Article

The Reliability of Offshore Jacket Platforms Based on Bayesian Calibration

by
Fang Zhou
1,
Fansheng Meng
2,3,
Yuhan Zhao
2,3,
Jinbo Chen
2,3,*,
Rui Zhao
1,
Yongfei Zhang
1,
Zhaolong Han
2,3 and
Yan Bao
2,4
1
Shandong Electric Power Engineering Consulting Institute Co., Ltd., Jinan 250013, China
2
School of Ocean and Civil Engineering, Shanghai Jiao Tong University, Shanghai 200240, China
3
State Key Laboratory of Ocean Engineering, Shanghai Jiao Tong University, Shanghai 200240, China
4
Shanghai Jiao Tong University Sichuan Research Institute, Chengdu 610200, China
*
Author to whom correspondence should be addressed.
J. Mar. Sci. Eng. 2025, 13(10), 1989; https://doi.org/10.3390/jmse13101989
Submission received: 11 August 2025 / Revised: 1 September 2025 / Accepted: 26 September 2025 / Published: 17 October 2025

Abstract

The safety of offshore structures is a key topic in developing offshore oil and gas and offshore wind energy. Due to the harsh offshore environment and costly offshore field tests, offshore field trials to validate the theoretical models for offshore structures are limited, and testing results can rarely be found in the public domain. The Bayesian updating technique combines existing engineering knowledge with the observed performance data about in-service offshore structures to update model uncertainties. Hence, the Bayesian technique overcomes the shortcomings of limited offshore field trials. This paper compiles performance data on offshore jackets in hurricanes in the Gulf of Mexico (GoM) in the past two decades and calibrates the model uncertainties of the API method using the Bayesian technique. With the updated model uncertainty, this paper evaluates the reliability of generic offshore jackets in the GoM and the case study’s offshore wind substation in China. With a typical reserve strength ratio (RSR) of about 2.0 to 2.2, the reliability analysis reveals that the updated annual failure probability of a generic offshore jacket in the GoM is largely less than 1.0 × 10 3 , indicating that the extreme weather overload is not a major concern. However, the RSR of the case study platform in China is greater than 4.5, and the annual failure probability for the case study offshore wind substation is about 2–3 orders of magnitude lower than typical oil and gas jackets. Hence, from the extreme metocean condition perspective, the substation under investigation has sufficient structural capacity, and the design practice for offshore wind substations in northern China may be improved.

1. Introduction

An offshore wind substation is a key component in offshore wind development and plays an important role in ensuring electricity generated by offshore wind can be safely and effectively transported to land [1,2]. The failure of an offshore wind substation can lead to the shutdown of the entire offshore wind farm. Therefore, ensuring the long-term structural reliability of offshore substations in extreme environments is crucial to the investment in the entire offshore wind farm. Currently, fixed-jacket structures dominate the structural form for offshore wind substations. Fixed-jacket design primarily follows the methods and standards established for fixed offshore oil and gas platforms, predominantly those published by the American Petroleum Institute (API), such as API RP2A-WSD 2014 (Working Stress Design) [3] and API RP2A-LRFD 2019 (Load and Resistance Factor Design) [4]. The design of fixed offshore oil and gas platforms in the U.S. Gulf of Mexico (GoM) adheres entirely to the API series of design standards (e.g., wind and wave standards per API RP2MET, structural design per API RP2A-WSD, and foundation design per API RP2GEO, etc.) [3,5,6], and the design standards in other countries and regions are also influenced by the API design standards. Therefore, this paper investigates the long-term reliability of offshore substations based on the API standards.
Although the API family of standards is widely applied in offshore engineering, validating the accuracy of these standards and the associated structural design theories is paramount in maintaining structural integrity and personnel safety and preventing environmental disasters [7,8]. Over the past two decades, more than 250 platforms have collapsed in the GoM during seven major hurricanes, highlighting concerns about potential deficiencies in the API standards and raising questions regarding the accuracy in the assessment of the long-term reliability of jacket structures designed to the API standards. Most of these damaged/failed platforms have been designed using pre-1980 API standards, with the major issue of using a lower maximum wave height in the design, and they exclusively failed due to extreme hurricane conditions. The key failure mechanisms of these platforms include deck damage, leg buckling, and joint failure (pancake type) [9,10,11]. Only one platform failed in the pile foundation [12]. In addition, recent LOADS JIP studies have found that actual wave crests were significantly higher than those specified by the API standards [13], suggesting that wave forces predicted by the API-based designs are lower than actual wave forces. This discrepancy may compromise the safety of platforms which were designed according to the API standards. However, the applicability of the LOADS JIP results to Chinese waters or the GoM remains unclear. The performance of platforms in past GoM hurricanes (e.g., survival, damage, or failure) can be used to test the validity of the design methodology through the back-analysis of measured metocean data, predicted structural response, and the observed platform performance. For example, a predictive analysis of an eight-legged jacket structure based on measured metocean data indicated failure; however, the structure survived during the actual hurricane without damage, demonstrating that the current design and analysis approach is potentially conservative [14]. Nevertheless, the conventional back-analysis based on measured data faces significant challenges: (1) the measured wind and wave current data exhibit high uncertainty, especially the actual maximum wave height in the design storm, which can only be predicted by statistical methods, resulting in the uncertainty of the input parameters affecting the results of the reanalysis; (2) numerous factors influence the structural survival or failure, making it difficult to determine the controlling factors for the conventional reanalysis. For instance, a jacket surviving extreme storms could result from actual wave forces being lower than calculated or the actual structural capacity exceeding the calculated capacity.
The Bayesian theory based on probabilistic analyses [15,16,17] effectively integrates measured data, design experience, and reanalysis results and uses mathematical models to systematically analyze the uncertainties in design methods. This approach offers an effective framework to objectively assess API design methodologies and quantify the uncertainties inherent in API standards. By quantifying the design uncertainties in API standards and combining them with statistical characteristics of environmental conditions in a target sea area, the long-term reliability of an offshore jacket, defined as the probability of failure due to extreme weather, can be effectively evaluated.
Based on the above review of jacket platform design standards and historical data, this study proposes a Bayesian calibration-based long-term structural reliability assessment of offshore platforms. This method is based on Bayesian calibration of the API standards, using the oil and gas jacket platforms in the GoM studied by the authors as a database to quantify the uncertainty of the API design standards. All the platforms in the database have been back-analyzed to determine the failure modes, and the predicted capacity is compared to the observed performance of the platform in hurricanes. The novelty of the present model is the systematic incorporation of wave loading, structural resistance, and pile capacity to comprehensively evaluate the model bias factors. Then, a reliability analysis for generic offshore jackets in the GoM is performed to form a basis. Subsequently, the offshore engineering finite element design software SACS (version 16.0) is used to evaluate the ultimate capacity of the case study’s offshore wind substation. Finally, the long-term reliability of the target offshore substations is determined based on the statistical law of wind, wave, and currents in the target sea area and the calibrated API design standards.

2. Introduction to Bayes’ Theory

2.1. Classification of Uncertainty

Generally, the uncertainty in offshore engineering is divided into two categories: the first category is aleatory uncertainty (also known as data uncertainty); the second category is epistemic uncertainty (also known as model uncertainty). Aleatory uncertainty generally reflects the inherent variability in natural phenomena and cannot be reduced by improving computational models and theories, such as the variation in wave heights in space and time in an ocean state [18] and the spatial variability of geotechnical properties [19]. Therefore, research is needed to clarify the underlying mechanisms of change to understand and then quantify the aleatory uncertainty, rather than to reduce this type of uncertainty. Epistemic uncertainty mainly arises from limited experimental data and imperfect theories, which leads to the discrepancy between the design theory and the actual inherent mechanism, such as the wave force calculation method based on wave height and the axial capacity model of pile foundations. Therefore, epistemic uncertainty can be reduced by further fundamental studies and experimental tests. The Bayesian calibration method is based on observational data to calibrate the existing imperfect models and reduce the epistemic (model) uncertainty.

2.2. Bayesian Model Calibration

Bayesian model calibration typically updates the prior probability distributions of model parameters by combining observational data to obtain posterior probability distributions [8], as expressed by the following equation:
P D F B = b D = L H D B = b P D F B = b + L H D B = b P D F B = b d b
where P D F B and P D F B are, respectively, the prior and posterior distributions (probability density function) of the uncertain model parameter B (called model bias factor in the following context); b is a specific sample of the model parameter B; D is the observed data; and L H D B = b is the likelihood of occurrence for the observed data. Therefore, P D F B represents the existing knowledge level (including the existing theory and experience, etc.), while P D F B reflects the improved understanding after learning from the measured data. Thus, Bayesian theory organically combines existing knowledge and the data measured to improve the understanding of the behavior of offshore jackets.

3. Design Model Bias Factor Calibration

3.1. Jacket Platform Database

Chen et al. [20] presented a database consisting of 18 fixed-jacket oil and gas platforms (B1–B18) in the GoM. The detailed parameters of each of these jacket platforms have also been published elsewhere [9,14,20], and some summaries are as follows: This database contains common three-legged, four-legged, six-legged, and eight-legged jacket platforms with water depths ranging from 18 to 110 m. The main predicted damage modes include jacket failure and foundation failure. Most of the platforms in the database were designed and installed before 1980, and only one was designed and installed after 2000 (this may pose a limitation on the current study that more platforms should be examined to minimize statistical sensitivity). Therefore, most of the platforms studied were based on earlier API standards, but this did not affect this study because the latest API design standards were used to predict the ultimate capacity of the platforms based on the actual dimensions of these platforms. The offshore finite element software SCAS was used in the back-analysis of these platforms, and the damage/failure load was predicted based on pushover analyses [9,10,11]. Five of the jacket platforms withstood the hurricane without major damage (brace buckling, joint failure, deck damage, etc.), while the remaining 13 platforms experienced varying degrees of damage or total failure during the hurricane.
For the purpose of Bayesian calibration, Table 1 summarizes the key load/resistance information from Chen et al. [20]. As shown, for 8 out of the 18 platforms, the predicted performance in hurricanes is consistent with the observed performance (showing “design is fair” in Table 1), indicating that in general the API methods are appropriate. The six platforms show that the API design method is conservative, while the remaining four platforms show that the API method is unconservative. Therefore, deterministically, it is difficult to quantitatively evaluate the embedded safety level in the API methods.

3.2. Calibration Model

The Bayesian calibration for the design model bias factor utilizes the following reliability model:
g = B R ξ R r P r e d i c t e d B S ξ S s B
where g is the limit state function: g > 0 indicates that the structure is in a safe state, and g ≤ 0 indicates that the structure fails; B R and B S are, respectively, the model bias factors for resistance and load representing epistemic uncertainty; ξ R is the bias factor of resistance representing aleatory uncertainty, which can be divided into ξ R   =   [ ξ j , ξ f l , c , ξ f a , c , ξ f a , s ], respectively, representing the bias factors of the jacket platforms’ superstructure capacity, the pile foundation lateral bearing capacity in clay, the pile foundation axial capacity in clay, and the pile foundation axial capacity in sand; r P r e d i c t e d is the capacity of the jacket platforms calculated based on API design standards, which is calculated using the finite element software SACS [21], in which the steel mean yield strength is used instead of the design minimum value, so that the yield strength adopted in the calculation is about 10% higher than the design minimum; ξ S is the load bias factor caused by aleatory uncertainty; s B is the overall wave force (base share at mudline) calculated based on API design standards using SACS, which can be expressed as follows:
s B = C 1 h + C 2 u C 3 h h d s B = C 1 + C 4 h h d h + C 2 u C 3 h > h d
where C 1 to C 4 are the fitting parameters; h is the instantaneous wave height; h d is the minimum wave height that can hit the deck of the jacket platform; u is the surface current velocity. The variation in h follows Forristall’s probability distribution [11], and the wave parameters are calibrated from measured data in hurricanes.
For the load bias factor ξ S due to aleatory uncertainty, there is a need to account for variations in wind, wave, and currents over time and space, as well as the wave force uncertainty between each wave cycle in a sea state (e.g., random distribution of waves along different directions). This uncertainty can be introduced as a bias factor obeying a lognormal distribution with a mean of 1.0 and a coefficient of variation of 0.2. However, this method needs to consider each wave cycle, which makes the calculation complicated and cumbersome for extreme 3 h sea states (about 1000 wave periods). Chen [9] proposed using the sea state approach instead of wave-by-wave approach to simplify the calculation, i.e., the calculation is based on the maximum wave height of the whole sea state without considering each wave cycle individually based on the independence of each wave cycle from each other. Using Monte Carlo simulation as a numerical validation tool, Chen [9] concluded that a coefficient of variation (COV) of ξ S can be ignored due to the averaging effect for about 1000 wave periods, but the mean value increases by 17%. Therefore, in the current study, ξ S is treated as a deterministic value of 1.17, i.e., COV = 0. ξ R is also assumed to follow a lognormal distribution, and the parameters of the probabilistic model are shown in Table 2 [22].

3.3. Calibration Results

The key objective of Bayesian calibration is to update the model bias factors B = [ B s , B j , B f l c , B f a c , B f a s ], which, respectively, represent the model bias factors of the wave force, the resistance of the jacket superstructure, the lateral capacity of the pile foundation in clay, and the axial capacity of the pile foundation in clay and sandy soils. Table 3 shows the comparison of the prior and posterior distributions of B following [20]. As shown, for the wave force, the jacket superstructural resistance, and the pile axial capacity in clay model bias factors, the mean values remain similar. For the pile lateral capacity model bias factor, the mean value increased due to no lateral pile shear failure observed in the database. For the same reason, the mean value for the pile axial capacity in sand increased. These updated results provide a new basis for evaluating the long-term reliability of offshore jackets. Also shown in Table 3 are the updates on the uncertainty quantification represented by the COV value. As shown, for the wave loading and the structural resistance, the updated COV value for the model bias factor reduced by 35%, while for the foundation the updated COV value for the pile bias factor reduced by about 20–30%. The decreased COV value for the posterior model bias factor will increase the calculated jacket reliability. Thus, with the Bayesian calibration and the back-analysis of the database platform, the gained knowledge is reflected in the increased reliability in the reliability assessment of offshore jackets.
Another finding from Table 3 is the different levels of conservatism for the different model bias factors. As shown, the mode bias factors for wave loading, structural resistance, and the pile axial capacity in clay are close to 1.0 within 5% to 10% difference; however, for the pile lateral capacity in clay, the model bias factor is 1.17, and for pile axial capacity in sand, the model bias factor is 1.46. This means that, on average, the API methods are more conservative for the design of the pile axial capacity in sand compared to the design of the superstructure. This may be one of the reasons that no reported pile failed in sand while there are multiple jacket superstructure failures in the literature.

4. Reliability of Generic Offshore Jacket Platforms in GoM

4.1. Simplified Reliability Model

The reliability of an offshore platform can be assessed with different methods with varying degrees of complexity for fixed-jacket platforms and floating platforms [23], e.g., using an analytical solution based on typical design practices using a 100-year design load [24], using the first-order reliability method (FORM) [17], using the second-order reliability method (SORM) [25,26,27], and using nest inner–outer FORM [10]. In order to widen the adoption of the current reliability in practice, a simplified reliability framework is presented here to evaluate the reliability of offshore jackets due to extreme storms and to demonstrate the impact of Bayesian updating on the calculated reliability of offshore jackets. The concept of the reserve strength ratio ( R S R ), which is defined as the ratio of the system ultimate capacity to the 100-year environmental load [28], is used for the convenience of reliability calculation. Both the system ultimate capacity and 100-year environmental load are expressed in terms of the global base shear force at the mudline.
Following the definition of R S R , the ultimate capacity of the jacket can be expressed as r P r e d i c t e d = R S R × s 100 , where s 100 represents the base shear force with a 100-year return period. The factor of safety ( F o S ) against the ultimate failure is introduced as F o S = r / s , where r is the ultimate capacity, and s is the base shear. The structure is safe when F o S > 1.0 ; the structure fails when F o S 1.0 . Combining Equations (2) and (3), the F o S can be expressed as follows:
F o S = B R ξ R r P r e d i c t e d B S ξ S s B = B R ξ R × R S R × s 100 B S ξ S C 1 H m a x C 3
where B R and B S are, respectively, the model bias factors for resistance and load as introduced earlier; H m a x is the maximum wave height assumed to follow a log-normal distribution. Note, due to the relatively minor impact of the current and wind compared to the wave load in the extreme condition, the effect of surface current and the corresponding wind are implicitly incorporated in the coefficient C 1 in order to simplify the reliability calculation without losing the numerical rigor. This simplification only applies to fixed jackets. The impact of wind and current may be significant for floating structures [29,30,31].
Since all the random variables in Equation (4) are assumed to follow a lognormal distribution, the failure probability of the structure (i.e., F o S 1.0 ) can be obtained from the analytical expression of the lognormal distribution as follows (using the definition of R S R ):
P f = 1 Φ [ l n ( F o S ¯ ) ζ B R 2 + ζ ξ R 2 + ζ B s 2 + ζ ξ s 2 + C 3 2 ζ H m a x 2 ] = 1 Φ [ ln ( B R ξ R ¯ × R S R × s 100 / B S ξ s ¯ C 1 H ¯ m a x C 3 ) ζ B R 2 + ζ ξ R 2 + ζ B s 2 + ζ ξ s 2 + C 3 2 ζ H m a x 2 ] = 1 Φ [ ln ( B R ξ R ¯ × R S R × H 100 C 3 / B S ξ S ¯ H ¯ m a x C 3 ) ζ B R 2 + ζ ξ R 2 + ζ B s 2 + ζ ξ s 2 + C 3 2 ζ H m a x 2 ]
where P f is the failure probability; F o S represents the factor of safety; Φ is the cumulative distribution function for the normal distribution; H 100 is the maximum wave height for a 100-year return period; the overbar “—” denotes the median of a random variable; ζ denotes the log-standard deviation of a random variable, and the subscripts denote the category of a random variable. As discussed earlier, in the peak sea state with around 1000 wave cycles, ζ ξ s can be approximated as 0 due to the averaging effect (see Section 3.2); the rest of the variables were defined before and are also shown in Table 2 and Table 3.

4.2. Reliability of a Jacket Superstructure System

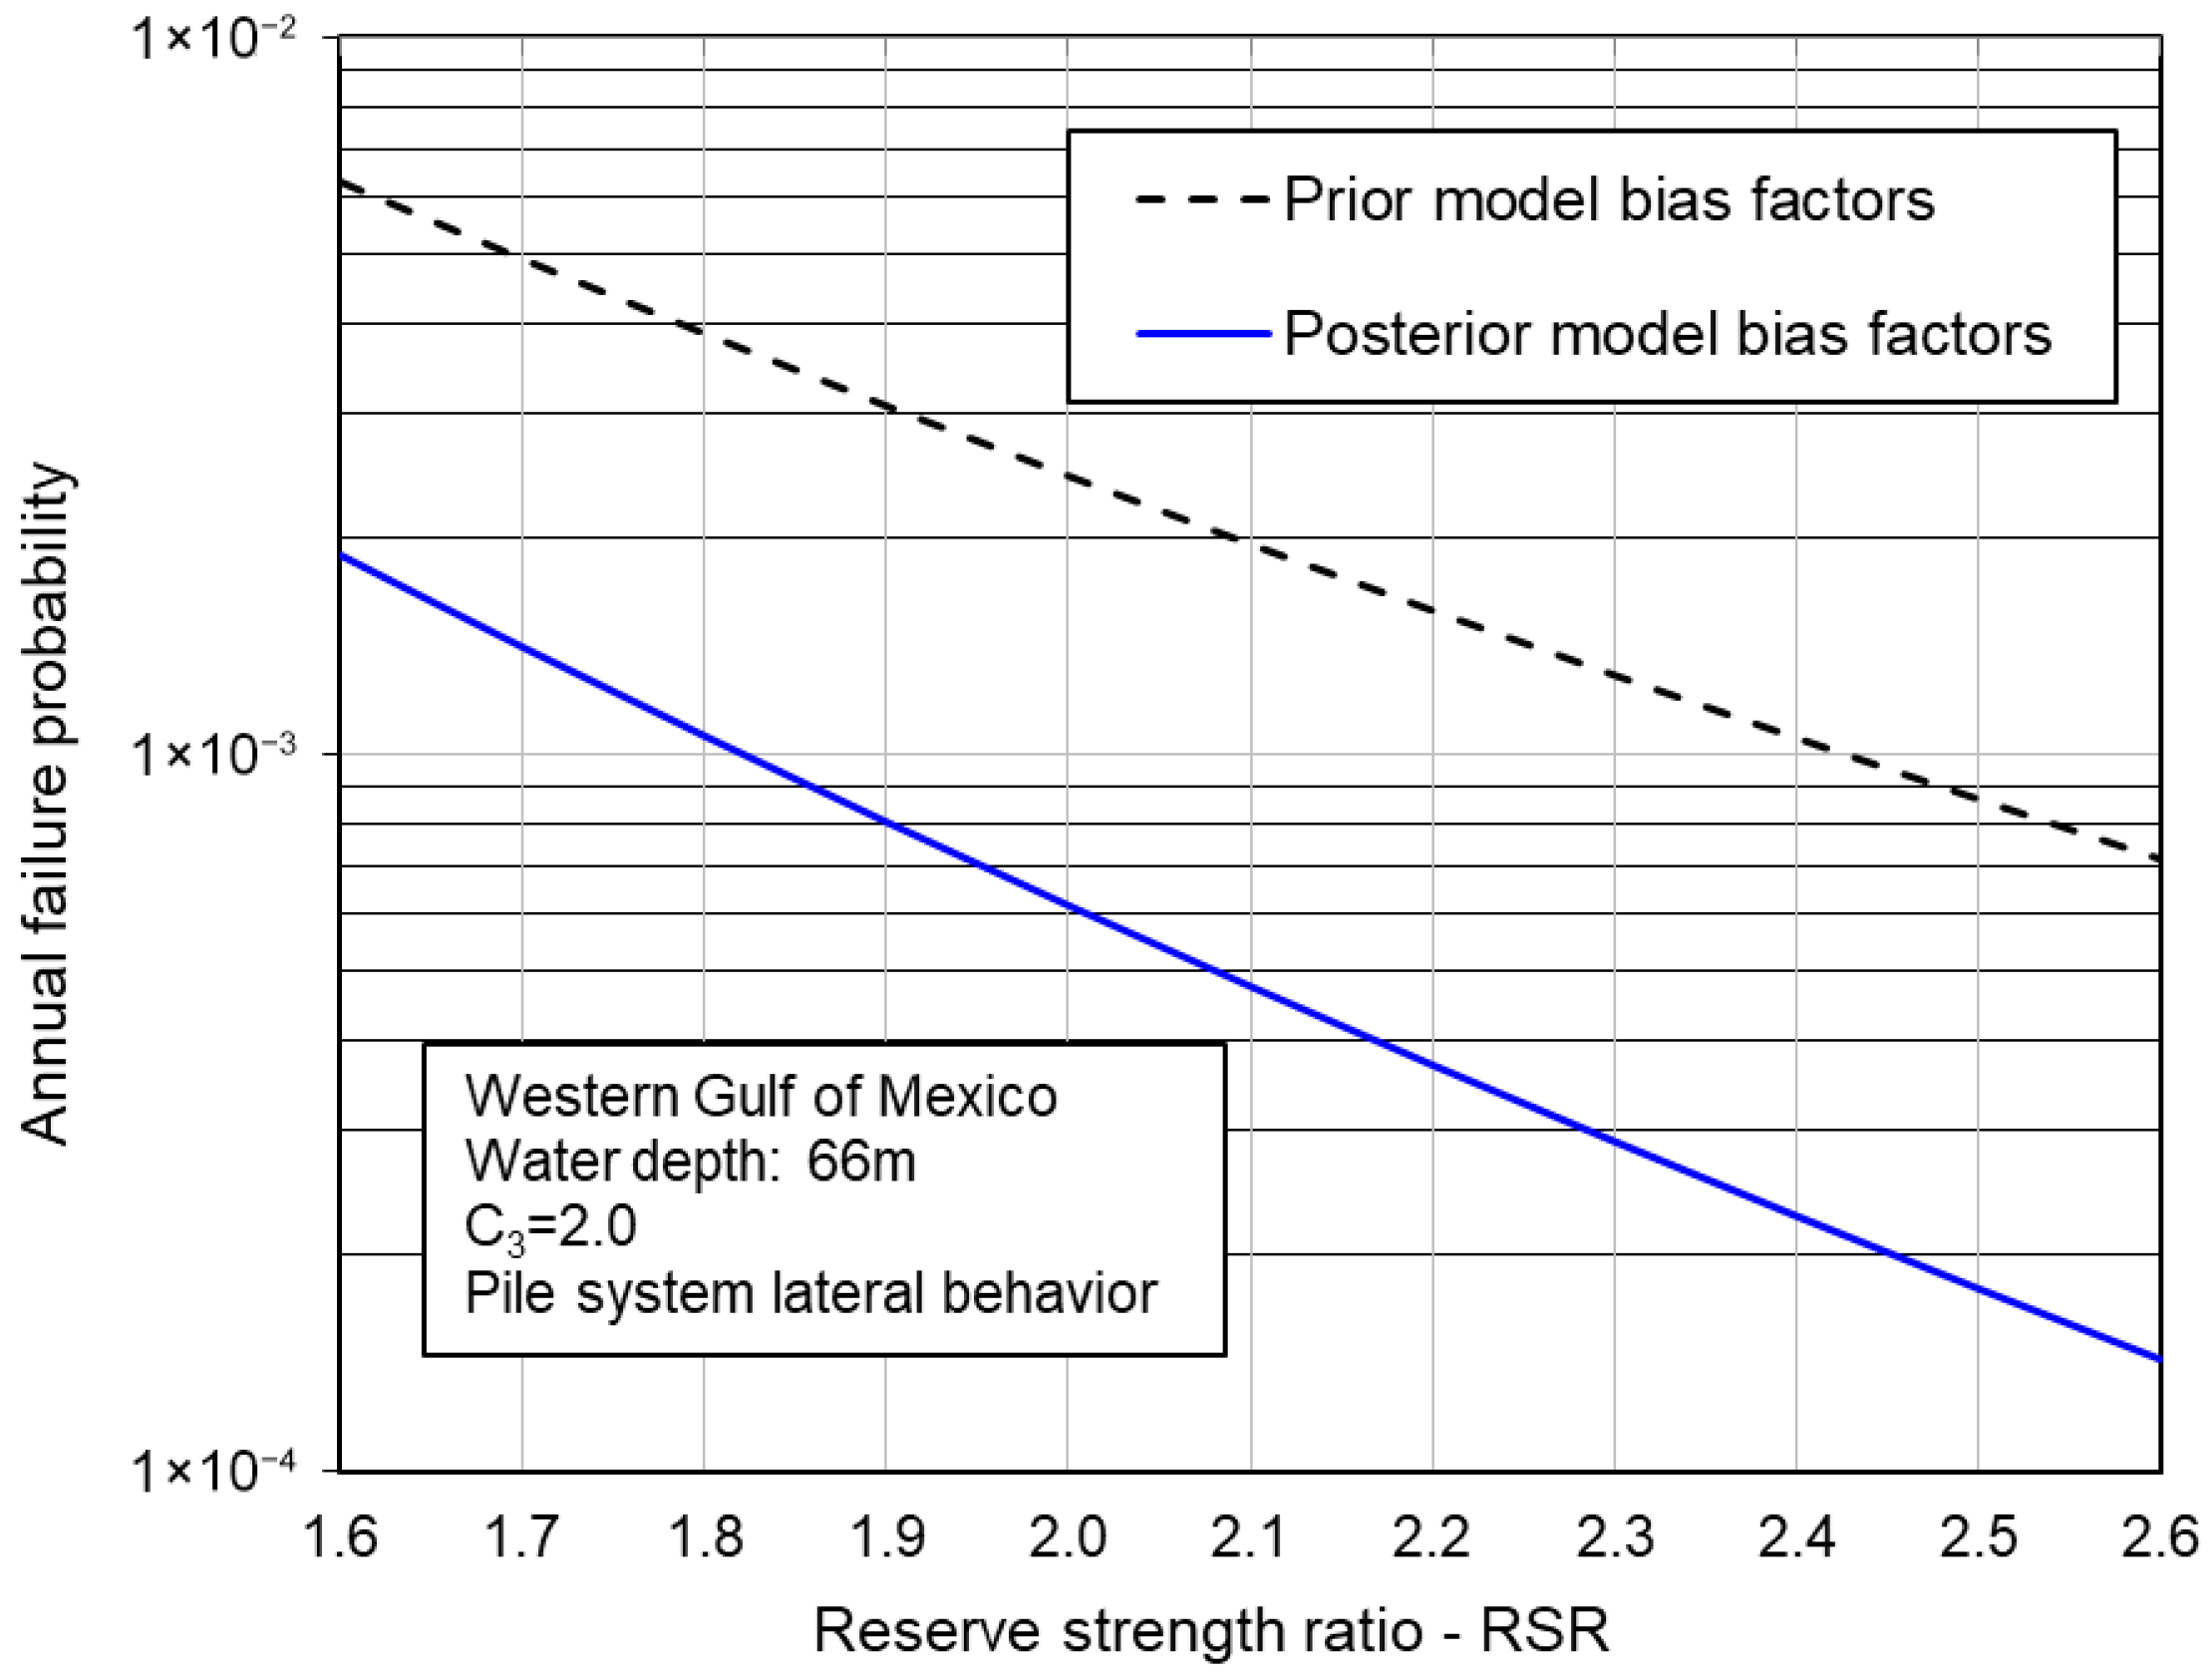
Consider a typical drag-dominated offshore jacket in a water depth (WD) of 100 m in the western GoM. For simplicity, the global base shear on the jacket is expressed in terms of the maximum wave height with the current effect implicitly included in the base shear calculation [10,11,32]. For a drag-dominated jacket, the wave height exponent C3 in Equation (3) will be around 2.0, while for an inertia-dominated platform, C3 will be close to 1.0. In the GoM waters, the uncertainty level in the maximum wave height is largely independent of the water depth for a fixed-jacket platform as long as water depth is greater than about 50 m [6,9]. Thus, the effect of water depth can be neglected in the reliability calculation. In the western GoM at WD = 100 m, H 100 is 24.5 m, and the log-standard deviation can be fitted to be 0.29 with a log-normal distribution [6]. Using Equation (5), Figure 1 shows the annual failure probability of a jacket superstructure system (excluding the pile foundation). For typical jacket platforms designed following the latest API standards, the R S R is usually in between 1.85 and 2.3. For a typical R S R value of 2.0, the annual failure probability is about 1.0 × 10 3 . For typical oil and gas platforms in the GoM, this annual failure of 0.1% is low enough that overload is not the dominant risk; blowouts, fires, and collisions account for more of the catastrophic losses in the GoM [33]. Figure 1 also shows that the jacket structure failure probability using the updated model bias factors from Bayesian calibration is lower than that using the prior distribution. These updated results highlight the benefits of reanalyzing the observed performance data, and the improved knowledge about the platform’s actual behavior during hurricanes. However, the difference between the failure probabilities using the prior and posterior model bias factors is not significant. This is because the model bias factor for the wave model remains largely the same, although the COV is reduced, the model bias factors for the jacket structural system are also reduced. On the contrary, the small difference between the prior and posterior results indicates that the current design practice following the API series standards is consistent with the jacket structural performance in actual hurricanes.

4.3. Reliability of a Pile System Against Lateral Failure

An offshore pile system can fail laterally or axially, and the factors governing these two failure models differ significantly. For the design of laterally loaded piles, the current design practice following the API series standards is to limit the maximum stress within the pile wall, i.e., 0.6 F y is the allowable axial stress and 0.75 F y is the allowable bending stress for typical piles ( F y is the steel yield strength). With a third increase in the allowable stress in the extreme condition, the maximum stress within a laterally loaded pile is about 0.8–1.0 F y , i.e., the maximum load causing the outmost fiber yield in the pile wall to the 100-year design load is about 1.0 to 1.25. Considering a ratio of 1.3 for the plastic section modulus to the elastic section modulus, the ratio of the load causing the first plastic hinge in the most critical pile in a pile system to the 100-year load is thus about 1.3 to 1.625. Following [9,22], the pile system lateral capacity is about 40% to 60% higher than the base shear, causing the first plastic hinge in a typical jacket. Thus, the typical R S R for the pile system in the lateral failure is about 1.82 to 2.6, with a typical R S R of about 2.2. This R S R is in general greater than that for the jacket superstructure system and may be a reason that it is rare to see a pile foundation fail laterally for an offshore jacket due to the load limit when the superstructure fails.
Figure 2 shows the annual failure probability of a typical pile foundation system as a function of R S R . As shown, there is a significant decrease in the calculated failure probability using the posterior model bias factors from using the prior model bias factors (on the order of an order of magnitude difference for typical R S R s ), on the order of 4.0 × 10 4 with a typical R S R . This is because no lateral failure was observed in the database used in the Bayesian study, and the authors are also not aware of any publicly documented offshore jacket pile foundation failure.
The above analysis of the pile system lateral failure probability implicitly assumes that all the loads on a pile are the extreme environmental load. In practice, part of the load on a pile is caused by gravity loads. The presence of gravity loads will in general increase reliability and thus reduce the failure probability of a pile in the lateral direction. The reasons are twofold: (1) the variability of gravity loads is smaller than extreme environmental loads; (2) gravity loads generally cause axial stresses in a pile. In the API series standards, the design for axial stress has a factor of safety ( F o S ) of 1.25, which is higher than that for bending stress of 1.0 (when a 1/3 increase in allowable stress is considered for a typical offshore pile geometry). Therefore, in reality, the failure probability of a pile system in the lateral direction is expected to be lower than that estimated in Figure 2.

4.4. Reliability of a Pile System Against Overturning Failure

The current design practice in the GOM for the axially loaded piles uses F o S = 1.5 based on the most heavily loaded pile in a pile system. The design environmental load to the gravity load is typically in the range of 0.5 to 3.0 based on platform surveys [34]. Thus, the gravity load takes a significant portion of the axial load in a pile and needs to be accounted for in the reliability analysis due to the lower variability of gravity loads. Using F o S = 1.5 and assuming the axial load re-distribution in a pile system is not significant before the first failure of the most critical pile (this is usually the case for typical offshore jackets), the following relation can be derived:
W f i r s t W n = G n + W n × F S G n W n = F S + F S 1 G n W n
where W f i r s t , W n , and G n represent the environmental load causing the first axial failure of the most critical pile, 100-year design environmental load, and design gravity load, respectively.
Using the concept of pile system redundancy factor ( S R F ), i.e., the ratio of the ultimate load causing the axial failure of a pile system to the load causing the axial failure of the most critical pile, and combining Equation (6), the R S R for a pile system against overturning can be calculated as follows:
R S R = F S + F S 1 × G n W n × S R F
with F o S = 1.5 , W n / G n = 0.5 3.0 , the R S R is in the range of 1.67 to 2.5 for S R F = 1.0 (e.g., for a three-legged jacket) and in the range of 2.0 to 3.0 for S R F = 1.2 (e.g., for a six- and eight-legged jacket).
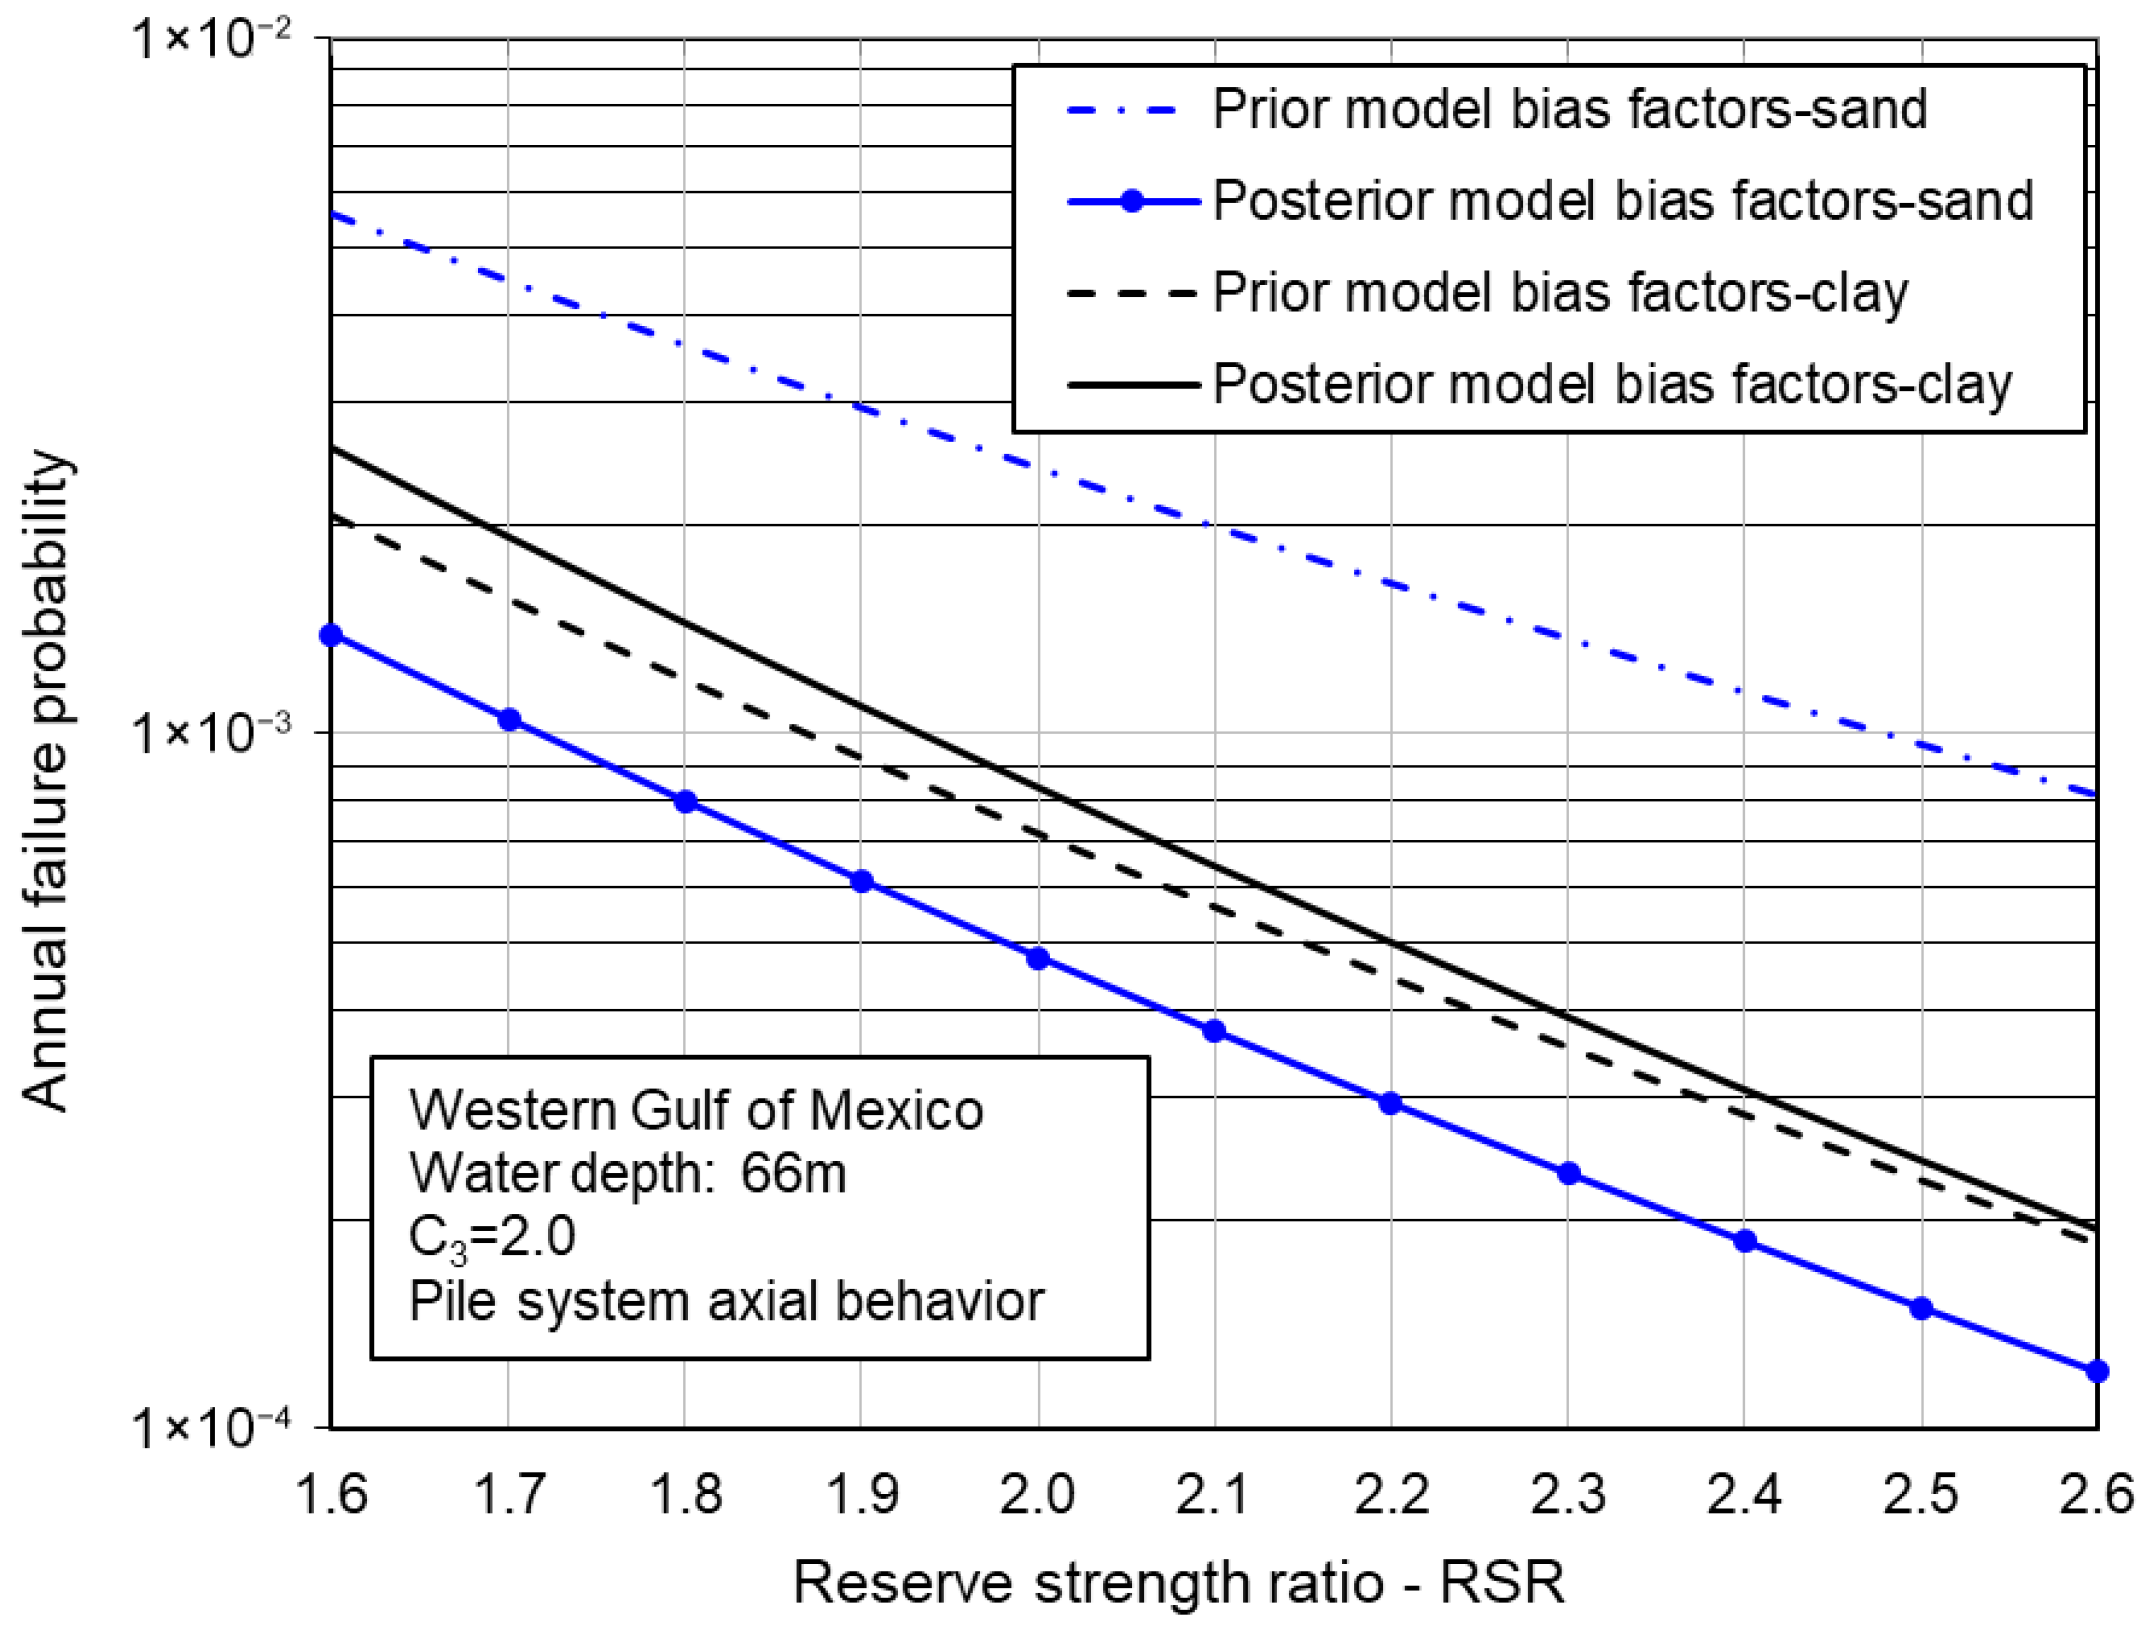
Figure 3 shows the failure probability of a pile system against overturning failure. As shown, for piles in clay, the failure probability remains largely the same with slight reduction using the prior model bias factors (on the order of 4.0 × 10 4 for R S R = 2.2 ). This is because the mean value for the axial capacity of a pile reduces from 1.3 to 1.05, while the uncertainty (COV) level reduces by a third in the Bayesian analysis. This result indicates that the API standard for the pile axial design is consistent with the observed performance. However, for piles in sand, the predicted failure probability with the posterior bias factor is an order of magnitude lower than that using the prior model bias factor (updated to be about 3.0 × 10 4 for R S R = 2.2 ). This is because no offshore piles fail axially in sand in the database, and the authors are also not aware of any such case histories. Thus, the current design method for axially loaded piles in sand using the API method is largely conservative. This conclusion is consistent with the findings in other studies [19,35].
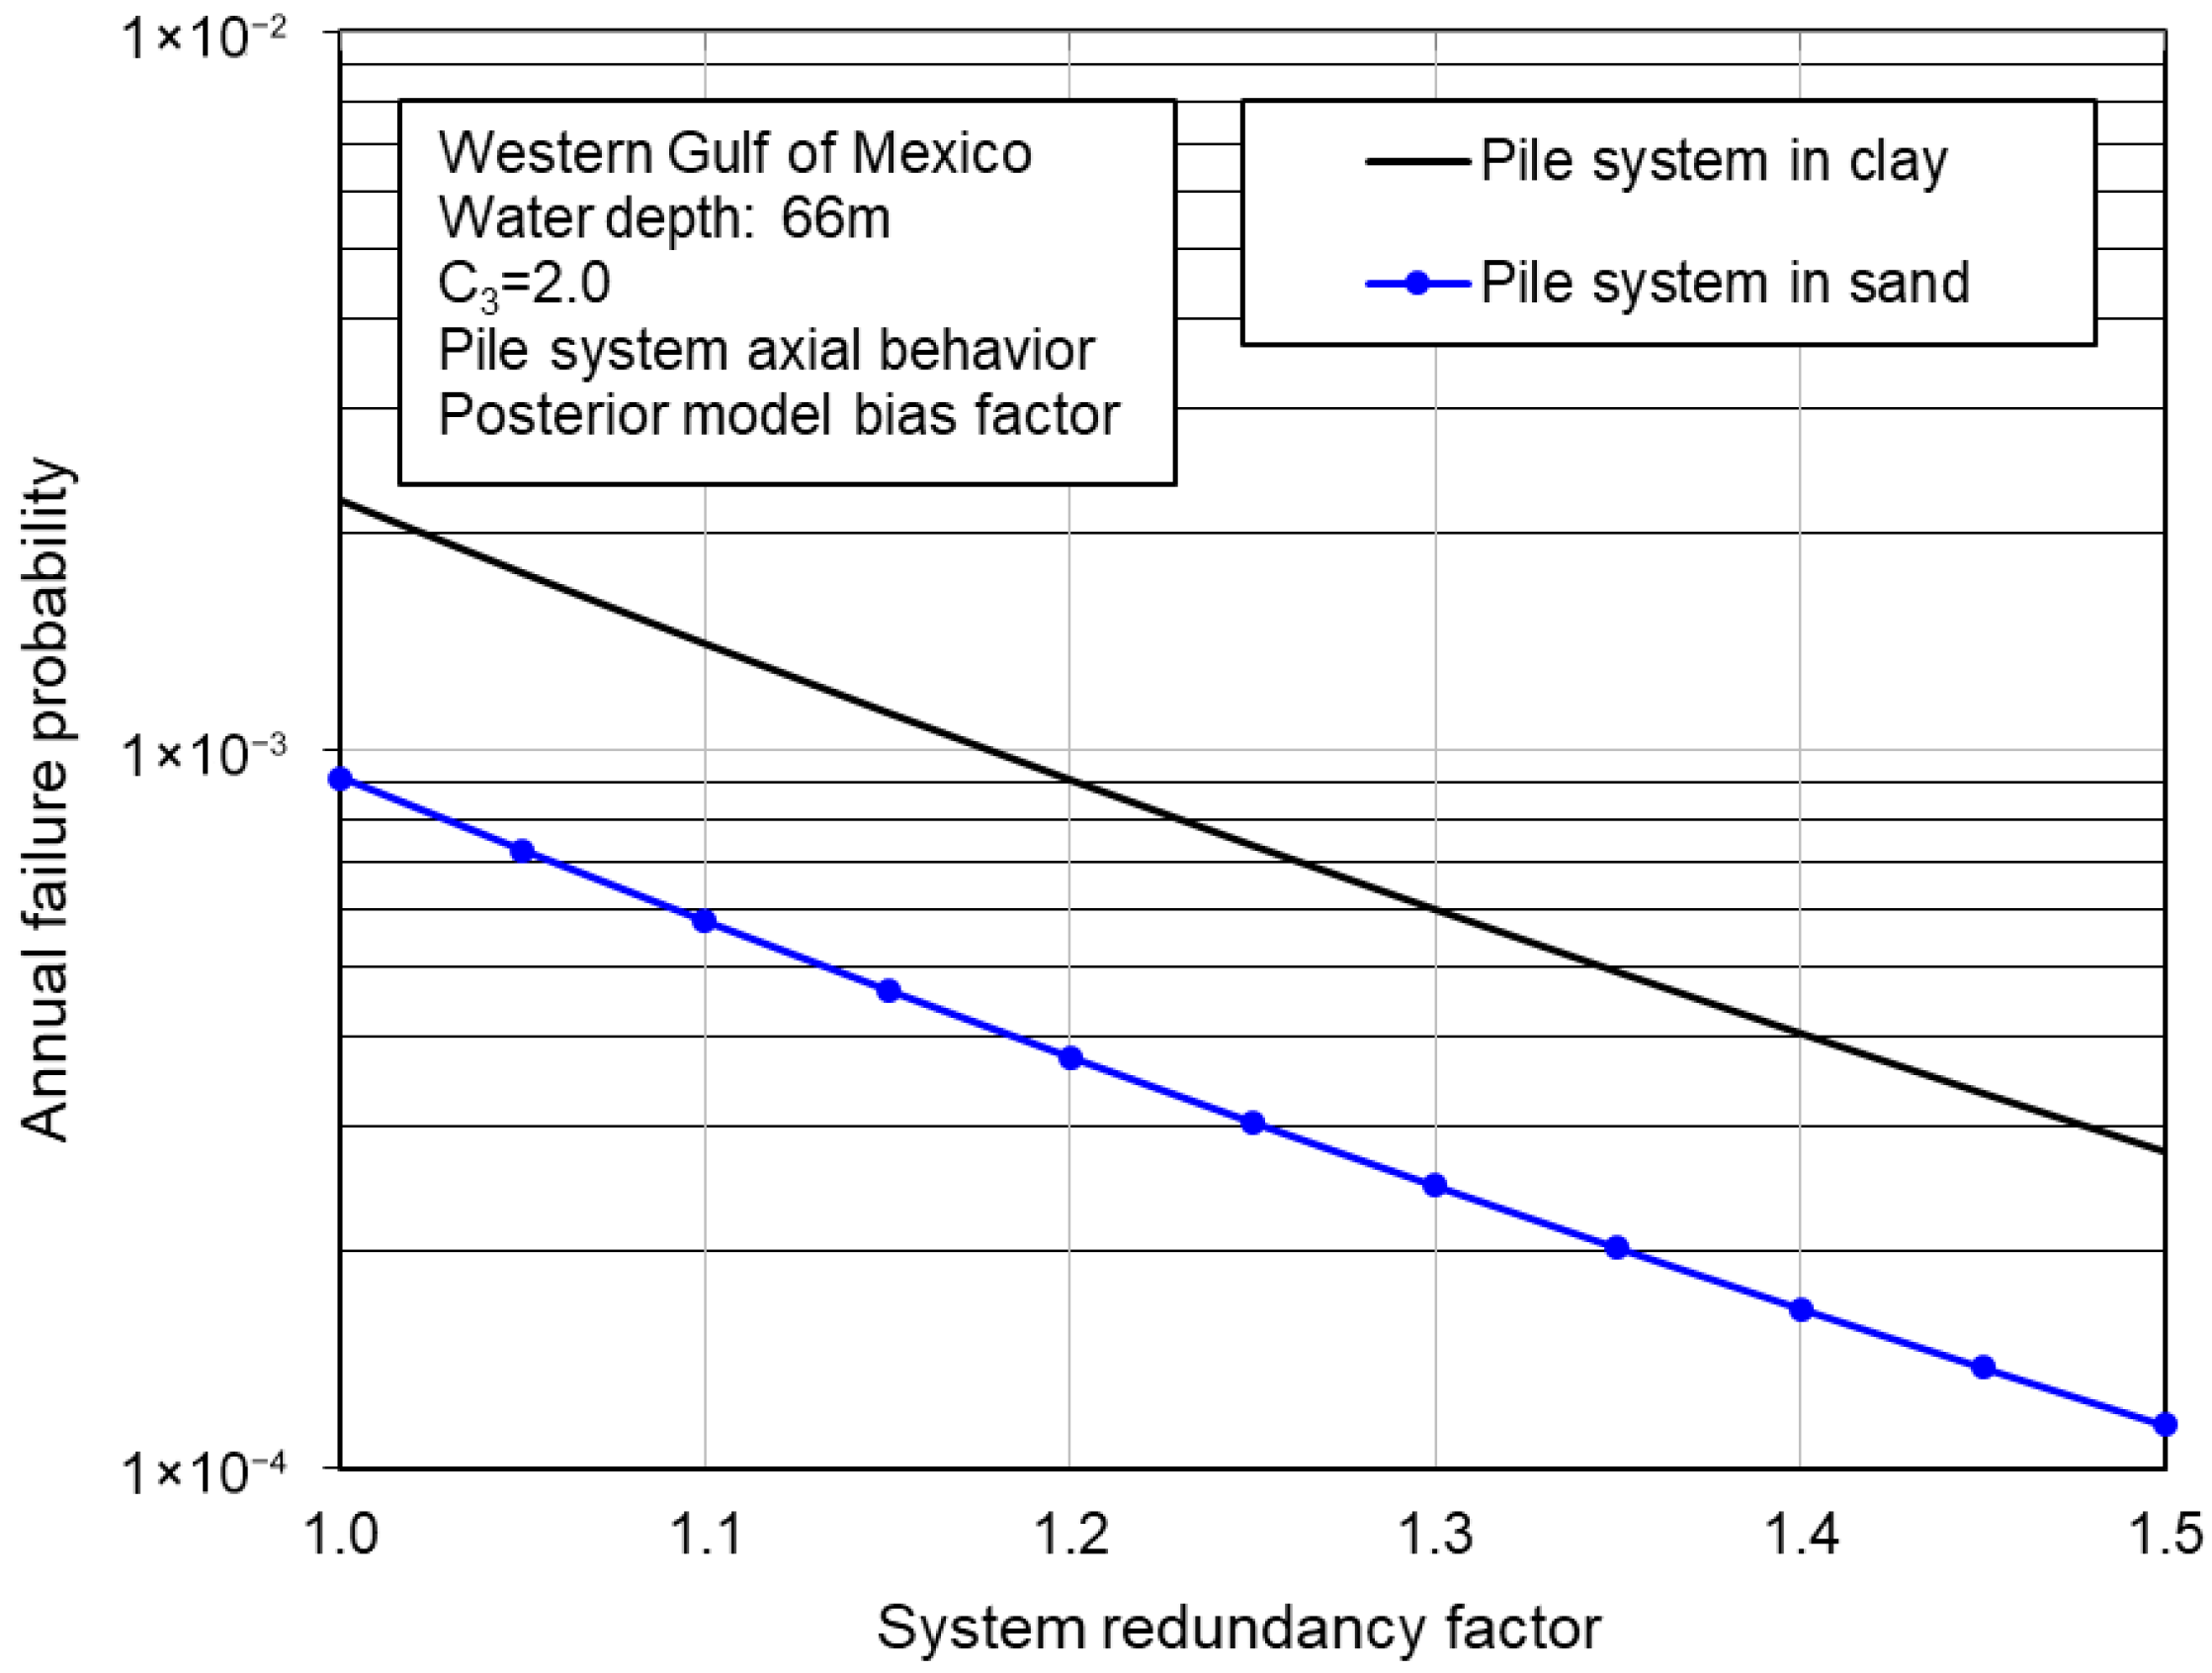
Figure 4 shows the failure probability of a pile system against overturning as a function of S R F (assume F o S = 1.5 , W n / G n = 2.0 ). As shown, the failure probability of a pile system reduces to half when the SRF increases from 1.0 to 1.2. Thus, based on the current design practice focusing on the most critical pile, the inherent reliability of a pile foundation system depends significantly on the system redundancy and thus on the leg number and layout of piles. For a typical tripod (three-legged) platform, the failure of one pile will lead to the catastrophic failure of the system and has little redundancy in the pile foundation. For a six- or eight-legged platform, the pile system may have significant redundancy beyond the failure of the first pile, e.g., it is common to see that the SRF for a six-legged platform is greater than 1.2 [9,14], and the failure probability of the six-legged platform can be half of that for a tripod platform for similar superstructures based on Figure 4. This is consistent with the general observations: it is uncommon to see pile foundation failures for six-legged and eight-legged platforms, while failures of tripods have been reported [12] and are also included in the current Bayesian study (see Table 1 Platform B18).

5. Reliability of the Case Study of Offshore Jacket Platforms in Northern China

The case study platform considered in this study is a jacket-type substation for offshore wind developments. The target location considered is in the northern part of China. The water depth of the target area is about 100 m. The 100-year return-period extreme storm has a maximum wave height of 17.35 m, the corresponding wave period is 13.23 s, the 1 h mean wind speed is 23.7 m/s at 10 m above sea level, the surface current speed is 1.70 m/s, and the bottom current speed is 0.38 m/s. The substation consists of the deck, the jacket superstructure, and the pile foundation. The deck has a total of seven levels with a projection area of 83.2 m × 85.5 m and weighs about 25,000 tons. The jacket structure consists of eight main legs, braces, and pile sleeves, with a total height of about 120 m (excluding the upper deck). The four corner main legs have a diameter of 3 m, and the four internal main legs have a diameter of 2.6 m. The primary bracing system is an X-brace with member diameters ranging from 1250 mm to 1650 mm. The 3 m diameter driven piles are used as pile foundations and are connected by skirted pile sleeves. The pile foundations and sleeves are connected by grouting.
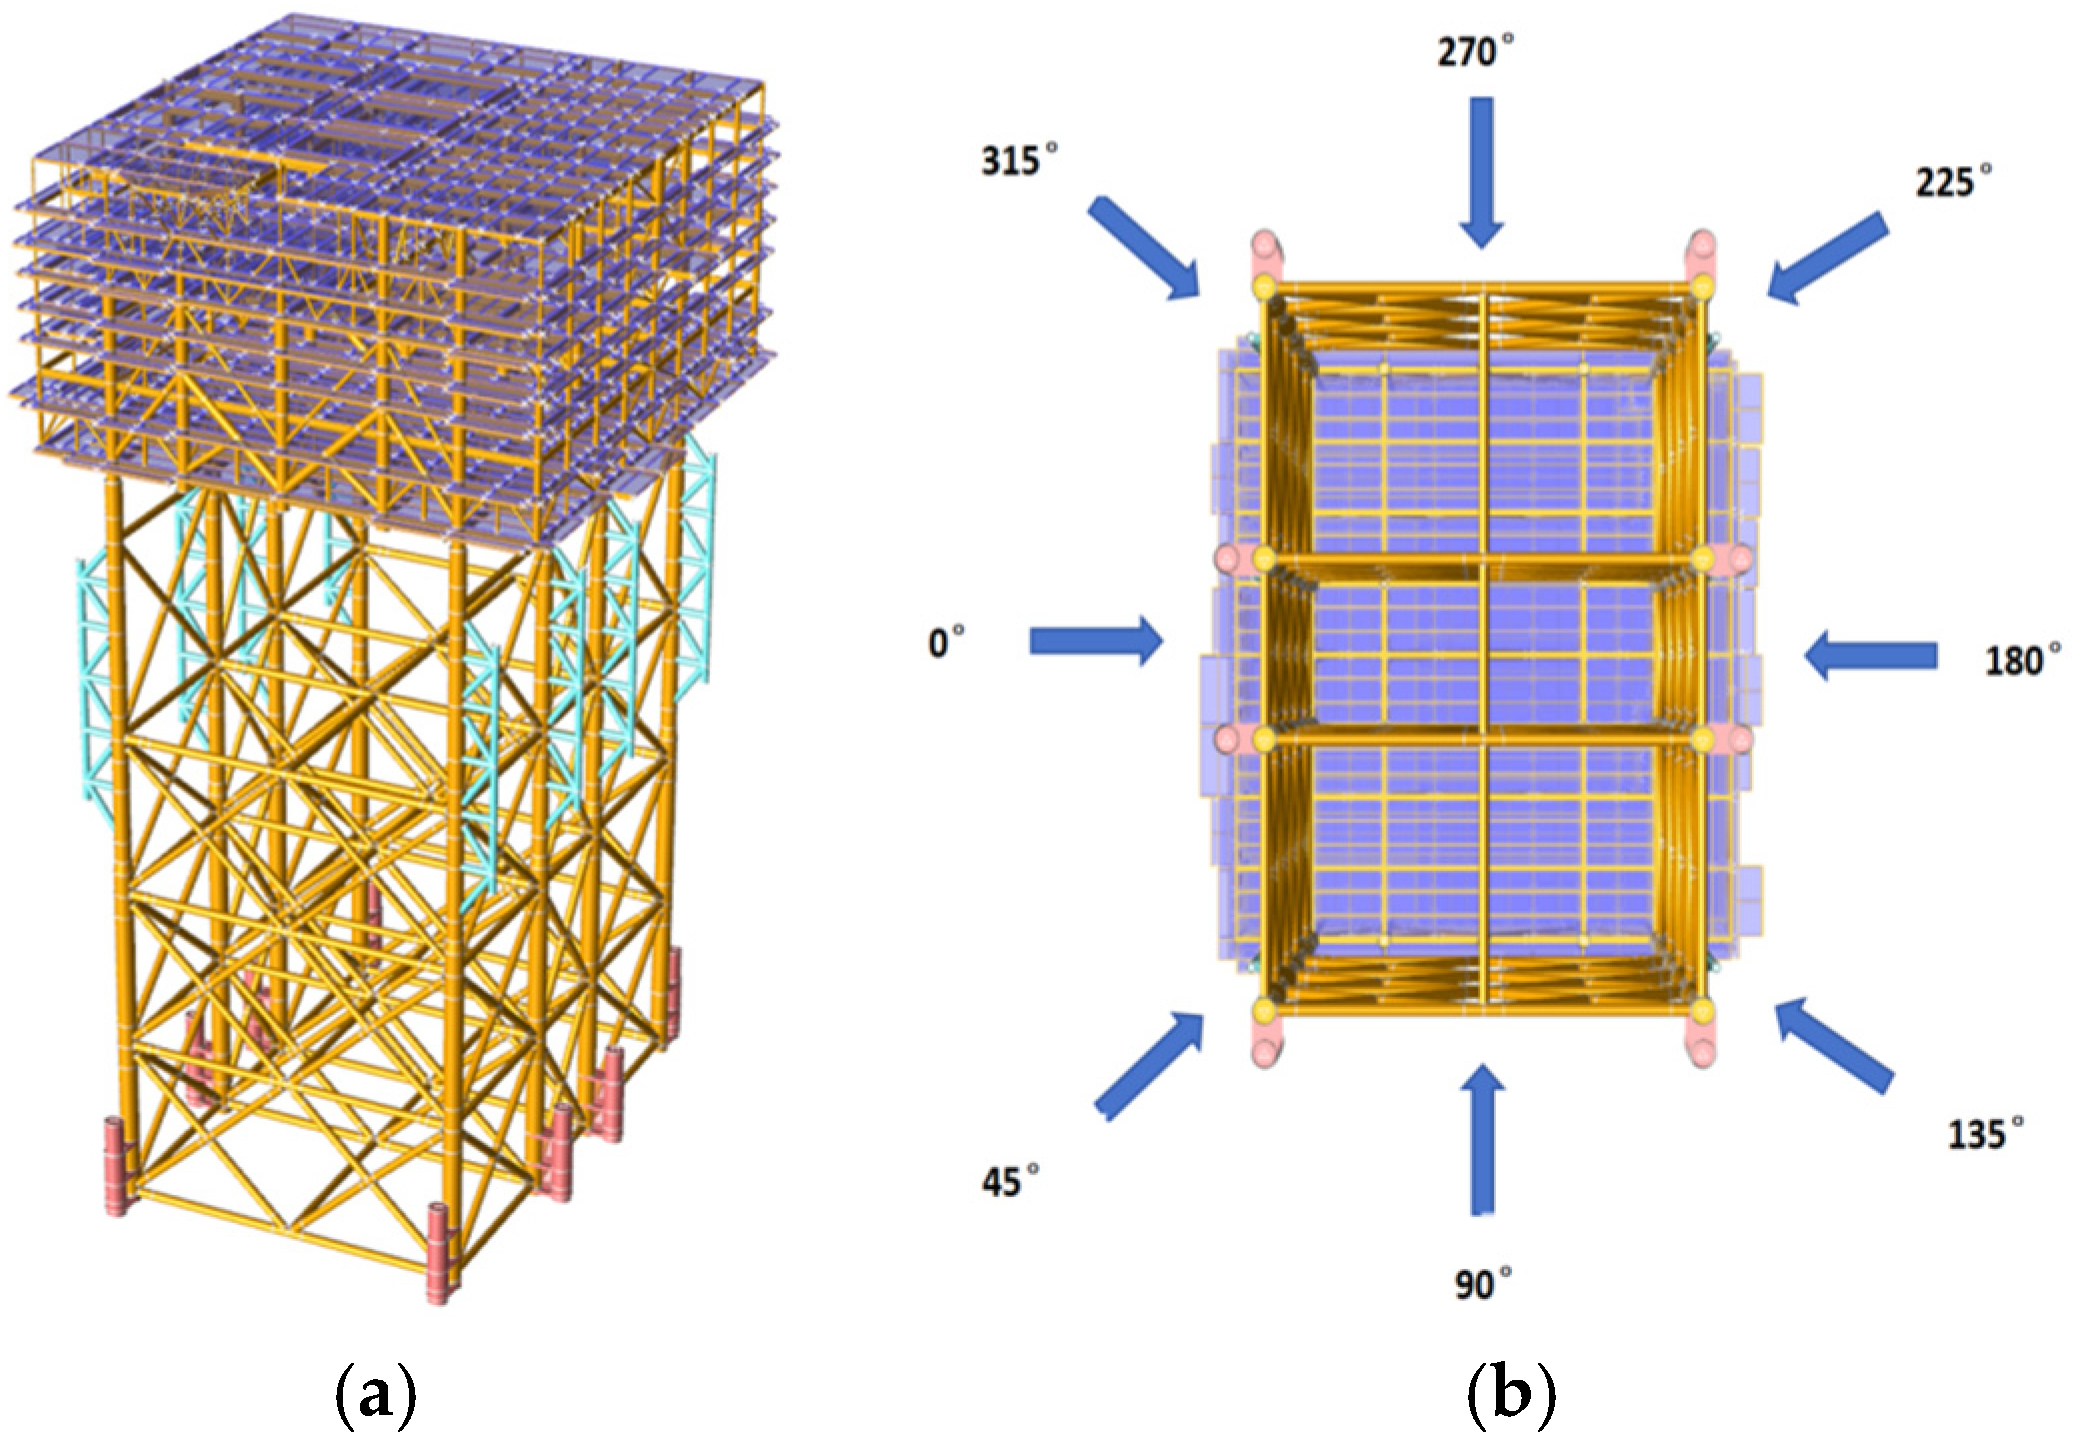
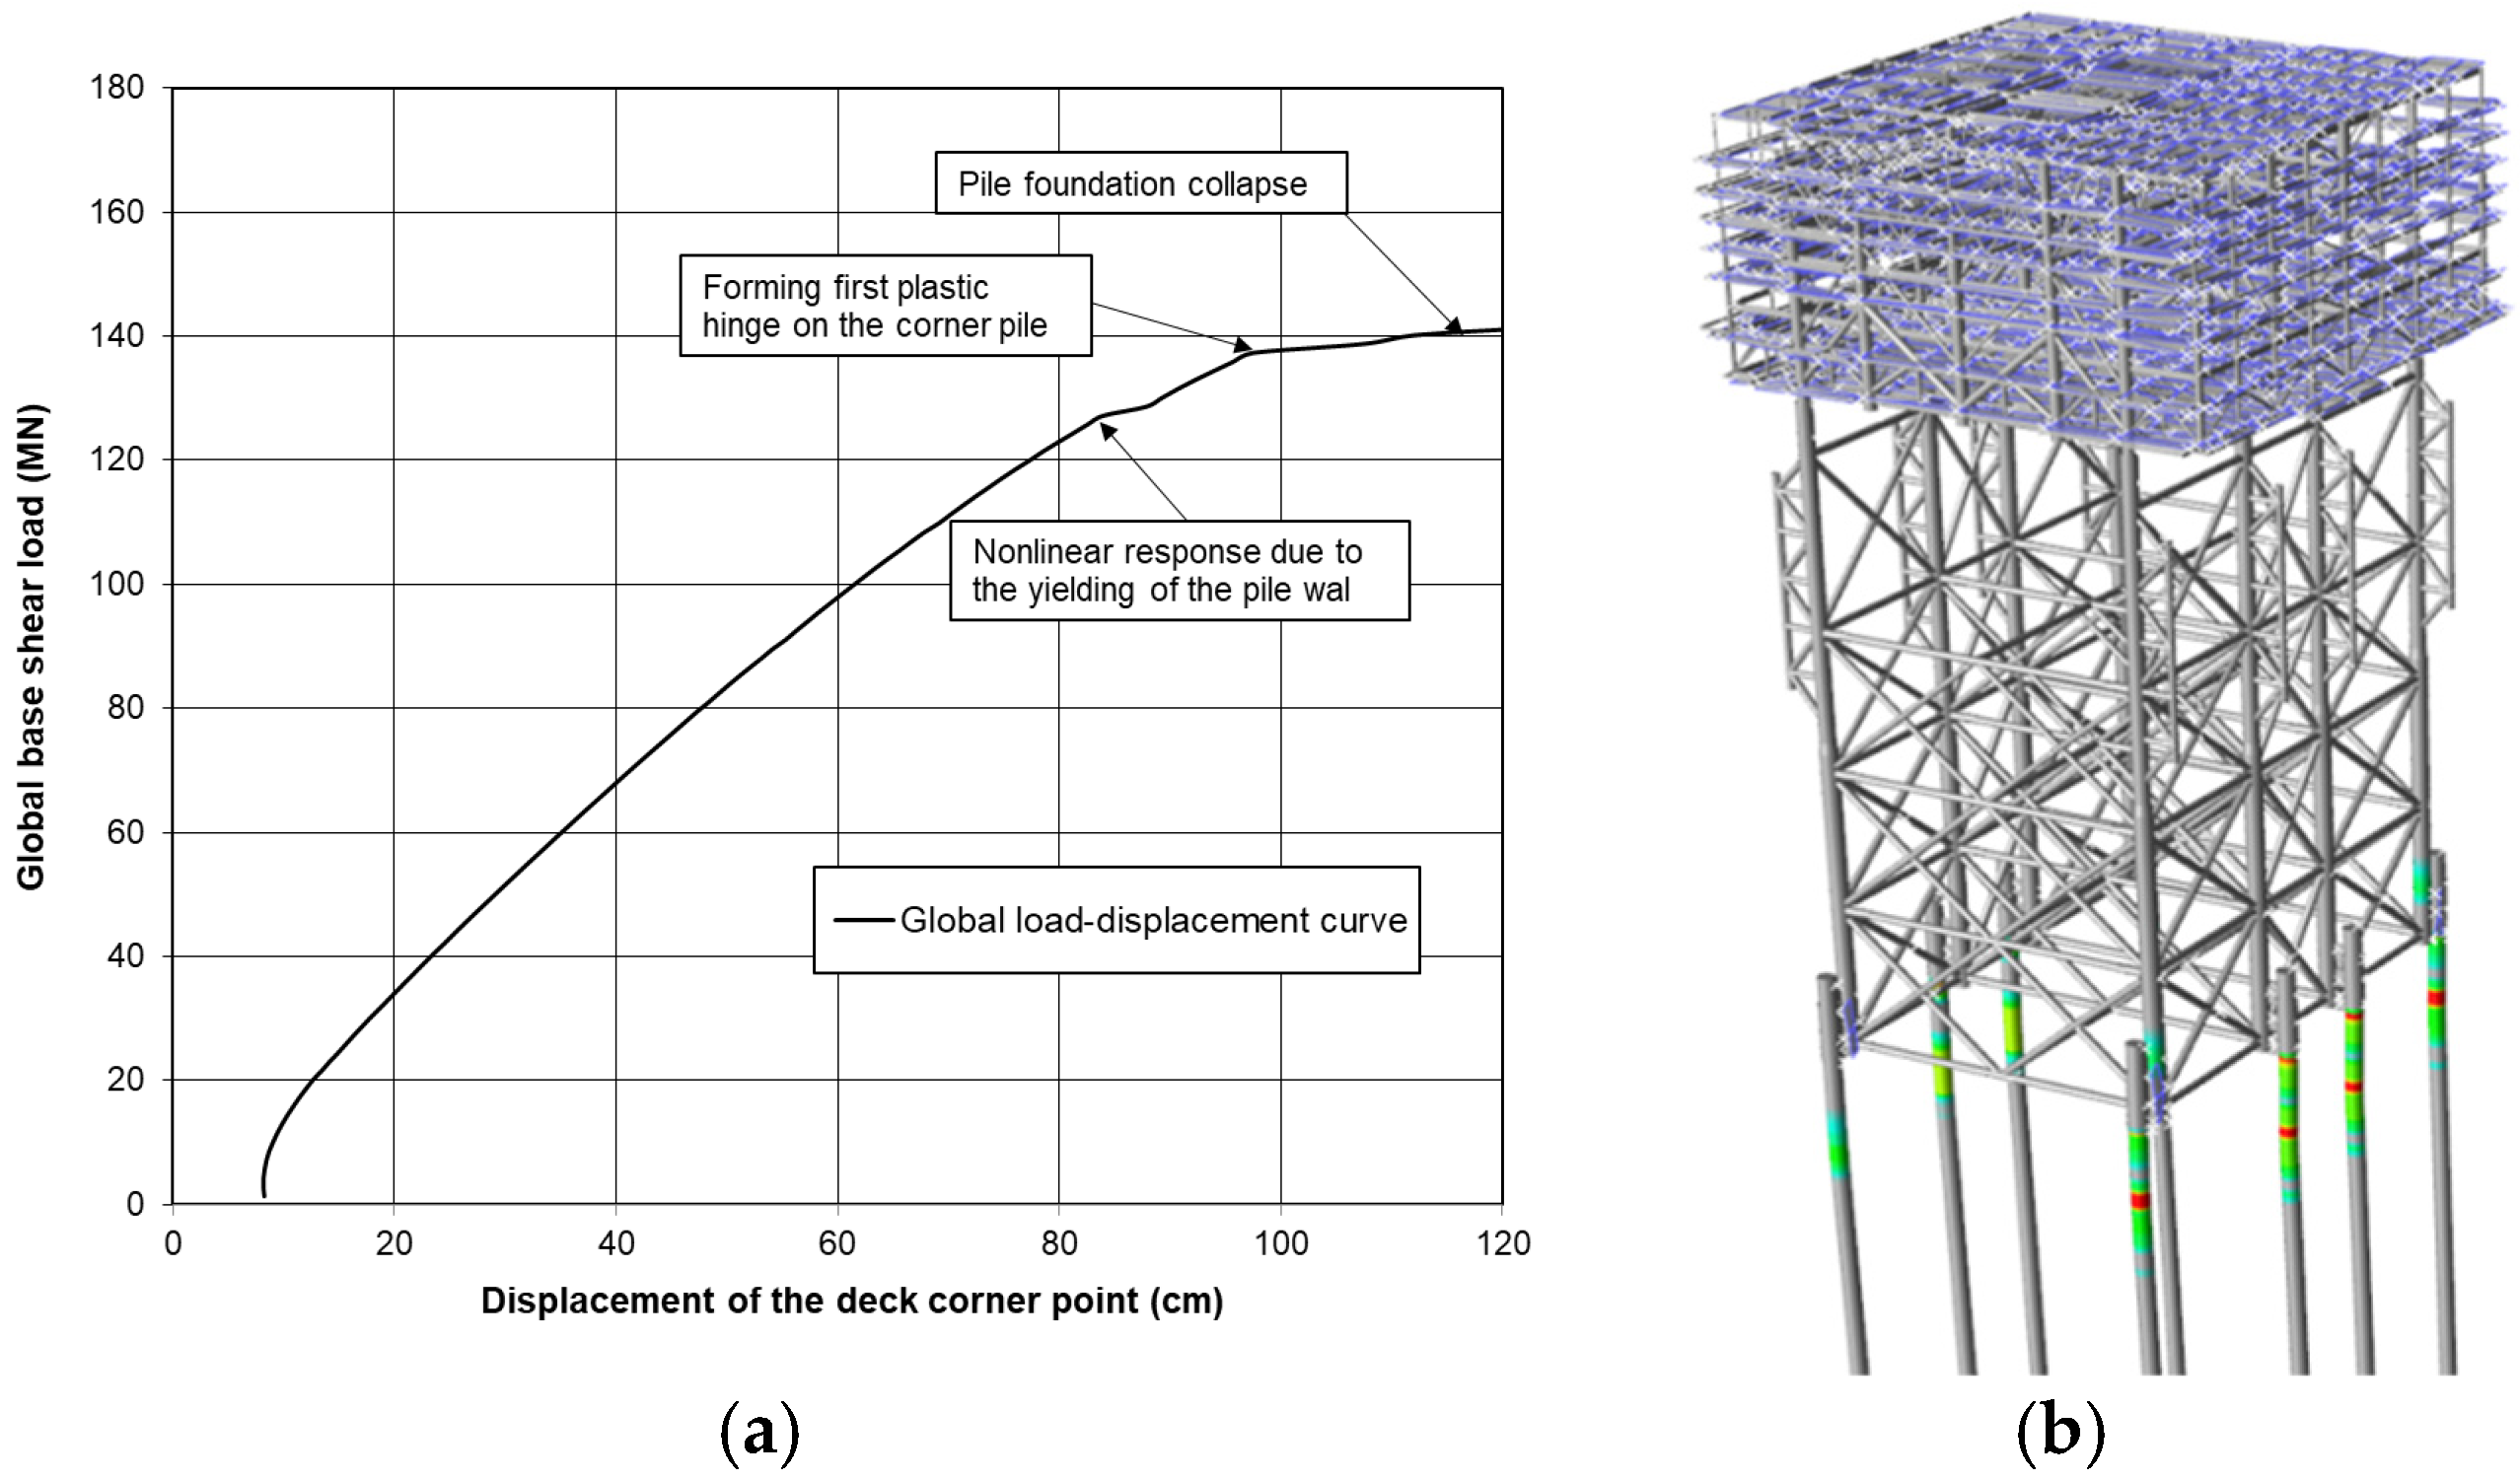
The substation was modeled using the marine engineering finite element (FE) software SACS (version 16.0) (Figure 5a), and structural design checks and static pushover analyses were performed to determine the structural ultimate capacity. SACS software is widely accepted in designing offshore jackets. Fundamentally, SACS uses beam–column theorem to conduct FE analysis for offshore jackets, thus avoiding time-consuming solid element meshing. The core part of SACS is the failure criterion for different elements, and this is the most significant advantage of SACS that SACS has implemented all the design/failure equations of the full API standards for wave loading and structural and pile modeling. For the wave loading part, the calculation follows the Morrison equation with the allowed wave particle kinematic reduction. The maximum wave height and period are required, and an appropriate wave theory is selected based on the water depth. For the structural modeling, the capacities of braces, legs, and joints follow API standards. For the pile foundation, with the input of soil parameters, API p–y and t–z curves are generated.
The environmental loads were applied to the jacket structure from 0° in every 45° direction, with a total of eight directions (Figure 5b). Based on the results of the static analysis of the structure, the long-term statistical laws of wind, wave, and currents, and the Bayesian-calibrated model bias factors described above, the long-term structural failure probability of the substation can be determined.

5.1. In-Place Design Check

Following the API RP2A-LRFD 2019 standards [4], an in-place static design check of the substation was performed to verify the structural design. The factor of environmental load for extreme storm conditions is 1.35, the equipment weight load factor is 1.1, and the live load factor is 1.1. The in-place design check was performed using the 100-year return period wind, wave, and current conditions. The environmental loads in different directions were loaded according to the maximum value without considering the reduction in wind, wave, and current parameters in different directions, to conservatively derive the UC value of the jacket structure (the ratio of actual stress to allowable stress). UC > 1.0 indicates overstress, while UC < 1.0 indicates satisfying the API design standards. Because the analysis is based on the elastic assumption, the in-place design check can be finished within seconds in SACS. Design check results show that the maximum UC value of the substation is 0.742, which satisfies the design standard. Since UC = 0.742 has some space from 1.0, from the perspective of an extreme storm causing overloading, the substation still has room for optimization (specific optimization needs to consider fatigue, floating tow installation, and seismic analysis).

5.2. Static Pushover Analysis

Static pushover analysis is a nonlinear static analysis method used to evaluate the ultimate capacity of a jacket structure. The core step is to take the wave force for a 100-year return period as a baseline and gradually increase this 100-year wave force linearly from zero until structural failure. During this process, the non-environmental loads are kept constant to derive the wave force at the limit state of the structure. This wave force approximates the ultimate capacity of the structure in an extreme storm state. In order to determine the ultimate capacity accurately, small load incremental steps are used in SACS, which results in about 5–8 h of computational time with a regular 64-bit, 32 GB RAM computer. Loads were applied in three directions (0°, 45°, and 90°), and the results indicate that capacity is the lowest at 45° (the diagonal direction). In this direction, the structure and the pile remain essentially elastic up to global base shear load of about 120 MN, at which point the yielding of the pile wall leads to a high nonlinear response in the global load–displacement curve. After that, at the deck displacement of about 100 cm and the base shear load of about 135 MN, the first plastic hinge is formed at the corner pile. At this point, the stiffness of the whole system reduces significantly (Figure 6a), and at the global base shear load of about 140 MN, the system stiffness reduces essentially to zero, the displacement increases rapidly, and the software stops the calculation, resulting in a collapsing load of about 140 MN with the key piles forming two plastic hinges (Figure 6b). At 45°, under the 100-year return period, the total base shear is about 30.2 MN, which results in a minimum R S R of about 4.63. This R S R is significantly higher than that of the general design of offshore oil and gas jacket platforms, which is in the range of 2.0–2.20, indicating that this jacket platform is conservative for the design of extreme storms.

5.3. Long-Term Failure Probability Analysis

5.3.1. Characterization of Environmental Loading Uncertainty

According to the site-specific metocean report, the 5-, 50-, and 100-year return-period maximum wave heights in the target area are 12.48 m, 16.32 m, and 17.35 m, respectively. Due to the limited data on the maximum wave heights in the higher return period, the annual maximum wave heights were fitted to a lognormal distribution, yielding a log-mean of 2.337 and a log-standard deviation of 0.222. As shown in Figure 7a, the selected lognormal distribution closely matches the metocean data.
The environmental loads due to wind, waves, and currents are characterized by the total base shear ( s B ). Figure 7b illustrates the relationship between the total base shear of this jacket structure, as calculated by SACS, and the input maximum wave height, according to Equation (3). Since the lower edge of the deck is 23.5 m from sea level, well above the anticipated peak of the maximum wave height, wave impact on the deck is not expected and is not considered here. In establishing the relationship between the global base shear and the maximum wave height, the corresponding wave period, wind speed, and current speed at the same return period are used in the calculation of s B in Figure 7b as shown in Equation (8):
s B = 0.124 H m a x 1.92
where H m a x is the maximum wave height in meters; s B is the base shear in MN. The exponent 1.92 is obtained by regression from SACS calculations. Due to the high stiffness of the jacket structure (the first-order natural period is about 4 s), the wave load is mainly controlled by the drag force. Therefore, the exponent 1.92 is close to the theoretical value of 2.0 (i.e., the wave load is dominated by the drag force). Figure 7b also indicates the fact that the global base shear load on the platform increases nonlinearly with the maximum wave height, reflecting the wave load on the platform being more dominated by the drag load. In addition, it points out that the single most important variable in determining the base shear load on offshore jackets is the maximum wave height, and the uncertainty in the base shear load is mainly from the uncertainty in the maximum wave height.

5.3.2. Substation Failure Probability Calculation

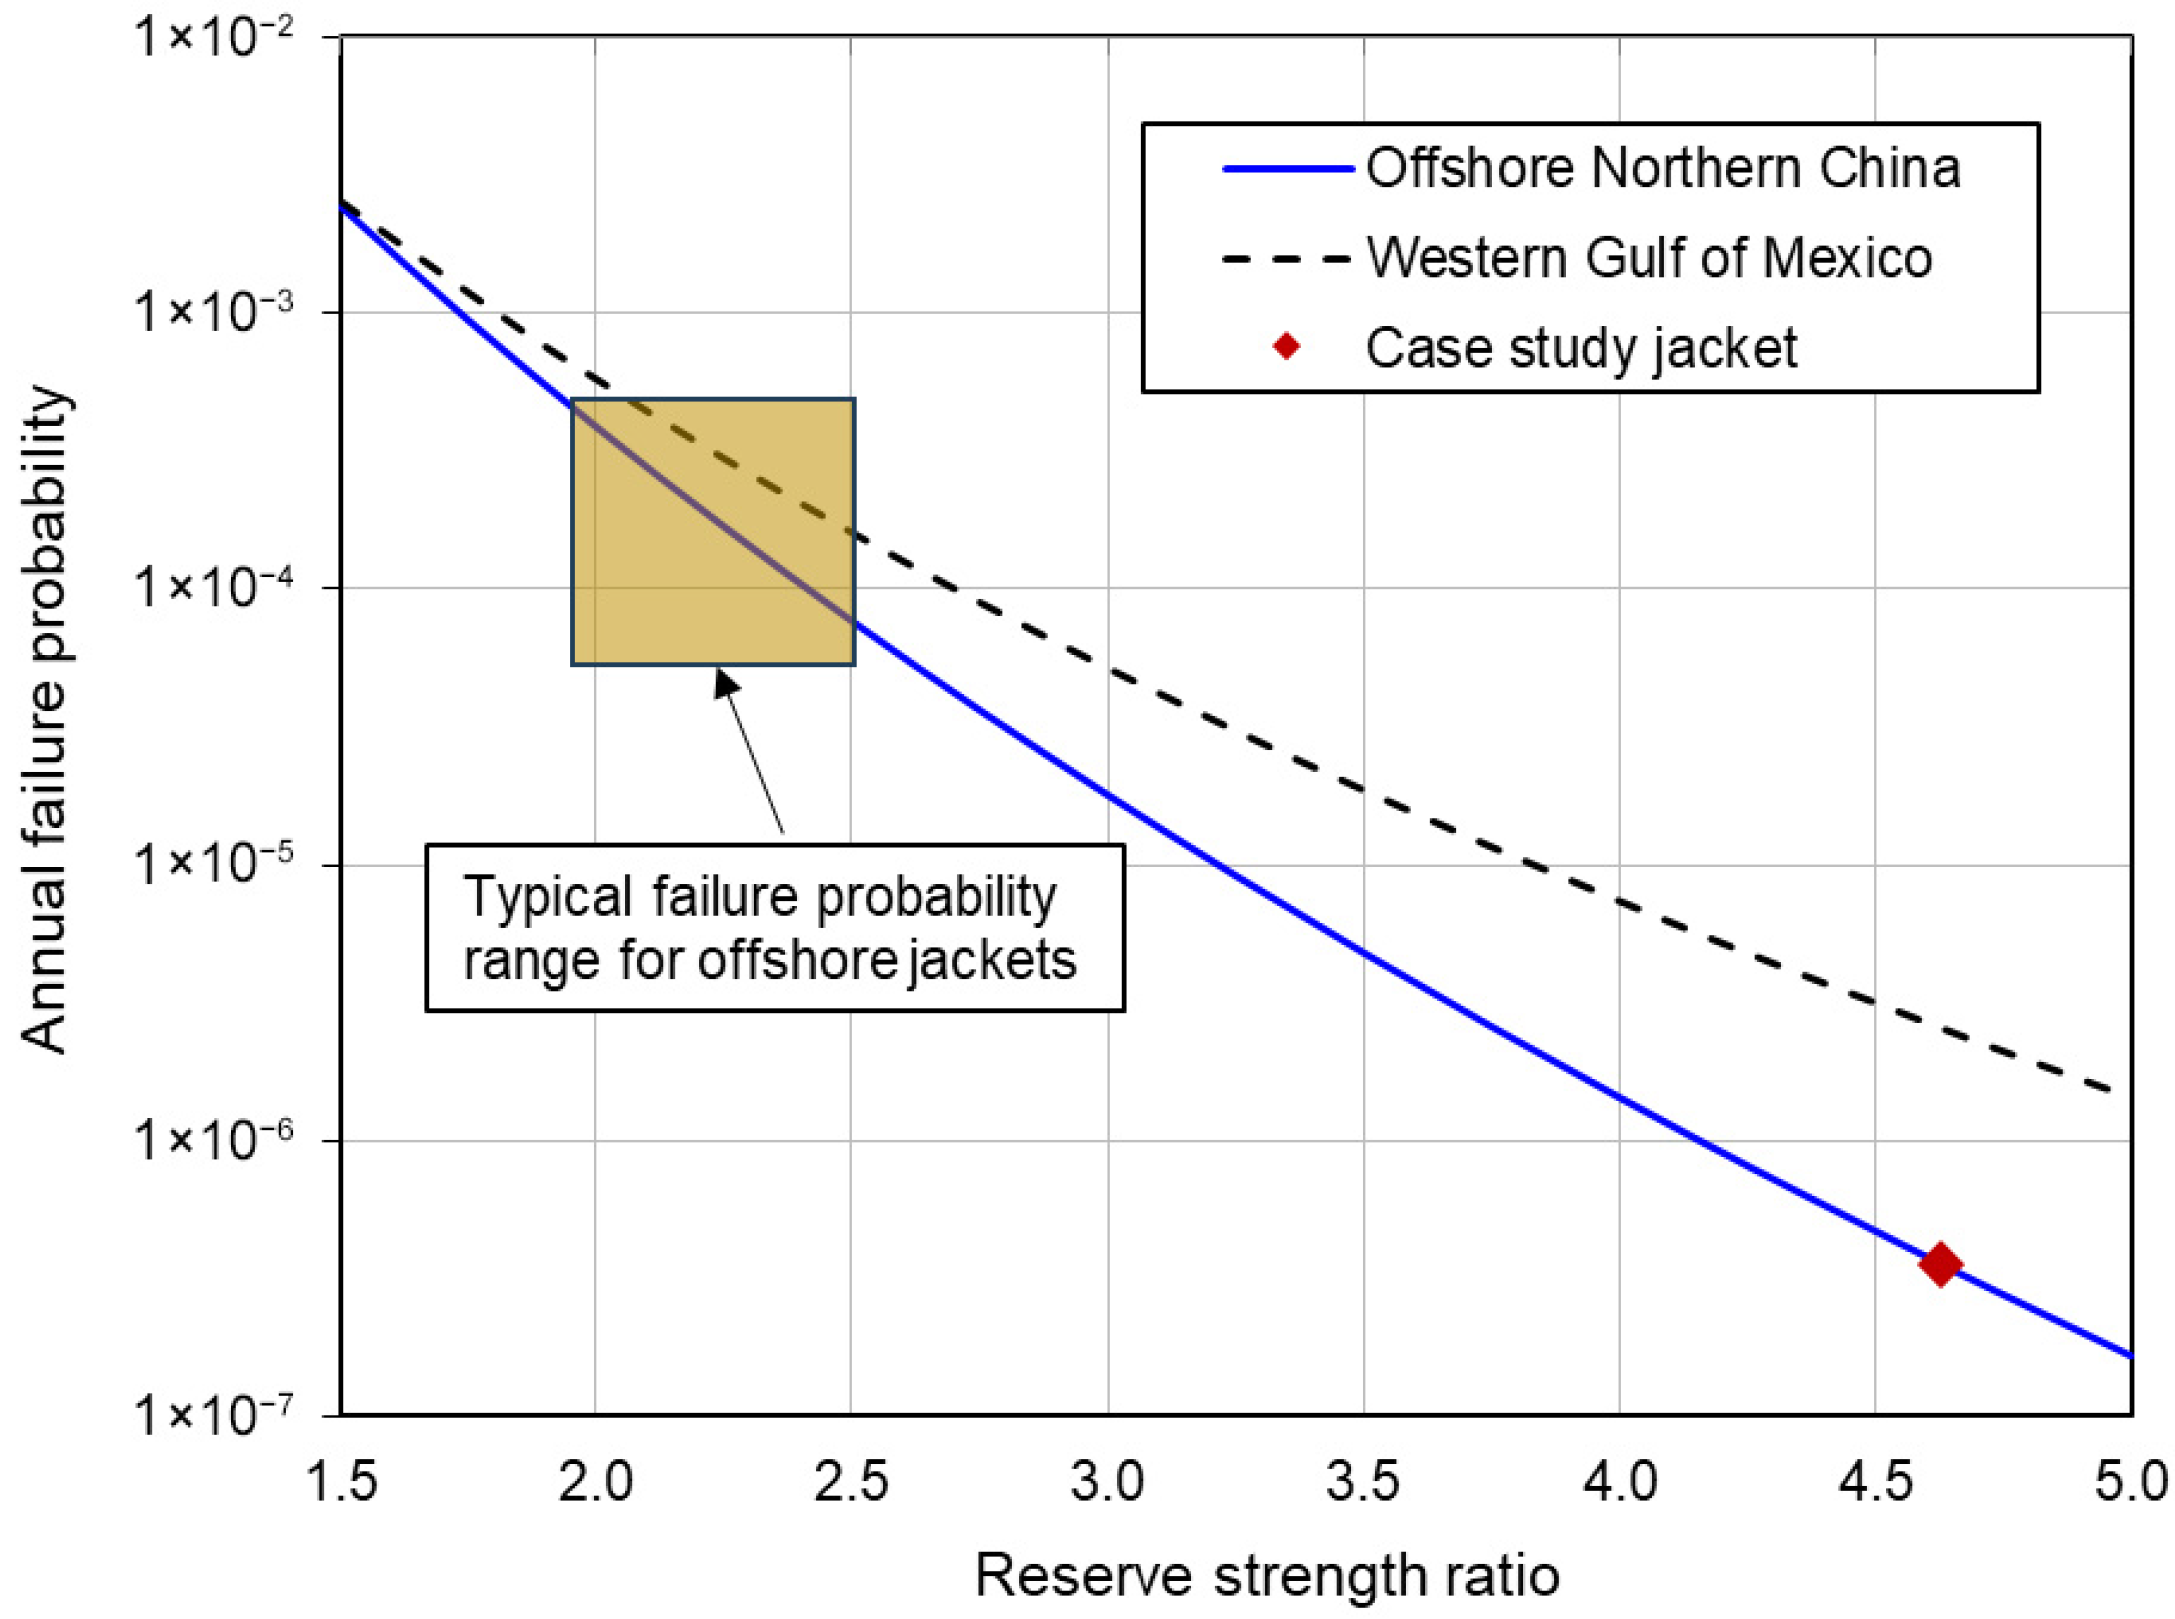
Using the concept of R S R , the failure probability of the substation can be calculated by combining Equations (5) and (8). Because the minimum R S R of the substation is determined by the lateral capacity of the pile foundation, the capacity model bias factor is taken as that of the pile’s lateral capacity, i.e., a mean of 1.17 and a COV of 0.24 (see Table 3). Figure 8 illustrates the annual failure probability due to extreme waves for this substation. The annual failure probability of the jacket structure is about P f = 4.0 × 10 7 for the case of lateral shear damage of the pile foundation at R S R = 4.63 . For comparison, Figure 8 also shows the annual failure probability of a jacket structure located in the western GoM based on the same design and the same structure. Extreme wave data in the GoM were obtained by fitting the API RP2MET (2014) [6] and followed the same methodology in Section 4. H m a x is fitted to a lognormal distribution with log-mean and log-standard deviations of 2.525 and 0.293, respectively. For the same R S R = 4.63 , the annual probability of failure of the jacket structure located in the western GoM is about P f = 5.0 × 10 5 , which is significantly higher than the jacket structure of the study in this paper. This difference arises because the extreme wave uncertainty in the western GoM (log-standard deviation = 0.293) exceeds that in the target sea area in northern China (log-standard deviation = 0.222).

5.3.3. Discussions

Figure 8 also shows the annual failure probability of structural design caused by extreme waves for common offshore oil and gas jacket platforms [9,22,24,36,37], which can also be concluded from Section 4. As shown, it can be seen that the annual failure probability of the jacket platform studied in this paper is two to three orders of magnitude lower than that of common offshore oil and gas jacket platforms under extreme wave loading, indicating a conservatively designed structure. From the static pushover analysis, it can be seen that the R S R of this jacket platform equals 4.63, approximately double that of typical jackets. Since this R S R is controlled by lateral shear failure of the pile foundation, in order to examine the jacket superstructure behavior, the piles were treated as elastic elements (i.e., no plastic deformation), and the pushover analysis was re-run to determine the ultimate capacity of the jacket superstructure. This results in the R S R for the structure itself being about 5.6. This R S R is expected. For the API RP 2A-LRFD (2019) [4] design checks, UC equals 0.742 with an extreme wave load factor of 1.35, while UC under gravity load alone is 0.572. It can be approximated that UC is about 1.0 when the extreme wave load factor is about 3.4, and the structure begins to develop plastic strains. Because the main leg failure is governed by compression and bending, the ratio of the load leading to the formation of the plastic hinge to the that causing the first yielding of the leg is about 1.3. Due to the high structural redundancy of this eight-legged structure, the authors’ experience shows that the ultimate capacity is usually more than 20% after the first leg is damaged. The R S R of the superstructure itself is then about 3.4 × 1.3 × 1.2 = 5.3 , which is close to the value of 5.6 analyzed by SACS. Therefore, the long-term structural reliability of this jacket platform is higher than that of a common offshore oil and gas jacket platform from the extreme wave perspective.
The low annual failure probability of this jacket can also be expected from another perspective. The jacket was checked for the UC value per API RP 2A-LRFD (2019) [4]. As noted above, under an extreme wave load factor of 1.35, the maximum UC occurs in the main legs, with UC = 0.742. If only structural gravity is taken into account, the UC value would be about 0.572. Thus, for the critical members, the 100-year extreme wave load is only about ( 0.742 0.572 ) / ( 1.35 × 0.572 ) = 22 % of the gravity load. Therefore, the jacket loads are mainly caused by structural weight. Since the uncertainty of the structural weight is significantly lower than that of extreme wave loads, the reliability of a structure controlled by gravity load will be significantly higher than that of the structure controlled by extreme waves for the same UC value. From the perspective of the return period of wave loads, failure occurs when the extreme wave load is 4.63 times the 100-year wave load. Combined with Equation (8), the maximum wave height at R S R = 4.63 is about 2.2 times the maximum wave height of the 100-year event. According to the regression analysis in Figure 7, the annual exceedance probability of that wave height is about 1.0 × 10 8 . This probability is also consistent with the long-term annual failure probability P f = 4.0 × 10 7 analyzed above (accounting for the structure and the model uncertainty).
The above findings have also prompted the consideration of structural design guidelines and corresponding standards for offshore substations in Chinese waters. The existing important reference standard for the design of jackets for substations is API RP2A-LRFD 2nd (2019) [4]. Its load factors are derived from extreme wave statistics values in the GoM combined with long-term reliability analysis. Meanwhile, the design of offshore jackets in the GoM is mainly controlled by extreme waves. However, for the offshore substations with heavy topsides studied in this paper, the structural design is mainly controlled by gravity loads. Furthermore, the existing metocean data show that the uncertainty of extreme waves in northern China studied in this paper is lower than that in the GoM. For a given UC, the long-term reliability for a jacket structure governed by gravity load will be higher than one governed by extreme waves. Therefore, this study questioned the suitability of API RP2A-LRFD 2nd (2019) [4], particularly the factors for gravity load and extreme wave loads, for offshore substations with heavy topsides used in offshore wind farms in China.

6. Conclusions

This study demonstrates that the Bayes’ theorem can be effectively used in the calibration of model bias factors for offshore jacket platforms. With the compiled platform database, a calibration study was performed to update the model bias factors for wave loading, structural capacity, and the pile lateral and axial capacities. Then, the reliability of generic jackets in the GoM was evaluated, followed by a case study of an offshore wind substation in northern China for comparison. The main conclusions are as follows:
(1)
Based on the failure performance of 18 jacket platforms during GoM hurricanes, Bayesian calibration indicates that the API design standards are marginally conservative for the structural design of jackets and pile foundations in clay and overly conservative for pile foundation designs in sand. However, the current findings are based on the platforms studied and may be revised with more data points or real-world offshore experiments. The readers need to be aware of this shortcoming of this paper.
(2)
The annual failure probability of a generic offshore platform in the GoM decreases with the increase in reserve strength ratio and typically is lower than 1.0 × 1 0 3 , indicating that extreme weather overload is not the major concern. With the updated model bias factors, the failure probability of jacket superstructures reduces slightly, and the probability of a pile system overturning failure in clay remains largely the same. However, the updated failure probability of a pile system in the lateral direction and against overturning in sand reduces significantly.
(3)
The case study’s offshore substation has an R S R = 4.63 , indicating that the design may be on the conservative side. Using the Bayesian-calibrated bias factors, the long-term failure probability analysis yields an annual failure probability of approximately 4.0 × 1 0 7 . Because this annual failure probability is significantly lower than that of common offshore oil and gas jacket platforms, the design of this jacket is on the conservative side.
(4)
Conventional offshore oil and gas jacket platforms in the GoM are typically governed by extreme wave loading. However, for offshore substations with heavy topsides in offshore northern China, the structural self-weight largely controls the design of the jacket members. In addition, the metocean statistics between the Chinese waters and the GoM are largely different. This raises the question on the suitability of API RP2A-LRFD 2nd (2019) [4] load factors for gravity load and extreme wave loads for offshore substations with heavy topsides in Chinese waters, and more research will be needed to further investigate this topic.

Author Contributions

Conceptualization, F.Z.; Methodology, Y.Z. (Yuhan Zhao); Software, F.M.; Validation, J.C.; Formal analysis, F.Z. and J.C.; Investigation, Y.Z. (Yuhan Zhao); Resources, R.Z., Y.Z. (Yongfei Zhang), Z.H. and Y.B.; Data curation, J.C.; Writing—original draft, F.Z. and F.M.; Writing—review & editing, Y.Z. (Yuhan Zhao), J.C., R.Z., Y.Z. (Yongfei Zhang), Z.H. and Y.B.; Supervision, Z.H.; Project administration, F.Z., R.Z., Y.Z. (Yongfei Zhang) and Y.B. All authors have read and agreed to the published version of the manuscript.

Funding

The Sichuan Science and Technology Program (No. 2024NSFSC0065).

Data Availability Statement

The original contributions presented in this study are included in the article; further inquiries can be directed to the corresponding author.

Acknowledgments

The authors thank the management of Shandong Electric Power Engineering Consulting Institute for their permission to publish this study.

Conflicts of Interest

Authors Fang Zhou, Rui Zhao and Yongfei Zhang were employed by the company Shandong Electric Power Engineering Consulting Institute Co., Ltd. The remaining authors declare that the research was conducted in the absence of any commercial or financial relationships that could be construed as a potential con-flict of interest.

Abbreviations

The following abbreviations are used in this manuscript:
GoMGulf of Mexico
APIAmerican Petroleum Institute
COVCoefficient of Variation
FoSFactor of Safety
RSRReserve Strength Ratio
SRFSystem Redundancy Factor
FEFinite Element

References

  1. Shelley, S.A.; Boo, S.Y.; Kim, D.; Luyties, W.H. Concept design of floating substation for a 200 MW wind farm for the northeast US. In Proceedings of the Offshore Technology Conference, Houston, TX, USA, 4–7 May 2020. [Google Scholar] [CrossRef]
  2. Robak, S.; Raczkowski, R. Substations for offshore wind farms: A review from the perspective of the needs of the Polish wind energy sector. Bull. Pol. Acad. Sci. Tech. Sci. 2018, 66, 517–528. [Google Scholar] [CrossRef]
  3. API RP 2A-WSD; Recommended Practice for Planning, Designing and Constructing Fixed Offshore Platforms—Working Stress Design. American Petroleum Institute: Washington, DC, USA, 2014.
  4. API RP 2A-LRFD; Planning, Designing, and Constructing Fixed Offshore Platforms—Load and Resistance Factor Design. American Petroleum Institute: Washington, DC, USA, 2019.
  5. API RP 2GEO; Geotechnical and Foundation Design Considerations. American Petroleum Institute: Washington, DC, USA, 2011.
  6. API RP 2MET; Derivation of Metocean Design and Operating Conditions. American Petroleum Institute: Washington, DC, USA, 2014.
  7. Liu, J.; Yu, Y.; Wang, B.; Wang, J. Safety of Jacket Platform of Rod Pumping. China Offshore Platf. 2023, 38, 75–79. [Google Scholar]
  8. Wang, C. Safety evaluation analysis of deep sea conductor jacket platform. China Strateg. Emerg. Ind. 2018, 151. (In Chinese) [Google Scholar] [CrossRef]
  9. Chen, J. Deterministic and Probabilistic Analyses of Offshore Pile Systems. Ph.D. Thesis, The University of Texas at Austin, Austin, TX, USA, 2016. Available online: https://repositories.lib.utexas.edu/items/7f3aa035-8b6f-4385-9a65-31404322f55b (accessed on 5 June 2025).
  10. ABS Consulting. Hurricane Lili′s Impact on Fixed Platforms: Final Report Prepared for Minerals Management Service; MMS Order No.: 0103PO72325; U.S. Department of the Interior—Minerals Management Service: Herndon, VA, USA, 2004. [Google Scholar]
  11. Energo Engineering, Inc. Reliability vs. Consequence of Failure for API RP2A Platforms Using RP2MET; U.S. Department of the Interior—Minerals Management Service: Herndon, VA, USA, 2009. [Google Scholar]
  12. Chen, J.-Y.; Gilbert, R.B.; Puskar, F.J.; Verret, S. Case study of offshore pile system failure in hurricane Ike. J. Geotech. Geoenviron. Eng. 2013, 139, 1699–1708. [Google Scholar] [CrossRef]
  13. Jesper, T.; Allan, Z. AWARE Project: General project introduction, structural reliability analysis, and code wrapper development. In Proceedings of the Offshore Structure Reliability Conference, Delft, The Netherlands, 25–28 October 2022; Available online: https://www.iogp.org/event/2022-offshore-structures-reliability-conference-osrc/ (accessed on 25 September 2025).
  14. Gilbert, R.B.; Chen, J.Y.; Materek, B.; Puskar, F.; Verret, S.; Carpenter, J.; Young, A.; Murff, J.D. Comparison of observed and predicted performance for jacket pile foundations in hurricanes. In Proceedings of the Offshore Technology Conference, Houston, TX, USA, 3–6 May 2010. [Google Scholar]
  15. Xu, L.; Chen, G. Updating probabilistic reliability model based on fuzzy bayesian theory. J. Pet. Univ. (Nat. Sci. Ed.) 2003, 53–56, 151–152. (In Chinese) [Google Scholar]
  16. Li, M.; Zhang, R.; Hong, M. Marine disaster risk assessment based on weighted bayesian network. Mar. Sci. Bull. 2018, 37, 121–128. [Google Scholar]
  17. Alfredo, H.S.A.; Wilson, H. Probability Concepts in Engineering Planning and Design; John Wily Sons: New York, NY, USA, 1975; Volume 268. [Google Scholar] [CrossRef]
  18. Forristall, G.Z. On the statistical distribution of wave heights in a storm. J. Geophys. Res. Ocean. 1978, 83, 2353–2358. [Google Scholar] [CrossRef]
  19. Lacasse, S.; Nadim, F.; Langford, T.; Knudsen, S.; Yetginer, G.L.; Guttormsen, T.R.; Eide, A. Model uncertainty in axial pile capacity design methods. In Proceedings of the Offshore Technology Conference, Houston, TX, USA, 6–9 May 2013. [Google Scholar] [CrossRef]
  20. Chen, J.; Gilbert, R.B.; Ku, A.; Chen, J.-Y.; Marshall, P.W. Calibration of model uncertainties for fixed steel offshore platforms based on observed performance in Gulf of Mexico hurricanes. J. Geotech. Geoenviron. Eng. 2020, 146, 04020039. [Google Scholar] [CrossRef]
  21. Puskar, F.; Verret, S. Assessment of Fixed Offshore Platform Performance in Hurricanes Katrina and Rita; Energo Engineering Inc.: Houston, TX, USA, 2007. [Google Scholar]
  22. Chen, J.; Gilbert, R.B.; Manuel, L.; Ku, A. Comparative assessment of component and system reliability for offshore platform pile foundations. In Innovations in Geotechnical Engineering; American Society of Civil Engineers: Reston, VA, USA, 2018; pp. 371–388. [Google Scholar] [CrossRef]
  23. Amouzadrad, P.; Mohapatra, S.C.; Guedes Soares, C. Review on sensitivity and uncertainty analysis of hydrodynamic and hydroelastic responses of floating offshore structures. J. Mar. Sci. Eng. 2025, 13, 1015. [Google Scholar] [CrossRef]
  24. Cornell, C.A. Structural reliability-some contributions to offshore technology. In Proceedings of the Offshore Technology Conference, Houston, TX, USA, 1–4 May 1995. [Google Scholar] [CrossRef]
  25. Wang, Y. An enhanced second-order method in structural reliability analyses. Structures 2025, 80, 109766. [Google Scholar] [CrossRef]
  26. Varela, G.; Tolentino, D. Reliability assessment of offshore structures considering cumulative damage over time. Structures 2025, 76, 109025. [Google Scholar] [CrossRef]
  27. Hu, Z.; Mansour, R.; Olsson, M.; Du, X. Second-order reliability methods: A review and comparative study. Struct. Multidiscip. Optim. 2021, 64, 3233–3263. [Google Scholar] [CrossRef]
  28. Krieger, W.; Banon, H.; Lloyd, J.; De, R.; Digre, K.; Nair, D.; Irick, J.; Guynes, S. Process for assessment of existing platforms to determine their fitness for purpose. In Proceedings of the Offshore Technology Conference, Houston, TX, USA, 2–5 May 1994. [Google Scholar] [CrossRef]
  29. Guo, J.; Liu, M.; Fang, Z.; Chen, W.; Pan, X.; Yang, L. An experimental study on the influence of wind-wave-current coupling effect on the global performance of a 12 MW semi-submersible floating wind turbine. Ocean Eng. 2024, 304, 117795. [Google Scholar] [CrossRef]
  30. Mohapatra, S.C.; Amouzadrad, P.; Bispo, I.B.d.S.; Guedes Soares, C. Hydrodynamic response to current and wind on a large floating interconnected structure. J. Mar. Sci. Eng. 2025, 13, 63. [Google Scholar] [CrossRef]
  31. Lamei, A.; Hayatdavoodi, M.; Riggs, H.; Ertekin, R. Wave–current–wind interaction with elastic floating offshore wind turbines. Eng. Anal. Bound. Elem. 2025, 171, 106052. [Google Scholar] [CrossRef]
  32. Aggarwal, R.; Litton, R.; Cornell, C.; Tang, W.; Chen, J.; Murff, J. Development of pile foundation bias factors using observed behavior of platforms during Hurricane Andrew. In Proceedings of the Offshore Technology Conference, Houston, TX, USA, 6–9 May 1996. [Google Scholar] [CrossRef]
  33. Marshall, P.W. Design of Welded Tubular Connections: Basis and Use of AWS Code Provisions; Elsevier: Amsterdam, The Netherlands, 2013; Volume 37. [Google Scholar]
  34. Moses, F. Development of Preliminary Load and Resistance Design Document for Fixed Offshore Platforms: API-PRAC Project 85-22; American Petroleum Institute: Washington, DC, USA, 1986. [Google Scholar]
  35. Liu, Z.; Nadim, F.; Lacasse, S.; Lehane, B.; Choi, Y.J. Method uncertainty for five axial pile capacity design methods. In Proceedings of the Offshore Technology Conference, Houston, TX, USA, 6–9 May 2019. [Google Scholar] [CrossRef]
  36. Moses, F. System reliability developments in structural engineering. Struct. Saf. 1982, 1, 3–13. [Google Scholar] [CrossRef]
  37. Chen, J.; Gilbert, R.B.; Manuel, L. Study of Environmental Load Factor in API RP2A LRFD; University of Texas at Austin: Austin, TX, USA, 2017. [Google Scholar]
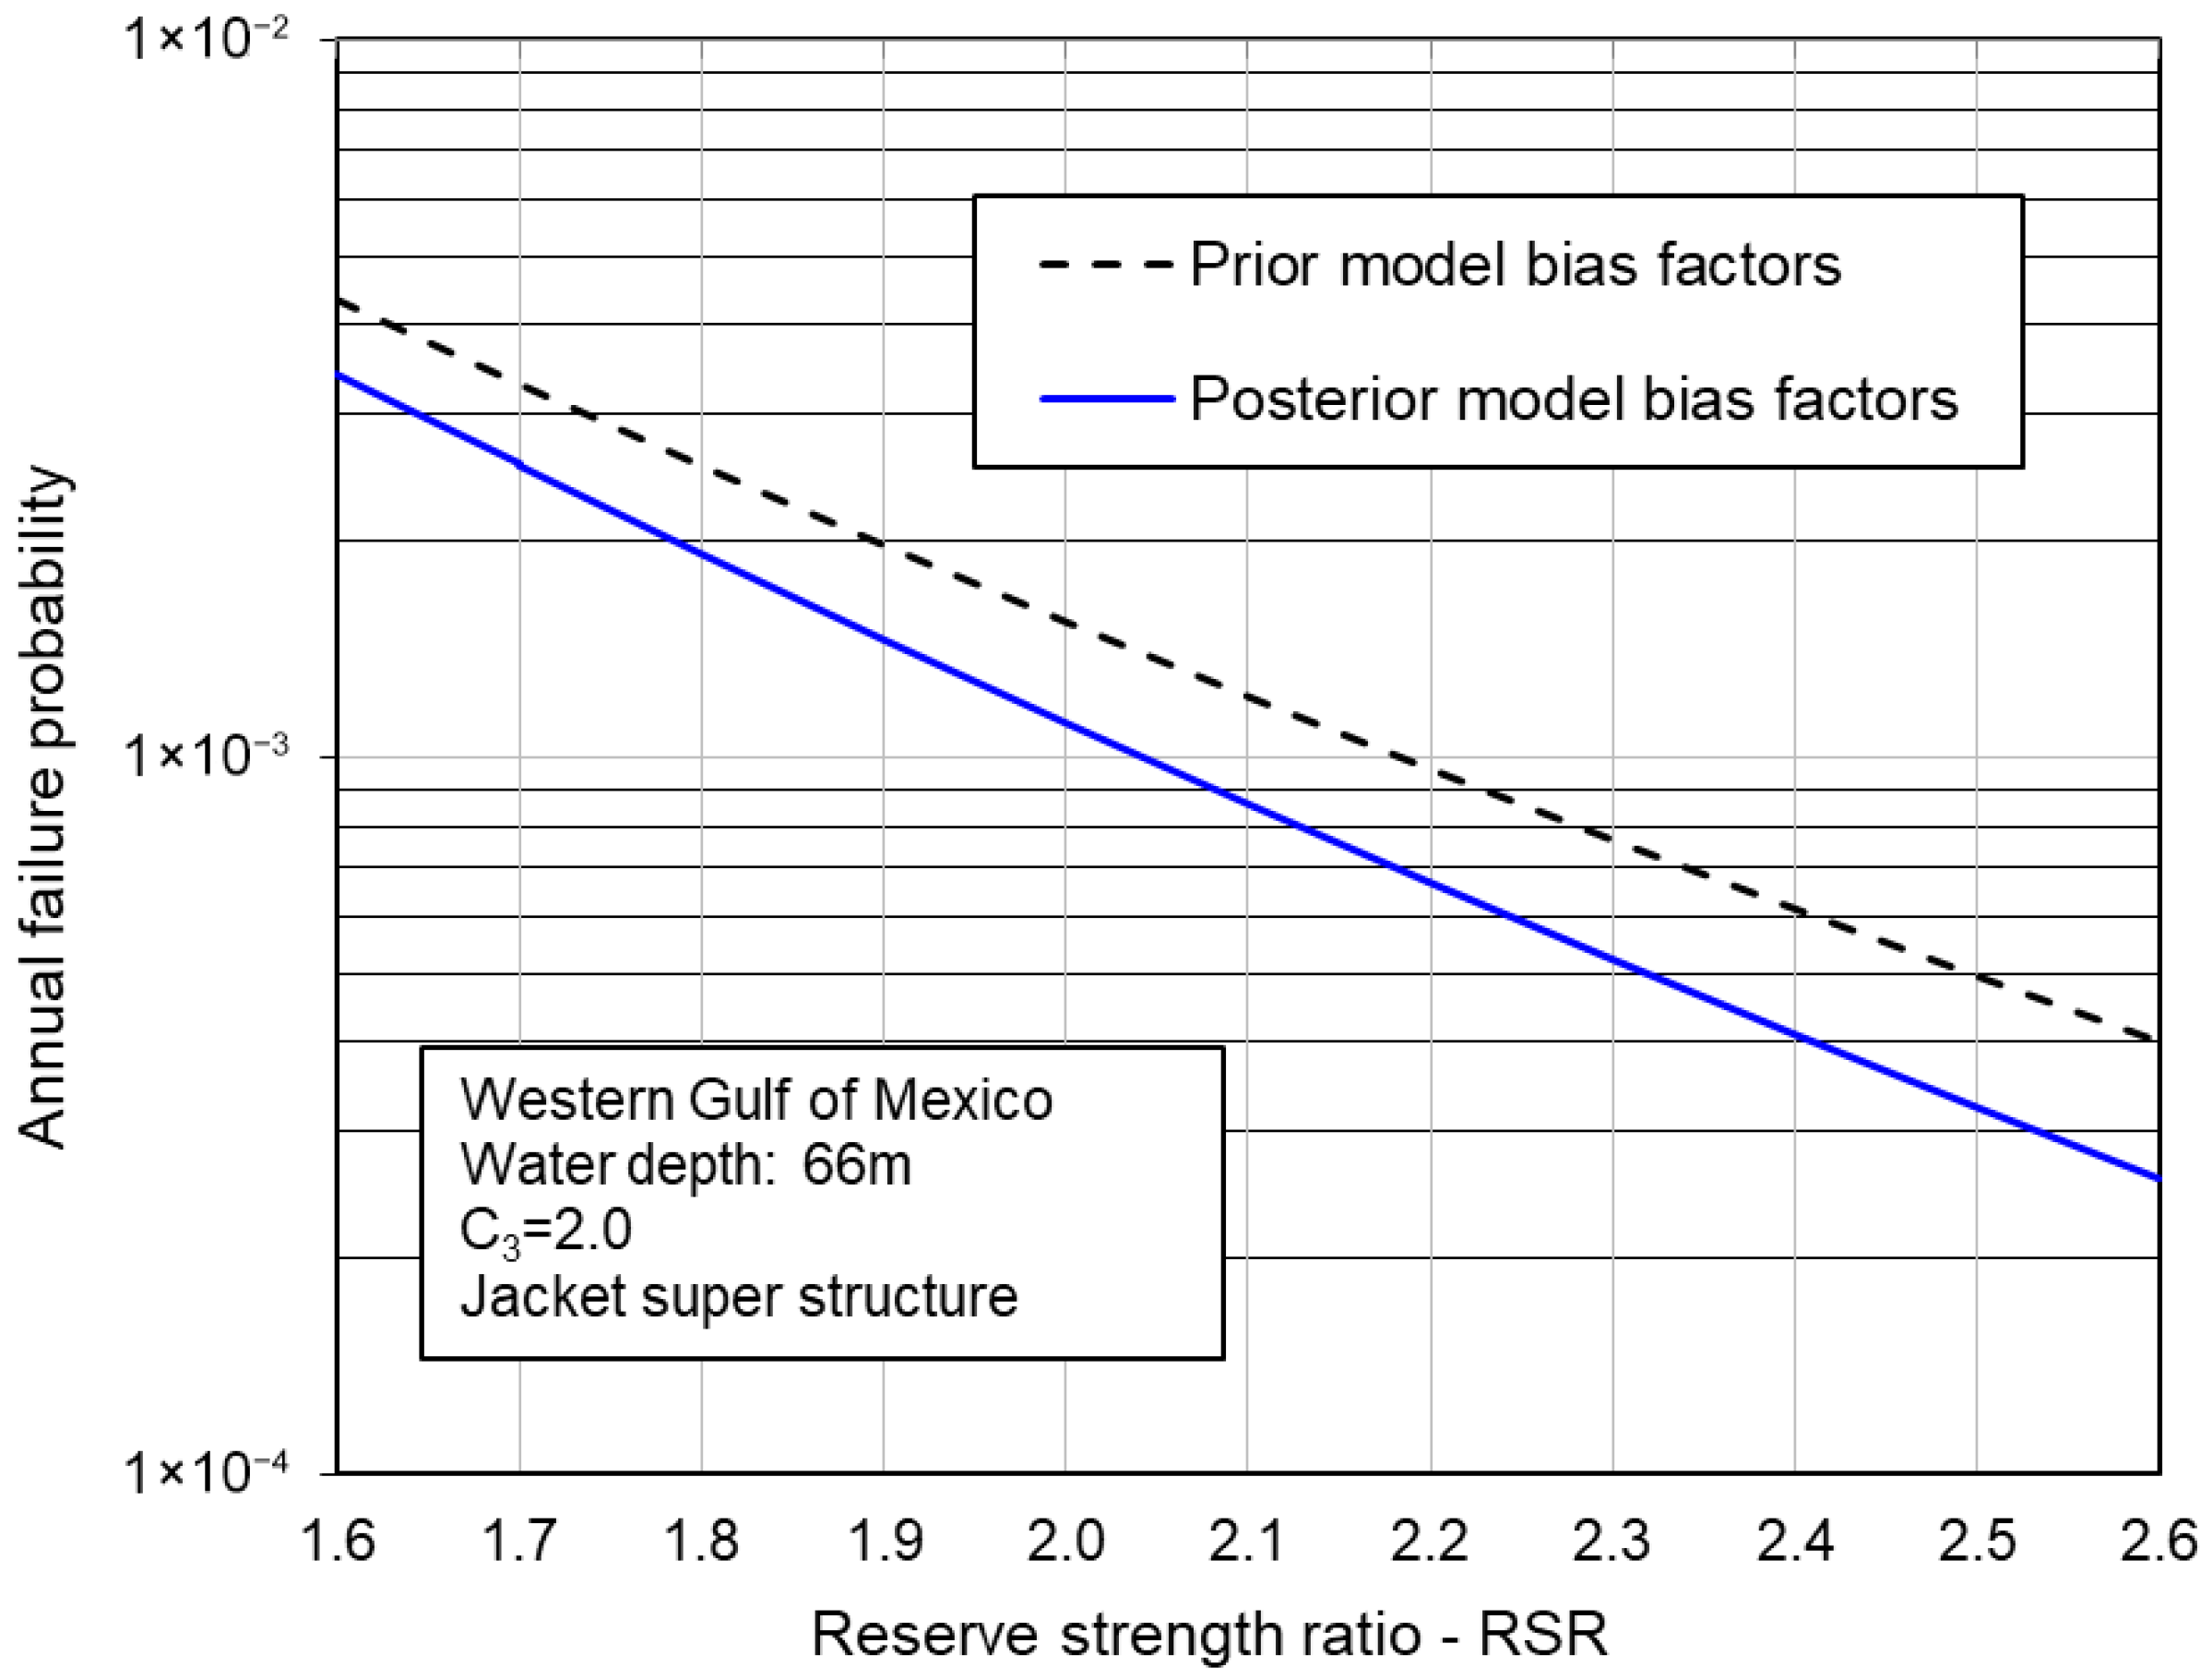
Figure 1. Reliability of a jacket superstructure with prior and posterior model bias factors in GoM.
Jmse 13 01989 g001
Figure 2. Reliability of a pile system in the lateral direction with prior and posterior model bias factors in GoM.
Jmse 13 01989 g002
Figure 3. Reliability of a pile system in the axial direction with prior and posterior model bias factors in GoM.
Jmse 13 01989 g003
Figure 4. Variation in pile system against overturning with system redundancy factor.
Jmse 13 01989 g004
Figure 5. Overall modeling effect of the substation: (a) FE model in SACS; (b) applied environmental load.
Jmse 13 01989 g005
Figure 6. Static pushover analysis results: (a) load–displacement curve; (b) development of plastic hinges (the red spots shown in the figure).
Jmse 13 01989 g006
Figure 7. Fitting of metocean data: (a) lognormal distribution fitting of maximum wave height; (b) base shear vs. maximum wave height fitting curve.
Jmse 13 01989 g007
Figure 8. Long-term annual failure probability of the case study’s jacket.
Jmse 13 01989 g008
Table 1. Jacket platform database summarized from Chen et al. [20].
Current Platform No.Predicted Base Shear Load (MN)Predicted
Ultimate Capacity (MN)
Predicted Platform
Performance
Observed Platform
Performance
Comments
B116.716.9FailureSurvivalDesign is conservative
B24.66.3SurvivalSurvivalDesign is fair
B315.814.5FailureFailureDesign is fair
B410.38.0FailureFailureDesign is fair
B520.016.5FailureDamageDesign is conservative
B65.47.3SurvivalDamageDesign is unconservative
B76.07.2DamageFailureDesign is unconservative
B86.04.9FailureDamageDesign is conservative
B924.537.4SurvivalSurvivalDesign is fair
B1014.515.3DamageDamageDesign is fair
B1118.816.2FailureDamageDesign is conservative
B1218.918.6FailureSurvivalDesign is conservative
B1317.625.1SurvivalDamageDesign is unconservative
B1416.518.6DamageDamageDesign is fair
B154.411.4SurvivalDamageDesign is unconservative
B1611.314.3DamageDamageDesign is fair
B1715.415.0FailureSurvivalDesign is conservative
B185.35.4FailureFailureDesign is fair
Table 2. Aleatory bias factor of resistance [22].
VariableSeabed Geotechnical Sampling Condition ξ j ξ f l , c ξ f a , c ξ f a , s
Mean value1.01.01.01.0
Coefficient of variation (COV)Project-specific static sampling0.150.10.10.2
Project-specific driven sampling0.150.150.20.3
No project-specific seabed soil samples0.150.20.30.5
Table 3. Model bias factor a priori and a posteriori statistical values [20].
Statistical Value B s B j B f l c B f a c B f a s
Prior distributionMean value0.931.001.001.301.30
Coefficient of variation (COV)0.200.200.300.300.50
Posterior distributionMean value0.920.951.171.051.46
Coefficient of variation (COV)0.130.130.240.190.37
Disclaimer/Publisher’s Note: The statements, opinions and data contained in all publications are solely those of the individual author(s) and contributor(s) and not of MDPI and/or the editor(s). MDPI and/or the editor(s) disclaim responsibility for any injury to people or property resulting from any ideas, methods, instructions or products referred to in the content.