Abstract
The operation of floating nuclear power plants is subject to a number of environmental factors in addition to the typical working temperature and pressure loads. These include marine environmental loads, which can cause fatigue damage and therefore must be taken into account. The fatigue analysis of marine structures frequently employs frequency domain methods, whereas the fatigue analysis of pressure equipment predominantly utilizes time-domain methods. At present, there is no comprehensive and accessible approach for conducting a fatigue analysis of pressure equipment in floating nuclear power plants. In light of the aforementioned considerations, this paper puts forth a novel approach to evaluating fatigue damage based on the principle of damage combination. This article presents a finite element model of pressure equipment and a methodology for calculating the transfer function of such equipment under wave loads. The frequency domain method is employed to calculate the fatigue damage caused by wave loads, with consideration given to both the working temperature and pressure load. The stress time history curve of pressure-bearing equipment is then calculated using the time-domain method. Subsequently, the fatigue damage caused by thermal pressure loads is obtained through a combination of the rainflow counting method and cumulative damage theory, with verification conducted using time-domain calculations. In comparison to alternative damage combination methodologies, the novel approach offers more precise and straightforward damage calculations, with promising potential for integration into engineering design.
1. Introduction
Nuclear energy, as a clean energy source with extremely high energy density, is the subject of ongoing development and is utilized in a range of fields. The safety issues associated with this energy source have attracted considerable attention. As an emerging type of utilization of nuclear energy, floating nuclear power plants are subject to a range of movements, including lateral tilt, longitudinal tilt, pitch, sway, heave, and so forth, on the reactor platform. These movements are a consequence of the interaction between the marine environment and the floating nuclear power plant, specifically the action of wind, waves, currents, and other environmental factors. During the design life, floating reactors not only have to withstand low-frequency fatigue caused by temperature and pressure, but they also have to endure long-term oscillation inertial forces generated by waves [1,2]. The lateral inertial force generated by waves is a constantly changing dynamic load that causes alternating stress in equipment structures, which may cause fatigue damage to the structure. Fatigue failure is the main form of mechanical structural failure [3,4,5,6]. As a vital component of large-scale nuclear power equipment, the potential consequences of Reactor Pressure Vessel (RPV) failure are significant and far-reaching. It is therefore imperative that the fatigue damage analysis of the RPV is completed with the utmost expediency and precision during the design phase in order to ensure the safety of floating nuclear power plants.
According to the requirements of the nuclear power standard ASME BPVC III [7], fatigue analysis requires the superposition calculation of possible transient loads, considering different transient combinations to find the most dangerous position for fatigue analysis. The transient load resulting from temperature and pressure fluctuations is relatively straightforward in its fundamental structure, straightforward to calculate, and susceptible to fatigue damage under thermal pressure. Nevertheless, the transient loads generated by wave action under different wave heights and periods are not identical. It is necessary to consider that each transient load requires a significant amount of time to simulate the complete time-domain nonlinear coupling calculation. Consequently, the fatigue damage caused by wave load action is predominantly examined through the lens of spectral analysis techniques. In theory, due to the nonlinear relationship between damage and stress, the direct addition of fatigue damage obtained from the two methods would be a highly conservative and potentially dangerous approach. In the fatigue analysis of the riser system by Luo et al. [8], the result of the direct addition of damage is 20–60% lower than the actual result; Lotsberg [9] also pointed out that this direct addition method should not be used to calculate the combined fatigue damage under two types of loads.
Additionally, numerous studies have been conducted on the combination methods of damage under varying loads. Lotsberg [9] proposed a simple and clear formula based on the principle of damage equivalence, which equates a low-frequency and high-frequency random stress response process to a combination of two constant amplitude stress time processes. This formula has been applied in DNV specifications. Huang and Moan [10] proposed a formula similar to DNV, but it can only provide more accurate fatigue damage in some cases. Similarly, Temple [11] proposed a new damage combination formula called the sum of squares of damage square root method, which has no theoretical background, and the damage results are not satisfactory. Han and Ma [12] proposed a pseudo spectral method based on the superposition of two constant amplitude sine waves to construct a new spectrum to solve the fatigue damage combination problem under high and low frequency loads. The method is relatively straightforward to use; however, in floating nuclear power plants, low-frequency loads are no longer sinusoidal, rendering the method inapplicable. Conversely, the theoretical foundation for estimating damage using these methodologies is Miner’s linear accumulation theory. Although spectral methods based on the Miner’s rule have proven to be effective in estimating fatigue life [13,14], it must be acknowledged that the Miner’s rule does not consider the interaction between loads, which is inconsistent with the actual damage accumulation behavior of many materials. In engineering, the total cumulative damage of a structure when it fails is not necessarily 1, and there is usually a large fluctuation range [15]. To address the shortcomings of Miner’s criterion, many scholars have proposed different cumulative damage models, which are categorized into two types: modified linear cumulative damage models and nonlinear cumulative damage models. Among the modified linear cumulative damage models, the Corten–Dolan [16] model is the most classical one, and the main difference between it and Miner’s criterion is that it replaces the slope parameter m of the S–N curve with the damage index “d”.
Nonlinear damage accumulation models include the accumulation model based on the damage curve, the accumulation model based on the energy criterion, the accumulation model based on the continuous damage mechanics, and the accumulation model considering the effect of loading sequence. Marco and Starkey [17] constructed a nonlinear fatigue damage model considering stress amplitude by conducting experiments with different loading sequences on the concept of a damage curve. Subsequently, Manson and Halford [18] provided the damage index and proposed an analytical expression for the damage curve based on the empirical formula of the effective crack propagation model. Based on the application of the energy dissipation process in fatigue damage, Ye et al. [19] proposed a toughness dissipation model, which requires fewer parameters, has a simple form, and is more accurate in calculating fatigue cumulative damage under multi-stage loading. Niu et al. [20] obtained the rule of change of the hardening coefficient and hardening index with the load cycle through strain cycling experiments and put forward a fatigue damage model related to the energy of plastic strains. This is a nonlinear cumulative model based on the energy criterion, and this kind of model is simple without additional physical parameters, but there is the problem of not considering the order of loads and the interaction between loads. Following the proposal of the concepts of “continuity” and “damage factor” by Kachanov [21] through the analysis of creep damage, the theory of continuum damage mechanics was gradually developed. Consequently, the cumulative damage model based on continuum damage mechanics began to evolve. Lemaitre [22] combined the theory of continuum damage mechanics with thermodynamics to obtain a new model of fatigue damage evolution; Dattoma [23] established the theory of continuous medium damage on the basis of Chaboche and Lemaitre’s model; Xu [24] utilized the continuous damage model for the fatigue assessment of suspension bridges under multiple loads. These models have a more perfect mechanical theoretical basis, but due to the large number of parameters in the model, some parameters are difficult to determine. More and more models represent the effect of the loading sequence on fatigue damage by introducing specific parameters. Chen [25] took the static toughness of the material as the damage parameter, considering the loading sequence effect, and proposed a convenient nonlinear fatigue damage accumulation criterion. Gao [26] provided a definition for the correction factor as the ratio of two successive applied stress levels, and Wang’s [27] contributions to the field entailed the refinement of Ye’s model through the incorporation of primary and secondary terms representing the ratio of anterior and posterior loads. This methodological advancement yielded more precise results.
In the study of pressure-bearing equipment in floating nuclear power plants, the fatigue damage under wave load and thermal pressure load was calculated using the methods of the ship standard and the nuclear power standard, respectively. Considering the joint action of thermal pressure load and wave load, a more convenient damage calculation formula was proposed based on Liu and Wang’s [28] damage formula. Ultimately, the stress time history curve and fatigue damage value of the structural verification node were derived through time-domain simulation calculations for a range of operational scenarios. The findings demonstrate that the combined approach exhibited superior accuracy in predicting damage values compared to the linear model while offering a more expedient solution than time-domain simulation calculations.
2. Fatigue Analysis Method for Ship Structure
Fatigue analysis methods for ship structures are mainly divided into two categories: time-domain methods [29] and frequency-domain methods [30,31] (spectral methods). The former are based on the random process simulation of fatigue loads and a structural transient analysis. Previous methods include using the rainflow counting formula (RCF) to extract the average and amplitude of stress response time history [32], and then using these values as inputs to the fatigue damage equation to evaluate fatigue damage and life. This method is capable of simulating actual fatigue damage in a more realistic manner; however, it is relatively inefficient in terms of computational resources. The latter method, the spectral method, directly calculates fatigue damage by obtaining the power spectral density (PSD) of stress based on the PSD of random loads. The computational efficiency of spectral methods is considerable, as frequency domain response analysis is more rapid than transient dynamics analysis over an extended period.
2.1. Spectral Analysis Method
Spectral analysis is a frequently employed methodology in the fatigue analysis of maritime vessels, facilitating the investigation of load and structural response. The theoretical basis for this method is the transformation of linear systems in the context of stochastic process theory. Assuming that the wave process is a stationary stochastic process, then the alternating stress caused by waves can also be considered a stochastic process. In accordance with the tenets of stochastic process theory, the power spectral density of two stationary stochastic processes is related by the following equation:
where is called the transfer function, is the power spectral density function of the input process, is the power spectral density function of the response process, and is circular frequency.
In the context of operating pressure-bearing equipment in floating nuclear power plants, the oscillation inertia force generated by waves represents a continually evolving dynamic load. Its magnitude is contingent upon acceleration. In order to employ spectral analysis methods, it is first necessary to convert the wave spectrum into an acceleration spectrum. This is followed by the calculation of the alternating stress intensity power spectrum of the pressure-bearing equipment through the acceleration spectrum. The formula should be expressed as follows:
where is the alternating stress intensity power spectrum, is the acceleration power density spectrum, is the wave spectrum, is the transfer function from the acceleration spectrum to the alternating stress intensity power spectrum, and is the transfer function from the wave spectrum to the acceleration spectrum.
The fatigue calculation of the full structure using the narrow band correction method can be expressed as follows:
where is the fatigue damage value calculated using the narrow band correction method, T is the duration, K and m are material parameters, and is the average cross-zero rate, calculated by the following equation:
where and are the spectral moment, calculated by the following equation:
where is the power density spectrum, and is circular frequency.
2.2. Transfer Function
The ratio of the structural displacement amplitude to the wave amplitude under wave action, calculated by the software under the Hydrodynamic Diffraction plate in ANSYS Workbench (v. 22.1), is defined as the transfer function, , from the wave spectrum to the displacement spectrum. Furthermore, a relationship exists between the displacement spectrum and the acceleration spectrum. The displacement spectrum and acceleration spectrum have the following relationship:
where is the transfer function from the wave spectrum to the acceleration spectrum.
The acceleration power spectrum is calculated as follows:
where is power spectral density function of the acceleration response.
The transfer function from the acceleration power spectrum to the alternating stress power spectrum is calculated using the complex frequency response method. For a multi-load input linear system, under a multi-input process , the multi-output process of the structure is , and there is a relationship between the input process power spectral density function matrix, , and the output process power spectral density function matrix, , expressed as follows:
where is the input process power spectral density function matrix, is the output process power spectral density function matrix, and is the frequency transfer function matrix. The matrix form is as follows:
where is the cross-spectral density function of response processes and ; is the cross-spectral density function of input processes and .
is the frequency transfer function between and , representing the frequency transfer function generated at j by a unit harmonic load acting at k, and and are conjugate functions with each other.
By using the harmonic response analysis module of ANSYS APDL, the calculation results are combined with real and imaginary data to obtain the transfer function from input to output. Unit acceleration is applied in six directions in APDL to obtain the transfer function of acceleration in six directions to structural stress intensity.
2.3. Alternating Stress Intensity Power Spectral Density
The ASME standard requires the use of alternating stress intensity to evaluate fatigue damage in structures. The alternating stress intensity in the standard refers to half of the maximum absolute value of the difference between the three principal stresses.
For a linear system, the relationship between a single load and six stress components is linear.
where C represents the stress component under the action of a unit load, and represent different stress components.
The calculation of the principal stress can be expressed as
where , , and represent different principal stresses.
For the same load form and structure, the coefficients of each stress component in the equation are determined, so there is also a linear relationship between and the principal stress.
The stress intensity is calculated as follows:
So, in a linear system, the input single load, F, and the stress intensity response, , are also linearly related.
For a linear system under the simultaneous action of several loads, without considering the influence of direction and assuming that the effects of different loads are not correlated, the response of the alternating stress intensity can be considered as the sum of the response values under the individual action of each load. In fact, the direction of the principal stress is different, and the loads also influence each other, so the sum of the response values under the individual action of each load is a more conservative result.
2.4. Inertial Acceleration Conversion
Based on the idea of coordinate transformation, the inertial acceleration caused by the movement of the ship is transformed into acceleration in three directions, X, Y, and Z, to calculate the inertial load caused by the change in position of the pressure equipment. In two-dimensional rotation, it is established that a counter-clockwise rotation of the coordinate system along the Z axis is positive, with a rotation angle of θ, as shown in Figure 1 below.
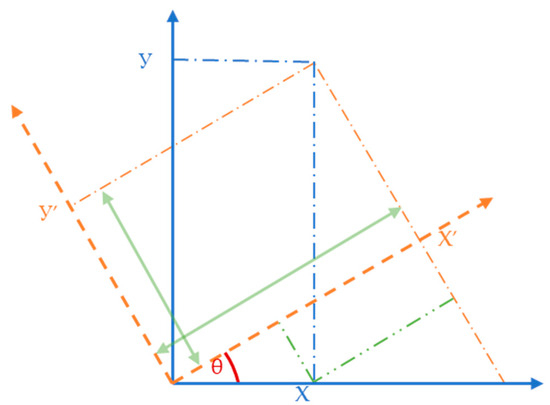
Figure 1.
Schematic diagram of coordinate system rotation.
There are
They are expressed in matrix form as follows:
For three-dimensional rotations, only three two-dimensional rotations need to be performed. By extrapolation, the coordinate axes are rotated by α, β, and γ along the X, Y, and Z axes, and the corresponding coordinate transformations are as follows:
After obtaining the pitch, roll, and yaw angles, the gravitational acceleration can be converted into linear acceleration in three directions. Taking the effect in the Rx direction as an example, the calculation of the stress intensity power spectral density of the pressure equipment verification point is performed as follows:
where , , and are the power density spectral functions of stress intensity in the Y, Z, and Rx directions; is the power spectral density function of the total stress intensity; is the wave spectrum; is the transfer function from the wave spectrum to the structural motion acceleration spectrum; and is the transfer function from motion acceleration to structural response, alternating stress intensity.
2.5. S-N Curve
From the ASME, we can obtain the material number used for RPV as SA-508 GR.3 CL.1 with the following chemical composition and material properties at different temperatures. The specific chemical composition is shown in Table 1 and the material properties at various temperatures are shown in Table 2.

Table 1.
Chemical composition of SA-508 steel (wt.%).

Table 2.
Material characteristics of SA-508 steel at different temperatures.
The Appendix of ASME BPVC-III Volume 1 provides the design fatigue curve for the corresponding material. The specification does not directly provide the fatigue performance curve for a particular grade of material but first classifies materials with similar fatigue performance and then provides the fatigue performance envelope for each type of material. Therefore, when using the design fatigue curve in the ASME specification for evaluation, a conservative estimate is obtained with a certain margin to meet engineering requirements. The specific design fatigue curve is shown in Figure 2 below.
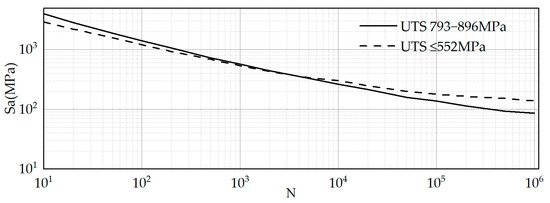
Figure 2.
S–N curve of RPV material.
The general idea of using the spectral analysis method for fatigue calculation is to first calculate the environmental load on the structure, apply the load in the form of unit load at different frequencies to the finite element model to calculate the frequency domain response of the structure, and obtain the linear relationship between load and stress in the frequency domain. The short-term distribution of the load is calculated based on the short-term sea state information, and the stress range distribution of the structure under this working condition is obtained through the linear relationship obtained previously. The cumulative damage theory is used to calculate various short-term damages, and all of the damage are combined based on long-term service conditions to obtain the total damage. This method has many assumptions, and no one has used it to calculate structural fatigue in the nuclear power field, nor has it been mentioned in the nuclear power standard.
3. Fatigue Analysis Method for Nuclear Pressure Vessels
The ASME Boiler and Pressure Vessel Standard is a comprehensive technical specification for boilers and pressure vessels jointly issued by the American Society of Mechanical Engineers (ASME) and the American National Standards Institute (ANSI). It is the earliest and most authoritative boiler and pressure vessel standard in the world. Among other things, it requires the use of alternating stress intensity for fatigue analysis. As shown in Figure 3, the main methods to obtain RPV structural stresses are theoretical analysis, experimental verification, and numerical calculation.
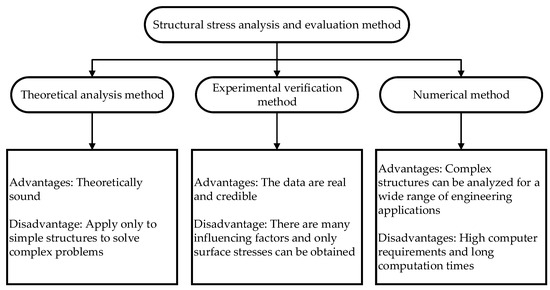
Figure 3.
Structural stress analysis method.
Theoretical analysis methods are often impractical due to the complexity of actual structures, and the structure must be simplified, requiring analysts to have a deep understanding of mechanical theory and mathematical solving skills to complete them. The experimental verification method has more advantages and persuasiveness, but it has high time and economic costs. At the same time, the representative demonstration of component experimental design is more complex, so it is not suitable for widespread application in the structural design process. The most effective, widespread, and economical method in engineering is numerical calculation, usually using sophisticated finite element analysis methods. Ma [33] and Liu [34] used the finite element method for a fatigue analysis of RPVs in marine environments. By simulating the stress state of the structure under various operating conditions using finite element analysis; accurately or conservatively calculating its temperature, deformation, and stress; and evaluating the various performance indicators of the reactor pressure vessel structure, the design cycle is greatly shortened, and research and development costs are reduced.
The specific steps are as follows:
- Create a finite element model. Subdivide the mesh, discretize the mathematical model into a finite number of elements, and discretize the load and support and apply them to the finite element mesh. The finer the grid subdivision, the smaller the error in the analysis results, but the more elements there are, the less time it takes to solve. It is therefore necessary to design the optimum mesh density in terms of both accuracy and time.
- Solve the finite element model. Apply the finite element algorithm to calculate the required stress and strain.
- Analyze the results. Establishing mathematical models during finite element analysis can result in modeling errors, creating finite element models can result in discrete errors, and solving processes can result in numerical errors. Taking into account these three types of errors, objectively analyze the calculation results.
- Combining the stress results under various working conditions in accordance with ASME specifications, complete the fatigue analysis of key parts of RPV according to the fatigue analysis process.
According to the provisions outlined in ASME BPVC—III, Division 1, NB, the specific fatigue analysis process is delineated in Figure 4 for instances wherein two or more stress cycles result in effective stress fluctuations.
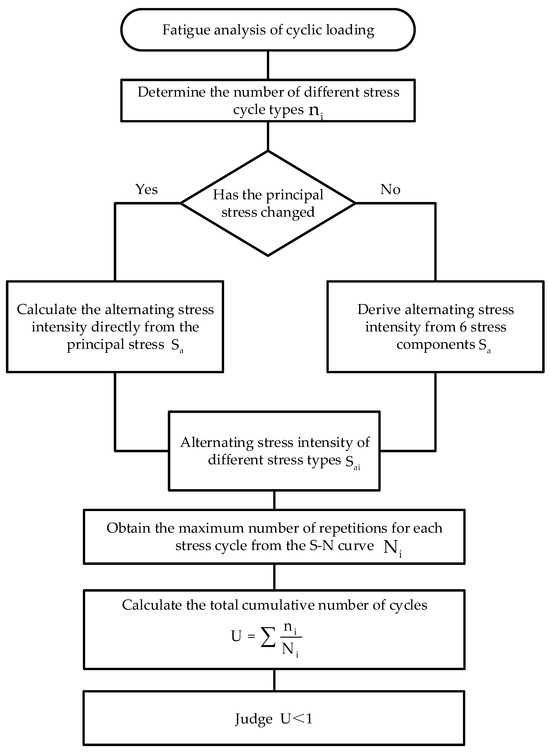
Figure 4.
The fatigue analysis process of cyclic loading in the ASME standard.
When the direction of principal stress remains unchanged, for the entire stress cycle, considering the three principal stress pairs at this point and their respective values over time, while also taking into account the overall and local structural discontinuities represented by , , and , respectively, determine the stress differences , , and over time, and determine the absolute value of the extreme value of each stress difference fluctuation range. , where the alternating stress intensity, , is the maximum value in .
When the direction of principal stresses changes, investigate the various values of the six stress components over time throughout the entire stress cycle. Choose a time point that corresponds to one of the extreme states of the cycle (either the algebraic maximum or minimum). At each time point during the cycle, subtract each of the six stress components from their respective counterparts to derive new stress components. Subsequently, at each time point, determine the principal stress based on the newly obtained six stress components. Finally, calculate the stress difference using the principal stress to obtain the maximum absolute value of any stress difference at any given time. The alternating stress intensity is half of this value.
This method is based on the time-domain method and requires the acquisition of time-history data of stress intensity during the operation of pressure vessels. Whether it is the ASME specification in the United States, the RCC-M specification in France, the JIS specification in Japan, etc., their fatigue analysis clearly requires that fatigue caused by transient loads be evaluated when performing a stress assessment. The methods and ideas used are consistent with the requirements in the ASME, and it is necessary to obtain the structural stress under different transient loads, but the combination in specific service condition analysis varies. Irregular wave action can cause stress cycles of different magnitudes in structures, making data statistics more complex. Using ASME methods to calculate fatigue under wave loading is not ideal for engineering applications.
4. Fatigue Damage Combination Analysis Method
Compared with conventional onshore nuclear power plants, pressurized equipment in floating nuclear power plants is not only subjected to low-frequency, high-stress internal pressure–heat loads, but also to high-frequency, low-stress wave loads. When high-frequency and low-amplitude loads are superimposed on low-frequency and high-amplitude loads, it usually promotes the cumulative damage of the material and accelerates its fatigue failure to a large extent, which is known as combined high and low cycle fatigue (CCF). Their fatigue damage analysis cannot only focus on fatigue damage under one load as in onshore nuclear power plants, but must also consider the influence between high and low cycle loads. The common method of simply adding the fatigue damage values under two environments cannot accurately give the total fatigue damage value. Yan [35] conducted fatigue tests on turbine blades under CCF loads and found that the combination of high cycle loads and low cycle loads significantly reduced the fatigue life of turbine blades. The fatigue life of alloys under composite loads at high temperatures showed greater dispersion. Zhao [36] et al. studied the effect of high and low cycle loading on the fatigue performance of TC11 titanium alloy, and the results show that CCF loading significantly reduced the fatigue life of TC11 titanium alloy.
To illustrate the variation in alternating stress intensity, the startup and shutdown process during the operation of a floating nuclear power plant is examined. As shown in Figure 5, the wave load cycle is considered as HCF (high cycle fatigue), and the thermal pressure load cycle is considered as LCF (low cycle fatigue).
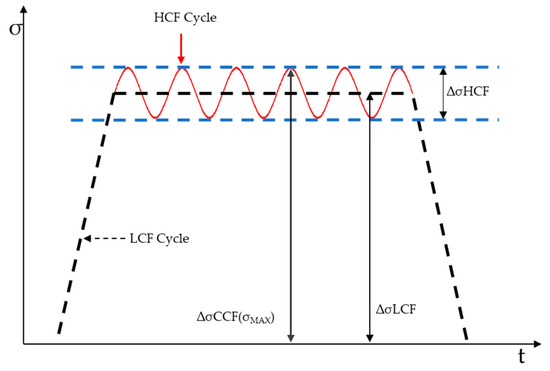
Figure 5.
Schematic diagram of CCF load process.
The formula for calculating cumulative damage under joint loads using the Miner’s rule is
where ni and Ni represent the number of cyclic loading cycles and the corresponding fatigue life at stress level σi, respectively.
For the CCF process, the cumulative damage during one loading is
where NHCF and NLCF are the fatigue life for HCF and LCF, respectively.
Under the operating environment of pressure equipment, Equation (20) can be rewritten as
where represents the fatigue damage caused by thermal pressure load during a single start-up and shutdown, and represents the fatigue damage caused by wave load during a single start-up and shutdown. This equation simply adds the fatigue damage values directly.
In the study by Hashin and Rotem [37], they proposed new equations to express fatigue damage under two-stage loading based on the concept of damage curves for fatigue life analysis with constant and continuously varying cyclic amplitude segments:
where Ne is the number of cycles corresponding to the fatigue limit.
By transforming Equation (23), we can obtain the following:
By analyzing the exponential part of Equation (24), the following equations can be obtained:
Equation (23) can be further expressed as follows:
According to the equivalent damage theory, the damage caused by LCF loading is equivalent to the cumulative damage deduced by HCF loading. As shown in Figure 6, according to the equivalent damage theory, the damage of LCF at point A is equivalent to the damage at point B in the CCF damage curve with a stress level of σCCF, where the equivalent number of loading cycles with a stress level of σCCF is m’’CCF; similarly, the damage of HCF at point C is equivalent to the damage at point B in the CCF damage curve with a stress level of σCCF.
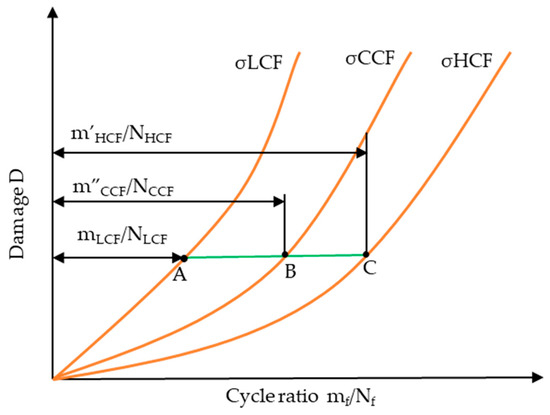
Figure 6.
Fatigue damage curves under CCF loading.
We can deduce that
Therefore, the relationship between and can be obtained as follows:
In the S-N curve of materials, there is a relationship between stress cycle S and fatigue life N, expressed as follows:
where K and m are the fatigue parameters.
Thus, by transforming Equation (29), the following equation can be obtained:
Since K and m are constants related to materials, logN is inversely proportional to logS. By combining Equations (28) and (30), the following formula can be obtained:
where ΔσLCF is the LCF stress range, and ΔσHCF is the HCF stress range.
Thus, by combining Equation (31) with Miner’s rule, the nonlinear cumulative damage model for CCF is proposed as follows:
In Liu and Wang’s study [28], they considered the interaction between loads and derived a new nonlinear formula for calculating cumulative fatigue damage during combined loading process based on Equation (32):
They used to represent the effect of load interaction on cumulative damage and experimentally demonstrated that the calculation results of Equation (33) are more refined. In the working environment of RPV, Equation (33) can be expressed as follows:
In RPV, ΔσLCF is the maximum value of alternating stress intensity under a hot pressure environment, and ΔσHCF is an irregular wave load with multiple peaks.
For a signal with a unit bandwidth, the power spectrum is the square of the root mean square amplitude spectrum. The power spectrum can be seen as the integral of the power spectral density in a certain frequency range, and the data of the root mean square amplitude spectrum can be obtained from the power spectral density function.
where is the amplitude spectrum, is the power spectral density function, and f1 and f2 are the starting and ending frequencies of the power spectral density function.
The process of wave action is often regarded as a zero mean Gaussian random process; therefore, is numerically equal to the zero-order spectral moment of the power spectral density function. Equation (34) above can be transformed into
Consider the root mean square amplitude ΔσHCF as input into Equation (34), which is changed to
where is the accumulated fatigue damage caused by thermal compression during a start–stop process, and is calculated using a spectral analysis to determine the fatigue damage values under different sea conditions.
In this way, when calculating the total fatigue damage, the fatigue damage and thermal pressure damage under each sea state are calculated individually, they are combined using the new method, and then the probability of occurrence of each sea state is considered. Finally, the total fatigue damage can be obtained by summing up the damage values of all combinations.
5. Simulation Verification of Damage Combination Method
5.1. Finite Element Model
All modeling, transfer function extraction, and transient calculations of the RPV were performed using ANSYS APDL finite element analysis software (v. 22.1). In accordance with the specification requirements, the stress analysis neglects the influence of the cladding. To ensure the reliability of the results, the finite element model is based on a quadrilateral structural mesh. The ship model consists of 1,337,459 cells, with the hull and containment model using SHELL cells and the RPV model and its support pads using SOLID186 cells, for a total of 214,265 cells. The RPV finite element model and hull position are shown schematically in Figure 7.
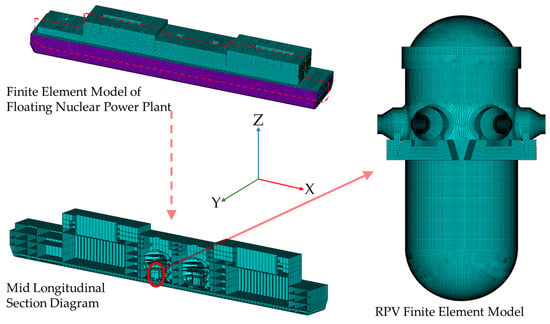
Figure 7.
RPV finite element model and position distribution.
The contact between the support pads and the containment is set as a BOND contact. The connection between the containment model and the support pads is coupled by degrees of freedom, which constrains the motion of the contact nodes and allows the containment to translate along the groove of the support pads, simulating the relative motion between the containment model and the support pads. The constraint settings for the contact position are shown in Figure 8.
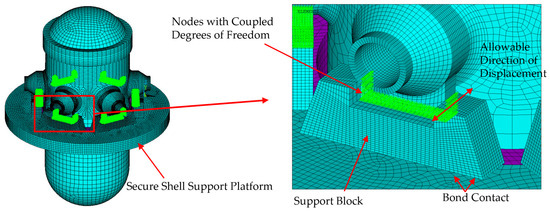
Figure 8.
Boundary conditions and contact types.
In order to minimize the computational time, the subsequent analyses and calculations were performed using only the RPV model and its support pads. The contact setup was consistent with the previously described configuration, and all six support pad constraints were set to a rigidly fixed state for all calculations.
Consider that the mesh size has a significant impact on the calculation results. In general, the finer the mesh, the higher the accuracy. However, the computational time required for very fine grid models is too long, leading to computational inefficiency. In order to ensure the realism and reliability of the results, both convergence and computational efficiency need to be considered to obtain a reasonable grid size. Models with different numbers of cells were set up, and different models were analyzed statically, as shown in Figure 9. The model with a grid size of 0.45 m and 214,265 cells is effective.
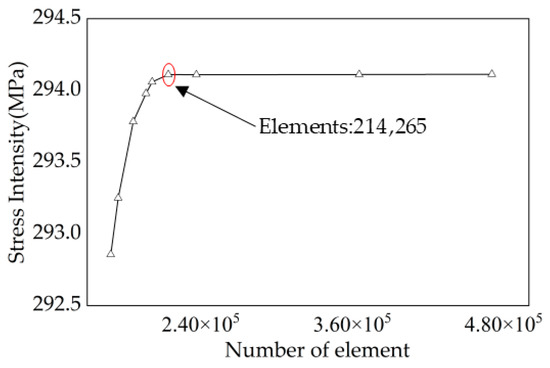
Figure 9.
Mesh size convergence analysis.
5.2. Power Spectral Density Under Wave Load
The stress response exhibited by the RPV is subject to variation under different short-term sea states. The wave dispersion diagram of the Yellow Bohai Sea region, where the floating nuclear power plant is located, is shown in Table 3 [33].

Table 3.
Wave scatter diagram.
Four combinations of operating conditions that appeared in the wave propagation diagram were selected, namely Hs = 2 m, Tp = 4 s; Hs = 3 m, Tp = 6 s; Hs = 3.5 m, Tp = 7 s; and Hs = 4 m, Tp = 8 s. Subsequent calculations and validations were performed for these four working conditions, with different wave heights and periods.
The water depth at the location where the floating nuclear power plant operates is shallow, and the wave dispersion diagram is the joint distribution of effective wave height and spectral peak period. The wave loads in different wave directions were predicted using the improved JONSWAP spectrum. The spectral shape of the JONSWAP spectrum is shown in Figure 10. The improved JONSWAP spectrum is expressed as follows:
where S(ω) represents the wave spectrum; g represents gravitational acceleration; ω represents wave frequency; ωp represents peak frequency; γ is the peak enhancement factor, typically valued at 3.3; and α is an empirical coefficient related to the wind speed and the spectral peak frequency of the wave spectrum, which can be estimated from the significant wave height and peak period, . When ω ≤ ωp, σ = 0.07, and when ω > ωp, σ = 0.09.
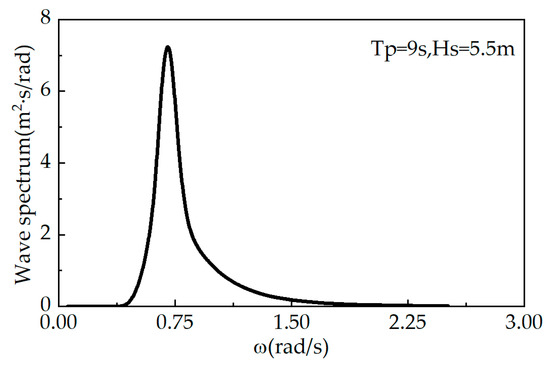
Figure 10.
Schematic diagram of wave spectrum.
The calculation formula for the power spectrum density function of the alternating stress intensity under wave action is shown in Equation (39), and the power spectrum of the alternating stress intensity at some nodes is shown in Figure 11 and Figure 12.
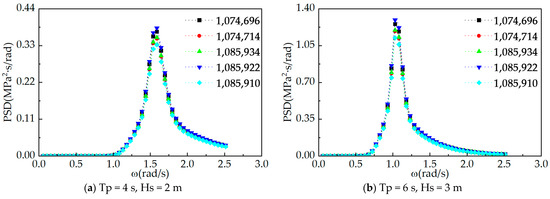
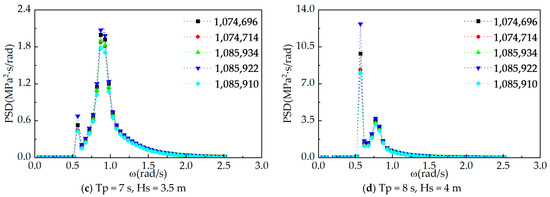
Figure 11.
PSD of some nodes in top area under different operating conditions.
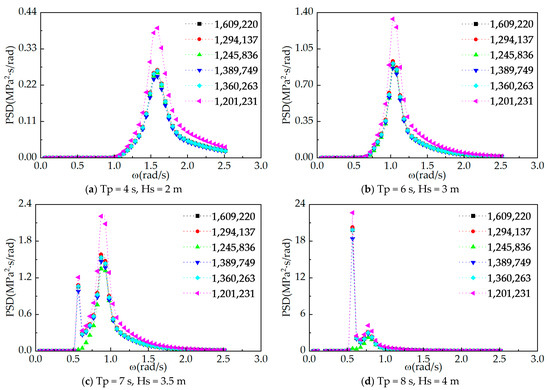
Figure 12.
PSD of some nodes in RPV tank area under different operating conditions.
5.3. Stress Time History Under the Combined Action of Heat and Pressure
When using the design fatigue curve to evaluate the fatigue of the inner and outer walls of the RPV, it is necessary to first calculate the equivalent amplitude of the alternating stress based on the values of the alternating stress components obtained from the transient analysis; then, based on the obtained amplitude of the alternating stress, it is necessary to search for the corresponding allowable number of cycles. The calculation was performed in ANSYS. Taking the example of a nuclear power plant with significant load fluctuations in terms of temperature rise and fall, a typical start–run–stop operating condition of a floating nuclear power plant was selected for the calculation. The change curves of internal pressure and temperature under a start–run–stop operating condition are shown in Figure 13 and Figure 14.
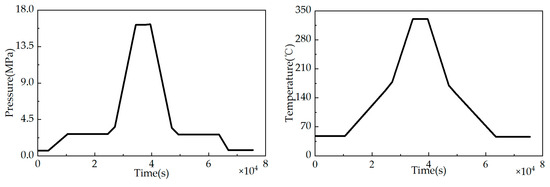
Figure 13.
Time history of pressure and temperature fluctuations.
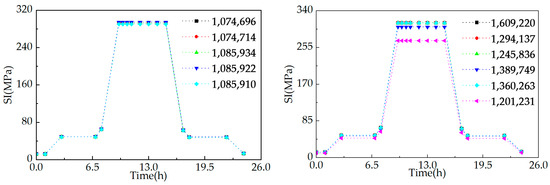
Figure 14.
Time history of alternating stress intensity at verification nodes.
5.4. Fatigue Damage Under Damage Combination Method
The fatigue damage under wave loading is calculated by the spectral analysis method and the corresponding zero-order spectral moment; the fatigue damage under thermal pressure loading is obtained by the typical transient method; and the total fatigue damage is calculated by the newly proposed damage combination method. The specific results are shown in Table 4, Table 5, Table 6 and Table 7.

Table 4.
Fatigue damage values of combined methods (Tp = 4 s and Hs = 2 m).

Table 5.
Fatigue damage values of combined methods (Tp = 6 s and Hs = 3 m).

Table 6.
Fatigue damage values of combination method (Tp = 7 s, Hs = 3.5 m).

Table 7.
Fatigue damage values of combined methods (Tp = 8 s and Hs = 4 m).
5.5. Error Analysis
In order to verify the accuracy of the combined method, time-domain simulation was used to obtain accurate stress response time history data. From this, standard fatigue damage values were calculated and compared with the results of the combined method. In view of the long complete start–stop cycle, it is not feasible in practice to simulate thermal pressure and wave action directly and simultaneously. Therefore, the two loading effects were simulated separately, and then the resulting stress response data were linearly superimposed as an approximation of the true value. The simulation of thermal pressure loading was conducted in Ansys APDL, with data points from key stages of temperature rise and fall selected for calculation. Boundary conditions were set according to the parameters outlined in Section 5.1. Resultantly, the stress response under thermal pressure loading throughout the entire start–stop process was obtained by linearly interpolating the results at various time points.
The wave loading process is facilitated by the Transient Structural block in Workbench. Initially, the time-range data of acceleration response and the time-range data of longitudinal rocking, transverse rocking, and bow rocking under different wave height cycles were obtained in Hydrodynamic Response. Subsequently, the time-range data of acceleration response in six directions under the influence of attitude change were solved by using the coordinate transformation matrix. In the Transient Structural block, the RPV and the six support pads model were utilized to simulate the calculation in order to reduce the amount of calculation, and the connection settings were the same as those described in Section 5.1. The acceleration response time series data in six directions were utilized as inputs, and the six support pads were set to be rigidly fixed during the calculation. The simulation time was set to 1200 s, and the stress response time data obtained were spliced together to expand them into the time data of a complete startup and shutdown process. The time-domain simulation results under wave loading are shown in Figure 15.
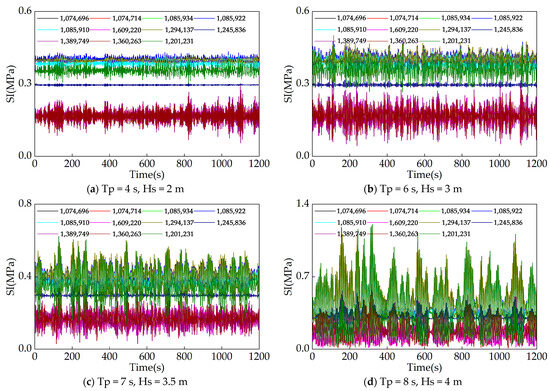
Figure 15.
Stress response data under wave loading (1200 s).
Subsequent to the acquisition of stress response time data under varying loads, the stress response data from disparate load sources at the same moment were synthesized linearly to obtain the complete stress time response data under the common action of different loads. These data were then utilized to calculate the fatigue damage, which is regarded as the standard fatigue damage and is recorded as DTIME. The damage results obtained using the method described in the text are denoted as DNON. The damage results under different methods are shown in Figure 16.
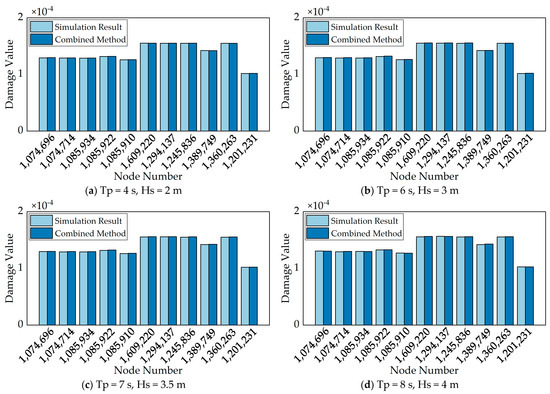
Figure 16.
Comparison of damage results under different methods.
The Error Evaluation Index is calculated as follows:
The error indices for the four operating conditions are shown in Table 8, Table 9, Table 10 and Table 11 below.

Table 8.
Fatigue damage error of combination method (Tp = 4 s, Hs = 2 m).

Table 9.
Fatigue damage error of combination method (Tp = 6 s, Hs = 3 m).

Table 10.
Fatigue damage error of combination method (Tp = 7 s, Hs = 3.5 m).

Table 11.
Fatigue damage error of combination method (Tp = 8 s, Hs = 4 m).
When compared with the damage results under time-domain simulation, the newly proposed combination method has high accuracy, and the relative error is kept within ±1%. At the same time, most of the results are slightly higher than the real results, which means that the combination method is relatively conservative and does not underestimate the fatigue damage results, which is helpful for engineering applications.
6. Conclusions
In this study, fatigue damage calculations were performed for the start–stop condition of pressure equipment of a floating nuclear power plant during operation. In contrast to the traditional damage superposition method, this paper adopted a novel damage combination approach. In the marine environment, a spectral analysis method was used to calculate the fatigue damage, while in the hot pressure environment, the fatigue damage was calculated by time-domain simulation. Finally, the accuracy of the damage combination method was verified by a complete time-domain simulation covering the coupling process between wave and hot pressure environments, and the following conclusions can be drawn:
- (1)
- From the complete time-domain analysis of the RPV under different operating conditions, it can be seen that there is an influence between wave loads and thermal pressure loads, and the calculation of fatigue damage needs to take into account the interaction between the two. The simple use of Miner’s criterion for calculating the fatigue damage of the structure will result in a large error.
- (2)
- The results of the damage calculations using the combined method are close to those of the time-domain simulation calculations; the accuracy of the combined method does not change with the wave environment, the error is always within ±1%, and the results of the calculations are slightly more conservative without underestimating the damage. The reason for this may be that the spectral analysis method used in the wave damage calculations introduces errors, and the results of the fatigue damage calculations using the NB method are conservative, so the recalculation results using the combined method also become conservative.
- (3)
- The novel fatigue analysis method integrates the expeditious benefits of spectral analysis methods with the precision of time-domain simulation calculations. This method does not necessitate the incorporation of additional parameters, is straightforward to operate, and yields precise results. In comparison with the conventional method, which is time-consuming and requires extensive simulation time to model the nonlinear process of wave action, this method can substantially reduce the computation time, a significant advantage in the design stage of engineering applications.
- (4)
- In addition, this combined approach to calculate fatigue damage under different loads can also be used to calculate structural damage when other marine structures are loaded in environments similar to RPV.
Author Contributions
Data curation, F.M.; methodology, K.S., F.M. and J.Y.; project administration, M.Z.; resources, J.Y.; software, F.M.; supervision, M.Z.; validation, K.S. and J.Y.; writing—original draft, K.S.; writing—review and editing, M.Z. All authors have read and agreed to the published version of the manuscript.
Funding
This work was sponsored and supported by the Leading Innovation Project of China National Nuclear Corporation (KY90200220002).
Institutional Review Board Statement
Not applicable.
Informed Consent Statement
Not applicable.
Data Availability Statement
All data are contained within the article.
Conflicts of Interest
The authors declare no conflicts of interest.
References
- Xu, X.; Xie, X.; Liang, Q.; Peng, C. Probabilistic Fracture Mechanics Analysis of Heat Transfer Tube in Floating Nuclear Power Plant under Multiple Failure Mechanisms. Nucl. Eng. Des. 2023, 406, 112242. [Google Scholar] [CrossRef]
- Ma, F.; Zhang, M.; Wang, D.; Zhang, K.; Qu, X. A Reconstruction Method of Stress Fields, Bending Moments and Wave Parameters for Floating Nuclear Power Plants through Regular Wave Identification. Ocean Eng. 2024, 310, 118703. [Google Scholar] [CrossRef]
- Zhang, R.; Zhang, Y.; Zhu, L.; Huang, J. Fatigue Failure Mechanism of Coal Mining Machine Cutting Gearbox Housing. J. Braz. Soc. Mech. Sci. Eng. 2020, 42, 273. [Google Scholar] [CrossRef]
- Ma, X.; Yang, F.; Li, J.; Xue, Y.; Guan, Z. Fatigue Life Assessment Method of In-Service Mechanical Structure. Adv. Mech. Eng. 2021, 13, 1687814021996524. [Google Scholar] [CrossRef]
- Li, H.; Liu, Y.; He, X.; Yin, W. New Nonlinear Cumulative Fatigue Damage Model Based on Ecological Quality Dissipation of Materials. Int. J. Aerosp. Eng. 2021, 2021, 5555812. [Google Scholar] [CrossRef]
- Amarir, I.; Mounir, H.; El Marjani, A. Durability Analysis of Welded Rectangular Profiles Under Damped Loads for Automotive Utilization. In International Conference on Advanced Intelligent Systems for Sustainable Development; Kacprzyk, J., Balas, V.E., Ezziyyani, M., Eds.; Springer International Publishing: Cham, Switzerland, 2022; Volume 1418, pp. 896–919. [Google Scholar]
- ASME. BPVC Section III: Rules for Construction of Nuclear Facility Components, Division 1, Subsection NB: Class 1 Components, 2023rd ed.; The American Society of Mechanical Engineers: New York, NY, USA, 2023. [Google Scholar]
- Parunov, J. ISSC 2006—16th International Ship and Offshore Structures Congress, 20–25 August 2006, University of Southempton, UK. Brodogradnja 2006, 57, 271–273. [Google Scholar]
- Lotsberg, I. Background for Revision of DNV-RP-C203 Fatigue Analysis of Offshore Steel Structure. In Proceedings of the 24th International Conference on Offshore Mechanics and Arctic Engineering: Volume 3, Halkidiki, Greece, 12–17 June 2005; ASMEDC: Halkidiki, Greece, 2005; pp. 297–306. [Google Scholar]
- Huang, W.; Moan, T. Fatigue Under Combined High and Low Frequency Loads. In Proceedings of the Volume 3: Safety and Reliability; Materials Technology; Douglas Faulkner Symposium on Reliability and Ultimate Strength of Marine Structures, Hamburg, Germany, 4–9 June 2006; ASMEDC: Hamburg, Germany, 2006; pp. 149–156. [Google Scholar]
- Van Der Tempel, J.; Diepeveen, N.F.B.; Salzmann, D.J.C.; De Vries, W.E. Design of Support Structures for Offshore Wind Turbines. In WIT Transactions on State of the Art in Science and Engineering; WIT Press: Southampton, UK, 2010; Volume 1, pp. 559–591. ISBN 978-1-84564-205-1. [Google Scholar]
- Han, C.; Ma, Y.; Xing, J.; Zhang, Z.; Liu, K. An Equivalent Pseudo Spectral Method for Estimating Fatigue Damage under Two Gaussian Random Loads. Ocean Eng. 2020, 201, 107072. [Google Scholar] [CrossRef]
- Mršnik, M.; Slavič, J.; Boltežar, M. Frequency-Domain Methods for a Vibration-Fatigue-Life Estimation—Application to Real Data. Int. J. Fatigue 2013, 47, 8–17. [Google Scholar] [CrossRef]
- Tovo, R. Cycle Distribution and Fatigue Damage under Broad-Band Random Loading. Int. J. Fatigue 2002, 24, 1137–1147. [Google Scholar] [CrossRef]
- Liu, Y. Research on Fatigue Life Prediction Method for Mechanical Structures Based on Nonlinear Cumulative Damage Theory. Master’s Thesis, Dalian Jiaotong University, Dalian, China, 2023. [Google Scholar]
- Corten, H.T. Testing Methods for Determination of Fracture Toughness of Metals. Int. J. Press. Vessel. Pip. 1973, 1, 299–316. [Google Scholar] [CrossRef][Green Version]
- Marco, S.M.; Starkey, W.L. A Concept of Fatigue Damage. Trans. Am. Soc. Mech. Eng. 2022, 76, 627–632. [Google Scholar] [CrossRef]
- Manson, S.S.; Halford, G.R. Practical Implementation of the Double Linear Damage Rule and Damage Curve Approach for Treating Cumulative Fatigue Damage. Int. J. Fract. 1981, 17, 169–192. [Google Scholar] [CrossRef]
- Duyi, Y.; Zhenlin, W. A New Approach to Low-Cycle Fatigue Damage Based on Exhaustion of Static Toughness and Dissipation of Cyclic Plastic Strain Energy during Fatigue. Int. J. Fatigue 2001, 23, 679–687. [Google Scholar] [CrossRef]
- Niu, X.D.; Li, G.X.; Hao, L. Hardening Law and Fatigue Damage of a Cyclic Hardening Metal. Eng. Fract. Mech. 1987, 26, 163–170. [Google Scholar] [CrossRef]
- Kachanov, M. Elastic Solids with Many Cracks and Related Problems. In Advances in Applied Mechanics; Elsevier: Amsterdam, The Netherlands, 1993; Volume 30, pp. 259–445. [Google Scholar]
- Lemaitre, J.; Plumtree, A. Application of Damage Concepts to Predict Creep-Fatigue Failures. J. Eng. Mater. Technol. 1979, 101, 284–292. [Google Scholar] [CrossRef]
- Giancane, S.; Nobile, R.; Panella, F.W. Fatigue Life Prediction of Notched Components Based on a New Nonlinear Continuum Damage Mechanics Model. Procedia Eng. 2010, 2, 1317–1325. [Google Scholar] [CrossRef]
- Xu, Y.L.; Chen, Z.W.; Xia, Y. Fatigue Assessment of Multi-Loading Suspension Bridges Using Continuum Damage Model. Int. J. Fatigue 2012, 40, 27–35. [Google Scholar] [CrossRef]
- Chen, H.; Yang, F.; Wu, Z.; Yang, B.; Huo, J. A Nonlinear Fatigue Damage Accumulation Model under Variable Amplitude Loading Considering the Loading Sequence Effect. Int. J. Fatigue 2023, 177, 107945. [Google Scholar] [CrossRef]
- Gao, K.; Liu, G.; Tang, W. An Improved Manson-Halford Model for Multi-Level Nonlinear Fatigue Life Prediction. Int. J. Fatigue 2021, 151, 106393. [Google Scholar] [CrossRef]
- Wang, W.; Li, J.; Pan, J.; Chen, H.; Chen, W. An Improved Nonlinear Cumulative Damage Model Considering the Influence of Load Sequence and Its Experimental Verification. Appl. Sci. 2021, 11, 6944. [Google Scholar] [CrossRef]
- Liu, P.; Wang, X.; Shen, Q.; Guo, H.; Wang, Y.; Sun, Y. A Nonlinear Cumulative Fatigue Damage Life Prediction Model under Combined Cycle Fatigue Loading Considering Load Interaction. Int. J. Fatigue 2023, 177, 107972. [Google Scholar] [CrossRef]
- Sun, B. A Continuum Model for Damage Evolution Simulation of the High Strength Bridge Wires Due to Corrosion Fatigue. J. Constr. Steel Res. 2018, 146, 76–83. [Google Scholar] [CrossRef]
- Wu, B.; Lu, W.; Li, X.; Kou, Y.; Wei, Q.; Guo, X. A New Frequency-Domain Method for Fatigue Prediction of Offshore Structures under Wideband Random Loadings. Ocean Eng. 2023, 281, 114812. [Google Scholar] [CrossRef]
- Benasciutti, D.; Tovo, R. Spectral Methods for Lifetime Prediction under Wide-Band Stationary Random Processes. Int. J. Fatigue 2005, 27, 867–877. [Google Scholar] [CrossRef]
- Peng, M.; Liu, M.; Cong, Y.; Gu, S. A Simplified Time-Frequency Fatigue Analysis Method Considering the Response Characteristics of Jacket-Type Offshore Wind Turbine. Ocean Eng. 2024, 302, 117751. [Google Scholar] [CrossRef]
- Ma, F.; Li, H.; Zhang, M.; Qu, X. A Quasi Time-Domain Method for Fatigue Analysis of Reactor Pressure Vessels in Floating Nuclear Power Plants in Marine Environments. J. Mar. Sci. Eng. 2024, 12, 2085. [Google Scholar] [CrossRef]
- Liu, G.; Zhu, H.; Zhang, Z.; Zhang, G.; Cao, G.; Tan, L.; Qi, J. Research on Fatigue Analysis Method of Nuclear Equipment Under Ocean Conditions. In Proceedings of the Volume 10: Advanced Methods of Manufacturing for Nuclear Reactors and Components, Virtual, Online. 8–12 August 2022; American Society of Mechanical Engineers: New York, NY, USA, 2022; p. V010T10A035. [Google Scholar]
- Yan, X.-J.; Sun, R.-J.; Deng, Y.; Liu, Z.-N.; Nie, J.-X. Experimental Study on Fatigue Curve Law of Turbine Blade under Combined High and Low Cycle Loading. Hangkong Dongli Xuebao/J. Aerosp. Power 2011, 26, 1824–1829. [Google Scholar]
- Zhao, Z.; Lu, K.; Wang, L.; Liu, L.; Chen, W. Prediction of Combined Cycle Fatigue Life of TC11 Alloy Based on Modified Nonlinear Cumulative Damage Model. Chin. J. Aeronaut. 2021, 34, 73–84. [Google Scholar] [CrossRef]
- Hashin, Z.; Rotem, A. A Cumulative Damage Theory of Fatigue Failure. Mater. Sci. Eng. 1978, 34, 147–160. [Google Scholar] [CrossRef]
Disclaimer/Publisher’s Note: The statements, opinions and data contained in all publications are solely those of the individual author(s) and contributor(s) and not of MDPI and/or the editor(s). MDPI and/or the editor(s) disclaim responsibility for any injury to people or property resulting from any ideas, methods, instructions or products referred to in the content. |
© 2025 by the authors. Licensee MDPI, Basel, Switzerland. This article is an open access article distributed under the terms and conditions of the Creative Commons Attribution (CC BY) license (https://creativecommons.org/licenses/by/4.0/).