Article

Geospatial Analysis of Shoreline Shifts in the Indus Delta Using DSAS and Satellite Data

1
Institute of Port, Coastal, and Offshore Engineering, Ocean College, Zhejiang University, Hangzhou 310058, China
2
National Institute of Oceanography, Karachi 75600, Pakistan
3
Department of Mathematics, Computer Science and Engineering, University of Quebec at Rimouski, Rimouski, QC G5L 3A1, Canada
*
Author to whom correspondence should be addressed.
J. Mar. Sci. Eng. 2025, 13(10), 1986; https://doi.org/10.3390/jmse13101986
Submission received: 9 September 2025 / Revised: 4 October 2025 / Accepted: 13 October 2025 / Published: 16 October 2025
(This article belongs to the Section Coastal Engineering)

Abstract

Pakistan’s coastline encompasses the Indus Delta, a critical ecosystem that sustains biodiversity, fisheries, and local livelihoods, yet it is increasingly threatened by both natural and anthropogenic pressures. This study quantifies multi-decadal shoreline changes in the Indus Delta and examines how changes in climatic factors (precipitation and wind) affect these changes, using the Digital Shoreline Analysis System (DSAS v5.1) and multi-temporal Landsat imagery (TM, ETM+, OLI) to quantify long-term shoreline dynamics from 1990 to 2020 (30-year period). Key metrics, including End Point Rate (EPR), Net Shoreline Movement (NSM), and Linear Regression Rate (LRR), indicated an overall retreat, with a mean NSM of −1810 m and a mean LRR of −173 m·year across the 30-year period. Shoreline change rates exhibited a significant relationship with climatic variables, particularly wind speed and precipitation, with dynamics shifting from erosion-dominated to localized accretion in areas where mangrove rehabilitation programs were implemented after 2005. Seasonal variability further influenced shoreline behavior: low-rainfall years intensified erosion due to reduced sediment availability, while high-rainfall years enhanced accretion through increased sediment input. These findings underscore the urgent need for integrated coastal management strategies, including mangrove conservation, sustainable sediment management, and climate-adaptive planning, to strengthen the resilience of the Indus Delta.

1. Introduction

Shorelines are dynamic interfaces between terrestrial and marine environments, functioning as critical zones that sustain coastal ecosystems, maintain biodiversity, and provide essential ecological and economic services to human societies. These ever-evolving zones, actively shaped by natural forces and human activity, have become increasingly susceptible to both environmental and anthropogenic stresses. Shoreline degradation is primarily caused by disruptions to natural processes, such as decreased sediment flow, dam construction, climate change, and the overexploitation of coastal resources [1,2]. River deltas, in particular, are highly susceptible to these forces, and the Indus Delta is an exemplary case of such vulnerability. The world’s most vulnerable deltaic systems, the Indus Delta, which serves as a quintessential example of such vulnerability [3].
The Indus Delta faces a series of challenges, such as reduced freshwater inflow as a result of damming and large-scale irrigation, which disrupt sediment transportation, leading to erosion, coastal retreat, and displacement of people [4]. Mangrove degradation, caused by increased salinity and reduced freshwater flow [5], leads to water salinization, which impacts agriculture. Meanwhile, a rise in sea levels and shifts in climatic conditions make mangroves more vulnerable [2]. As a result, the Indus Delta is highly susceptible to erosion and environmental degradation.
Shoreline dynamics, particularly in river deltas, are inherently complex, shaped by a combination of morphological, hydrological, climatological, geological, and anthropogenic factors. These factors interact continuously through tidal cycles, waves, and currents, leading to ongoing changes in shoreline morphology and position [1]. The erosive and constructive nature of water movement creates a dynamic zone that is both fragile and vital for maintaining the ecological integrity of coastal regions. Consequently, the global importance of shoreline research and management is increasing, as understanding shoreline change drivers is critical for preserving these essential ecosystems and mitigating the impacts of climate change on coastal communities.
Erosion is considered one of the most significant risks threatening coastal areas. Monitoring changes in coastal areas helps identify the spatial distribution of erosion risks and predict their future evolution [5]. Recent satellite-based shoreline studies demonstrate that coasts are highly dynamic, with significant erosion and accretion patterns observed across different regions. For example, shoreline variability has been reported along the Indus Delta [6]. At the global scale, coastal zones remain critical as they host a substantial share of the human population, with hundreds of millions of people projected to be increasingly exposed to sea-level rise and related hazards [7,8]. In response to growing concerns over habitat loss, shoreline retreat, and the vulnerability of deltaic ecosystems to both human activities and climate change, this study aims to understand and address these critical challenges.
Recent advancements in shoreline monitoring have significantly improved our ability to analyze coastal changes. Modern studies increasingly combine multi-temporal satellite data (e.g., Landsat, Sentinel-2) with advanced geospatial tools like the Digital Shoreline Analysis System (DSAS) to quantify erosion and accretion patterns [1,9]. While machine learning approaches are gaining popularity for shoreline detection [10], traditional water indices like NDWI and MNDWI remain widely used, particularly in turbid deltaic environments where vegetation interference is common [11,12].
While previous studies have assessed shoreline changes in the Indus Delta using DSAS metrics (EPR, NSM, LRR), they often lacked integration with climatic and ecological drivers [6]. To address this gap, the present study advances the field in several ways. It combines shoreline change analysis with seasonal climatic variables (rainfall, wind speed), enabling a cause-and-effect interpretation of erosion and accretion patterns over three decades. It quantifies the impact of post-2005 mangrove reforestation on shoreline stabilization, offering rare empirical evidence of ecological restoration benefits. It employs both Normalized Difference Water Index (NDWI) and Modified Normalized Difference Water Index (MNDWI) to enhance shoreline extraction accuracy in a delta affected by high turbidity and vegetation interference. The study expands the spatial coverage, identifying localized erosion and accretion hot spots, including previously unreported zones. Finally, the findings are directly translated into actionable, site-specific strategies for sediment management, mangrove restoration, and climate adaptation, reinforcing their relevance for integrated coastal management in the Indus Delta.
To analyze shoreline changes from 1990 to 2020, the study employs metrics including the End Point Rate (EPR), Net Shoreline Movement (NSM), and Linear Regression Rate (LRR). Focusing on the Indus Delta’s vulnerability to erosion and ecological degradation, this paper examines shoreline dynamics over the past three decades to support coastal management efforts. It investigates both natural and human-driven factors influencing shoreline changes and provides policy recommendations for erosion control, mangrove conservation, and agricultural land preservation. The findings aim to assist local authorities and communities in strengthening coastal defenses and adapting to climate change. Additionally, the study helps bridge knowledge gaps by providing essential data for sustainable development and disaster preparedness.
Therefore, this study aims to quantify the multi-decadal rates of shoreline change along the Indus Delta from 1990 to 2020 by applying the Digital Shoreline Analysis System (DSAS) to derive robust metrics of erosion and accretion (End Point Rate, Net Shoreline Movement, and Linear Regression Rate). To evaluate the statistical correlation between these shoreline change rates and key climatic variables (wind speed and precipitation) in order to determine the strength, direction, and significance of their relationship as direct drivers of coastal dynamics.
By addressing these objectives, the study documents three decades of shoreline evolution and quantifies the influential role of climatic drivers on erosion and accretion patterns. The findings provide a critical evidence base for managing shoreline dynamics, prioritizing vulnerable sectors for intervention, and informing climate-adaptive coastal planning. This work is intended to support policymakers in strengthening the resilience of deltaic communities against erosion and climate-driven risks.
The remaining sections of the article are as follows: Section 2 provides an overview of the study area, including its geographic and occupational context. Section 3 describes the data collection process and methodology, focusing on the satellite data and shoreline extraction methods. Section 4 presents the results, including analyses based on NSM, EPR, and LRR. Section 5 discusses the findings, while Section 6 concludes with recommendations and suggestions for future research.

2. Study Area

The study area of the Indus Delta, situated in the southern side of Sindh, Pakistan, specifically focuses on its western sector, because it contains the most active distributaries (e.g., Wari, Khuddi, and Hajamro creeks) and is the primary zone for recent mangrove rehabilitation efforts [1,2], providing a clear signal of the interplay between diminished river discharge, wave-tidal forces, and conservation interventions. Which lies along the northern coastline of the Arabian Sea. It extends from 24.33° N, 67.29° E to 23.69° N, 68.00° E, based on geographical coordinates in decimal degrees (WGS84). The geographical location of the study area is presented in Figure 1. The map shows the Indus River Delta shoreline, with inset maps providing regional context within Sindh province and Pakistan. As one of the largest deltaic systems in the world, it supports a rich biodiversity that includes mangrove forests, various fish species, and diverse aquatic and terrestrial ecosystems [3]. The Indus Delta is one of the largest deltaic systems in South Asia, located along the Arabian Sea coast of Sindh, Pakistan. The Indus is running for more than 3,200 km across China, India, Afghanistan, and Pakistan [13,14]. It contains one of the largest contiguous mangrove forests in the region, spanning ~600,000 ha, which provides critical habitat for fisheries, migratory birds, and coastal biodiversity [15]. Tidal processes dominate the delta, with a high tidal range of up to 4.0 m during spring tides specifically recorded in 1986, 1990, 1993, and 1999 that inundate the creek banks, a phenomenon significantly amplified by the winds of the southwest monsoon [16]. As the river approaches the Arabian Sea, it diverges into numerous distributaries, creeks, and channels, forming a complex, dynamic network of waterways that supports a variety of ecosystems [17].
The Indus Delta’s shoreline dynamics are governed by a complex interplay of natural and anthropogenic forces, yet existing studies often overlook critical oceanographic and environmental parameters that underpin these changes. Tidal regimes, wave climate, and coastal vulnerability are pivotal drivers of erosion and accretion, yet their systematic integration into shoreline change analyses remains sparse. For instance, tidal ranges in the Indus Delta are flushed daily by tides ranging up to 3 m [16]. Coastal vulnerability indices (CVI) for the region highlight the delta’s low-lying topography and sediment compaction as key risk factors [6], compounded by reduced sediment flux from upstream dams [3].
Previous remote sensing studies [11,18] emphasize the need to contextualize shoreline change metrics (EPR, NSM, LRR) within local hydrodynamic settings [12,19] and note that NDWI/MNDWI-based shoreline extraction requires tidal-stage harmonization to avoid false positives from submerged features. The absence of such adjustments in deltaic studies risks misrepresenting accretion/erosion trends [1].
Despite all this adversity, the Indus Delta remains an ecologically significant region with a rich biodiversity of flora and fauna, as well as human livelihoods dependent on its resources for fishing, agriculture, and other activities. The Indus Delta is a significant site to investigate the impacts of climate change, human activities, and coastal management practices. Hence, the Indus Delta landscape is not only an ecologically significant region but also a region increasingly subjected to environmental issues of natural and human-induced origin.

3. Data and Methodology

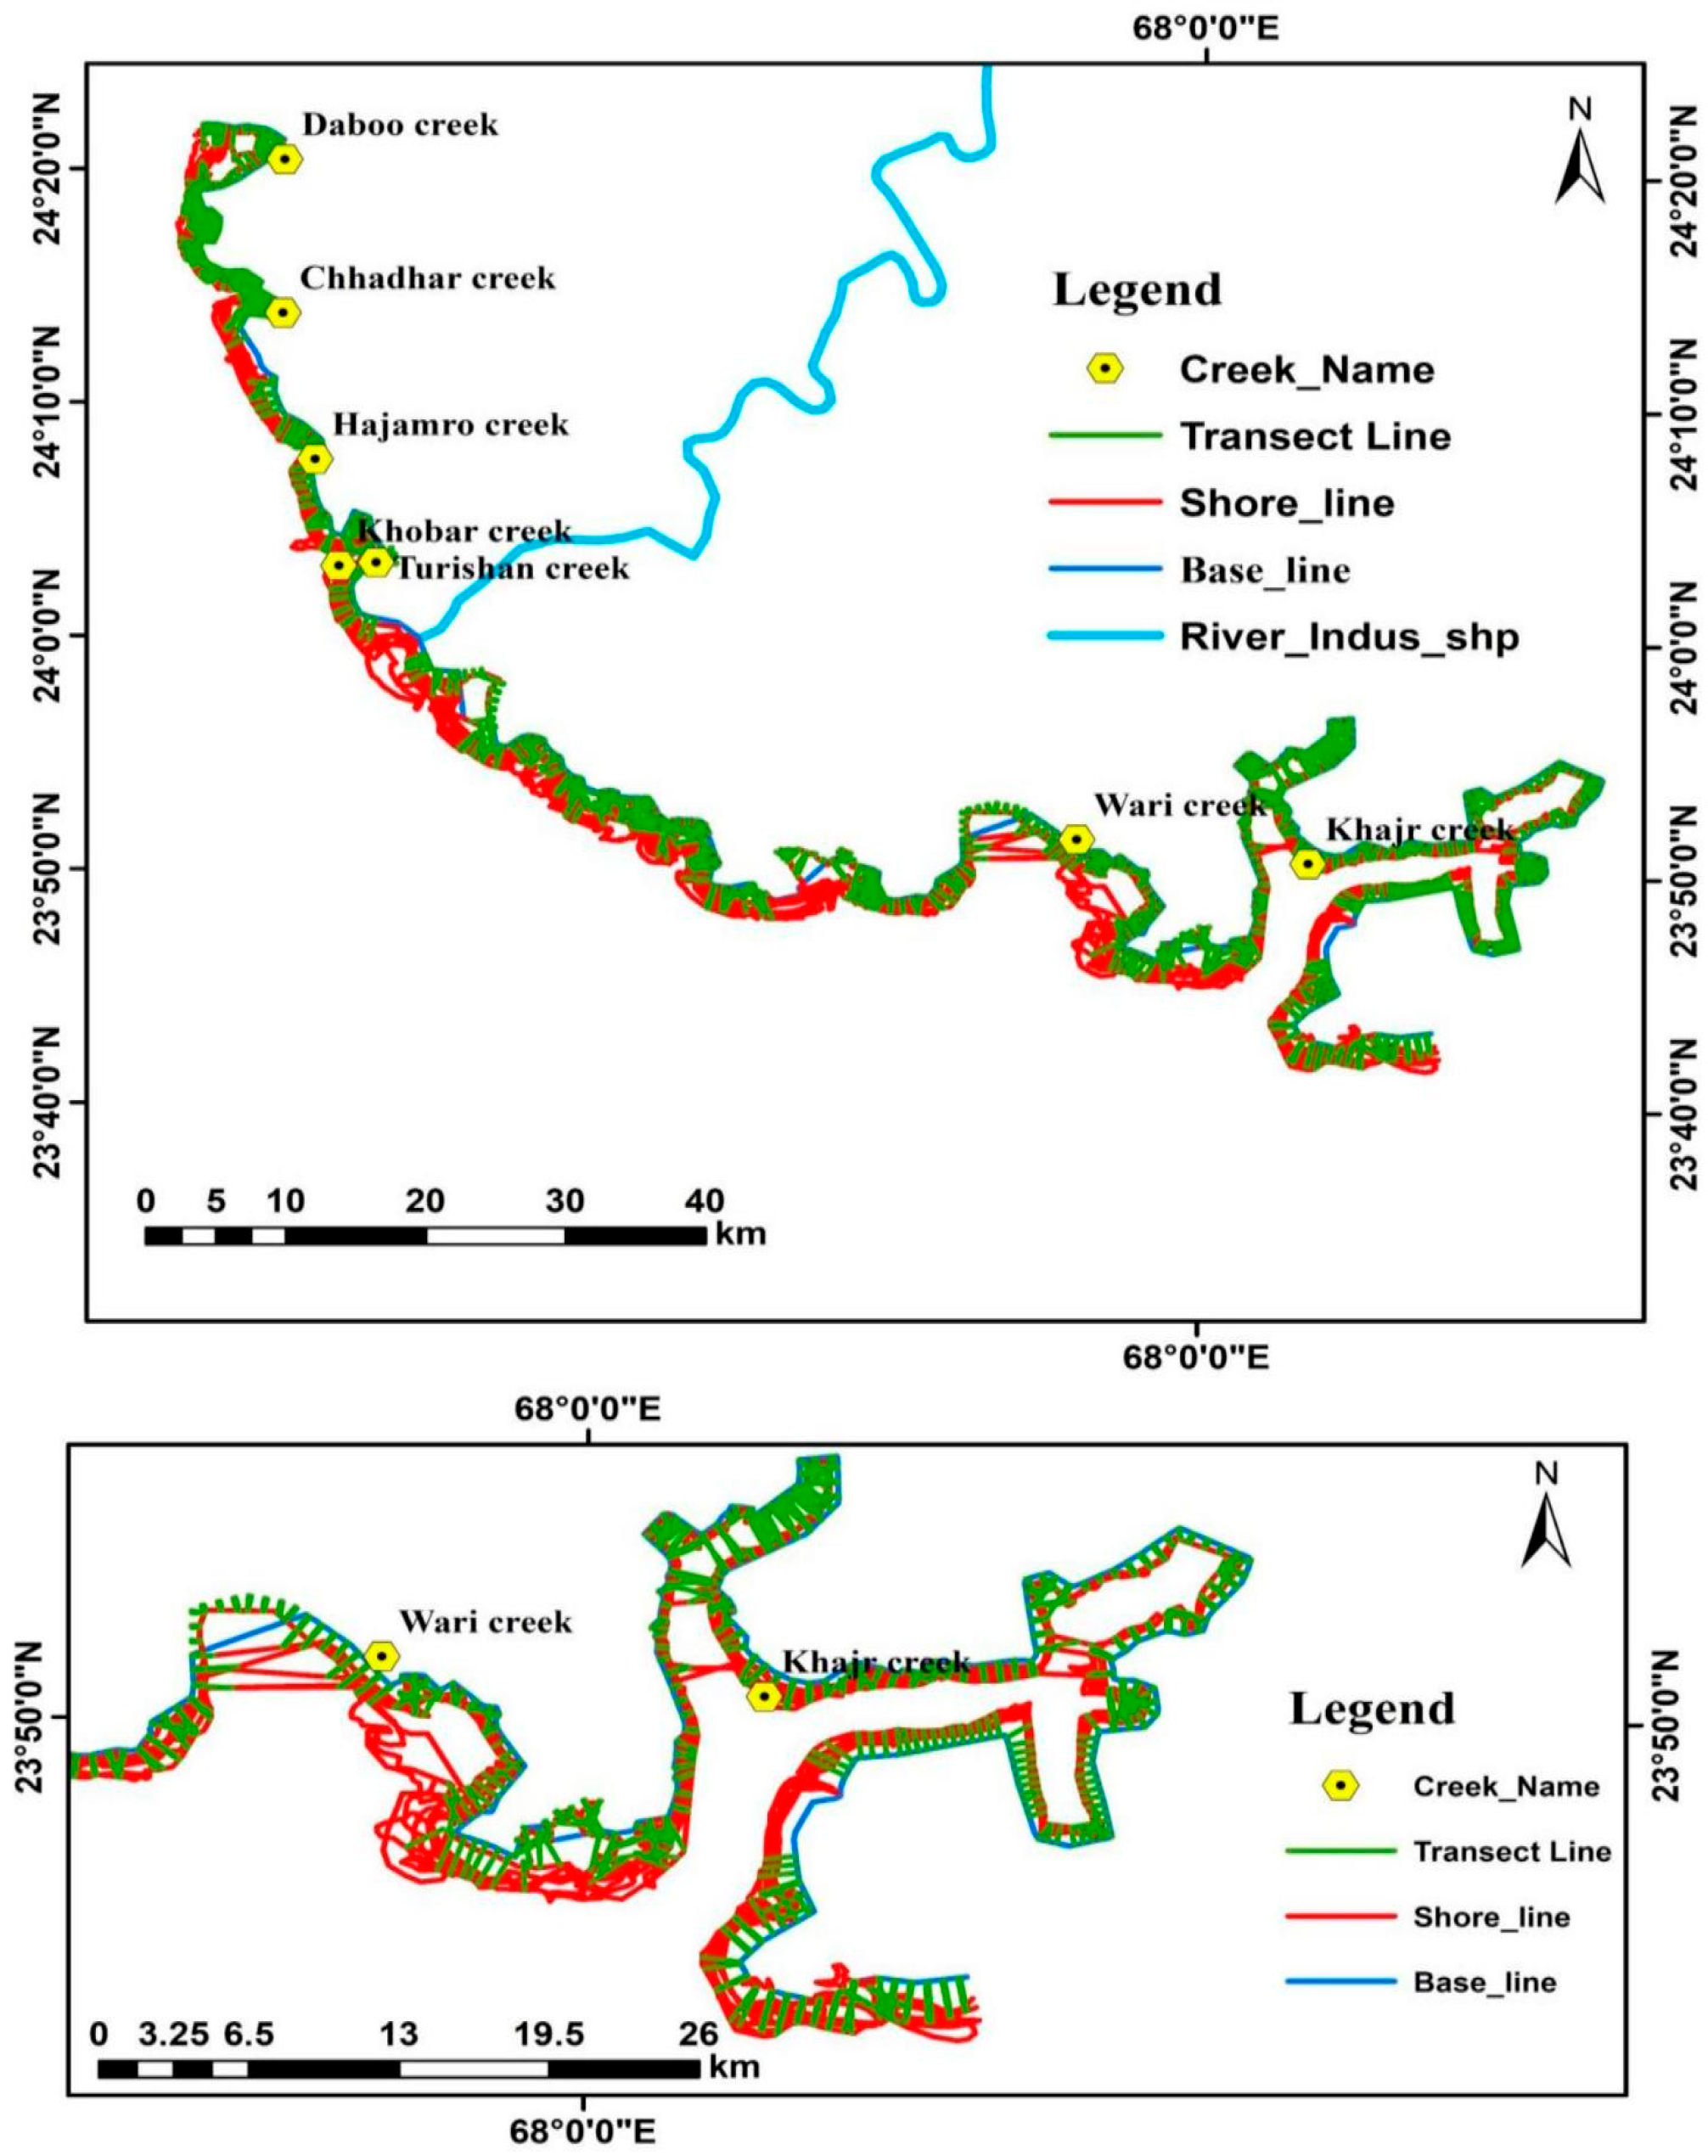
This section outlines the comprehensive, integrated geospatial framework employed to systematically analyze multi-decadal shoreline dynamics in the Indus Delta of Pakistan over the period 1990 to 2020. The research methodology was strategically designed with a dual objective: firstly, to accurately quantify the rates and spatial patterns of coastal erosion and accretion, and secondly, to investigate the potential influence of key climatic drivers—namely, precipitation and wind speed—on these observed changes. The geographical foundation of the study is established in Figure 2, which delineates the study area focused on the major creek systems of the delta and illustrates the critical spatial configuration for the analysis, including the precise placement of the baseline and the distribution of measurement transects. To achieve the study’s objectives, a sequential analytical workflow was implemented. This multi-stage process, visually summarized in the flowchart of Figure 3, encompassed data acquisition from satellite and climatic sources, rigorous data preprocessing, semi-automated shoreline extraction using spectral indices, quantitative change analysis utilizing the Digital Shoreline Analysis System (DSAS) within a GIS environment, and culminated in statistical correlation analysis to link shoreline behavior with climatic variability.

3.1. Satellite Data

Multi-temporal Landsat imagery, including data from the Thematic Mapper (TM) and Operational Land Imager (OLI) sensors, was used to extract shoreline positions from 1990 to 2020. All Level-1 terrain-corrected (L1T) images were acquired from the US Geological Survey (USGS) Earth Explorer portal at a 30 m spatial resolution. The satellite images are freely downloaded from the website of the US Geological Survey (USGS) (http://www.earthexplorer.usgs.gov accessed on 30 November 2023). To minimize positional errors caused by the high tidal range (exceeding 3 m during spring tides [16]), image selection was prioritized for acquisition dates coinciding with low tidal stages and with minimal cloud cover. The description of each satellite image is presented in Table 1.
The acquisition dates listed in Table 1 represent sample/reference images from each interval. In practice, multiple annual Landsat images with less cloud cover were used between 1990 and 2020 to extract shoreline positions. Consequently, each sub-period (e.g., 1990–1995) contains more than two shoreline positions per transect, allowing DSAS to calculate Linear Regression Rates (LRR) in accordance with USGS (2018) guidelines.
For shoreline analysis, we employed the Digital Shoreline Analysis System (DSAS) v5.1 extension within ArcGIS 10.8 to compute shoreline change statistics at 5-year intervals from 1990 to 2020 [20]. This temporal framework was selected to evaluate the influence of climatic factors, specifically precipitation and wind speed, on shoreline dynamics. Climate data was sourced from the climate site of Copernicus Climate Change Service https://cds.climate.copernicus.eu/ accessed on 30 November 2023.

3.2. Shoreline Extraction

Shoreline extraction can be conducted using several remote sensing techniques such as manual digitizing, band ratio, and edge detection, both supervised and unsupervised (e.g., Tasseled Cap, NDWI, MNDWI, PCA) [21,22,23]. These approaches enable the delineation of water bodies and shoreline boundaries from satellite imagery. In this study, the Normalized Difference Water Index (NDWI) [19] and the Modified Normalized Difference Water Index (MNDWI) [12] were employed due to their proven reliability and accuracy in extracting shorelines. These indices are particularly effective in distinguishing water bodies from land, while minimizing the effects of turbidity and vegetation interference.

3.2.1. Rationale for Choosing NDWI and MNDWI

NDWI and MNDWI are widely applied in coastal studies because of their ability to enhance water features and suppress background noise from vegetation or built-up land [21,22]. NDWI and MNDWI were computed. The NDWI is calculated using the green and near-infrared (NIR) bands, whereas the MNDWI uses the shortwave infrared band (SWIR1), which further enhances water delineation in areas with significant sediment or urban influence [12,19]. These indices were employed to delineate the land-water interface, which served as our shoreline proxy. A fixed threshold was applied under the assumption that it consistently separated water from land across the multi-temporal image dataset.
M N D W I = G r e e n S W I R 1 G r e e n + S W I R 1
N D W I = G r e e n N I R G r e e n + N I R
where
Green = Band 2 (Landsat TM/ETM+) or Band 3 (Landsat 8 OLI);
NIR = Band 4 (Landsat TM/ETM+) or Band 5 (Landsat 8 OLI);
SWIR1 = Band 5 (Landsat TM/ETM+) or Band 6 (Landsat 8 OLI).
The NDWI values range between −1 and +1, with positive values (>0) indicating water bodies, while values near or below zero typically represent vegetation or land [12,19]. Thresholds recommended in previous studies (e.g., NDWI > 0.2, MNDWI > 0.1) were applied to improve classification accuracy and a reliable result [21,23,24].
By applying NDWI and MNDWI to Landsat TM, ETM+, and OLI imagery, we successfully delineated water–land boundaries across the Indus Delta. The combined use of both indices reduced noise and improved shoreline delineation, thereby allowing the preparation of accurate time-series shorelines for subsequent statistical analyses (Figure 4).

3.2.2. Accuracy Assessment

To validate shoreline and wetland classification, confusion matrices were generated using stratified random sampling (n = 5000) across the study area. At MNDWI > 0.3, the model achieved Overall Accuracy = 96.1%, Producer’s Accuracy = 0.86, User’s Accuracy = 0.91, and Kappa = 0.90, with most misclassifications occurring in transitional wetland zones. By refining the permanent/seasonal separation using the percentile composite, classification accuracy improved significantly, with the final model achieving 99% Overall Accuracy, Producer’s Accuracy, and User’s Accuracy (Kappa = 0.90). These results underscore the robustness of the adopted workflow for shoreline delineation in a complex, turbid deltaic setting.

3.3. Baseline and Transect Generation

In this study, we employed the DSAS v5.1 extension within ArcGIS 10.8 to generate baselines and transects for shoreline change analysis [20]. A landward fixed baseline was digitized parallel to the general shoreline orientation, ensuring that all transects intersected multiple shoreline positions consistently across time. Transects were automatically cast at 100 m spacing, extending 1000 m seaward and oriented perpendicular to the baseline. This configuration produced 3420 transects along the western Indus Delta, providing adequate spatial coverage while avoiding excessive autocorrelation between adjacent transects. For reliable rate estimation, each transect required a minimum of three shoreline intersections. The DSAS toolbox calculated shoreline-change statistics, including Net Shoreline Movement (NSM), End Point Rate (EPR), and Linear Regression Rate (LRR) as explained in Table 2. LRR was computed using ordinary least squares regression with a 95% confidence level. Distance measurements were projected to WGS 1984 UTM Zone 42N, with planar calculations applied [25]. Uncertainties arising from pixel resolution (30 m), co-registration errors, classification thresholds, and tidal/seasonal variations were combined following DSAS guidelines. Outlier transects were excluded where regression residuals exceeded one pixel root mean square error (RMSE > 30 m) [25] or where shoreline intersections were inconsistent with adjacent transects. Erosion and accretion “hotspots” were defined as transects exceeding the 90th percentile of observed shoreline-change rates [25].

3.4. Statistical Analysis of Climatic Drivers

Shoreline change rates, which served as the primary geomorphic variable in this analysis, were calculated using the Digital Shoreline Analysis System (DSAS) [1]. The following metrics were employed: [9].
The statistical parameter NSM shows how much the shoreline position has changed at the point where each transect meets, from the oldest to the youngest shoreline positions.
It is formulated as follows:
NSM = d2 − d1
where
d2 = Distance from baseline to the oldest shoreline;
d1 = Distance from baseline to the most recent shoreline.
EPR is used to figure out the extent of the shoreline changes each year. It is estimated by finding the distance between the oldest and newest shoreline locations and dividing that by the total time that occurred between them. We use Equation (4) to find out the EPR:
EPR = (d2 − d1)/(t2 − t1)
where
d2 = Distance from baseline to the oldest shoreline;
d1 = Distance from baseline to the most recent shoreline;
t2 = Year of the oldest shoreline;
t1 = Year of the most recent shoreline [6,9].
LRR represents a statistically robust rate of change calculated by fitting a least-squares regression line to all shoreline points for each transect [6].
This study employed a statistical approach to quantitatively evaluate the potential influence of climatic factors on shoreline dynamics. Spearman’s rank-order correlation analysis was selected as the primary method for this investigation. This non-parametric technique was chosen for three specific reasons that align with the nature of the dataset; It does not require the assumption of normally distributed data, which is frequently violated by environmental variables like precipitation and geomorphic rates [26,27]; It is robust to the influence of outliers, which are common in shoreline change datasets; and it is designed to detect monotonic relationships, whether linear or non-linear, which is the hypothesized form of the climate-shoreline interaction.
To ensure a spatially and temporally consistent climatic record across the data-sparse Indus Delta, this study utilized the ERA5-Land global reanalysis dataset [28]. This dataset provides physically coherent estimates generated by assimilating vast observational data into a numerical model. Its suitability for regional delta-scale analysis is supported by a high spatial resolution (~0.1° or ~9 km) and a strong validation record against station data in South Asia [29].
Precipitation (mm) and wind speed (m/s) data were extracted for the period 1990–2020. To capture the regional climatic forcing affecting the entire delta, values were extracted for a 2 × 2 grid point box encompassing the study area (Latitude: 23.5° N to 24.5° N, Longitude: 67.0° E to 68.5° E) and averaged to produce a single, representative annual time series for each variable.
The shoreline change data were structured at the transect level to maximize analytical resolution and statistical power. The End Point Rate (EPR) was calculated for each of the 3420 transects across six sequential five-year intervals (1990–1995, 1995–2000, 2000–2005, 2005–2010, 2010–2015, 2015–2020).
The strength and direction of the monotonic relationship for each pairing were quantified using Spearman’s rank correlation coefficient (ρ or rs), which is calculated as follows:
r s = 1 6 d 2 i n ( n 2 1 )
di = difference between the two ranks (climatic variable and EPR) for each observation;
n = number of observations.
The correlation coefficient was interpreted as follows: positive values suggest that higher ranks of a climatic variable are associated with higher EPR ranks (accretion), while negative values suggest an association with lower EPR ranks (erosion) [26].

4. Result

4.1. Shoreline Change Analysis by Using EPR, LRR, and NSM

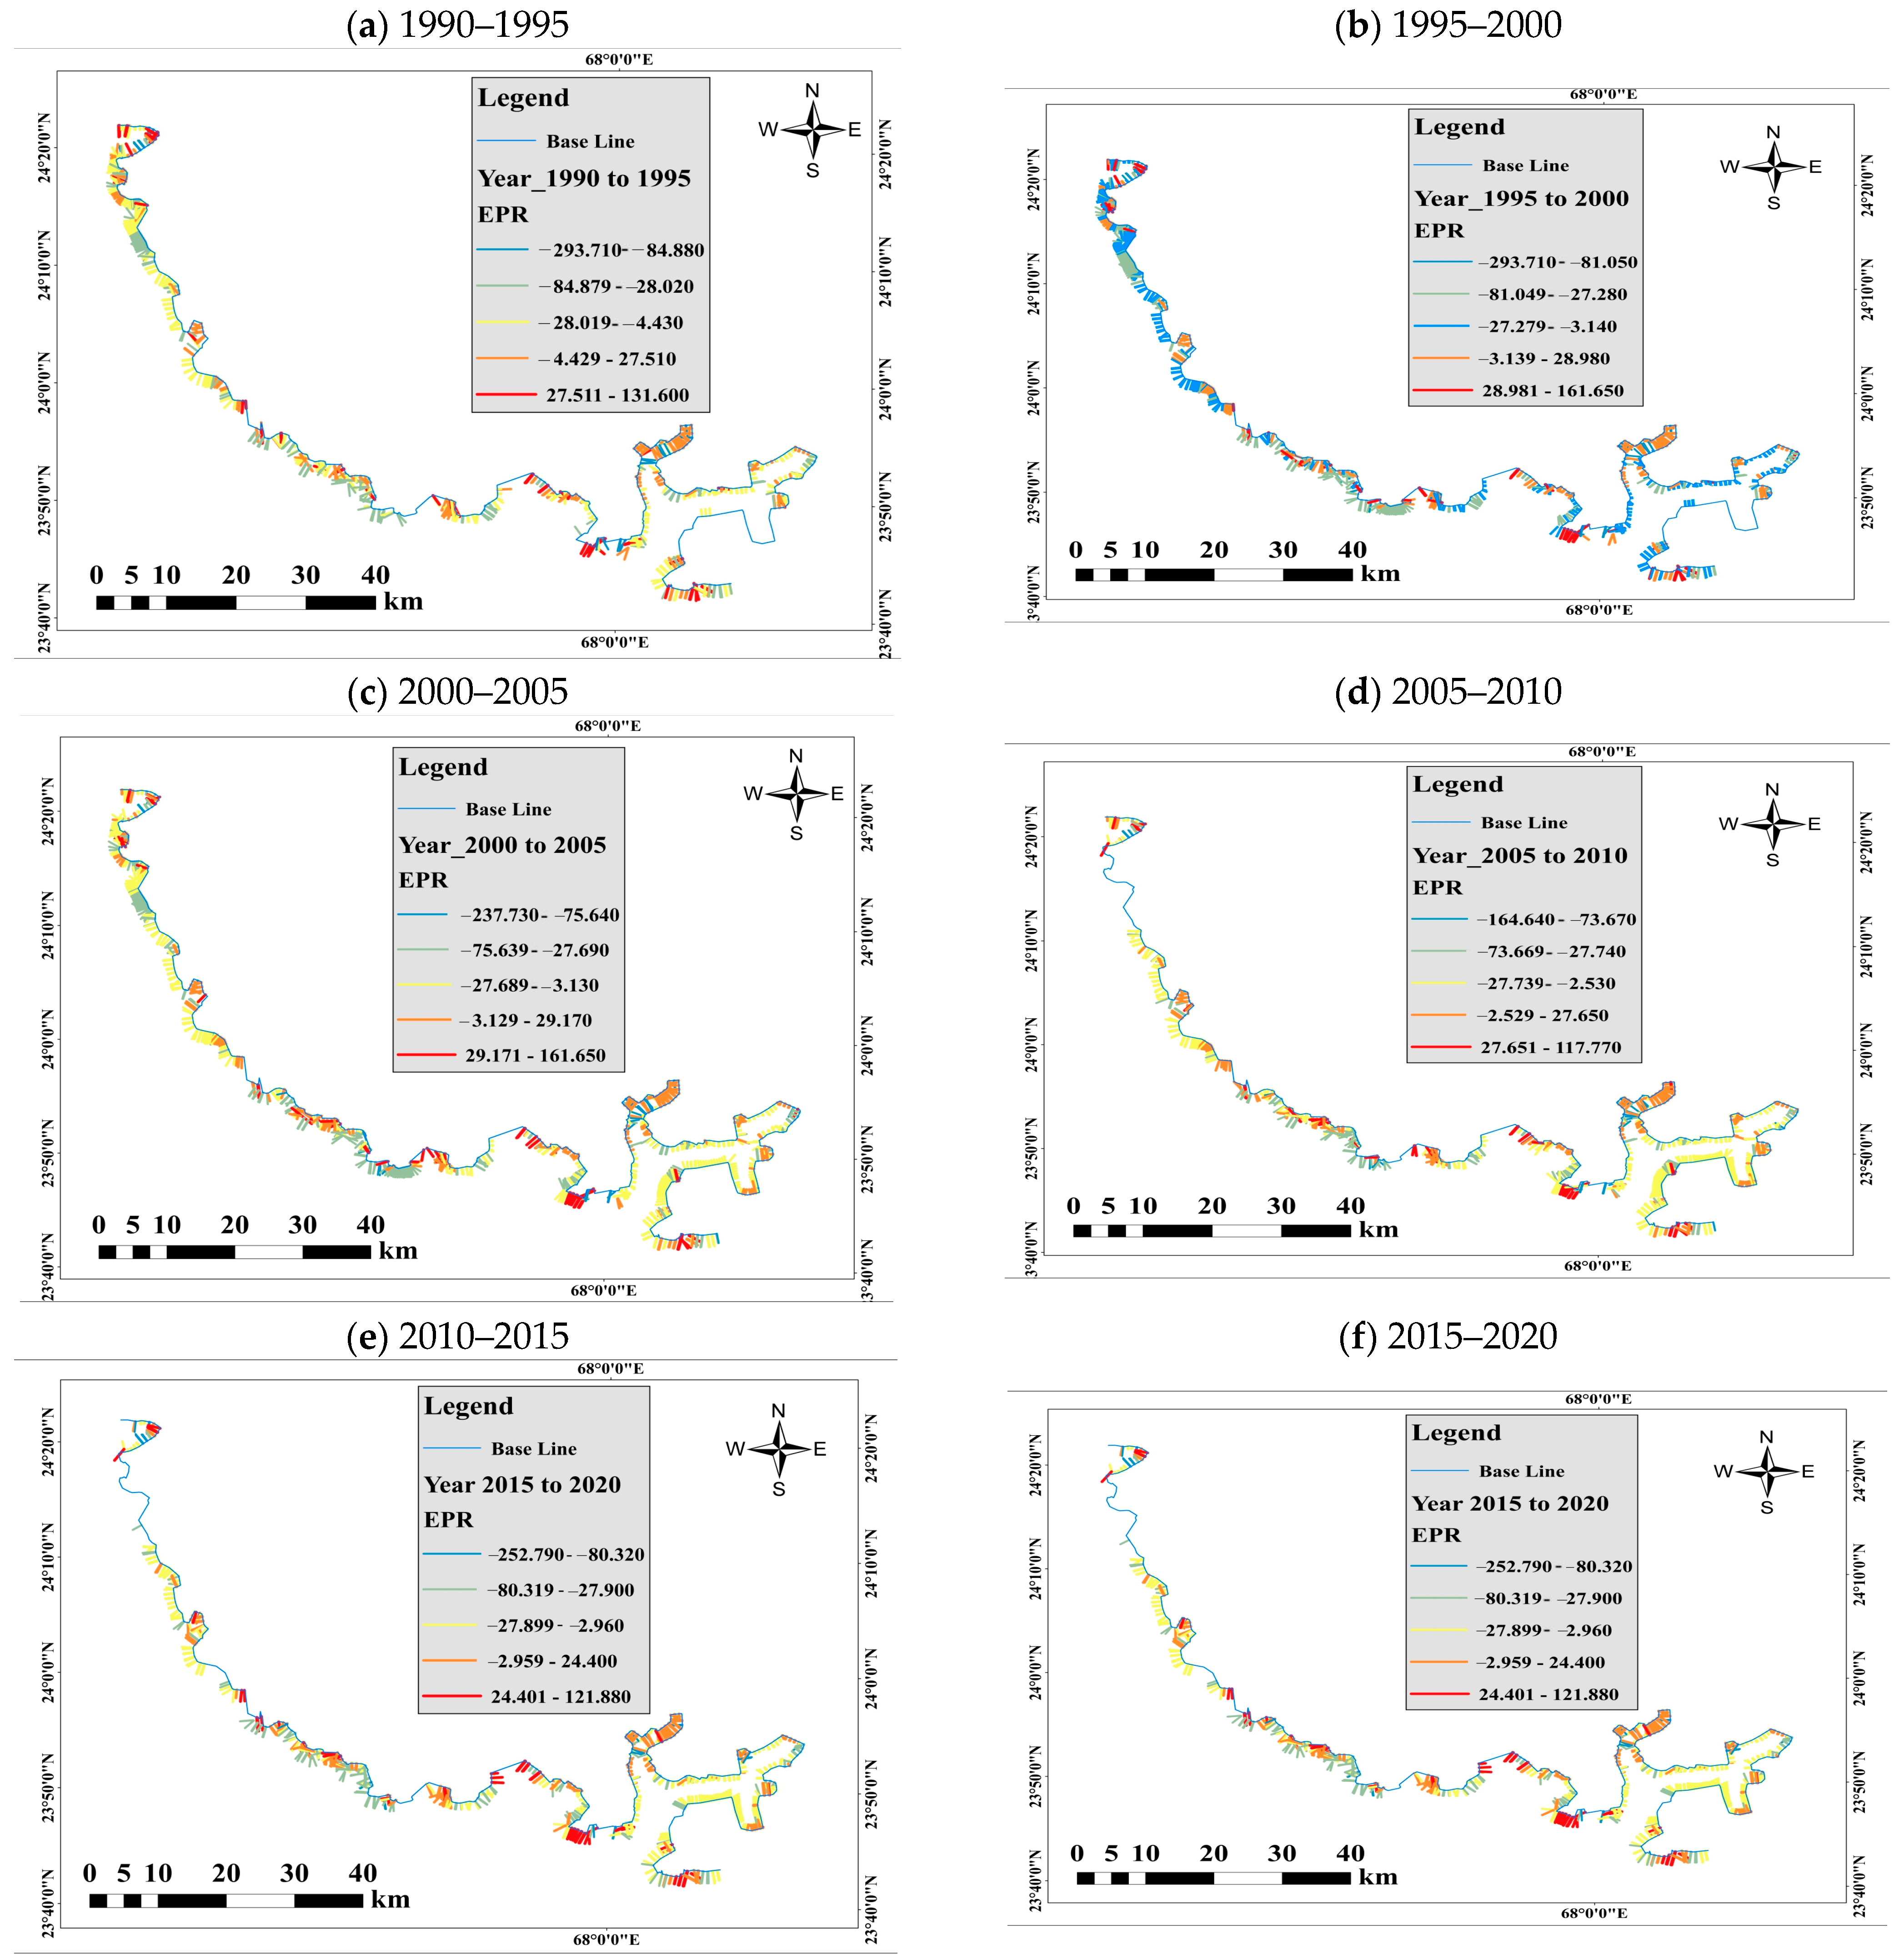
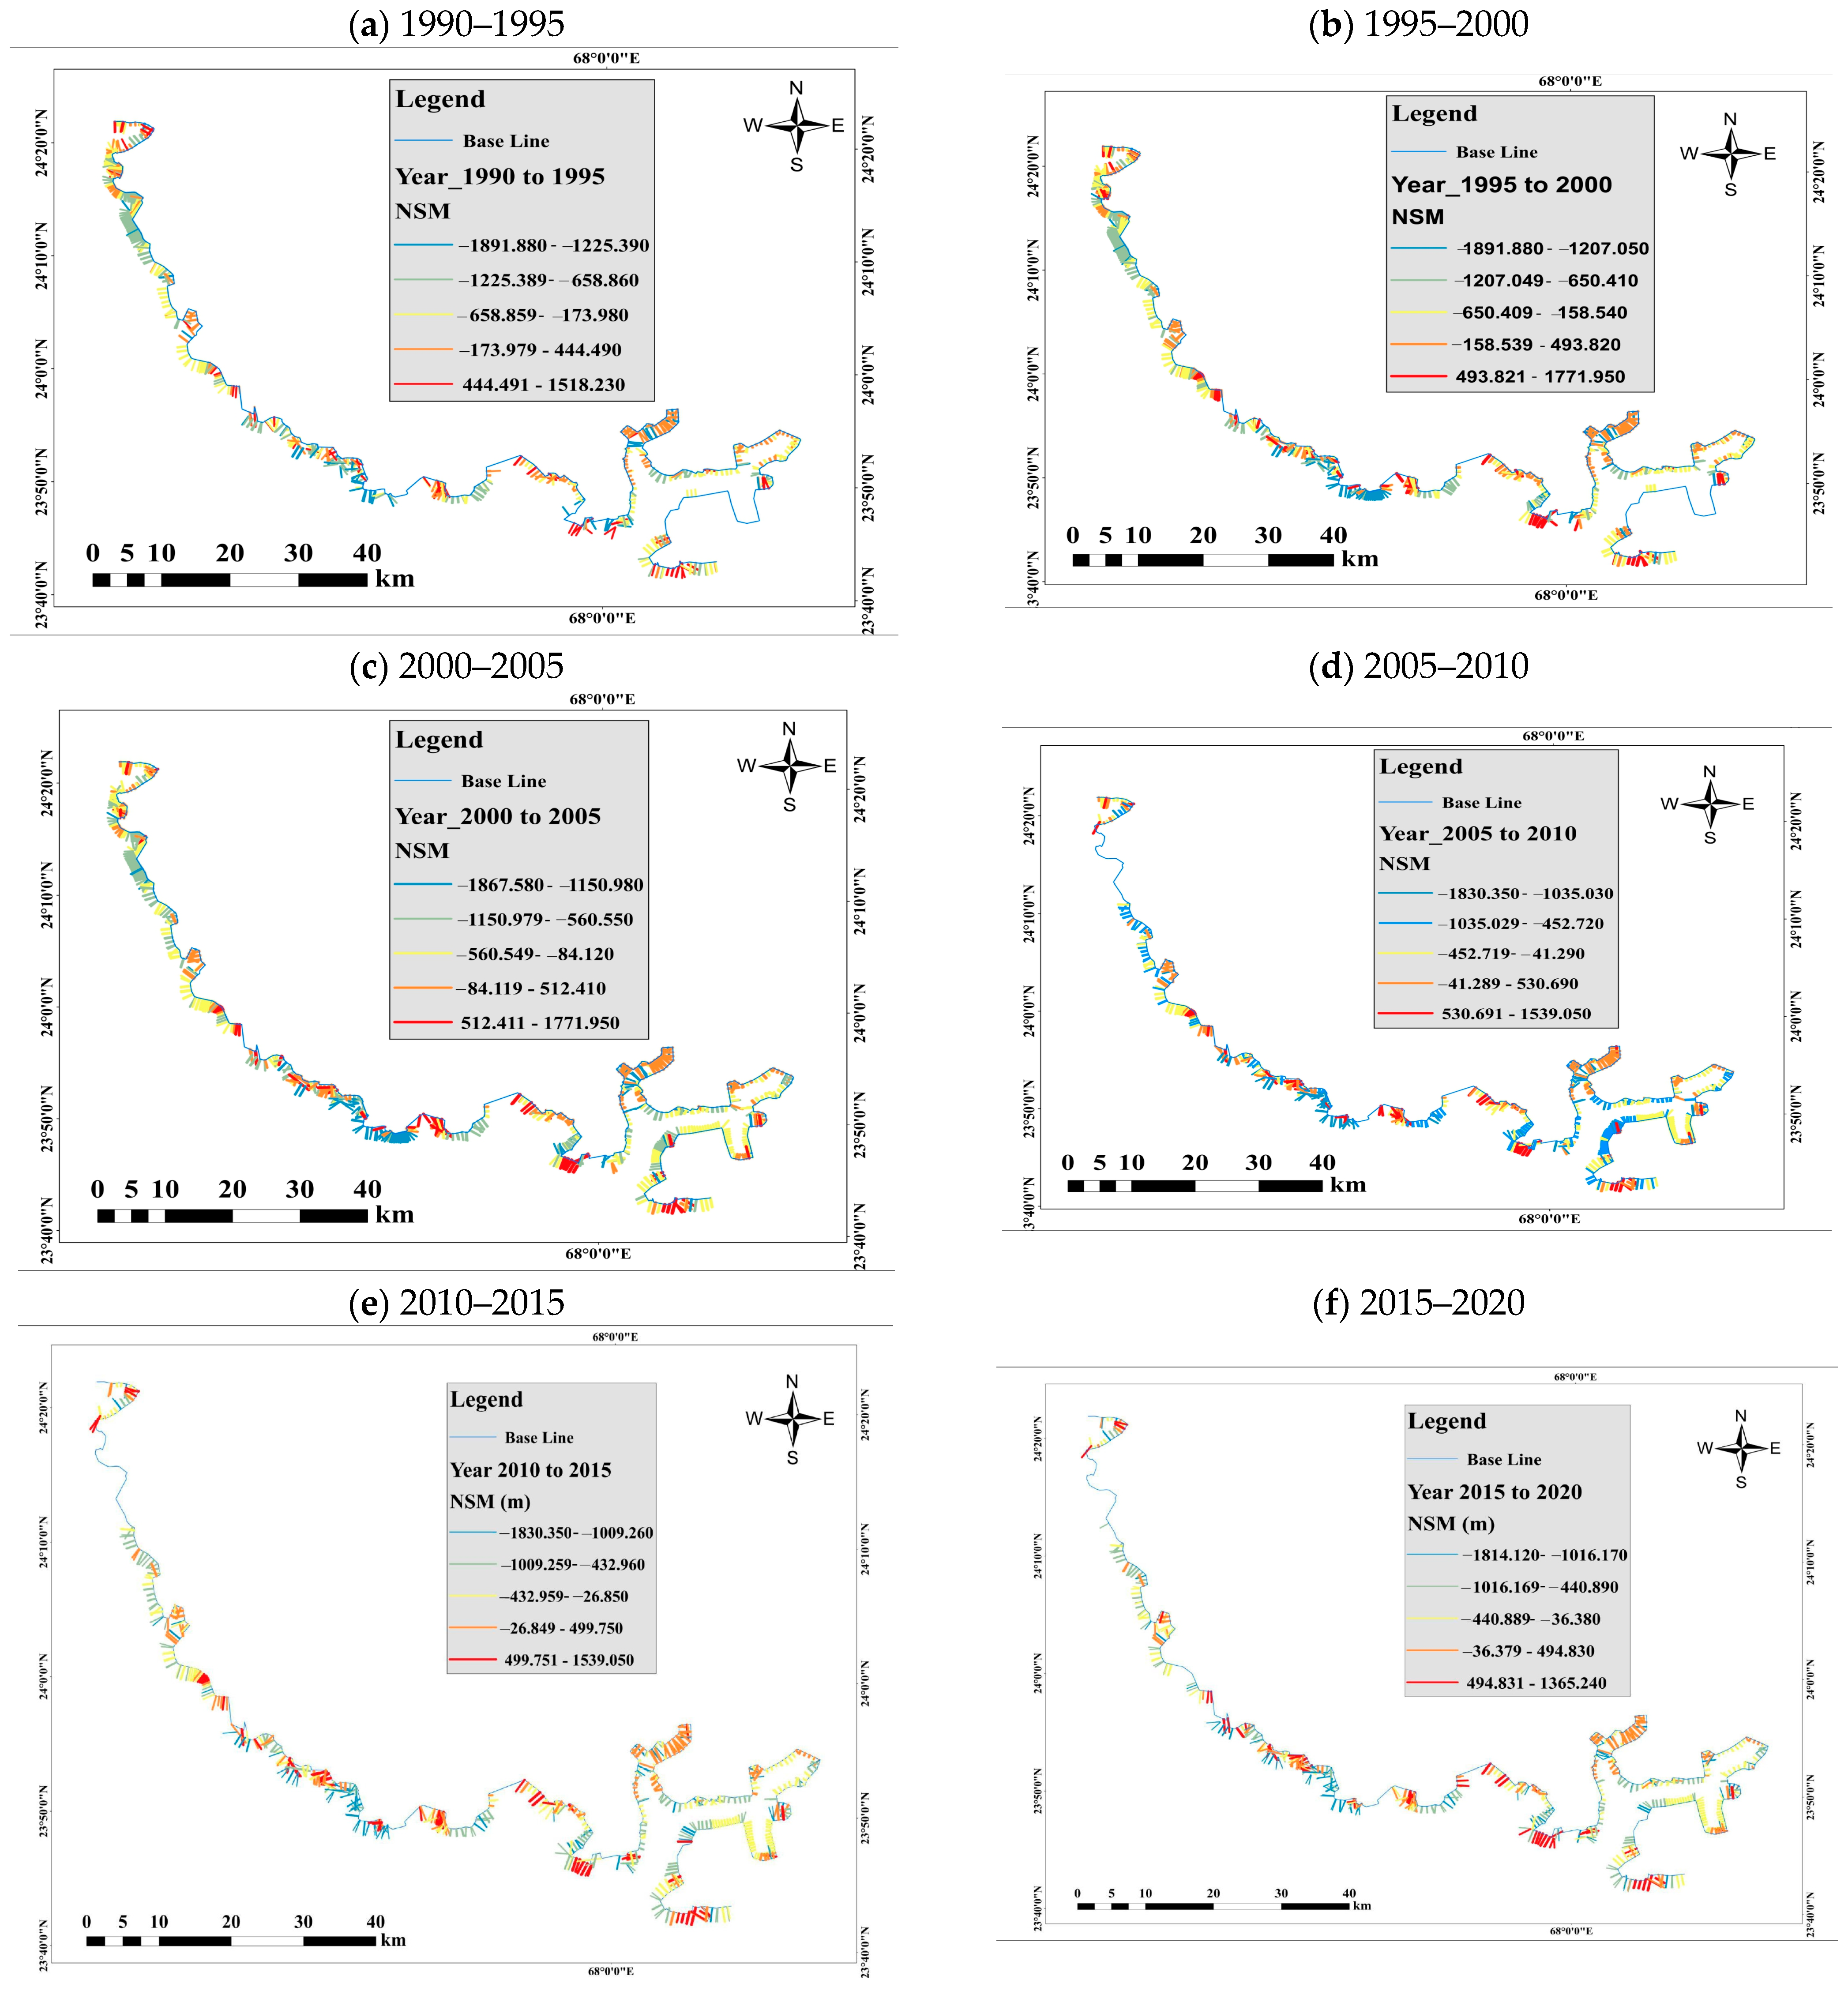
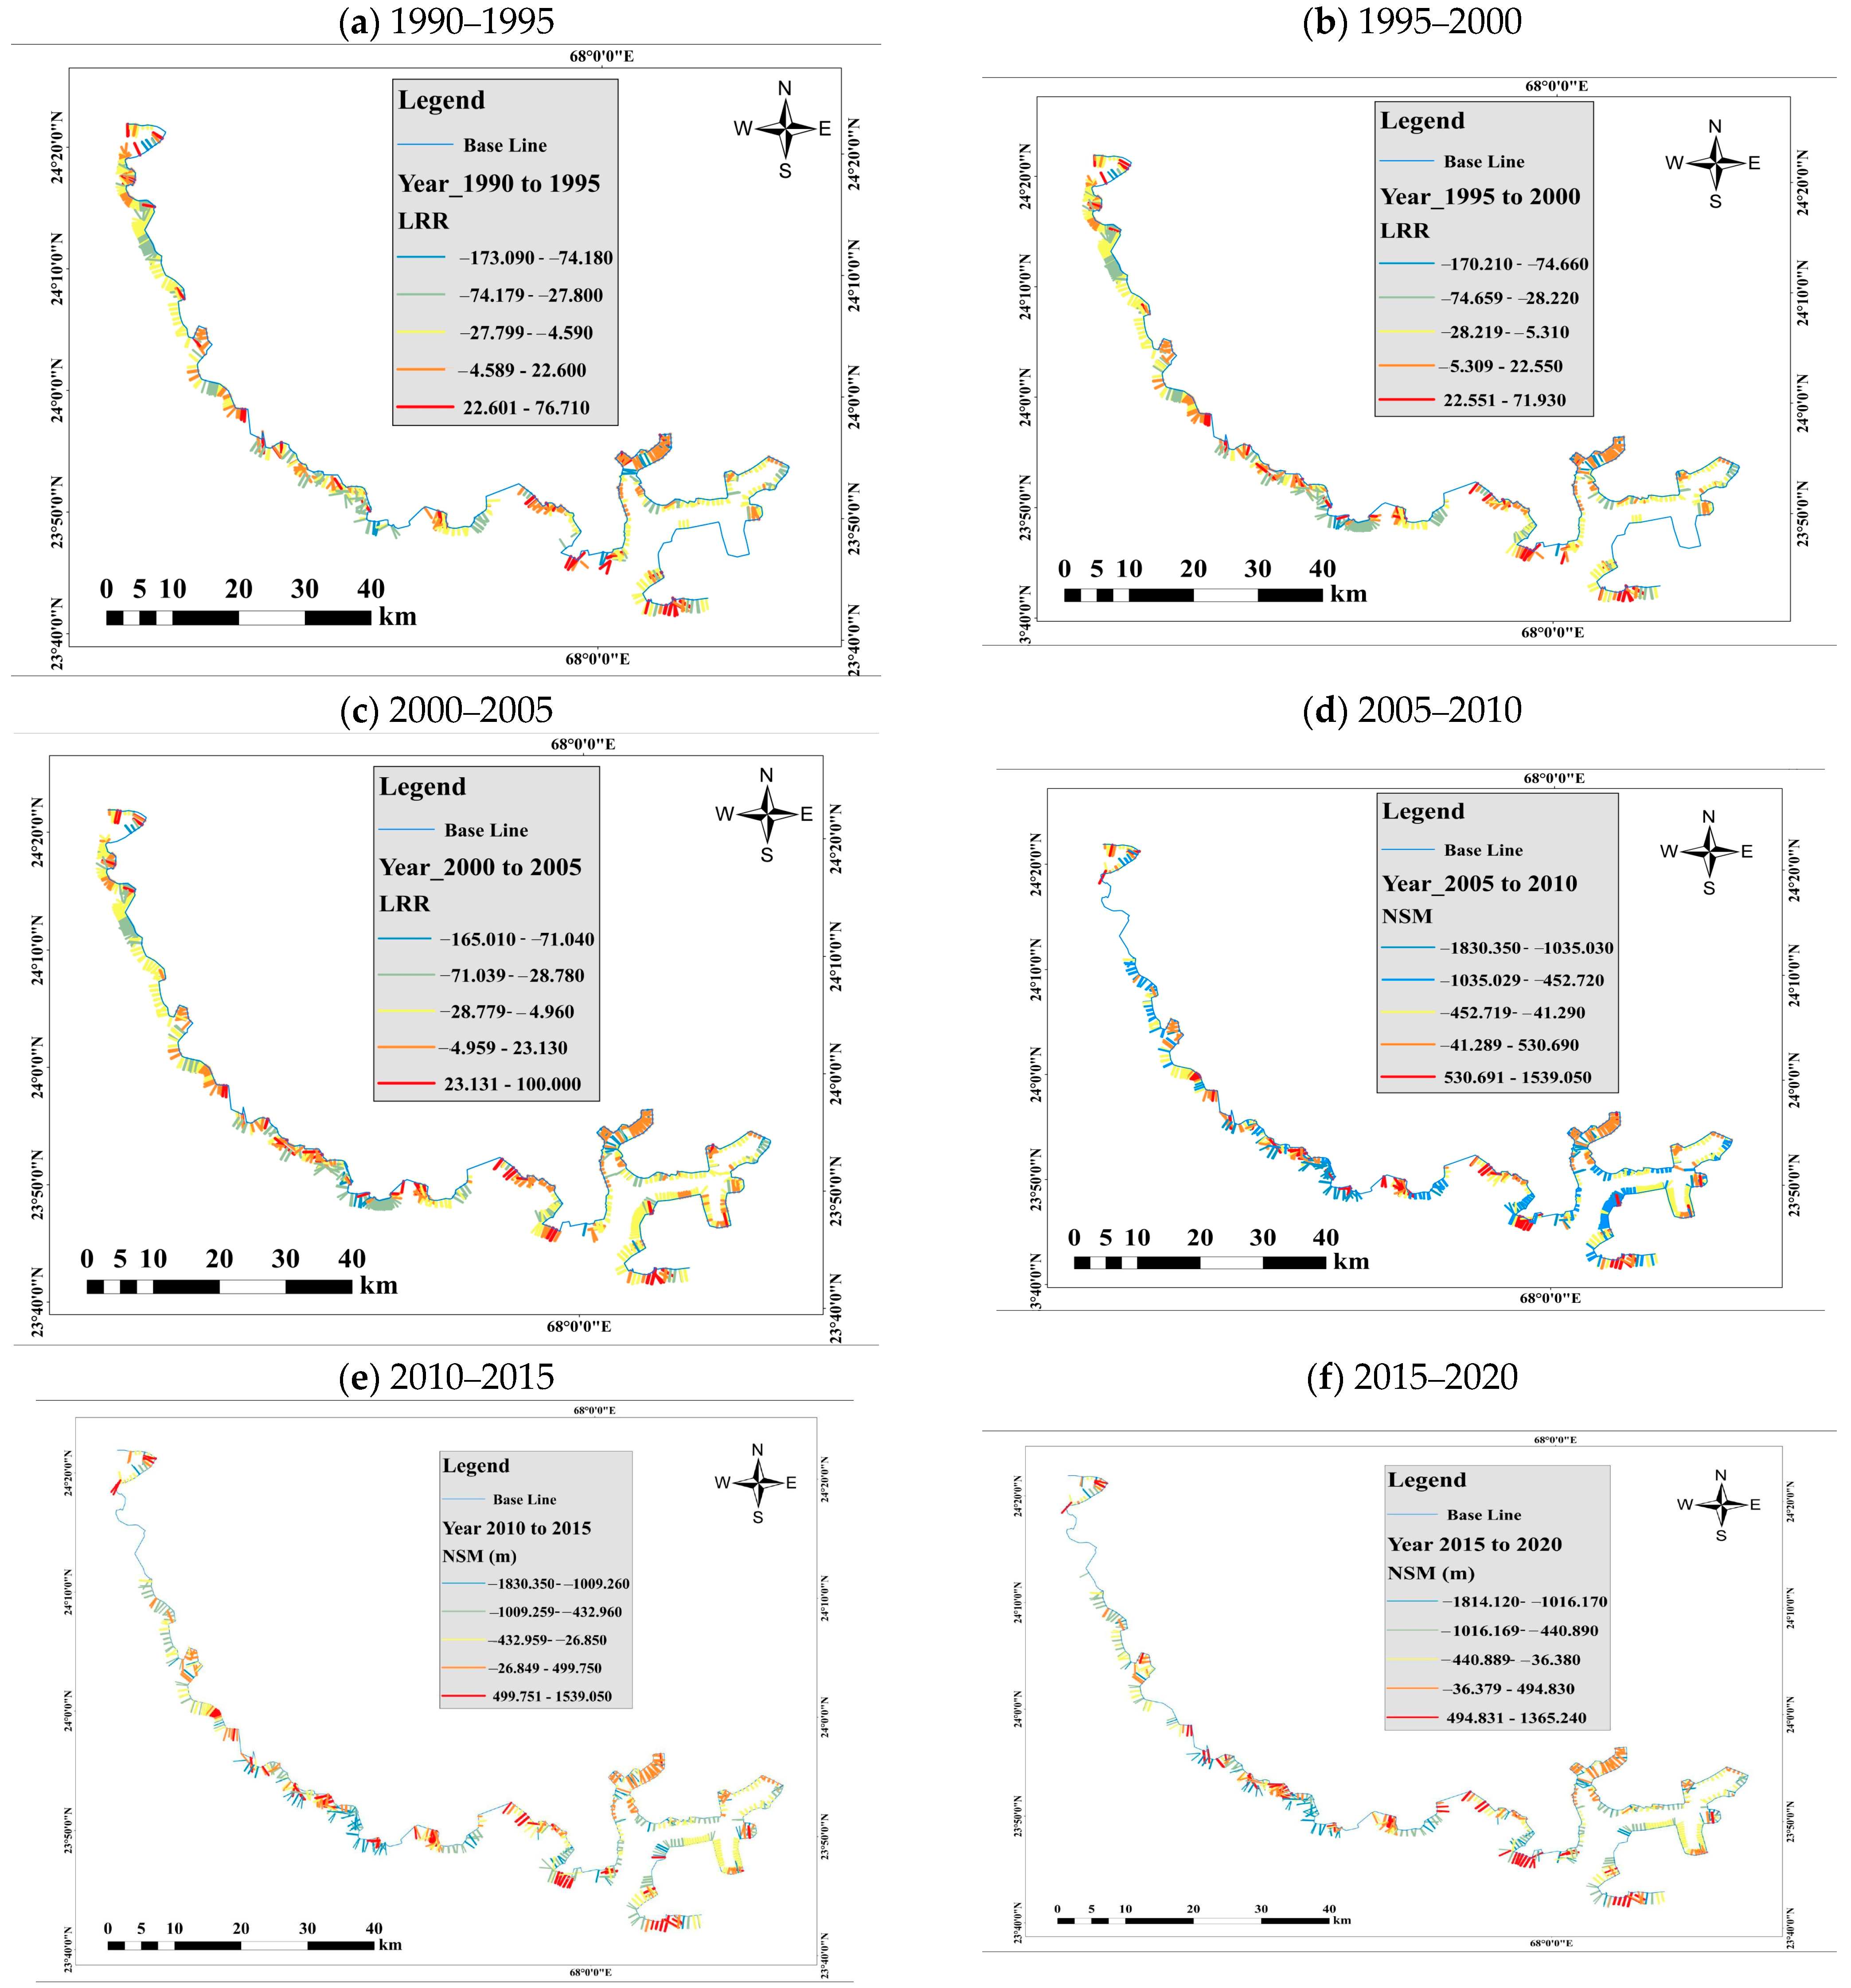
Shoreline change analysis for the Indus Delta was conducted for six time periods using (Figure 5a–f), End Point Rate (ERP), Net Shoreline Movement (NSM) (Figure 6a–f), and Linear Regression Rate (LRR) (Figure 7a–f). These metrics have been widely used in similar studies [4,6,9].
The multi-decadal shoreline analysis from 1990 to 2020 reveals a dynamic interplay of erosion and accretion, with clear temporal trends and distinct spatial patterns, as visualized in the EPR, NSM, and LRR maps (Figure 5, Figure 6 and Figure 7, respectively).
The EPR analysis (Figure 5) shows that the Indus Delta experienced its most extreme rates of change in the first decade of the study period. Spatially, the highest erosion rates (below −290 m/year from 1990 to 2000) were consistently concentrated along the open, wave-exposed coasts of the western creeks, particularly Wari and Khajar (Figure 5a,b). This indicates these areas were initially highly vulnerable to marine forces amid declining river sediment. Concurrently, significant accretion (above +130 m/year) was focused at the mouths of major eastern creeks like Hajamro, suggesting sediment deposition in lower-energy zones. Concurrently, significant accretion (above +130 m/year) was focused at the mouths of major eastern creeks like Hajamro, suggesting these are zones of net sediment deposition.
A notable shift occurred after 2005, with a pronounced moderation in maximum erosion rates (ranging from −164 to −168 m/year between 2005 and 2015, as seen in Figure 5d,e). During this period, the spatial extent of severe erosion visibly contracted, especially in the central delta, coinciding with the initiation of mangrove rehabilitation efforts, which may have enhanced stability. During this period, the spatial extent of severe erosion visibly contracted, especially in the central delta, representing a notable phase of reduced shoreline change. However, this stabilization was temporary. The period 2015–2020 saw a resurgence of severe erosion, with the rate climbing to −252.79 m/year. The EPR map for this final interval (Figure 5f) shows this renewed erosion reclaiming areas in the west that had previously stabilized, underscoring the persistent vulnerability of the delta to erosional forces.
The NSM results (Figure 6), which represent the total distance of shoreline movement, reinforce the trends observed in the EPR. The most substantial net land loss (approximately −1890 m) occurred early in the study period (1990–2000), creating a clearly defined band of erosion along the southwestern coastline (Figure 6a,b). Conversely, the maximum net accretion (exceeding +1700 m) was also observed during this time, primarily building new land in the eastern sections of the delta.
The following periods (2000–2015) showed a relative stabilization in net movement, with erosion values hovering around −1830 to −1800 m. Spatially, the NSM maps for these years (Figure 6c–e) show a consolidation of these erosion and accretion zones rather than major expansion, indicating a period of equilibrium. The final period (2015–2020) is marked by a reduction in the maximum accretion value to 1365.24 m, while erosion remained severe. This is visible in Figure 6f as a net shrinkage of the major accretionary areas, signaling a resumption of net land loss across the delta system.
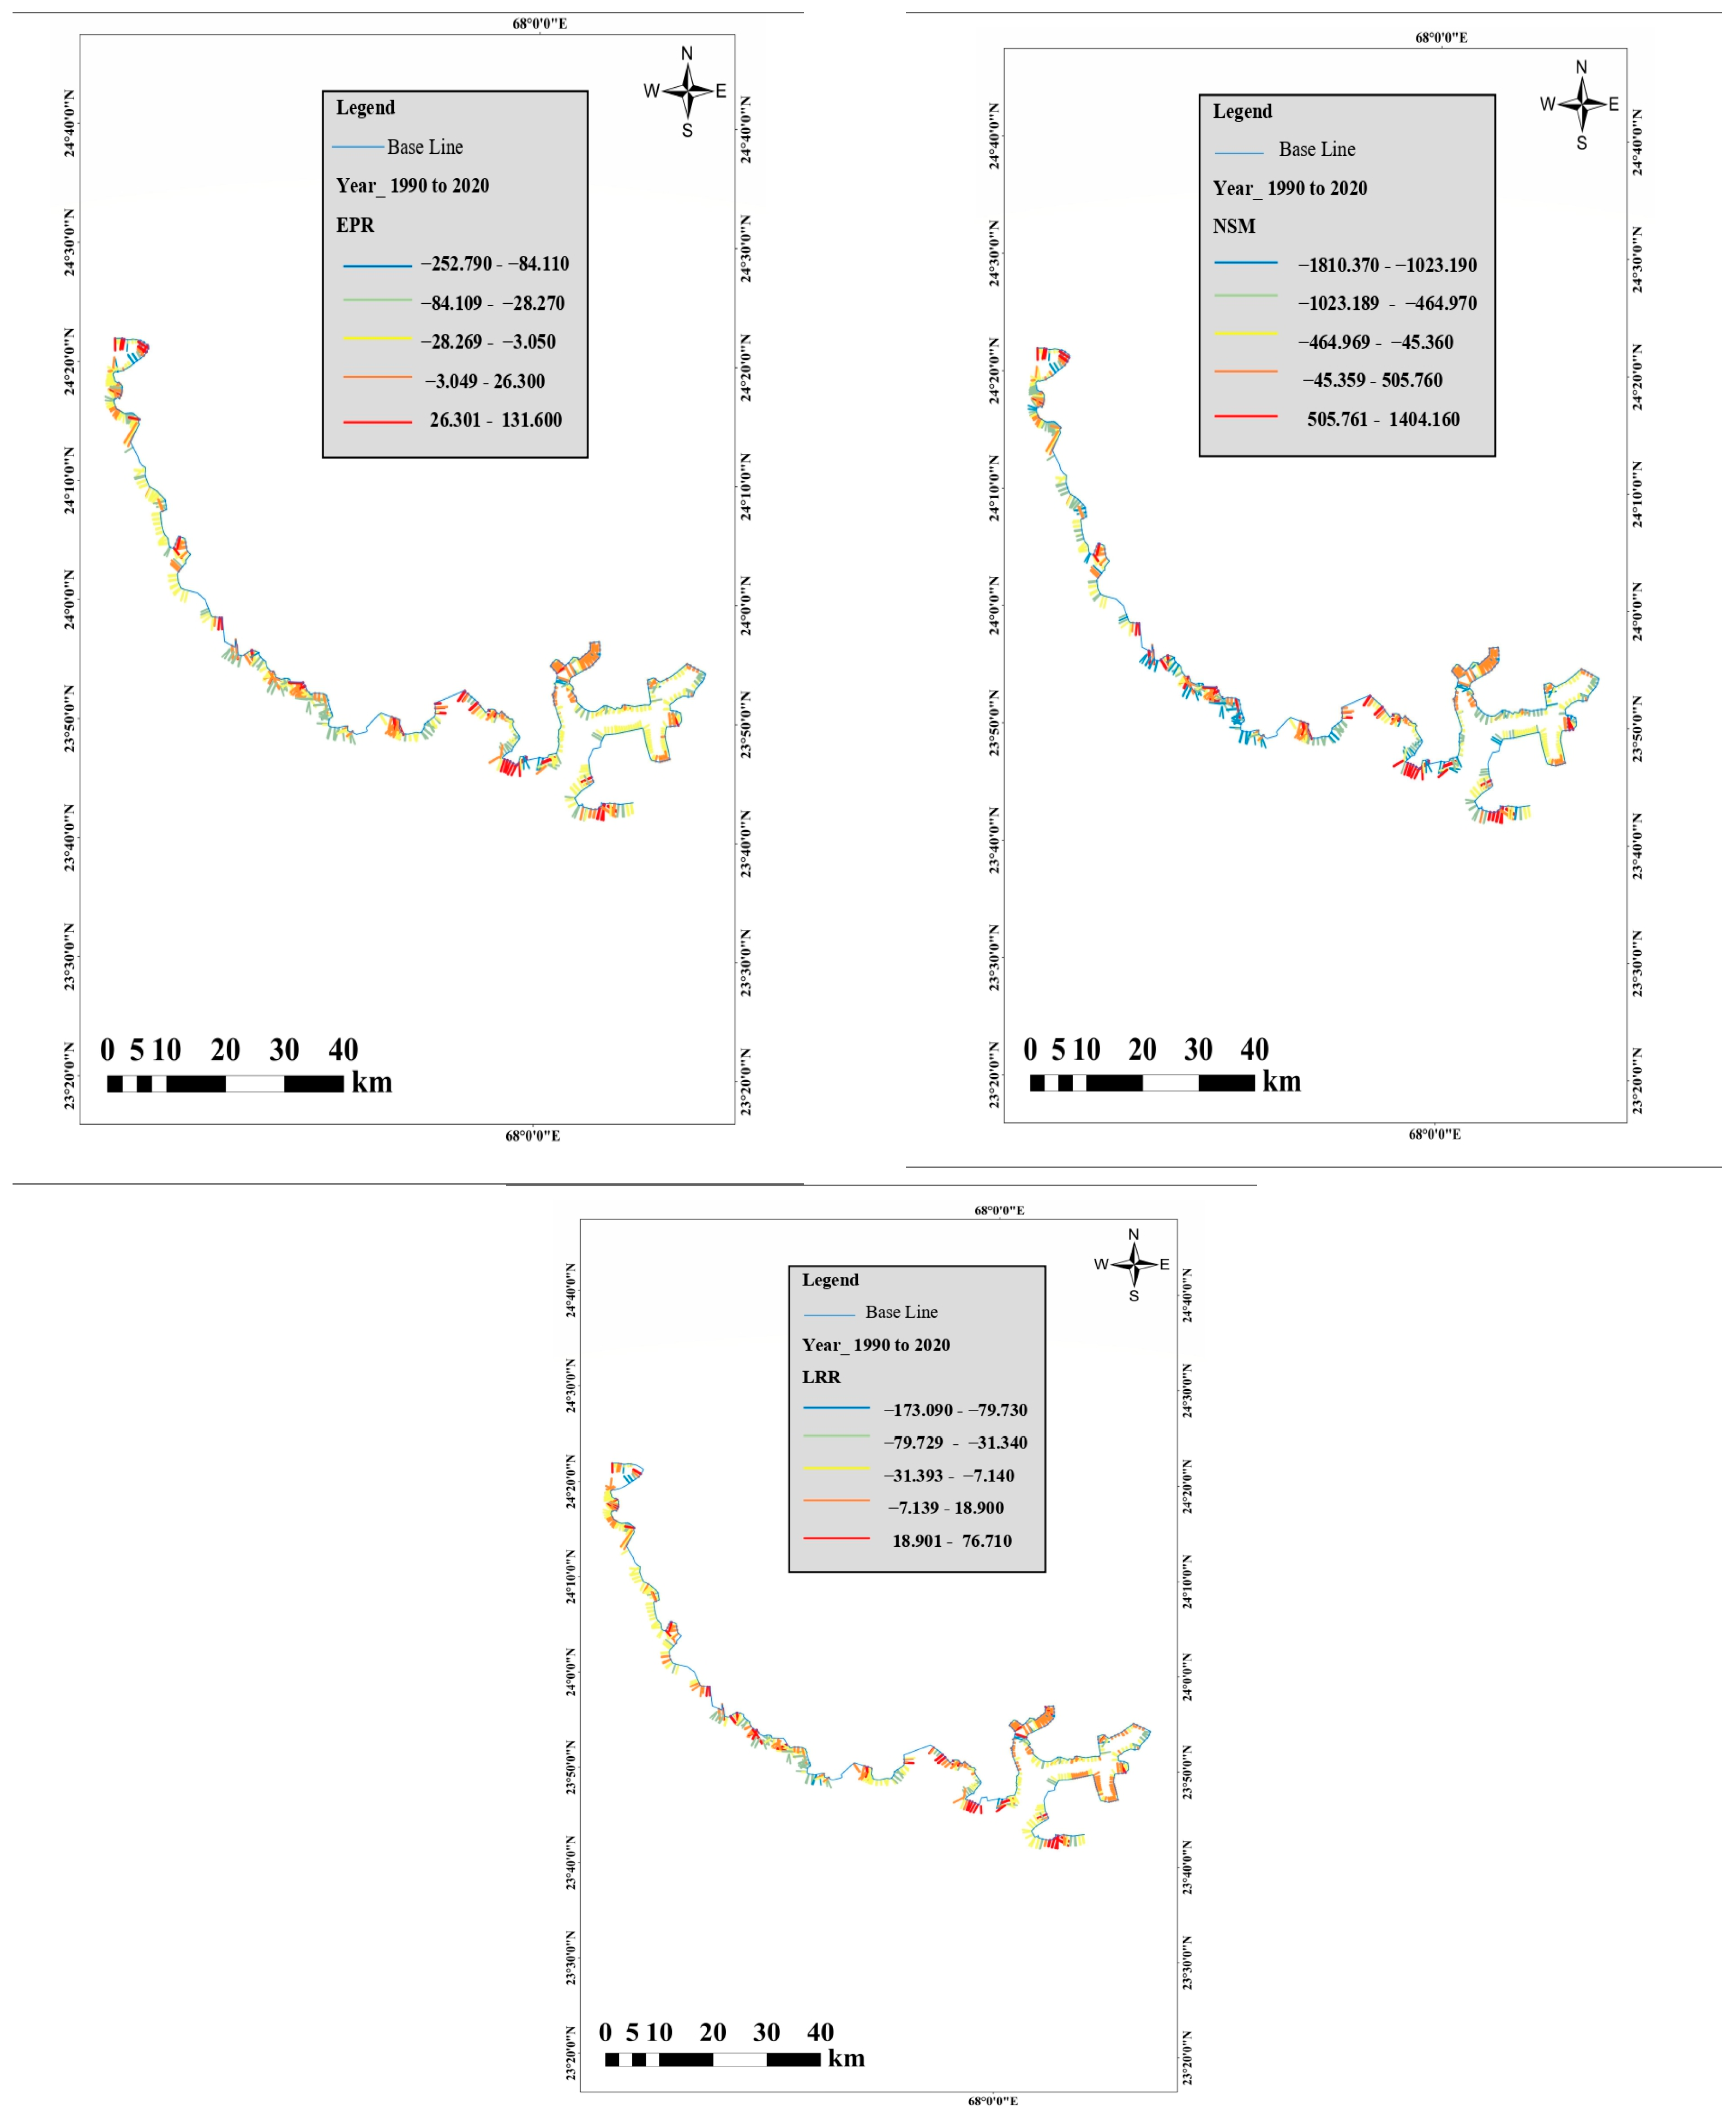
The LRR provides a smoothed, long-term perspective on shoreline behavior. The highest long-term erosion rates occurred in the early intervals (approximately −170 to −173 m/year between 1990 and 2000), and the LRR synthesis map (Figure 7) confirms that these rates were entrenched along the southwestern coast, identifying it as a chronic erosion hotspot. While rates moderated slightly in the intermediate periods, the final interval (2015–2020) saw a return to high erosion (−170.84 m/year). Critically, the LRR map shows that despite short-term fluctuations, the overarching spatial pattern for the entire 30-year period is one of persistent retreat for the western and southern shores, with more stable or accretional behavior limited to specific zones in the east and within the creek systems.
In summary, the combined metrics reveal a delta experiencing significant long-term erosion, punctuated by a period of relative stabilization around 2005–2015. Spatially, the western sector, directly exposed to the Arabian Sea, has been consistently most vulnerable, while the eastern creeks have shown more dynamic behavior with episodes of considerable accretion.

4.2. Correlation Between Shoreline Change and Climatic Variables

Spearman’s rank-order correlation analysis was conducted to quantify the monotonic relationship between the End Point Rate (EPR) of shoreline change and key climatic variables (wind speed and precipitation) over the study period.
The results reveal a highly dynamic and shifting relationship between climatic drivers and shoreline behavior (Table 3). The strength and direction of the correlation varied significantly across the analyzed years.
The correlation analysis reveals that the impact of climatic factors on the Indus Delta shoreline change varies irregularly over time. Strong and statistically significant negative correlations in 1990 (ρ = −0.679) and 2000 (ρ = −0.663) imply that increased precipitation and wind speeds were linked to increased erosion over those years, which could be a result of enhanced sediment perturbation and storm processes. A moderate negative correlation in 2005 (ρ = −0.409, p ≈ 0.05) also indicates the persistent erosive effect of climatic forcing, albeit weaker. In contrast, the outcomes for 1995, 2010, and 2015 reflect weak and non-significant correlations, which suggests that shoreline dynamics in these years might have been controlled more by non-climatic processes like lower river discharge, trapping of sediment by dams, and tidal variability. As an interesting point, the highly significant and very strong positive correlation in 2020 (ρ = +0.812) reflects a change in system response since, accompanied by favorable climatic conditions as well as rehabilitation activities of mangroves post-2005, increased shoreline stability and localized accretion would have likely been promoted.

5. Discussions

5.1. Shoreline Transition in the Indus Delta

The Indus Delta, a vital and dynamic coastal ecosystem, has undergone significant shoreline transformations over the past decades due to both natural processes and human activities [30]. Our multi-decadal analysis quantitatively confirms a long-term trajectory of net shoreline erosion between 1990 and 2020, as evidenced by negative mean rates across all metrics as shown in Figure 8: an End Point Rate (EPR) of −29.94 m·year, a Net Shoreline Movement (NSM) of −246.17 m, and a Linear Regression Rate (LRR) of −29.5 m/year (Table 4). This trend was interrupted only by short-lived and localized episodes of accretion. Spatially, the DSAS results reveal a clear pattern: the most severe erosion was concentrated along the southern and western edges of the delta, particularly in the transects corresponding to the Wari and Khuddi creeks, where NSM values fell below −1800 m (Figure 6). In contrast, the primary zones of accretion (NSM up to +1404 m) were confirmed near the delta mouth and adjacent to active distributaries like Hajamro Creek (Figure 6).
The single most critical factor shaping the Indus Delta shoreline is the reduction in sediment supply from the Indus River. Historically, the river carried hundreds of millions of tons of sediment annually to its delta, replenishing mudflats, stabilizing tidal channels, and counteracting wave- and tide-driven erosion. However, extensive upstream regulation, including the construction of large reservoirs such as Tarbela and Mangla, as well as barrages like Kotri, Sukkur, and Guddu, has drastically curtailed both water discharge and sediment flux [31,32]. These structures divert freshwater for irrigation and hydropower, trapping sediments behind dams and reducing downstream delivery. The result is a chronic sediment deficit, leaving deltaic shorelines unable to rebuild naturally after erosional events. In geomorphological terms, deltas function as sediment-dependent systems: when inputs balance or exceed marine energy, shorelines prograde; when inputs decline, erosion dominates [33]. The Indus Delta illustrates this imbalance sharply, with most distributaries delivering insufficient sediment to maintain their coastal margins. This sediment deficit has led to a clear pattern of erosion, the overall trend across the Indus Delta shows a mix of shoreline retreat and advancement, with certain sections experiencing significant erosion, particularly along the southern and western edges, and others undergoing considerable accretion, especially near the delta mouth. EPR measures the annual rate of shoreline change between its initial and final positions, with negative values indicating erosion and positive values representing accretion [34]. In this study, the approximated average EPR of −29 m·year indicates an overall retreat, with extremes ranging from severe erosion at −252 m·year to localized accretion at 131 m·year. NSM, quantifying total shoreline displacement over the study period, highlights substantial variations in shoreline movement. The most eroded regions recorded values as low as −1810 m, while areas with notable accretion reached +1404 m, likely influenced by sediment deposition and wave activity. LRR, providing a long-term average rate of shoreline change through regression analysis, reveals a consistent erosion trend. The average LRR of −29 m·year reflects persistent shoreline retreat, smoothing out short-term fluctuations [34]. These changes are likely influenced by a combination of natural factors like sediment supply, wave and tidal forces, and human-induced activities such as damming and river channelization. The results emphasize the need for integrated coastal management to protect vulnerable areas from further erosion while enhancing sediment deposition in accretion regions.

5.2. Climatic Factors Affecting Shoreline Dynamics

Superimposed on this long-term sediment deficit are climatic drivers, particularly precipitation and wind speed [13,34]. Rainfall variability governs the amount of sediment delivered to the delta through distributaries and overbank flooding. In low-rainfall years, river discharge diminishes, further reducing sediment input. During such conditions, even moderate wave and tidal energy accelerates erosion because the system lacks replenishment material [33]. Conversely, high-rainfall years increase fluvial discharge and sediment availability, enabling accretionary processes as marine energy redistributes sediments across mudflats and tidal channels. This dynamic is acutely observed in the Indus Delta, where anthropogenic sediment starvation has heightened sensitivity to these climatic fluctuations [35]. This relationship is robustly quantified by our correlation analysis, which reveals that the system’s response has shifted fundamentally over time. In the early period (1990 and 2000), a strong negative correlation, as shown in Table 3 (rs = −0.68 and rs = −0.66, respectively), confirms that higher precipitation and wind energy directly intensified erosion, as evidenced by the peak erosion rates of that era. Specifically, strong winds generated higher wave energy that scoured the unprotected coast, while intense precipitation, instead of delivering significant sediment, may have led to channel-scouring flows that further destabilized the shoreline. This is consistent with a sediment-starved, mangrove-deficient coastline vulnerable to climatic forces.
Wind plays a dual role [36]. Strong southwesterly monsoon winds enhance wave energy and littoral drift, driving sediments eastward and deepening erosional hot spots, especially in the western creeks [37]. At the same time, wind-driven storm surges can deposit sediments inland if river discharge provides an adequate supply [38]. Thus, the direction and intensity of climatic forcing determine whether wind acts as an erosive or depositional agent. The correlation analysis substantiates that wind speed is a key driver of shoreline change, but its role has transformed, likely mediated by changes in mangrove cover and sediment availability [33]. However, in the most recent period (2020), this dynamic has reversed. The strong positive correlation (rs = 0.81, p < 0.0001) indicates that high rainfall and wind now promote accretion. In contrast, when rainfall increased and coincided with mangrove recovery, conditions were favorable for localized accretion.
The Indus Delta hosts one of the largest mangrove ecosystems in South Asia [39], yet its condition has fluctuated significantly over recent decades. Mangrove loss before 2005 was driven by salinity intrusion, reduced freshwater inflows, fuelwood harvesting, and pollution [40]. Rising temperatures, especially during peak summer months, lead to increased evaporation rates, elevating salinity levels in coastal waters. This has a detrimental effect on mangrove ecosystems, which act as natural barriers against erosion. This degradation removed a critical natural defense: mangrove roots stabilize sediments, enhance deposition by reducing current velocities, and dissipate wave energy [33]. Areas where mangroves were depleted became erosion-prone hotspots, with accelerated shoreline retreat. By contrast, mangrove rehabilitation programs initiated after 2005 improved ecological resilience in certain sectors of the delta [41]. We attribute the recent shift to the successful mangrove reforestation that occurred post-2005; the restored forests now effectively trap sediments delivered during intense rainfall periods, contributing to the stabilization of previously eroding areas. Newly established mangrove stands trapped sediments, facilitated mudflat formation, and offered partial protection against storms. The moderation of erosion rates observed in subsequent years coincides with these restoration efforts, highlighting the role of ecosystem-based approaches in delta management [41]. The statistical shift in climatic correlations aligns with the timeline of mangrove degradation and recovery. The pre-2005 decline left the coast exposed, as evidenced by the strong negative correlation of that era. Subsequent reforestation efforts have mitigated this vulnerability, fundamentally altering the shoreline’s response to climate change, as proven by the significant positive correlation in 2020. Hydrodynamic energy is a dominant shaping force in the Indus Delta [35]. The region experiences semi-diurnal tides up to 3 m [16]. These processes exert powerful erosive pressure, particularly during the summer monsoon when winds, waves, and tidal currents converge. The effect of these forces depends heavily on sediment availability [42]. In years of sediment scarcity, wave and tidal energy transport sediments offshore, deepening erosion. In years of sediment abundance, however, the same forces redistribute rather than remove sediments, spreading them across tidal creeks and mudflats, promoting localized accretion. This duality explains why some periods displayed partial stabilization despite the long-term erosional trajectory.
Global and local processes of relative sea-level rise further exacerbate shoreline retreat [43]. Rising sea levels, at an estimated rate of 1.1 mm·year, contribute to saltwater intrusion and shoreline retreat [16]. Although sea level rise was not a variable in our correlation analysis, it likely acts as a background stressor; its estimated rate of ~1.1 mm·year in the region contributes to a long-term increase in saline intrusion and tidal inundation, making the shoreline more susceptible to the climatic forces we measured. Thermal expansion of the oceans, coupled with the melting of glaciers, is raising global sea levels, while the Indus Delta simultaneously subsides due to sediment compaction and tectonic processes. This combination reduces land elevation relative to the sea, exposing deltaic areas to tidal inundation and saline intrusion. Even modest increases in sea level significantly alter the sediment balance by drowning low-lying areas, undermining agricultural productivity, and eroding mangrove margins. Low-lying areas are particularly vulnerable to inundation, accelerating land loss, and necessitating urgent mitigation measures to protect coastal communities. In addition, subsidence accelerates channel widening and creek erosion, intensifying shoreline instability. Beyond hydrology and climate, human activities amplify coastal vulnerability [44].
Taken together, the shoreline dynamics of the Indus Delta reflect a complex interplay of fluvial deficit, climatic forcing, ecological degradation, and marine energy regimes [45]. The system’s response is highly contingent: erosion dominates when sediment supply is scarce and wave–wind energy is high, whereas accretion becomes possible only when rainfall-driven sediment delivery and mangrove stability coincide. The contrasting patterns of erosion and accretion across different intervals highlight that the Indus Delta is not a uniformly eroding landscape but a dynamic mosaic of localized responses to broader forcing mechanisms. Western creeks, for example, remain erosion hotspots due to reduced sediment supply and strong littoral drift, while areas with active mangrove rehabilitation exhibit relative stabilization.

5.3. Human Activities and Shoreline Degradation

Our quantitative shoreline change results provide direct geomorphic evidence of the catastrophic sediment deficit induced by large-scale damming and irrigation diversions on the Indus River. The most severe erosion hotspots identified by our DSAS analysis, specifically the extreme retreat in the western side of the delta (NSM < −1800 m; LRR ≈ −170 m/year), are not randomly distributed. They are strategically located in areas that have been starved of the sediment once supplied by now-defunct or diminished distributaries. While the Indus River once built the delta with ~270 million tons of sediment annually, upstream infrastructure has reduced this load by over 80% [31,32]. Consequently, the natural hydrodynamic forces of tides and monsoon waves, which were once land-building agents [35,43], now act as potent erosive forces [42], relentlessly scouring the sediment-starved shorelines of these western creeks.
Furthermore, the spatial variation in erosion rates suggests the influence of different geomorphic and anthropogenic controls. The concentrated, severe erosion in the western sector (e.g., Wari Creek) aligns with the dual impact of maximal sediment deficit and direct exposure to the dominant south-westerly wind and wave energy of the Arabian Sea. In contrast, the relative stability or accretion noted in some eastern sections, such as near Hajamro Creek, coincides with zones reported in the literature to have higher mangrove coverage [15,41]. This spatial pattern provides a context for interpreting our correlation results, which reveal a fundamental temporal shift: A uniform climatic signal (e.g., high wind speed) was correlated with erosion in the early period (1990, 2000) but with accretion in the most recent period (2020). A plausible explanation for this reversal, supported by existing studies, is the large-scale mangrove rehabilitation programs initiated post-2005 [15,41]. We hypothesize that the maturation of these replanted forests has progressively enhanced their capacity to trap sediments and dissipate wave energy, thereby modulating the shoreline’s response to climatic forcing. Thus, human actions have not only created a regional sediment deficit but, through ecological interventions, have also subsequently re-engineered the delta’s vulnerability, transforming the role of natural hydrodynamic energy in different parts of the delta.

5.4. Integrated Mitigation Strategies

The findings of this study provide a robust, empirical basis for moving beyond generic recommendations to precise, targeted management actions in the Indus Delta. Our analysis dictates a dual-pronged strategy that addresses the root cause of degradation, the sediment deficit, while simultaneously fortifying natural defenses based on the observed shifts in shoreline resilience. The persistent long-term erosional trend, quantified by a mean LRR of −29.5 m·year, and the catastrophic retreat in specific hotspots like Wari Creek are direct geomorphic evidence of the sediment starvation caused by upstream dams. Therefore, the highest priority must be strategic sediment management, specifically advocating for managed sediment releases from existing reservoirs during the pre-monsoon period to target the most vulnerable western distributaries. Concurrently, the statistically significant reversal of the climate-shoreline correlation from strongly erosional to accretional provides delta-scale evidence that mangrove restoration can fundamentally alter physical processes. This finding justifies a precision rehabilitation approach, prioritizing the conservation and expansion of mangroves in the more stable eastern sectors, such as near Hajamro Creek, to consolidate their defensive function, while creating strategic buffers landward of western erosion fronts to dissipate energy. Crucially, these strategies are synergistic; managed sediment pulses would provide the substrate for successful mangrove establishment, which in turn would enhance sediment retention. This integrated, spatially explicit framework, directly justified by the quantified rates and relationships in this study, offers a viable pathway to help the delta system regain a dynamic equilibrium where natural energies can once again serve constructive, rather than predominantly erosive, roles.

5.5. Implications for Future Research

This study’s findings, particularly the non-linear shift in the shoreline’s response to climatic drivers, reveal critical gaps that should guide future research. While our correlation analysis identified a significant relationship reversal, the underlying processes are complex. Future efforts should therefore move beyond statistical correlation towards predictive modeling. The application of emerging machine learning techniques, such as Convolutional Neural Networks (CNN) and Artificial Neural Networks (ANN) as demonstrated in recent coastal studies [46,47], could powerfully integrate our observed rates of change (NSM, LRR) with the full suite of climatic and anthropogenic drivers to forecast future shoreline positions under different scenarios.
Furthermore, our reliance on satellite-derived shorelines highlights the need for enhanced sediment flow monitoring to directly quantify the primary variable sediment flux that our study identifies as the system’s master control. Finally, the high inter-annual variability in our EPR results suggests the system is highly sensitive to discrete events. Investigating the impact of extreme weather events on sediment resuspension and mangrove resilience is a critical next step to understand the deviations from the long-term erosional trend. Addressing these priorities will translate the patterns documented here into predictive tools for proactive delta management.

5.6. Methodological Considerations and Limitations

While our bootstrap assessment demonstrates that the overall erosion and accretion patterns are robust, it is important to acknowledge that the transect–shoreline angle deviations reported in this study (mean = 48.9°, median = 50.1°) are relatively high. Although previous DSAS documentation and field studies have indicated that the sign of shoreline change may be preserved up to angular deviations of ~60°, such large departures inevitably reduce spatial consistency and may introduce additional local uncertainty. Recent methodological contributions have emphasized the importance of minimizing angular deviation through improved baseline construction and the use of spline-based approaches for generating more orthogonal transects [48,49]. While the implementation of these advanced tools was beyond the scope of this work, referencing these developments situates our study within the broader context of ongoing methodological refinement. We therefore explicitly recognize transect orthogonality as a limitation of our approach and encourage future studies to explore refined baseline design strategies to further enhance spatial consistency and reduce uncertainty in shoreline change estimates.

6. Conclusions

This study provides a multi-decadal, geospatial assessment of shoreline dynamics in the Indus Delta, delivering two key contributions. Methodologically, it demonstrates the efficacy of integrating DSAS-based change detection with climatic correlation analysis to decipher complex deltaic behavior. Substantively, it reveals that the shoreline’s response to climatic drivers is not fixed but can be fundamentally altered by ecological state. The statistically significant shift from an erosion-dominated system to one where climate can promote accretion provides robust, empirical evidence for the efficacy of large-scale mangrove rehabilitation in stabilizing a sediment-starved coast. Consequently, effective management must prioritize integrated strategies that couple upstream sediment management with downstream ecological restoration.
The long-term retreat is the outcome of a severe and persistent sediment deficit caused by upstream dams and barrages, compounded by climatic variability, mangrove loss, strong wave-tidal forcing, and relative sea-level rise. The strong negative relationship between rainfall and erosion in 1990 and 2000, the correlations were strongly negative (r = −0.68 and r= −0.66, respectively), where (p < 0.0005 and p < 0.0008) reversed to a strong positive relationship with accretion by 2020 (rs = 0.81, p < 0.0001). These drivers act in combination: erosion intensifies when low rainfall and strong winds coincide with reduced sediment delivery and degraded mangrove cover, while accretion is possible only when rainfall-driven sediment inputs and mangrove stabilization counterbalance the effects of marine energy. This demonstrates that the mediating role of mangroves is transformative; they act as a natural buffer, but their past degradation drastically increased the system’s vulnerability.
The findings highlight that shoreline change in the Indus Delta is not uniform but reflects a mosaic of responses to interacting hydrological, climatic, ecological, and oceanographic processes. This variability is evidenced by the extreme spatial differences in our results, from a maximum accretion of +1404 m (NSM) to a maximum erosion of −1810 m (NSM) (see Figure 9). This variability underscores the delta’s vulnerability as well as its capacity for partial stabilization under favorable conditions, particularly where mangrove rehabilitation has been successful, as seen in the post-2005 period. However, areas like Wari Creek remain highly vulnerable, emphasizing the need for targeted, spatially explicit interventions.
By quantitatively linking these factors, this study advances a statistically validated, multi-factor approach to explain erosion and accretion patterns, filling a key gap in deltaic shoreline studies. The application of NDWI and MNDWI for shoreline extraction under high turbidity conditions further enhances methodological accuracy for monitoring such complex systems.
Nevertheless, some limitations remain, including the use of correlation rather than causal climatic modeling and the lack of in situ hydrodynamic or socioeconomic data. Future research should combine remote sensing with hydrodynamic modeling and socioeconomic analysis to strengthen resilience planning. Ultimately, this study not only documents the precarious state of the Indus Delta but also provides a scientific foundation and actionable insights for safeguarding its future.

Author Contributions

Conceptualization, H.B.; Methodology, H.B.; Software, H.B.; Investigation, H.B.; Writing—original draft, H.B.; Writing—review & editing, Z.H., N.A.K. and X.K.; Supervision, Z.H. All authors have read and agreed to the published version of the manuscript.

Funding

This study is supported in part by the National Key Research and Development Program of China (2021YFF0501302).

Data Availability Statement

The satellite data were used in this study were sourced from USGS Earth Explorer and Google Earth. The data were processed using ArcGIS 10.8 and Digital Shoreline Analysis System (DSAS) v5.1 software.

Conflicts of Interest

The authors declare no conflicts of interest.

References

  1. Addo, K.A.; Walkden, M.; Mills, J.P. Detection, measurement and prediction of shoreline recession. ISPRS J. Photogramm. Remote Sens. 2008, 63, 543–558. [Google Scholar] [CrossRef]
  2. Oyedotun, T.D. Shoreline geometry: DSAS as a tool for historical trend. Geomorphol. Tech. 2014, 3, 12. [Google Scholar]
  3. Wong, C.; Williams, C.; U, C.; Schelle, P.; J, P. World’s Top 10 Rivers at Risk. 2007. WWF International. Gland, Switzerland. Global Forest Resources Assessment 2020. Food and Agriculture Organization of the United Nations. Available online: https://www.researchgate.net/publication/23778568_World%27s_Top_10_Rivers_at_RiskFAO (accessed on 27 August 2024).
  4. Al-Tahir, R.; Ali, A. Assessing land cover changes in the coastal zone. Surv. Land Inf. Sci. 2004, 64, 107–112. [Google Scholar]
  5. Esmail, M.; Mahmod, W.E.; Fath, H. Assessment and prediction of shoreline change using multi-temporal satellite images and statistics: Case study of Damietta coast, Egypt. Appl. Ocean Res. 2018, 82, 274–282. [Google Scholar] [CrossRef]
  6. Siyal, A.A.; Solangi, G.S.; Siyal, P.; Babar, M.M.; Ansari, K. Shoreline change assessment of Indus delta using GIS-DSAS and satellite data. Reg. Stud. Mar. Sci. 2022, 53, 102405. [Google Scholar] [CrossRef]
  7. Neumann, B.; Vafeidis, A.T.; Zimmermann, J.; Nicholls, R.J. Future coastal population growth and exposure to sea-level rise and coastal flooding—A global assessment. PLoS ONE 2015, 10, e0118571. [Google Scholar] [CrossRef]
  8. Kummu, M.; De Moel, H.; Salvucci, G.; Viviroli, D.; Ward, P.J. Over the hills and further away from coast: Global geospatial patterns of human and environment over the 20th-21st centuries. Environ. Res. Lett. 2016, 11, 034010. [Google Scholar] [CrossRef]
  9. Thieler, E.R.; Himmelstoss, E.A.; Zichichi, J.L.; Ergul, A. Digital Shoreline Analysis System (DSAS) Version 4.0An ArcGIS Extension for Calculating Shoreline Change; U.S. Geological Survey Open-File Report 2008-1278; US Geological Survey: Reston, VA, USA, 2009.
  10. Wang, X.; Xie, S.; Zhang, X.; Chen, C.; Guo, H.; Du, J.; Duan, Z. A robust multi-band water index (MBWI) for automated extraction of surface water from Landsat 8 OLI imagery. Int. J. Appl. Earth Obs. Geoinf. 2018, 68, 73–91. [Google Scholar] [CrossRef]
  11. Özpolat, E.; Demir, T. The spatiotemporal shoreline dynamics of a delta under natural and anthropogenic conditions from 1950 to 2018: A dramatic case from the Eastern Mediterranean. Ocean Coast. Manag. 2019, 180, 104910. [Google Scholar] [CrossRef]
  12. Xu, H. Modification of normalised difference water index (NDWI) to enhance. Int. J. Remote Sens. 2006, 27, 3025–3033. [Google Scholar] [CrossRef]
  13. Milliman, J.D.; Farnsworth, K.L. River Discharge to the Coastal Ocean: A Global Synthesis; Cambridge University Press: Cambridge, UK, 2011. [Google Scholar] [CrossRef]
  14. Kidwai, S.; Amjad, S.; Akhtar, N. Coastal ecosystems of Pakistan: Statusand trends. Reg. Stud. Mar. Sci. 2019, 28, 100588. [Google Scholar]
  15. Food and Agriculture Organization of the United Nations. Global Forest Resources Assessment 2020; Food and Agriculture Organization of the United Nations: Rome, Italy, 2020. [Google Scholar]
  16. Asif, I.; Tabrez, A.; Tabrez, S. The Impact of Sea Level Rise on Pakistan’s Coastal Zones in A Climatic Change Scenario. In Proceedings of the 2nd International Maritime Conference, Karachi, Pakistan, 29–31 January 2008. [Google Scholar] [CrossRef]
  17. Khan, A.A.; Haredy, R.; Inam, A. Geochemistry and Sedimentary Sources of the Surface Sediments from the Continental Shelf off the Indus Delta, Pakistan. Int. J. Mar. Sci. 2020, 36, 61–74. [Google Scholar] [CrossRef]
  18. Kılar, H. Shoreline change assessment using DSAS technique: A case study on the coast of Meric Delta. Reg. Stud. Mar. Sci. 2022, 57, 1027–1037. [Google Scholar] [CrossRef]
  19. McFeeters, S. The use of the Normalized Difference Water Index (NDWI) in the delineation of open water features. Int. J. Remote Sens. 1996, 17, 1425–1432. [Google Scholar] [CrossRef]
  20. Himmelstoss, E.A.; Henderson, R.E.; Kratzmann, M.G.; Farris, A.S.; Weber, K.M. Digital Shoreline Analysis System (DSAS) Version 5.1 User Guide; U.S. Geological Survey Open-File Report 2021–1091; US Geological Survey: Reston, VA, USA, 2021; 104p. [CrossRef]
  21. Ji, L.; Zhang, L.; Wylie, B.; Rover, J. On the terminology of remote sensing image classification. Remote Sens. Environ. 2009, 113, 1343–1351. [Google Scholar] [CrossRef]
  22. Rokni, K.; Ahmad, A.; Selamat, A.; Hazini, S. Water featureextraction and change detection using multitemporal Landsat imagery. Remote Sens. 2014, 6, 4173–4189. [Google Scholar] [CrossRef]
  23. Kuleli, T.; Guneroglu, A.; Karsli, F.; Dihkan, M. Automatic detection of shoreline change on coastal Ramsar wetlands of Turkey. Ocean Eng. 2011, 38, 1141–1149. [Google Scholar] [CrossRef]
  24. Otsu, N. A threshold selection method. IEEE Trans. Syst. Man Cybern. 1979, 9, 62–66. [Google Scholar] [CrossRef]
  25. Konstantinou, A.; Scott, T.; Masselink, G.; Stokes, C.; Conley, D.; Castelle, B. Satellite-based shoreline detection along high-energy macrotidal coasts and influence of beach state. Mar. Geol. 2023, 462, 107082. [Google Scholar] [CrossRef]
  26. Ali Abd Al-Hameed, K. Spearman’s correlation coefficient in statistical analysis. Int. J. Nonlinear Anal. Appl. 2022, 13, 3249–3255. [Google Scholar] [CrossRef]
  27. Helsel, D.R.; Hirsch, R.M.; Ryberg, K.R.; Archfield, S.A.; Gilroy, E.J. Statistical Methods in Water Resources; U.S. Geological Survey Techniques and Methods, Book 4, Chapter A3; US Geological Survey: Reston, VA, USA, 2020; 458p. [CrossRef]
  28. Muñoz Sabater, J. ERA5-Land hourly data from 1950 to present. Clim. Data Store (CDS) 2019, 10. [Google Scholar] [CrossRef]
  29. Bandhawa, K.L.; Kumar, P.; Mishra, V. Evaluation of ERA5-Land and MERRA-2 reanalysis datasets for monitoring meteorological drought over South Asia. J. Hydrol. Reg. Stud. 2023, 47, 101395. [Google Scholar] [CrossRef]
  30. Giosan, L.; Syvitski, J.; Constantinescu, S.; Day, J. Climate change: Protect the world’s deltas. Nature 2014, 516, 31–33. [Google Scholar] [CrossRef]
  31. Basson, T.; Schultz, B.; González-Villareal, F. Final report of IPOE for review of studies on water escapages below Kotri Barrage. Hydraul. Eng. 2018. [Google Scholar] [CrossRef]
  32. Tunio, I.A.; Kumar, L.; Memon, A.; Mahessar, A.; Kandhir, A.; Memon, S. Sediment transport dynamics during a super flood: A case study of the 2010 super flood at the Guddu Barrage on the Indus River. J. Pre-Proof 2024, 39, 683–701. [Google Scholar] [CrossRef]
  33. Syvitski, J.P.M.; Saito, Y. Morphodynamics of deltas under the influence of humans. Glob. Planet. Change 2007, 57, 261–282. [Google Scholar] [CrossRef]
  34. Besset, M.; Billi, P.; Fazzini, M. Multi-decadal variations in delta shorelines and their relationship to river sediment supply: An assessment and review. Earth-Sci. Rev. 2019, 191, 1–24. [Google Scholar] [CrossRef]
  35. Giosan, L.; Clift, P.D.; Blusztajn, J.; Khan, M.A. On the control of climate- and human-modulated fluvial sediment delivery on river delta development: The Indus. Geology 2006, 34, 937–940. [Google Scholar]
  36. Komar, P.D. Beach Processes and Sedimentation, 2nd ed.; Prentice Hall: Upper Saddle River, NJ, USA, 1998. [Google Scholar]
  37. Anthony, E.J.; Smith, D.; Ramm, A. Monsoon wind influence on sediment transport and erosion in deltaic coasts. Coast. Eng. 2022, 177, 103997. [Google Scholar] [CrossRef]
  38. Williams, S.J.; Flanagan, L.B. Storm surge impacts on sediment deposition and coastal morphology. J. Coast. Res. 2020, 36, 789–803. [Google Scholar] [CrossRef]
  39. Giri, C.; Ochieng, E.; Tieszen, L.L.; Zhu, Z.; Singh, A.; Loveland, T.; Masek, J.; Duke, N. Status and distribution of mangrove forests of the world using earth observation satellite data. Glob. Ecol. Biogeogr. 2011, 20, 154–159. [Google Scholar] [CrossRef]
  40. Saifullah, S.M.; Ismail, A. Assessment of mangrove forests in the northwestern Indus Delta: Population structure and environmental characteristics. J. For. Res. 2015, 26, 123–134. [Google Scholar]
  41. Uddin, M.K.; Rahman, M.A.; Islam, M.R. Mangrove restoration and its impact on shoreline stabilization in deltaic regions. Wetl. Ecol. Manag. 2022, 30, 45–60. [Google Scholar]
  42. Nienhuis, P.H.; Leuven, J.R.; Winterwerp, J.C. Sediment redistribution under tidal and wave energy in deltaic systems. Mar. Geol. 2020, 429, 106282. [Google Scholar] [CrossRef]
  43. Syvitski, J.P.M.; Kettner, A.J.; Overeem, I.; Hutton, E.W.H.; Hannon, M.T.; Brakenridge, G.R.; Day, J.; Vörösmarty, C.; Saito, Y.; Saito, L.; et al. Sinking deltas due to human activities. Nat. Geosci. 2009, 2, 681–686. [Google Scholar] [CrossRef]
  44. Tessler, Z.D.; Vörösmarty, C.J.; Grossberg, M.; Gladkova, I.; Aizenman, H.; Syvitski, J.P.M.; Foufoula-Georgiou, E. Profiling risk and sustainability in coastal deltas of the world. Science 2015, 349, 638–643. [Google Scholar] [CrossRef] [PubMed]
  45. Anthony, E.J. Wave influence in the construction, shaping, and destruction of river deltas: A review. Mar. Geol. 2015, 361, 53–78. [Google Scholar] [CrossRef]
  46. Khan, A.R.; Ab Razak, M.S.B.; Yusuf, B.B.; Shafri, H.Z.B.M.; Mohamad, N.B. Future prediction of coastal recession using convolutional neural network. Estuar. Coast. Shelf Sci. 2024, 299, 108667. [Google Scholar] [CrossRef]
  47. Khan, A.R.; Ab Razak, M.S.B.; Yusuf, B.B.; Shafri, H.Z.B.M.; Mohamad, N.B. Harnessing artificial neural networks for coastal erosion prediction: A systematic review. Mar. Policy 2025, 178, 106704. [Google Scholar] [CrossRef]
  48. Scala, P.; Manno, G.; Lo Re, C.; Ciraolo, G. Update 2.0 to Coastal dynamics analyzer (CDA): A QGIS plugin for transect and area based analysis of coastal erosion. SoftwareX 2025, 30, 102170. [Google Scholar] [CrossRef]
  49. Gómez-Pazo, A.; Payo, A.; Paz-Delgado, M.V.; Delgadillo-Calzadilla, M.A. Open Digital Shoreline Analysis System: ODSAS v1.0. J. Mar. Sci. Eng. 2022, 10, 26. [Google Scholar] [CrossRef]
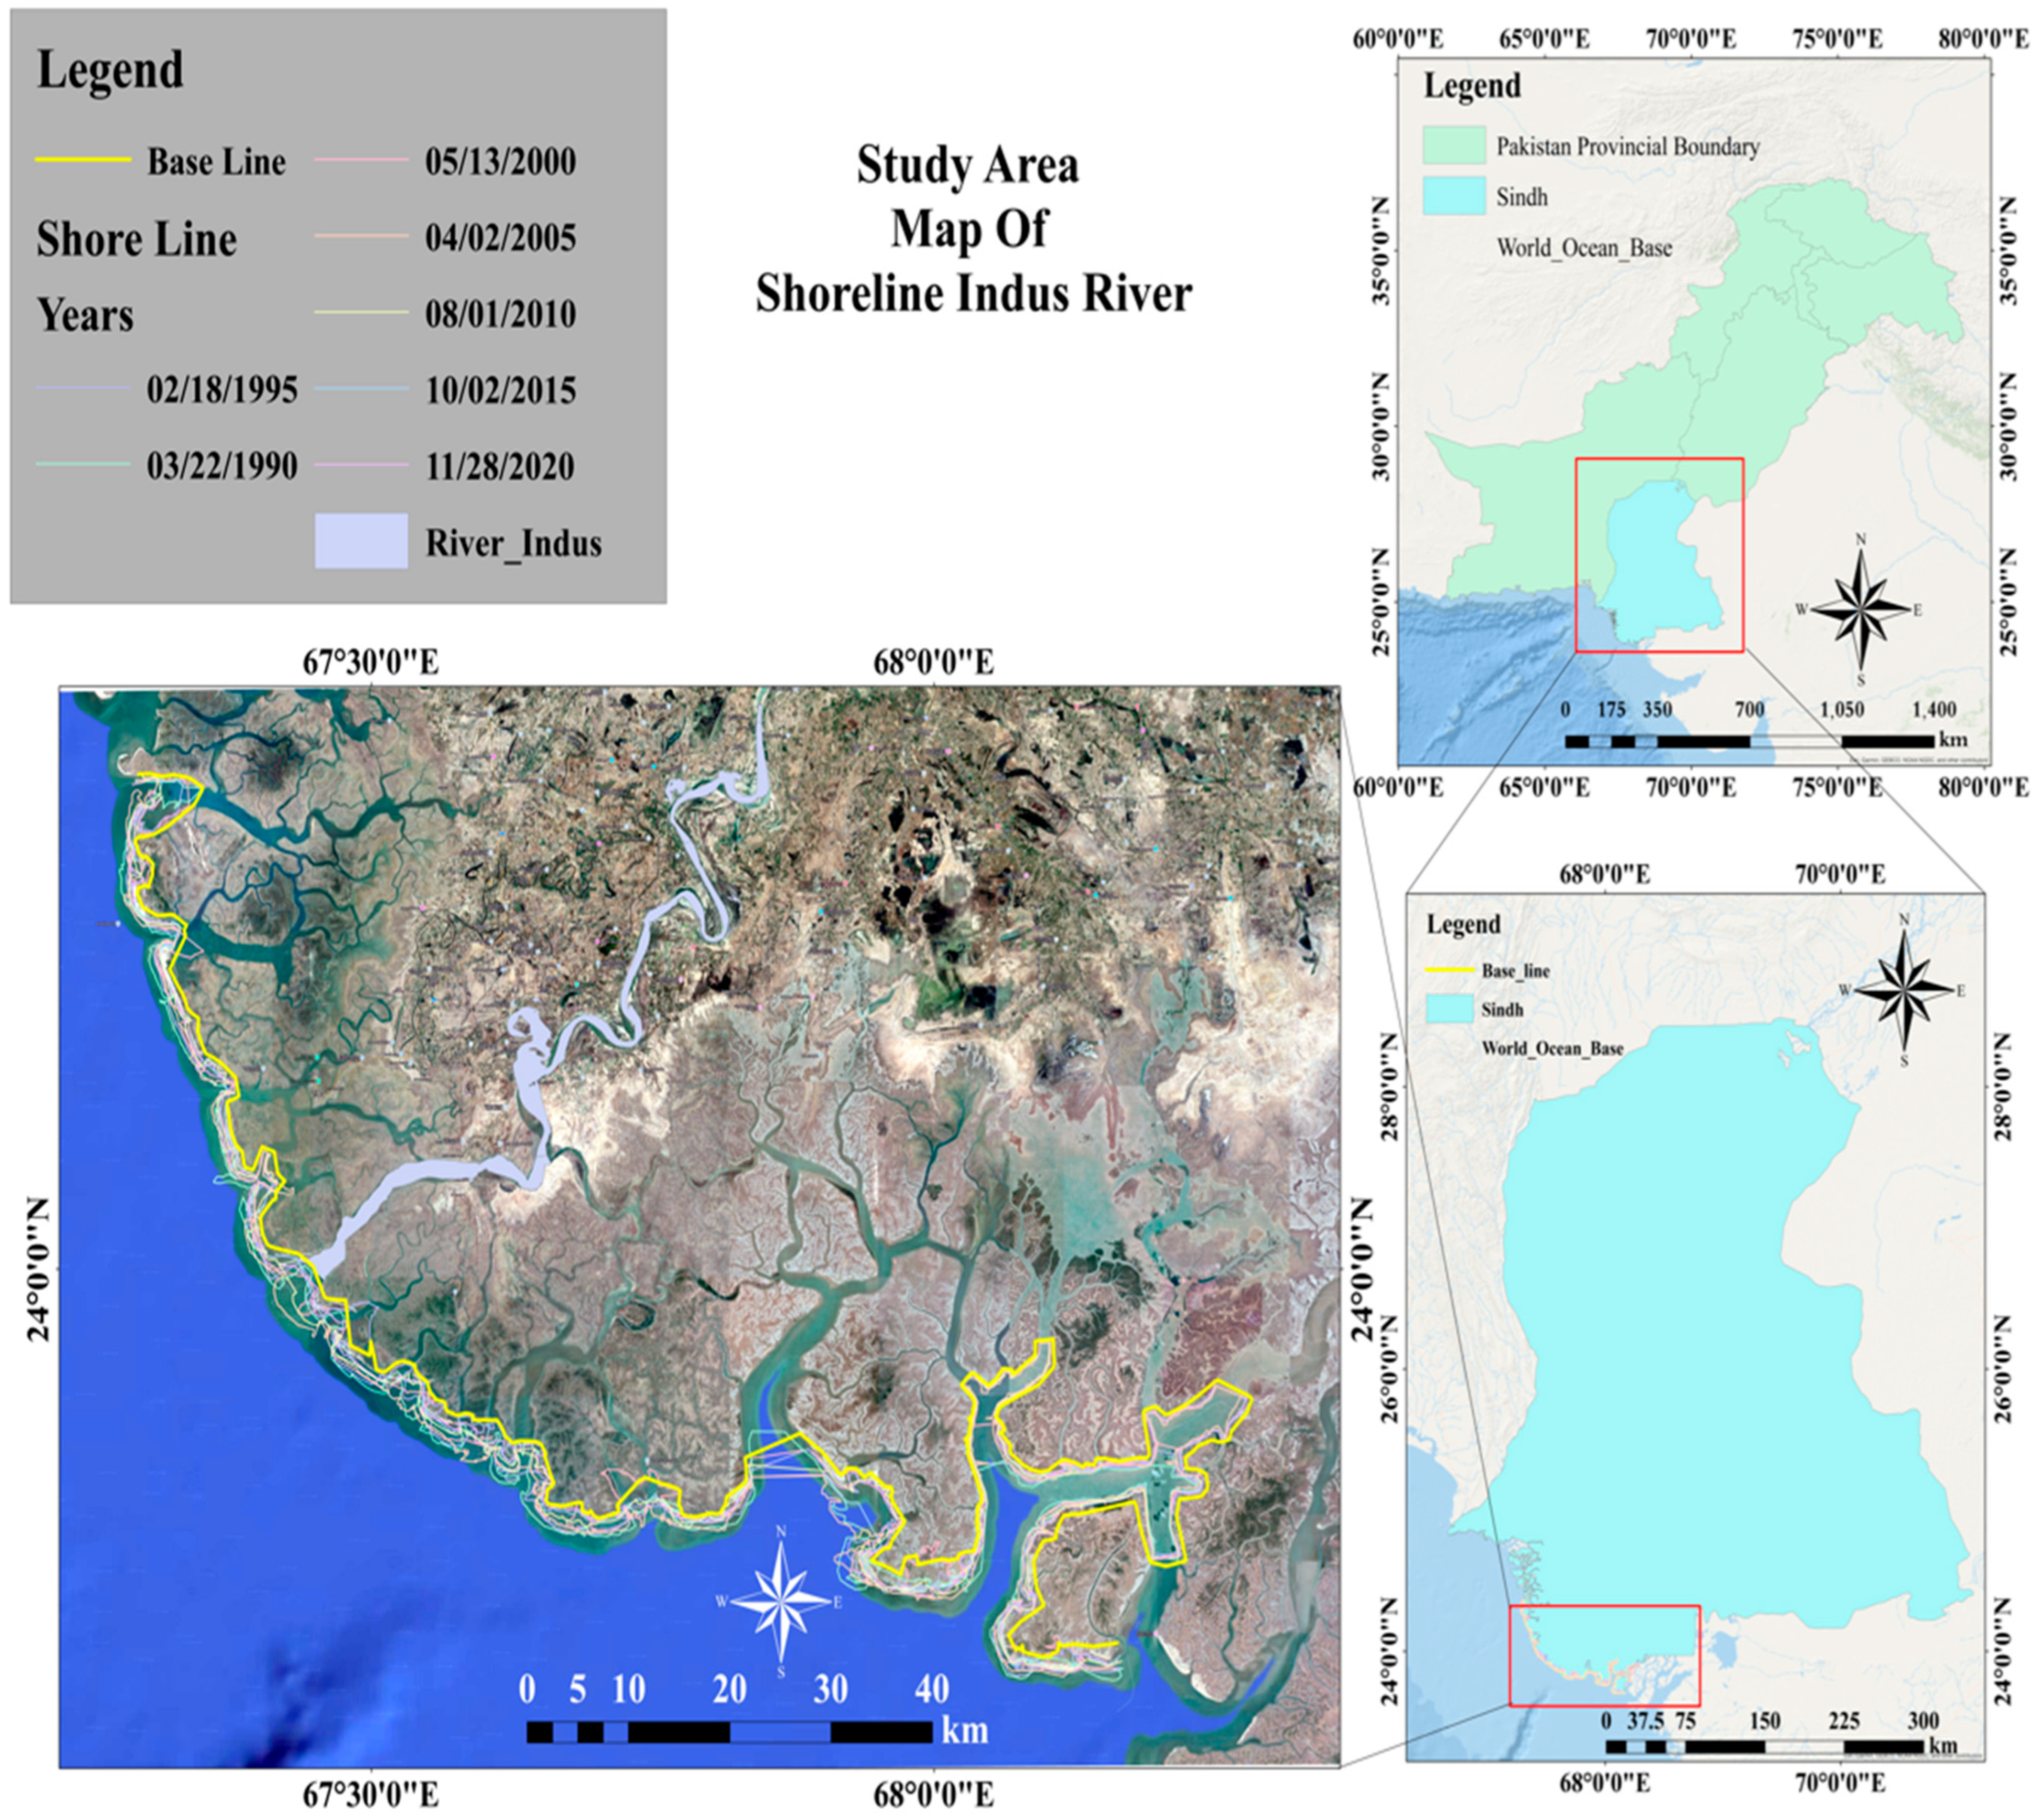
Figure 1. Study area map of the Indus River shoreline (The inset maps highlight the study area within Pakistan and Sindh province, providing regional context for shoreline change analysis).
Jmse 13 01986 g001
Figure 2. DSAS configuration and transect layout of Indus Delta (Shoreline positions, baselines, and transects across the Indus Delta (1990–2020). Wari and Khajar creeks are shown separately as key erosion hot spots where shoreline retreat is most pronounced).
Jmse 13 01986 g002
Figure 3. The methodology of Shoreline Variation Analysis.
Jmse 13 01986 g003
Figure 4. The left side shows the Binary Ratio Image, and on the right side are Landsat Temporal Images in a False Color Band composite.
Jmse 13 01986 g004
Figure 5. End Point Rate (EPR) of the shoreline changes calculated for the six periods: (a) 1990–1995; (b) 1995–2000; (c) 2000–2005; (d) 2005–2010; (e) 2010–2015; and (f) 2015–2020.
Jmse 13 01986 g005
Figure 6. Net shoreline movement (NSM) of the shoreline changes calculated for the six periods: (a) 1990–1995; (b) 1995–2000; (c) 2000–2005; (d) 2005–2010; (e) 2010–2015; and (f) 2015–2020.
Jmse 13 01986 g006
Figure 7. Linear Regression Rate (LRR) of the shoreline changes calculated for the six periods: (a) 1990–1995; (b) 1995–2000; (c) 2000–2005; (d) 2005–2010; (e) 2010–2015; and (f) 2015–2020.
Jmse 13 01986 g007
Figure 8. Shoreline change analysis of the Indus Delta from 1990 to 2020. (a) End Point Rate (EPR, m·year−1), (b) Net Shoreline Movement (NSM, m), and (c) Linear Regression Rate (LRR, m·year−1). Each panel shows temporal variations in shoreline dynamics, highlighting areas of erosion (blue) and accretion (red) across successive five-year intervals. Positive values indicate shoreline advance (accretion), while negative values indicate shoreline retreat (erosion).
Jmse 13 01986 g008
Figure 9. EPR, NSM, and LRR shoreline change statistics of the Indus Delta from 1990 to 2020.
Jmse 13 01986 g009
Table 1. Characteristics of satellite images used in this study.
Acquisition DateEstimated Number of Images UsedSensorPath/RowBands UsedWavelength (µm)Spatial Resolution (m)
22/03/19905–7Landsat 5 TM152/043Green (B2), NIR (B4), SWIR1 (B5), Red (B3)0.52–0.60; 0.76–0.90; 1.55–1.75; 0.63–0.6930
18/07/19955–7Landsat 5 TM152/043Green (B2), NIR (B4), SWIR1 (B5), Red (B3)0.52–0.60; 0.76–0.90; 1.55–1.75; 0.63–0.6930
13/05/20005–7Landsat 5 TM152/043Green (B2), NIR (B4), SWIR1 (B5), Red (B3)0.52–0.60; 0.76–0.90; 1.55–1.75; 0.63–0.6930
02/04/20055–7Landsat 5 TM152/043Green (B2), NIR (B4), SWIR1 (B5), Red (B3)0.52–0.60; 0.76–0.90; 1.55–1.75; 0.63–0.6930
01/08/20108–10Landsat 5 TM152/043Green (B2), NIR (B4), SWIR1 (B5), Red (B3)0.52–0.60; 0.76–0.90; 1.55–1.75; 0.63–0.6930
02/10/201510–12Landsat 8 OLI152/043Green (B3), NIR (B5), SWIR1 (B6), Red (B4)0.53–0.59; 0.85–0.88; 1.57–1.65; 0.64–0.6730
28/08/202010–12Landsat 8 OLI152/043Green (B3), NIR (B5), SWIR1 (B6), Red (B4)0.53–0.59; 0.85–0.88; 1.57–1.65; 0.64–0.6730
Table 2. Key Metrics for Shoreline Change Analysis.
MetricDescriptionUsage for Indus DeltaInterpretation
Net Shoreline Movement (NSM)Calculates the overall distance a shoreline has moved over different points. It calculates over time the cumulative impacts of coastline change, therefore measuring both erosion and accretion. Helps determine areas of the delta that are undergoing significant shoreline shifts.Positive values indicate shoreline advance (accretion); negative values indicate shoreline retreat (erosion).
End Point Rate (EPR)Calculates the annualized rate of shoreline movement by dividing the NSM by the time between the earliest and latest shoreline positions. It provides a simple, average rate of change per year.Provides a straightforward view of the rate of erosion/accretion in the delta’s segments over the studied period.Higher positive values indicate rapid accretion, while higher negative values indicate rapid erosion.
Linear Regression Rate (LRR)Uses a linear regression model to fit a trend line across various coastline places, computing the change rate as the slope of this line. Less responsive to outliers and smooths short-term fluctuates.Provides a robust overall trend of shoreline change across multiple positions, ideal for areas with episodic events or irregular shorelines, like the delta.Positive values indicate overall shoreline advance; negative values indicate shoreline retreat, making it a robust method for analyzing dynamic environments.
Digital Shoreline Analysis System (DSAS)An ArcGIS tool extension that automates shoreline change calculations by generating transects across coastline positions and calculates metrics like NSM, EPR, and LRR.Provides a consistent framework to calculate and analyze shoreline changes across various delta segments.DSAS enables reliable, repeatable, and spatially consistent analysis essential for monitoring and managing coastal dynamics in regions like the Indus Delta.
Table 3. Spearman’s rank correlation coefficients (ρ) between shoreline change rates (EPR) and climatic variables (precipitation, wind speed) in the Indus Delta (1990–2020).
YearSpearman’s ρ (Rs)p-Value
1990−0.6790.00051
1995+0.1860.408
2000−0.6630.00076
2005−0.4090.059
2010−0.1880.402
2015−0.1810.419
2020+0.812<0.00001
Negative r values indicate an inverse relationship (erosion-dominated conditions), whereas positive r values indicate a direct relationship (accretion-dominated conditions).
Table 4. Statistical results along the Indus Delta from 1990 to 2020 based on the metrics End Point Rate (EPR, m.year−1), Net Shoreline Movement (NSM, m), and Linear Regression Rate (LRR, m.year−1).
Statistical Result from 1990–2020
StatisticsEPR(m·year−1)NSM(m)LRR(m·year−1)
Average−29.94−246.17−29.5
Max.131.61404.1676.71
Min.−252.79−1810.37−173.09
Standard Deviation82.04810.2159
Disclaimer/Publisher’s Note: The statements, opinions and data contained in all publications are solely those of the individual author(s) and contributor(s) and not of MDPI and/or the editor(s). MDPI and/or the editor(s) disclaim responsibility for any injury to people or property resulting from any ideas, methods, instructions or products referred to in the content.