Abstract
With the development of offshore wind power towards deep-sea areas, the offshore valve tower, as a key facility of offshore wind farms, plays a vital role in ensuring the stable operation of the system. To investigate its dynamic response characteristics under seismic loading, a 1:25 physical test model of the valve tower was constructed based on the gravity–elasticity similarity principle. Acceleration responses at the first deck of a 1:65 scale offshore converter platform model were obtained through shaking-table tests and applied as base excitation to the valve tower model. The experimental results reveal that the frequency domain response of the valve tower transitions from high-frequency dominance at the base to low-frequency dominance at the top, with the structural weak link located at the mid-connection between the front and rear sub-towers. The fundamental frequency of the valve tower is 3.92 Hz, and the average damping ratio is 3.21%. The shake table test of the converter valve tower was verified using the gravity–elasticity similarity law, effectively reproducing the seismic response characteristics of the prototype. This provides crucial data for seismic response spectrum analysis, identifies structural weaknesses, and offers guidance for the design of more earthquake-resistant offshore valve towers, thus enhancing the safety of deep-sea wind farms.
1. Introduction
With the continuous growth of the global economy, energy demand is steadily increasing. Due to its sustainable wind energy resources and high-power generation efficiency, offshore wind power has rapidly developed in recent years, with a clear trend of extending from nearshore to deep-sea areas [1]. To achieve long-distance grid connections, flexible direct current (DC) transmission technology has become a key means of linking offshore wind farms to the onshore power grid [2,3]. However, regions in China that are rich in wind energy resources are mostly located in areas with frequent seismic activity, and the risk of earthquake-induced damage to key electrical equipment, such as valve towers, is becoming increasingly prominent [4,5]. Given the sensitivity of offshore electrical equipment to seismic effects, in-depth research on the structural dynamic characteristics under earthquake loads is of great significance for ensuring the safe operation of offshore wind farms [6].
In recent years, many scholars have conducted extensive research on the dynamic response of valve towers under seismic loads [7,8]. In seismic performance analysis, finite element analysis (FEA), response spectrum methods, and shaking-table tests are the most commonly used approaches. For example, Ding et al. [9] used the finite element method to study the modal characteristics and dynamic response of ±500 kV flexible DC valve towers under various seismic excitations, finding that their low-frequency characteristics make them prone to resonance. He et al. [10] used the response spectrum method to analyze the seismic response of flexible DC valve towers, finding that they exhibit good seismic performance. Zhang et al. [11] validated the effectiveness of seismic analysis methods for ultra-high voltage DC valve towers through shaking-table tests. Additionally, Zhang et al. [12] employed FEA with modal and time-history analyses, demonstrating that natural frequencies, mode shapes, and coupling effects critically influence overall seismic performance. These studies collectively underscore the importance of tailored analytical and experimental approaches to enhance the seismic resilience of valve towers.
Despite extensive work on the electrical performance of single onshore valve towers [13,14,15], the system-level seismic behavior of their supporting structures—whose overall stiffness is relatively low—has received comparatively less attention, making them vulnerable under strong dynamic excitation such as earthquakes [16]. For suspended single-tower configurations, Sun et al. [17] established a finite element model for a suspended single-tower converter valve and calculated its seismic response through modal analysis and response spectrum methods, finding that horizontal swinging and torsional modes have a significant impact on the seismic response. In terms of seismic design for valve tower, Yang et al. [18] established a finite element model of the 800 kV thyristor valve and its hall, introducing a restraint system consisting of rods, springs, and viscous dampers, and reducing the horizontal displacement of the valve through optimized design parameters, thereby improving its seismic resilience. Tu et al. [19] numerically investigated the dynamic response of supported flexible DC valve towers and explored lead–rubber bearings for isolation, but the mitigation effect proved limited. Xiao et al. [20] proposed installing dampers between the valve tower and the valve hall, and demonstrated that this configuration provides a measurable seismic-mitigation effect. Extending to offshore contexts, Zheng et al. [21] proposed enhancing the seismic resistance of ±500 kV offshore flexible DC valve towers through lightweight design and structural optimization. Lan et al. [22] used a simplified finite element model to evaluate the impact of platform mass and stiffness on the dynamic response of valve towers under the combined action of waves and earthquakes.
Overall, existing investigations on the structural dynamic response of offshore platforms and equipment have primarily concentrated on the overall safety of converter platforms, with particular emphasis on their performance under seismic loading [23,24,25] and extreme wind and wave conditions [26]. Structural integrity has been the top priority in these studies [27]. In contrast, investigations into valve towers have largely centered on suspended configurations or individual onshore towers under seismic excitation, relying on analytical methods and design approaches originally developed for onshore platforms [28]. Nevertheless, most offshore converter platforms currently employ supported valve towers, whose bases are anchored to the first deck of the platform. Compared with their onshore counterparts, which are directly embedded into the ground, supported valve towers exhibit markedly different stiffness characteristics. Under the combined influence of complex marine environments and seismic loads, the local flexibility of these valve towers can exert a significant effect on the natural frequencies of the equipment and its auxiliary structures [29]. Accordingly, experimental and analytical studies on the seismic dynamic response of valve towers in offshore converter platforms are essential. Such studies not only enable a deeper understanding of the dynamic transfer mechanisms between the platform and the equipment but also serve to fill an important gap in the existing body of research.
This study established a 1:25 scale physical test model of a valve tower based on the elasticity–gravity similarity principle. Using the shaking-table test results of a 1:65 scale offshore converter platform model, the acceleration time-history response at the first deck was extracted and applied as the base excitation load for the valve tower model. Shaking-table experiments were then performed to investigate the structural dynamic behavior. We analyzed the tower’s acceleration and strain responses, with particular attention to its characteristics under different seismic loading conditions. Furthermore, the effects of earthquake motion amplitude, spectral characteristics, and the structural properties themselves on the dynamic response were examined. The research findings aim to provide both theoretical support and experimental references for the seismic design of offshore valve towers.
2. Experiments
2.1. Similarity Criterion
For the converter platform subjected to seismic loading, the primary vibration mode of each component is bending. To ensure similarity in inertial forces, elastic restoring forces, and applied external forces, the model fabrication must first satisfy the elastic force similarity law [30,31]:
where λ, λρ, λA, λt, λu, λE, and λI represent the geometric similarity ratio, mass density ratio, cross-sectional area ratio, time scale ratio, deformation ratio, elastic modulus ratio, and moment of inertia ratio, respectively.
In the case of bending vibration of structural members, it is not necessary to strictly maintain complete geometric similarity of all dimensions. The cross-sectional size requirements can be relaxed, provided that the cross-sectional stiffness similarity is preserved:
where λr is the radius of gyration scale ratio.
The Froude number is the ratio of inertial force to gravity. Thus, Froude number similarity represents the similarity relationship between the inertial force and gravity, which is expressed as follows [32]:
where λv is the speed scale.
Considering the acceleration scale is λg = 1,
When simultaneously satisfying gravity similarity, the relationship can be expressed as follows:
Combining Equations (2) and (4), and simultaneously satisfying elastic similarity and Froude number similarity, the gravity–elastic force similarity can be given as follows:
2.2. Physical Model
In this study, the prototype structure was made of steel, with an elastic modulus of 206 GPa. The model components were fabricated from plexiglass (acrylic), whose dynamic elastic modulus is 3.91 GPa. Accordingly, the modulus scaling factor is 52.69, and the sectional radius-of-gyration ratio is 17.22. A valve tower model was constructed at a geometric scale of 1:25. The longitudinal dimensions of the structural members strictly followed the geometric scale, while the radius of the tubular cross-sections was determined according to the moment-of-inertia similitude to faithfully reproduce the elastic response of the prototype. The structural mass was scaled by the mass similitude ratio. For non-structural masses—such as equipment weight—scaling followed the load similitude ratio. Because the model material differs from the prototype, lead blocks and lead rings were employed as counterweights to adjust the mass of each component. Based on the geometric scale and the radius-of-gyration scale, other similitude parameters can be derived. Table 1 summarizes the similarity relations for the fundamental parameters and illustrates several cross-section-related similarity relations using the valve tower members as an example.

Table 1.
Similarity ratios for basic parameters of model design.
The physical model of the valve tower is shown in Figure 1. After scaling, the valve tower model has a total height of 506.4 mm, a length of 467.2 mm, a width of 176.7 mm, and a total weight of 23 kg. A numerical model of the valve tower was built in advance. Measurement points were chosen based on the results of the numerical model. The selection considered stress distribution and vibration modes from the structural design. To monitor the dynamic response of key structural regions, measurement points J1–J2 are located on the lower legs to capture high-stiffness responses; J4–J6 are placed in the midsection to focus on the stiffness transition zones where vibration tends to concentrate; and J3 is positioned at the upper part to monitor low-frequency responses induced by the mass of heavy equipment. This arrangement ensures comprehensive data acquisition and covers the different structural characteristics of the valve tower. The measurement point locations of the various sensors are shown in Figure 2.
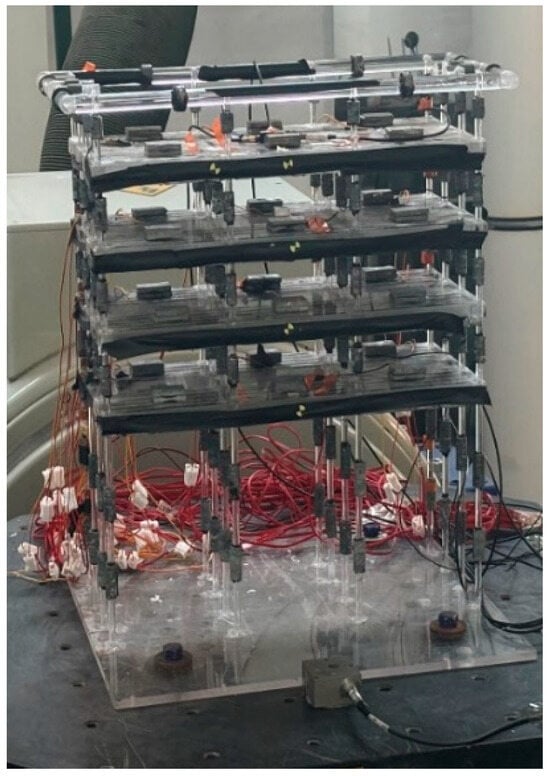
Figure 1.
Schematic diagram of the structural test model of the valve tower equipment.
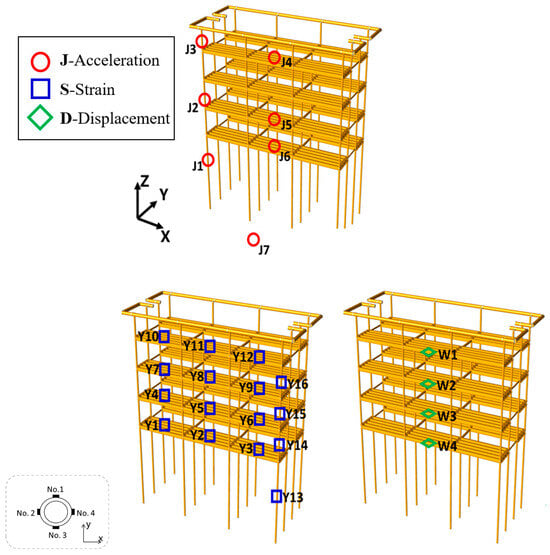
Figure 2.
Schematic diagram of sensor position layout.
The physical quantities measured in the experiment included acceleration, strain, and displacement at critical positions of the upper valve tower, as well as strain on the main piles of the lower section. An NI data acquisition system from the United States, in combination with strain gauges, was employed to record strain data at key structural locations. Acceleration responses at important structural positions were measured using accelerometers with an accuracy of up to 0.3% and a measurement frequency of up to 1000 Hz, ensuring high stability and strong anti-interference capability. Displacement responses were obtained through the FZ-Motion optical motion capture system. The FZ-Motion cameras were equipped with high-precision, high-speed imaging sensors, providing a maximum resolution of 12 megapixels, a working distance of up to 40 m, and a maximum frame rate of 500 FPS.
2.3. Test Conditions
Offshore converter platforms typically install supported valve towers on the first deck. Under seismic excitation, the transmission mechanism of the structural dynamic response is such that the external excitation first acts on the platform’s supporting piles, then propagates upward through the jacket and beam structural system, and finally reaches the bottom connection of the valve tower. In this study, a 1:65 scale overall model of an offshore converter platform was constructed, incorporating the main structural components, including piles, beams, and the jacket (see Figure 3). The electrical platform of the converter station is supported by pile foundations. However, accurately characterizing soil properties in laboratory tests is challenging, and the complexity of seismic loading further complicates direct simulation of pile–soil interaction. Therefore, a simplified modeling approach was adopted in this study. Specifically, the equivalent pile method was employed to represent the pile–soil interaction of the converter station. A finite element model was first established, in which the nonlinear behavior between the piles and the surrounding soil was captured using the p–y curve method. Subsequently, the equivalent pile length was determined by calibrating the model under the constraint of matching the fundamental frequency of the structure, thus establishing the relationship between the equivalent pile length and pile diameter. The analysis indicates that the equivalent pile length for the electrical platform model is seven times the pile diameter. In the experimental setup, the platform piles were rigidly fixed to the shaking table using two acrylic plates to ensure stability. The physical model adopted an eight-deck structural arrangement, with the jacket section having a total height of 2.4 m and an overall model mass of 377 kg. Through a white-noise sweep test and data processing using the half-power bandwidth method, the overall structural damping ratio of the offshore converter platform was measured to be 2.11%.
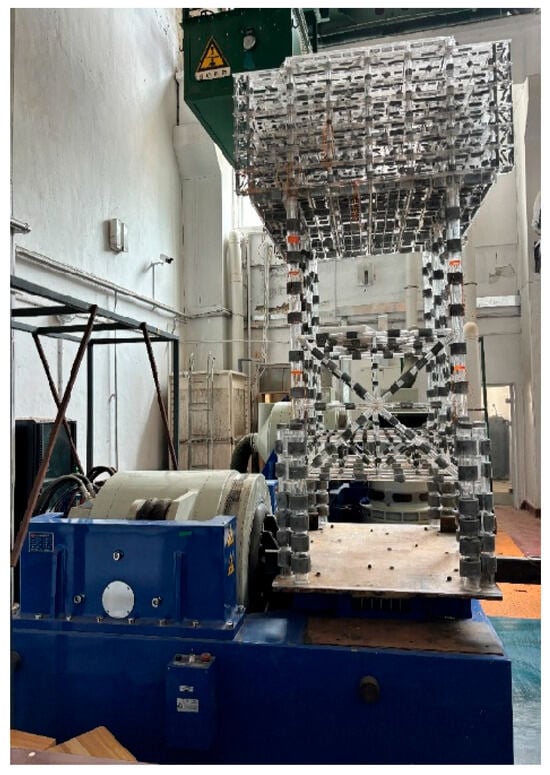
Figure 3.
Offshore converter platform.
In accordance with the China Classification Society (CCS) design code [33] and the site-specific seismic characteristics of the converter platform, representative ground-motion inputs were selected. The inputs comprised four natural records from the PEER database (RSN913_BIGBEAR, RSN3456_CHICHI, RSN2474_CHICHI03, and RSN1585_CHICHIT) and one artificial record generated to match the CCS design response spectrum (“CCS spectrum”). The peak ground acceleration (PGA) of all records was normalized to 0.10 g, 0.15 g, 0.20 g, and 0.25 g and applied in the X (longitudinal) direction of the electrical platform model. The response spectra of these records deviate from the CCS design response spectrum by less than 20%. The input seismic wave conditions are summarized in Table 2.

Table 2.
Seismic wave operating conditions.
The measured acceleration dynamic response values at the first-deck level of the converter station platform were extracted and applied as the bottom excitation loads for the valve tower. The selected measurement locations on the first deck of the valve tower platform are shown in Figure 4. The condition name “A1-1” denotes the test at measurement L1 under the action of the A1 seismic wave, with other conditions named in the same manner. The experimental conditions for the valve tower equipment are listed in Table 3.
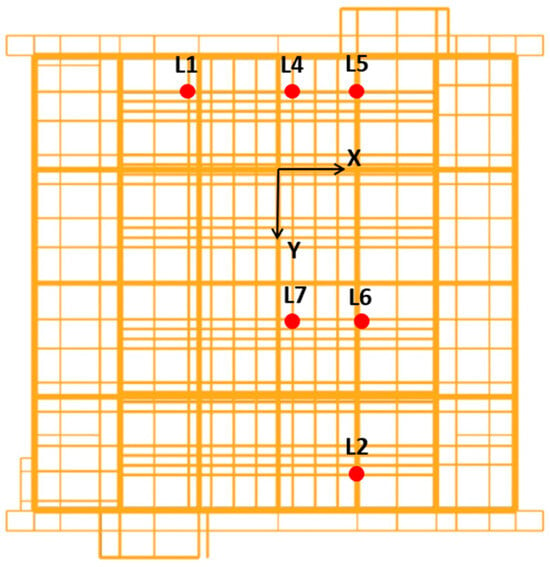
Figure 4.
Schematic diagram of the locations (L1–L7) where the input acceleration values were applied on the valve tower.

Table 3.
Excitation test conditions for valve tower equipment.
3. Results and Discussion
Before applying the seismic wave conditions, a modal test of the model was first conducted to determine its natural frequencies and damping parameters. Subsequently, tests were carried out according to the conditions listed in Table 3. Under this set of conditions, acceleration, strain, and displacement response data of the valve tower were collected. The test results were then processed to generate time-history curves, peak value variation plots, and other related graphs in order to analyze the dynamic response characteristics of the valve tower under seismic excitation.
3.1. Dynamic Characteristics of the Model
In the shaking-table test, the physical model of the valve tower was firmly connected to the table surface via a rigid base plate. A unidirectional (X-direction) excitation was applied, with a white-noise input signal having a peak acceleration of 0.08 g, while acceleration response data from all measurement points were collected simultaneously. Based on power spectral density analysis, Table 4 summarizes the characteristic frequencies corresponding to the acceleration response spectrum peaks at each measurement point. The results indicate that the fundamental frequency of the test structure in the X-direction is 3.92 Hz, and the characteristic frequency of the second vibration mode is 50.10 Hz.

Table 4.
Peak frequencies of the acceleration power spectrum at different positions of the valve tower equipment.
Based on the structural acceleration response data collected under white-noise excitation, a spectral analysis was conducted to examine the dynamic response characteristics at each measurement point. The power spectral density function of the acceleration response at each point was calculated, and the half-power bandwidth method was applied for parameter identification, yielding the damping parameters for each vibration mode of the structure, as shown in Table 5. The analysis results indicate that, for X-direction vibration, the average damping ratio of the first mode of the test structure is 3.21%.

Table 5.
The first-order vibration mode damping ratio of the valve tower structure.
3.2. Effect of Seismic Intensity on Structural Response
The peak acceleration response of the structure was the maximum acceleration response of the structure under the action of the corresponding seismic wave, which is an important index to reflect the seismic response of the structure. With the increase in input peak ground acceleration, the peak accelerations at all measurement points of the valve tower show a linear growth trend (see Figure 5). This effect is particularly evident in the upper equipment section: when the PGA increases from the lowest to the highest test value, the response increment at the tower-top measurement point is significantly greater than that in the lower leg section. Taking the L4 point as an example, under two different seismic wave loadings (the CCS spectrum wave and the RSN913_BIGBEAR wave) with peak values of 0.1 g, 0.15 g, 0.2 g, and 0.25 g, respectively, the overall growth trends are generally consistent. However, in the high-PGA range, the former exhibits slightly higher peak values than the latter.
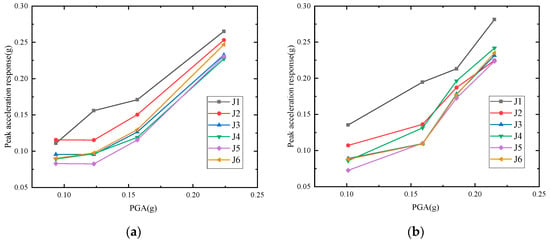
Figure 5.
Variation in peak acceleration at L4 point under different PGAs: (a) results under CCS artificial seismic wave; (b) results under RSN913_BIGBEAR earthquake record.
As the base acceleration increases, the stress in the valve tower model also increases. Taking the strain measurement point Y14 at the valve tower structure located at position 4 as an example, the experimental conditions under two seismic loads—CCS wave and RSN913_BIGBEAR wave, with different peak ground accelerations, were studied. Figure 6 shows how the peak strains measured by four strain gauges arranged around the pile leg at the Y14 measurement point change with the base acceleration. As seen in the figure, strain gauges 2 and 4, which are aligned with the loading axis in the X-direction, exhibit the largest and very similar strain responses, indicating that these gauges experience greater stress along the loading direction. In contrast, strain gauge 3, which is oriented perpendicular to the loading direction, shows the smallest strain response, suggesting lower stress in that direction. The strain recorded by strain gauge 1 falls between the two, primarily due to its different mounting orientation on the pile leg, causing a different strain distribution, with the maximum strain concentrated along the principal loading direction. This strain distribution pattern clearly reflects the directional sensitivity of the structural response, indicating that the valve tower structure’s strain response varies significantly in different loading directions, further demonstrating the directionality dependence of the structure’s response to seismic loads.
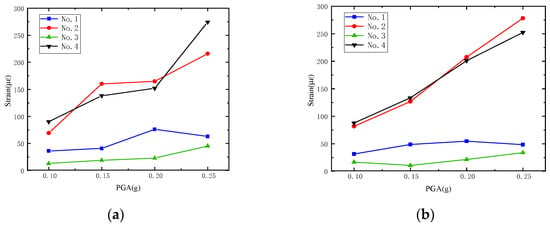
Figure 6.
Variation in peak acceleration at Y14 point under different PGAs: (a) results under CCS artificial seismic wave; (b) results under RSN913_BIGBEAR earthquake record.
3.3. Effect of Seismic Spectral Characteristics on Structural Response
Under the same peak ground acceleration conditions, differences in the spectral composition of seismic waves can significantly affect the dynamic response of the structure.
The acceleration time-history data were processed in MATLAB R2021b (MathWorks, Natick, MA, USA) using the Fourier transform to obtain the frequency-dependent variation in acceleration amplitude. When the converter station platform is subjected to an input excitation of 0.25 g, a comparison of the acceleration spectra at measurement point J1 for working conditions A4-5 and B4-5, C4-5, D4-5, and E4-5 (see Figure 7) reveals that, at the first-mode natural frequency, the acceleration peak value in A4-5 is noticeably higher than those under other conditions (up to 30–50% higher in some comparisons). This indicates that the structural seismic response is determined not only by its inherent dynamic characteristics—such as natural frequencies and mode shapes—but also by the degree of spectral matching between the input ground motion and the structure’s natural frequencies. Furthermore, the distinct frequency components and energy distributions among different earthquake records lead to variations in response amplitudes.
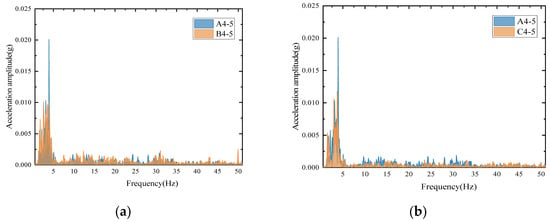
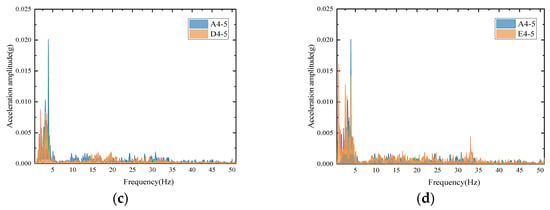
Figure 7.
Comparison of the acceleration spectral characteristics of J1 at different measurement points under each working condition: (a) A4-5 vs. B4-5; (b) A4-5 vs. C4-5; (c) A4-5 vs. D4-5; (d) A4-5 vs. E4-5.
This observation indicates that the seismic response of the structure is not solely determined by its inherent dynamic properties, such as natural frequencies and mode shapes, but is also strongly influenced by the degree of spectral matching between the input ground motion and the structure’s fundamental frequencies. The distinct frequency components and energy distributions among different earthquake records lead to variations in response amplitudes. Specifically, when the input ground motion contains a high energy density near the structural fundamental frequency, a stronger resonance effect occurs, amplifying the structural response. Conversely, a lack of such spectral alignment may attenuate the response even under the same PGA level.
This finding suggests that, in seismic design and the selection of input ground motions, PGA alone should not be used as the sole criterion. Instead, the matching relationship between the spectral characteristics of the input ground motion and the structural dynamic parameters should also be considered to avoid potential response amplification due to frequency resonance.
3.4. Dynamic Characteristics of the Valve Tower
In addition to the spectral characteristics of the input ground motion, the spatial distribution of stiffness and mass within the structure also has a significant impact on its dynamic response. Frequency-domain analysis along the tower height provides a clearer understanding of how these “internal structural factors” shape the response patterns.
The frequency-domain results (see Figure 8) indicate that both the J1 measurement point located on the lower leg and the J2 and J3 points located in the upper section exhibit a pronounced peak near 3.9 Hz, corresponding to the first natural frequency in the X-direction. Under a 0.25 g input, the peak amplitude at this frequency for condition B4-6 is approximately 45% lower than that for condition A4-6. This result indicates that the response amplitude can decrease significantly when the spectral match between the input ground motion and the structural fundamental frequency is reduced.
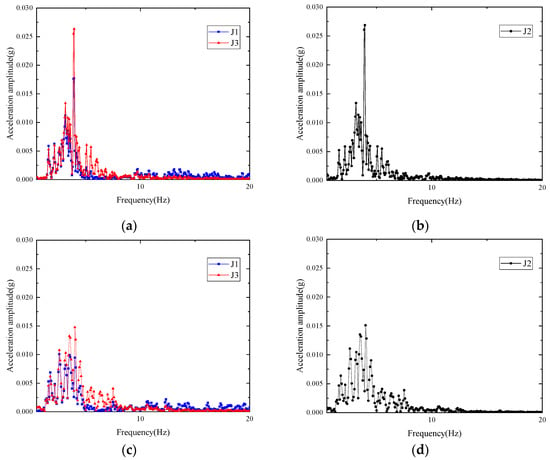
Figure 8.
Comparison of the acceleration spectrum characteristics of J1, J2 and J3: (a) A4-6, J1 and J3; (b) A4-6, J2 displayed separately; (c) B4-6, J1 and J3; (d) B4-6, J2 displayed separately.
The distribution of spectral responses along the tower height, as shown in Figure 9, reveals a clear spatial gradient. The lower leg region exhibits pronounced peaks at 3.92 Hz for the first mode and at approximately 50 Hz for the second mode, which indicates greater sensitivity to high-frequency components. In contrast, the upper section’s vibration energy is concentrated mainly in the 3.92 Hz low-frequency band. The mid-section measurement points J4, J5, and J6 show higher amplitudes at both the first and second modal frequencies. This suggests a stronger tendency for vibration concentration in the central region.
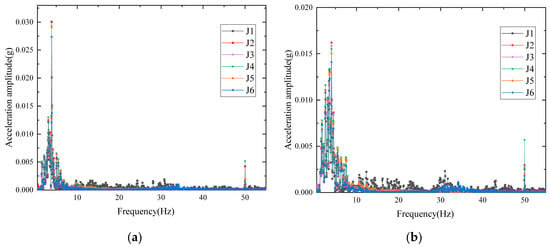
Figure 9.
Comparison of the acceleration spectral characteristics of each measurement point under different working conditions: (a) A4-6; (b) B4-6.
This differentiated response is closely associated with the “stiff–flexible composite” characteristics of the valve tower. The lower legs, with high stiffness and relatively low mass, are more readily excited under high-frequency inputs. The upper section, which carries heavy functional components and exhibits lower stiffness, tends to accumulate low-frequency energy. The central connection zone, as the core of force transmission and a location of abrupt stiffness change, is particularly susceptible to vibration concentration under multi-frequency excitation.
Accordingly, segment-specific optimization should be integrated within a system-level seismic design strategy. For the lower legs, fatigue resistance to high-frequency vibrations can be enhanced by strengthening welds and critical connections (e.g., adopting higher weld categories, adding local stiffeners, and optimizing connection details). For the upper structure, low-frequency resonance may be mitigated through mass redistribution and/or the installation of isolation elements; prestressed stay-type insulators can also be introduced to provide directional restraint, adjust modal frequencies, and reduce sway.
This study shows that the central connection region (e.g., J4–J6) exhibits the highest vibration amplitudes under multi-modal frequency excitation, indicating local stiffness discontinuities that lead to vibration concentration. This finding highlights the importance of designing the connection between the converter valve tower and the superstructure (platform deck). According to seismic engineering practice and the standards IEEE 693 and IEC 62271-300 [34,35], connections should meet minimum stiffness thresholds to avoid resonance and incorporate effective energy dissipation mechanisms (e.g., viscous dampers or spring–damper systems). The present results also reveal X-direction stress concentration along the loading axis (see Figure 6), supporting the use of reinforced welds or supplemental damping to mitigate resonance effects.
In addition, a lightweight structural design is recommended to reduce mass-induced low-frequency responses, and finite element verification is advised during the design stage to ensure that the fatigue life of the connections meets or exceeds the design seismic level. These measures not only enhance the overall seismic performance of supported-type converter valve towers but also provide valuable insights for the development of future design standards for offshore wind and converter platforms.
4. Conclusions
Based on the shaking-table tests conducted using a 1:25 scale valve tower and a 1:65 scale platform model, the dynamic characteristics of the structure under seismic excitation were investigated while adhering to the gravity–elasticity similarity principle. The tests utilized the first deck acceleration as the base input to obtain acceleration, strain, and frequency-domain responses. The main conclusions are as follows:
- (i)
- The structure’s first-mode natural frequency in the X-direction is 3.92 Hz, with a second-mode characteristic frequency of approximately 50.10 Hz, and an average first-mode damping ratio of 3.21%. These parameters, obtained through white-noise excitation and power spectral density analysis, confirm that the test effectively reproduces the prototype’s seismic response, providing a reliable basis for subsequent response spectrum analysis and design verification.
- (ii)
- As peak ground acceleration increases, both acceleration and strain peak values exhibit near-linear growth, with the amplification effect in the upper equipment section significantly greater than in the lower leg section. Strain gauges aligned with the X-direction loading axis record the maximum responses, indicating pronounced directional sensitivity. This suggests that seismic design should prioritize controlling structural vibrations in the upper section and stress concentration along the primary loading direction under high PGA conditions.
- (iii)
- Differences in the spectral energy distribution of seismic waves lead to significant variations in response. Resonance amplification depends on the spectral match between the input ground motion and the structure’s natural frequencies, highlighting that PGA alone is insufficient as a basis for seismic design. The selection of input ground motions should consider frequency content to mitigate resonance risks.
- (iv)
- The lower leg section is more sensitive to high-frequency inputs, while the upper equipment section is dominated by low-frequency energy. The mid-section connection zone exhibits high amplitudes in both modes, indicating vibration concentration due to stiffness transitions. Structural design should focus on enhancing the fatigue resistance of the lower legs, mitigating low-frequency resonance in the upper section, and addressing multi-frequency coupling effects in the mid-section connection zone.
This research provides a fundamental basis for studying the seismic performance of offshore valve towers by validating the experimental approach and identifying critical design parameters. Future investigations are encouraged to address multi-directional seismic excitations, soil–structure interaction effects, and the application of advanced damping systems to further improve the seismic resistance of offshore converter platforms under complex marine and seismic environments.
Author Contributions
Conceptualization, W.Z., T.W., Z.S. and J.C.; methodology, W.Z. and Z.S.; validation, Q.S. and J.C.; formal analysis, Q.S. and Z.S.; investigation: T.W., J.C. and G.D.; resources, G.D.; data curation, T.W. and C.B.; writing—original draft preparation, W.Z. and Q.S.; writing—review and editing, Z.S., G.D., C.B. and Q.S.; visualization, Q.S.; supervision, C.B.; project administration, G.D. All authors have read and agreed to the published version of the manuscript.
Funding
This research was funded by the Major Scientific and Technological Project of Power China Huadong Engineering Corporation Limited, grant number KY2023-ZD-06, the National Key Research and Development Program of China, grant number 2021YFB2400605.
Data Availability Statement
The original contributions presented in this study are included in the article. Further inquiries can be directed to the corresponding author.
Conflicts of Interest
Authors Wei Zhang and Tianchai Wang were employed by the company China Power Construction (Wenzhou) Green Energy Development Co., Ltd. Authors Zhenzhou Sun and Jiefeng Chen were employed by the company Power China Huadong Engineering Corporation. The remaining authors declare that the research was conducted in the absence of any commercial or financial relationships that could be construed as a potential conflict of interest. The authors declare that this study received funding from China Power Construction (Wenzhou) Green Energy Development Co., Ltd. and Power China Huadong Engineering Corporation. The funders were not involved in the study design, collection, analysis, interpretation of data, the writing of this article, or the decision to submit it for publication.
References
- Yang, B.; Liu, B.; Zhou, H.; Wang, J.; Yao, W.; Wu, S.; Shu, H.; Ren, Y. A critical survey of technologies of large offshore wind farm integration: Summary, advances, and perspectives. Prot. Control Mod. Power Syst. 2022, 7, 1–3. [Google Scholar] [CrossRef]
- Dakic, J.; Cheah, M.; Gomis, B.O. HVAC transmission system for offshore wind power plants including mid-cable reactive power compensation: Optimal design and comparison to VSC-HVDC transmission. IEEE Trans. Power Deliv. 2020, 36, 2814–2824. [Google Scholar] [CrossRef]
- Negra, N.B.; Todorovic, J.; Ackermann, T. Loss evaluation of HVAC and HVDC transmission solutions for large offshore wind farms. Electr. Power Syst. Res. 2006, 76, 916–927. [Google Scholar] [CrossRef]
- Liu, Q.; Lei, X.; Lai, Y.; Qin, M.; Zhang, X.; Ma, L.; Dai, K.; Yang, Y.; Bashir, M. Analysis of dynamic response of offshore wind turbines subjected to earthquake loadings and the corresponding mitigation measures: A review. Ocean Eng. 2024, 311 Pt 2, 118892. [Google Scholar] [CrossRef]
- Zhao, L.; Shan, Z.; Wang, M. Seismic response and spectrum analysis of offshore wind farm sites in Jiangsu Province, China. In Proceedings of the ISRM Regional Symposium—11th Asian Rock Mechanics Symposium, Beijing, China, 20–25 October 2021. [Google Scholar]
- Sun, Z.; Zhao, S.; Bi, C.; Chen, Q.; Huang, S.; Chen, J. Dynamic response analysis of an offshore converter platform with valve towers under seismic excitation. Symmetry 2022, 14, 1635. [Google Scholar] [CrossRef]
- Lan, D.; Li, J.; Chen, J.; Xu, Q. Floor response spectra of offshore electrical platform under sea waves and earthquake. Ocean Eng. 2022, 265, 112623. [Google Scholar] [CrossRef]
- Cheng, Y.; Lin, S.; Lu, Z.; Sun, Y.; Chen, E. Seismic performance evaluation of UHV valve. Proc. SPIE 2024, 13419, 134193C. [Google Scholar]
- Ding, C.; Liu, Y.; Zhu, P.; Li, J.; Pu, G. Analysis of the seismic performance of ±500 kV flexible DC converter valves. Energies 2023, 16, 6335. [Google Scholar] [CrossRef]
- He, C.; Xie, Q.; Ma, G.; Yang, Z.; Zhuo, R. Seismic behavior of ±800 kV UHV converter transformer and bushing system. High Volt. Eng. 2018, 44, 1878–1883. [Google Scholar]
- Zhang, W.; Yu, H.; Gao, B.; Liu, B.; Yin, C. Experimental study on seismic simulation shake table of UHV suspended converter valve. High Volt. Apparatus 2022, 58, 142–149. [Google Scholar]
- Zhang, X.; Lyu, Y. Seismic performance analysis of ±600 kV converter transformer circuit. High Volt. Apparatus 2022, 58, 50–56. [Google Scholar]
- Kang, C.; Huo, H.; Li, N.; Liu, B.; Guo, F. Annual maintenance mode of converter station and preventive test method of DC equipment. Appl. Math. Nonlinear Sci. 2025, 10, 0512. [Google Scholar] [CrossRef]
- Wang, J.; Wu, H.; Deng, Z.; Peng, Z.; Liao, J. E-field distribution analysis on three types of converter double valve in 800 kV valve hall. In Proceedings of the 2015 IEEE 11th International Conference on the Properties and Applications of Dielectric Materials (ICPADM), Sydney, NSW, Australia, 19–22 July 2015; pp. 1–4. [Google Scholar]
- Liu, X.; Xie, Q. A multi-model probabilistic framework to evaluate seismic resilience of UHV converter stations. Eng. Struct. 2024, 300, 117153. [Google Scholar] [CrossRef]
- Chen, J.-L.; Li, J.-W.; Wang, D.-W.; Feng, Y. Seismic response analysis of steel–concrete hybrid wind turbine tower. J. Vib. Control 2021, 28, 2240–2253. [Google Scholar] [CrossRef]
- Sun, Q.G.; Wu, X.F.; Di, J.J.; Zhou, Y.C. Seismic analysis for the suspended converter valve tower of the UHV. Appl. Mech. Mater. 2012, 187, 196–201. [Google Scholar] [CrossRef]
- Yang, Z.; Xie, Q.; Zhou, Y.; Mosalam, K.M. Seismic performance and restraint system of suspended 800 kV thyristor valve. Eng. Struct. 2018, 169, 179–187. [Google Scholar] [CrossRef]
- Tu, M. Parameter Identification and Isolation Performance of Supported Flexible DC Converter Valve Towers. Master’s Thesis, South China University of Technology, Guangzhou, China, 2022. [Google Scholar]
- Xiao, J.; Li, S.; Wang, Y.; Mao, Z.; Zhang, C. Study on a method for improving the seismic performance of converter valve towers. New Technol. New Process 2017, 12, 39–42. [Google Scholar]
- Zheng, Q.; Sun, X.; Lou, Y.; Zhang, L.; Zhang, Y.; Dong, Y. Lightweight design and simulation analysis of ±500 kV offshore VSC-HVDC converter valve. High Volt. Apparatus 2023, 59, 188–201. [Google Scholar]
- Lan, D.-N.; Li, J.; Xu, Q.; Chen, J. Influence of the offshore electrical platform on the dynamic responses of converter valve under sea waves and earthquakes. Ships Offshore Struct. 2021, 17, 2531–2544. [Google Scholar] [CrossRef]
- Sun, Z.-Z.; Bi, C.-W.; Zhao, S.-X.; Dong, G.-H.; Yu, H.-F. Experimental analysis on dynamic responses of an electrical platform for an offshore wind farm under earthquake load. J. Mar. Sci. Eng. 2019, 7, 279. [Google Scholar] [CrossRef]
- Zhao, S.-X.; Bi, C.-W.; Sun, Z.-Z. Engineering analysis of the dynamic characteristics of an electrical jacket platform of an offshore wind farm under seismic loads. Appl. Ocean Res. 2021, 112, 102692. [Google Scholar] [CrossRef]
- Sun, Z.-Z.; Yu, Y.; Wang, H.-K.; Huang, S.; Chen, J. Dynamic response analysis of offshore converter station based on vector form intrinsic finite element (VFIFE) method. J. Mar. Sci. Eng. 2022, 10, 749. [Google Scholar] [CrossRef]
- Zhang, D.-L.; Bi, C.-W.; Wu, G.-Y.; Zhao, S.-X.; Dong, G.-H. Laboratory experimental investigation on the hydrodynamic responses of an extra-large electrical platform in wave and storm conditions. Water 2019, 11, 2042. [Google Scholar] [CrossRef]
- Wang, J.; Liu, X.; Li, W.; Liu, F.; Hancock, C. Time–frequency extraction model based on variational mode decomposition and Hilbert–Huang transform for offshore oil platforms using MIMU data. Symmetry 2021, 13, 1443. [Google Scholar]
- Zhang, L.; Xiao, J.; Lv, W.; Zeng, D. Research on seismic analysis of converter valve of offshore flexible high voltage direct current considering the effect of initial displacement. E3S Web Conf. 2021, 252, 01037. [Google Scholar] [CrossRef]
- Ma, C.; Saghi, H.; Choo, Y.-W.; Ju, Y.K.; Yoo, C.; Z, G. Influence of different foundation models on the dynamic response of jacket offshore wind turbines with local joint flexibility. Steel Compos. Struct. 2024, 53, 629–651. [Google Scholar]
- Lin, G.; Zhu, T.; Lin, B. Similarity techniques for structural dynamic model tests. J. Dalian Univ. Technol. 2000, 1, 1–8. [Google Scholar]
- Zhu, T. Research on Similarity Problems of Structural Dynamic Models and Structural Dynamic Test Technologies. Ph.D. Thesis, Dalian University of Technology, Dalian, China, 2004. [Google Scholar]
- Chakrabarti, S. Handbook of Offshore Engineering; Elsevier Press: Amsterdam, The Netherlands, 2005. [Google Scholar]
- CCS GD23-2004; Specification for the Construction and Inspection of Shallow Sea Fixed Platforms. China Communications Press: Beijing, China, 2004.
- IEEE Std 693-2018; IEEE Recommended Practice for Seismic Design of Substations. IEEE: Piscataway, NJ, USA, 2018.
- IEC TR 62271-300:2006; High-Voltage Switchgear and Controlgear—Part 300: Seismic Qualification of Alternating Current Circuit-Breakers. IEC: Geneva, Switzerland, 2006.
Disclaimer/Publisher’s Note: The statements, opinions and data contained in all publications are solely those of the individual author(s) and contributor(s) and not of MDPI and/or the editor(s). MDPI and/or the editor(s) disclaim responsibility for any injury to people or property resulting from any ideas, methods, instructions or products referred to in the content. |
© 2025 by the authors. Licensee MDPI, Basel, Switzerland. This article is an open access article distributed under the terms and conditions of the Creative Commons Attribution (CC BY) license (https://creativecommons.org/licenses/by/4.0/).