Article

Experimental and Numerical Research on p-y Curve of Offshore Photovoltaic Pile Foundations on Sandy Soil Foundation

1
PowerChina Huadong Engineering Corporation Limited, Hangzhou 311122, China
2
Key Laboratory of Geotechnical and Underground Engineering of Ministry of Education, Department of Geotechnical Engineering, Tongji University, Shanghai 200092, China
3
College of Civil Engineering and Architecture, Jiaxing University, Jiaxing 314001, China
*
Author to whom correspondence should be addressed.
J. Mar. Sci. Eng. 2025, 13(10), 1959; https://doi.org/10.3390/jmse13101959
Submission received: 28 August 2025 / Revised: 2 October 2025 / Accepted: 7 October 2025 / Published: 13 October 2025
(This article belongs to the Special Issue Advances in Offshore Foundations and Anchoring Systems)

Abstract

While methods like cyclic triaxial testing and p-y model updating theory exist in geotechnical and offshore wind engineering, they have not been systematically applied to solve the specific deformation problems of offshore PV piles. This study investigates a specific offshore photovoltaic (PV) project in Qinhuangdao City, Hebei Province. Initially, field tests of horizontal static load on steel pipe pile foundations were conducted. A finite element model (FEM) of single piles was subsequently developed and validated. Further analysis examined the failure modes, initial stiffness, and ultimate resistance of offshore PV single piles in sandy soil foundations under varying pile diameters and embedment depths. The hyperbolic p-y curve model was modified by incorporating pile diameter size effects and embedment depth considerations. Key findings reveal the following: (1) The predominant failure mechanism of fixed offshore PV monopiles manifests as wedge-shaped failure in shallow soil layers. (2) Conventional API specifications and standard hyperbolic models demonstrate significant deviations in predicting p-y (horizontal soil resistance-pile displacement) curves, whereas the modified hyperbolic model shows good agreement with field measurements and numerical simulations. This research provides critical data support and methodological references for calculating the horizontal bearing capacity of offshore PV steel pipe pile foundations.

1. Introduction

Renewable energy generation constitutes a critical component of the global energy supply system and has emerged as a pivotal strategic initiative for advancing energy transition and achieving climate change mitigation targets [1]. Compared with other renewable energy sources, photovoltaic (PV) power generation demonstrates superior cost-effectiveness and implementation feasibility, positioning the PV industry to play a decisive role in realizing carbon neutrality objectives [2,3,4]. Marine regions offer distinct advantages for PV deployment, including reduced land costs, flat terrains, minimal obstructions, and favorable solar irradiation conditions, thereby enhancing the power generation efficiency of PV modules. However, the harsh marine service environment presents challenges such as weak foundation bearing capacity, strong environmental corrosivity, and complex construction requirements [5,6]. Current offshore PV power plants employ either fixed pile foundations or floating structures, with fixed monopile foundations being predominantly adopted in nearshore and intertidal zones due to their technical affordability and site adaptability [7]. During service, offshore PV piles endure coupled wind–wave–current loads under complex loading scenarios, with horizontal loading being particularly dominant. Consequently, the horizontal bearing behavior of monopile foundations has become a focal research topic in offshore PV engineering [8].
In situ horizontal static load testing serves as a primary method for evaluating the lateral bearing capacity of pile foundations. Park et al. [9] compared field lateral load test results with existing p-y curve models, developing a site-specific p-y curve model tailored to Jeju Island’s basaltic geology. Kim [10] investigated load distribution and deformation patterns of offshore piles through experimental and numerical analyses, contrasting the behaviors of rigid and flexible wind turbine piles. Wang [11] explored the ultimate lateral capacity of offshore wind turbine pile groups via centrifugal model tests, while Yoo et al. [12] proposed and validated simplified dynamic p-y backbone curves through dynamic centrifuge testing. Notably, current research predominantly focuses on offshore wind turbine piles, with a critical scarcity of field-measured data for horizontally loaded PV piles in nearshore environments.
Current analytical theories for laterally loaded piles fall into three categories: (1) ultimate subgrade reaction method; (2) m-method (linear elastic subgrade reaction method) [13]; and (3) p-y curve method (composite subgrade reaction method) [14]. The ultimate subgrade reaction method neglects soil deformation effects on lateral resistance, rendering it incapable of predicting pile displacement. The m-method fails to account for nonlinear soil deformation under loading, limiting its applicability to scenarios with significant pile displacements [15]. In contrast, the p-y curve method discretizes soil strata into depth-dependent nonlinear springs [16], effectively capturing the elastoplastic development of soil–pile interaction, and has gained widespread engineering acceptance.
While substantial research exists on p-y curves for large-diameter offshore wind turbine monopiles, achieving successful marine engineering applications, such findings prove unsuitable for PV pile design. Dash et al. [17] analyzed liquefied soil p-y curves from 12 centrifuge tests to identify key lateral soil–pile interaction factors. Wang et al. [18] employed 3D FEM to quantify p-y curves for laterally loaded piles in sand with varying diameters and flexural rigidities, revealing failure mechanisms in dense sand. Liu et al. [19] proposed slope-adapted p-y criteria by modifying soil resistance displacement in conventional models, while Lim et al. [20] established simplified dynamic p-y curves through dry sand model tests under cyclic loading. Wang et al. [21] identified limitations in API-recommended p-y curves for soft clays and proposed enhanced alternatives. Crucially, wind turbine monopiles (7–10 m diameter, 20–50 m embedment) must withstand substantial overturning moments from turbine operation, whereas PV monopiles feature significantly smaller dimensions (<3 m diameter, 1–5 m embedment). This fundamental disparity renders wind energy-derived design methodologies inappropriate for PV applications. With the rapid expansion of offshore PV installations and persistent knowledge gaps in PV pile mechanics, field-data-driven p-y curve development for PV-specific conditions becomes imperative.
This study addresses these challenges through field static load tests on steel pipe piles at an offshore PV project in Qinhuangdao, Hebei Province. An ABAQUS-based finite element model of PV monopiles was developed and validated. The investigation systematically examines failure modes, initial stiffness evolution, and ultimate resistance mechanisms of sandy soil-embedded PV piles under varying diameters and depths. A method for calculating the horizontal bearing capacity of steel pipe piles in marine sandy soil foundations is proposed. This method can compute the p-y curves of steel pipes of different dimensions within sandy soil layers. Subsequently, the finite difference method is employed to determine the pile’s bearing capacity and bending moment distribution, providing reference values for soil layers with similar geological conditions.

2. Field Test Methods

2.1. Experimental Setup

The pile testing site is situated in the southeastern coastal waters of Qinhuangdao City (The test site is located at a certain photovoltaic plant.), Hebei Province, within the western Bohai Sea region adjacent to the Liaodong Bay. This area belongs to a littoral sedimentary geomorphological unit characterized by gentle submarine topography (slope < 1°). The experimental PV field center is located 7.0 km offshore, covering a planned marine area of approximately 6.556 km2. Water depths at the test site range between 9.8 m and 11.1 m. All test piles were constructed as driven steel pipe piles, with their layout configuration illustrated in Figure 1. The testing system comprised one test pile and one reaction pile. The loading protocol followed the unidirectional single-cycle horizontal maintained loading method recommended by the Technical Code for Testing of Building Foundation Piles (JGJ 106-2014) [22]. The incremental loading steps were set at 1/10 of the estimated ultimate bearing capacity, totaling 10 loading stages, while unloading was implemented in 5 stages with each step equivalent to two loading increments. High-strain dynamic testing (HSDT) was conducted during both initial driving and restrike phases. Wave propagation analysis incorporated the CASE method and CAPWAP method, with key parameters configured as follows: Stress wave velocity: 5120 m/s, Damping coefficient (Jc): 0.20–0.30, Integrity testing results (Table 1) confirmed 100% structural soundness across all test piles, with no defects detected in pile shaft continuity or cross-sectional dimensions. Table 2 data sources: on-site pile testing and engineering geological investigation reports.

2.2. Analysis of the Field Test

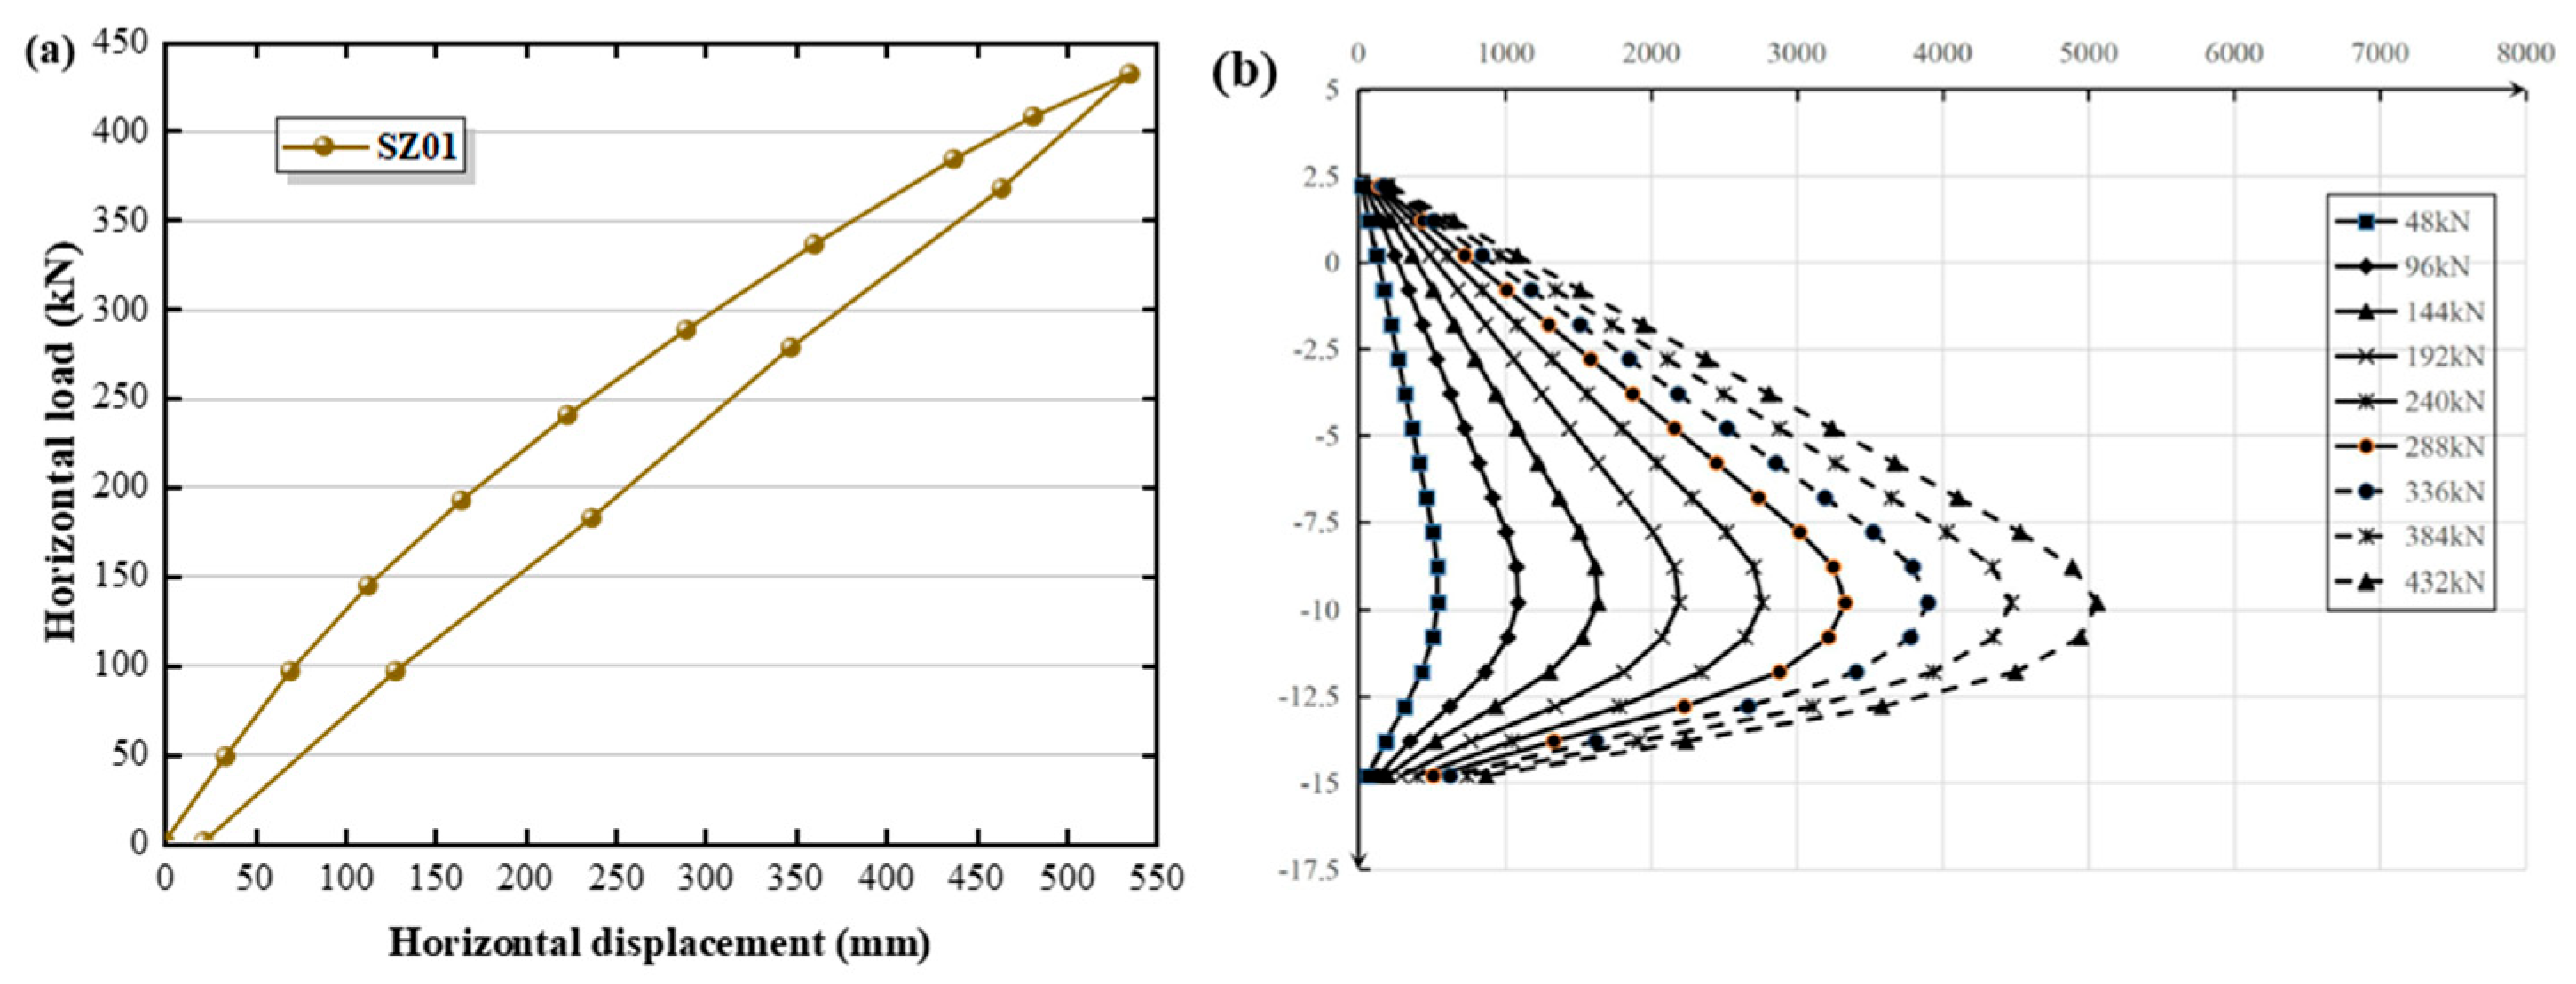
The measured horizontal load–displacement curve at the loading point is presented in Figure 2. As the load level increased, the foundation deformation transitioned from elastic to plastic behavior, with the surrounding soil undergoing plastic failure. Upon reaching the maximum applied load of 432 kN, the horizontal displacement at the loading point was measured as 535.94 mm. Unloading was conducted in five stages, each equivalent to twice the loading increment, resulting in a residual displacement of 21.85 mm at the loading point. During loading, the bending moment distribution along the pile shaft, captured using distributed optical fiber sensors, is shown in Figure 2 (95% confidence interval). The maximum bending moment occurred at a depth of approximately seven times the pile diameter below the mudline, and the overall pile behavior exhibited rigid body movement, with the extreme bending moment observed near the pile tip.

3. Numerical Calculation

3.1. Finite Element Model Establishment

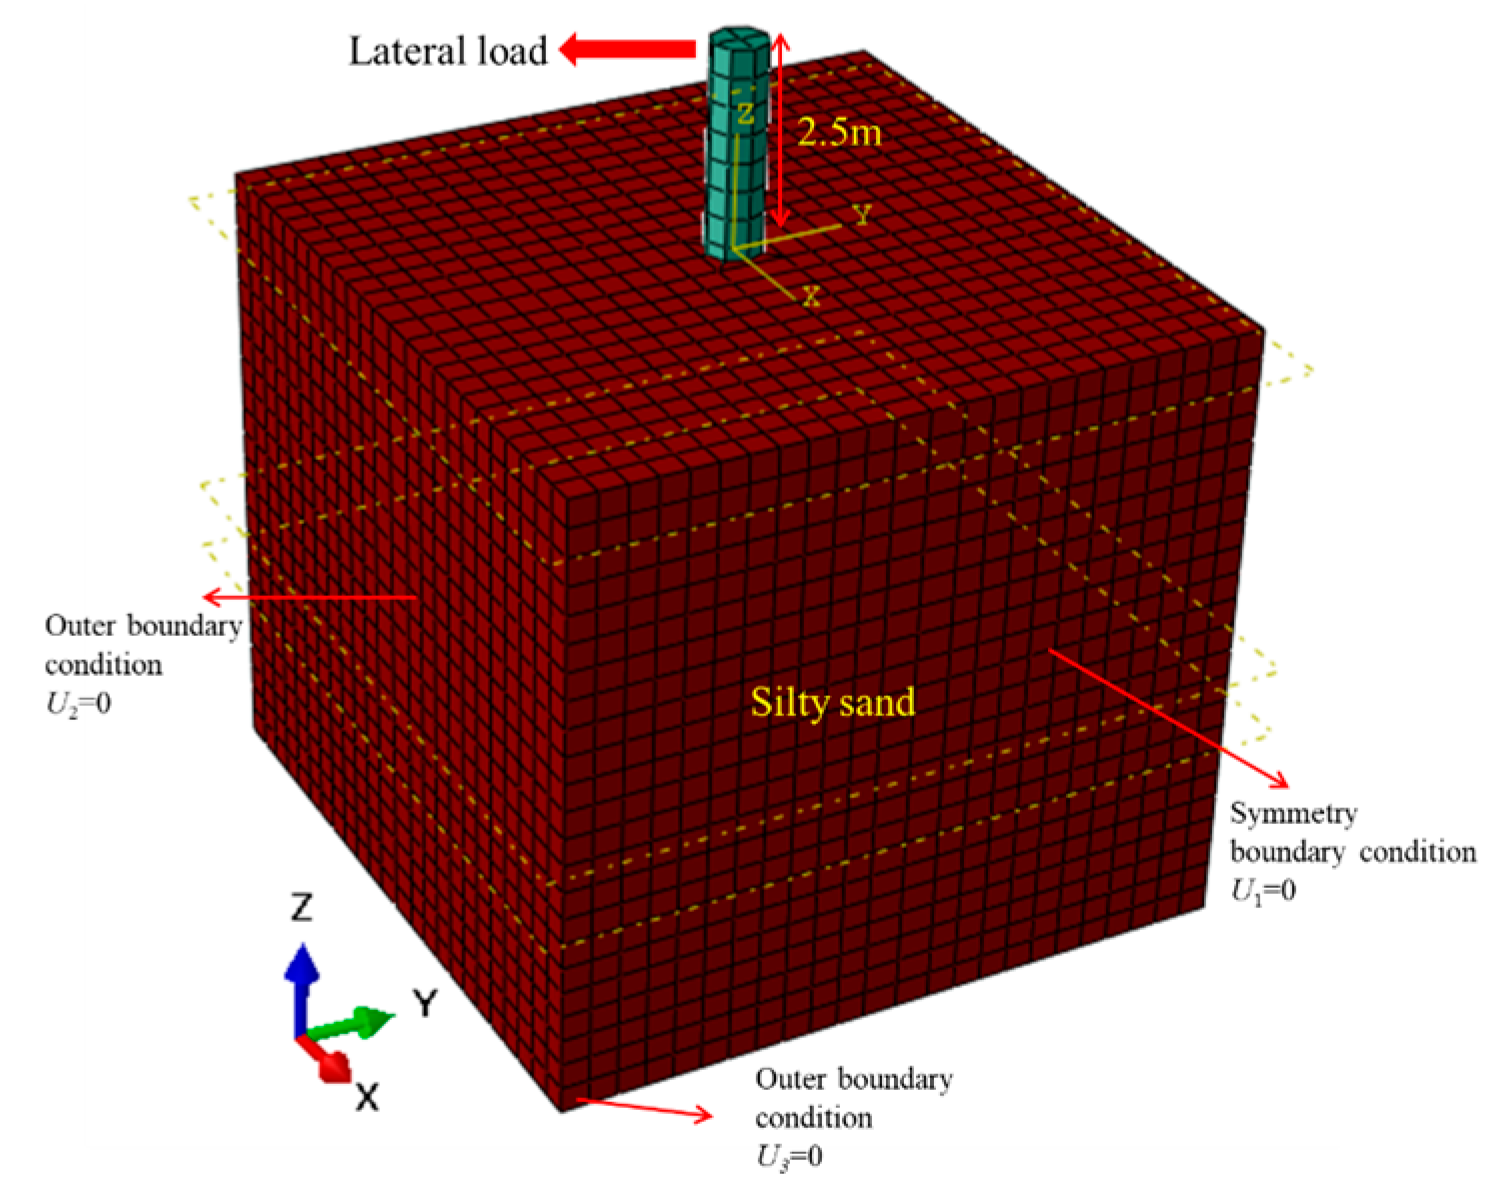
The pile-soil interaction of a fixed monopile foundation for offshore photovoltaic systems under horizontal loading was simulated using the finite element analysis software ABAQUS (2020). To validate the accuracy of the numerical model, a case study based on a field horizontal static load test from an offshore PV project in Qinhuangdao, Hebei Province, was utilized. A three-dimensional solid model of a steel pipe pile with a diameter of 1.5 m, total length of 17.5 m, and embedded depth of 15 m was established. The length and geometry of the structure correspond to those of the field static load test piles. The same pile-soil parameters were applied in the simulation. Displacement and rotation angle of the fixed XYZ-axis directional plane. To minimize boundary effects on the computational model, the soil domain was set to a thickness of 30 m (60D). To enhance computational precision, a finer mesh with a 0.5 m grid size was employed throughout, with the overall finite element model illustrated in Figure 3. To further investigate the size effects on the horizontal bearing behavior of the single pile in sandy soil, the soil was assumed to be a single homogeneous sand layer. The silty sand layer in contact with the pile in the aforementioned field test was selected, with soil parameters summarized in Table 3. All modeling parameters are derived from the on-site geological survey report.
The monopile foundation in Figure 3 was simulated using a linear elastic model with steel material properties defined as follows: density = 7924 kg/m3, Young’s modulus = 210 GPa, and Poisson’s ratio = 0.3. The soil foundation was modeled with a Mohr-Coulomb constitutive model. Contact interactions were configured with hard contact at the pile base and Coulomb friction penalty formulation along the lateral interface (friction coefficient = 0.5). Consistent with p-y curve assumptions, horizontal loading was applied at the pile head. Loading is conducted in 10 stages, with incremental increases at each stage. The soil’s elastic modulus exhibits nonlinear variation with depth, governed by Equations (1) and (2), which establish relationships between soil compression modulus, minor principal stress, and stratum depth [23,24]. Through ABAQUS USDFLD subroutine programming on the Fortran platform, this depth-dependent modulus variation was implemented in the numerical model. Figure 3 demonstrates favorable agreement between the simulated results and field test data.
E s = k σ   at σ 3 σ at
σ 3 = K 0 γ z
In the formula, Es is the initial compression modulus of soil; σat is the atmospheric pressure; k and λ are dimensionless constants; σ3 is the minor principal soil stress; K0 is the static soil pressure coefficient; z is the soil depth.

3.2. Verification of the Finite Element Model

It can be known from Figure 4 that the trends of the load–displacement curves obtained by the two methods are consistent. The maximum relative error of the horizontal displacement under the same horizontal load is only 7%. The pile shaft bending moments of the two methods are in good agreement in the sandy soil layer, while in the deep clay layer, the actual soil will provide greater resistance. To sum up, the finite element model can better reflect the horizontal force and deformation characteristics of the single pile in this sandy foundation.
As shown in Figure 4, the load–displacement curve obtained from the finite element simulation exhibits a consistent trend with the field test results. The maximum relative error in horizontal displacement under the same load level is only 7%. Furthermore, the bending moment distributions along the pile shaft from both the numerical simulation and field test show good agreement within the sandy soil layer, although the actual soil provides greater resistance in the upper sandy stratum. In summary, the finite element model accurately captures the horizontal force-deformation behavior of the single pile in this sandy foundation.
In the model, the monopile is a hollow steel pipe with diameters D of 1 m, 2 m, and 3 m. Although a reduction in pile length would typically be required to maintain the same bearing capacity as the pile diameter increases under identical loading conditions, the pile length was held constant in this study to isolate the effect of pile diameter variation on horizontal bearing behavior. Thus, all models feature a uniform pile length of 17.5 m and a wall thickness of 30 mm.

4. Result and Discussion

4.1. Analysis of Destruction Patterns

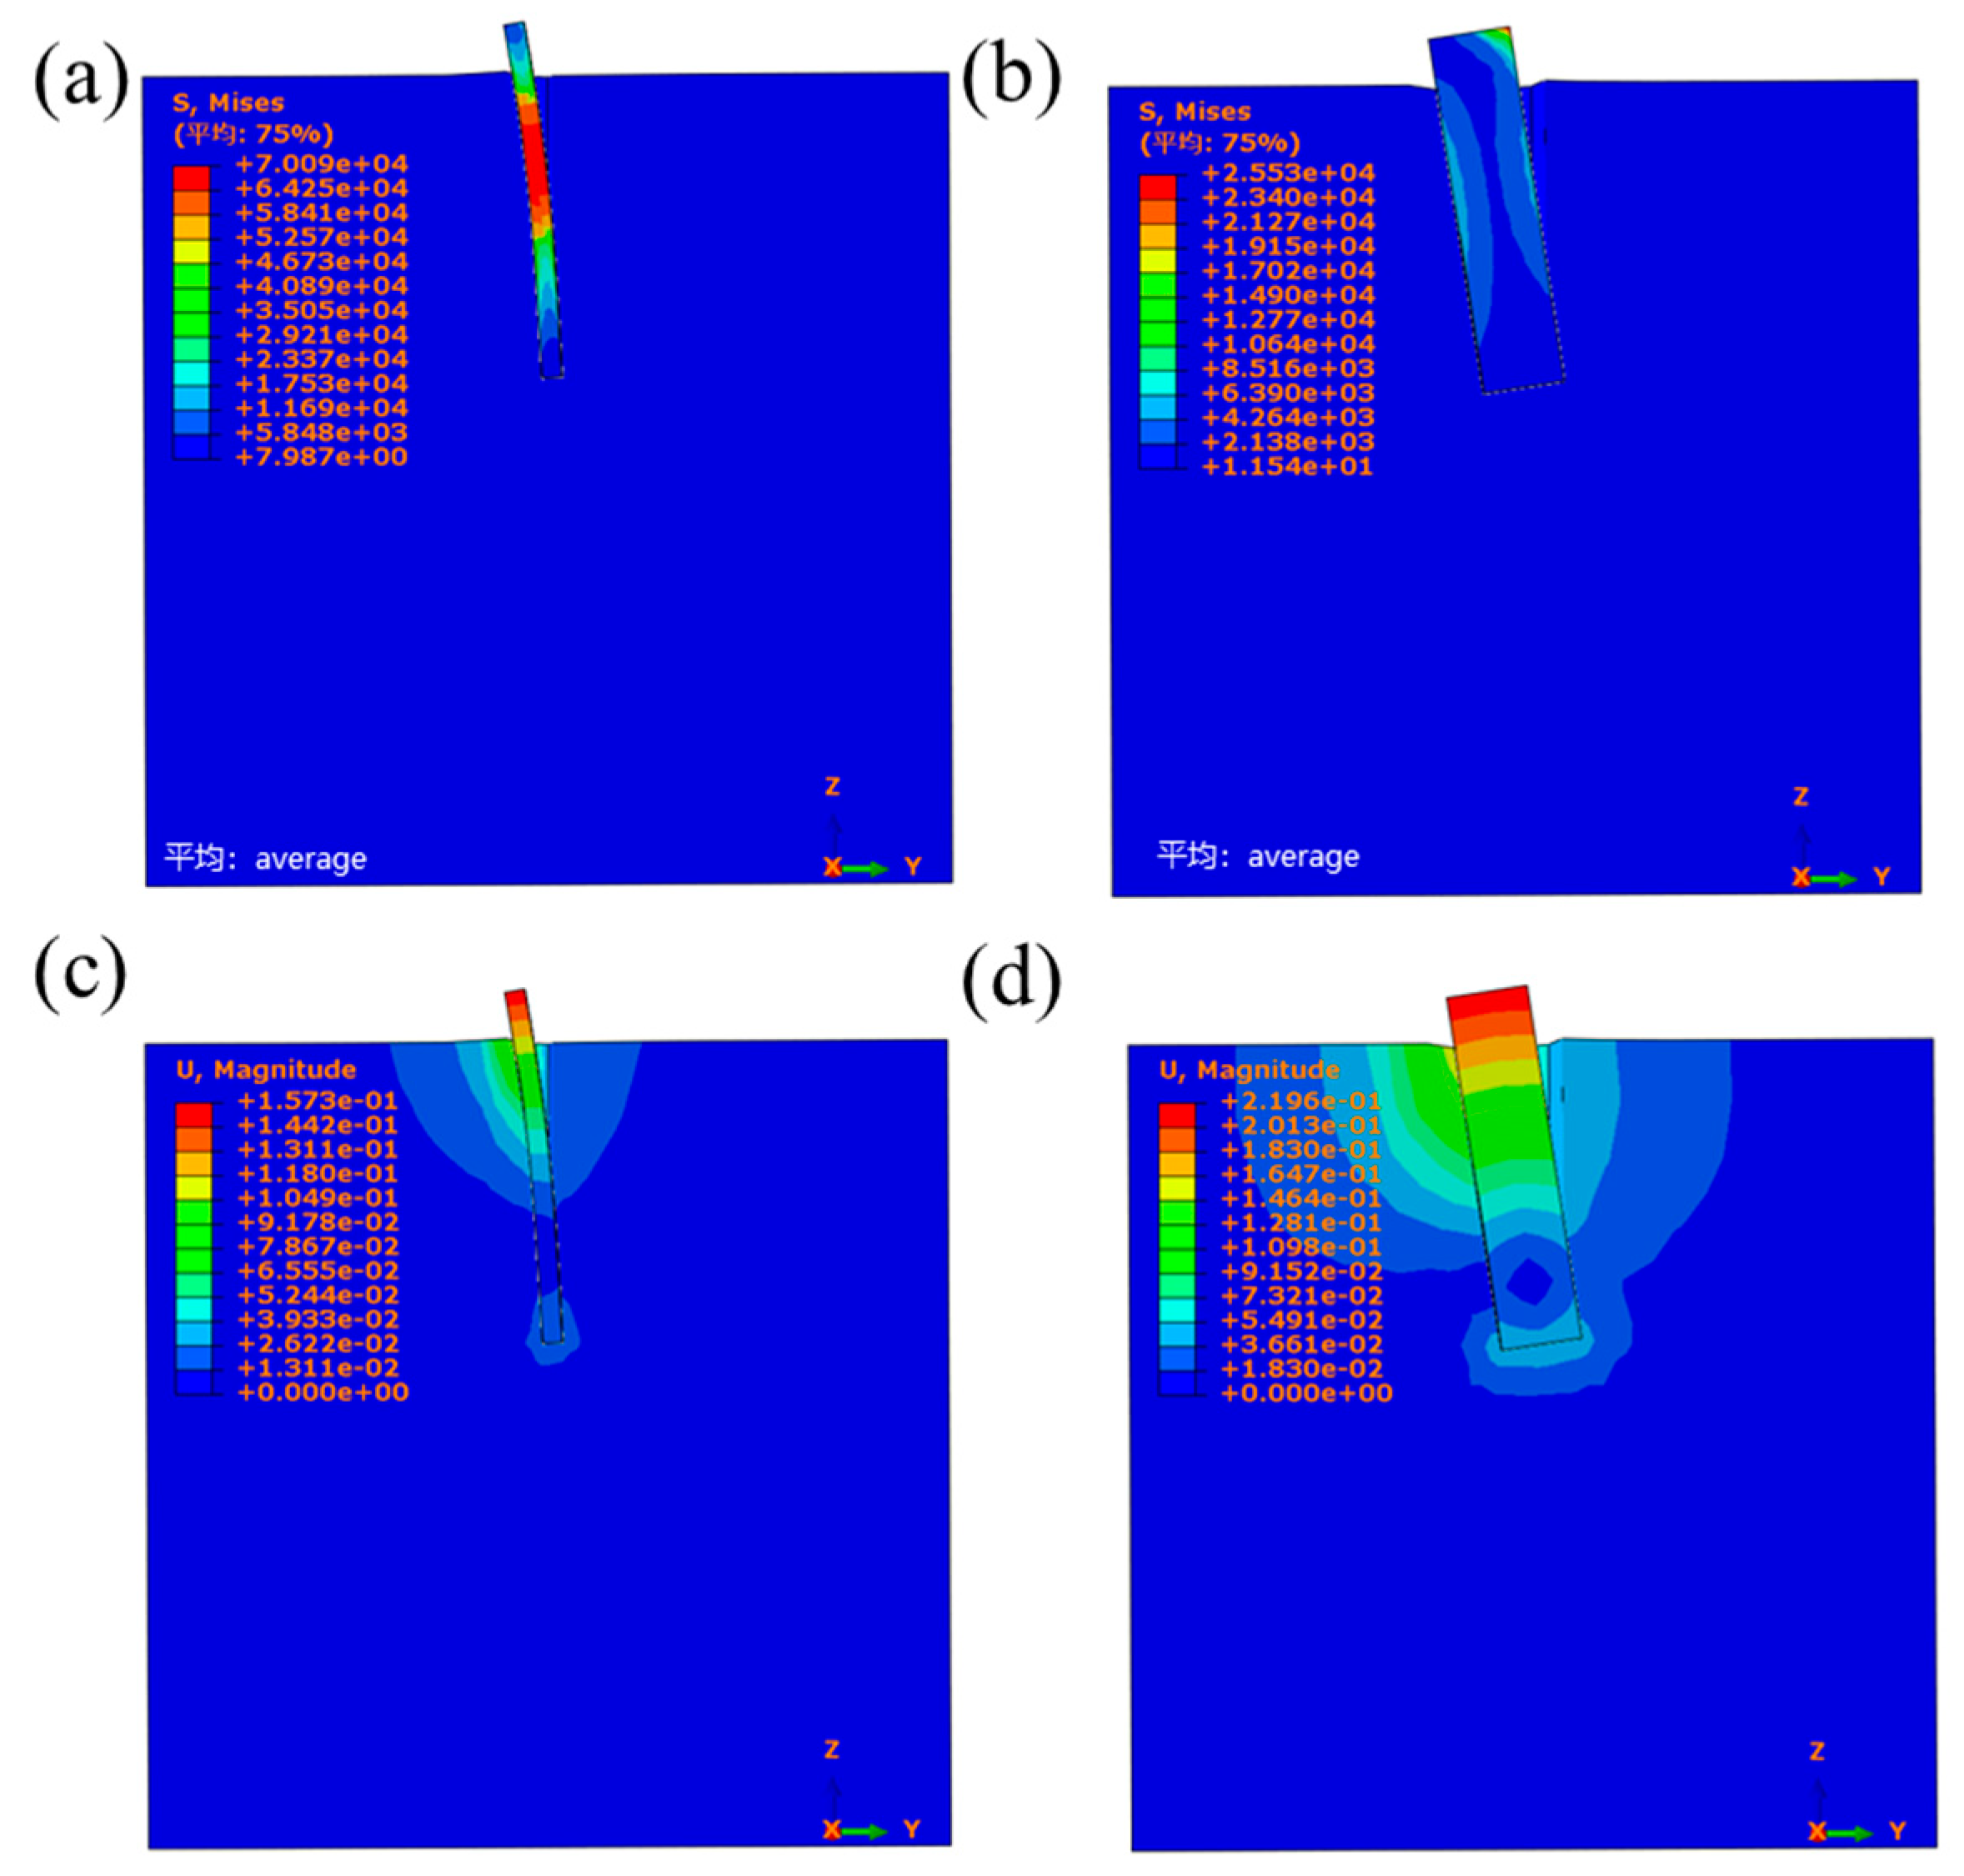
When the offshore photovoltaic foundation is subjected to a large horizontal load, the pile will produce a large horizontal displacement, and the soil around the pile will enter the plastic zone from the elastic zone. The horizontal ultimate bearing capacity of the pile is obtained based on the displacement gradient-horizontal load curve [15]. The equivalent plastic strain of the foundation, the displacement cloud diagram and the mechanical cloud diagram of the pile body of single piles with different pile diameters under the horizontal ultimate bearing capacity are shown in Figure 5 and Figure 6.
It can be known from Figure 5 that when a horizontal load is applied at the top of the pile, the shallow soil reaches plastic failure first. It can be known from Figure 6 that with the increase in the pile diameter, the pile body changes from a flexible pile to a rigid pile, the rotation center gradually moves downward, the depth of the “wedge-shaped” failure zone of the shallow soil deepens, and at the same time, the deflection of the failure pile body develops deeper, and finally the soil at the deep part is extruded, resulting in a “kick” phenomenon at the base [25], but the failure area is relatively small. Therefore, the failure mode of single piles with different pile diameters in sandy soil is mainly the wedge-shaped failure of the shallow soil, and the seriously damaged areas are all within 8 m below the mud surface. As the pile diameter increases, the deformation characteristics of the pile body shift from primarily bending deformation to overall rigid rotational deformation, transforming the pile from a semi-rigid to a rigid structure.

4.2. Analysis of p-y Curve Characteristics

Generally, the p-y curve is adopted to simulate the elastoplastic characteristics of the soil around the pile. In sandy soil foundation, the hyperbolic tangent model is used in API code [26] to calculate the p-y curve. However, the hyperbolic model proposed in reference [27] based on the centrifuge test results is used to improve the applicability of the p-y curve, and the calculation formula is Equation (3).
p = y 1 K i + y p u
In the formula, P represents the resistance of the foundation soil, Pu is the ultimate soil resistance, Ki is the initial stiffness, and y is the horizontal displacement.
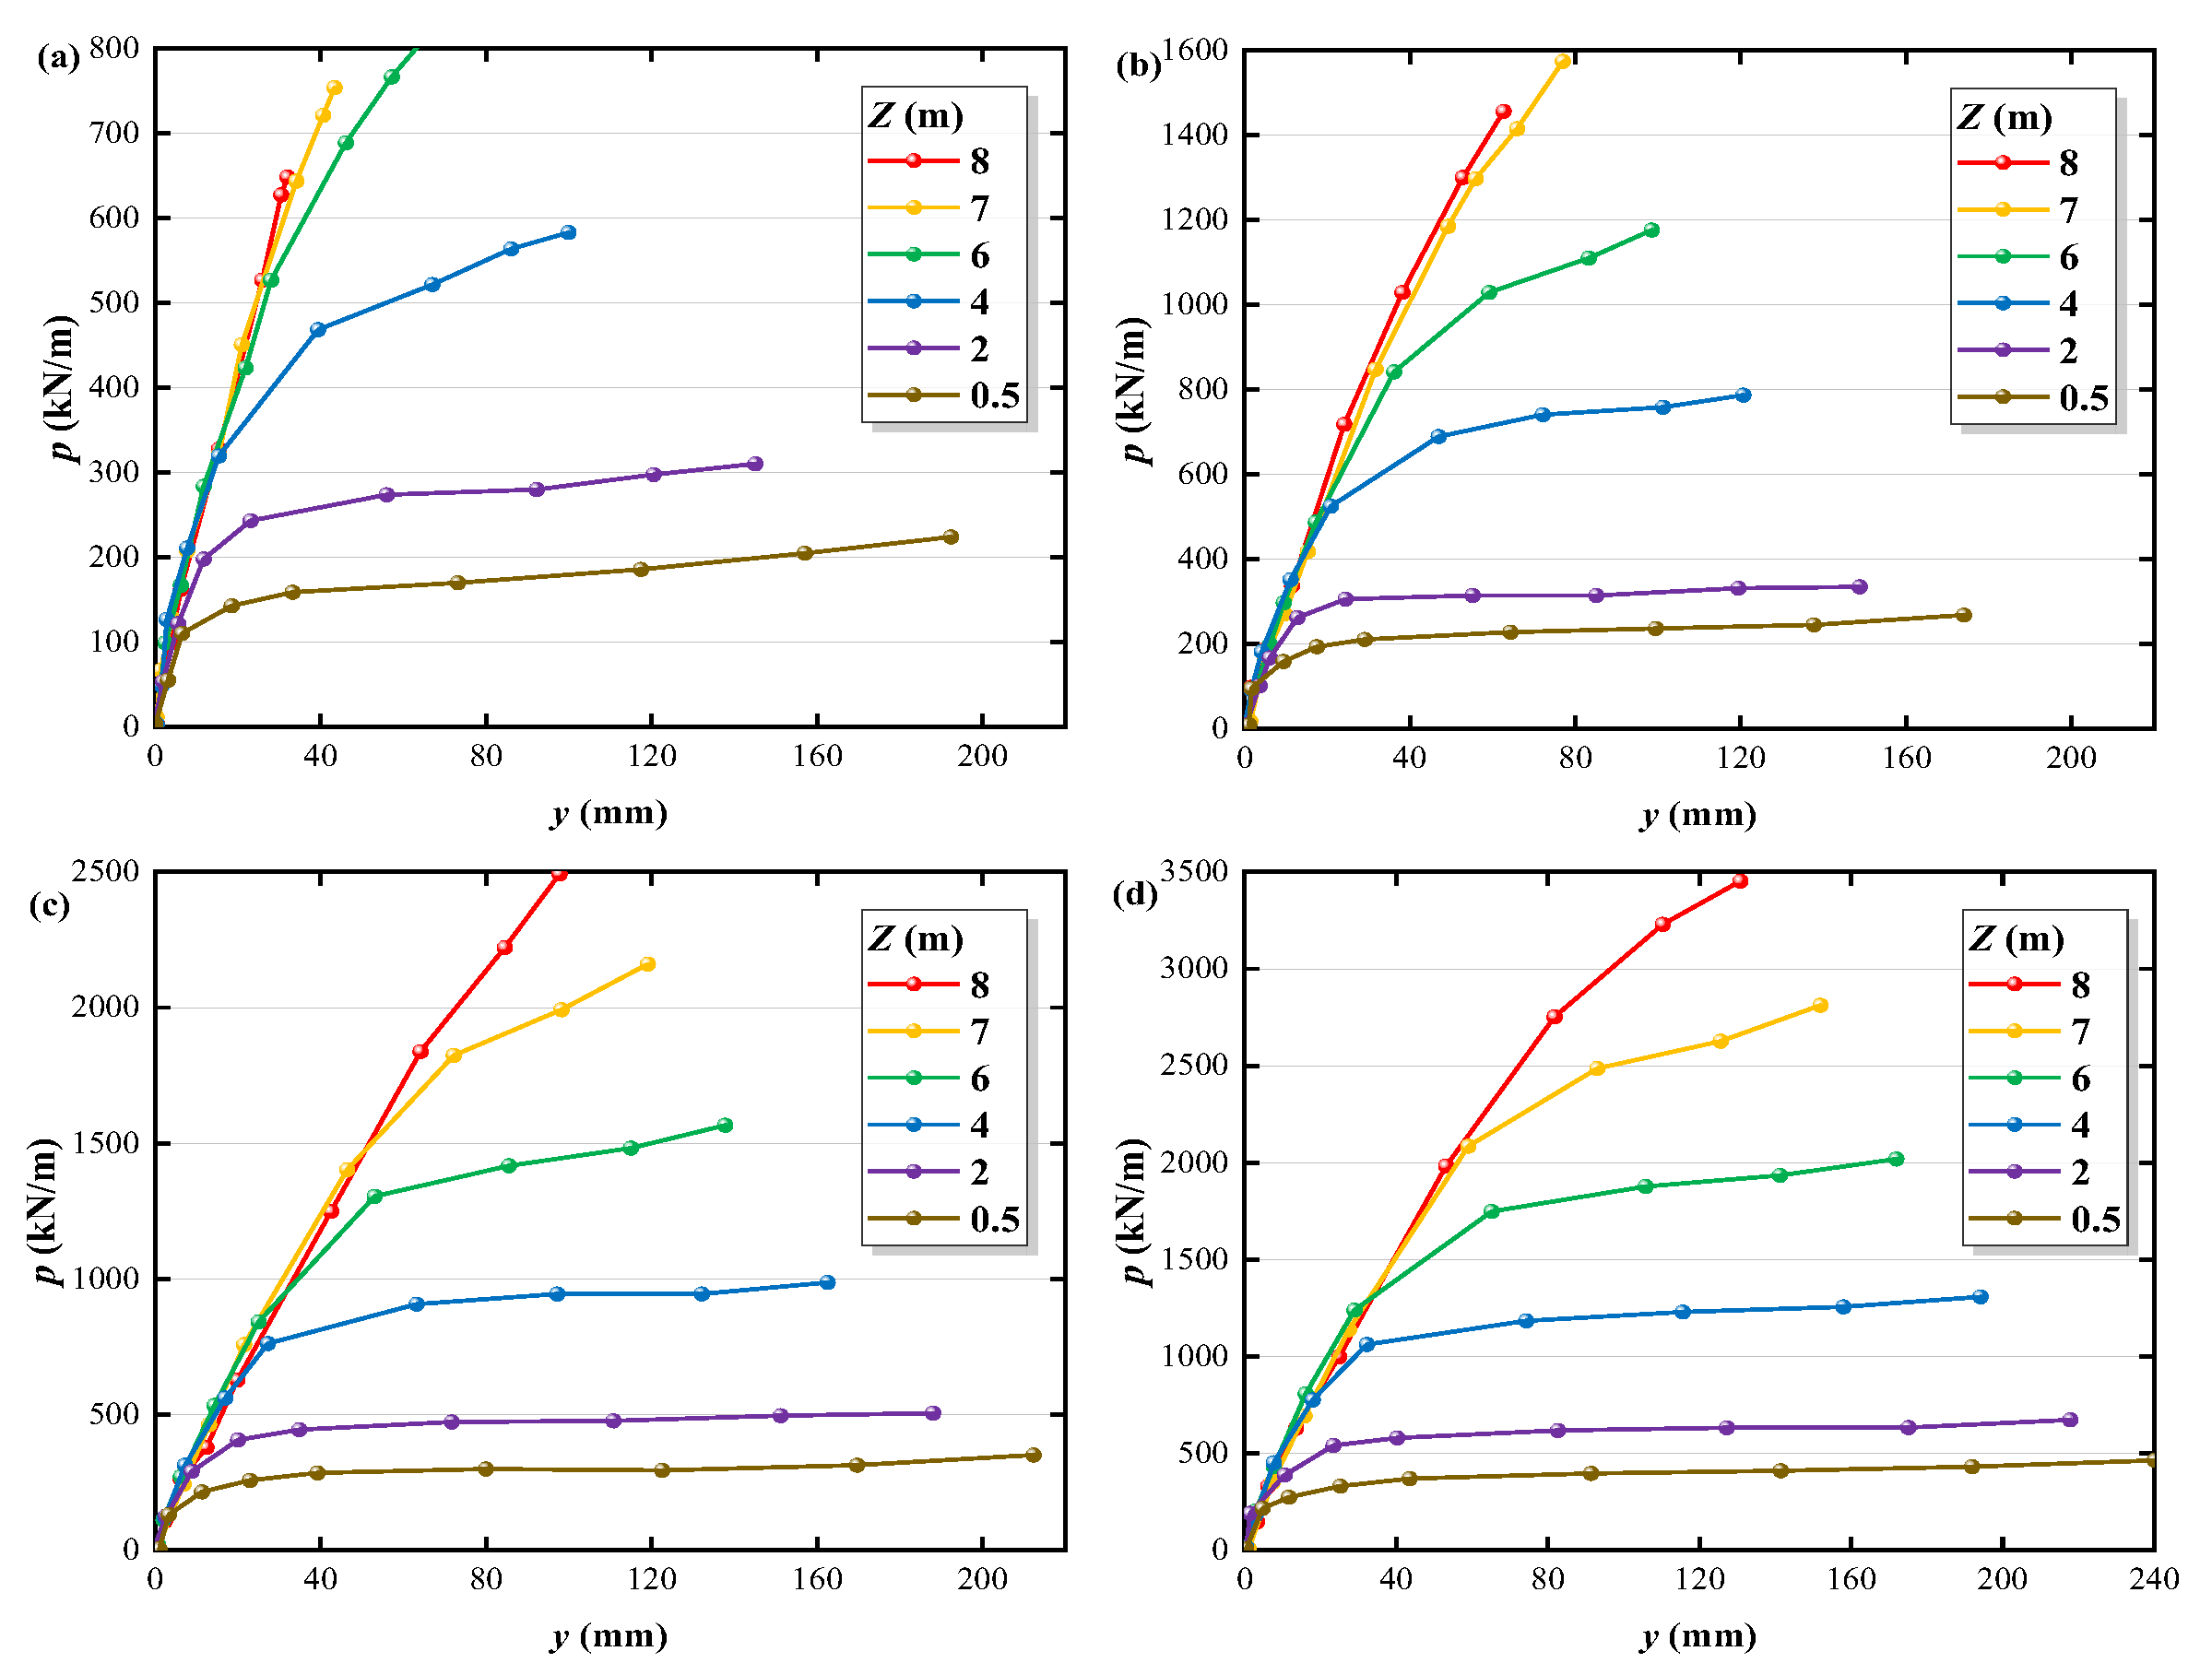
Based on the numerical simulation results, the p-y curves at various depths Z below the mudline for different pile diameters D in sandy soil were obtained, as shown in Figure 7. It can be observed from Figure 7 that the p-y curves of the sand layer at different depths and for different pile diameters approximately follow a hyperbolic shape, with a distinct inflection point present in each curve. Prior to the inflection point, the lateral soil resistance increases nearly linearly with horizontal displacement, while beyond the inflection point, it gradually stabilizes. For a given pile diameter, as the depth increases, the slope of the initial linear segment before the inflection point increases, indicating a higher initial stiffness; the ultimate soil resistance corresponding to the inflection point also increases. Similarly, at the same depth, as the pile diameter increases, the slope of the initial segment rises, and the ultimate soil resistance is enhanced.

4.3. Initial Stiffness Analysis

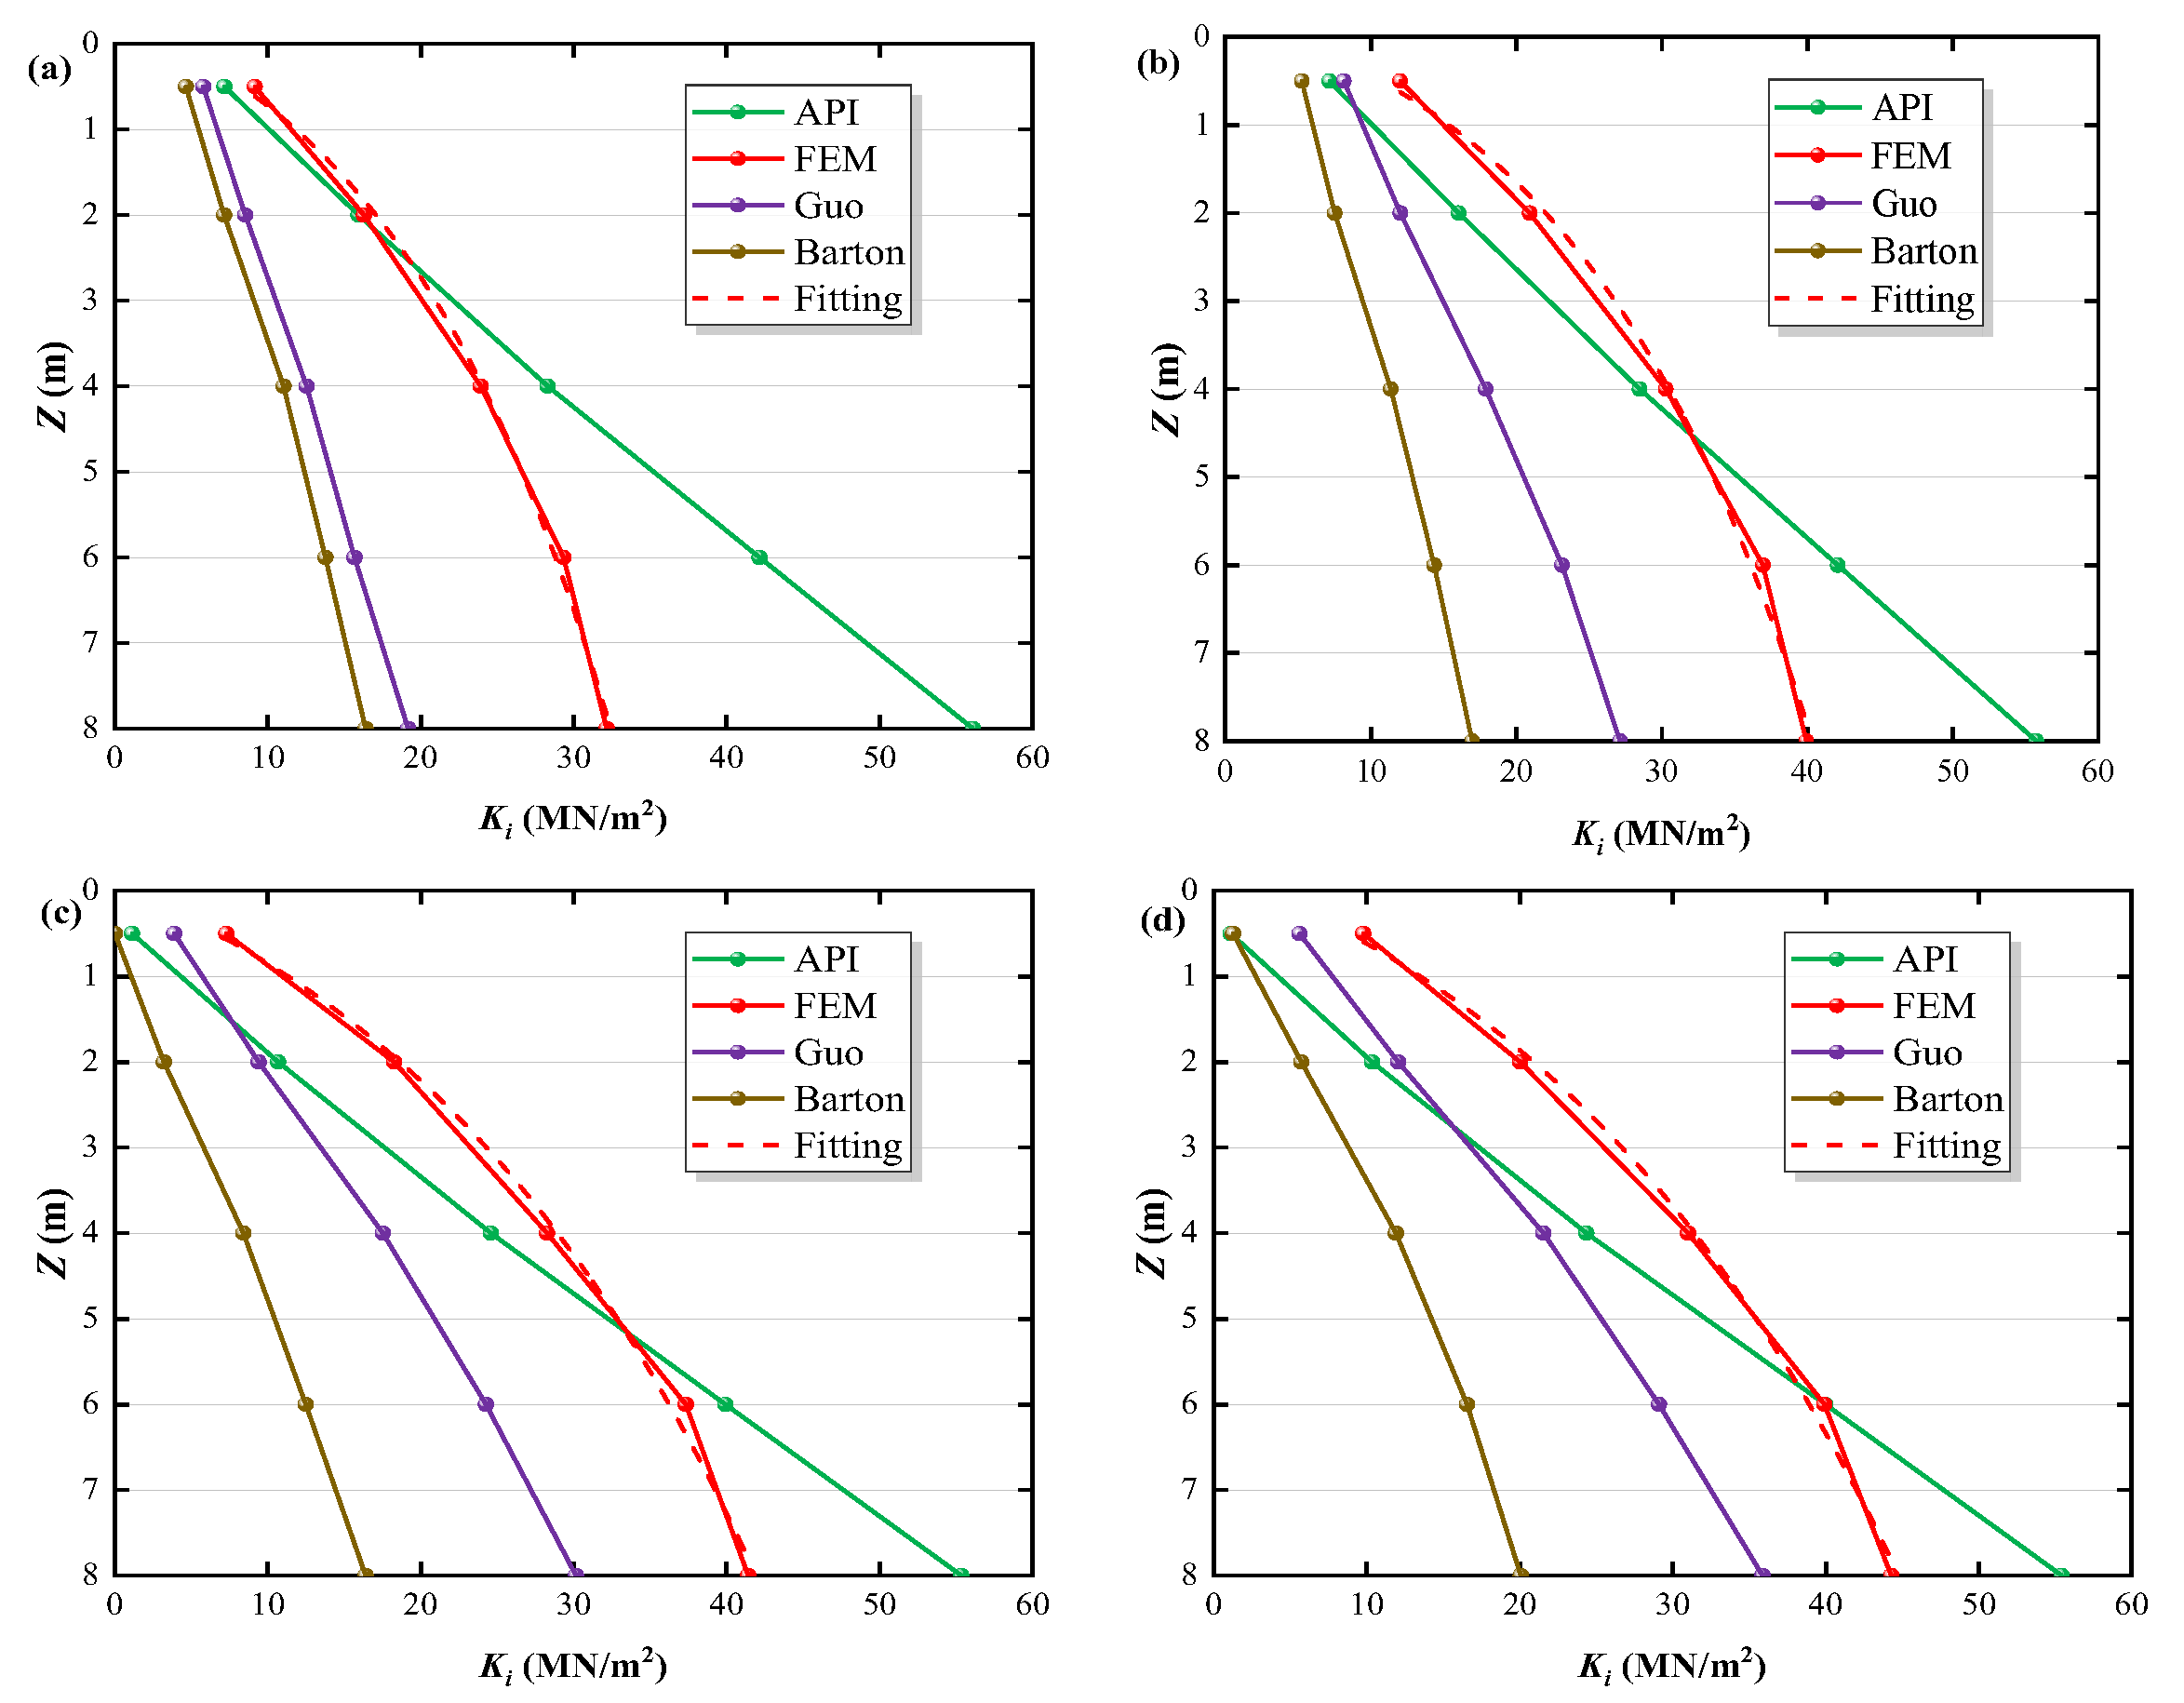
The Ki value obtained by hyperbolic curve fitting of Figure 8 was taken as the initial stiffness of the soil for numerical simulation, and compared with the initial stiffness obtained by the calculation methods of API specification [26], Guo [28], and Barton [29]. The comparison results are shown in Figure 8. It can be seen from Figure 8 that in sandy soil foundation, there are certain errors between the initial stiffness obtained by different calculation methods and the numerical model results. The initial stiffness of the Guo method [28] and the Barton method [29] is smaller than the numerical model value, and both of these two methods underestimate the initial bearing capacity of sandy soil. The reason is that the API specification is based on the test of small-diameter single piles, while the Guo method [28] and the Barton method [29] are based on indoor scale-down tests. The test results of the three methods all have certain limitations.
For sandy soil foundation, based on the numerical simulation results and referring to the functional form of the existing empirical formula, it is assumed that the initial stiffness Ki shows a power function increase with the pile diameter D and the depth Z from the mud surface. The power function form is K i = a × Z b × D c , where a, b, and c are fitting parameters. Through linearization processing (applying multiple linear regression after taking the natural logarithm), the parameter values are 9.78, 0.75, and 0.18, respectively. The fitted determination coefficient R2 is 0.98, and the fitting results are shown in Figure 7. The functional expression of the initial stiffness Ki is as follows:
K i = 9.78 × Z 0.75 × D 0.18

4.4. Analysis of Soil’s Ultimate Resistance

Since the p-y curve of the sandy soil foundation at a greater depth below the mud surface has not reached the peak value, the pu value obtained by hyperbolic curve fitting of Figure 9 is now taken as the ultimate soil resistance in the numerical simulation and compared with the commonly used calculation methods of ultimate resistance such as the Sorensen method [30], the Kallehave method [31], the Kim method [32], and the Zhu Bin method [33], and the results are shown in Figure 9.
It can be known from Figure 9 that in sandy soil foundation, there are certain differences between the ultimate resistances calculated by different theoretical methods and the numerical model results. When the pile diameter is 1 m, the numerical model result of the ultimate resistance is greater than the theoretical calculation result. With the increase in the pile diameter, the ultimate resistance value obtained by the numerical simulation gradually approaches that of the Sorensen method [30]. On the whole, the calculation results of the Kim method [32], the Kallehave method [31] and the Sorensen method [30] are smaller, underestimating the ultimate resistance of the sandy soil foundation, and are conservative in the application of practical engineering. However, the ultimate resistance obtained by the Zhu Bin method [33] is too large when the pile diameter exceeds 3 m. The commonly used calculation methods of ultimate resistance are not applicable to the fixed single-pile foundation of offshore photovoltaic.
For sandy soil foundation, based on the results of numerical simulation and referring to the functional form of the existing empirical formula, it is assumed that the ultimate soil resistance pu increases as a power function with the pile diameter D and the depth Z. The power function is p u = a × K p × γ × D b × Z c , where Kp is the coefficient of passive earth pressure, γ is the effective unit weight of the soil. According to the test results of the on-site silty sand foundation, Kp is 1.7 and γ is 9.2, and a, b, and c are fitting parameters. Using the nonlinear regression method Levenberg–Marquardt algorithm for fitting, the parameter values obtained are 2.45, 0.81, and 0.93, respectively. The fitted determination coefficient R2 is 0.96, and the fitting results are shown in Figure 9. The functional expression of the ultimate resistance pu is as follows:
p u = 2.45 × K p × γ × D 0.81 × Z 0.93

4.5. Comparative Analysis of Norms

The comparison curves of the initial stiffness and ultimate resistance of different pile diameters with respect to the API specification are shown in Figure 10. When the pile diameter is 2 m, the initial stiffness obtained by the API specification [26] is relatively large. As the pile diameter D increases, the numerical model values of the initial stiffness gradually exceed the calculated values of the API specification, and for the same pile diameter, as the depth increases, the numerical model values first approach the calculated values of the API specification and then are far less than the API specification results. This confirms the inapplicability of the API specification to the fixed single-pile foundation of offshore photovoltaic systems. The calculation results of the API specification [20] are underestimated, underestimating the ultimate resistance of sandy soil foundation, and are conservative in practical engineering applications.

4.6. Correction of p-y Curve

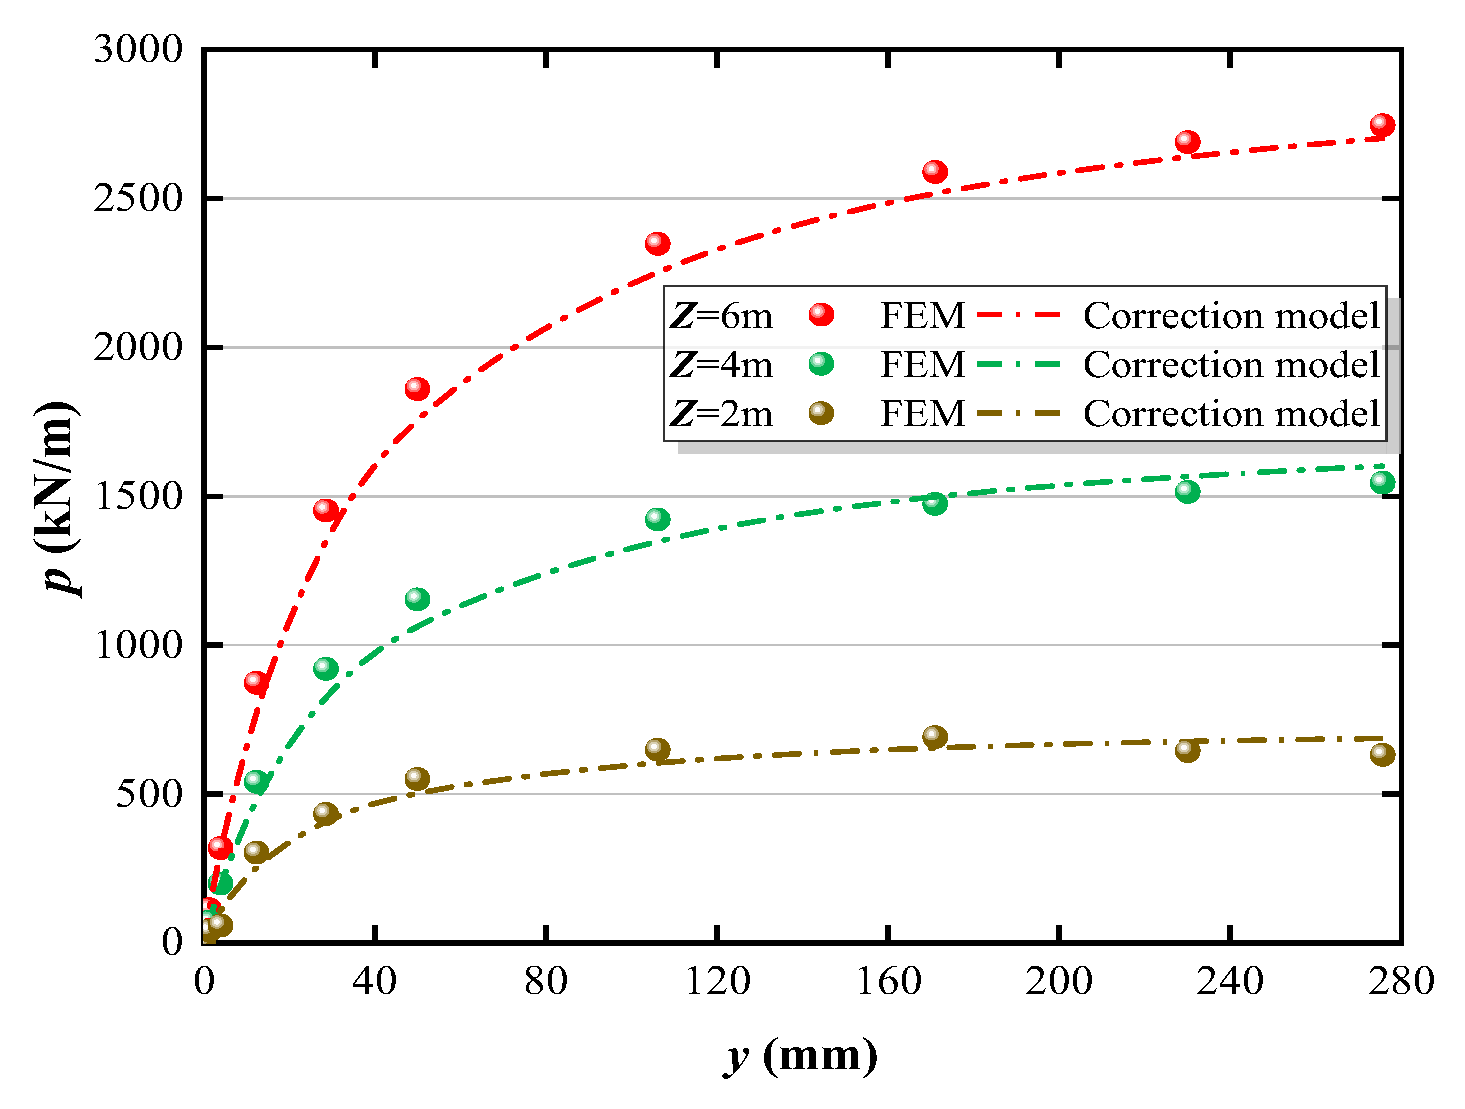
To further develop a calculation formula for the p-y curves applicable to fixed offshore photovoltaic monopiles in sandy soil layers, a modified hyperbolic model was adopted based on the aforementioned solutions for initial stiffness and ultimate soil resistance. The p-y curves derived from this model were compared with those obtained from the API specification [26] and the conventional hyperbolic model [27]. The p-y curves calculated by these different methods—exemplified for a pile with a diameter of 3 m at a depth of 6 m below the mudline—are presented in Figure 11.
To validate the universality of the modified hyperbolic model, a three-dimensional solid model of a pile-soil system with a diameter of 5 m was developed, while keeping all other parameters consistent with those described previously. Finite element analysis was subsequently carried out. A comparison between the p-y curves obtained from numerical simulations at various depths for the 5 m diameter monopile and those derived from the modified hyperbolic model is presented in Figure 12.
As illustrated in Figure 12, the initial stiffness and ultimate resistance of the soil calculated using the modified hyperbolic model are closely aligned with the numerical simulation results. The p-y curves from both methods exhibit strong agreement, and the expanded range of pile diameters further confirms the validity of the modified hyperbolic model. This model offers valuable reference for future studies on p-y curves of fixed monopile foundations in offshore photovoltaic applications.

4.7. Design and Construction

The offshore construction environment is complex, requiring special attention to the following aspects:
Precise Positioning and Control: Offshore construction is significantly affected by wind, waves, and currents. It is recommended to employ high-precision positioning methods. For example, the “T-type positioning method” or the dual-control technology of “GPS + total station” can effectively ensure that the planar position and verticality error of steel pipe piles remain within acceptable limits. During pile driving, the verticality deviation is typically required to be no greater than 0.5%.
Scientific Pile Driving and “Pile Slippage” Prevention:
“Heavy Hammer, Light Impact”: Employing a heavy hammer with low-energy light impacts during the initial phase prevents “pile slippage” accidents caused by sudden loss of pile tip resistance.
Final Hammer Standard: Adopt a dual-control standard of “penetration rate-elevation.” This means prioritizing the pile cap reaching the design elevation as the primary indicator, while using the average penetration rate of the final hammering sequence as a supplementary verification.
Corrosion Protection and Durability Design:
The marine salt spray environment is highly corrosive, necessitating long-term anti-corrosion measures for steel pipe piles. Key methods include increasing corrosion allowance (by appropriately thickening the pipe wall), applying high-performance anti-corrosion coatings, and implementing cathodic protection using sacrificial anodes.

5. Conclusions

This paper conducts a static load test on single-pile horizontal loading in offshore sandy soil foundation, and based on the ABAQUS finite element simulation software, analyzes the failure mode of the fixed offshore photovoltaic single-pile foundation in sandy soil foundation, and studies the influence of the horizontal bearing capacity characteristics of the single-pile foundation. The p-y curve of sandy soil foundation is corrected by using the curve fitting and inverse analysis method. This paper proposes a method for calculating the horizontal bearing capacity of steel pipe piles in marine sandy soil foundations. This method can compute the p-y curves for steel pipes of various dimensions in sandy soil layers. Subsequently, the finite difference method is used to calculate the pile bearing capacity and bending moment distribution, providing reference values for soil layers with similar geological conditions. Currently, this method is limited to calculating the horizontal bearing capacity of steel pipe piles in marine sandy soil foundations. For application in other engineering projects, For instance, in foundations using PHC pipe piles in silty clay layers, the p-y curve can be re-derived and modified following the methodology outlined in this paper. The main conclusions are as follows:
(1)
Under the action of horizontal ultimate load, the failure mode of the fixed offshore photovoltaic single-pile foundation in sandy soil foundation is mainly the wedge-shaped failure of the shallow soil around the pile. With the increase in pile diameter, the failure depth of the shallow soil increases, but the severe failure area is within 8 m below the mud surface.
(2)
In sandy soil foundation, the initial stiffness Ki and ultimate resistance pu of the offshore photovoltaic fixed single-pile foundation are in a power function model with pile diameter and distance from the mud surface. The fitting determination coefficient R2 is greater than 0.96, and the fitting relationship is good.
(3)
For sandy soil foundation, the p-y curve obtained by API specification and hyperbolic model has a large error, and both underestimate the bearing capacity of the soil. However, the corrected hyperbolic model proposed in this paper is in good agreement with the numerical model, and this method has certain guiding significance for the optimization design of offshore photovoltaic fixed single-pile foundation.

Author Contributions

Methodology, S.F.; Supervision, H.C.; Software, G.-e.L.; Validation, X.J.; Formal analysis, X.L. All authors have read and agreed to the published version of the manuscript.

Funding

Much of the work described in this paper was supported by the National Key R&D Program of China (No. 2024YFB4207000); the National Natural Science Foundation of China (No. 52478371 and No. 52508422); and the Key Laboratory of Geotechnical and Underground Engineering, Ministry of Education, Tongji University (No. KLE-TJGE-B2502).

Data Availability Statement

Data will be made available on reasonable request.

Conflicts of Interest

Authors Sai Fu, Guo-er Lv and Xianlin Jia was employed by the company PowerChina Huadong Engineering Corporation Limited. The remaining authors declare that the research was conducted in the absence of any commercial or financial relationships that could be construed as a potential conflict of interest.

References

  1. Ahmad, M.; Jiang, P.; Majeed, A.; Umar, M.; Khan, Z.; Muhammad, S. The dynamic impact of natural resources, technological innovations and economic growth on ecological footprint: An advanced panel data estimation. Resour. Policy 2020, 69, 101817. [Google Scholar] [CrossRef]
  2. Hu, J.K.; Teng, K.; Li, C.J.; Li, X.P.; Wang, J.; Lund, P.D. Review of recent water photovoltaics development. Oxf. Open Energy 2023, 2, oiad005. [Google Scholar] [CrossRef]
  3. Pérez, J.A.; Ponce-Torres, A.; Ríos, J.D.; Sánchez-González, E. Fatigue Behavior of H-Section Piles under Lateral Loads in Cohesive Soil. Buildings 2024, 14, 3228. [Google Scholar] [CrossRef]
  4. Wang, L.; Li, J.X.; Bai, W.Y.; Xie, X.Y.; Mao, X.; Ren, Z.F.; Liu, J.K. Study on the bearing capacity optimization and performance of photovoltaic support in desert sand and gravel area based on bionics. Sci. Rep. 2025, 15, 9638. [Google Scholar] [CrossRef] [PubMed]
  5. Zhang, J.; Li, R.Q.; Yang, S.C.; Liu, J.W.; Guo, Z.; Feng, L.Y.; Shang, W.C.; Zhu, L.; Du, B.K. Field load testing and numerical analysis of offshore photovoltaic steel pipe piles. Soil Dyn. Earthq. Eng. 2025, 188, 109034. [Google Scholar] [CrossRef]
  6. Liu, G.L.; Fu, S.J.; Zhao, X.F.; Jiang, W.; Li, D.; Fu, S.B. Frost jacking characteristics of steel pipe screw piles for photovoltaic support foundations in high-latitude and low-altitude regions. Soils Found. 2023, 63, 101277. [Google Scholar]
  7. Su, X.J.; Li, Z.H.; Wang, Q.; Li, J.X.; Xie, X.Y.; Mao, X.; Ren, Z.F.; Liu, J.K. Comparison and Optimization of Bearing Capacity of Three Kinds of Photovoltaic Support Piles in Desert Sand and Gravel Areas. Buildings 2024, 14, 2559. [Google Scholar] [CrossRef]
  8. Al-Atroush, M.E.; Aboelela, A.E.; Hemdan, E.E. Beyond p-y method: A review of artificial fi cial intelligence approaches for predicting lateral capacity of drilled shafts in clayey soils. J. Rock Mech. Geotech. Eng. 2024, 16, 3812–3840. [Google Scholar]
  9. Park, J.J.; Yang, K.H.; Hu, J.C.h. Analysis of p-y Curve of Drilled Shafts Socketed into Basalt at Jeju Island. Int. J. Offshore Polar Eng. 2017, 27, 374–382. [Google Scholar] [CrossRef]
  10. Kim, Y.; Jeong, S.; Won, J. Effect of Lateral Rigidity of Offshore Piles Using Proposed p-y Curves in Marine Clay. Mar. Georesources Geotechnol. 2009, 27, 53–77. [Google Scholar] [CrossRef]
  11. Wang, X.F.; Li, S.X.; Li, J.L. Experimental and numerical study on lateral response of pile-group for offshore wind turbines in sand. Mar. Georesources Geotechnol. 2023, 41, 524–543. [Google Scholar] [CrossRef]
  12. Yoo, M.T.; Choi, J.I.; Han, J.T.; Kim, M.M. Dynamic P-Y Curves for Dry Sand from Centrifuge Tests. J. Earthq. Eng. 2013, 17, 1082–1102. [Google Scholar] [CrossRef]
  13. Bouzid, D.A. Numerical Investigation of Large-Diameter Monopiles in Sands: Critical Review and Evaluation of Both API and Newly Proposed p-y Curves. Int. J. Geomech. 2018, 18, 04018141. [Google Scholar] [CrossRef]
  14. Hotak, A.H.; Zhao, Q.H.; Rasheedy, B.A. Review of soil liquefaction effect on the bridge response and comparative study of P-Y methods for soil liquefaction. Multiscale Multidiscip. Model. Exp. Des. 2025, 8, 95. [Google Scholar] [CrossRef]
  15. Khan, Z.; Ali, S.; Umar, M.; Kirikkaleli, D.; Jiao, Z.L. Consumption-based carbon emissions and International trade in G7 countries: The role of Environmental innovation and Renewable energy. Sci. Total Environ. 2020, 730, 138945. [Google Scholar] [CrossRef] [PubMed]
  16. Wu, J.J.; Pu, L.J.; Zhai, C.M. A Review of Static and Dynamic p-y Curve Models for Pile Foundations. Buildings 2024, 14, 1507. [Google Scholar] [CrossRef]
  17. Dash, S.R.; Bhattacharya, S. Experimental p-y curves for liquefied soils from centrifuge tests. Earthq. Eng. Eng. Vib. 2021, 20, 863–876. [Google Scholar] [CrossRef]
  18. Wang, H.; Wang, L.Z.; Hong, Y.; He, B.; Zhu, R.H. Quantifying the influence of pile diameter on the load transfer curves of laterally loaded monopile in sand. Appl. Ocean. Res. 2020, 101, 102196. [Google Scholar] [CrossRef]
  19. Liu, P.; Jiang, C. A new p-y curve criterion for piles in proximity to undrained clay slopes. Comput. Geotech. 2023, 164, 105801. [Google Scholar] [CrossRef]
  20. Lim, H.; Jeong, S. Simplified p-y curves under dynamic loading in dry sand. Soil Dyn. Earthq. Eng. 2018, 113, 101–111. [Google Scholar] [CrossRef]
  21. Wang, M.Y.; Wang, M.; Cheng, X.L.; Lu, Q.; Lu, J.Q. A New p-y Curve for Laterally Loaded Large-Diameter Monopiles in Soft Clays. Sustainability 2022, 14, 15102. [Google Scholar] [CrossRef]
  22. JGJ 106-2014; Technical Code for Testing of Building Foundation Piles. Ministry of Housing and Urban-Rural Development of the People’s Republic of China: Beijing, China, 2014.
  23. Zhang, X.; Zhou, R.; Xu, C. Study on Corrected p-y Curve Model of Pile Foundation of Offshore Wind Turbines. Acta Energiae Solaris Sin. 2023, 44, 290–297. [Google Scholar]
  24. Zhang, X.-l.; Zhou, R.; Zhang, G.-L.; Han, Y. A corrected p-y curve model for large-diameter pile foundation of offshore wind turbine. Ocean. Eng. 2023, 273, 114012. [Google Scholar] [CrossRef]
  25. He, R.; Zhu, T.; Ma, B.; Guo, Z. Lateral static stiffness of offshore monopile socketed in soft rock. Mar. Struct. 2022, 86, 103302. [Google Scholar] [CrossRef]
  26. Institute, A.P. Recommended Practice for Planning, Designing and Constructing Fixed Offshore Platforms-Working Stress Design; American Petroleum Institute Publishing Services: Washington, DC, USA, 2000. [Google Scholar]
  27. Klinkvort, R.T.; Hededal, O. Effect of load eccentricity and stress level on monopile support for offshore wind turbines. Can. Geotech. J. 2014, 51, 966–974. [Google Scholar] [CrossRef]
  28. Bitang, G.W.Z. Laterally loaded fixedheaded piles in sand. In Proceedings of the 9th Australia New Zealand Conference on Geomechanics, Auckland, New Zealand, 8–11 February 2004; pp. 88–94. [Google Scholar]
  29. Barton, Y.O. Laterally Loaded Model Piles in Sand: Centrifuge Tests and Finite Element Analyses. Doctoral Dissertation, University of Cambridge, Cambridge, UK, 1982. [Google Scholar]
  30. Sørensen, S.P.H.; Ibsen, L.B.; Augustesen, A.H. Effects of diameter on initial stiffness of p-y curves for large-diameter piles in sand. In Numerical Methods in Geotechnical Engineering; CRC Press: Boca Raton, FL, USA, 2010. [Google Scholar]
  31. Kallehave, D.; Thilsted, C.L.; Liingaard, M.A. Modification of the API p-y Formulation of Initial Stiffness of Sand. In Proceedings of the 7th International Conference: Offshore Site Investigation and Geotechnics: Integrated Technologies-Present and Future, London, UK, 12–14 September 2012. [Google Scholar]
  32. Kim, D.; Choo, Y.W.; Kwak, K. Comparison of Lateral Behavior of Rock-Socketed Large-Diameter Offshore Monopiles in Sands with Different Relative Densities. Int. J. Offshore Polar Eng. 2015, 25, 156–160. [Google Scholar]
  33. Zhu, B.; Zhu, R.; Luo, J.; Chen, R.; Kong, L. Model tests on characteristics of ocean and offshore elevated piles with large lateral deflection. Chin. J. Geotech. Eng. 2010, 32, 521–530. [Google Scholar]
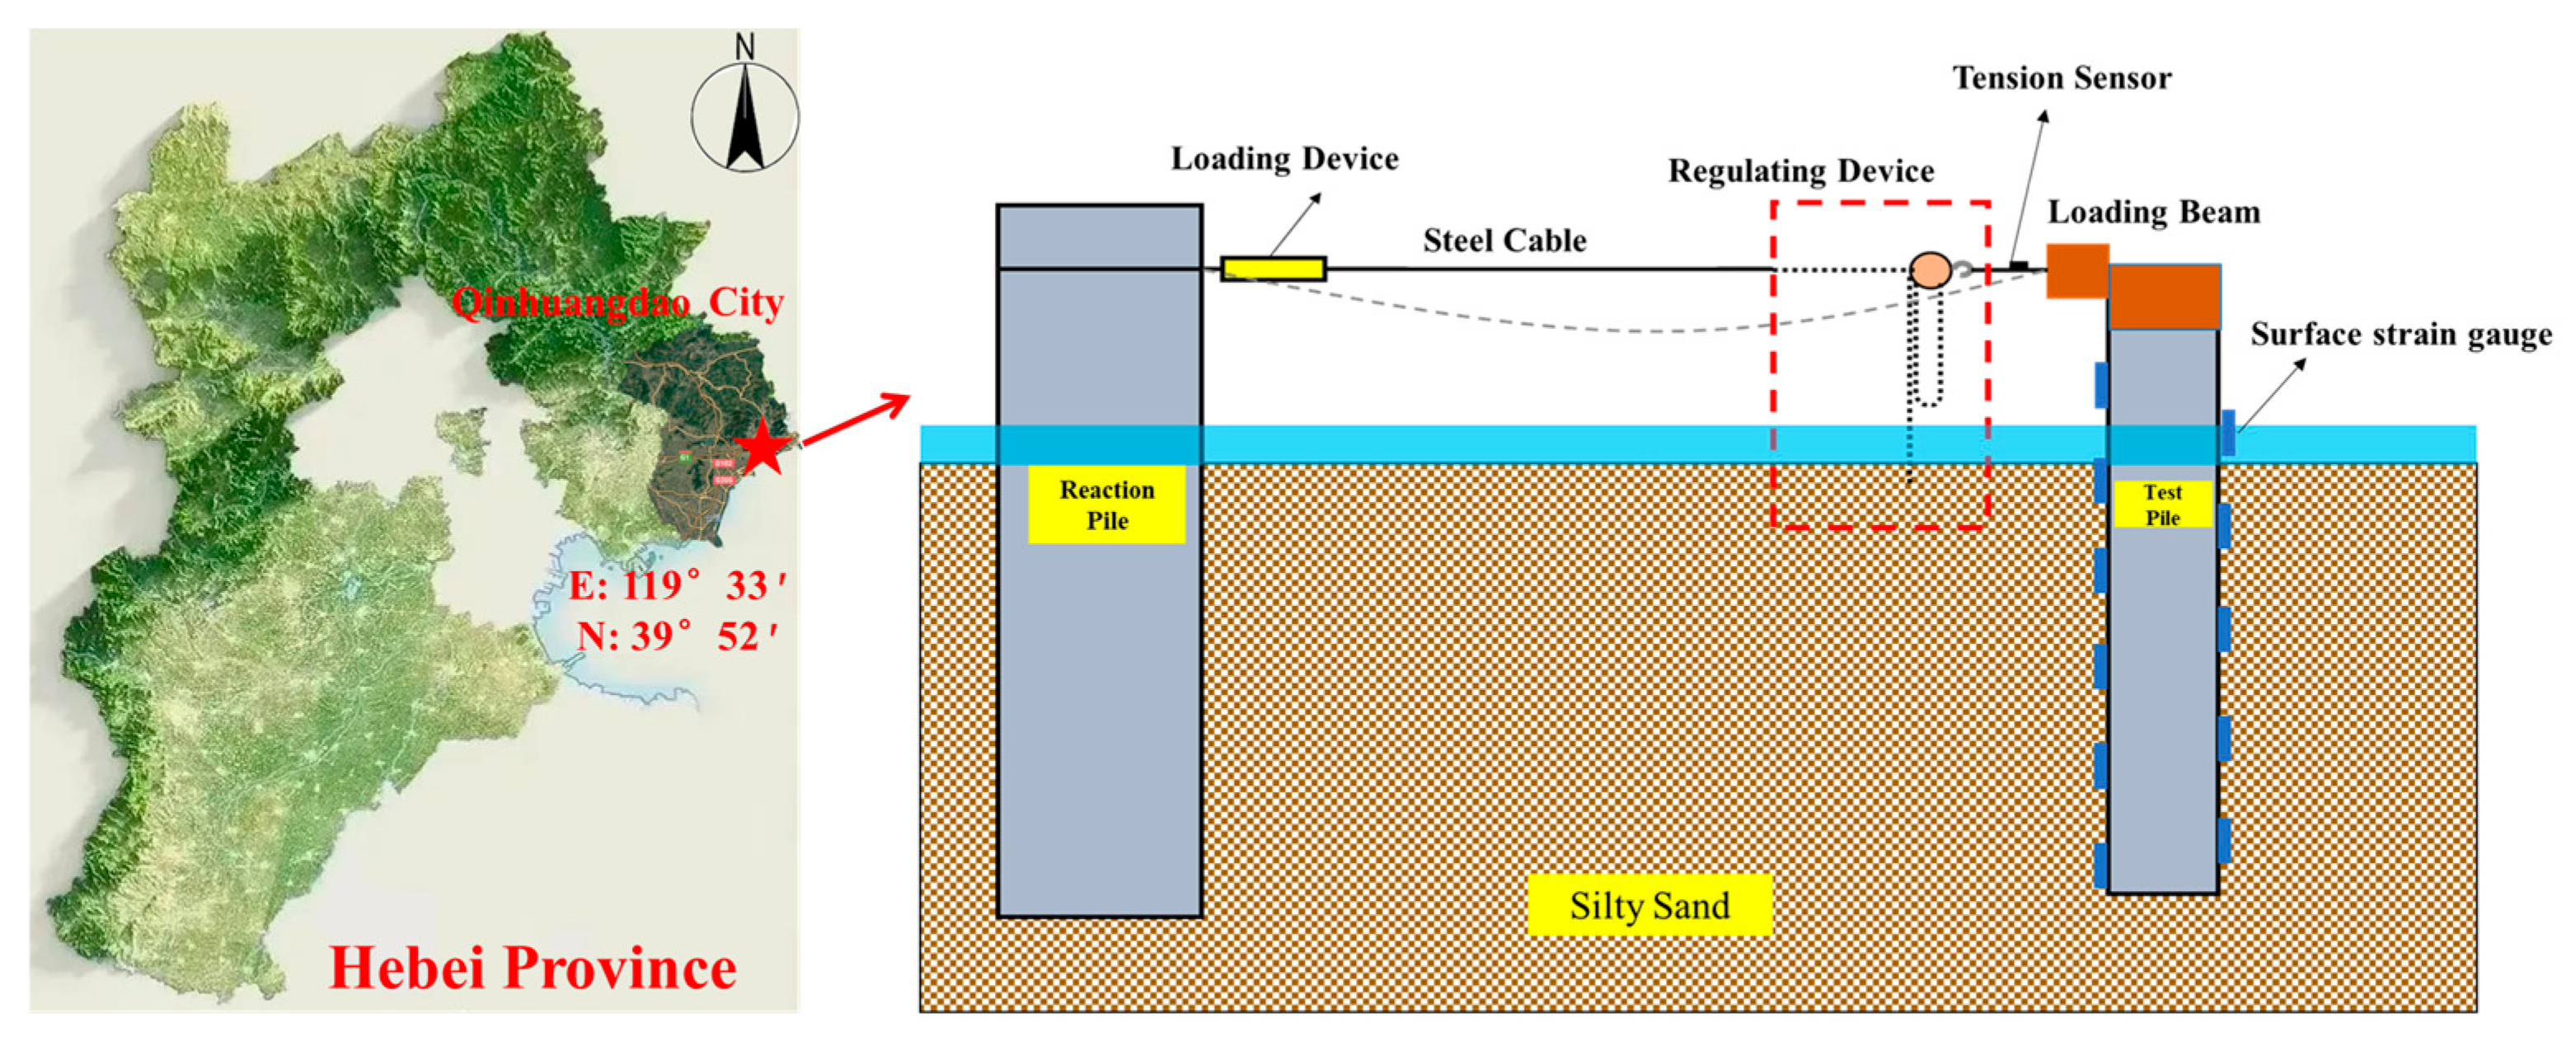
Figure 1. Layout diagram of horizontal load test.
Jmse 13 01959 g001
Figure 2. Measured Data of the Test Pile: (a) Displacement−load curve at the muddy surface (b) Bending moment of the pile body.
Jmse 13 01959 g002
Figure 3. Finite Element Model.
Jmse 13 01959 g003
Figure 4. Numerical Simulation Results and Experimental Results: (a) Load−displacement curve of point load loading; (b) Bending moment of the pile shaft (corresponding to the bending moment of 432 kN).
Jmse 13 01959 g004
Figure 5. Equivalent plastic strain of single piles with different diameters under horizontal load: (a) D = 1 m; (b) D = 2 m; (c) D = 3 m; (d) D = 4 m.
Jmse 13 01959 g005
Figure 6. Displacement distribution and pile body response of single piles with different diameters under horizontal load: (a) Stress response of pile with diameter D = 1 m; (b) Stress response of pile with diameter D = 4 m; (c) Displacement distribution of pile with diameter D = 1 m; (d) Displacement distribution of pile with diameter D = 4 m.
Jmse 13 01959 g006
Figure 7. p-y curves at different depths for different pile diameters in sandy soil: (a) D = 1 m; (b) D = 2 m; (c) D = 3 m; (d) D = 4 m.
Jmse 13 01959 g007
Figure 8. Curves of the initial stiffness of different pile diameters varying with depth: (a) D = 1 m; (b) D = 2 m; (c) D = 3 m; (d) D = 4 m.
Jmse 13 01959 g008
Figure 9. Curve showing the variation in ultimate resistance with depth for different pile diameters: (a) D = 1 m; (b) D = 2 m; (c) D = 3 m; (d) D = 4 m.
Jmse 13 01959 g009
Figure 10. Comparison curves of initial stiffness and ultimate resistance for different pile diameters: (a) initial stiffness; (b) ultimate resistance.
Jmse 13 01959 g010
Figure 11. p-y curve of a single pile with a diameter of 3 m at a depth of 6 m.
Jmse 13 01959 g011
Figure 12. p-y curves of each depth of a single pile with pile diameter of 5 m.
Jmse 13 01959 g012
Table 1. Current research status of offshore photovoltaic pile foundations.
Research AspectWhat Has Been Done (Established Knowledge and Transferable Insights)What Remains Scarce (The Specific Research Gap for Offshore PV)
General Industry ContextAcknowledged as an emerging industry with vast potential, but overall technology is in its early stages and faces challenges in reliability and integration. Industry experts emphasize the need for bold innovation and customized solutions for different sea areasComprehensive technical standards and mature, widely applicable design methods are lacking.
Specific Technical ChallengesKey technical difficulties have been identified, including structural durability in high salt-spray environments, stability under typhoons and strong waves, and ensuring the economic feasibility of foundationsIn-depth studies on the mechanical deformation mechanisms under these complex loads (e.g., wave-ice-wind coupling) are not thoroughly addressed.
Foundation Testing and Analysis Methods1. For Offshore Wind (Monopiles): Advanced methods beyond traditional p-y curves have been developed to analyze lateral deformation of large-diameter monopiles under long-term cyclic loads, using cyclic triaxial tests and numerical modeling.
2. For Laboratory Use: A specialized pile-soil interaction test system has been developed for jacket platforms, capable of applying static, cyclic, and impact loads. A lab-scale bearing performance detection device for offshore PV piles has also been proposed.
1. The application and validation of these advanced analysis methods (from offshore wind) specifically for offshore PV pile foundations are scarce.
2. Research on full-scale or large-scale field testing methods for the mechanical deformation of installed offshore PV piles is particularly lacking.
Table 2. Parameters of Pile Testing.
Pile NumberPile Length (m)Section Size (mm)Pile Tip Elevation (m)The Soil Layer at the Pile TipBurial Depth (m)Endurance Resistance (kN)
SZ0117.51500−12.34Silt15.211341
Table 3. Soil parameters.
Soil LayerLayer Thickness (m)Effective Unit Weight of Soil (kN/m3)Coefficient of Internal Friction (°)Relative DensitySoil–Pile Friction Angle (°)
Silt309.2290.2526
Disclaimer/Publisher’s Note: The statements, opinions and data contained in all publications are solely those of the individual author(s) and contributor(s) and not of MDPI and/or the editor(s). MDPI and/or the editor(s) disclaim responsibility for any injury to people or property resulting from any ideas, methods, instructions or products referred to in the content.