1. Introduction
Since ancient times, seaweed has occupied an important place in the food culture of East Asia countries and has gradually evolved into a unique cultural heritage [
1,
2]. Currently, seaweeds are not only a nutritious food source, but also have many applications such as biofuels, feed for cattle, fertilizers (bio-stimulants), pharmaceuticals, bioplastics, packaging products (from agar plasticity developed by the Japanese), and even as a construction material (e.g., sea bricks) [
3].
Most seaweed production today comes from cultivation, with only a small fraction derived from wild harvests [
4]. The world’s cultivated seaweed production has grown exponentially from 1.1 million tons in 1969 to 37.7 million tons in 2023 [
5]. The cultivation of seaweed has played a significant role in alleviating poverty, enhancing the resilience of coastal communities, and sequestering dissolved carbon dioxide [
6]. In doing so, it contributes to achieving 7 of the 17 UN Sustainable Development Goals (SDGs), including Zero Hunger, Good Health and Well-being, Decent Work and Economic Growth, Reduced Inequalities, Responsible Consumption and Production, Climate Action, and Life Below Water.
Traditional seaweed cultivation techniques, that include rope/line cultivation, net cultivation, and floating raft cultivation, are only suitable for a coastal sheltered area [
6]. These cultivation practices in nearshore sites have many advantages like easy installation, operation and harvesting [
2]. However, nearshore seaweed farming currently faces challenges that include competition for nearshore areas from urban development, shipping, recreation, fishing, nature conservation, and fish farming, as well as rising coastal seawater temperatures that slow the growth of seaweed [
7]. To overcome these shortcomings and to achieve large-scale seaweed production, cultivating seaweed in offshore waters has been proposed by an increasing number of scholars and organizations [
1,
2,
5,
8,
9].
Early offshore seaweed farming projects reveal a persistent gap between ambitious conceptual designs and the realities of exposed marine environments. The 1970s U.S. Marine Biomass Program [
10] exemplified this: the inverted-umbrella “quarter-acre module” reflected overconfidence in scaling nearshore experience offshore. After decades of practice, the programme failed because of the harsh marine environment and poor structural design [
11]. The design reflected an overreliance on engineering extrapolations from nearshore experiences while underestimating hydrodynamic loads, biofouling, and long-term maintenance challenges in exposed offshore waters. Subsequent European trials in the 2000s to 2010s—including Spain’s circular wind seaweed-seaweed integration, the Netherlands’ SPAR-buoy H-frame, and other concepts in Norway, Korea, and the Faroe Islands—suffered from similar limitations. Whether constrained by short deployment windows, instability leading to structural sinking, or inadequate redundancy against storm events, these efforts highlight a systemic lack of robust hydrodynamic modelling and risk management. None progressed to commercial adoption [
11]. In 2016, the U.S. Department of Energy’s ARPA-E MARINER program funded a four-year project aimed at identifying the optimal method for cultivating seaweed in large-scale, nearshore arrays for biofuel production. The project’s goal was to keep the production cost below USD 80 per dry metric ton of kelp. However, a key limitation of the system is that its deployment in nearshore waters does not sufficiently demonstrate whether it can withstand the more challenging conditions of offshore environments [
12]. Recently, Nguyen et al. [
2,
9] proposed a submersible High-Density Polyethylene (HDPE) circular seaweed platform concept with a single point mooring system as well as a multi-point mooring system. Although it is promising in terms of modularity and adaptability [
13], HDPE material also raises questions about long-term fatigue resistance. Promisingly, the University of New Hampshire lattice-type system [
14] demonstrated survival through one growth and harvest cycle in exposed Maine waters. Yet, weaknesses in kelp attachment strength, tension control, and operational accessibility reveal that even the most successful prototypes remain experimental rather than scalable. Taken together, these trajectories reveal three recurring barriers: (i) inadequate structural resilience against hydrodynamic extremes, (ii) material and biological interface failures (e.g., rope fatigue, weak holdfast attachment), and (iii) insufficient operational efficiency for industrial adoption.
The present paper presents a novel Submersible Seaweed Cultivation Infrastructure (named as SubSCI for brevity) that was recently developed by the Climate Foundation Australia and the University of Queensland to address the problems in offshore seaweed cultivation. SubSCI comprises square grid lines/ropes, small buoys, mobile buoys (referred to as SubTractors
TM), mooring lines, anchors, and concrete sinker weights. It is somewhat similar to the seaweed cultivation infrastructure developed by the BioArchitecture Lab (BAL) in Chile [
15], and it also shares certain features with an offshore cultivation system proposed by a team at Hohai University [
16]. SubSCI, however, adopts Ultra-High Molecular Weight Polyethylene (UHMWPE) ropes with proven strength-to-weight ratios. Unlike earlier experimental systems, SubSCI explicitly integrates lessons from past failure-prioritising redundancy, hydrodynamic validation, and modular scalability—positioning it as a step-change in offshore seaweed cultivation design.
The distinguishing feature of SubSCI is its submersible capability for deep cycling to access nutrients and for avoiding strong surface waves during storms. The “crawling” of the SubTractors along the diagonal mooring lines (as will be explained later in more detail) enables the raising and lowering of the square grid seaweed lines to access the cold, nutrient-rich waters at depths of 100 m or more. A research team from Los Angeles investigated how deep cycling affects the growth, morphology, and chemical composition of the giant kelp
Macrocystis pyrifera [
17]. Their study shows that giant kelp grown under deep-cycling conditions had an average growth rate of 5% per day and produced four times more biomass (wet weight) than individuals grown in a kelp bed without deep cycling [
17]. The primary advantage of deep cycling lies in its energy efficiency, consuming two orders of magnitude less energy than the regenerative upwelling method [
17,
18,
19,
20]. This reduced energy demand enhances its sustainability for large-scale offshore seaweed cultivation, improving economic viability and lowering operational energy costs. On the other hand, the upwelling approach requires a large amount of energy to pump a huge volume of deep water to the surface to irrigate the seaweed farm, thereby making it economically not viable [
20,
21]. Moreover, the submersible feature of SubSCI allows the seaweed platform and the seaweed to evade the destructive surface waves during storms. A notable example occurred in December 2021, when an ocean permaculture platform in Cebu waters withstood the Category-5 Super Typhoon Rai by submerging to a depth of only 5 m below the sea surface.
The layout of the paper is as follows: Following this introduction,
Section 2 presents the description of the Submersible Seaweed Cultivation Infrastructure (SubSCI).
Section 3 gives the geometrical and material properties of SubSCI while
Section 4 lists the environmental condition at the offshore site where SubSCI is deployed.
Section 5 presents the mathematical model and the hydroelastic analysis.
Section 6 describes the hydroelastic behaviour of SubSCI under wave and current actions at both surface and submerged depths.
Section 7 gives the conclusion of this study.
2. Description of SubSCI
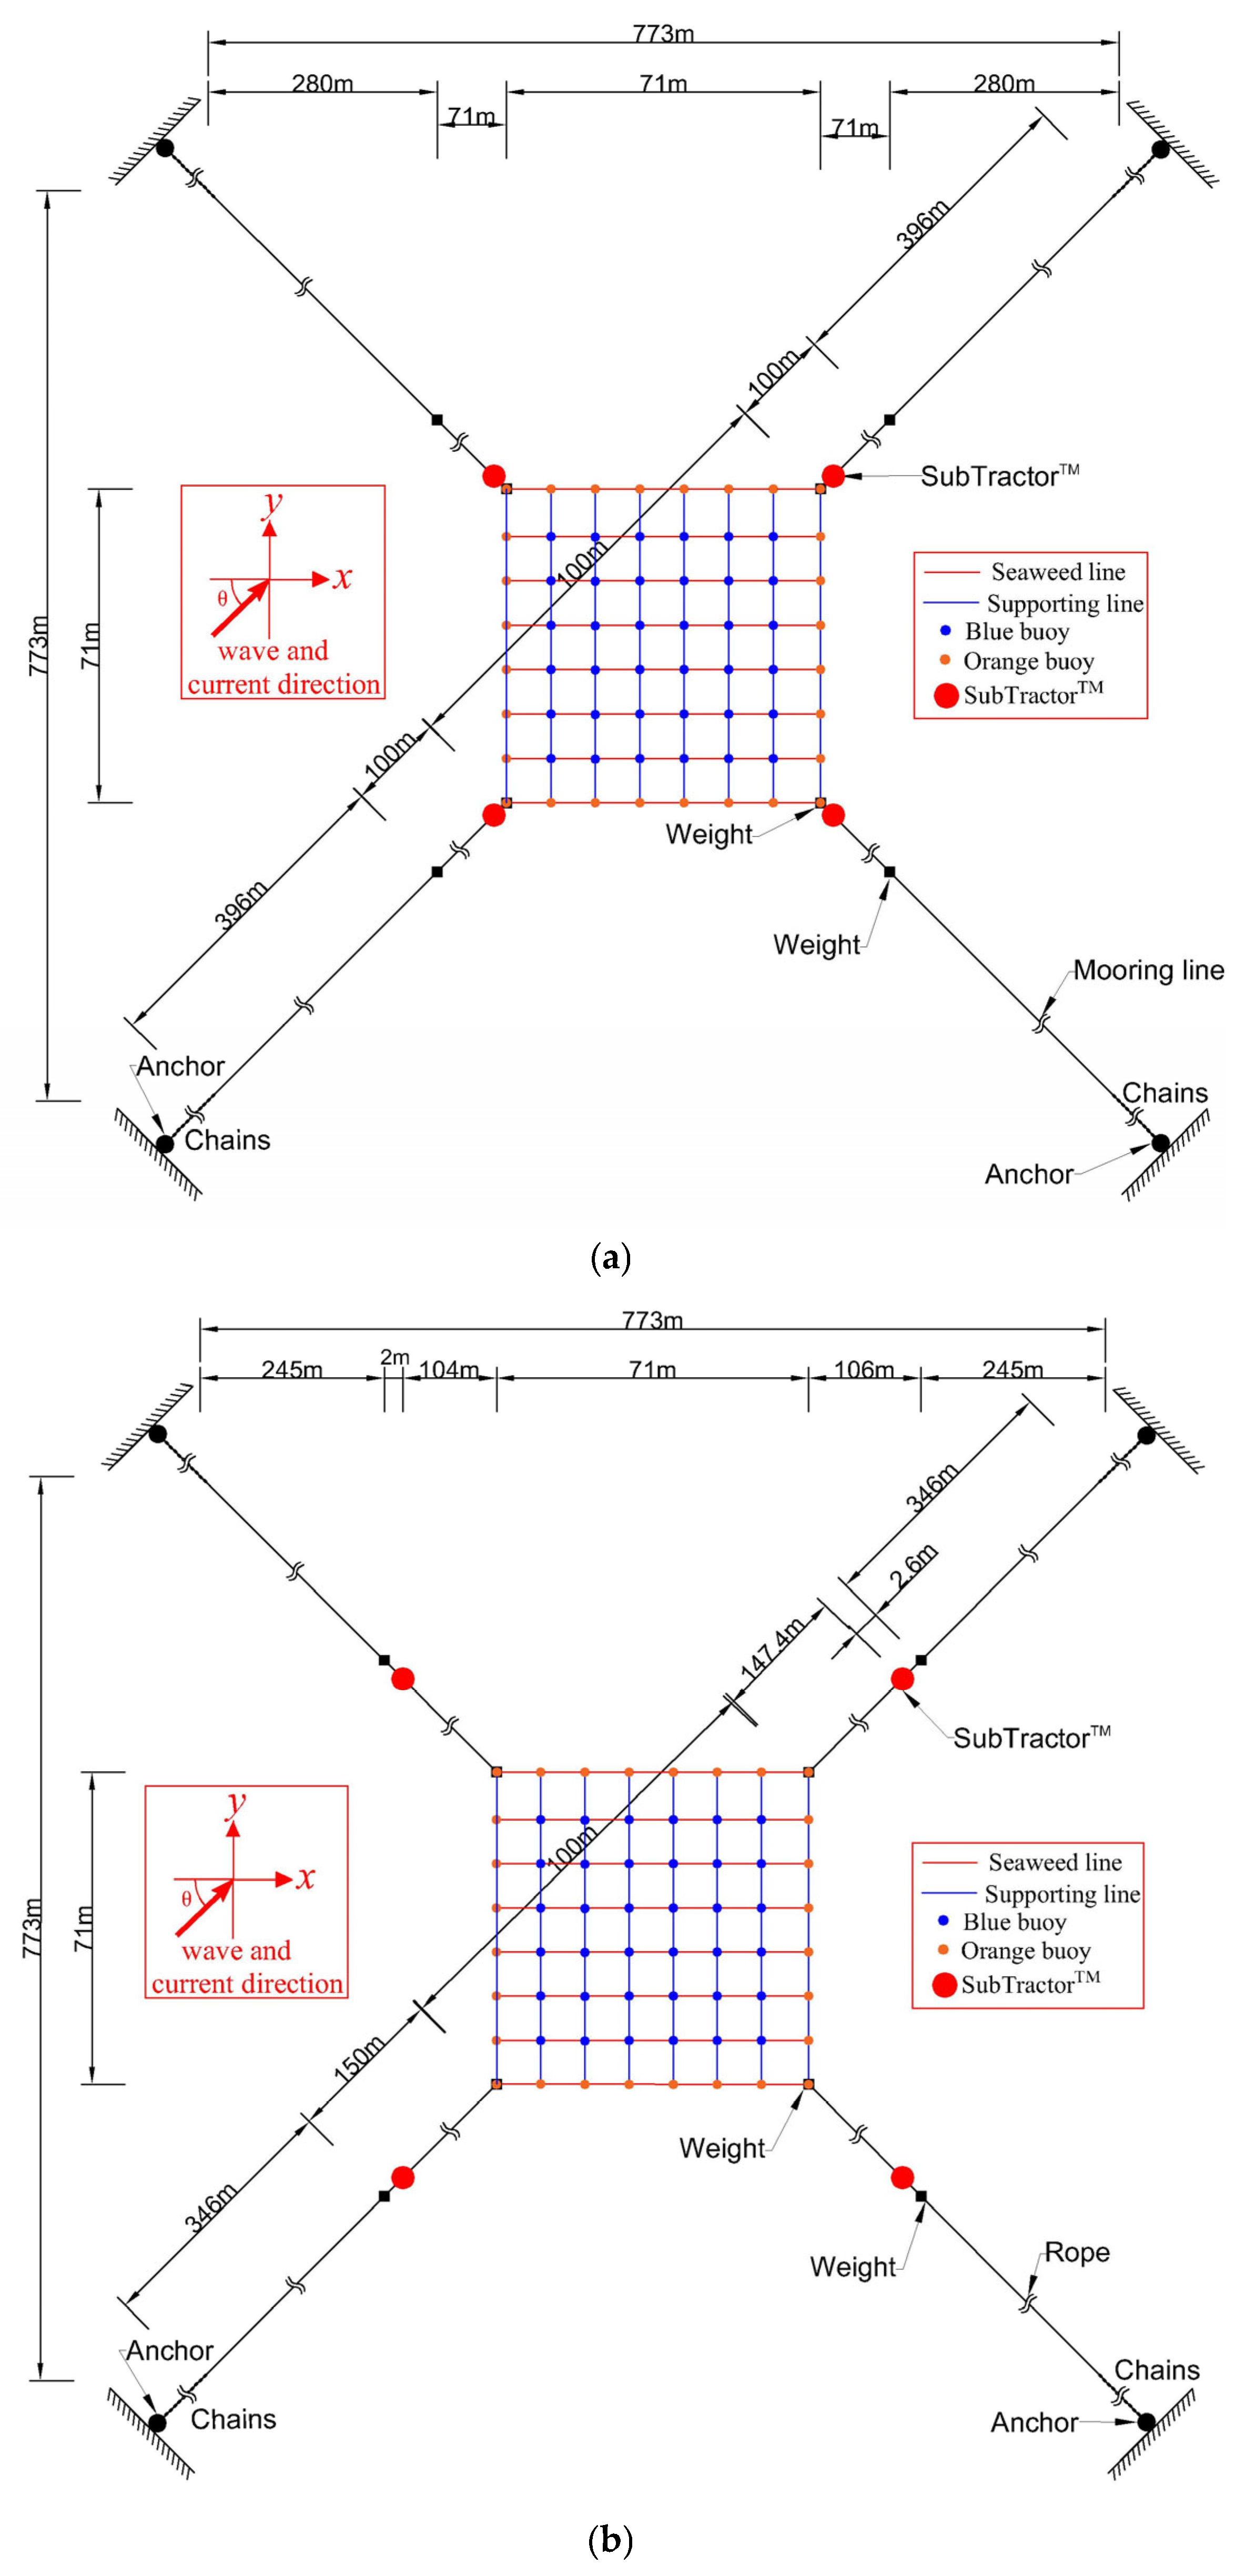
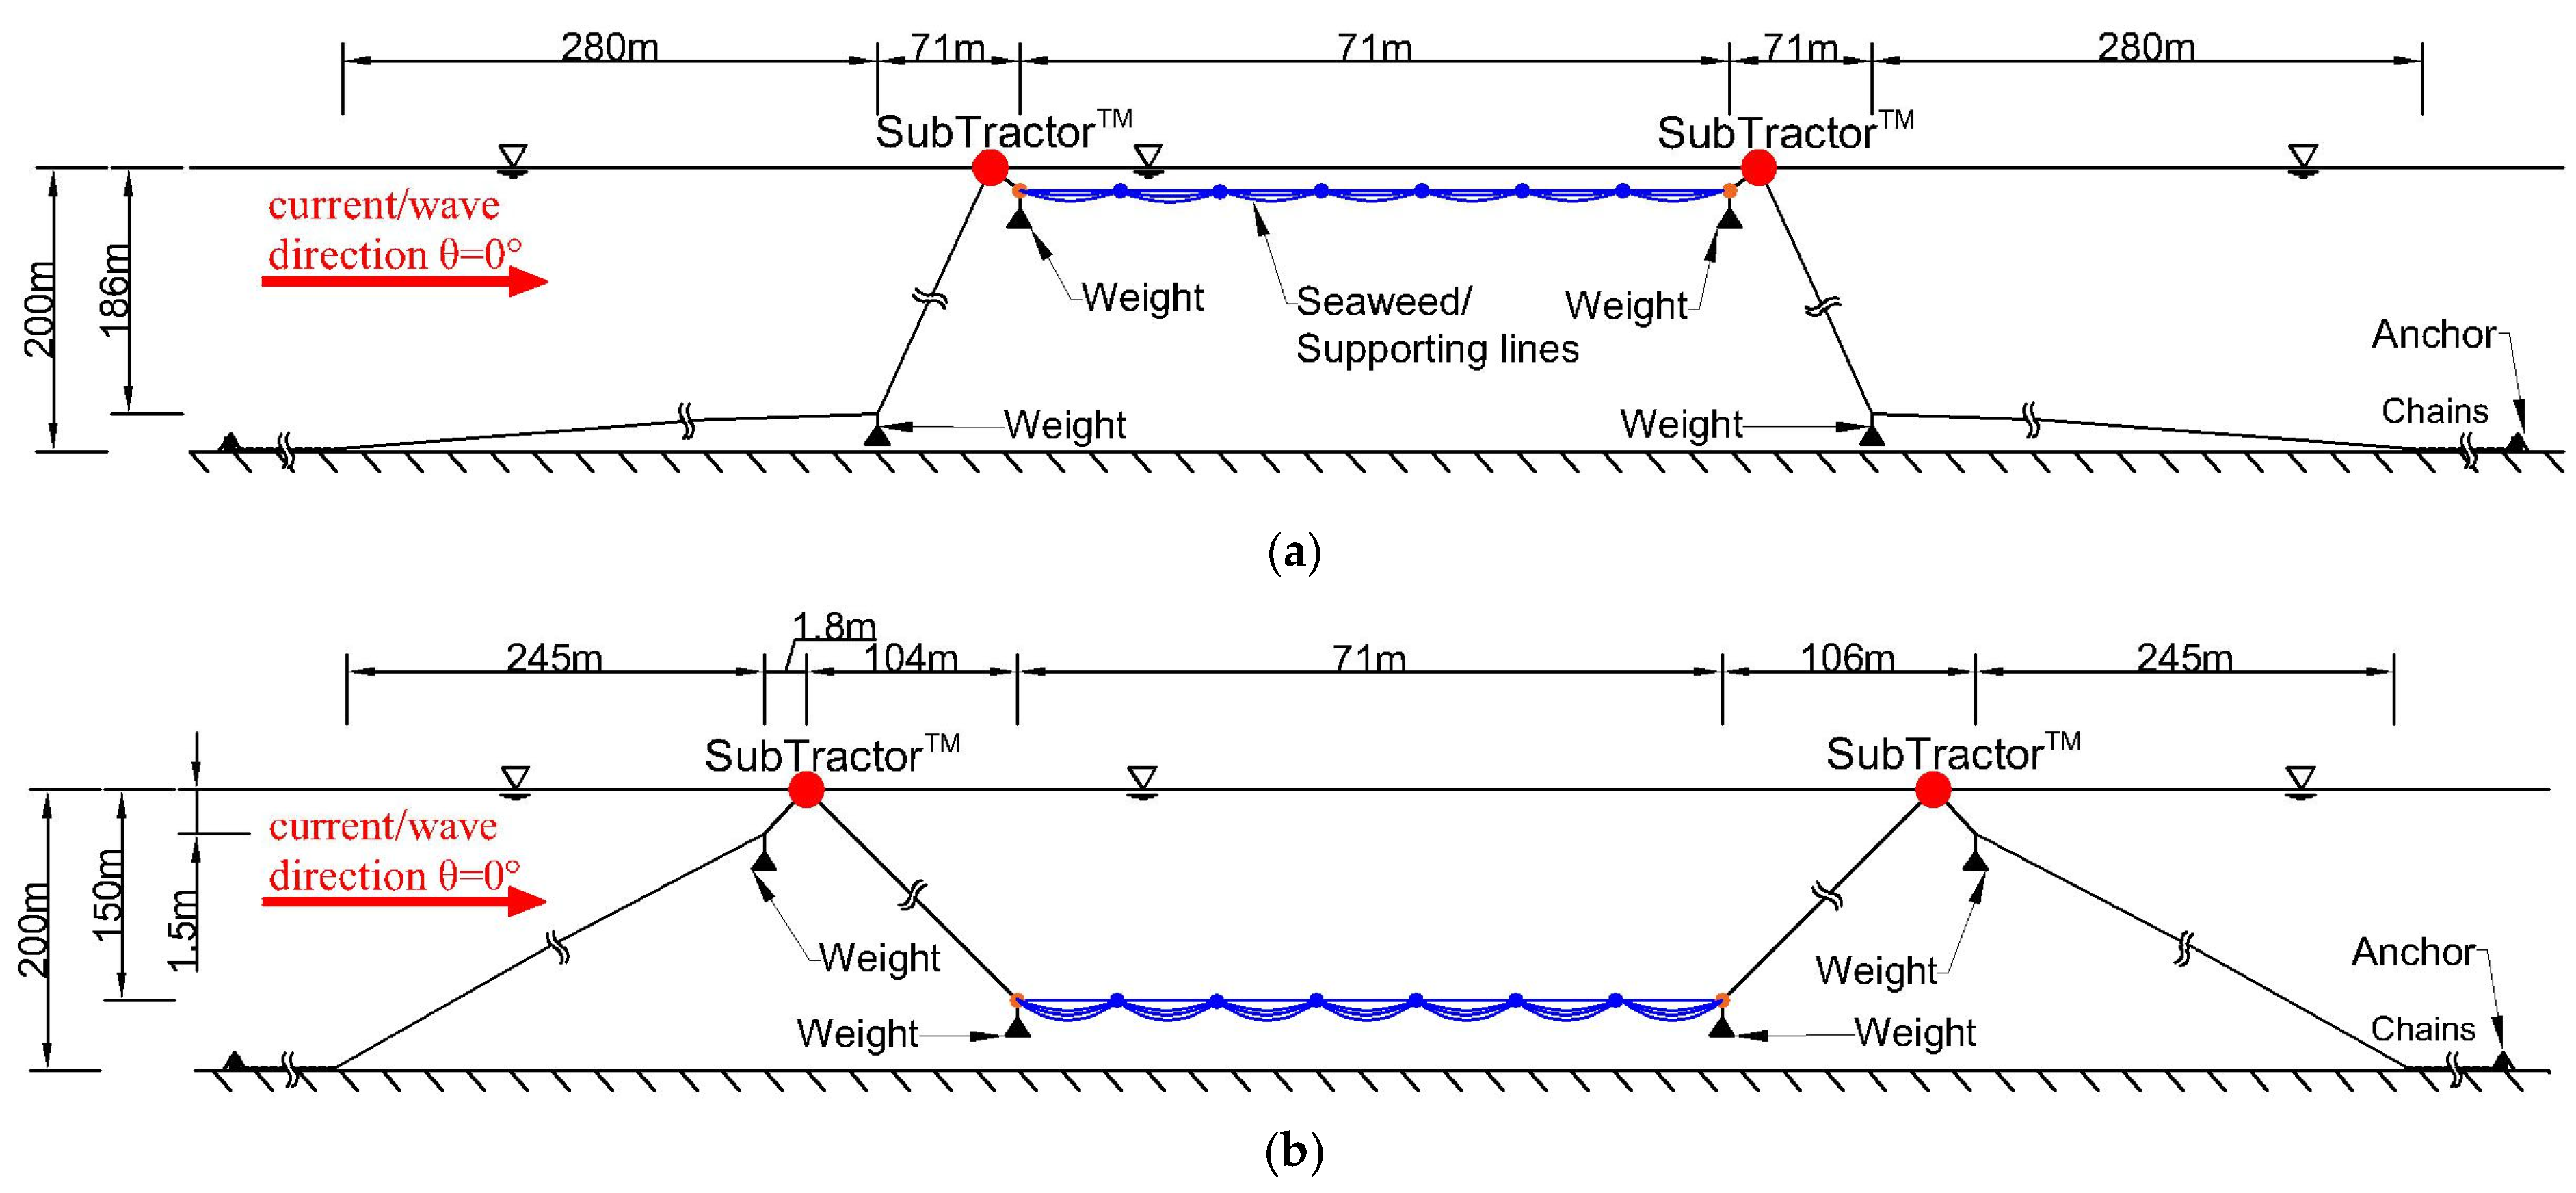
The Climate Foundation Australia Limited has constructed a 0.56-hectare SubSCI comprising eight grow-out lines that are 74 m long and eight supporting lines that are 74 m (forming an 8 × 8 square grid). These lines are made from ultra-high-molecular-weight polyethylene (UHMWPE) ropes (see
Figure 1 and
Figure 2). In the figures, the grid ropes in the x-direction are the seaweed grow-out lines that carry polyethylene tube nets to facilitate the attachment of seaweed seedlings and protect the growing seaweed from being washed away by strong surface waves. The grid ropes in the y-direction are supporting lines to minimize the sag of the grow-out lines. Seaweed grow-out lines and supporting lines intersect to form grid nodes where small buoys are attached. There are two types of buoys marked by orange and blue dots in
Figure 1. The orange buoys have a maximum buoyancy of 80 N whilst the blue buoys have a maximum buoyancy of 40 N. These buoys help to keep the grid lines in a planar configuration.
The challenge is how to enable the submergence and re-floating of the marine permaculture grid lines. Previous strategies for deep cycling have been adjusting the depth of the farming platform through mechanical winches or buoyancy control [
2]. However, these methods are not operationally efficient and are associated with a single point of failure. To that end, the Climate Foundation has come up with an innovative method that uses mobile buoys that can “crawl” along the UHMWPE mooring ropes. These unique mobile buoys are called SubTractors™. SubTractor buoys are modular, redundant traction units designed with a focus on flexibility, reliability, and scalability.
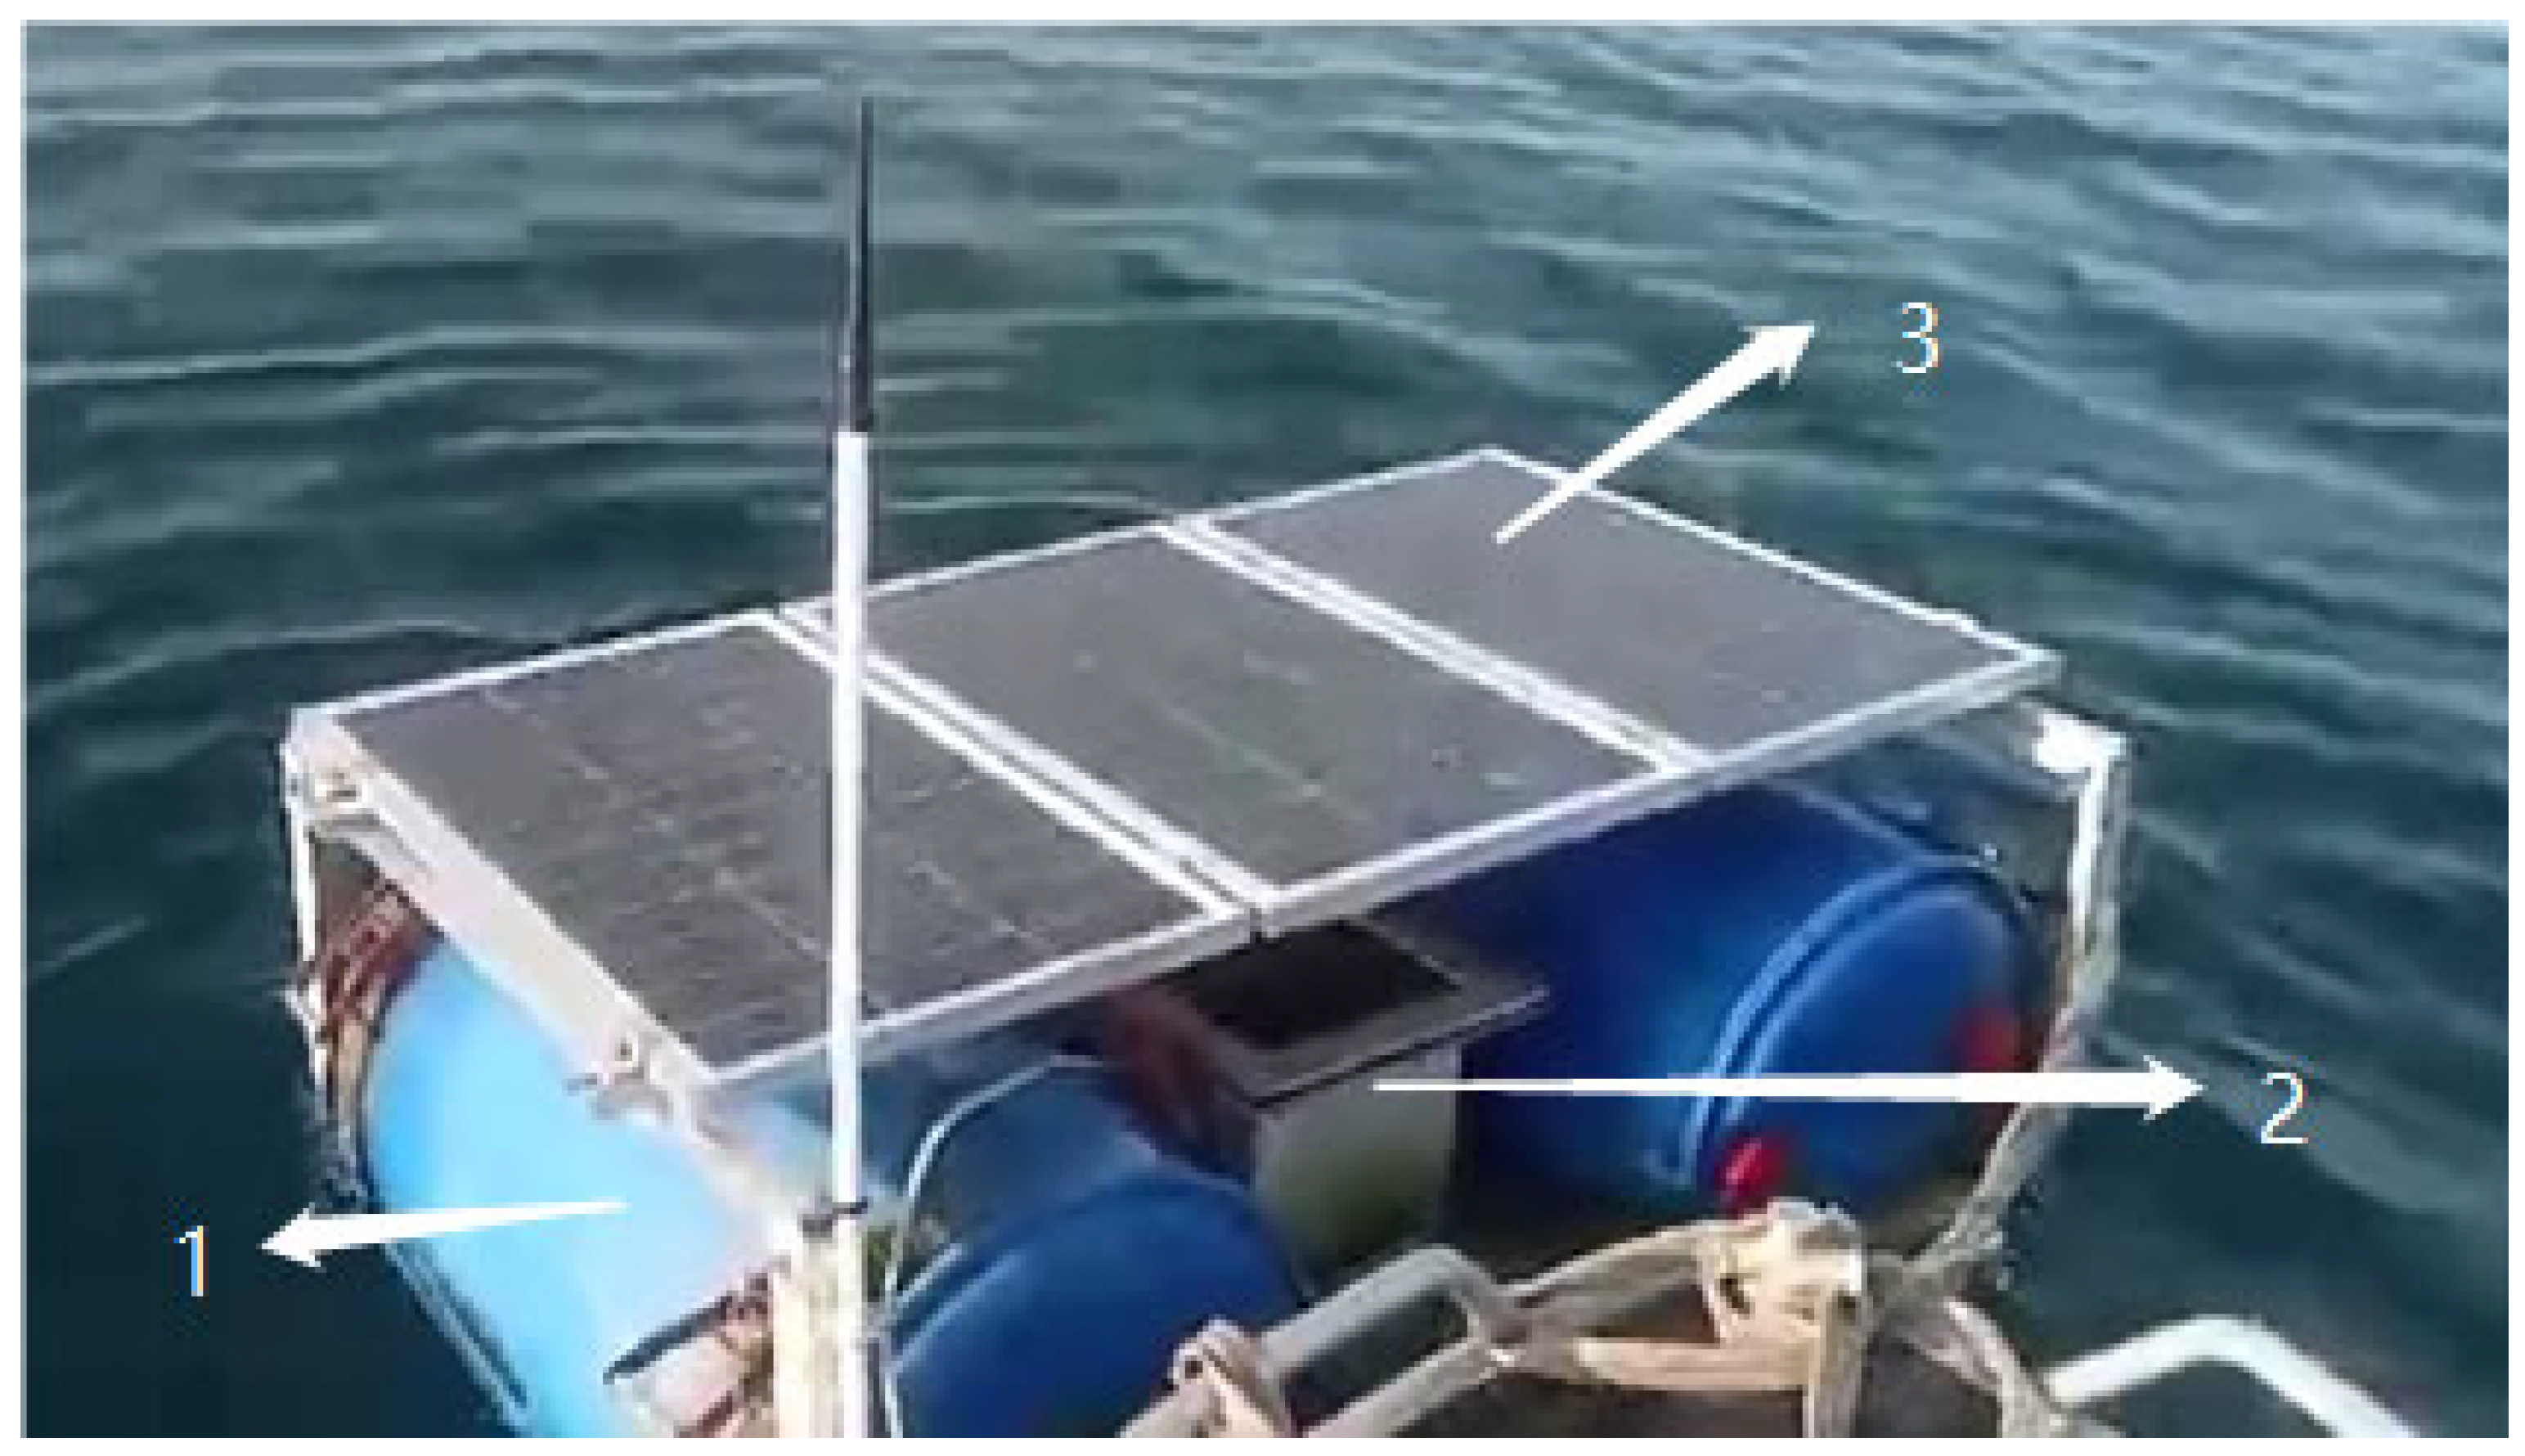
Figure 3 shows the SubTractor, consisting of a central driving motor flanked by blue buoys on both sides and topped with photovoltaic panels. The panels supply power to the motor, enabling the SubTractor’s movement.
A SubTractor is installed on each UHMWPE mooring rope of the SubSCI. Each SubTractor is fitted with a traction device that can traverse along the mooring line, enabling adjustments to the vertical position of the seaweed line grid. Referring to
Figure 1 and
Figure 2, it can be seen how SubTractors move along the mooring line to control the lowering or raising of the seaweed line grid, allowing for precise control of the position of the grid. Redundancy and modular design are key features of a SubTractor. Each SubTractor requires only a few hundred watts of operating power, which may be supplied by solar panels mounted on the SubTractor. Redundancy ensures that in the event of a single SubTractor failure, the entire platform is not critically damaged and can continue normal daily operations. In the case of a SubTractor failure, the affected area is limited to 12% or less of the whole platform’s surface area. Additionally, extra buoys can quickly replace damaged ones, allowing for routine maintenance. The modular design means that each SubTractor is designed as a module, making it easy to manufacture and transport, thereby improving the platform’s operational efficiency and the feasibility of large-scale seaweed cultivation.
The mooring lines, made of UHMWPE material, are the core of the tension structure, connecting the seaweed line grid to the seabed anchor points, and providing robust support in harsh offshore environments and during repeated SubSCI adjustments. These UHMWPE ropes are continuous from the grid corners to the steel chains connected to seabed anchors.
Figure 1a and
Figure 2a show, respectively, the plan view and side view of SubSCI at the floating stage. By moving the four SubTractors along the ropes in an outward direction from the grid corners, the square grid seaweed lines can be lowered to deep waters exceeding 100 m below the water surface as shown in
Figure 1b and
Figure 2b.
Eight concrete sinker weights and buoys are used to provide tensile forces to the ropes and to control the stability of the infrastructure. The entire SubSCI, through the inter-coordination of mooring lines, SubTractors, sinker weights, and buoys, forms a modular redundant tensile structure. Such a redundant structure should allow it to operate even in the event of failure of any SubTractors or a mooring line.
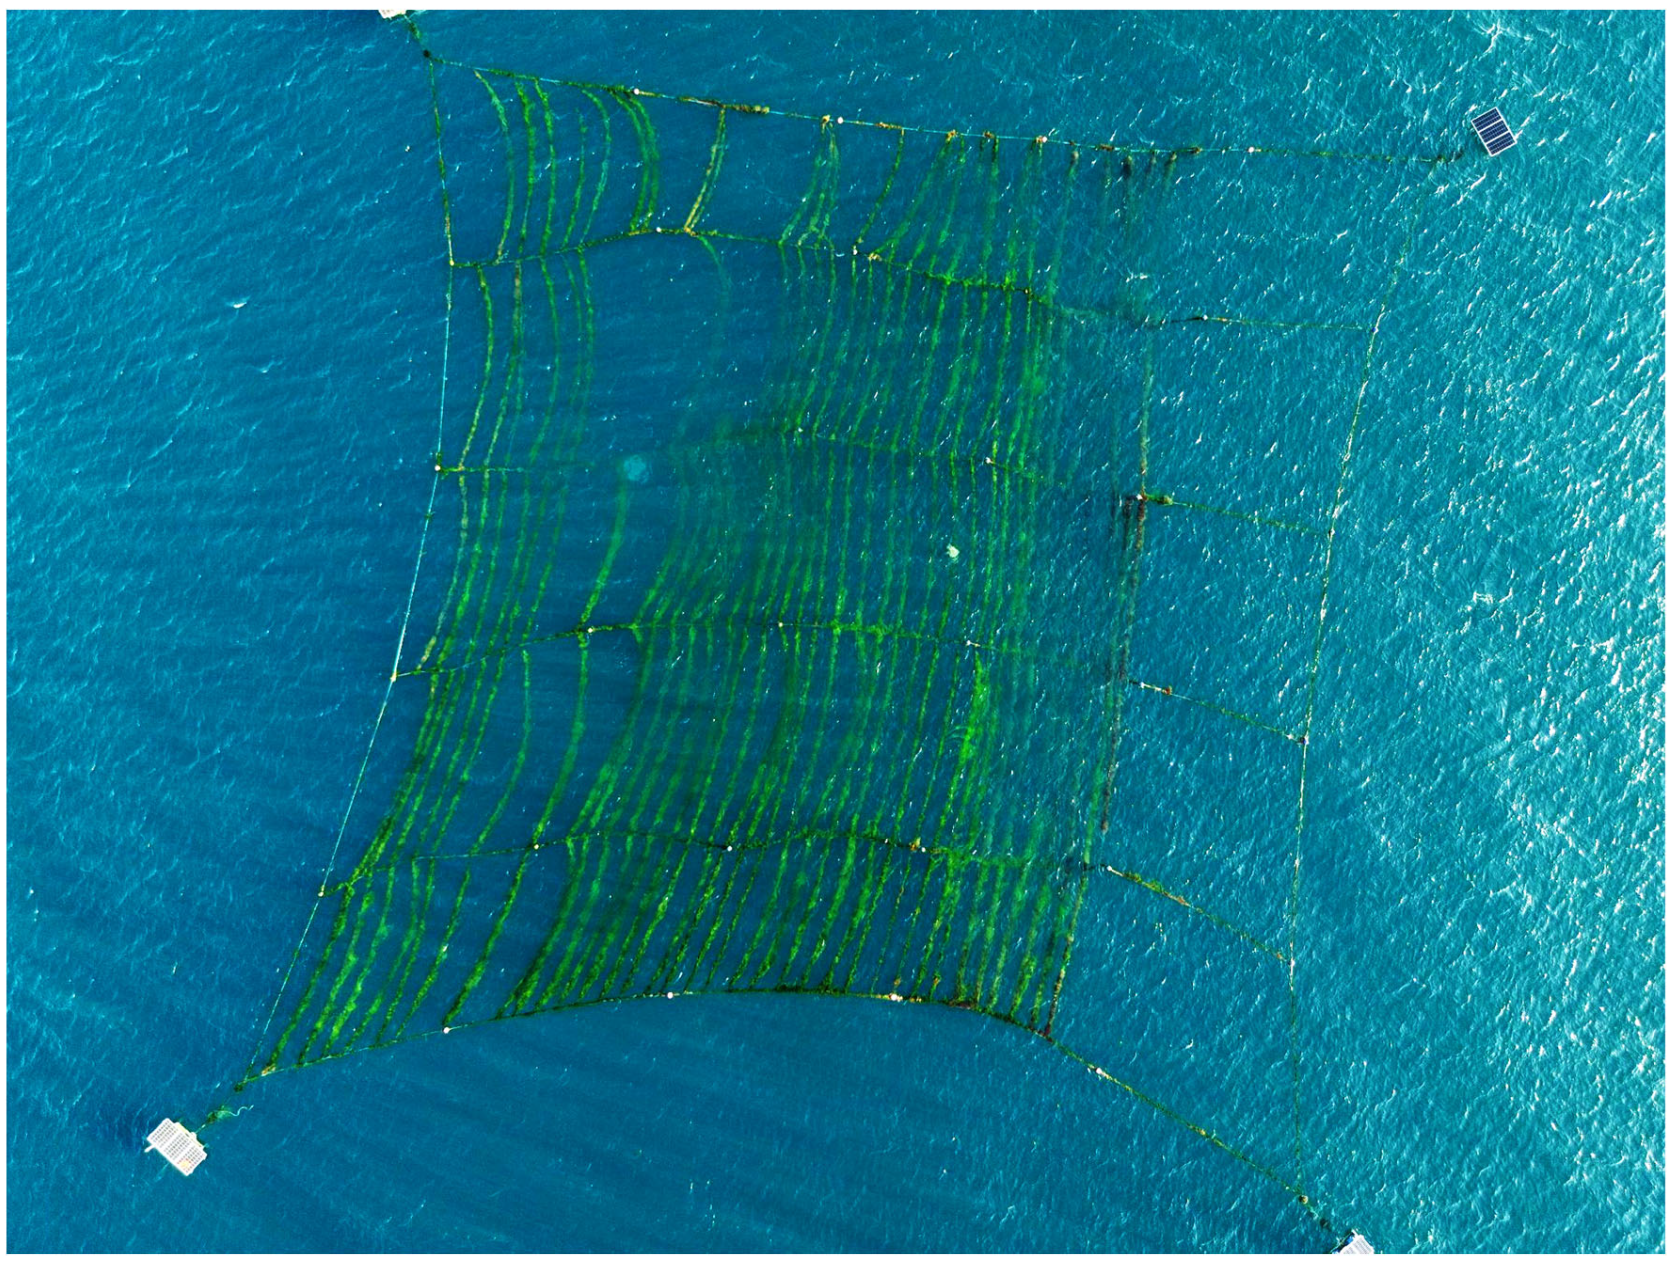
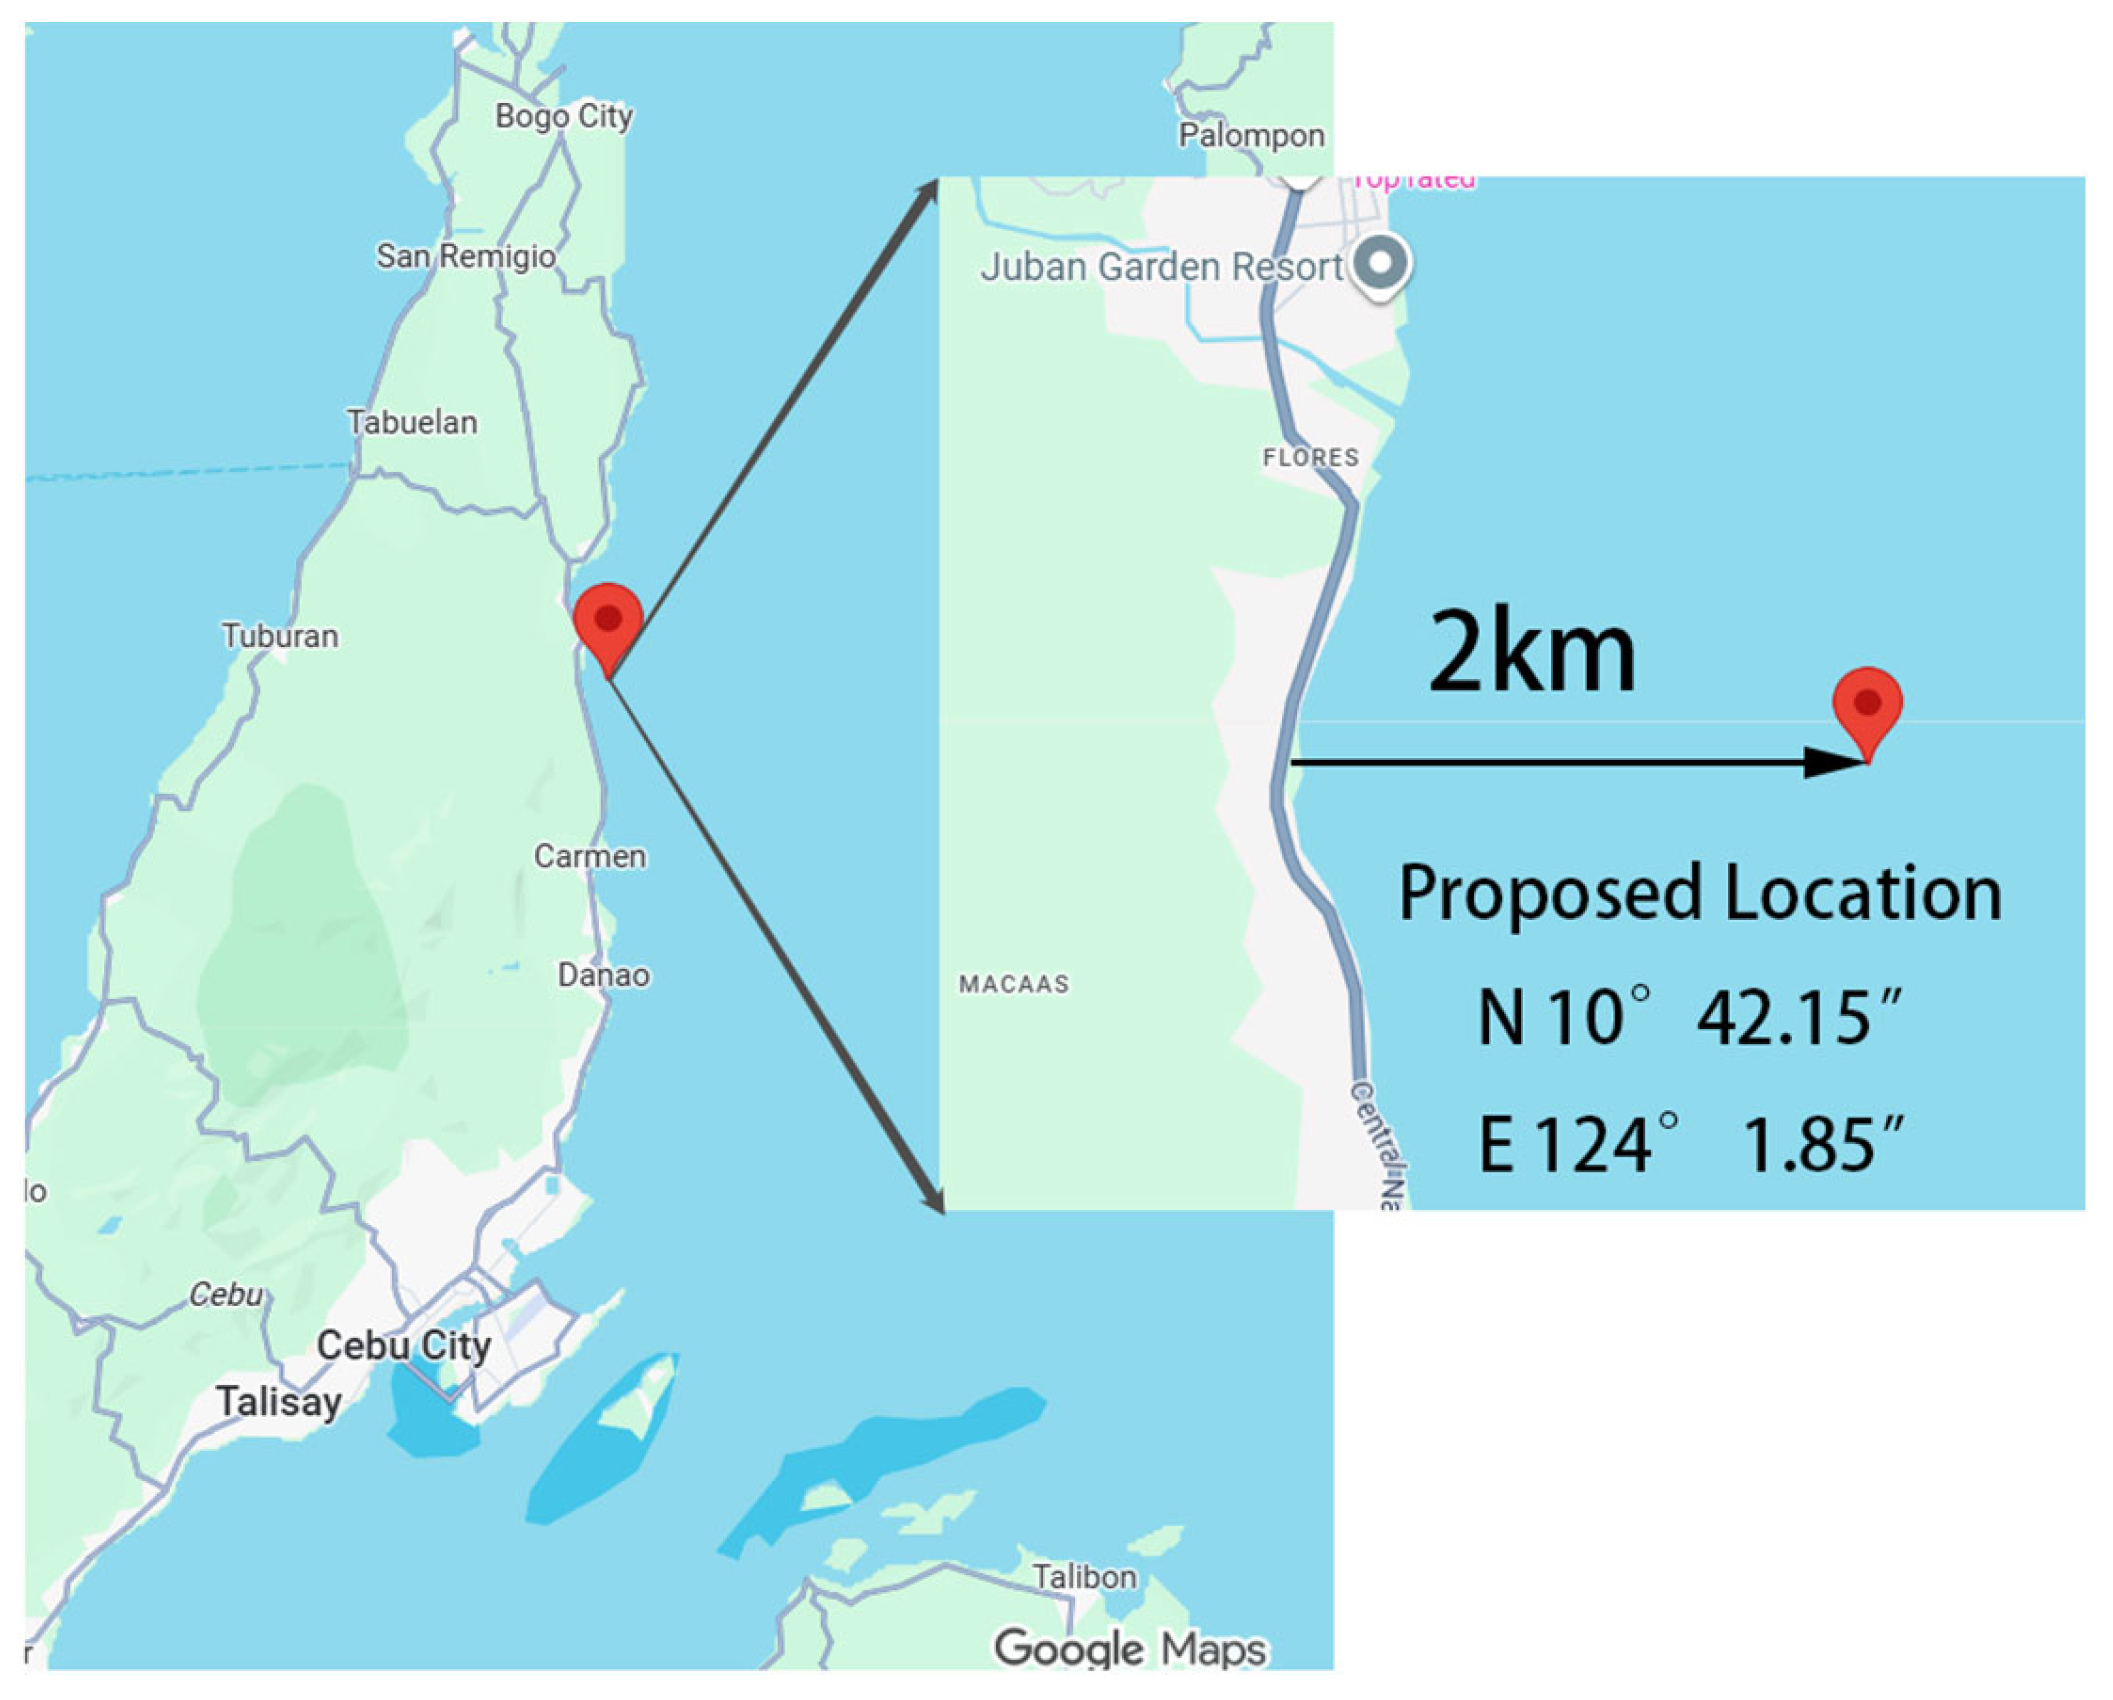
This novel submersible seaweed cultivation infrastructure has progressed beyond the conceptual design stage. A 0.56-hectare SubSCI has been deployed and tested in an offshore site of Cebu Island, the Philippines as shown by the drone image in
Figure 4. The image was taken during the seaweed growth stage. Each corner of the seaweed grid is secured with a mooring line, and each mooring line is fitted with a SubTractor.
5. Modelling and Hydroelastic Analysis of SubSCI
The software AquaSim 2.21.0-3462 is employed for the hydroelastic analysis of SubSCI. AquaSim is an analysis tool developed by Aquastructures AS [
22]. It utilizes the Finite Element Method (FEM) for the calculation and simulation of structural response under environmental loads such as waves, currents, and winds. The software is well suited for the hydroelastic analysis of aquaculture infrastructure.
Next, we discuss the modelling of different components in SubSCI that include mooring lines, seaweed grow-out lines, buoys, sinkers, and seaweed. In AquaSim, the mooring lines, seaweed grow-out lines, and support lines are modelled by truss elements. SubTractors are modelled by node-to-node spring elements. Orange and blue buoys are modelled by node-to-node spring elements when SubSCI is at the surface but are modelled as point loads when SubSCI is submerged. The sinker weights are modelled as point loads. The steel chains are modelled by truss elements, and the end node of the element is fixed to the seabed. The seaweed is attached onto the grow-out lines and the seaweed lines are modelled by truss elements. The seaweed is modelled by giving the truss element a circular cross-sectional area defined by the diameter of the seaweed tube net at different growth stages as well as the appropriate mass per unit length (see
Table 1). The circular cross-sectional area and mass per unit length of juvenile seaweeds as well as the mature seaweed on the seaweed grow-out line were obtained from actual measured data supplied by the Climate Foundation.
The seaweed cylindrical nets are modelled as permeable cylindrical membranes, where the membrane porosity is calibrated from physical tests either in a hydraulics laboratory or in the field. This porosity is contingent upon parameters including seaweed morphology, dimensions, and biomass density. During the growth period of seaweeds, the morphology of seaweeds changes gradually, and therefore the porosity also changes gradually. It is rather difficult to develop a model for a seaweed tube net. For that reason, we adopt a rational model wherein the membrane’s porosity is assumed to be 0 just like an impermeable tube. This is believed to be the worst scenario in terms of wave/current loads on the tube net and thus will provide a conservative design for the other components of SubSCI.
Table 3 provides the input parameters of the model in AquaSim, such as constraint specifications, load period or spectrum, simulation time step, total simulation duration, the drag coefficient of the seaweed lines, and the boundary condition.
6. Results and Discussion
6.1. Hydroelastic Deformation of SubSCI in Vertical Direction
Kappaphycus alvarezii is a species of red algae (Rhodophyta) belonging to the family Solieriaceae. It is one of the most widely cultivated seaweeds in tropical regions. This species requires a lot of sunlight. In shallow coastal waters, the optimal cultivation depth ranges from 0.5 m to 1 m [
23,
24,
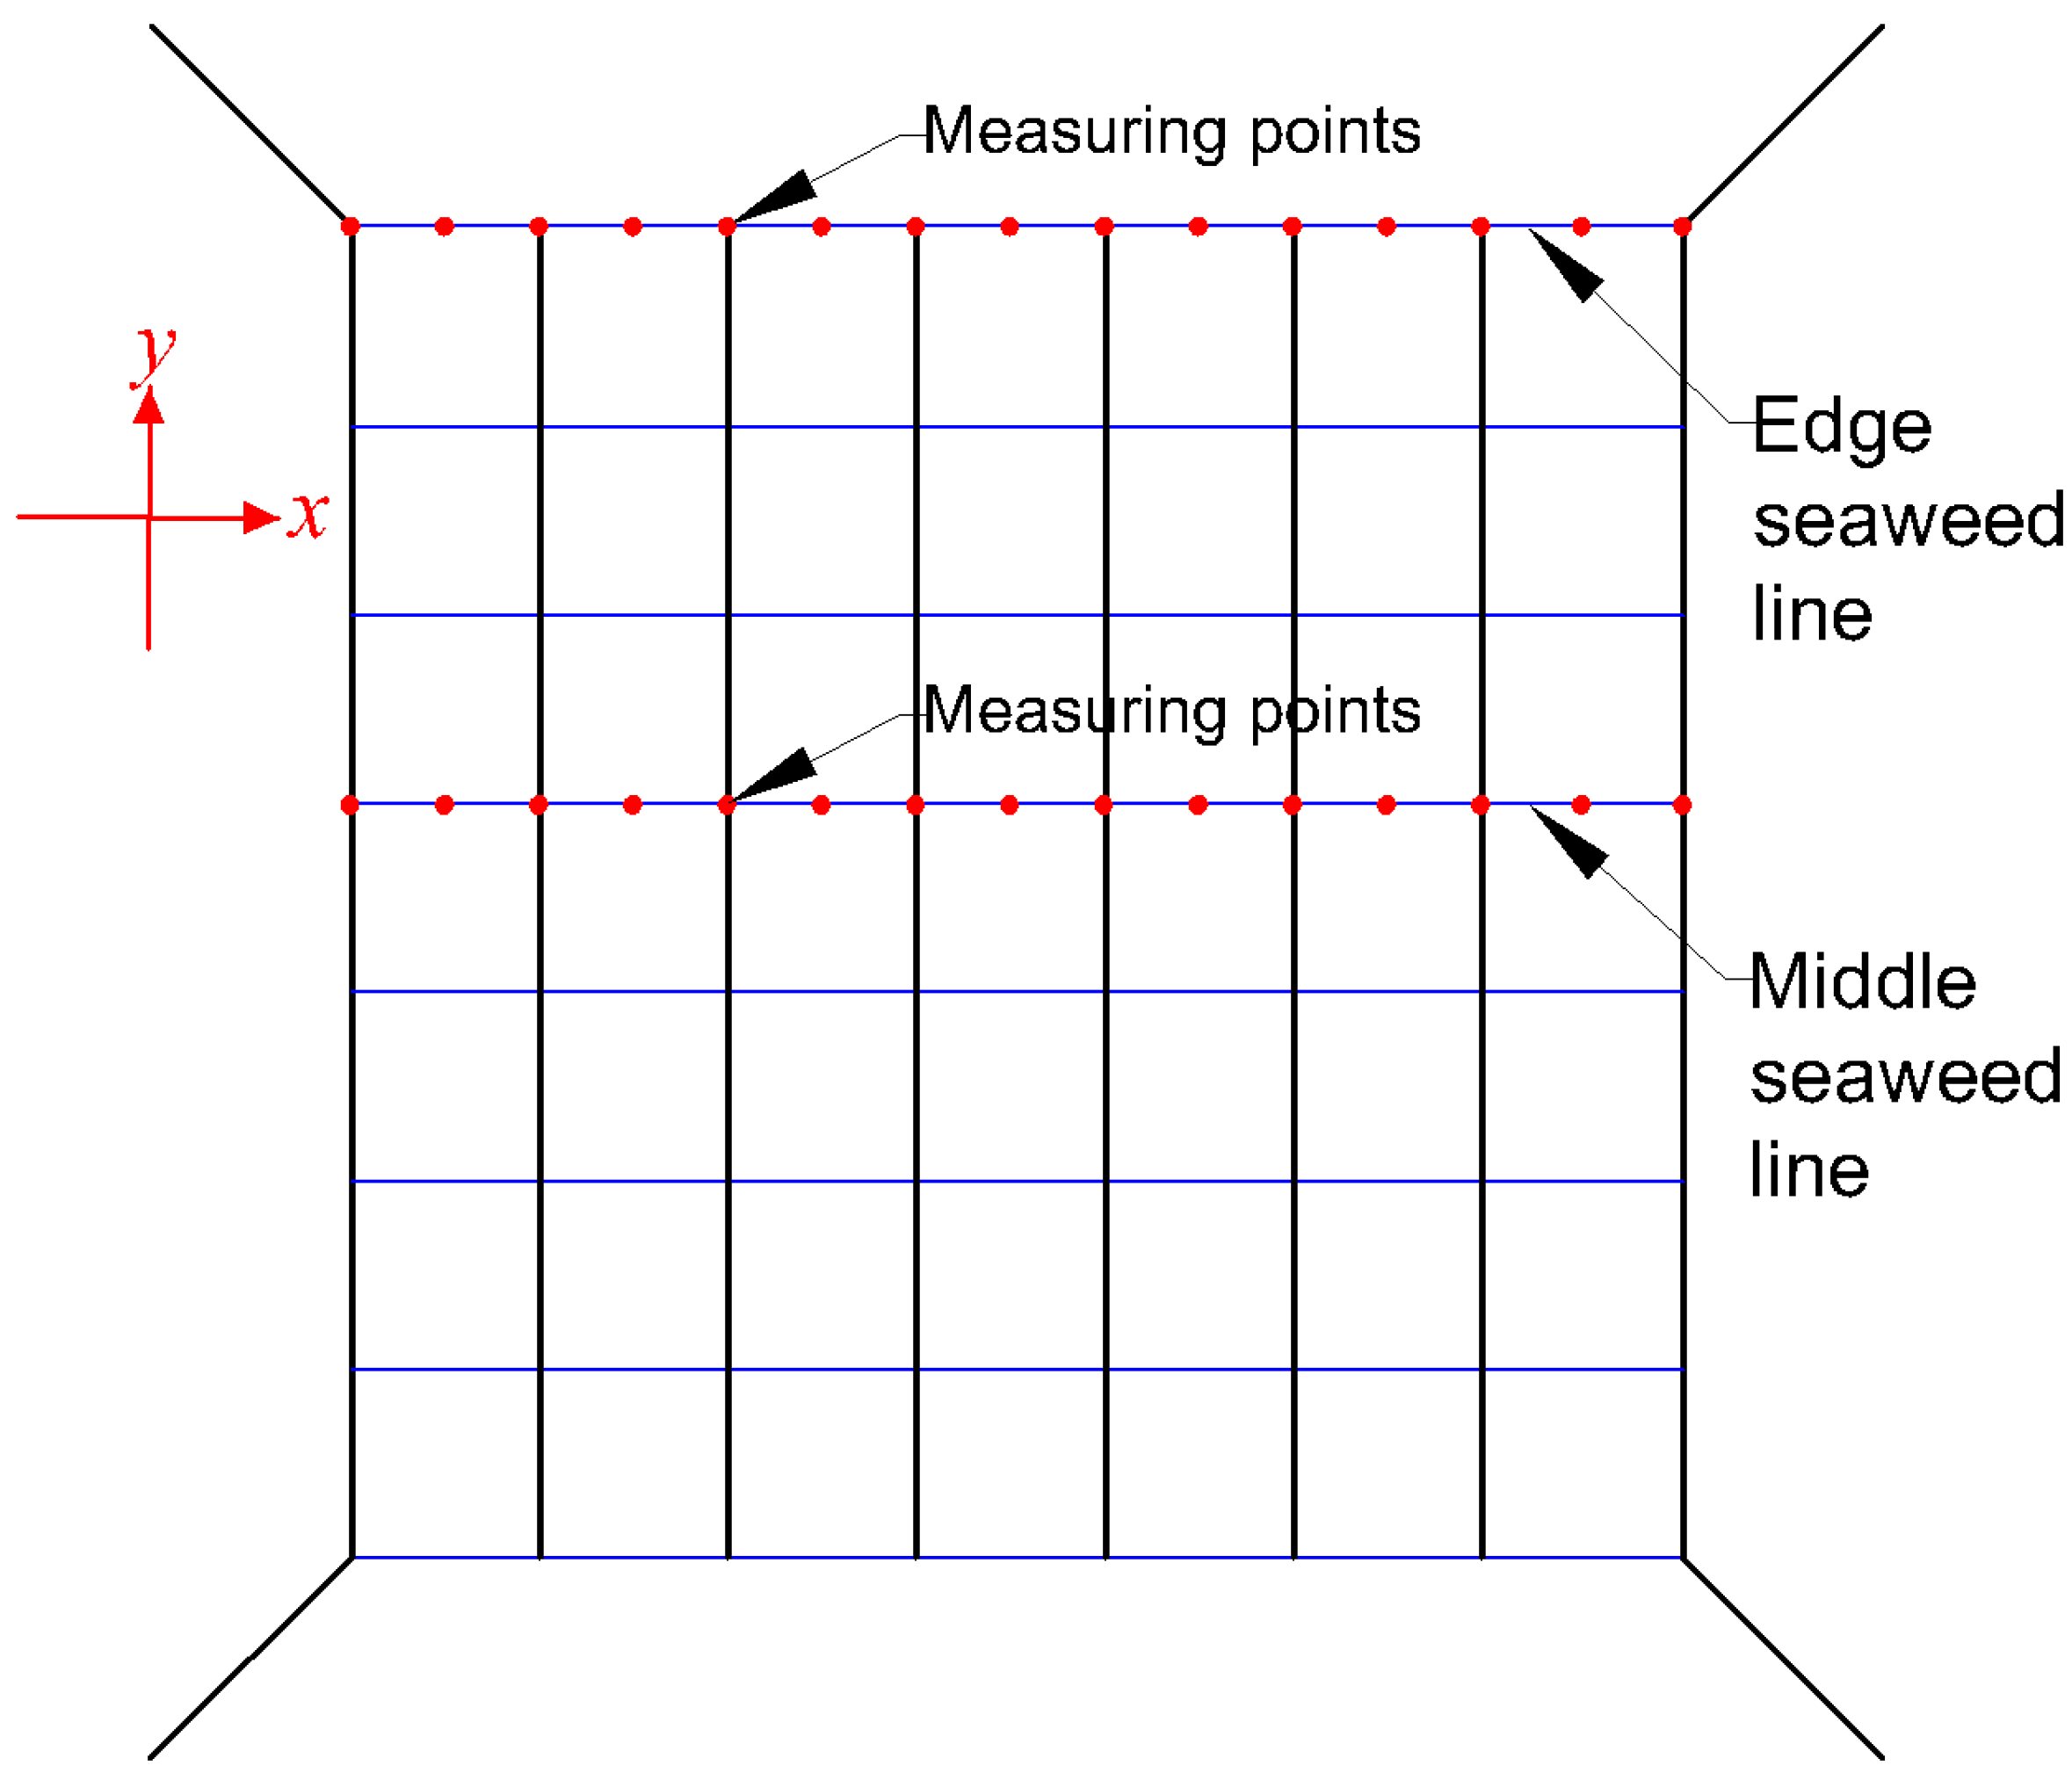
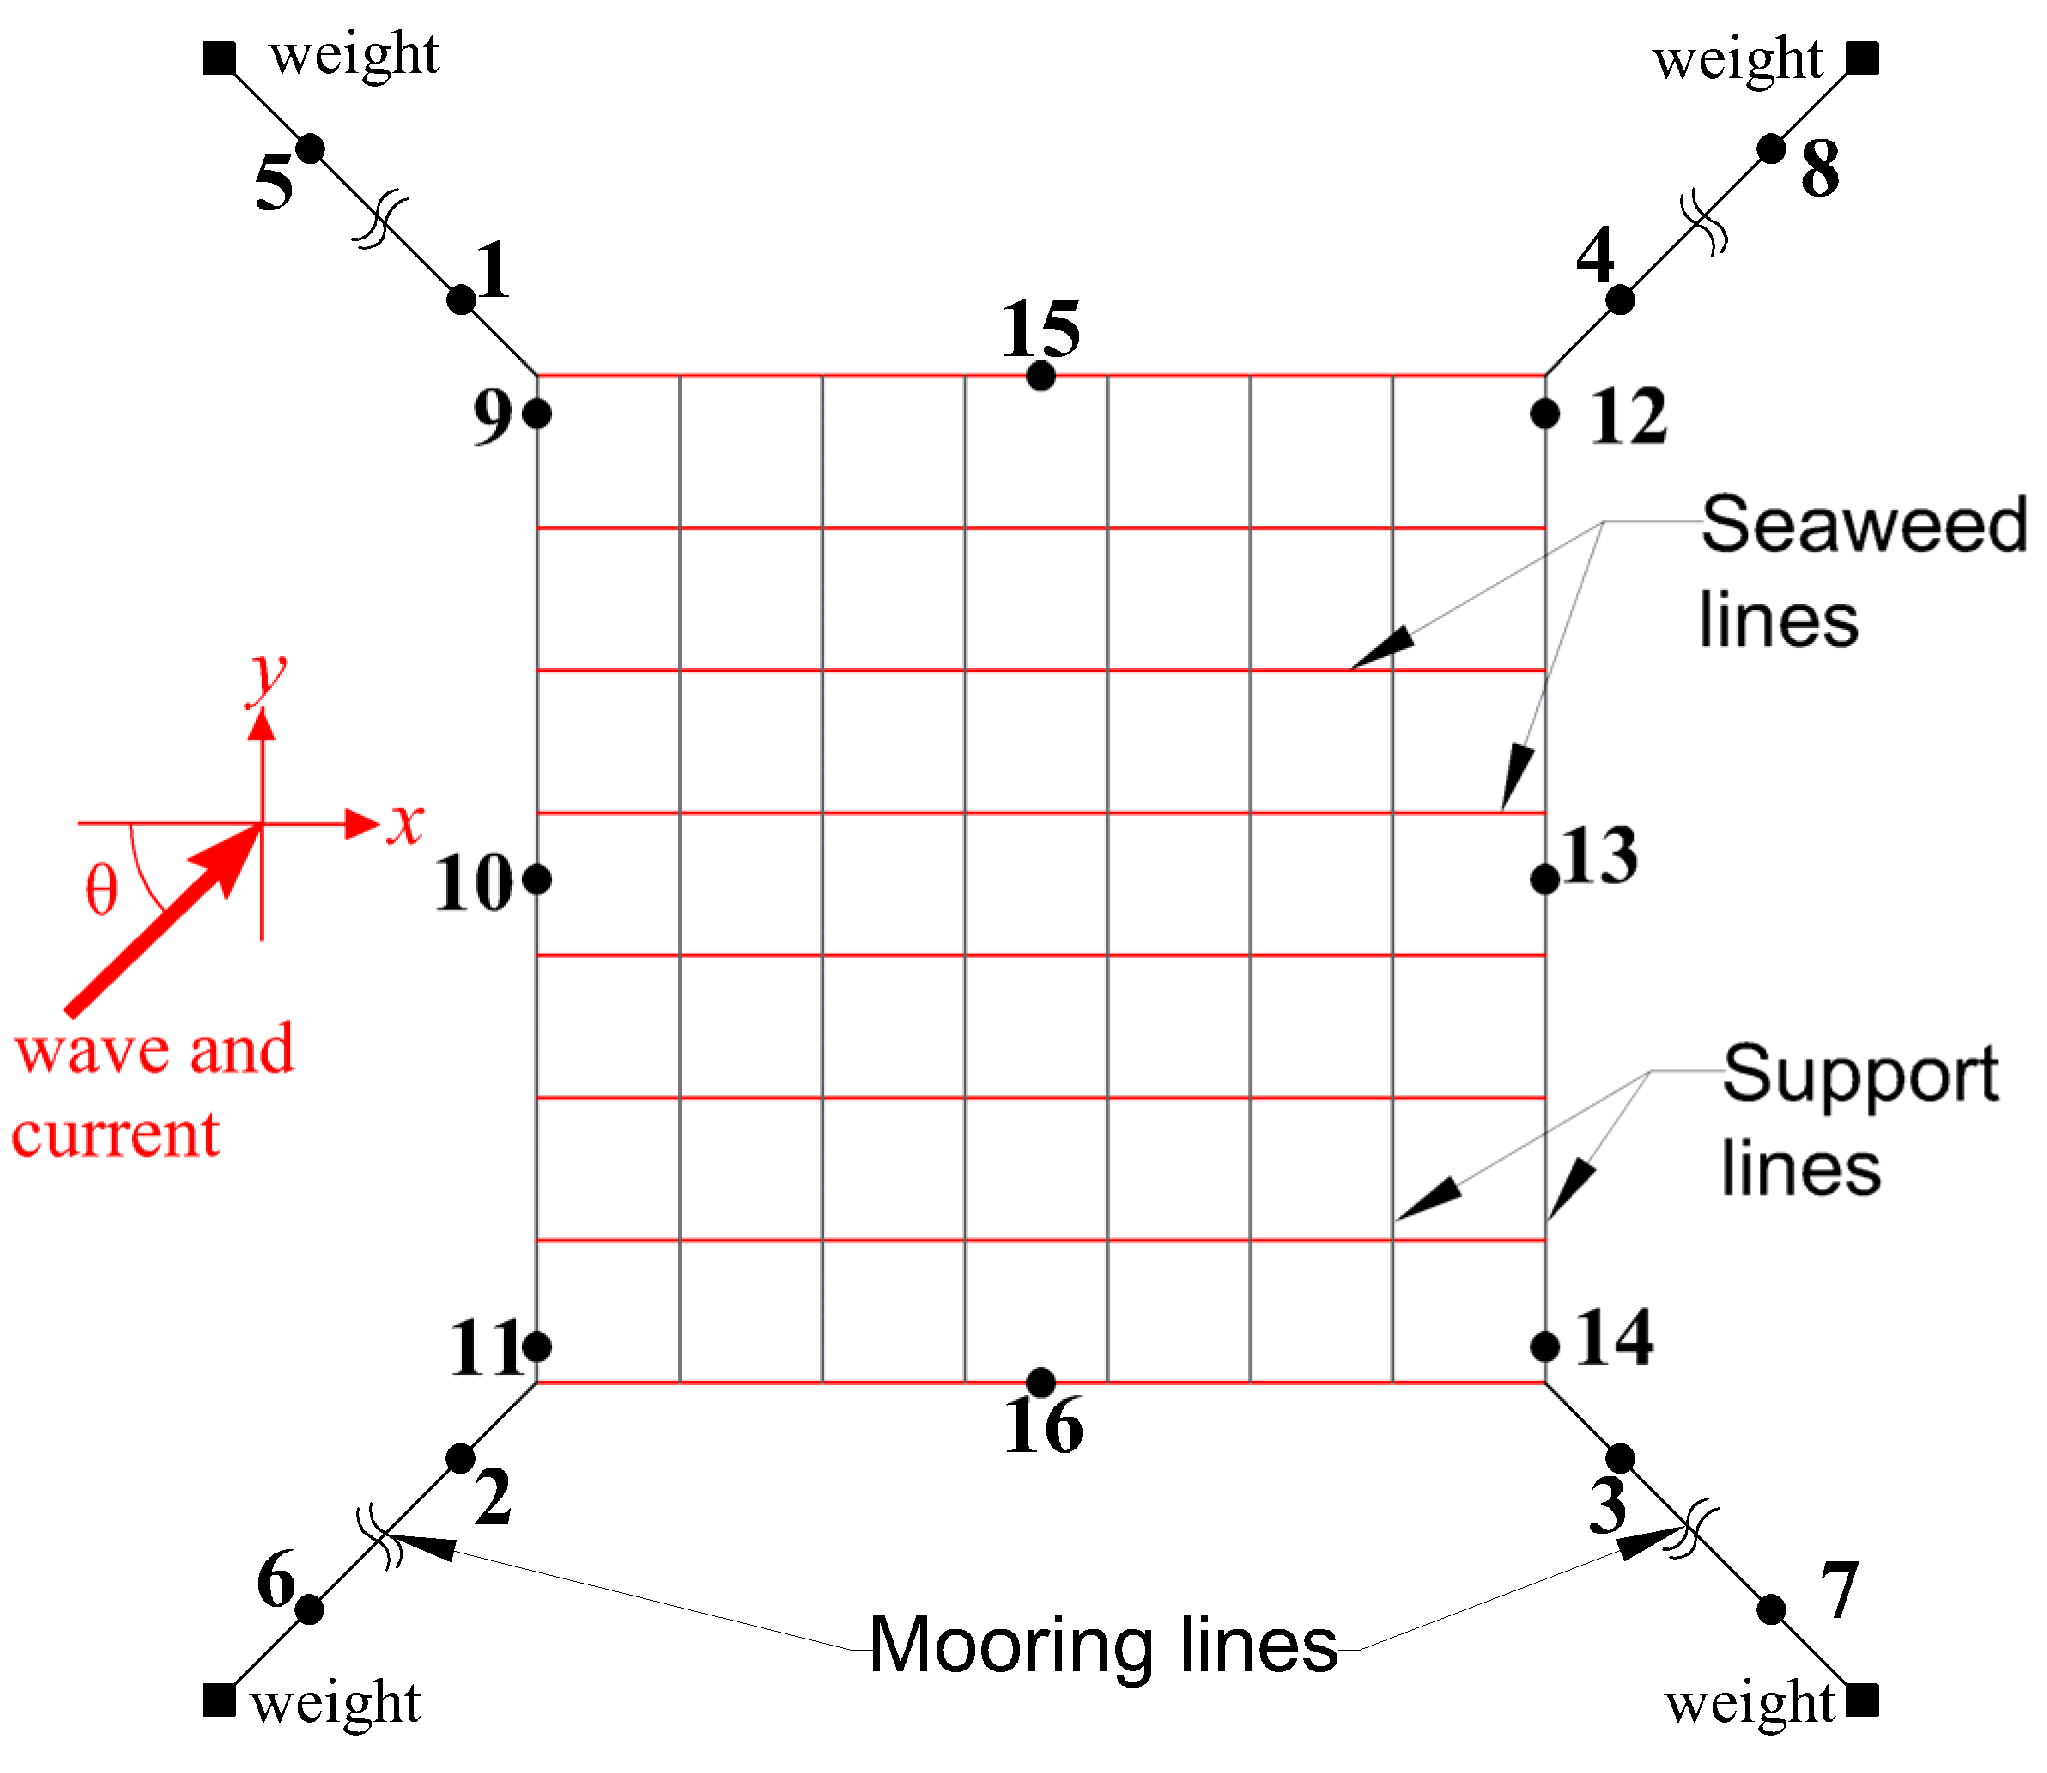
25]. However, in offshore environments where wave action is more intense, the suitable cultivation depth is set to within 2 m to ensure structural safety and good exposure to sunlight for photosynthesis. To obtain the maximum vertical displacement of the seaweed grid when the platform is floating at the sea surface, it is sufficient to consider only the most severe sea state and the strongest current conditions (sea state S2-0.6). Data measurement points are positioned along the middle and edge seaweed lines, with 15 points uniformly selected from left to right. Their exact locations are illustrated in
Figure 7.
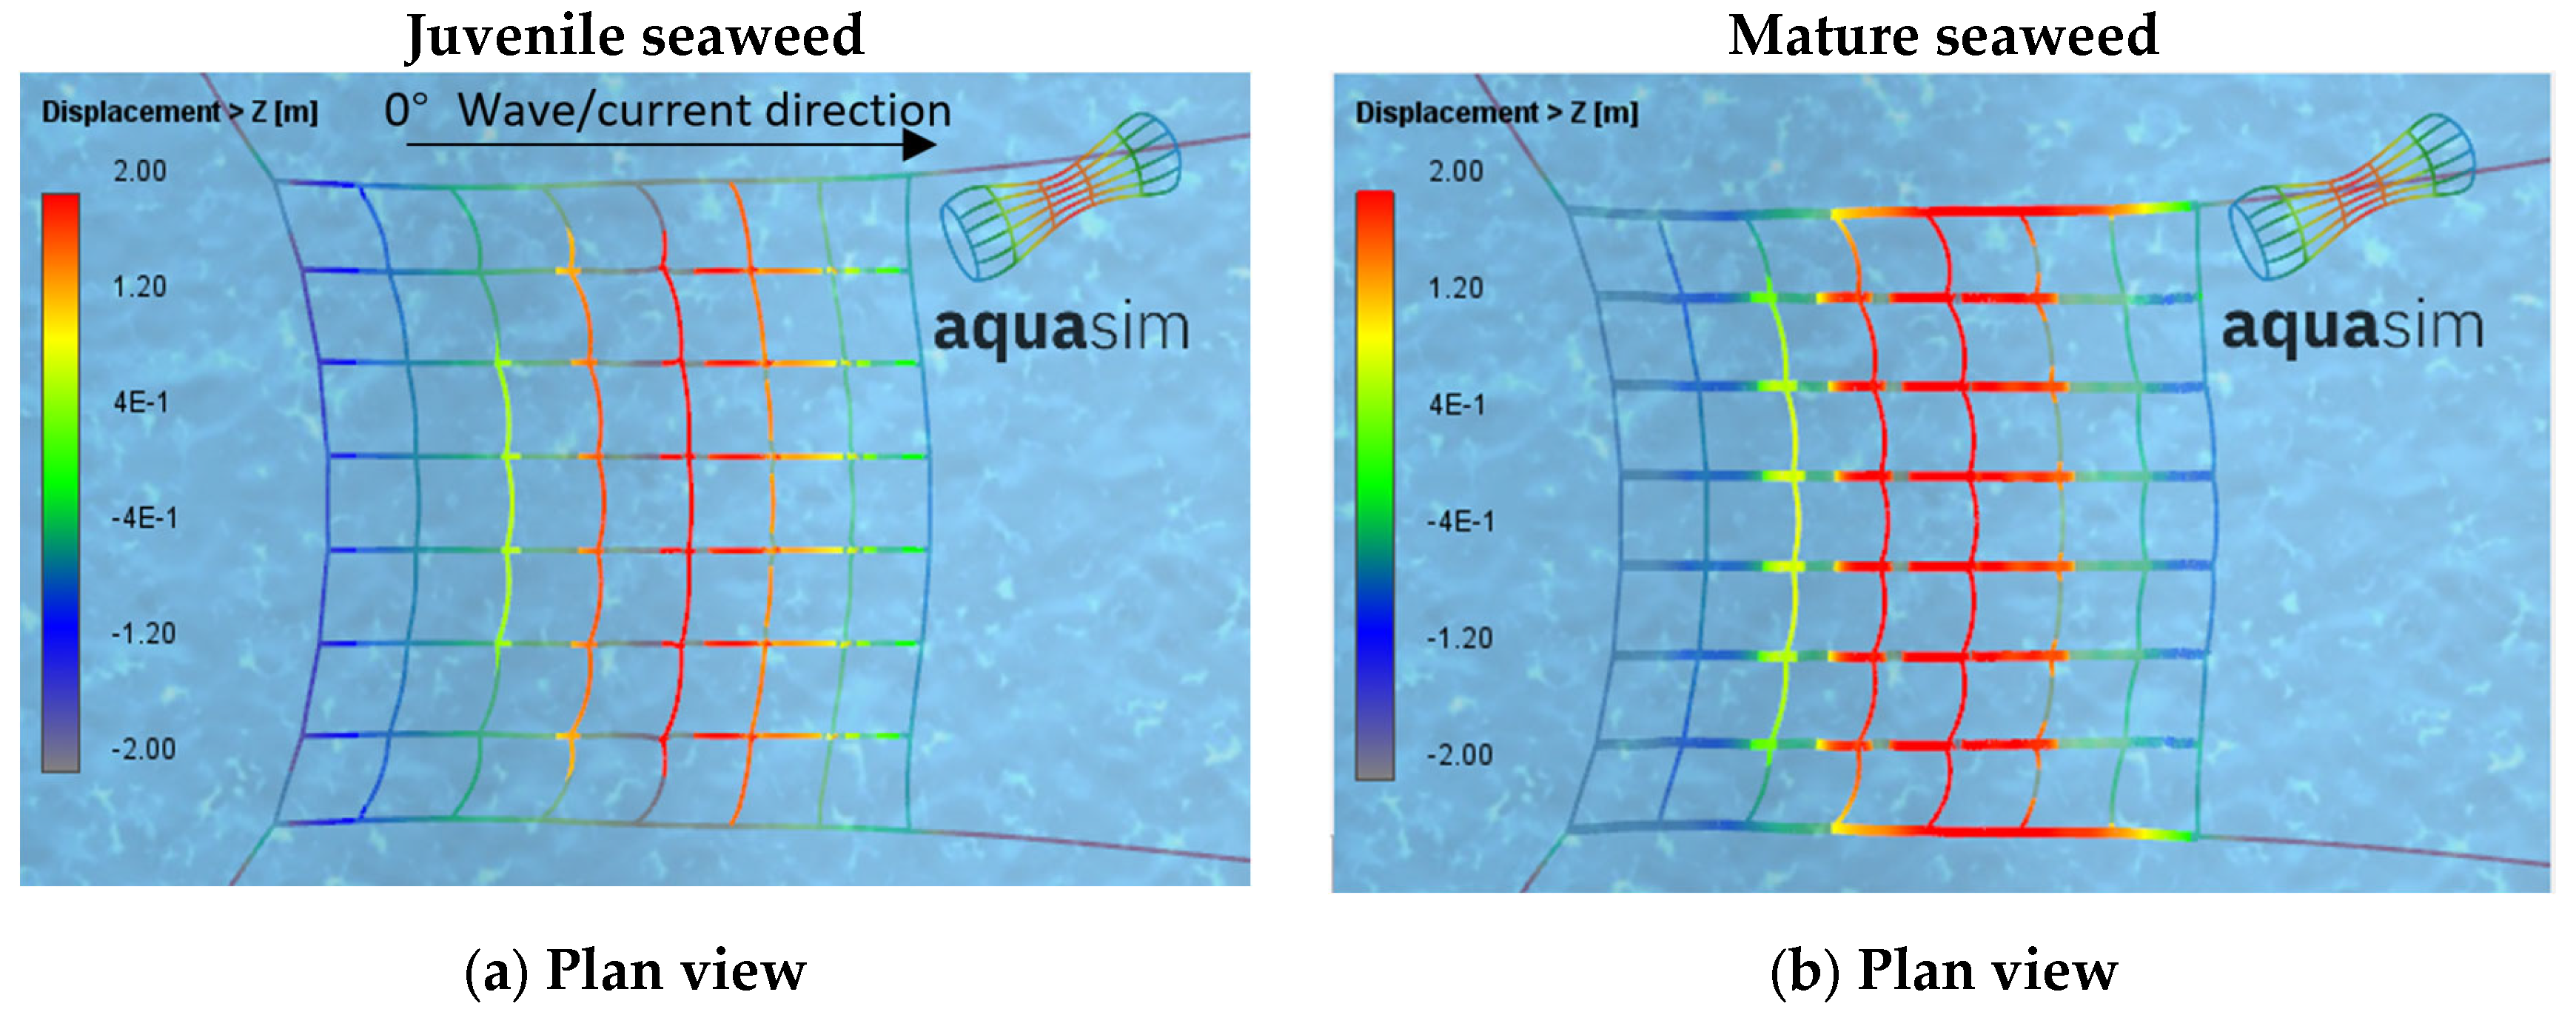
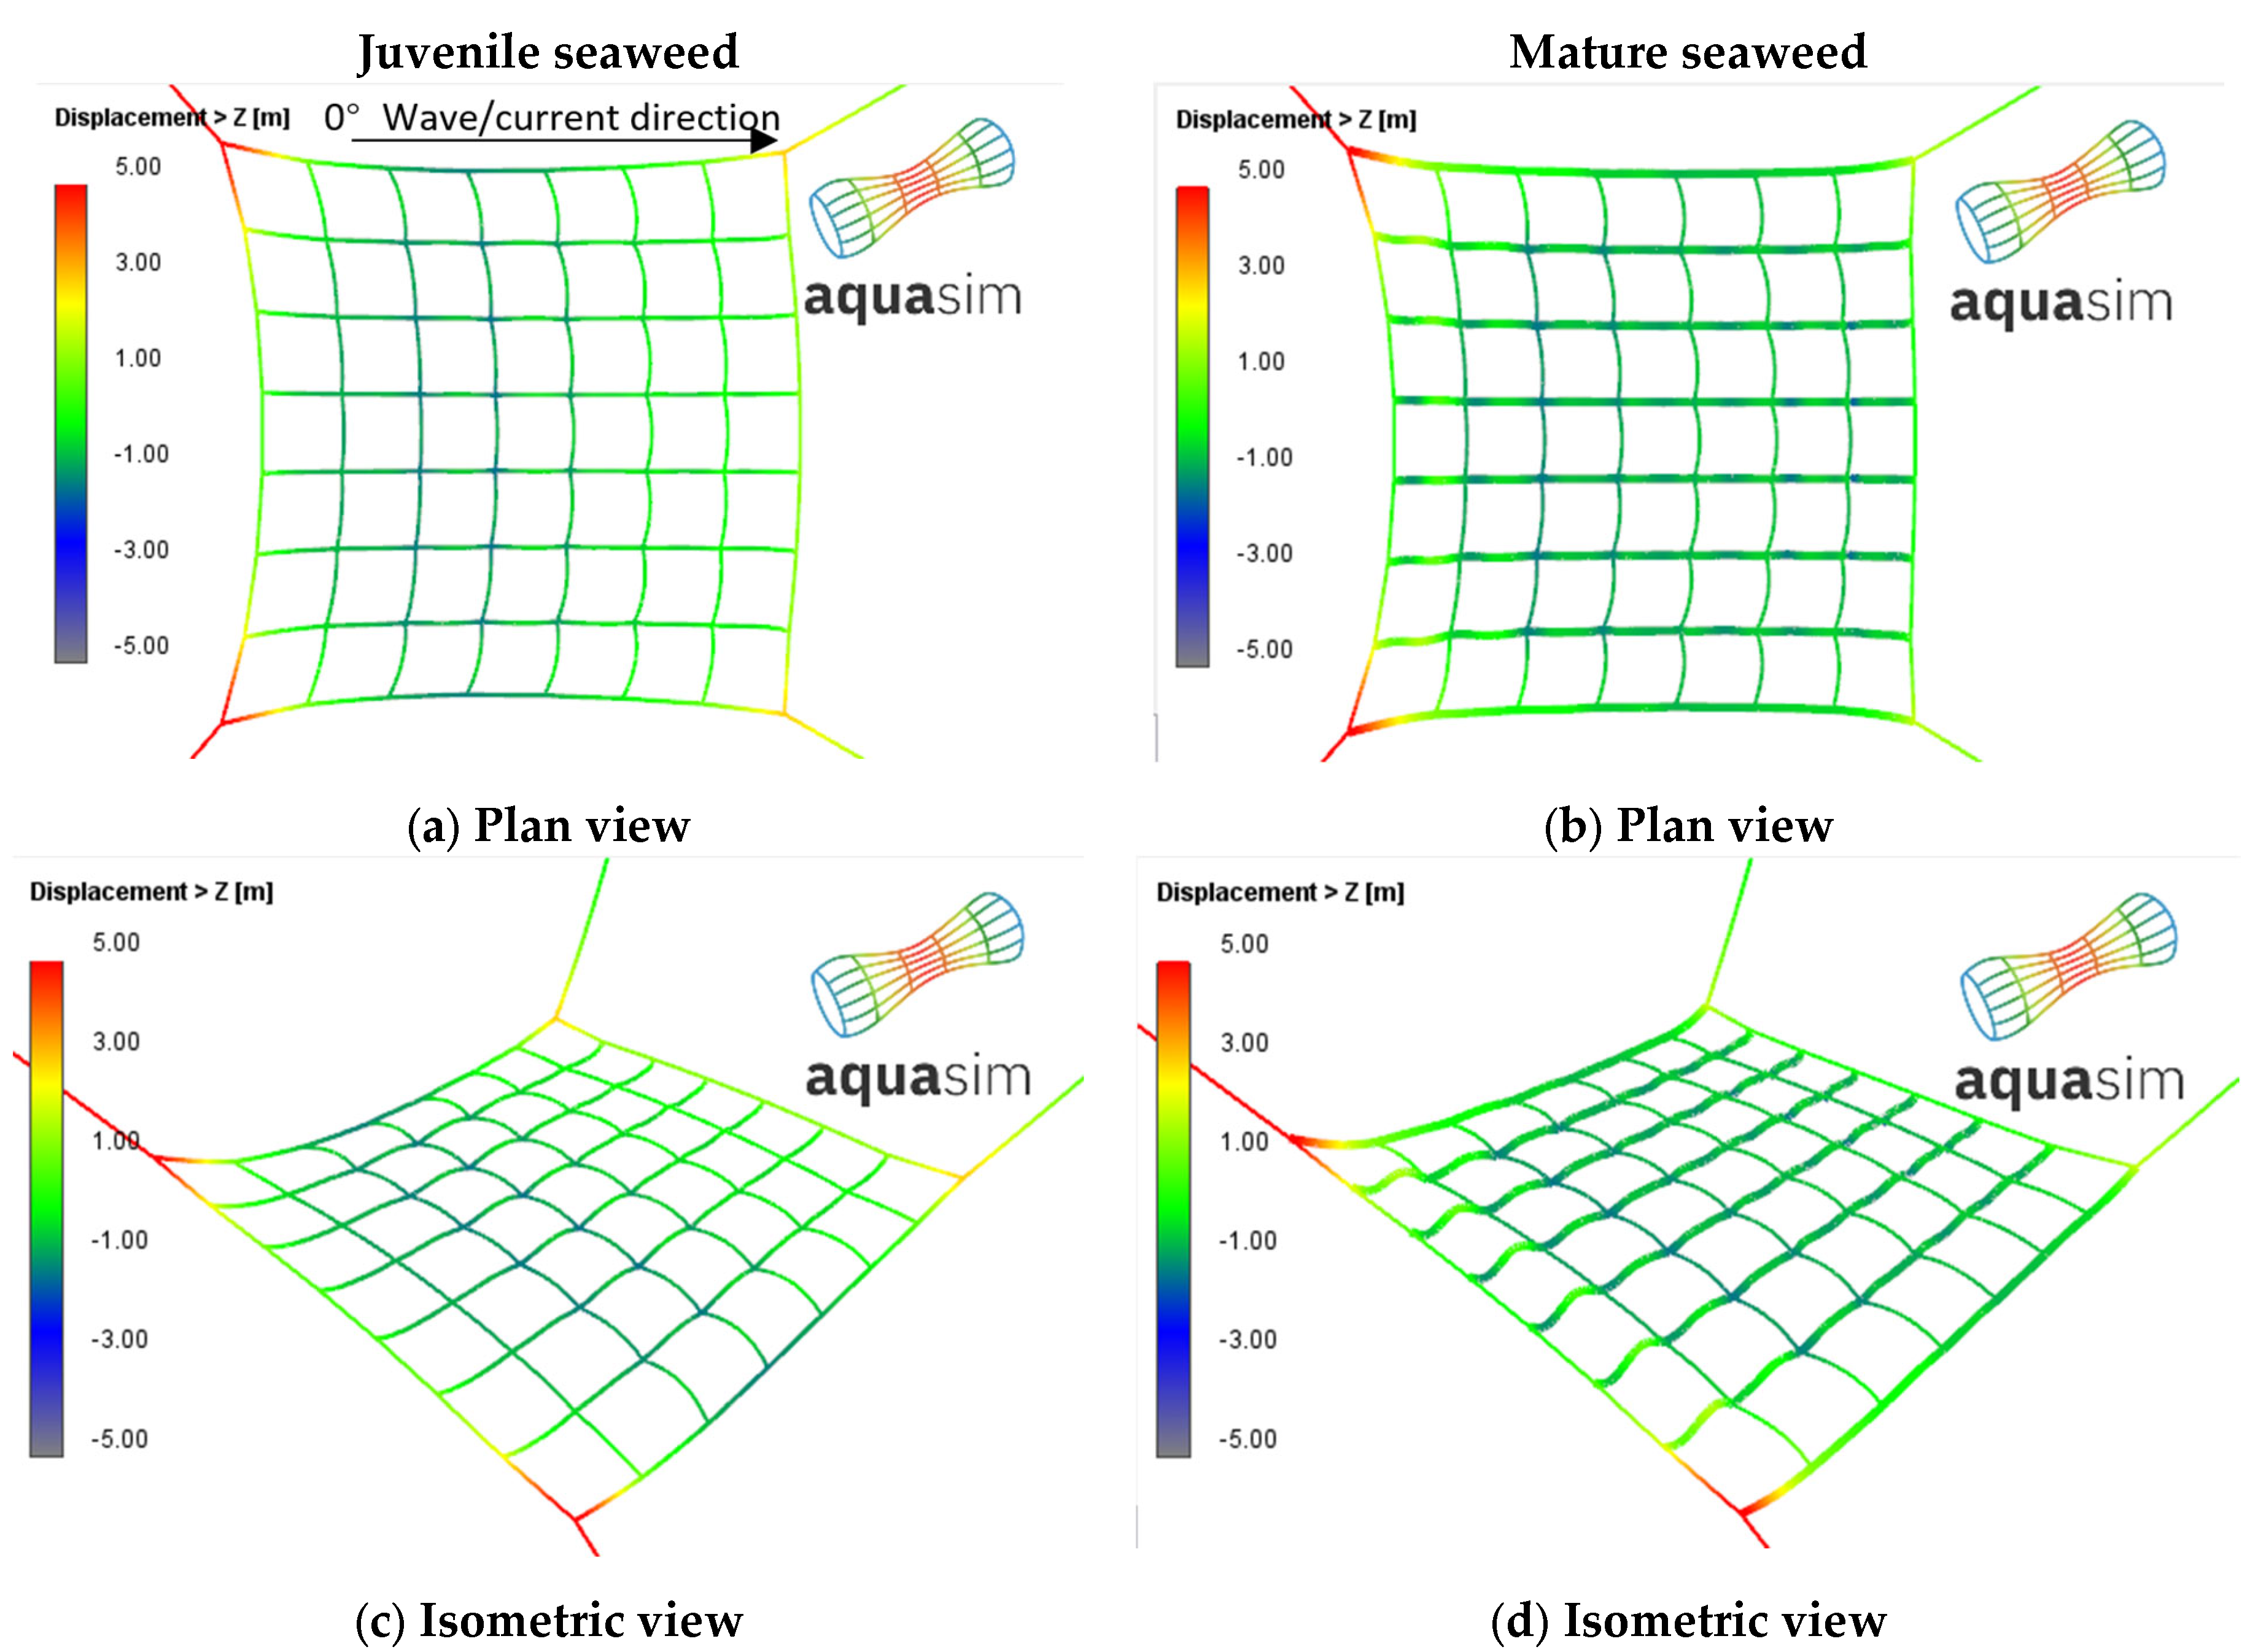
Figure 8 shows plan and isometric views of the SubSCI under waves S2 and current (speed of 0.6 m/s) actions, an incident angle
θ = 0°, and seaweed lines carrying juvenile seaweed or matured seaweed. As shown in
Figure 8a,b, regardless of whether the seaweed is in its juvenile or mature stage, the seaweed grid exhibits a curved shaped deformation in plan view and stretching along the direction of waves and currents, which aligns with observations from the field test.
Figure 8c,d show the deformations of the seaweed grid lines in tandem with wave motion, with some portions of the seaweed lines submerged below the water surface and others floating at the surface.
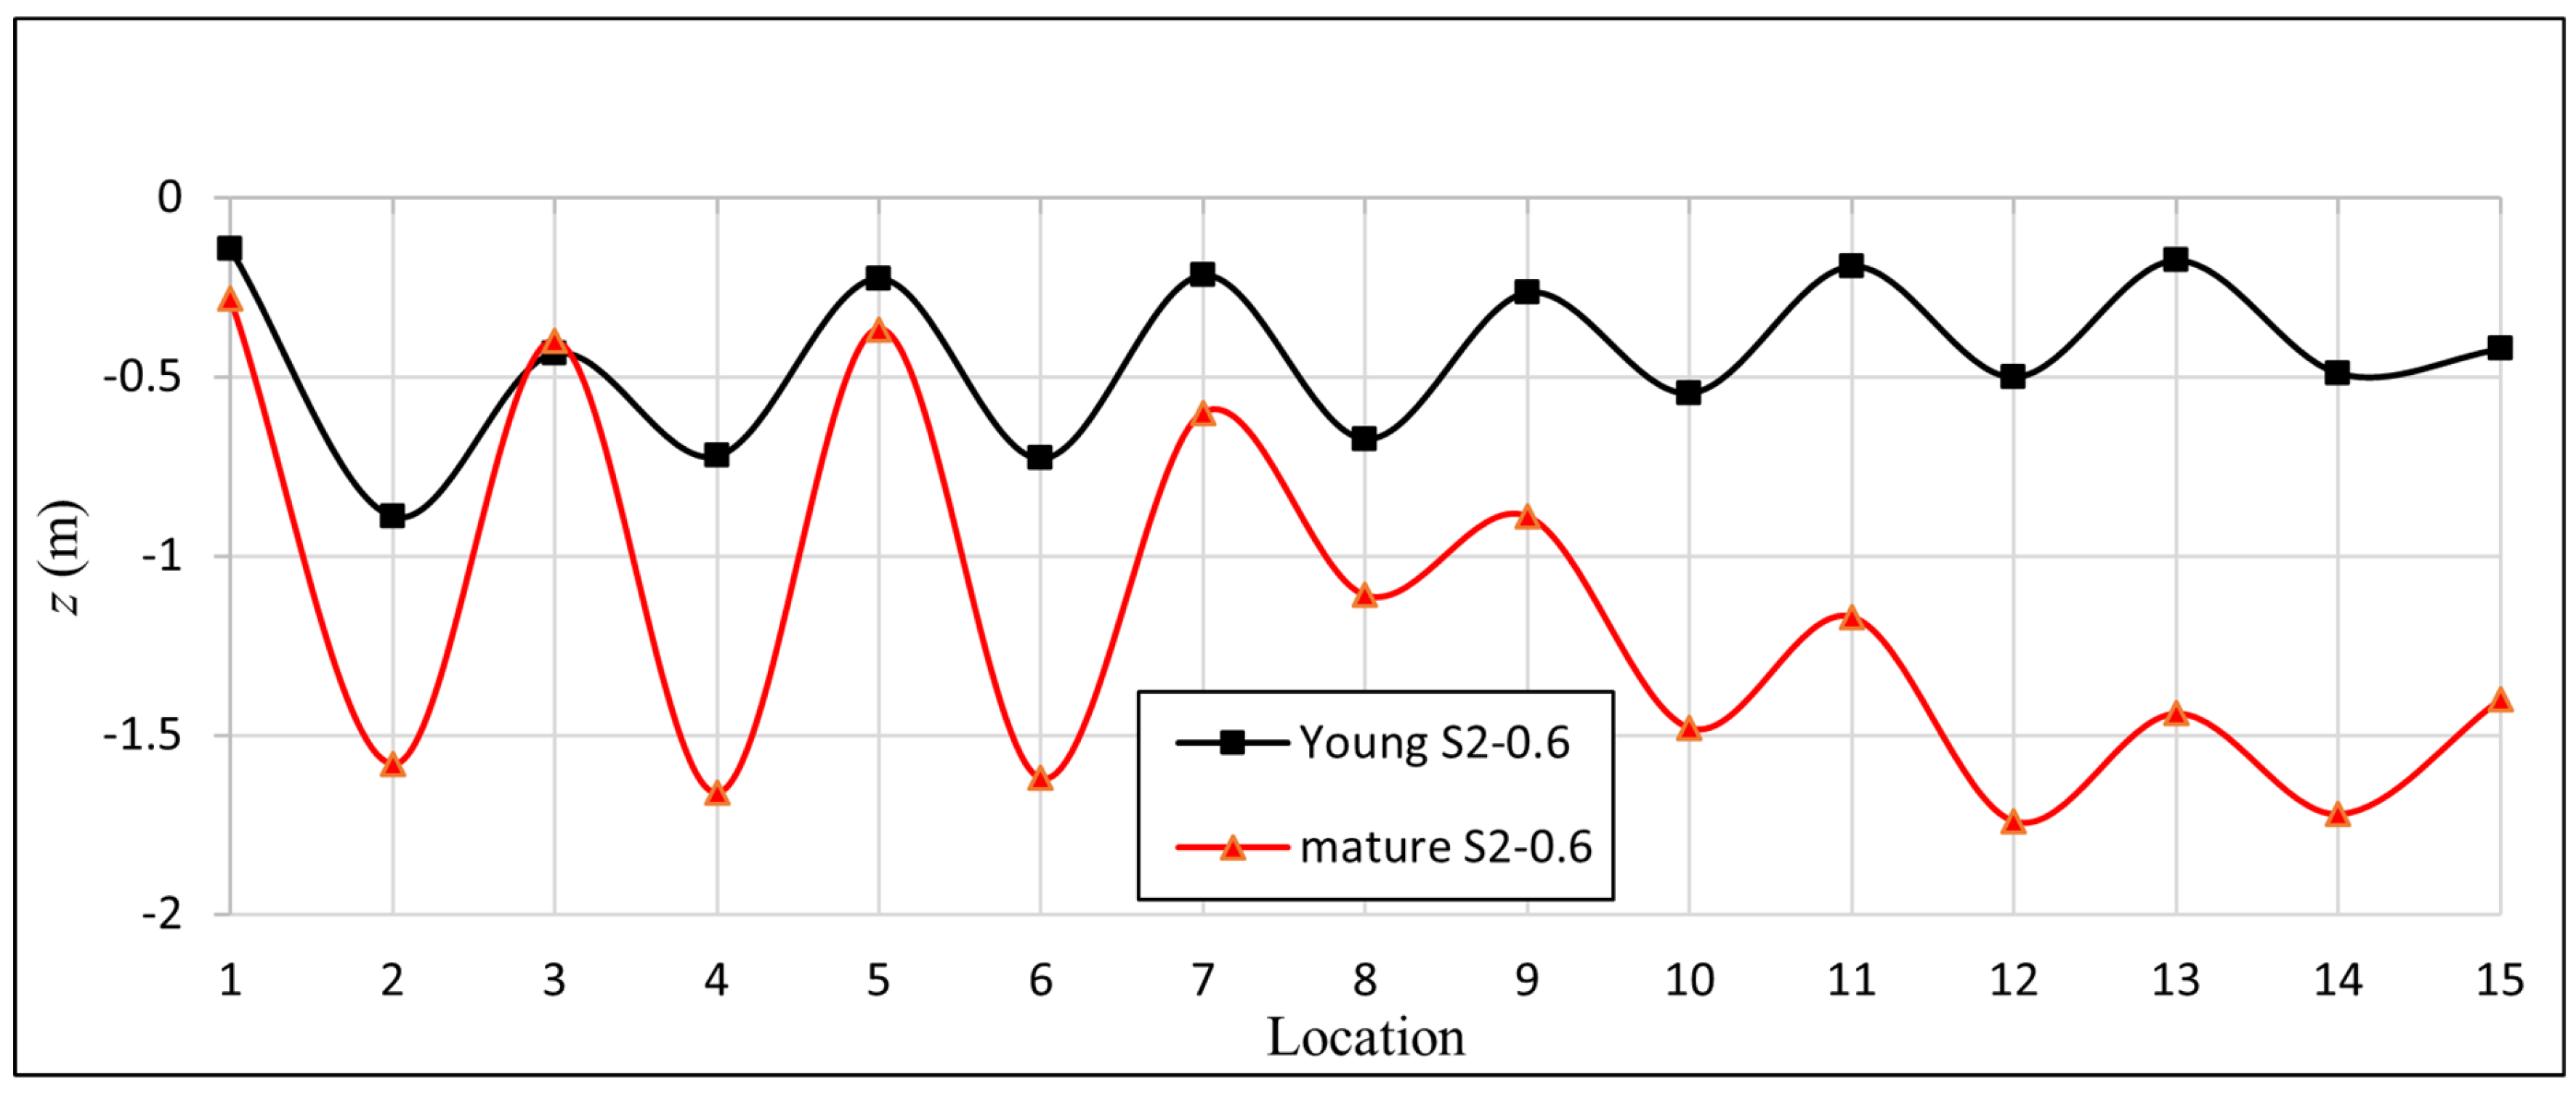
Figure 9 illustrates the distances between the floating central seaweed lines and the water surface for both juvenile and mature seaweeds. For juvenile seaweed, this distance remains within 1 m. Owing to the greater self-weight of the mature seaweed, the lines sag further; however, the distance remains within 1.5 m, which is below the maximum allowable limit of 2 m proposed by the Climate Foundation.
Next, we examine the deformation of SubSCI when submerged at 150 m below the water surface.
Figure 10a–d present views of SubSCI carrying either juvenile seaweed or mature seaweed at a depth of 150 m under sea state S2-0.6. It can be observed that the seaweed platform remains relatively level at this depth, with its four corners stretched outward by mooring lines in different directions to maintain tension equilibrium. The relative flatness appearance of the seaweed grid lines is due to the vanishing of waves at such a deep-water depth. Note that the dynamic wave pressure (
) has vanished at 150 m of water depth (100% for S1 with a wavelength of 14 m =
and 99.99% for S2 with a wavelength of 100 m =
). The deformation of the seaweed grid is primarily translational in nature as driven by the ocean current only with curved deformation (plan view) in the direction of the current. This indicates that the structure remains relatively stable after submerging to the seafloor.
Figure 11 illustrates the maximum vertical displacement of the central seaweed lines of the SubSCI system under submerged conditions. The maximum vertical displacement of the juvenile seaweed grid reaches 2.84 m, while that of the mature seaweed grid is 3.41 m. Both maximum displacement values fall within the allowable vertical deformation limit of 5 m as stipulated by the Climate Foundation.
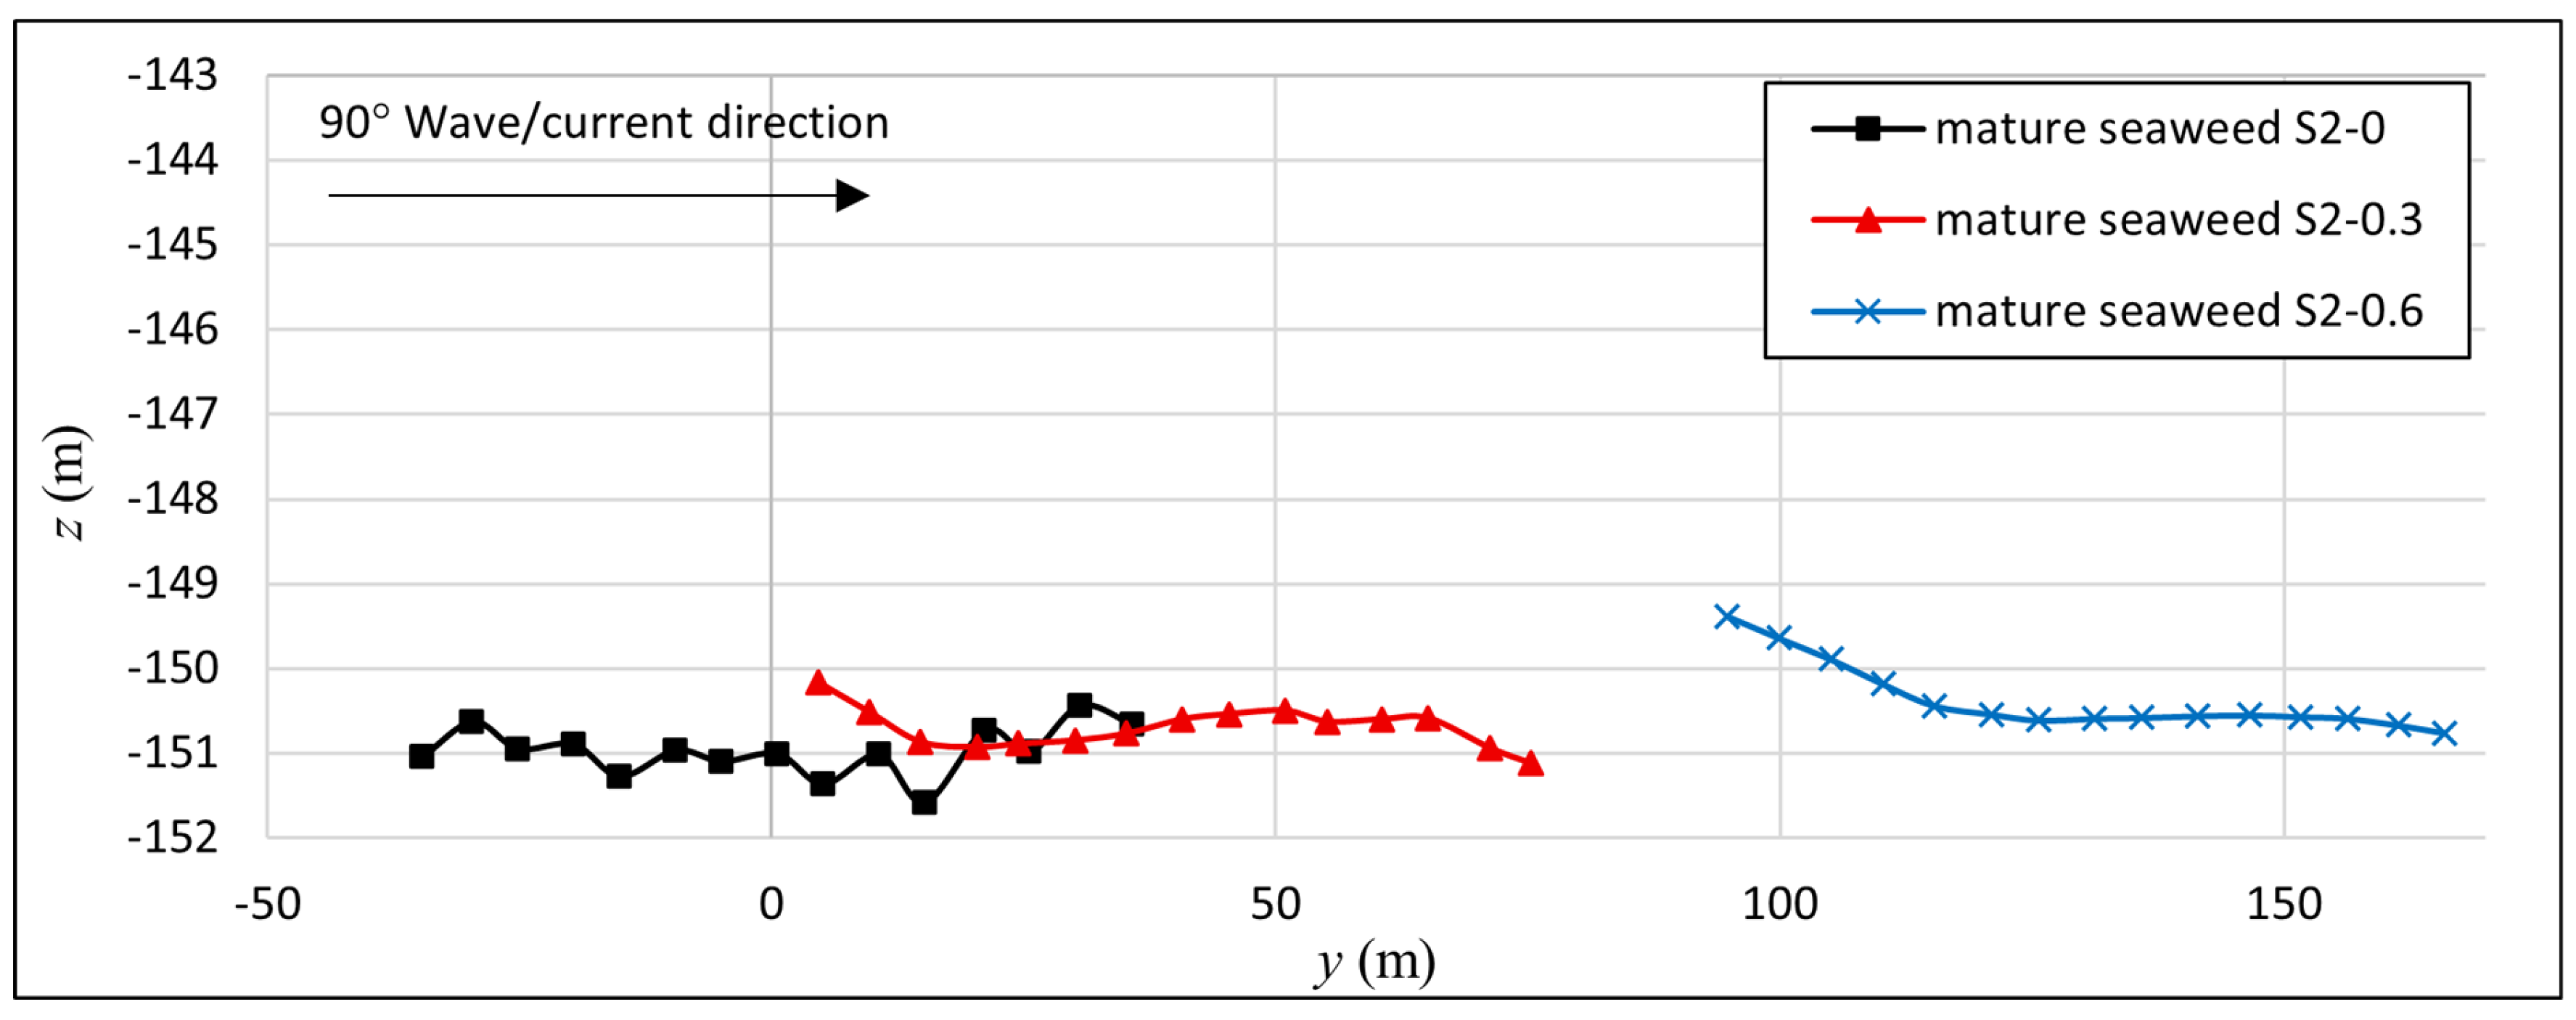
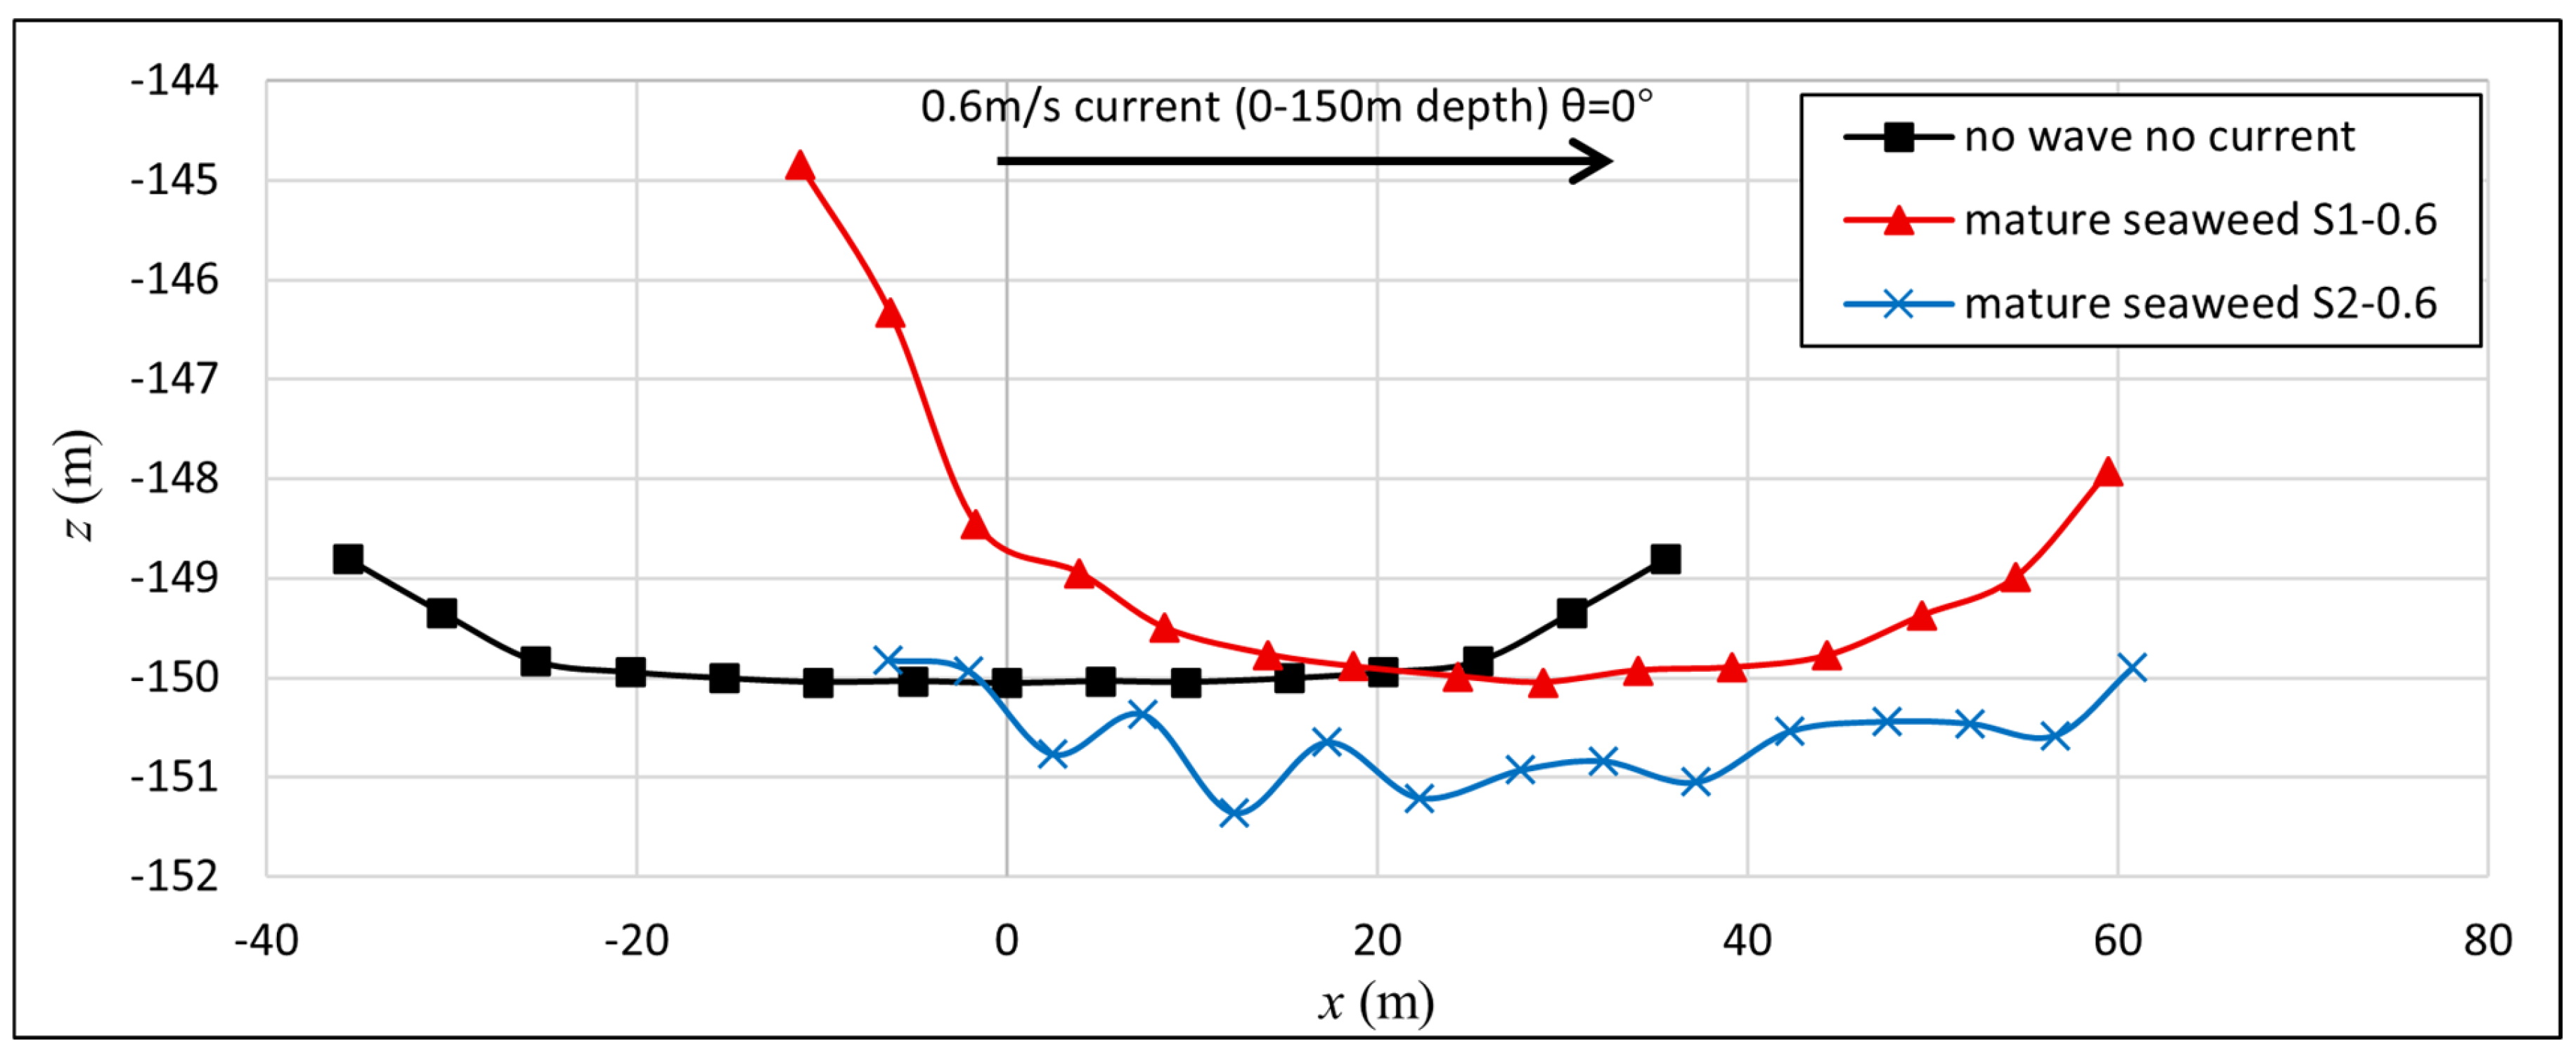
Figure 12 shows the translation of the middle seaweed line of SubSCI, carrying mature seaweed, under different current speeds (0 m/s, 0.3 m/s, and 0.6 m/s) at a water depth of 150 m. The seaweed line forms catenary shapes between the supporting lines. With a current speed of 0.3 m/s moving from left to right, the deformation of SubSCI seaweed lines will skew slightly to the right as shown in
Figure 12. The horizontal displacement is around 14 m for this current speed. If the current speed is further increased to 0.6 m/s, the seaweed lines will move even further to the right as shown in
Figure 12. The maximum horizontal displacement reaches up to 29 m, which is approximately twice that observed at a current speed of 0.3 m/s.
Figure 13 shows the translation of the submerged edge seaweed line for different current speeds. The deformation of the edge seaweed line is more slightly uniform when compared to the middle seaweed line (cf.
Figure 12 and
Figure 13). The maximum horizontal displacement is 11.3 m for a current speed of 0.3 m/s and it increases to 28 m when the current speed is 0.6 m/s, representing a 2.5-fold increase.
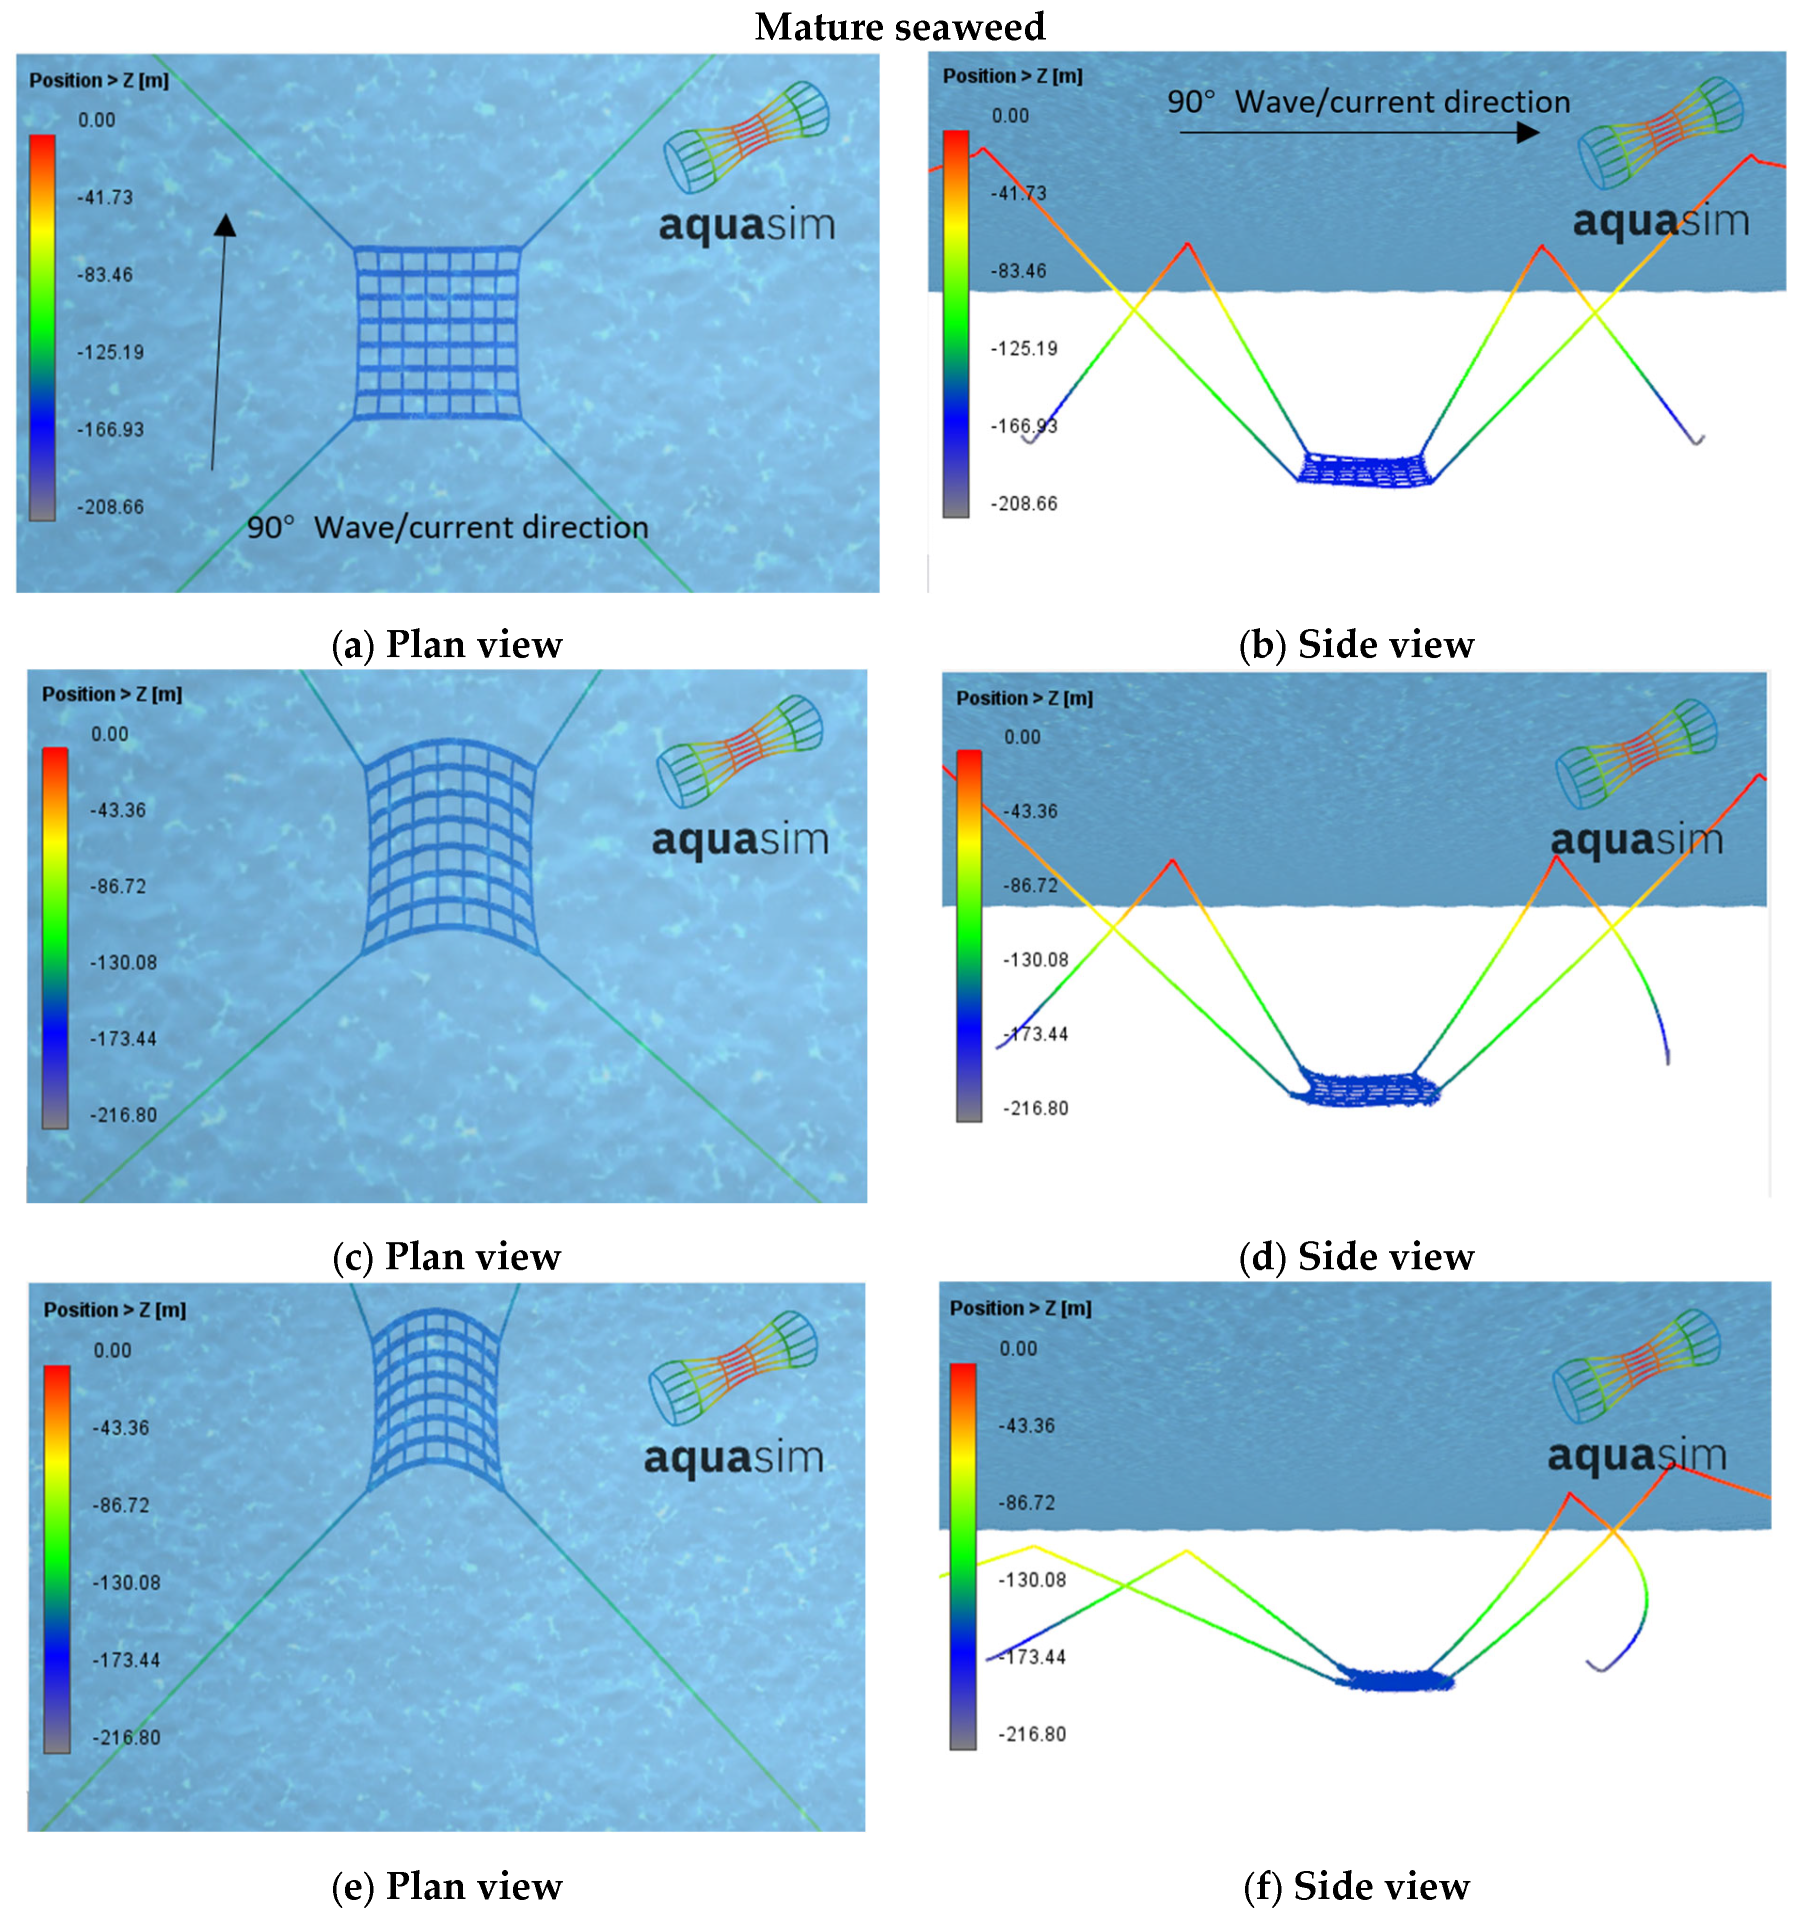
Figure 14a–f show the plan and side views of the deformation of SubSCI with an incident angle θ = 90° under a wave (S2) and currents (0 m/s, 0.3 m/s, and 0.6 m/s) with mature seaweed. The entire seaweed platform moves in the y-direction as the current speed increases. It can be observed that as the current speed increases, the lateral displacement of the seaweed grid also becomes more pronounced. When the current velocity reaches 0.6 m/s, the displacement along the y-axis extends to nearly 130 m. However, the vertical displacement of the platform remains relatively small, consistently staying below 5 m.
Figure 15 and
Figure 16 show, respectively, the translation and deformation of the middle supporting line and edge supporting line for various current speeds when the incident angle θ = 90°. As the current speed increases, both ends of the supporting line have different upward deflections. There is a lift of the seaweed grid line on the fore edge. The shape of the supporting line in
Figure 16 is curved when compared to the flat curve of
Figure 15 since the mooring lines exert tensile forces to the edge supporting lines. In
Figure 15, the maximum horizontal displacement of the middle supporting line is 39.3 m for a current speed of 0.3 m/s. When the current speed increases to 0.6 m/s, the horizontal displacement rises substantially to 130 m, which is 1.73 times the original length of the central seaweed line. Similarly,
Figure 16 shows a maximum horizontal displacement of 29.5 m for the edge supporting line at a 0.3 m/s current speed, and this displacement increases to 130 m at a 0.6 m/s current speed.
6.2. Axial Stresses in Mooring, Supporting, and Seaweed Grow-Out Lines
Next, we investigate the axial stresses in the mooring, supporting, and seaweed lines of SubSCI carrying mature seaweed under the sea state S2-0.6, i.e., the most severe sea state condition considered.
Figure 17 shows the 16 locations for measuring the axial stress and the directions of the wave and current. The waves and current directions are assumed to be the same and the incident angles considered are θ = 0°, 30°, 45°, 60°, and 90°. Both floating and submerged (150 m depth) conditions are examined. Measurement points are distributed as follows: points 1 to 8 on mooring lines, points 9 to 14 on supporting lines, and points 15 and 16 on seaweed lines.
Table 4 presents the axial stresses at 16 points in SubSCI with different waves and current incident angles θ. The data are compared for the floating SubSCI and submerged SubSCI (150 m water depth). Note that data are in parentheses when the SubSCI is submerged. We first discuss the axial stresses at measurement points 1 to 4. When the incident angle of waves and currents is 0° under floating conditions, axial stresses at points 1 to 2 are about 12.6 MPa and 12.7 MPa, much higher than at points 3 and 4 (3.0 to 3.2 MPa). When submerged, axial stresses at points 1 and 2 are 19.9 MPa and 20 MPa which is larger than that at points 3 and 4 (11.2 MPa). This symmetry between points (1,2) and points (3,4) reflects the structural symmetry of SubSCI, while the higher values at points 1 and 2 result from their direct exposure to incoming waves.
At θ = 90 degrees, the pattern shifts: the axial stresses at points 2 and 3 dominate (45 MPa floating, and 43 MPa submerged), whereas stresses at points 1 to 4 remain small (3.0 MPa floating, and 8.5 MPa submerged). Thus, wave-facing points 2 and 3 consistently carry higher loads than sheltered points 1 to 4.
A similar trend appears in mooring lines (points 5 to 8). At θ = 0° under floating conditions, the axial stresses at points 5 and 6 are equal to 12.1 MPa, while the axial stresses at points 7 and 8 are equal to 2.0 MPa. The axial stresses at points 5 and 6 are greater than those at points 7 and 8, because points 5 and 6 are at the wave-facing side, and the seaweed culture net moves with the waves, putting points 5 and 6 on the stretched mooring lines. Similarly, when the angle of incidence θ = 0° and the SubSCI is 150 m submerged, the axial stresses at points 5 and 6 are greater than the axial stresses at points 7 and 8. When submerged, this difference persists. At θ = 90°, the axial stress pair shifts to 6 and 7 (46 MPa floating, and 41.4 MPa submerged), while points 5 to 8 remain lightly loaded (less than 4 MPa). The axial stresses at points 6 and 7 are greater than those at points 5 and 8 because the former points are at the wave-facing side.
For the supporting lines (points 9 to 14), stresses differ significantly between wave-facing and sheltered sides. Under floating conditions with θ = 0°, the maximum axial stresses at points 9 and 11 are almost the same, which are 37.4 MPa, 35.9 MPa, and 37.6 MPa. In contrast, the maximum axial stresses at points 12 to 14 are very low (2.6 to 2.9 MPa). Submergence does not alter this trend: wave-facing supporting lines always bear much higher stress than sheltered ones.
For the floating SubSCI at θ = 90°, the axial stresses are symmetric about the y-axis: points 11 to 14 reach 60 MPa, points 10 and 13 are almost equal to 40.6 MPa, and points 9 and 12 are equal to 27 MPa. These axial stress results indicate that the closer one gets to the wave- and current-facing side of the SubSCI, the higher the axial stress. For the submerged SubSCI under a wave and current incident angle of 90°, the axial stresses from points 9 to 14 follow the same trend.
For point 15, the axial stress gradually increases from 7.9 MPa to 32.9 MPa as the incident angle θ increases in the floating state. For point 16, the axial stress on the SubSCI increases with increasing θ, regardless of whether the SubSCI is floating on the surface or submerged. When SubSCI is on the sea surface, the axial stress increases from 8.0 MPa to 67 MPa, while the axial stress increases from 20.4 MPa to 47 MPa when SubSCI is submerged. The maximum axial stress at point 16 can reach up to 67 MPa.
All supporting lines, seaweed grow-out lines, and mooring lines are made of UHMWPE ropes that are designed for high tensile strength and have an extremely low weight. Consequently, the fibres in UHMWPE ropes are highly oriented and do not yield in the traditional sense. They maintain their form until they reach a high stress level, at which they fail abruptly, making the concept of yielding strength less applicable. UHMWPE ropes show little permanent elongation under load and the failure is sudden when the ultimate tensile strength is reached. For this reason, UHMWPE ropes are often rated primarily by their breaking strength. From
Table 1, the breaking strength of the UHMWPE rope that we used in this research is 331 MPa. The maximum axial stresses at all measured points obtained in
Table 3 are much smaller than the breaking stress of the UHMWPE rope, indicating that the structure is very safe in most conditions in Cebu water.
6.3. Hydroelastic Analysis of SubSCI in Stratified Current
According to the Climate Foundation’s empirical measurements of seaweed cultivation in the Philippines, ocean current velocities exhibit significant variations across different depths. This variation is attributed to differences in seawater temperature and pressure at varying depths. Based on the Climate Foundation’s observations, we assumed a current velocity of 0.6 m/s at depths ranging from 0 to 75 m, and −0.3 m/s at depths ranging from 75 m to 150 m. These current velocity scenarios were input into the AquaSim software to simulate the performance of mature seaweed SubSCI under various sea state conditions, S1-0.6, S2-0.6, S1*, and S2* as presented in
Table 2.
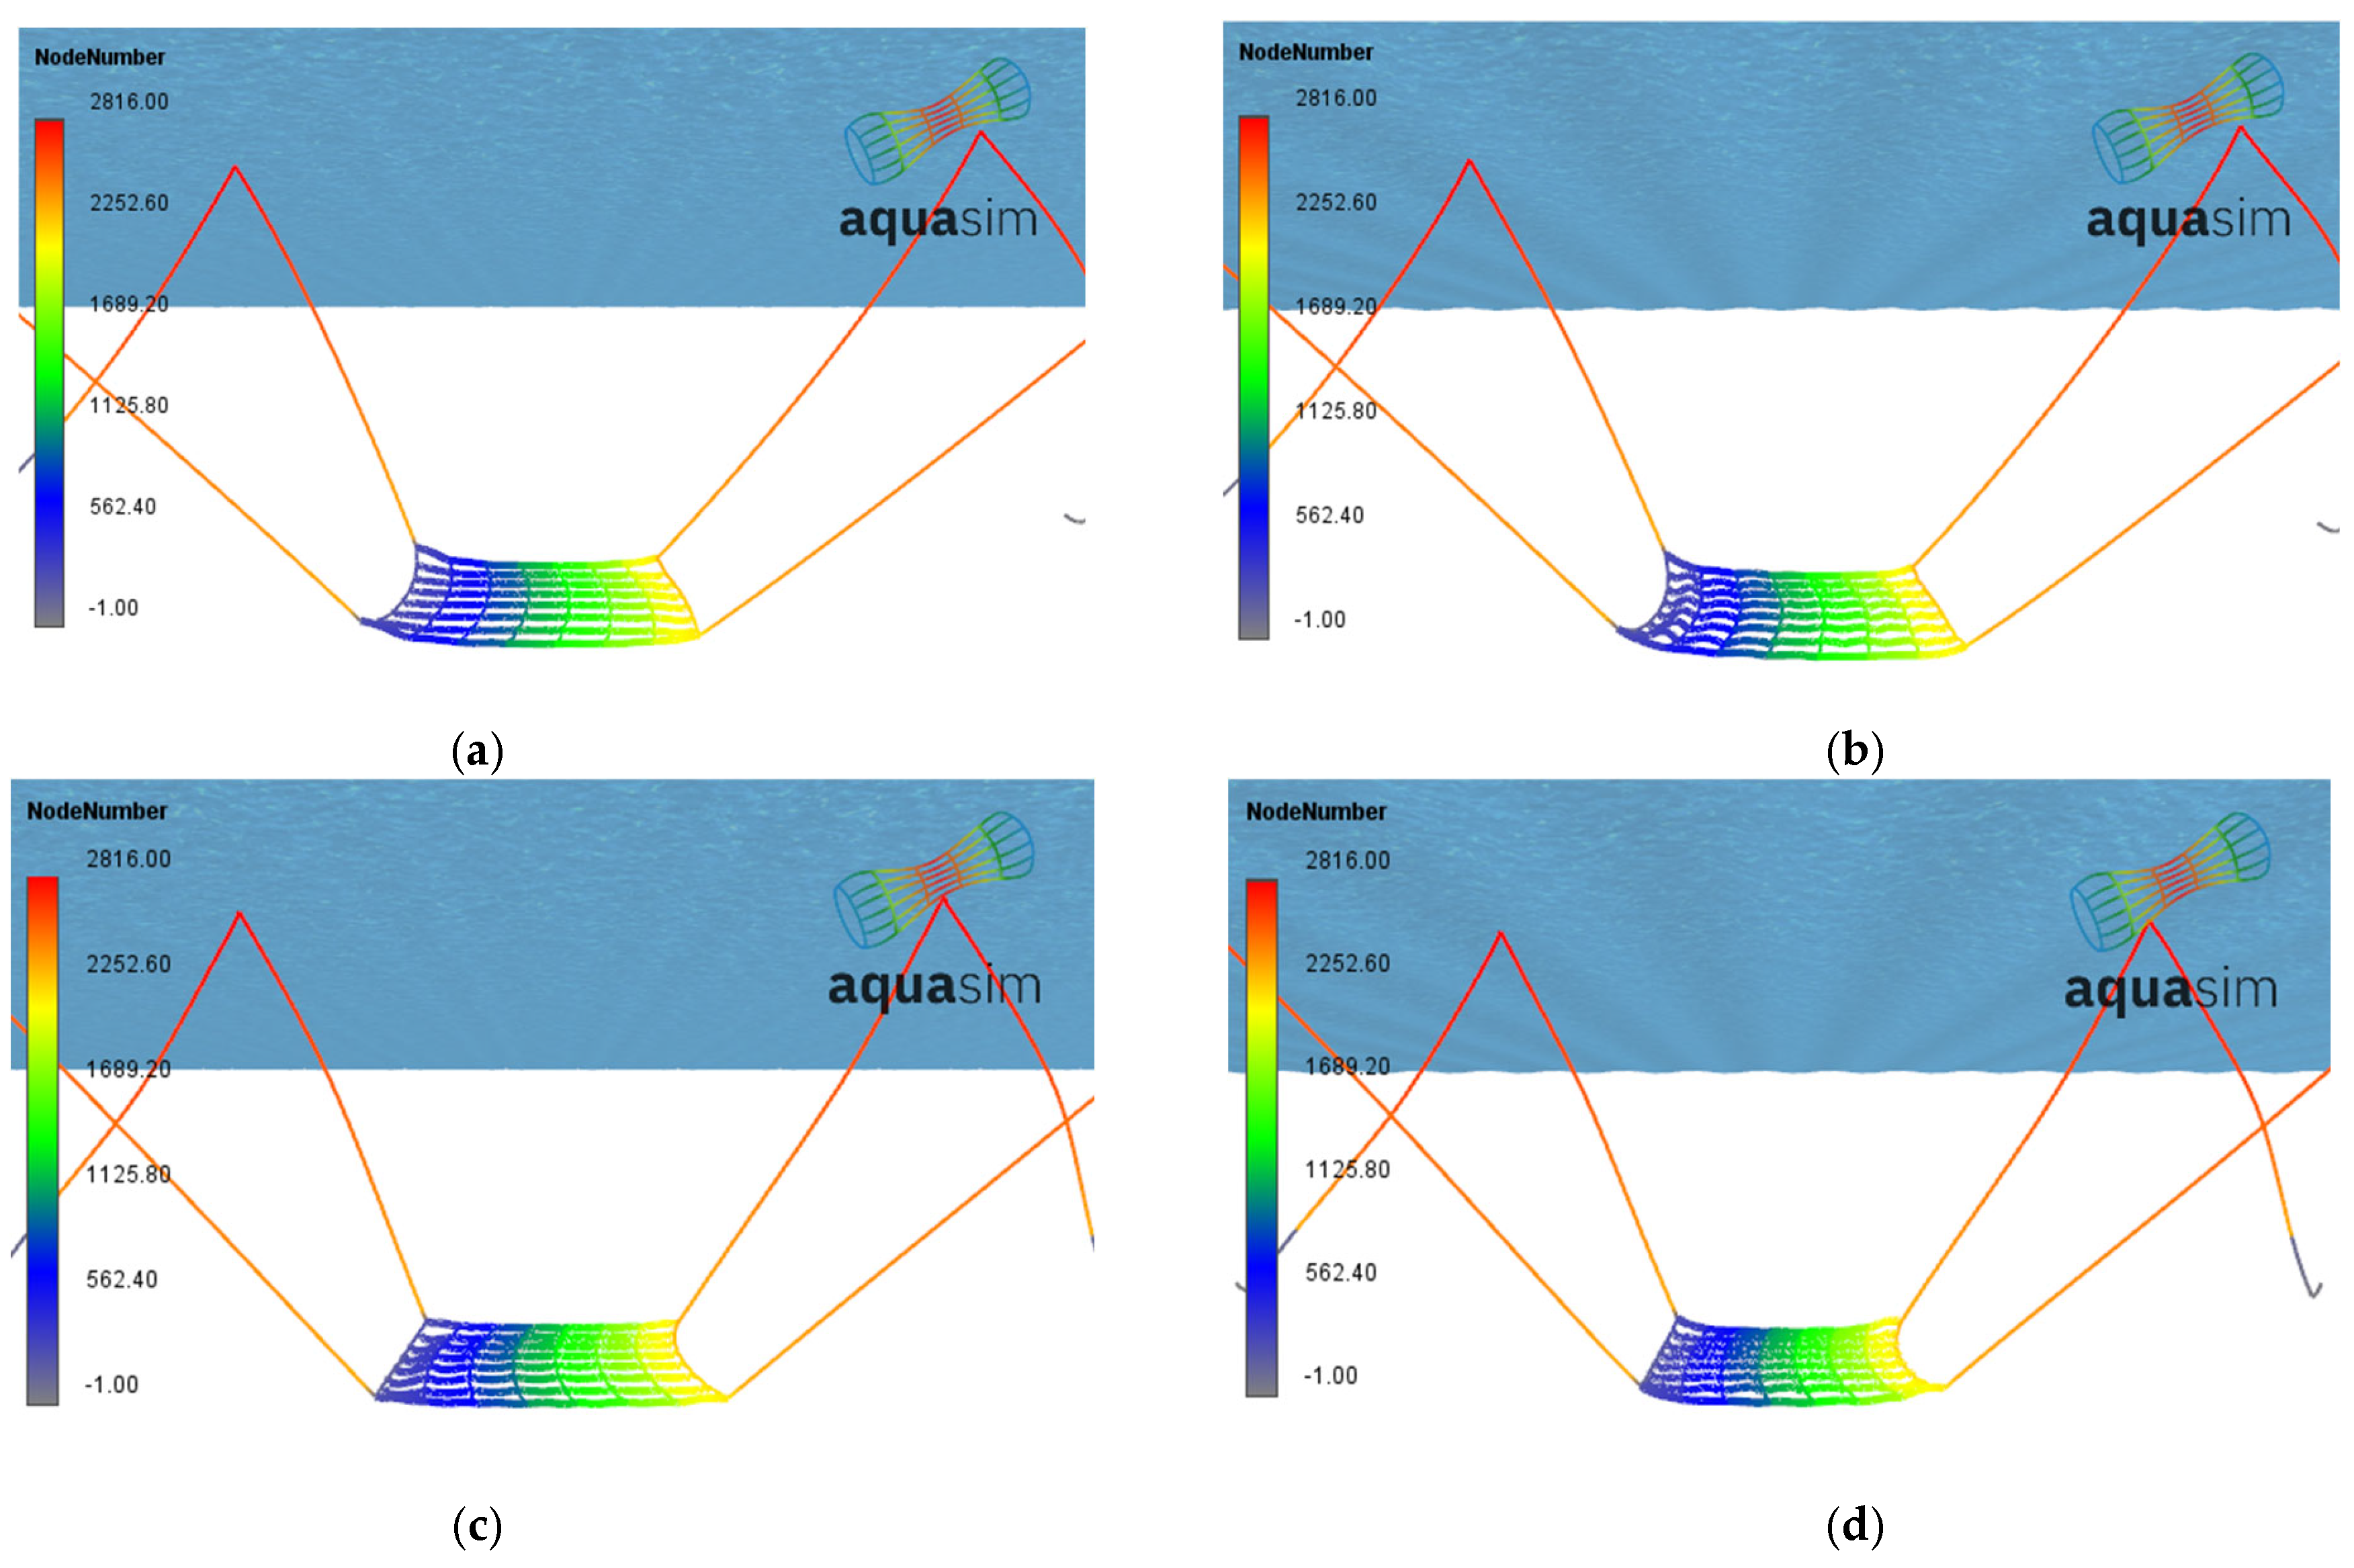
Figure 18 presents the side views of SubSCI with mature seaweed submerged at a depth of 150 m under the four mentioned sea states. From
Figure 18a,b, it is evident that the entire seaweed line platform is displaced laterally in the direction of water flow due to the presence of a current with a velocity of 0.6 m/s. Variations in wave height and wave period have minimal impact on the horizontal displacement of the seaweed line platform, and only a slight influence on the vertical displacement at the junction between the mooring line and the seaweed platform.
In contrast,
Figure 18c,d reveal a different scenario. Owing to the stratified current velocities in sea states S1* and S2*, the seaweed platform experiences an overall displacement to the left instead of to the right.
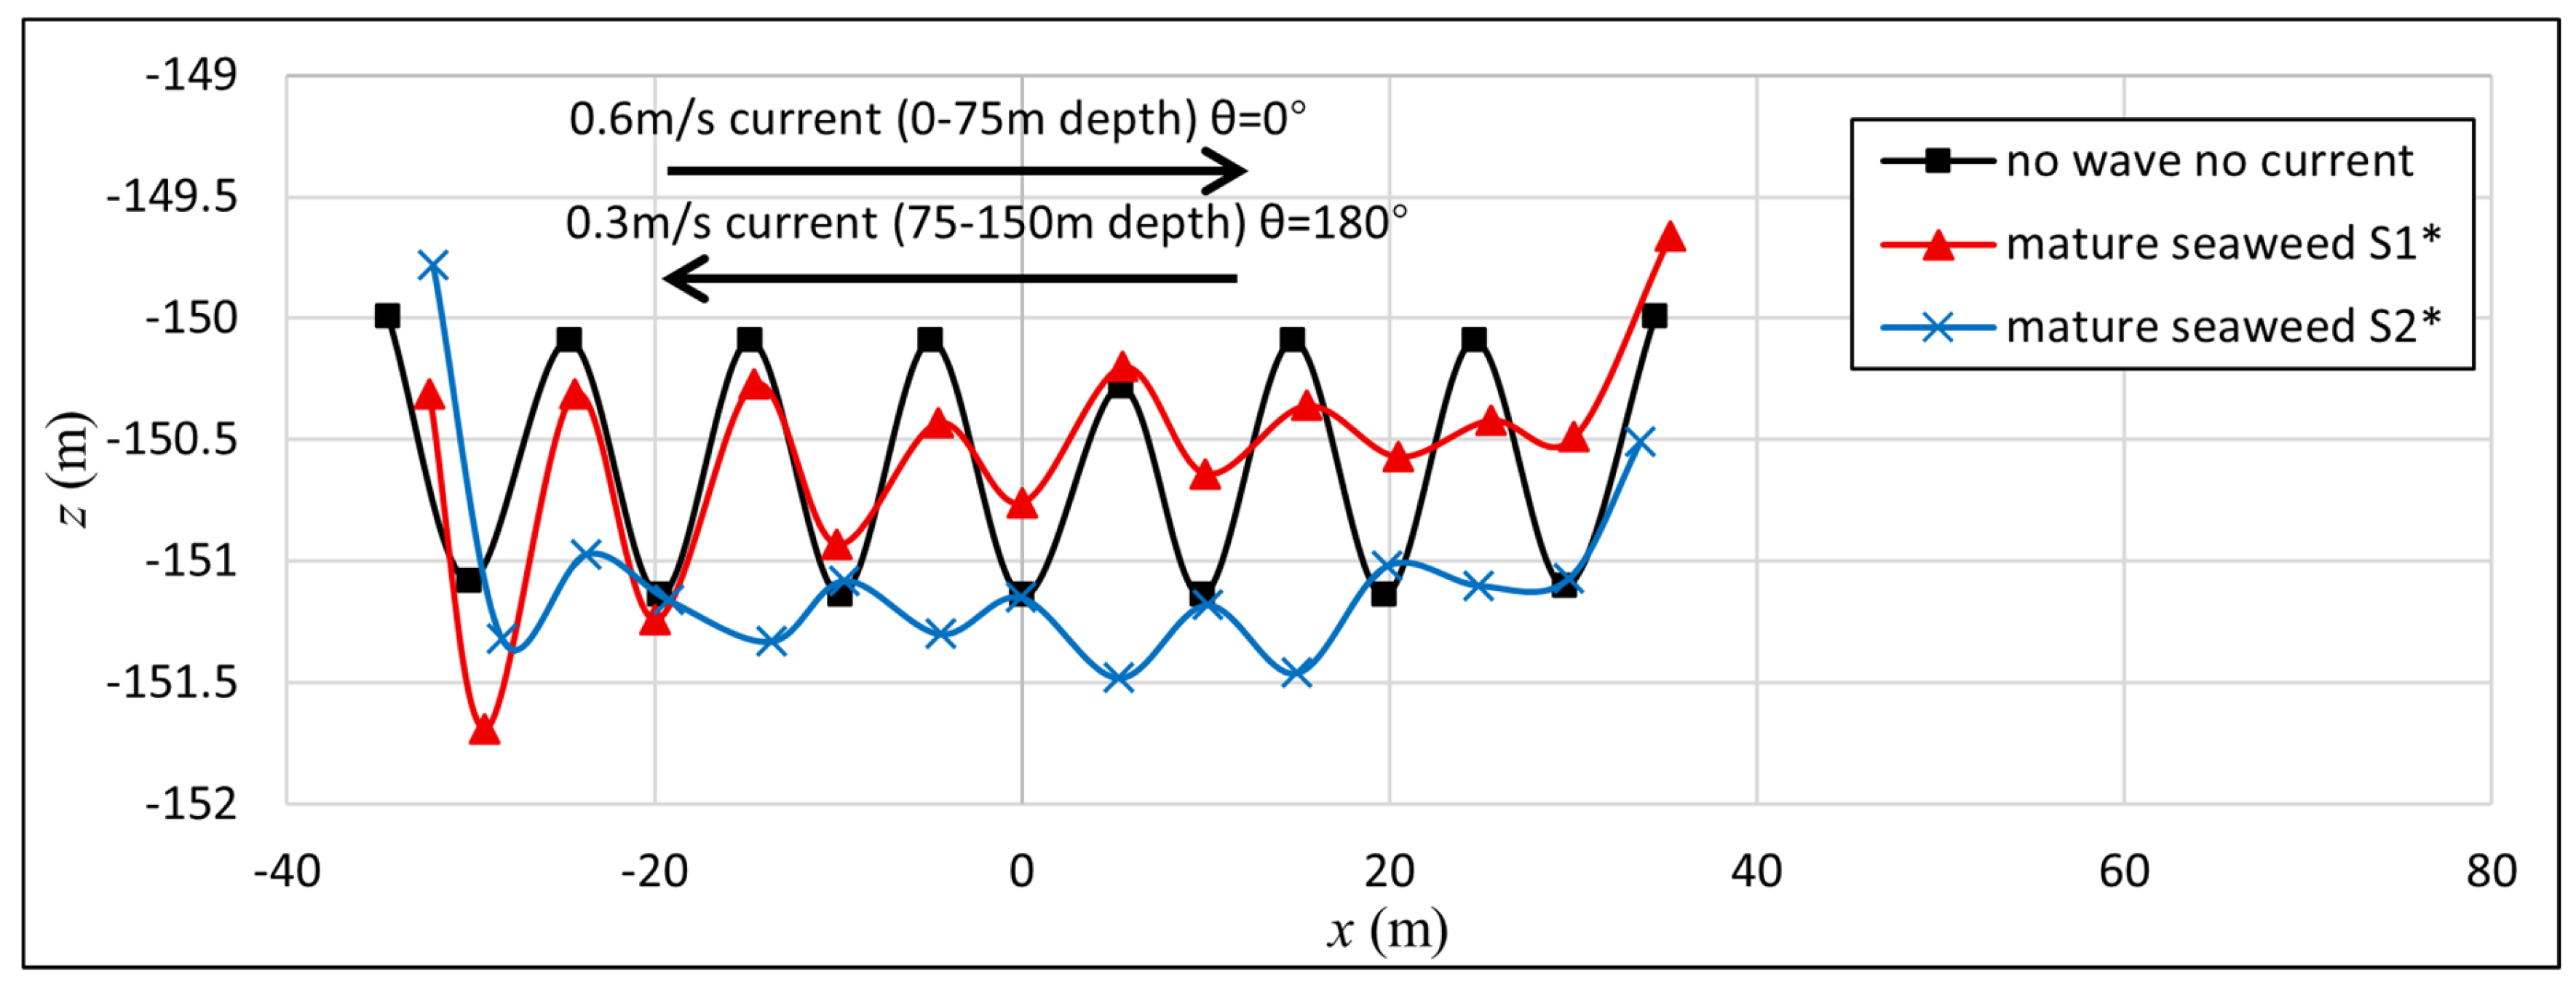
Figure 19 and
Figure 20 provide a clearer depiction of the deformation of the middle seaweed lines within the seaweed platform under various sea states. Under sea states S1 and S2, the middle seaweed lines deform rightward relative to their initial positions, with a maximum lateral displacement of up to 28 m. In contrast, under sea states S1* and S2*, the rightward displacement on middle seaweed lines is less than that under sea states S1 and S2 due to the influence of stratified current velocities, with a maximum lateral displacement of approximately 2.2 m.
Similarly,
Figure 21 and
Figure 22 illustrate the deformation of the edge seaweed lines within the seaweed platform under various sea states. When compared to the middle seaweed lines, the deformation of the edge lines primarily occurs at their ends, where they are connected to the mooring lines and are more influenced by mooring line displacements. Additionally, the deformation of submerged edge seaweed lines under sea states S1* and S2* is gentler and exhibits less lateral movement compared to sea states S1 and S2. This difference arises from the opposing directions of stratified currents, which result in reduced lateral and vertical displacements of the mooring lines.
Table 5 presents the maximum vertical deformation of middle and edge seaweed lines under various sea states. All values are below the maximum allowable vertical displacement of 2 m specified by the Climate Foundation, indicating that the SubSCI platform remains structurally safe when fully submerged to a depth of 150 m.
Figure 23 illustrates the distribution of axial forces in SubSCI when submerged to a depth of 150 m under sea states S1* and S2*. The force diagram qualitatively indicates that the axial forces on the four mooring lines are significantly higher under sea state S2* when compared to S1*.
Table 6 provides detailed data on the maximum axial stresses in the mooring lines, support lines, and seaweed lines. The highest axial stress on the mooring lines occurs under sea state S2*, reaching 6.9 MPa. The maximum axial stresses on the supporting lines are 15 MPa and 17.1 MPa for both S1* and S2*, while the maximum axial stress on the seaweed lines is 2.5 MPa under S2*. All these forces are well below the breaking strength of UHMWPE lines (331 MPa), indicating that SubSCI submerged at 150 m is not at risk of rope failure under sea states S1* and S2*.
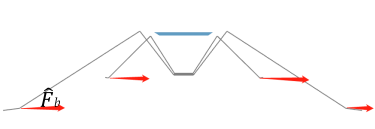
Additionally, the overall drag force acting on the structure is a critical factor to consider during daily farming operations at a depth of 150 m.
Table 7 shows the total drag force on four points attached to SubTractors located at sea level. The maximum drag forces are 14 kN for sea state S2-0.6 and 7.5 kN for sea state S2*. Also,
Table 7 presents the total drag force at the four anchor points where the mooring lines are attached to the seabed. The maximum drag force is 13.4 kN for sea state S2-0.6 and 5.7 kN for sea state S2*. To maintain structural stability, the anchoring force capacity at these points must not exceed 13.4 kN to prevent positional shifts.
