Article

Numerical Study of the Flow Around Twin Straight-Bladed Darrieus Hydrokinetic Turbines

1
PAI+ Group, Mechanical Engineering Department, Faculty of Engineering, Universidad Autónoma de Occidente, Cali 760030, Colombia
2
Grupo de Modelado y Métodos Numéricos en Ingeniería, Departamento de Ingeniería Mecánica y Mecatrónica, Facultad de Ingeniería, Universidad Nacional de Colombia, Sede Bogotá, Carrera 30 No 45A-03, Bogotá 111321, Colombia
3
Galicia Supercomputing Centre (CESGA), 15705 Santiago de Compostela, Spain
4
School of Mechanical, Aerospace and Civil Engineering, Universidad of Manchester, Manchester M13 9PL, UK
*
Author to whom correspondence should be addressed.
J. Mar. Sci. Eng. 2025, 13(10), 1947; https://doi.org/10.3390/jmse13101947 (registering DOI)
Submission received: 17 September 2025 / Revised: 7 October 2025 / Accepted: 8 October 2025 / Published: 11 October 2025
(This article belongs to the Section Ocean Engineering)

Abstract

Nowadays, the potential of hydrokinetic turbines as a sustainable alternative to complement traditional hydropower is widely recognized. This study presents a comprehensive numerical analysis of twin straight-bladed Darrieus hydrokinetic turbines, characterizing their hydrodynamic interactions and performance characteristics. The influence of turbine configuration spacing and flow parameters on efficiency and wake dynamics are investigated. The employed 3D computational approach combines the overset mesh technique, used to capture the unsteady flow around the turbines, with the URANS k-ω Shear Stress Transport (SST) turbulence model. Results show that turbine spacing improves power coefficients and overall efficiency, albeit at the cost of slower wake recovery. A noticeable performance increase is observed when the turbines are spaced between 1.5 and 2 diameters apart, which is predicted to reach up to 40% regarding the single turbine. Furthermore, the effect of flow interaction between the turbines is examined by analyzing the influence of turbine spacing on flow structures as well as pressure and skin friction coefficients on the blades. The performed analysis reveals that vortex detachment is delayed in the twin-turbine configuration compared to the isolated case, which partially explains the observed performance enhancement. The insights gained from this work are expected to contribute to the advancement of renewable hydrokinetic energy technologies.

1. Introduction

The rising global energy demand and the transition toward net-zero carbon economies are driving the rapid development of innovative renewable energy conversion systems. Among these, hydrokinetic energy presents a promising alternative to traditional hydropower, as it harnesses the kinetic energy of free-flowing water—such as rivers, tides, ocean currents, and artificial channels—without the need for large-scale infrastructure like dams [1,2].
Hydrokinetic turbines (HTs) serve as the core technology for capturing and converting this energy into electricity, offering a reliable and continuous power supply, particularly in remote and rural areas with low energy demand. HTs can be broadly classified into vertical-axis turbines (VATs) and horizontal-axis turbines (HATs) based on the orientation of their main shaft relative to the incoming flow [3]. While VATs are less sensitive to flow direction and can accommodate generator placement above the water surface, they generally exhibit lower efficiency compared to HATs. However, deploying multiple VATs can help mitigate this limitation [4]. Among VAT designs, the Darrieus H-type relies on lift forces for power generation but suffers from poor self-starting performance, whereas the Savonius turbine offers better self-starting capabilities at the expense of a lower power coefficient. The Darrieus–Gorlov VAT [5], which utilizes helical blades, improves both power efficiency and self-starting behavior, though its performance is highly dependent on the optimization of key design parameters such as blade number, solidity, aspect ratio, and wrap ratio. Given these factors, optimizing VAT configurations and understanding their hydrodynamic performance remain crucial for enhancing their viability as a sustainable energy solution.
Research on HTs has primarily focused on enhancing their performance through the experimental analysis of various configurations and numerical simulations. For example, ref. [6] investigated the turbulent flow dynamics around a VAT using three numerical approaches: Unsteady Reynolds-Averaged Navier–Stokes (URANS), Detached Eddy Simulation (DES), and Delayed Detached Eddy Simulation (DDES). All three methods employed the k-ω Shear Stress Transport (SST) turbulence model. In a subsequent study, Lopez et al. [7] compared two dynamic meshing methods for HT simulations: the widely used sliding mesh method and the recently developed overset mesh method, which offers lower computational costs. Their study evaluated the advantages and limitations of each approach in 2D VAT simulations, assessing their ability to capture complex flow phenomena and their computational efficiency.
Modifications to VATs have also been explored to improve performance. Authors in [8] performed a 3D simulation of a Darrieus-type turbine with winglets designed to reduce tip vortex formation. Both symmetric and asymmetric airfoil profiles were tested, and the simulations were conducted using commercial CFD software. Various RANS turbulence models were employed, including k-ε Renormalization Group, k-ω Shear Stress Transport, Transition Shear Stress Transport, and the Reynolds Stress Model. The results showed a significant performance improvement with symmetric winglets. Those findings were later corroborated by different studies, e.g., [9,10,11].
The study in [12] investigated hybrid Savonius–Darrieus hydrokinetic turbines using the URANS approach and the sliding mesh method. Their study examined five different profile configurations for the Savonius section of the turbine, specifically designed for deployment in remote riverine regions of Egypt. Dynamic stall and flow blockage in twin cross-flow hydrokinetic turbines was studied in [13], showing that torque rises near fixed walls while nearby moving objects can either augment or reduce torque depending on flow direction. The 3D numerical and experimental study on a vertical-axis hydrokinetic turbine in [14] showed that lower solidity shifts optimal performance to higher tip speed ratios. Simulations predicted strong efficiency gains at low solidity, but experiments showed only marginal differences due to unmodeled losses.
The wake generated by a VAT and its interaction with the free surface have been extensively investigated through experimental testing in open channels and numerical simulations. The study in [15] conducted an experimental analysis of a helical VAT operating in a channel. Using an acoustic Doppler Velocimeter (ADV), they measured flow velocity and found that 95% of the velocity was recovered at a downstream distance of five turbine diameters. This setup was then adopted to examine the interaction of fish swimming across VATs [16].
Lust et al. [17] performed experimental tests on an H-Darrieus turbine to evaluate its performance under steady current conditions and in the presence of incident waves. The study examined the turbine’s efficiency across a range of tip speed ratios (TSR) from 2.5 to 4.5 and at three different immersion depths (z/D): 0.19, 0.35, and 0.7. The results indicated that free surface effects had no impact on turbine performance at these depths. Additionally, while waves slightly reduced efficiency, the effect was not significant.
Gauvin-Tremblay and Dumas [18] analyzed the interactions between a Darrieus-type VAT, the free surface, and the riverbed. Using 2D and 3D URANS simulations, they evaluated the effects of immersion depth, proximity to the riverbed, and velocity profile on turbine performance. Their findings showed that shallow immersion reduced extracted power, while deeper immersion improved efficiency due to the turbine’s proximity to the riverbed. However, when a realistic velocity profile was considered, this advantage disappeared. The study also found that rotation and the Froude number had minimal influence on performance, whereas blockage effects played a more significant role. Notably, the 2D and 3D simulations yielded comparable results, suggesting that 2D models may be effective in certain contexts. In a later paper [19], the same authors analyzed the blockage effects and turbine wake interactions in a VAT array using a variant of the Blade Element Momentum (BEM)–CFD approach named EPTM (Effective Performance Turbine Model). It is concluded that, due to great impact caused by wake deflections, there is no advantage of staggering the VATs regarding aligned configurations which should be preferred. Furthermore, lateral and longitudinal spacing guidelines are also provided.
The contribution in [20] developed a numerical framework in OpenFOAM, integrating the overset mesh and volume of fluid (VOF) methods. Their results confirmed, for a single tip speed ratio, that VATs submerged at greater depths exhibited faster wake recovery compared to those placed closer to the free surface, where wake deficits persisted for longer distances. The wake behind a helical hydrokinetic turbine was considered in [21] from both experimental and CFD numerical points of view, with particular emphasis on wake dissipation. As a conclusion, these authors recommend not only relying on velocity deficit and turbulence intensity for evaluating wake dissipation but also normalized cross-sectional velocity profiles, which need to be considered.
The use of multiple VATs is expected to maximize harnessed kinetic energy; however, experimental and numerical studies on twin turbines remain relatively scarce in the literature. Positioning two or more turbines in a river or channel can generate more energy than a single rotor with an equivalent swept area. Runge et al. [22] reported a technology readiness level of 7 for a full-scale twin turbine deployed in the South Boulder Canal in Denver, Colorado. The turbine demonstrated a peak efficiency slightly higher than its laboratory-scale counterparts.
Studies about wake dynamics of downstream horizontal-axis single- and twin-turbine configurations are also available, for instance in [23,24], respectively. In [23], the authors conducted single- and two-phase URANS and DES tests for an HT, finding thrust and power predictions within 5% of experimental data. The same study also examined wake recovery and its interaction with the free surface, concluding that the free surface produces a blockage effect that accelerates the flow above the turbine and thereby enhances wake recovery. A side-by-side HT deployment was analyzed in [24] using numerical simulations that combined Large Eddy Simulation (LES) with the Actuator Line (AL) model. Single-, double- (2T), and triple-turbine (3T) configurations were investigated, and it was concluded that the power coefficient is highest in the 3T case due to an increasing blockage effect. Wake recovery was further examined using the dynamic mode decomposition technique, which revealed the multiscale nature of the wake dynamics, including its meandering behavior.
Similarly, ref. [25] investigated the wake characteristics of twin VATs using acoustic Doppler velocimetry, finding that wake momentum recovery was influenced more by the turbines’ rotational direction than by their lateral spacing. A counter-rotating forward configuration led to faster momentum recovery compared to co-rotating setups. Additionally, counter-rotating turbines exhibited the highest turbulence intensity in the wake. To achieve velocity recovery over shorter downstream distances, a minimum lateral spacing of at least two rotor diameters was recommended.
Zhang et al. [26] tested a twin helical VAT in a channel and observed that the twin setup achieved a maximum efficiency 10.24% greater than that of a single helical VAT. They also identified an optimal spacing of 1.4 diameters. Moreau et al. [27] experimentally assessed the performance and wake characteristics of a ducted counter-rotating twin VAT in tidal currents, concluding that the maximum power coefficient remained largely unaffected by the tidal cycle (i.e., flood or ebb tide configuration). However, wake recovery was 30% faster during the flood tide configuration.
Ma et al. [28] and Chen et al. [29] applied the Taguchi method combined with CFD to optimize a helical-blade VAT. Their optimization parameters included airfoil selection, pitch angle, enwinding ratio, solidity ratio, and the position of the connecting mechanism. The optimized VAT demonstrated a significant increase in the power coefficient and reduced fluctuations in its value. Additionally, ref. [30] numerically investigated the effect of rotor spacing on power output efficiency. A 2D model was implemented using commercial software, with turbulence accounted for by the k-ω SST turbulence model. The rotation domain for the twin rotors was modeled using a sliding mesh. Their findings suggested that an optimal twin-rotor distance of approximately 9/4 of the turbine diameter maximized the power coefficient. Conversely, Widyawan et al. [31] reported a 53% increase in the power coefficient compared to a single Darrieus VAT when twin turbines were spaced 1.5 diameters apart. Their study also employed a 2D domain, the sliding mesh approach, and the k-ω SST turbulence model.
Mohamed et al. [32] analyzed the potential of Darrieus-type VATs for hydrokinetic applications, particularly when deployed in arrays or clusters, within the context of distributed energy generation. The Actuator Line Method (ALM) [33] was used to model the turbines, while the VOF method was employed to represent the free surface, both implemented within the RANS solver of the commercial software Ansys Fluent. After conducting a sensitivity analysis of the model parameters, the simulation results were validated against experimental data, demonstrating good agreement between simulated and experimental results. The findings highlight the significance of bidirectional interactions between the turbines and the channel, emphasizing the impact of water level variations and inlet velocity on efficiency assessment [34,35]. In a subsequent study, Mohamed et al. [36] proposed a novel actuator cylinder (AC) model coupled with the Volume of Fluid (VOF) method, offering a computationally efficient tool for simulating hydrokinetic turbines. This approach provides reasonable estimations of turbine performance, suitable for early-stage design, site assessment, and feasibility studies. However, the simulation results indicated that the AC model tends to underestimate turbine-to-turbine interactions and predicts more pronounced blockage and wake effects compared to the more detailed actuator line method (ALM). Cacciali et al. [37] demonstrated that closely spaced hydrokinetic turbines arranged in aligned arrays reduce the size of each flow passage, which increases turbine blockage and enhances energy extraction, resulting in higher power conversion. Their 1D computational tool explicitly accounted for the free surface deformation (backwater effects) induced by turbine arrays in subcritical channel flows, as well as fluid dynamic losses, turbine wake effects, and channel friction. This integrated approach improves the accuracy and reliability of power output predictions compared to an idealized actuator disk or purely analytical models. Very recently, Velásquez et al. [38] proposed a methodology to optimize vertical-axis hydrokinetic turbines by adjusting shape parameters such as aspect ratio, solidity, and the index of revolution, utilizing a combination of response surface methodology and multi-criteria decision matrices. Their CFD approach primarily focused on analyzing fluid–structure interactions but did not incorporate the air–water interface.
The previous literature review has revealed a lack of comprehensive 3D CFD studies on the flow through twin vertical-axis hydrokinetic turbines. The present contribution addresses this gap by providing a thorough analysis and discussion of the hydrodynamic interaction between twin turbines as a function of their lateral spacing and tip speed ratio. For this purpose, the configuration examined corresponds to the counter-rotating forward test case experimentally characterized in [25]. Specifically, the study not only compares and discusses the performance curves—i.e., the power coefficient as a function of the tip speed ratio—for both isolated and twin-turbine arrangements at different spacings but also investigates in detail the non-dimensional pressure (pressure coefficient) and shear stress (skin friction coefficient) distributions on the blades as functions of turbine separation, tip speed ratio, and azimuthal angle. To the best of the authors’ knowledge, this latter aspect has not been previously addressed in the literature.
The remainder of this paper is organized as follows. Section 2 describes the computational methodology, including the geometrical model, meshing strategy, computational setup, and the verification and validation studies. Section 3 presents and discusses the performance curve of a single turbine in both isolated and twin-turbine configurations, together with visualizations of the wake structure. The effect of turbine spacing on the pressure and skin friction hydrodynamics coefficient on the blades is analyzed and discussed in Section 4. Finally, Section 5 summarizes the main conclusions of the study.

2. Materials and Methods

2.1. Operational Non-Dimensional Parameters of Hydrokinetic Turbines

The operation of hydrokinetic turbines is usually characterized using the following non-dimensional variables: power coefficient ( C P ), torque coefficient ( C m ), and tip speed ratio ( λ ) [39]. These variables are expressed in terms of fluid density fluid ( ρ ), incoming flow velocity ( V ), turbine diameter ( D ), blade span ( H ), rotational velocity ( ω ), and azimuth angle ( θ ), as illustrated in Figure 1.
The power coefficient, representing the turbine performance, is defined as follows:
C P = P 0.5 ρ V 3 S
where P is the power and S = H D the VAT frontal area. The corresponding torque coefficient is obtained by the following:
C m = M 0.25 ρ V 2 D S
In Equation (2) M stands for the mechanical torque transferred to the turbine by the fluid.
The Tip Speed ratio (TSR) is the quotient between the velocity at blade tip and the incoming flow velocity:
λ = ω D 2 V
Local pressure C p and skin friction C f coefficients on the blades are defined as the non-dimensional numbers of pressure p and magnitude of wall shear stresses τ w [40].
C p = p p 0.5 ρ V 2
C f = τ w 0.5 ρ V 2
Here, the reference pressure is denoted by p .

2.2. Computational Model and Numerical Setup

The geometry used in this study was taken from the experimental study reported in [25], including both the single- and twin-turbine configurations as well as the dimensions of the water flume in which the system was installed. The corresponding turbine parameters are summarized in Table 1 whereas Table 2 shows the hydraulic parameters of the water channel.
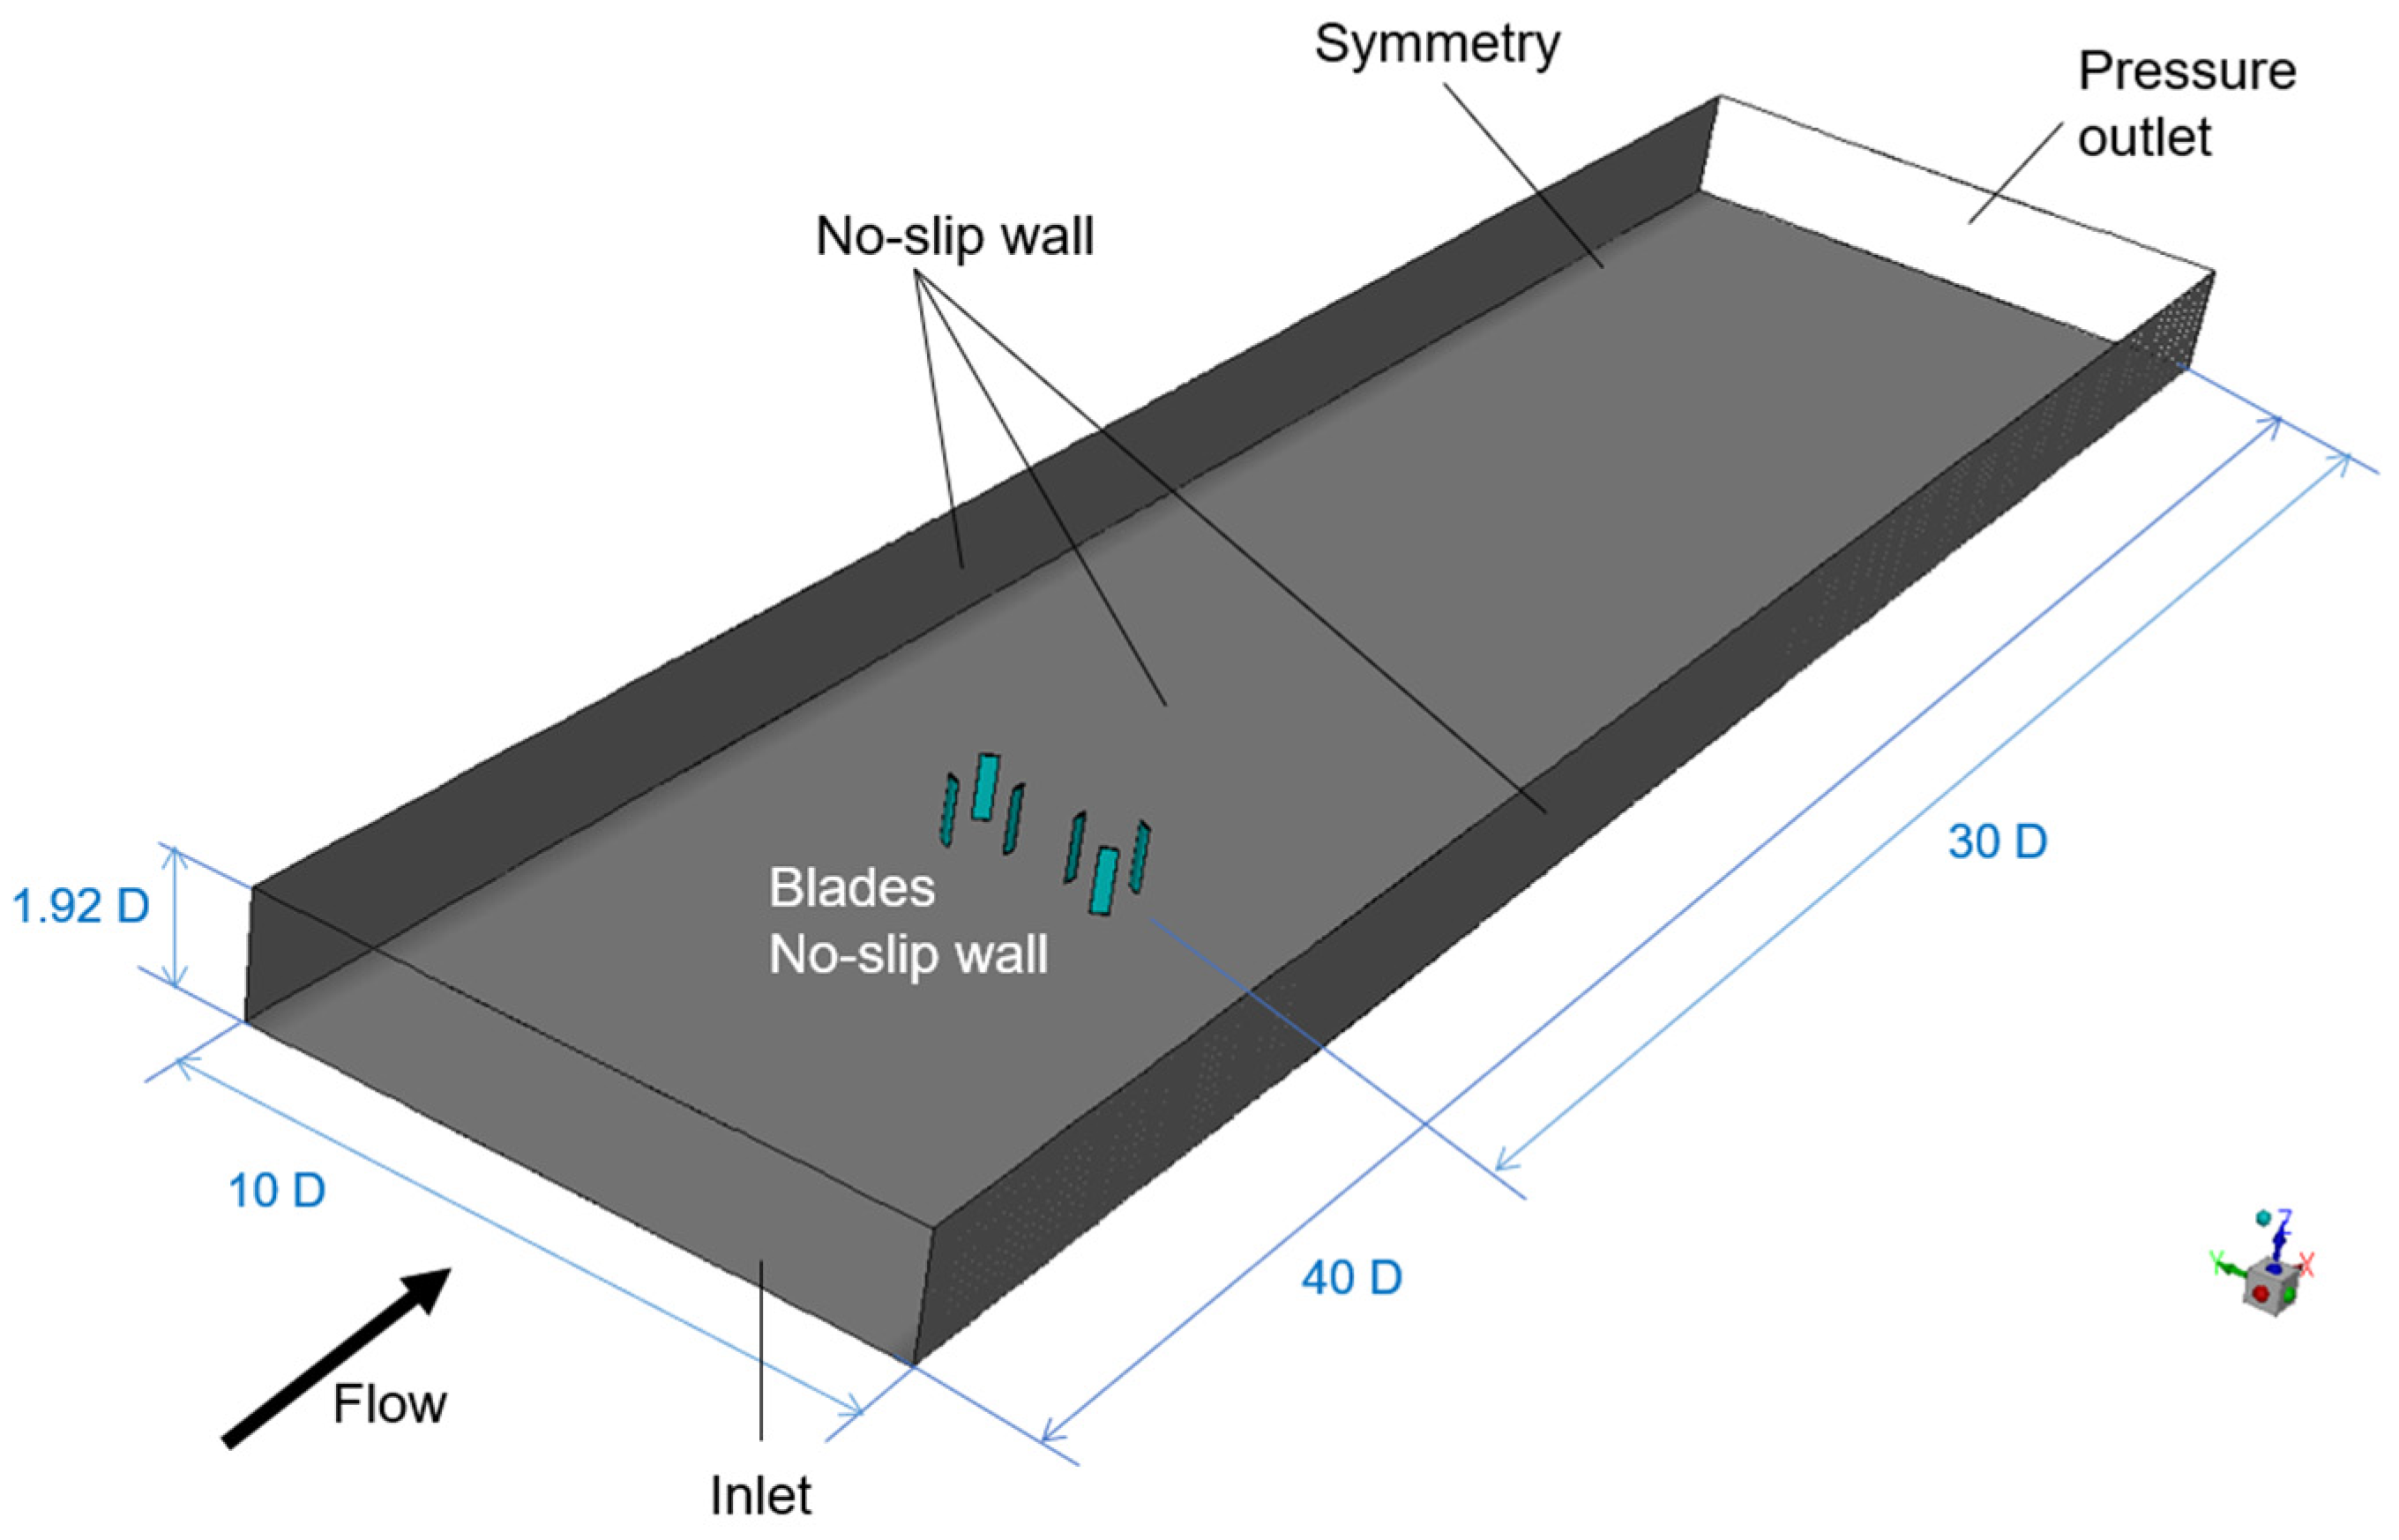
The modeled flow channel was 8.8 m long and 1.2 m wide with a flow depth h 0 = 0.23 m. The bottom of the blades was placed 2 cm above the floor while the distance between the upper surface and the free surface was 9 cm. As pointed out below, the proximity of the wall affects the flow in the lower part of the turbine, which strongly suggests considering the simulation of the whole blade instead of using a symmetry boundary condition at mid-span, as is frequently done in, e.g., [41,42,43]. On the other hand, to reduce the computational burden, neither the shaft nor the supporting arms are included in the 3D simulation [44].
A sketch of the computational domain in the case of the twin turbines is presented in Figure 2 together with the employed boundary conditions. The left side is defined as a velocity inlet with a prescribed velocity profile suggested by the experiments in [25] and Equation (6). A zero-pressure outlet condition is assigned to the right face, while at the upper side, representing the free surface, a symmetry boundary condition is imposed [45,46,47]. Finally, the bottom and lateral channel walls as well as the blades’ surfaces are defined as non-slip walls.
At the inlet, the following sheared velocity profile is imposed, based on the experimental study in [25], that varies with depth and accounts for the effect of the ground.
V z = 0.006 + z 0.105 0.2345
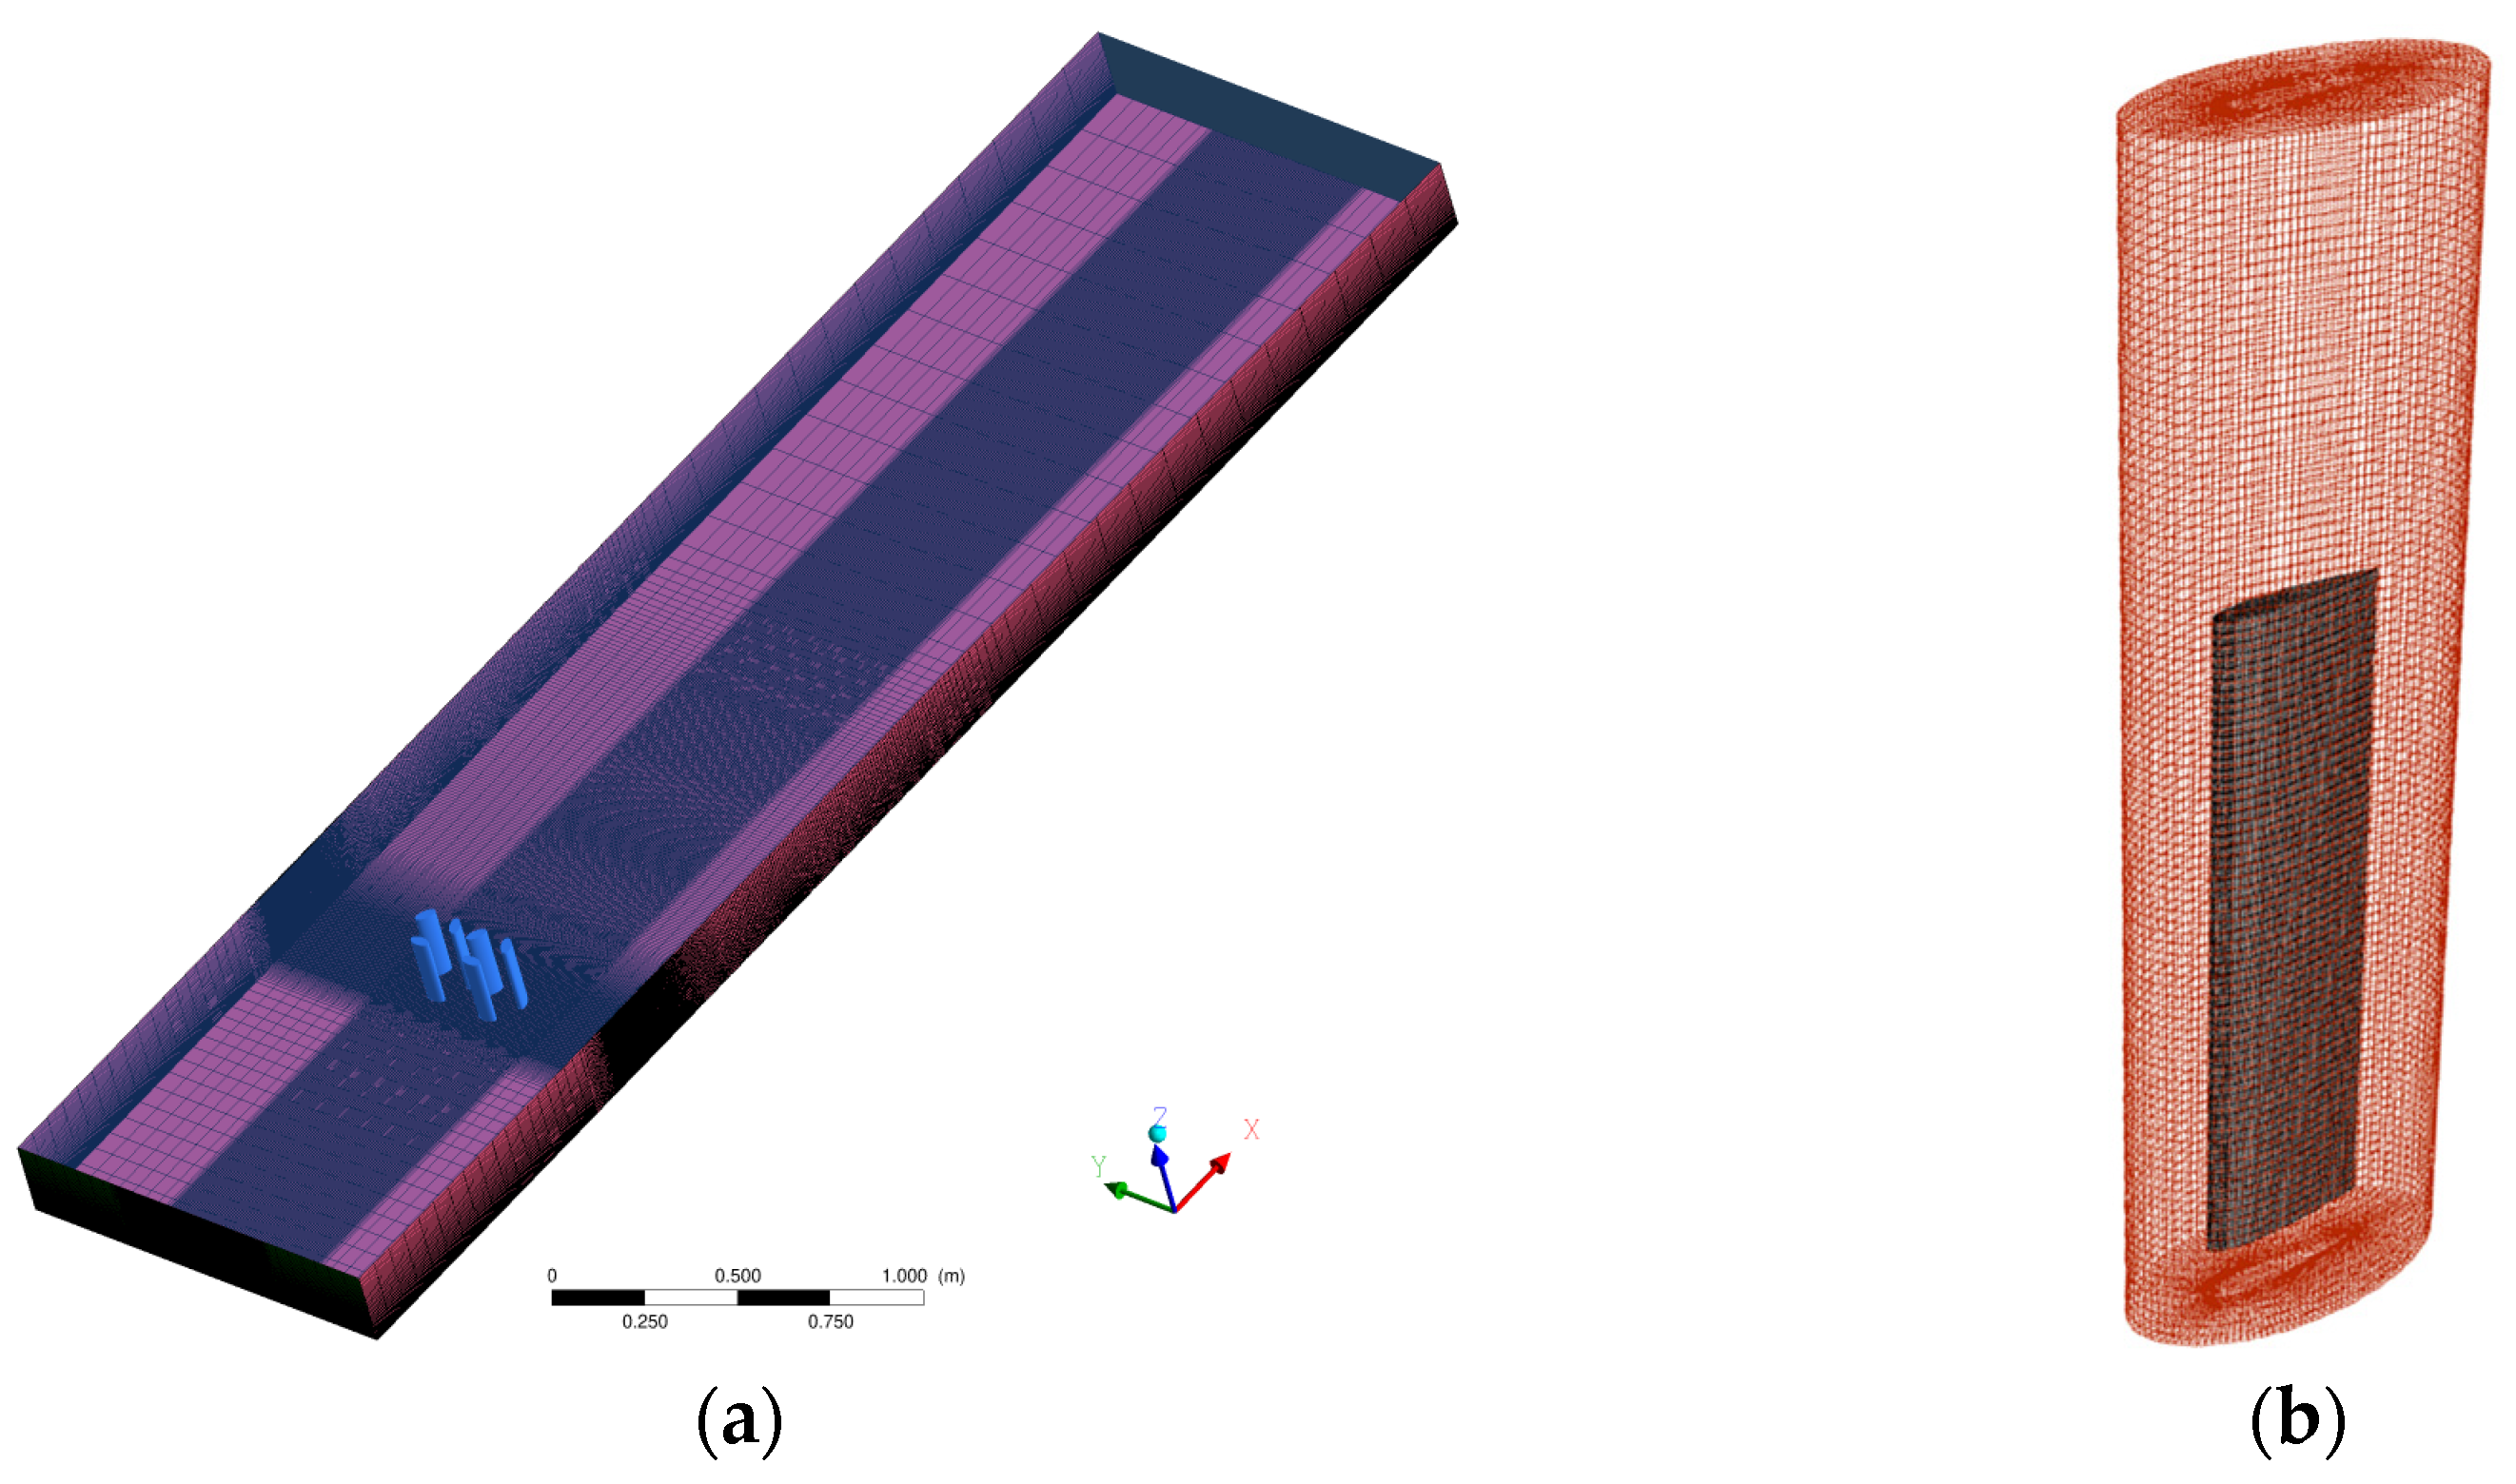
In the present study, the blade rotation inside the water channel has been described by the Overset Mesh (OM) approach. In this methodology, a stationary background mesh (BM) covers the entire computational domain, i.e., water flume, and one independent overset mesh is attached to each rotating blade; therefore, the OMs are superimposed on the BM and move through it. Flow variables are exchanged between meshes through interpolation in the overlapping regions, enabling accurate simulations without the need of deforming or remeshing the grid [41,48]. Figure 3 shows the wall mesh arrangement as well as the details of the OM around each individual blade.
Regarding the topology, both meshes are structured and composed of hexahedral elements. In the rotating grid, local refinement is applied near the blade to ensure that the first cell lies within the viscous sublayer of the developing boundary layer, with y + ~ 1 .
At the operating conditions, the flow in the water flume is turbulent (bulk Reynolds number ~30,000 and based on profile chord around ~22,000 [25]). Its behavior is described in this study by the Shear Stress Transport (SST) turbulence model, which is a combination k–ω and k–ε model [49,50], due to its ability of dealing with adverse pressure gradient boundary layer flows at low R e such as those happening at hydrokinetic turbines [8,51]. The SST model blends the near-wall accuracy of the k-ω formulation with the robustness of the k-ε model in the free stream and includes a shear stress limiter that enhances the prediction of flow separation and turbulent shear in regions with strong velocity gradients. At the inlet, according to the experiments, turbulent intensity is set up as 11% and the maximum turbulent viscosity ratio as 10.
Spatial discretization of all transport equations was carried out using the second-order upwind scheme, while temporal discretization employed a second-order implicit scheme. The time step was adapted for each tip speed ratio (TSR) and corresponded to one degree of blade rotation. The transient simulation used the Semi-Implicit Method for Pressure-Linked Equations (SIMPLE) algorithm for pressure–velocity coupling. The residual convergence criterion was set to 10−5 at each time step. To obtain representative time-averaged velocity values in the wake, a sufficient number of turbine revolutions needed to be simulated. In this study, the total number of revolutions depended on the TSR, but at least 20 full rotations were computed in all cases.
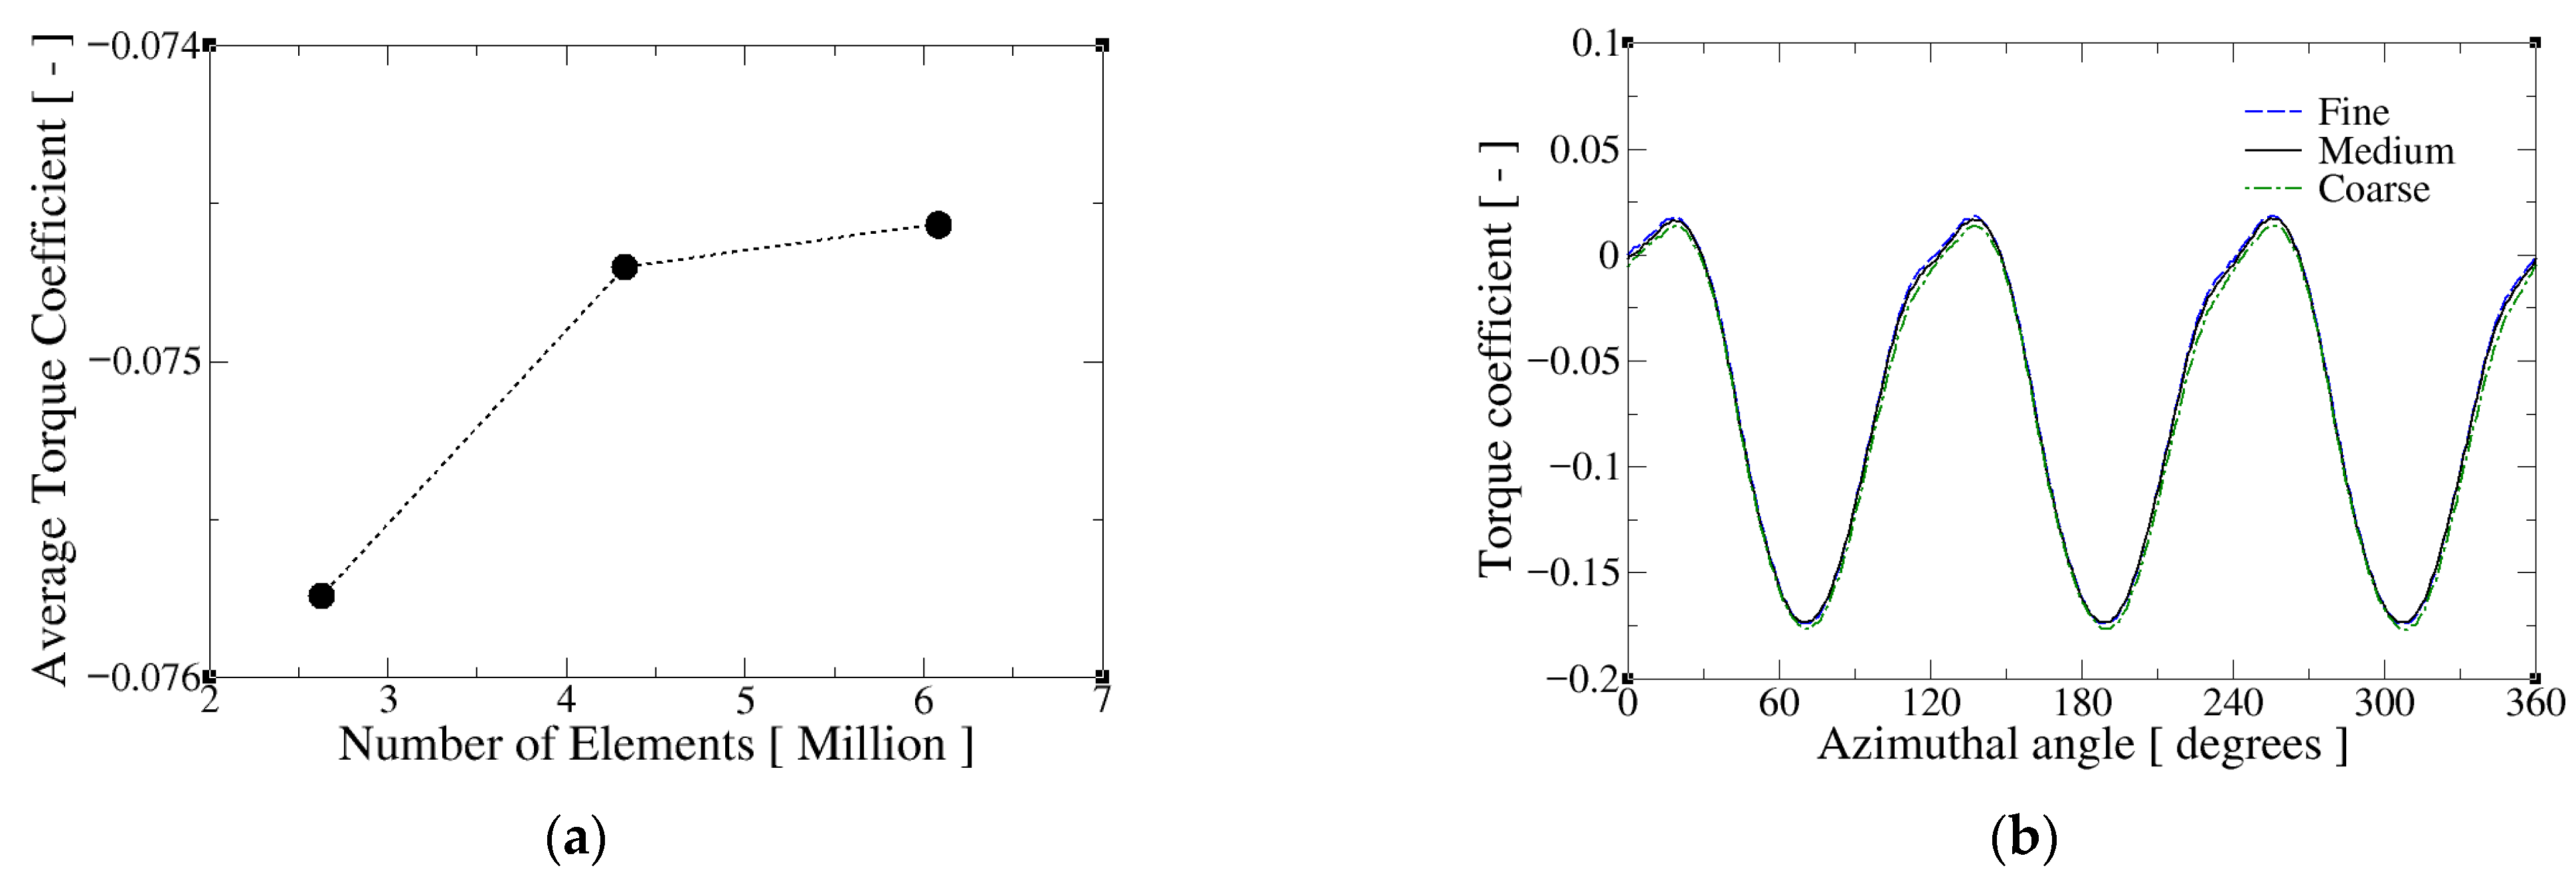
Verification studies were performed for the isolated turbine at the investigated TSR λ = 1.9 [25] using the software ANSYS-Fluent v. 2023R2. The target variable was the average torque coefficient C m defined in Equation (2). Three meshes with different numbers of cells were considered: coarse ( 2.6 × 10 6 ), medium ( 4.2 × 10 6 ), and fine ( 6.1 × 10 6 ). The distribution of cells among the computational domains is provided in Table 3 the number of cells reported for the overset domain corresponds to a single blade. Figure 4a shows the behavior of the average C m obtained in the various grids where the variation between the fine and the medium grid was around 0.2%, demonstrating the convergence towards a grid independent solution. Figure 4b displays the torque coefficient evolution along a complete revolution for the three considered meshes, showing only marginal differences between them. Therefore, to avoid an excessive computational burden, the medium grid has been chosen in this study.
As can be readily seen in Figure 4a, values for C m are negative, a fact also observed in [20]. The interpretation is that the turbine consumes energy instead of producing it because the turbine is operating far from its best efficiency point, BEP. As pointed out in [20], and demonstrated below, the maximum power coefficient for this turbine is attained around λ 1 . Moreover, it should be remarked that the experimental campaign of [25] did not measure the C m values, and turbines were rotated by a stepper motor, so that it was not possible to have direct comparison between numerical predictions and empirical results for it.

2.3. Validation of the Computations

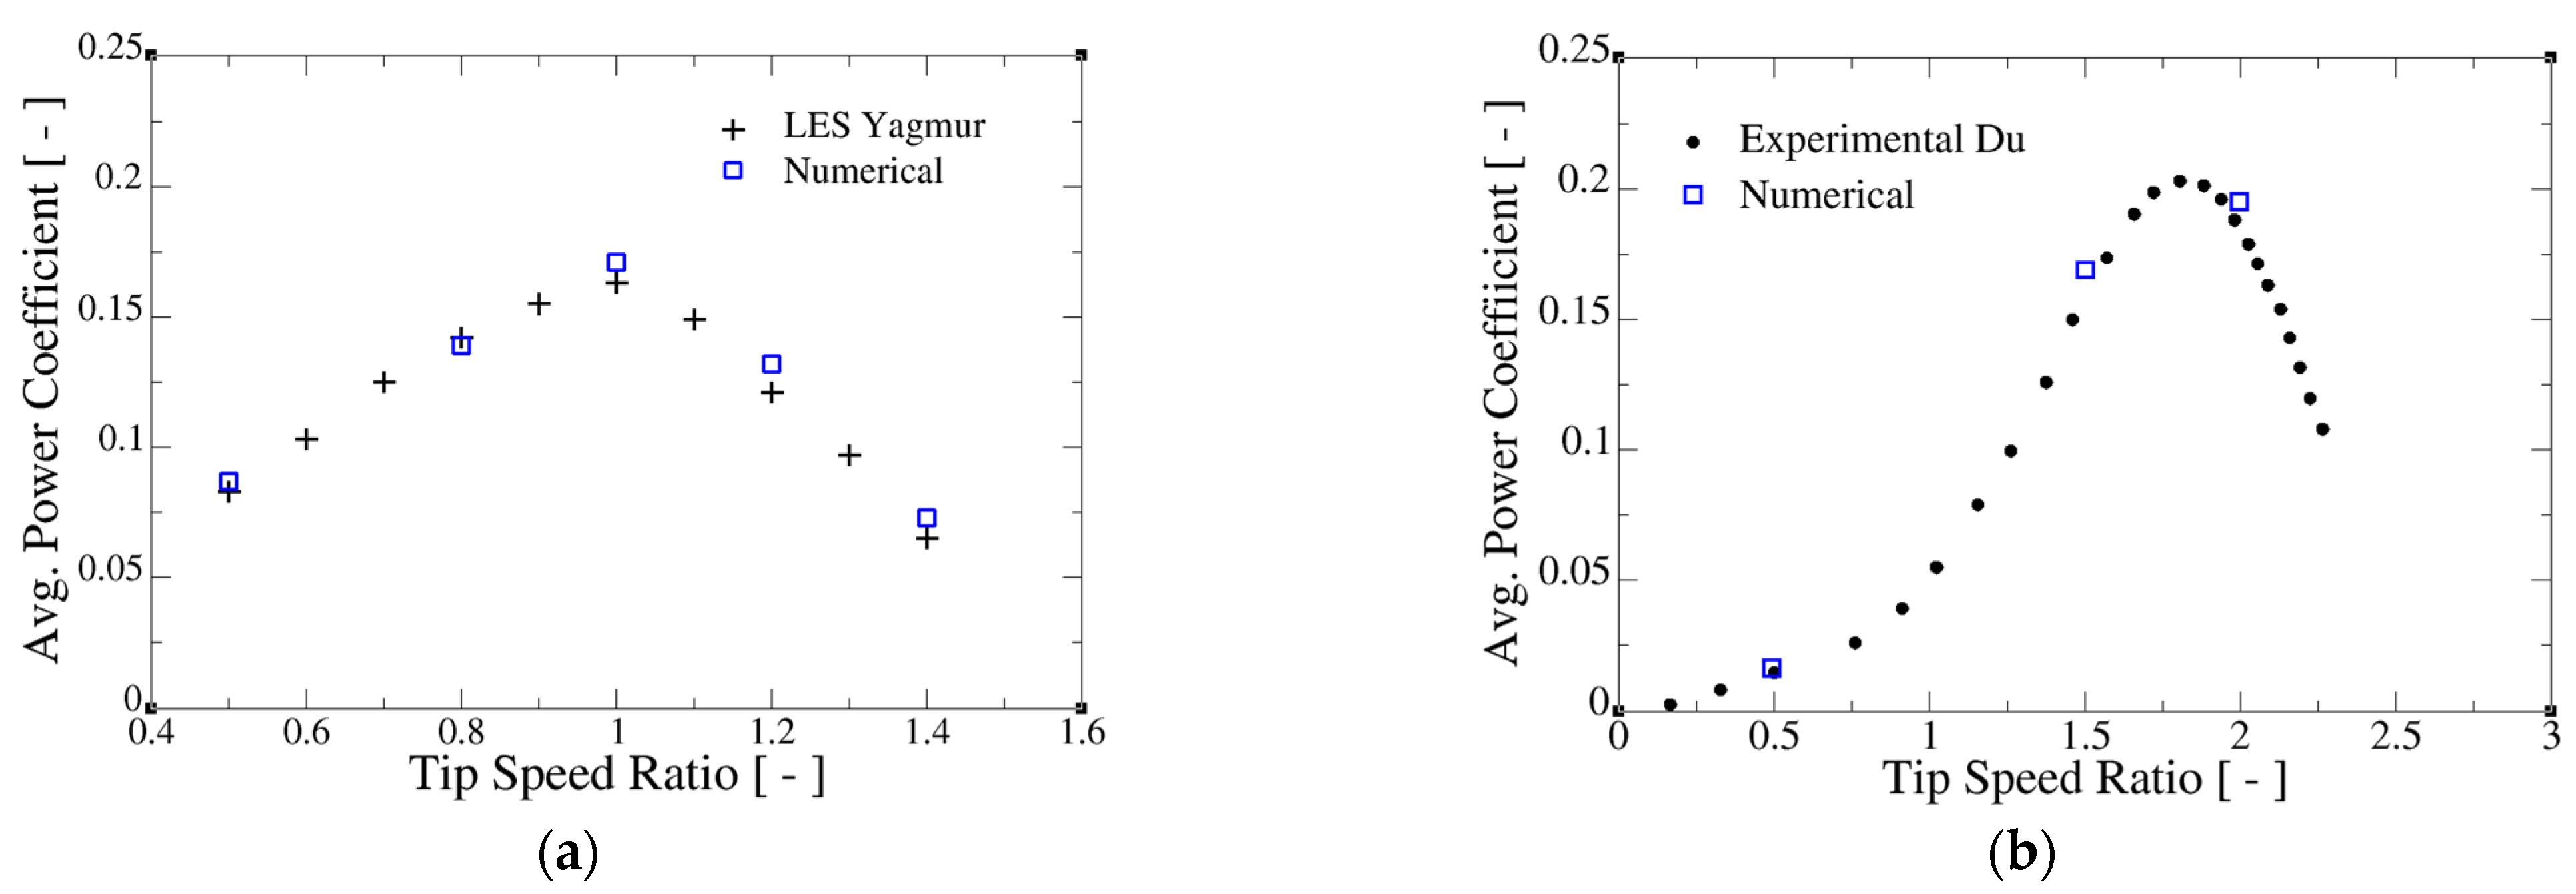
The article of Müller et al. [25] focused on the wake characteristics of the single- and twin-turbine configurations and did not include the respective performance curves C P ( λ ) . Therefore, to validate the predictive capabilities of the exposed computational methodology, results of numerical simulations have been compared with alternative data reported in the literature, such as those of the vertical hydrokinetic turbine of Yagmur et al. [52] and the vertical wind turbine of Du [53]. A summary of geometrical characteristics of both turbines is provided in Table 4, and full details can be found in the original documents.
It should be clarified that independent simulations were performed for each validation case. In the test corresponding to [52], the obtained numerical results are compared with those of Yagmur et al. based on Large Eddy Simulation (LES) because they use exactly the same geometrical model. However, for the Du [53] case, the 3D numerical results are benchmarked with the experimental data for a limited number of tip speed ratios. The employed numerical approximation based on the unsteady overset mesh framework is the same as that described previously.
Figure 5 shows the performance curves for both vertical turbines. In the case of the hydrokinetic rotor, the present results follow closely those of the high-fidelity LES computations of [52], showing only a slight overprediction for the highest values of λ , with maximum and mean differences of 9% and 5%, respectively. For the wind turbine [53], the actual numerical predictions are moderately above the experimental data (maximum and mean differences of 11% and 6.2%, respectively), as should be expected from the geometrical simplifications introduced in the numerical model; however, the agreement is found to be sufficient for the three considered values of tip speed ratio. Therefore, it can be concluded that the proposed methodology is suitable for predicting the performance curves of vertical-axis turbines.
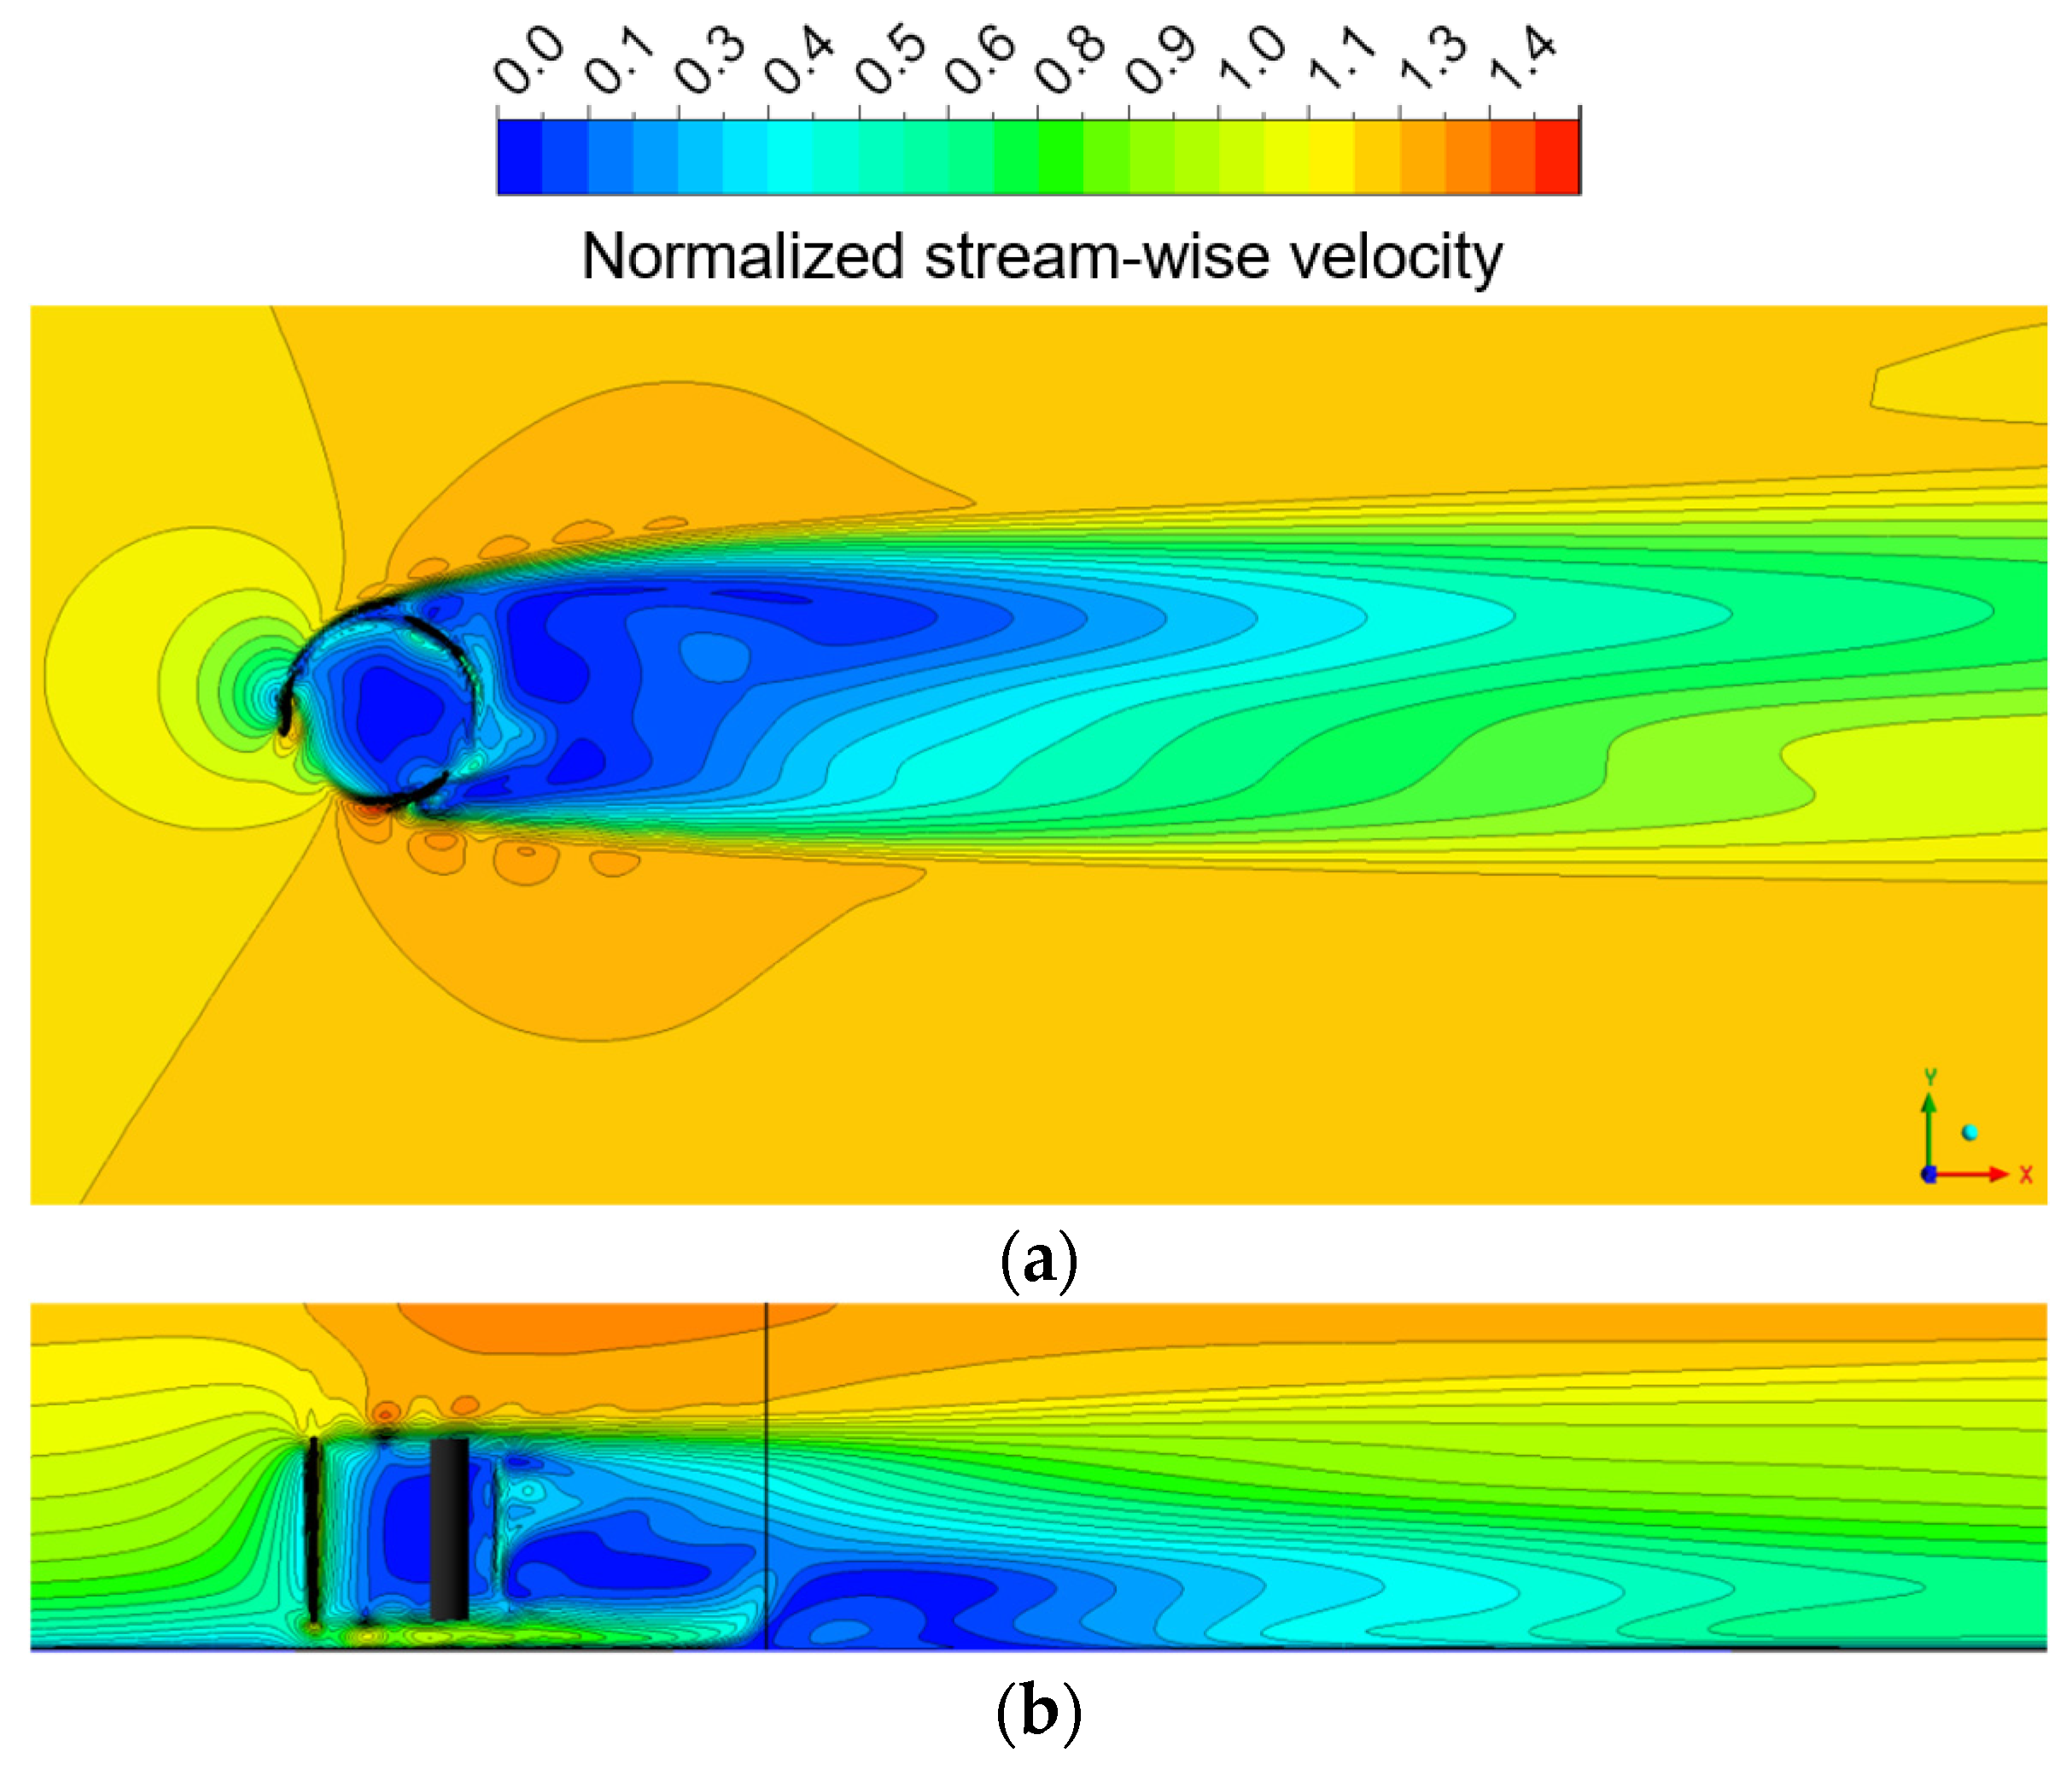
The study of Müller et al. [25] provided contour plots of various flow variables at a few axial sections within the turbine wake at tip speed ratio λ = 1.9 . In this context, Figure 6 shows top (Figure 6a) and side (Figure 6b) views of numerical normalized instantaneous stream-wise velocity fields around the turbine. In such figures, normalization is made with the average upstream velocity U 0 provided in Table 2.
Figure 6a presents a top view of the wake at mid-span ( z = 0 ). It can be readily appreciated that it is asymmetric regarding the channel symmetry plane y = 0 , showing a larger velocity deficit (blue areas) in the upper part than in the lower side. This asymmetry is caused by the counterclockwise rotation of the turbine, whereby the blades draw fluid into the upstream region on the upper zone while sweeping water toward the downstream area on the lower section. Wake expansion downstream is also evident in the plot, extending more broadly in the upper region than in the lower. Additionally, the characteristic low-velocity vortex can be identified within the circular path described by the blades.
A side view of the wake, in the channel’s central plane ( y = 0 ), is provided in Figure 6b. In this figure, it is presented how the upstream flow develops around the turbine. The flow accelerates beneath the blades, in the region close to the channel’s bottom wall, decelerates in front of the turbine, and is diverted upward, generating a localized acceleration near the free surface. The accelerated flow between the blades’ base and the channel bottom interacts with that in the wake through momentum transfer and eventually migrates upward (at the location marked with the vertical black line), leaving downstream a low-velocity region protruding from the bottom, which hinders wake recovery. Consequently, the presence of the wall directly influences the wake development in the lower half of the turbine.
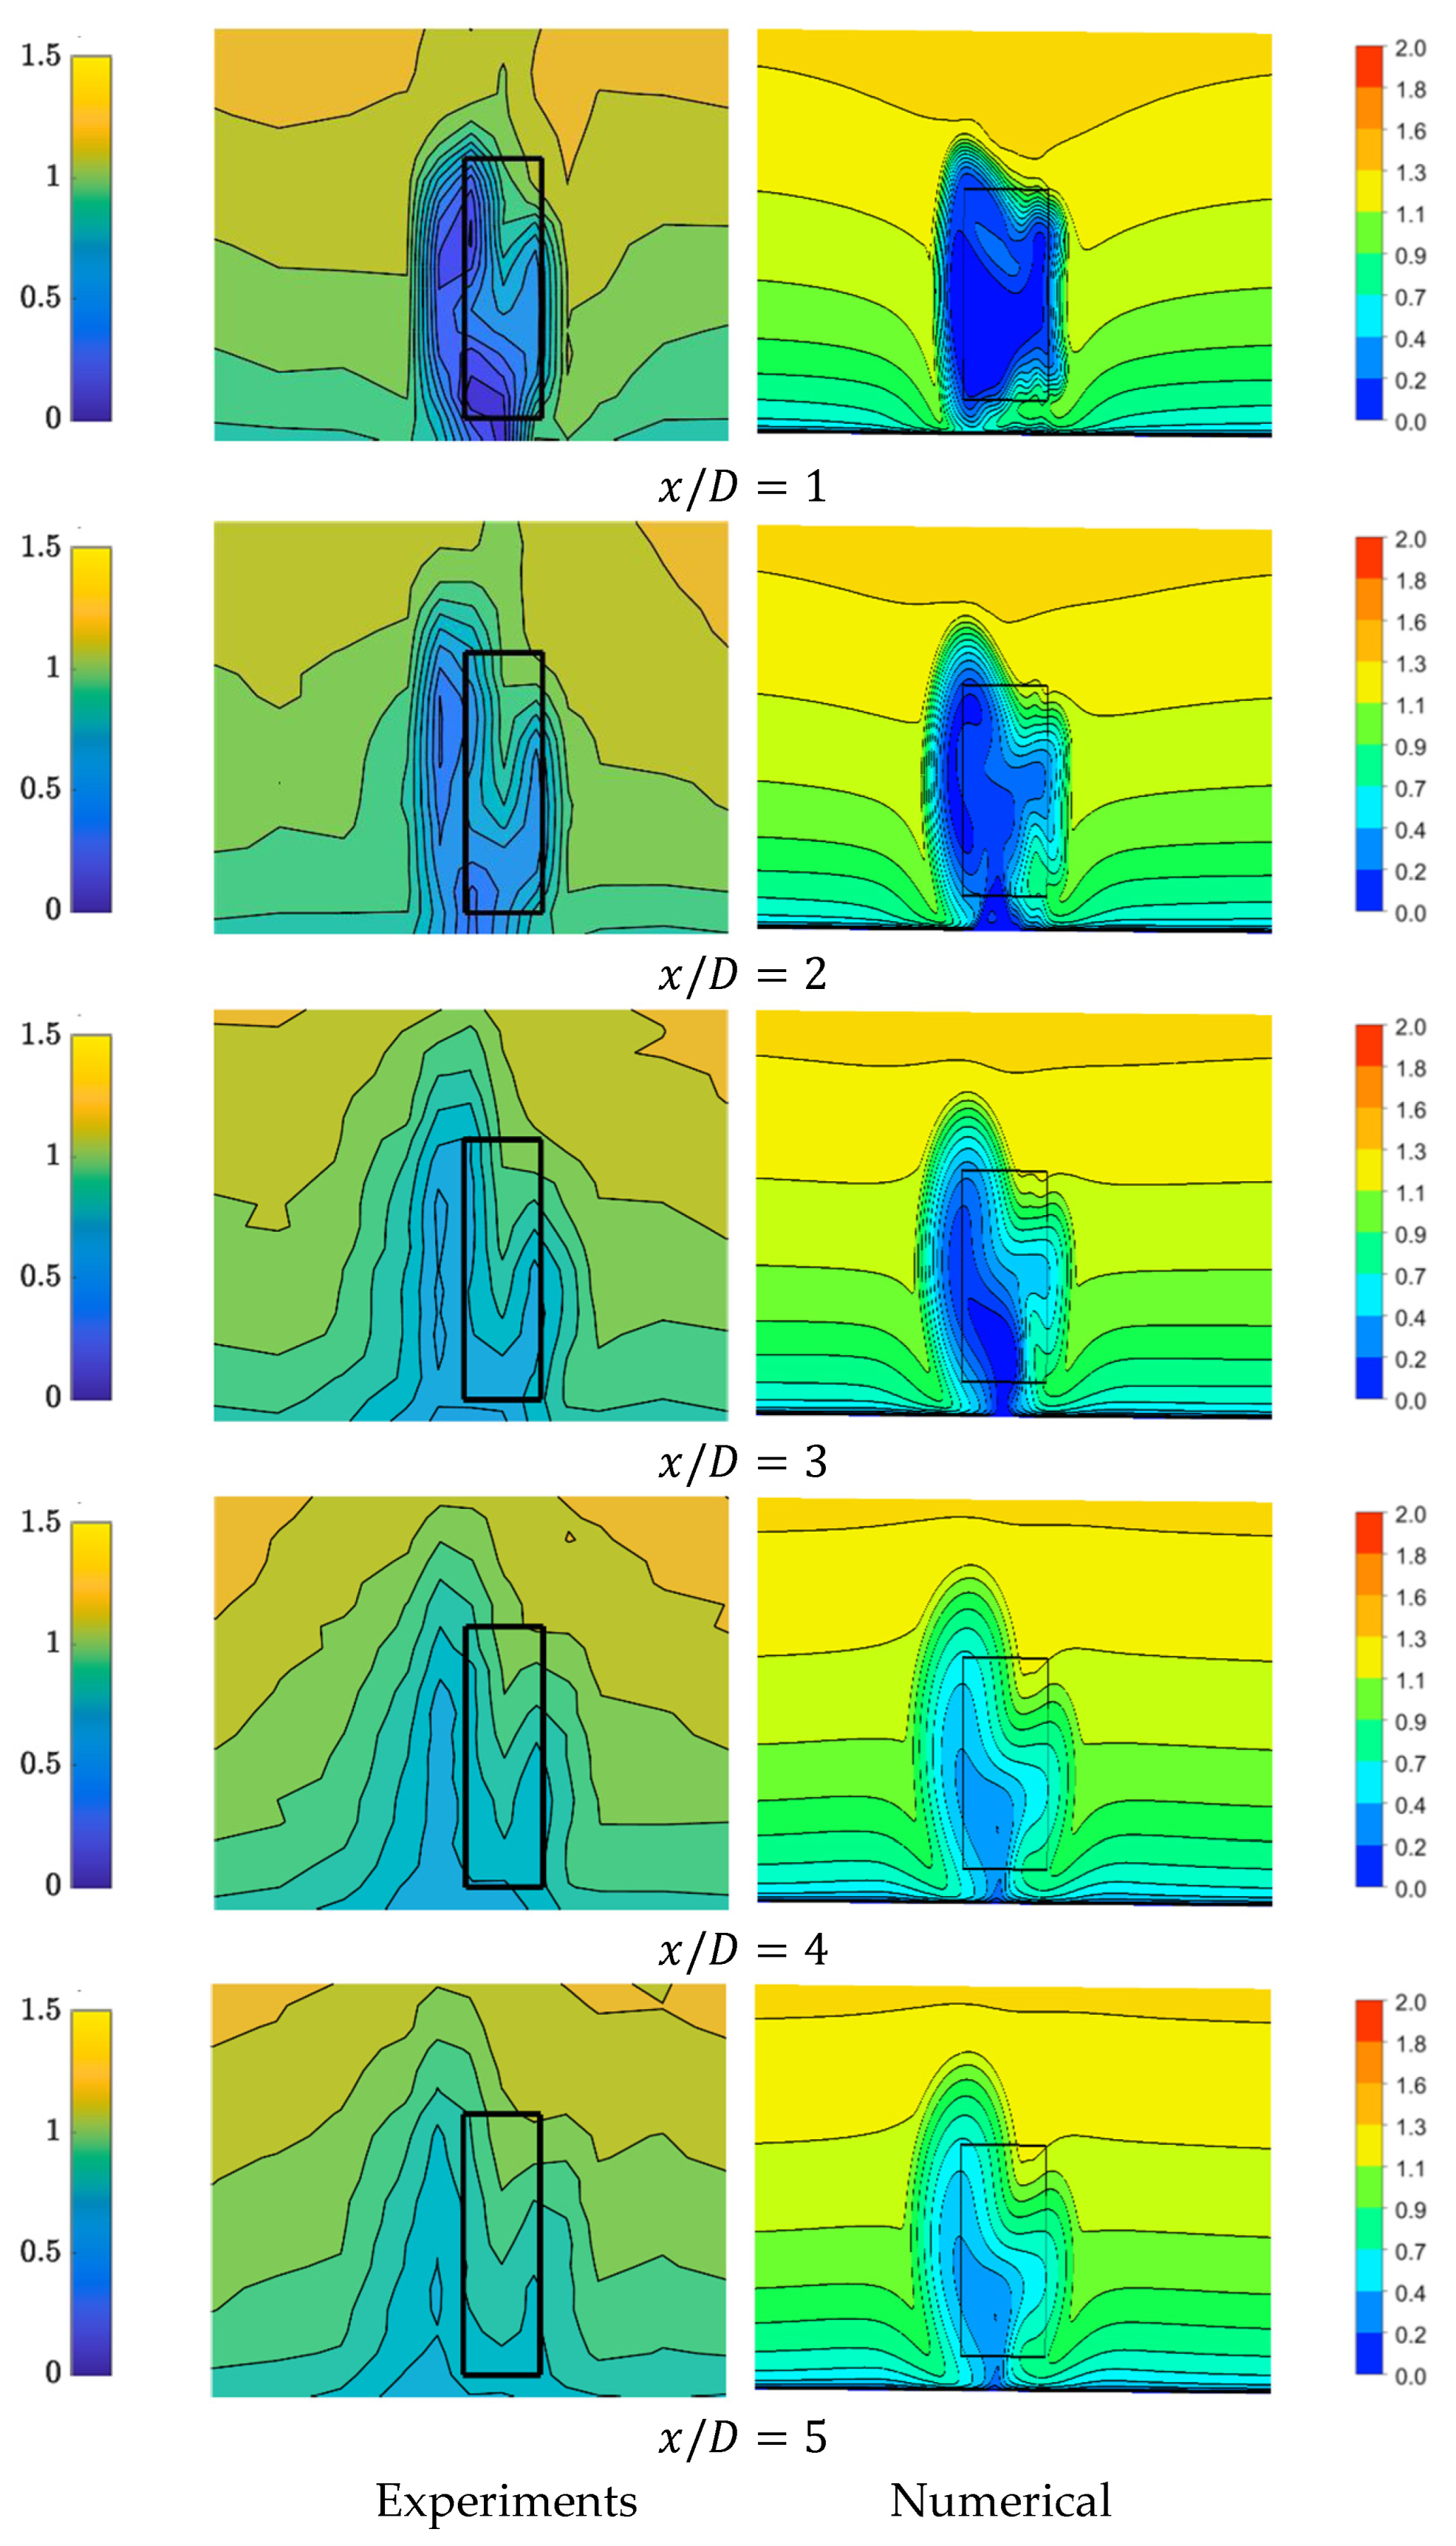
Figure 7 presents comparisons between the reported normalized stream-wise mean velocity field in [25] and those obtained in the present numerical computations at the planes x / D = 1 , 2 , 3 , 4 , 5 downstream of the turbine. It should be emphasized that experimental contour plots are reconstructed from point measurements performed with an ADV using a limited number of measuring positions. Additionally, it is known that near the walls the ADV technique is limited by its relatively large sampling volume, making it difficult to resolve sharp velocity gradients accurately. In contrast, the present numerical simulations effectively capture the velocity field in the turbine wake and its interaction with the bottom wall. Finally, the color maps of the experimental and numerical contour plots are not identical, which may create the impression of exaggerated visual differences.
In Figure 7 the solid rectangle depicts the boundaries of the rotor. As it rotates counterclockwise, the blades emerge from the plane of the paper on the left side of the rectangle and submerge on the right side, sweeping the fluid as they move. As a consequence, fluid velocity deficit is larger in the left side of the rectangle than in the right side, resulting in the asymmetric wake shown in Figure 6a.
Despite some quantitative differences between the experimental and numerical data, there is a remarkable qualitative agreement. In particular, the lower velocity deficit observed on the left side of the rectangle compared to the right is well-captured by the simulations. Additionally, the wake recovery with increasing axial distance demonstrates strong consistency between the numerical and experimental data.
Overall, considering the limitations of the experimental technique, the numerical results can be regarded as providing a reliable-enough representation of the flow behavior in the turbine wake.

3. Integral Parameters Results

3.1. Performance of the Isolated Turbine

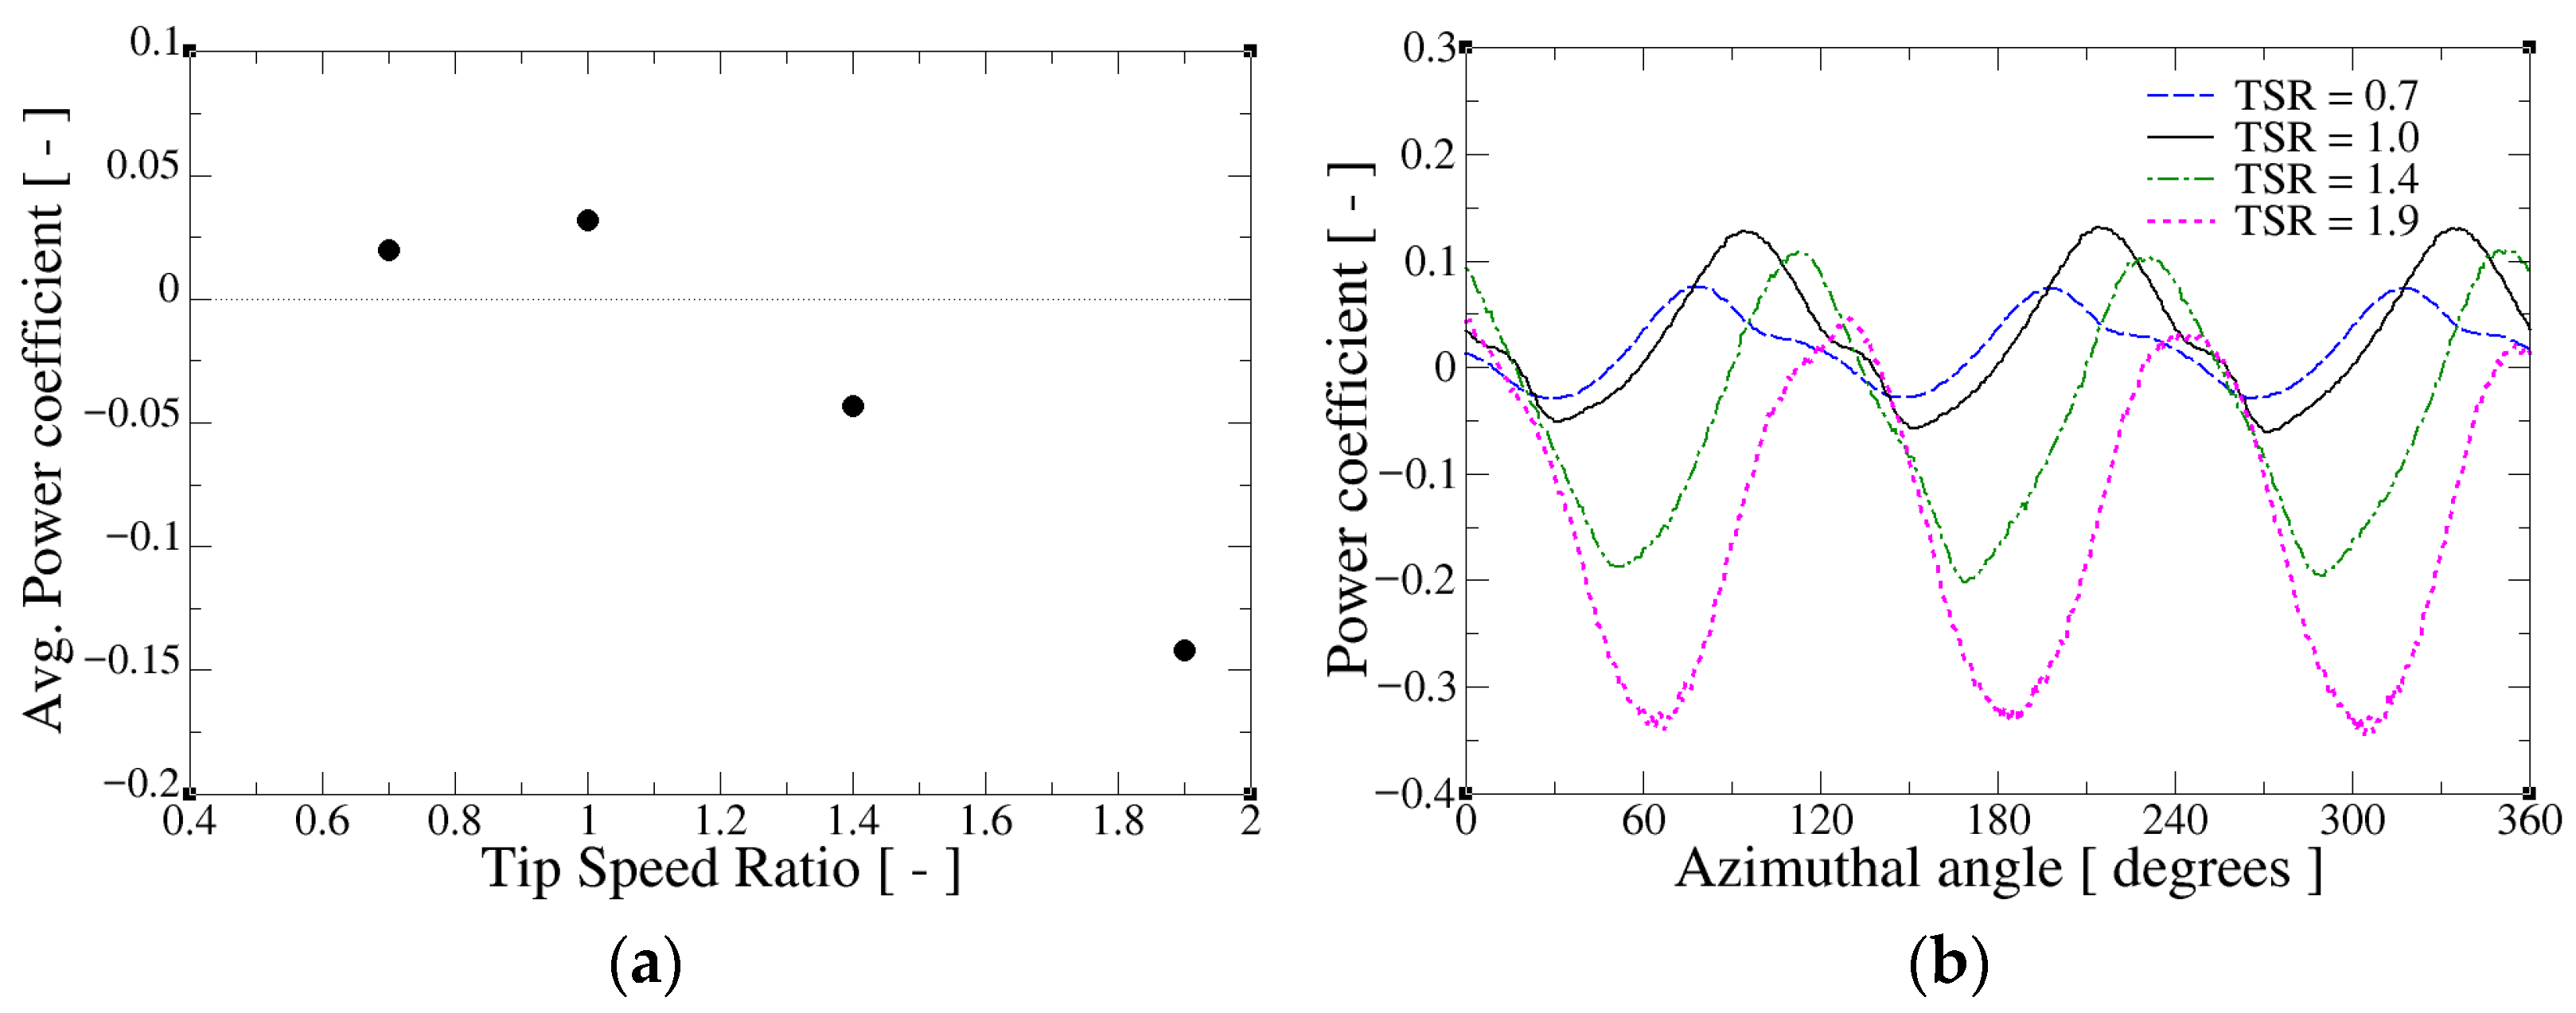
The initial task was the estimation of the isolated turbine performance curve, as these data were not provided in [25] and also not in [20]. For that, four specific values of the tip speed ratio were simulated λ = 0.7 , 1.0 , 1.4 , 1.9 ; the obtained results for the power coefficient C P are shown in Figure 8a. It can be observed that, similar to the Yagmur et al. [52] configuration, the maximum of the curve C P ( λ ) is found around λ 1.0 although with a reduced power coefficient. Moreover, the efficiency is clearly negative for the two highest tip speed ratios, indicating that under such conditions, the turbine is supplying energy to the fluid rather than extracting it from the flow. This result is consistent with the findings reported in [20].
Figure 8b illustrates the behavior of the instantaneous C P over a full rotation for the considered values of λ . It can be observed that, as the tip speed ratio increases, the location of the maximum shifts toward larger angles, and the amplitude of the oscillation grows, reaching lower minimum values. Additionally, the peak C P values increase from λ = 0.7 to 1.0 and then decrease for higher values of λ .
The observed behavior of the power coefficient in Figure 8a,b is consistent with that typically found in vertical-axis hydrokinetic turbines. Because the blade experiences cyclic variations in its angle of attack during its rotation, the surrounding flow becomes highly unsteady, generating a temporal lag between the angle of attack variation and the hydrodynamic response. If the amplitude of the angle of attack oscillation is sufficiently large, a vortex develops on the low-pressure side near the leading edge which promotes a temporary increase in the lift, thereby enhancing the torque. Such a vortex remains attached during some part of the rotation cycle before convecting towards the trailing edge and eventually detaching. This phenomenon produces a hysteresis cycle in the hydrodynamic coefficients. The resulting delay between the maximum angle of attack and the peak lift is the effect responsible for the appearance of a phase lag in the torque, whose maximum occurs after the blade reaches its largest effective angle of attack. At moderate values of TSR, here around one, the additional lift induced by the evolution of the leading-edge vortex is able to enhance the mean average torque. On the other hand, at higher tip speed ratios, the amplitude variations in the angle of attack decrease, the flow remains largely attached, and the hysteretic response weakens, reducing the lift generation and consequently the mean torque. Eventually, when λ is sufficiently high, the lift contribution diminishes to the extent that the turbine can no longer extract appreciable energy from the incoming flow.

3.2. Performance of Twin-Turbine Configuration

In this subsection, the performance of the twin-turbine arrangement is evaluated. The chosen configuration for the present numerical study is that recommended in [25], namely, twin turbines with lateral spacing of 2 D and a counter-rotating forward setup (hereafter referred to TT2D). Nevertheless, a separation of 1.5 D has also been evaluated (hereafter named TT1.5D) for two tip speed ratio values: λ = 1.0 , corresponding to the peak of the C P ( λ ) curve for the isolated turbine, and λ = 1.9 , the value used in the experiments reported in [25]. Figure 3a shows a sketch of the computational subdomains and mesh employed in the twin-turbine deployment.
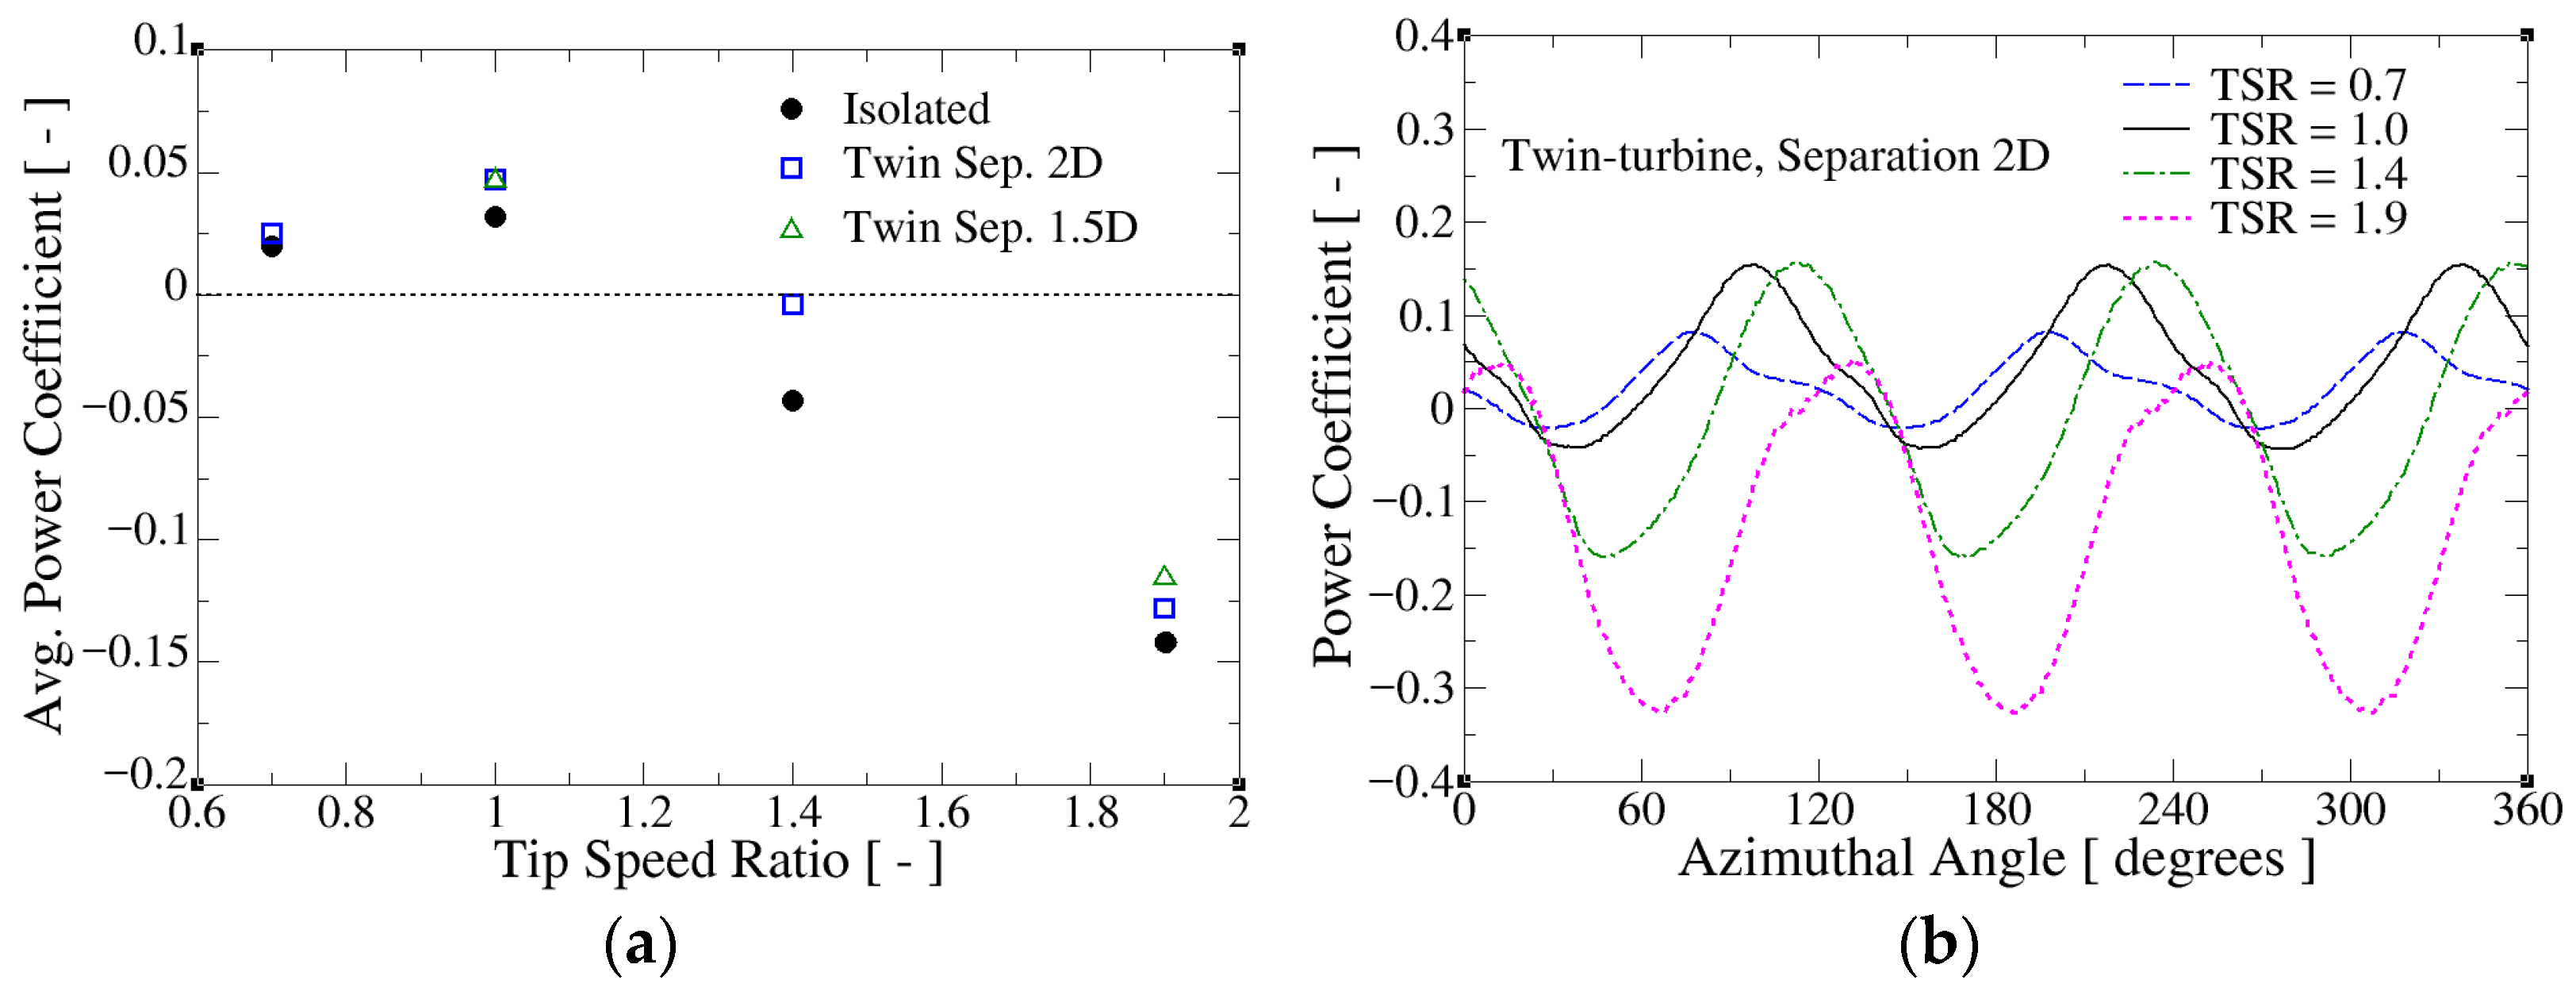
Figure 9a shows the average power coefficient produced by a single turbine under different arrangements at selected tip speed ratios. It should be emphasized that the C P corresponds just to one of the machines in the twin-turbine configuration; in this context, due to the symmetric flow conditions the total produced power must be multiplied by two. As can be readily observed from Figure 9a, the twin-turbine configuration increases the performance regarding the isolated case for all considered values of λ , which is clearly seen for the TT2D arrangement. The degree of improvement in this case depends on TSR but the mean gain is around 40% for the considered turbine. Further reducing the spacing results only in marginal differences. Compared with the TT2D configuration, the TT1.5D case exhibits a slightly less negative C P value for λ = 1.9 ( C P = + 0.012 ) but shows no improvement relative to the TT2D case for λ = 1.0 ( C P = 0.0 ).
Figure 9b displays the power coefficient evolution throughout a complete revolution for the four tip speed ratios examined in this study, within the TT2D arrangement. The curves’ behavior is similar to the isolated turbine, where the amplitude of the oscillation increases with the value of TSR with progressively lower minima.
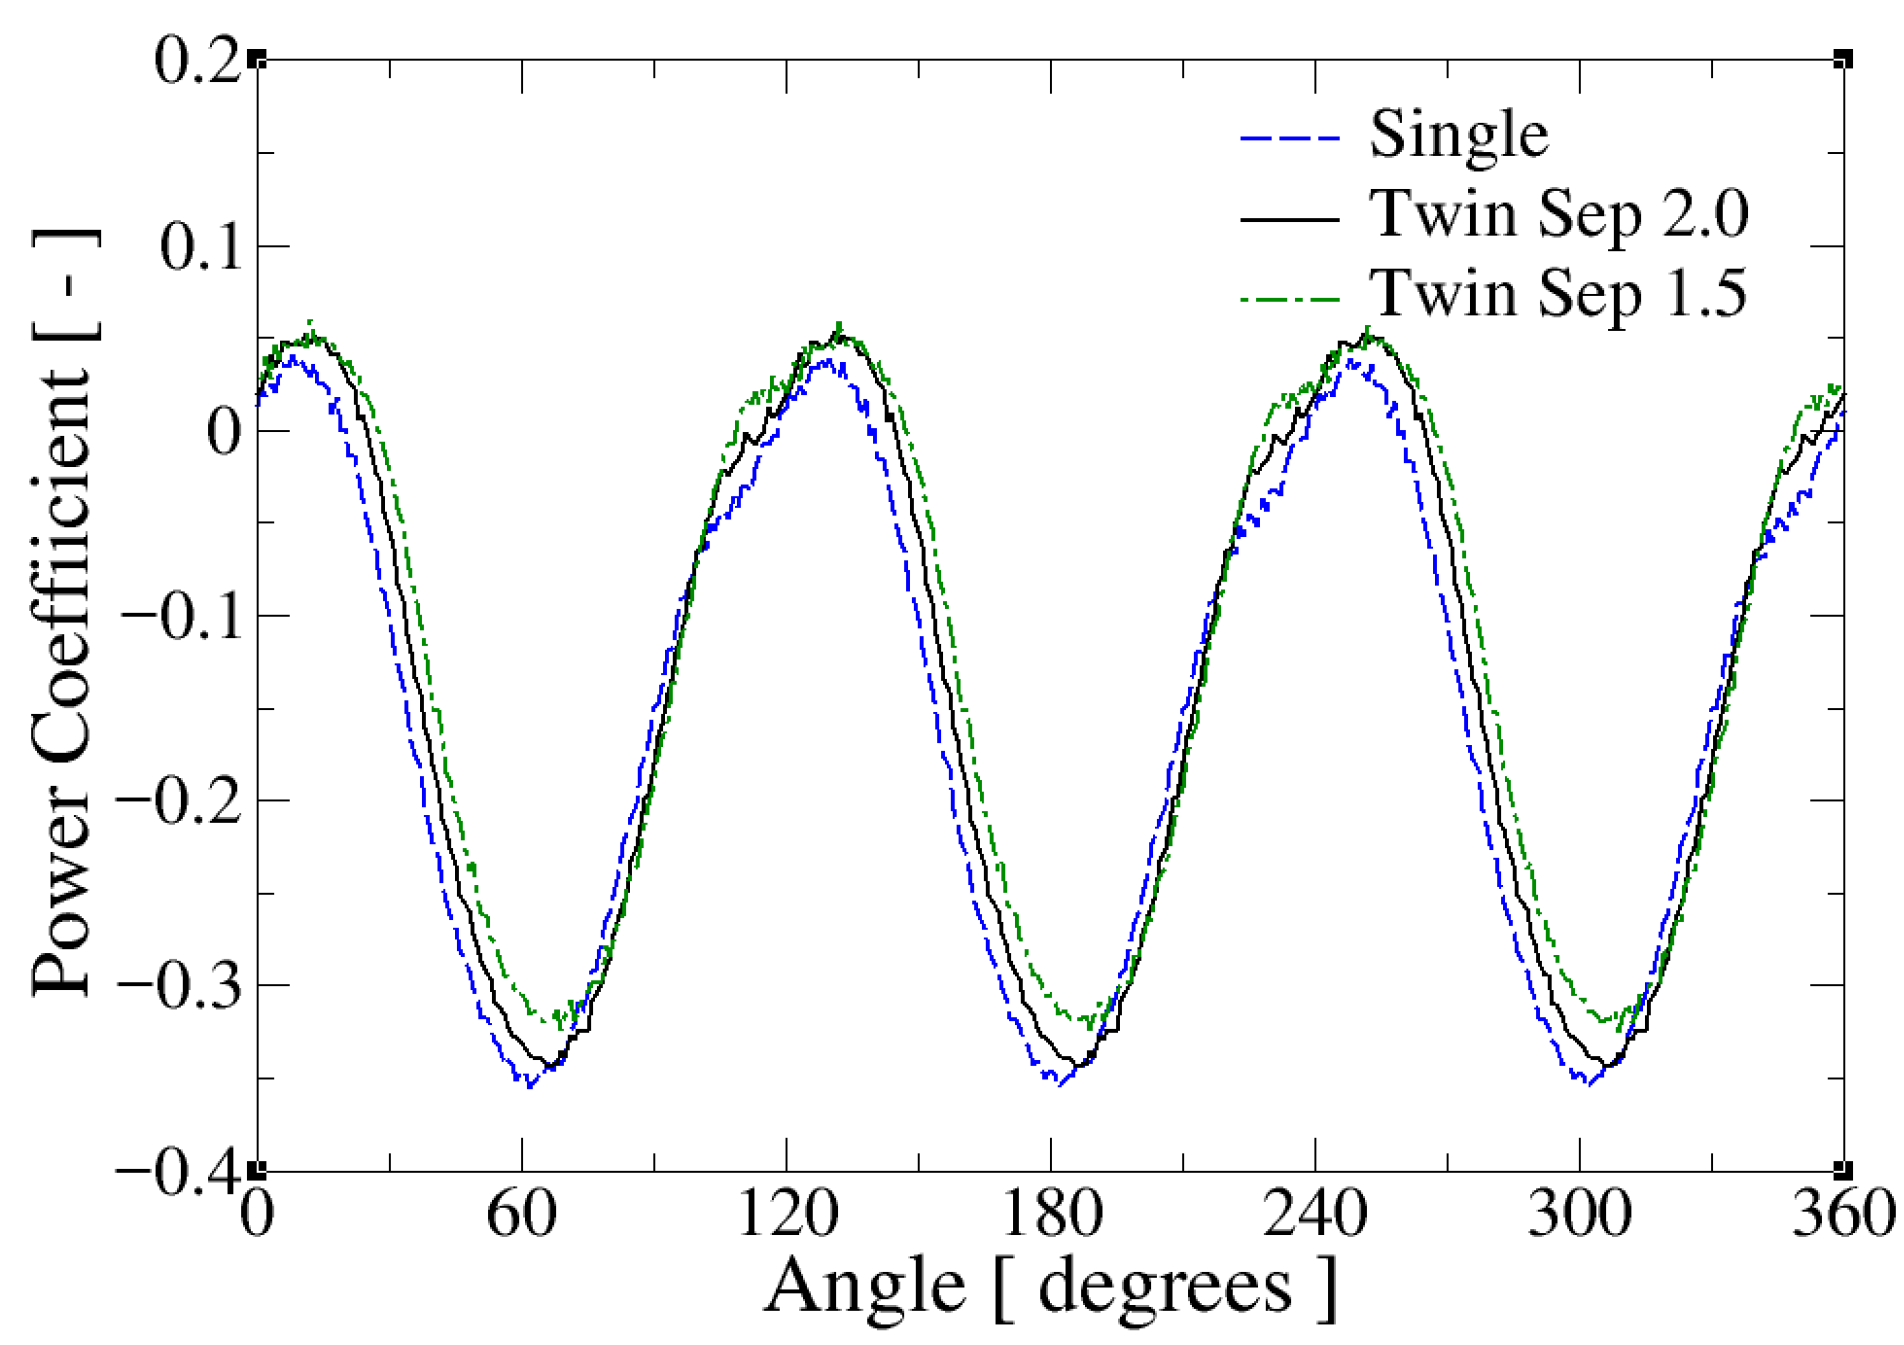
Figure 10 shows the evolution of the power coefficient over one complete rotation for the three considered cases at λ = 1.9 : the isolated turbine, TT2D, and TT1.5D. Comparing the two first configurations, it can be seen that C P attains both higher maxima and minima than the single turbine, which obviously results in a less negative power coefficient. This behavior occurs for all the considered TSR values, as shown in Figure 9a, and leads to an overall enhancement in turbine efficiency. This improvement is attributed both to an induced flow confinement effect, which effectively increases the fluid velocity in the central corridor between the two turbines, and to a tip-vortex detachment delay effect, as will be discussed below. On the other hand, when comparing the TT2D and TT1.5D scenarios in Figure 9b, the maxima of both curves are nearly identical. The only noticeable difference is the slightly higher minima in the TT1.5D case, which accounts for the marginally less negative power coefficient observed. However, this trend is not reproduced at λ = 1.0 , where the efficiency in both configurations is virtually identical.
In summary, the performance improvement observed with reduced turbine spacing arises from higher minimum values in the torque coefficient curve, rather than from increased peak values. However, the drawback of reducing the turbine spacing is the increased wake recovery distance, as noted in [25].

3.3. Wake Flow Visualization in the Twin-Turbine Arrangement

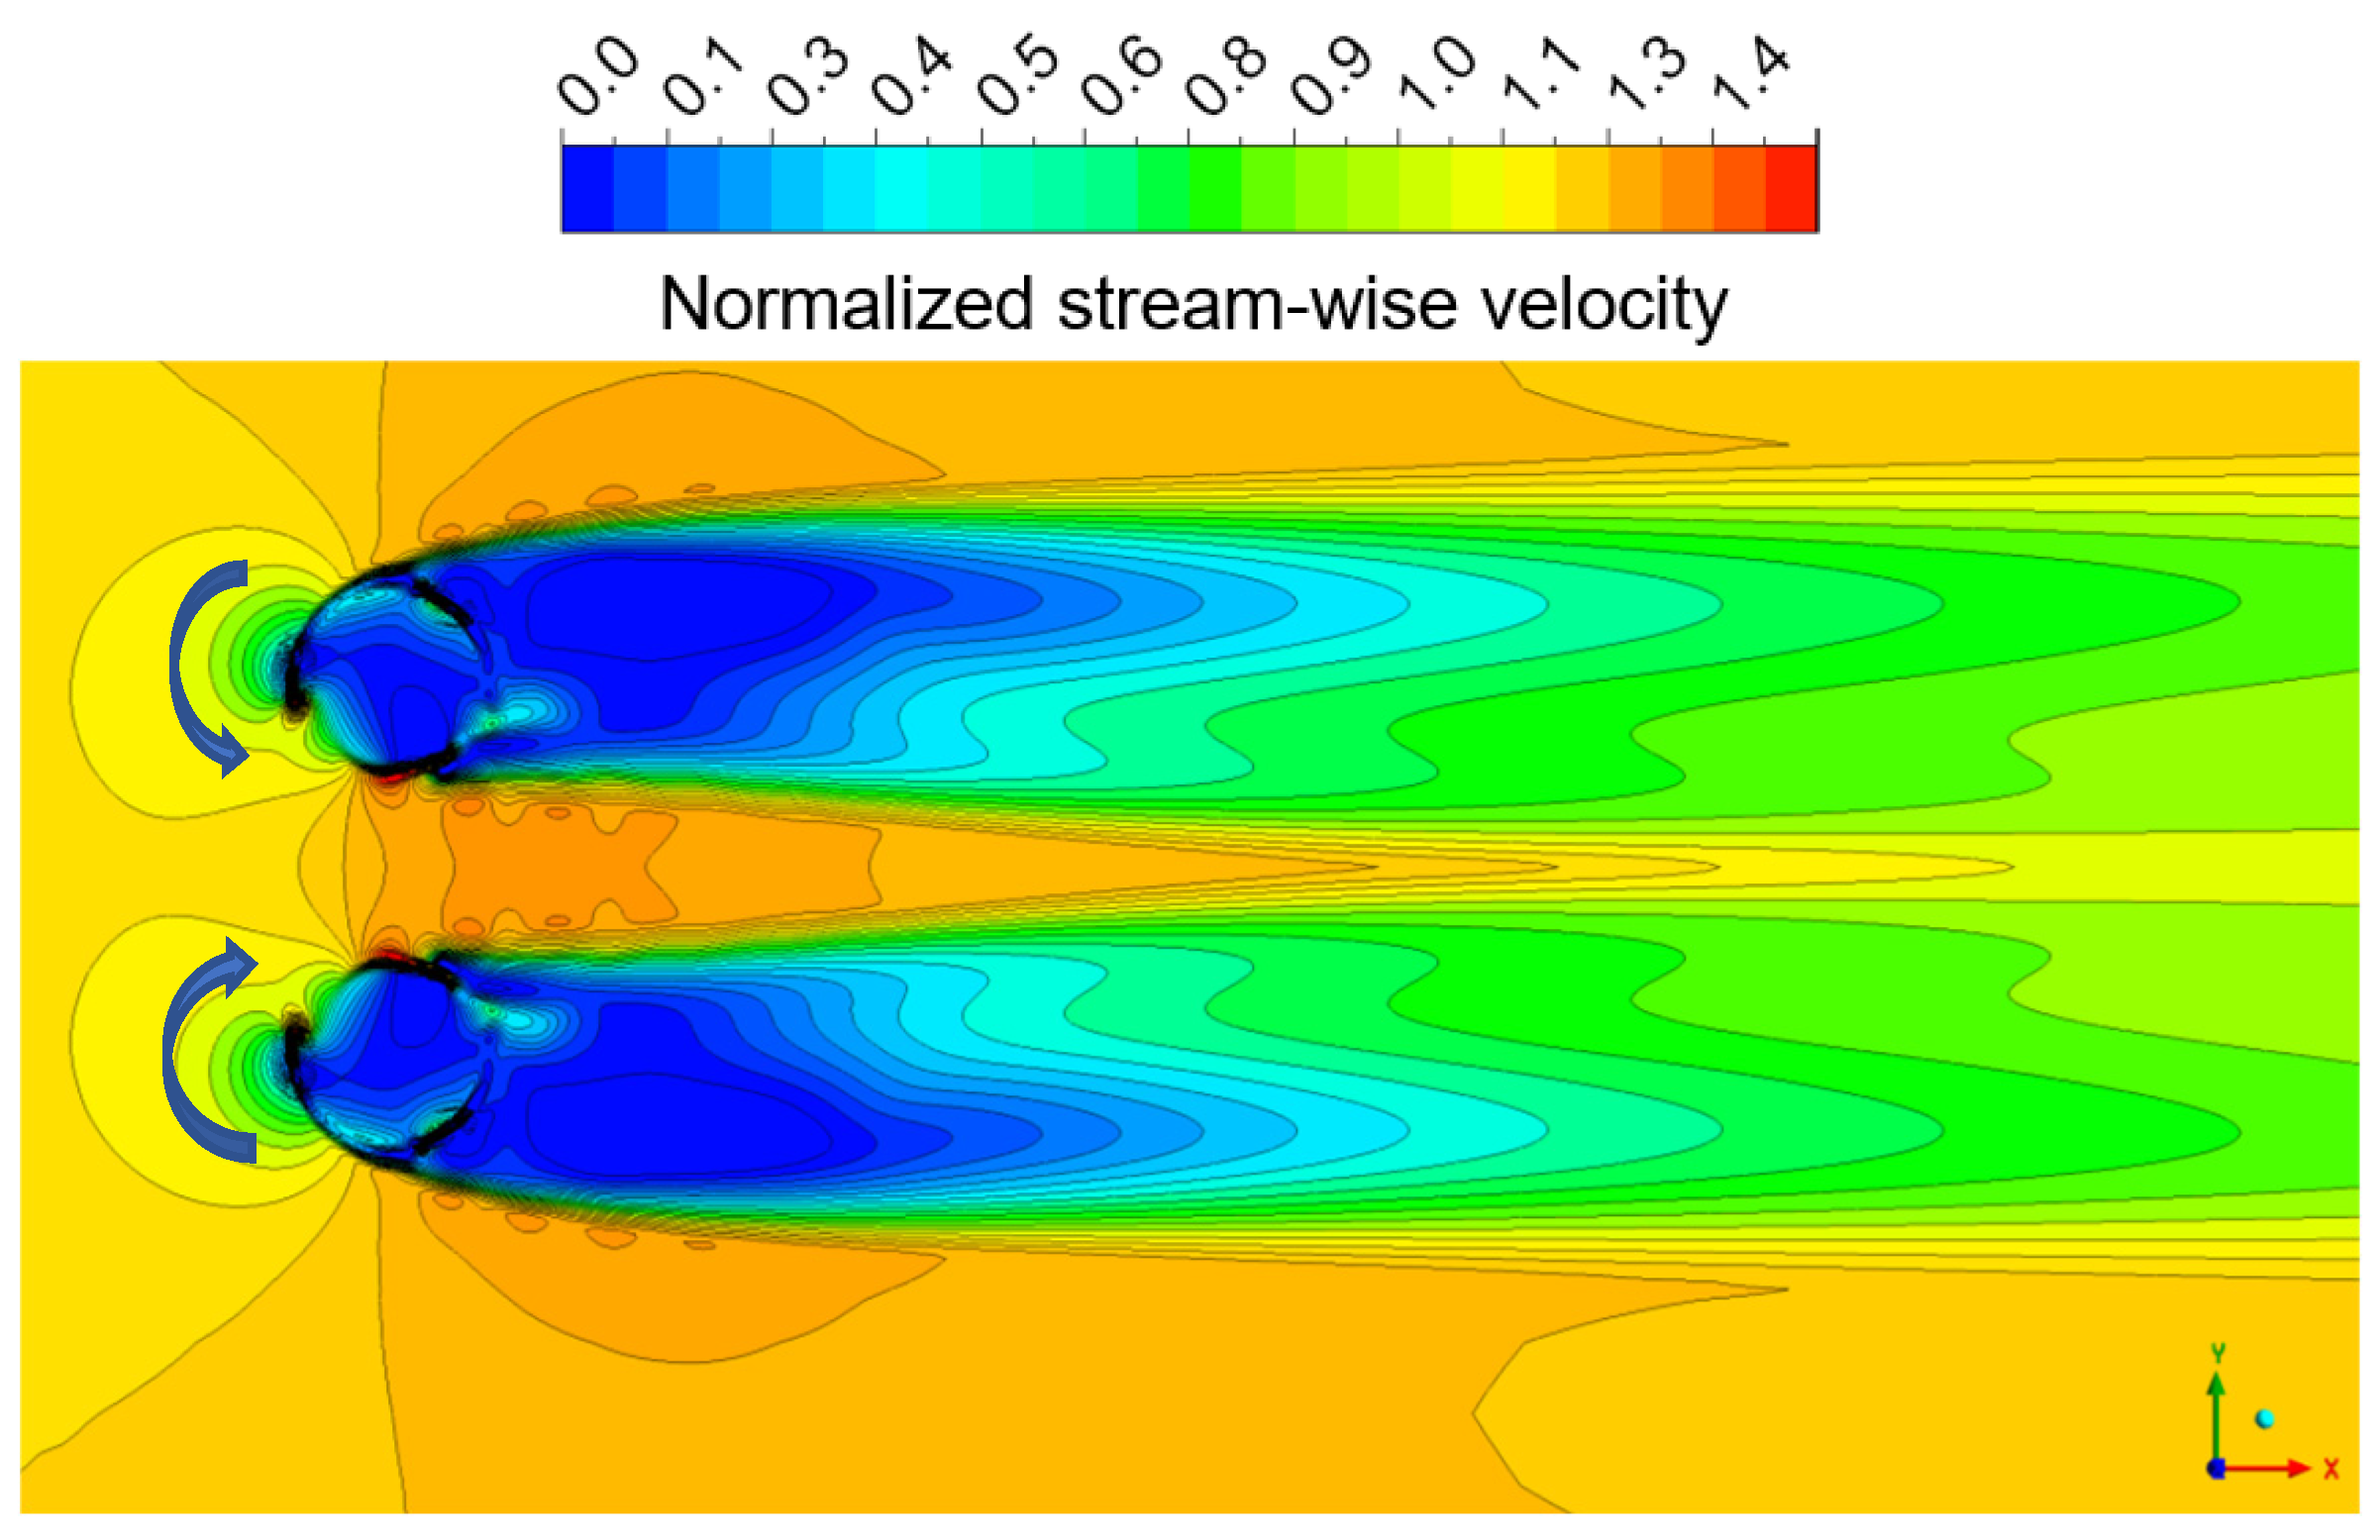
As an illustration, Figure 11 shows a top view of the flow around the twin turbine at the blades’ mid-span ( z = 0 ) for the TT2D counter-rotating forward case at λ = 1.9 . The arrows in the figure indicate the turning direction of the blades for each turbine. Hereafter, the upper turbine will be denoted by T1 and the lower by T2. The velocity field around T1 can be compared with that of the isolated turbine (Figure 6a). By comparing these two contour plots, it can be seen that the isocontour lines in front of the blades of T1 are somewhat distorted, due to the presence of T2, and that the expansion of the wake on the lower side is smaller than in the isolated case. This feature is due to the acceleration of the flow in the gap between the two turbines, which contracts the wake in this side. However, the wake expansion on the upper turbine side is very similar in the isolated and TT2D arrangements. On the other hand, at this spacing, the mixing of two wakes is not evident downstream from the turbines, but their recovery is delayed regarding the isolated configuration. Finally, the velocity deficit immediately behind the rotors is larger than in the single-turbine arrangement.
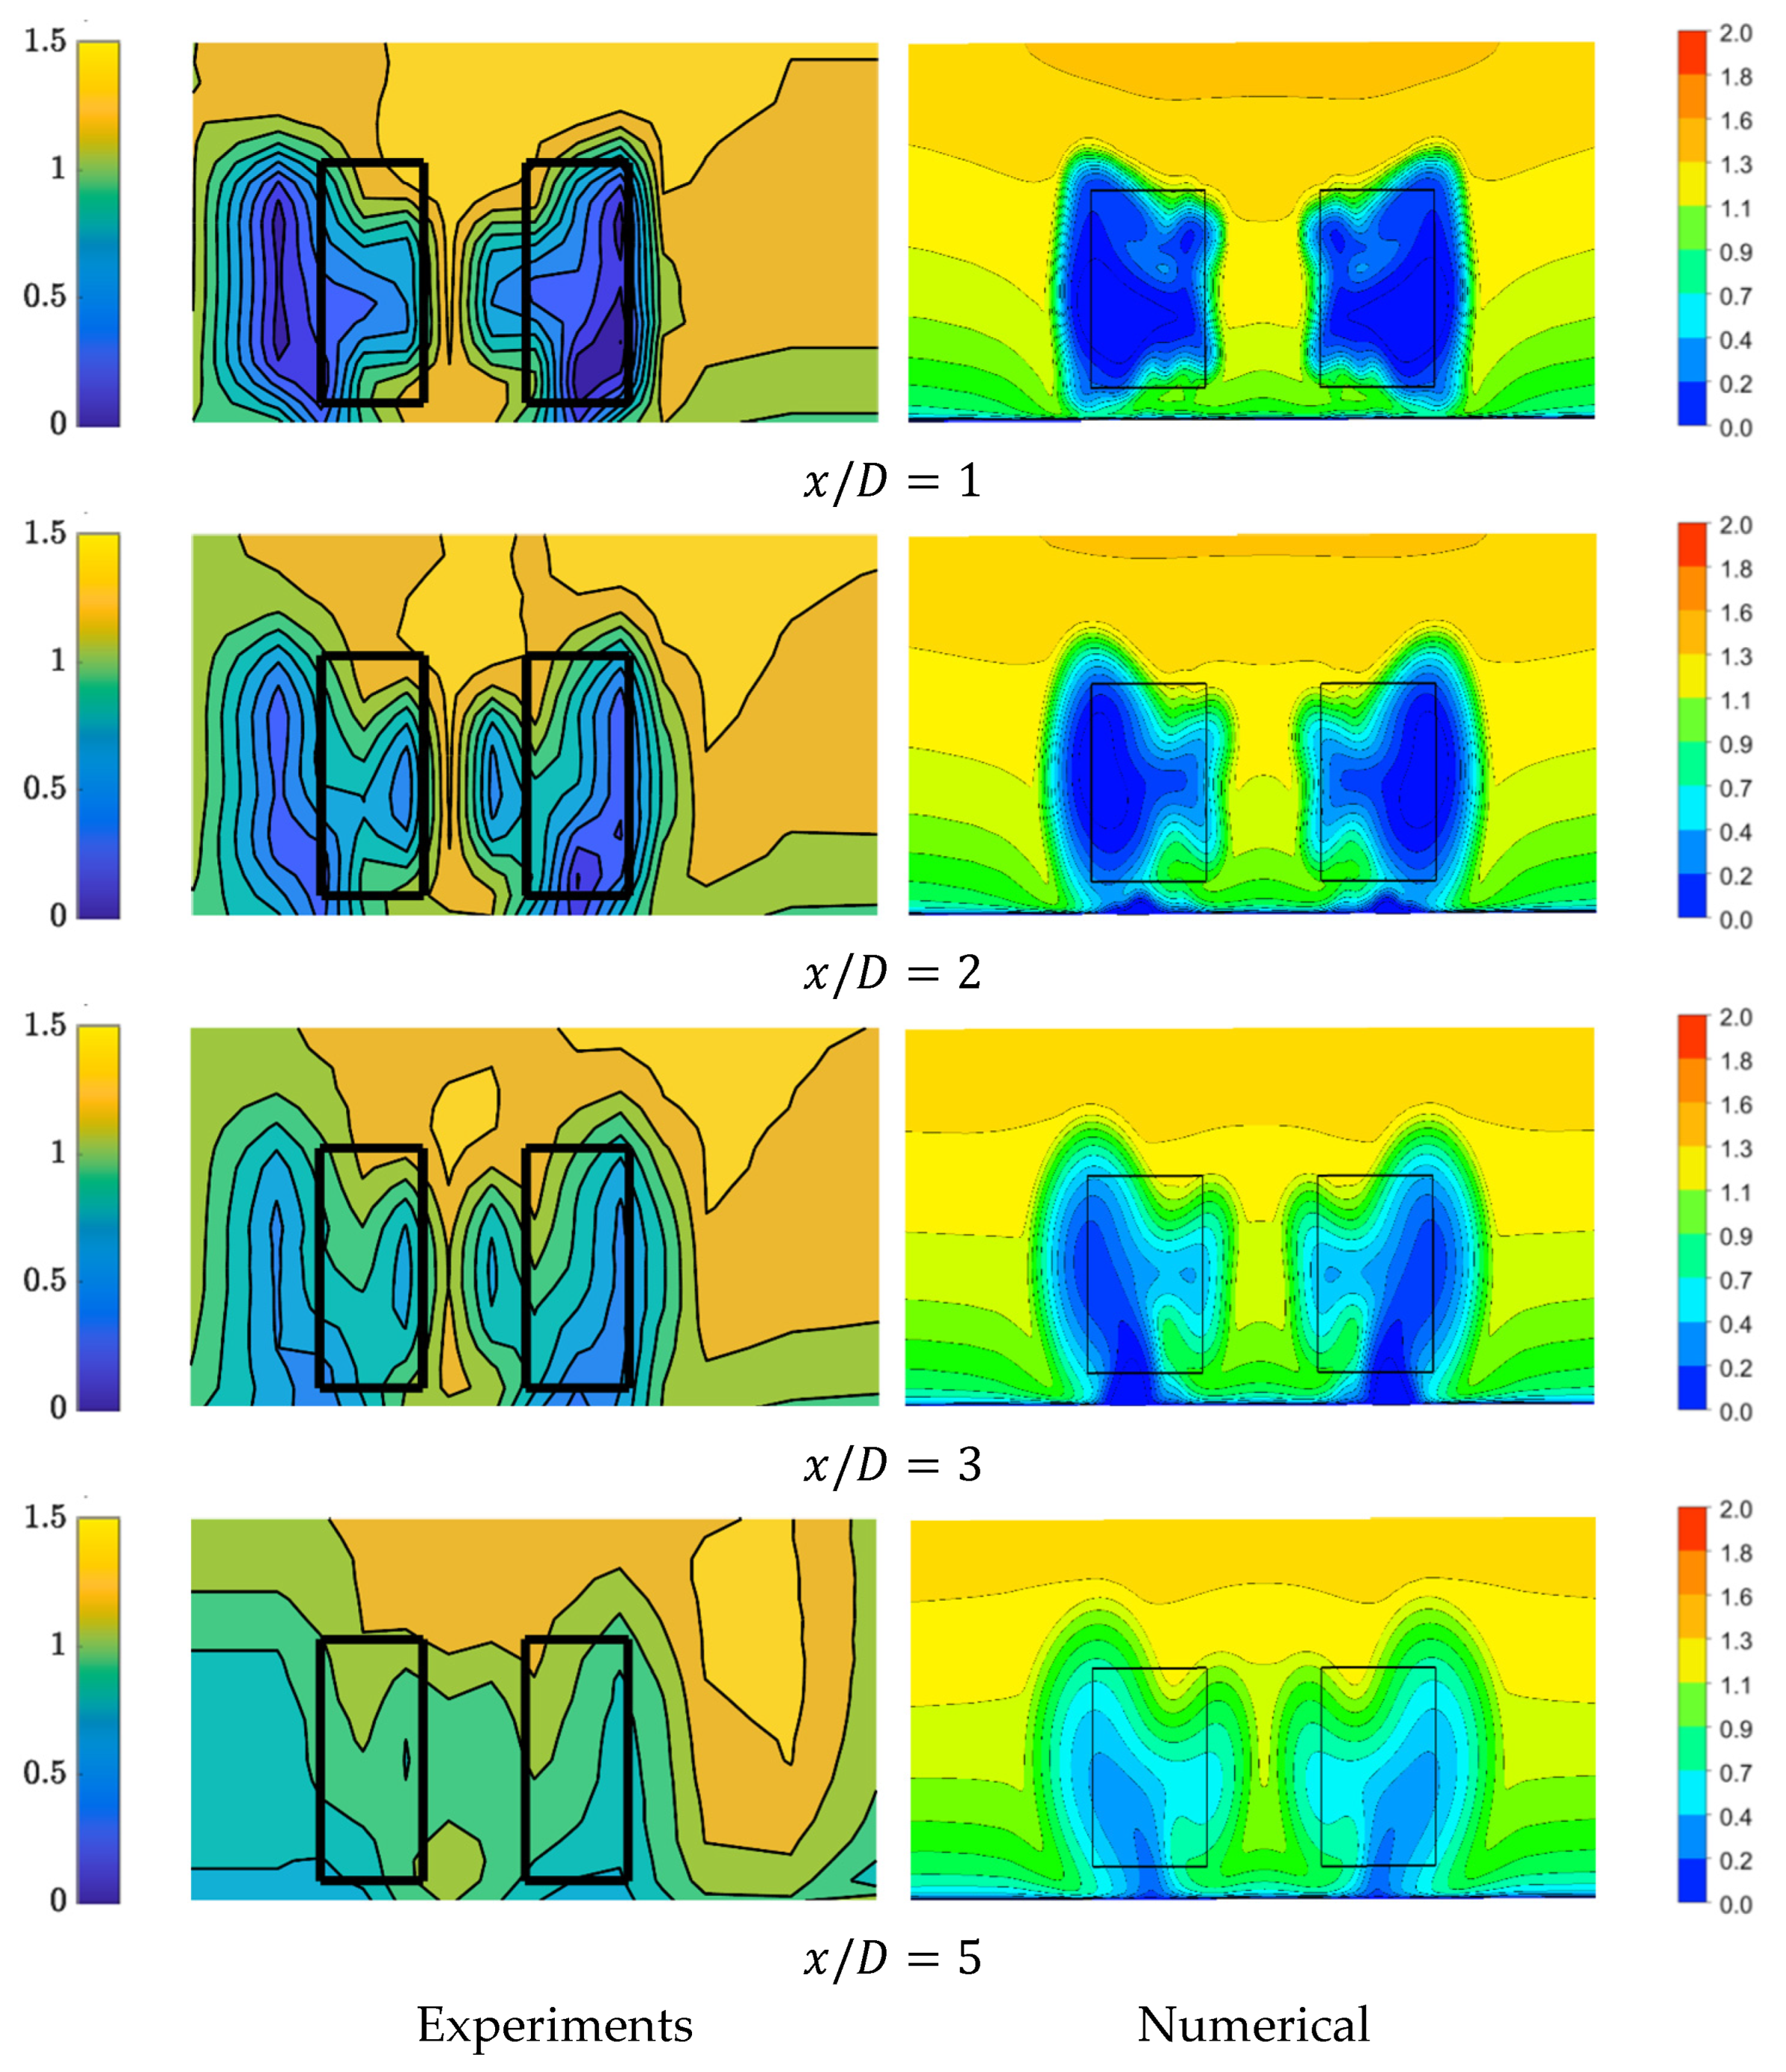
Figure 12 shows the development of the wakes behind the turbines in the TT2D arrangement at λ = 1.9 . Experimental contour plots obtained with the ADV technique in [25] are shown in the left column while the numerical ones are located in the right column. The black rectangles once again mark the limits of the rotors. Apart from the comments made in Section 2.3 in the case of the isolated turbine, it should be mentioned that the experimental and numerical TT2D arrangements are not identical. For technical reasons, in the laboratory rig the first turbine T1 was placed in the center of the flume, as the isolated turbine, while T2 was installed 2D away, closer to the channel lateral wall (see Figure 4 of [25]). The numerical setup, however, considered a symmetric positioning of the turbines with respect to y = 0 . Consequently, the flow around the turbines in the physical model lacks symmetry, in contrast to the simulated case. This phenomenon is clearly illustrated in the wake evolution presented in Figure 12: the simulations yield a fully symmetrical flow pattern, whereas the experimental results display asymmetries in the flow behind the turbines. In this context, considering the points discussed in Section 2.3 concerning contour map discrepancies and measurement limitations, the computed and experimental flow fields behind T2 exhibit a reasonably good qualitative agreement across all evaluated sections.
In summary, the twin-turbine arrangement improves the performance of the isolated machine across all tip speed ratios considered, albeit at the cost of slower wake recovery. Consequently, the twin-turbine system yields slightly more energy than two identical turbines operating independently under the same conditions.

4. Influence of Turbine Separation on the Aerodynamic Behavior of the Blades

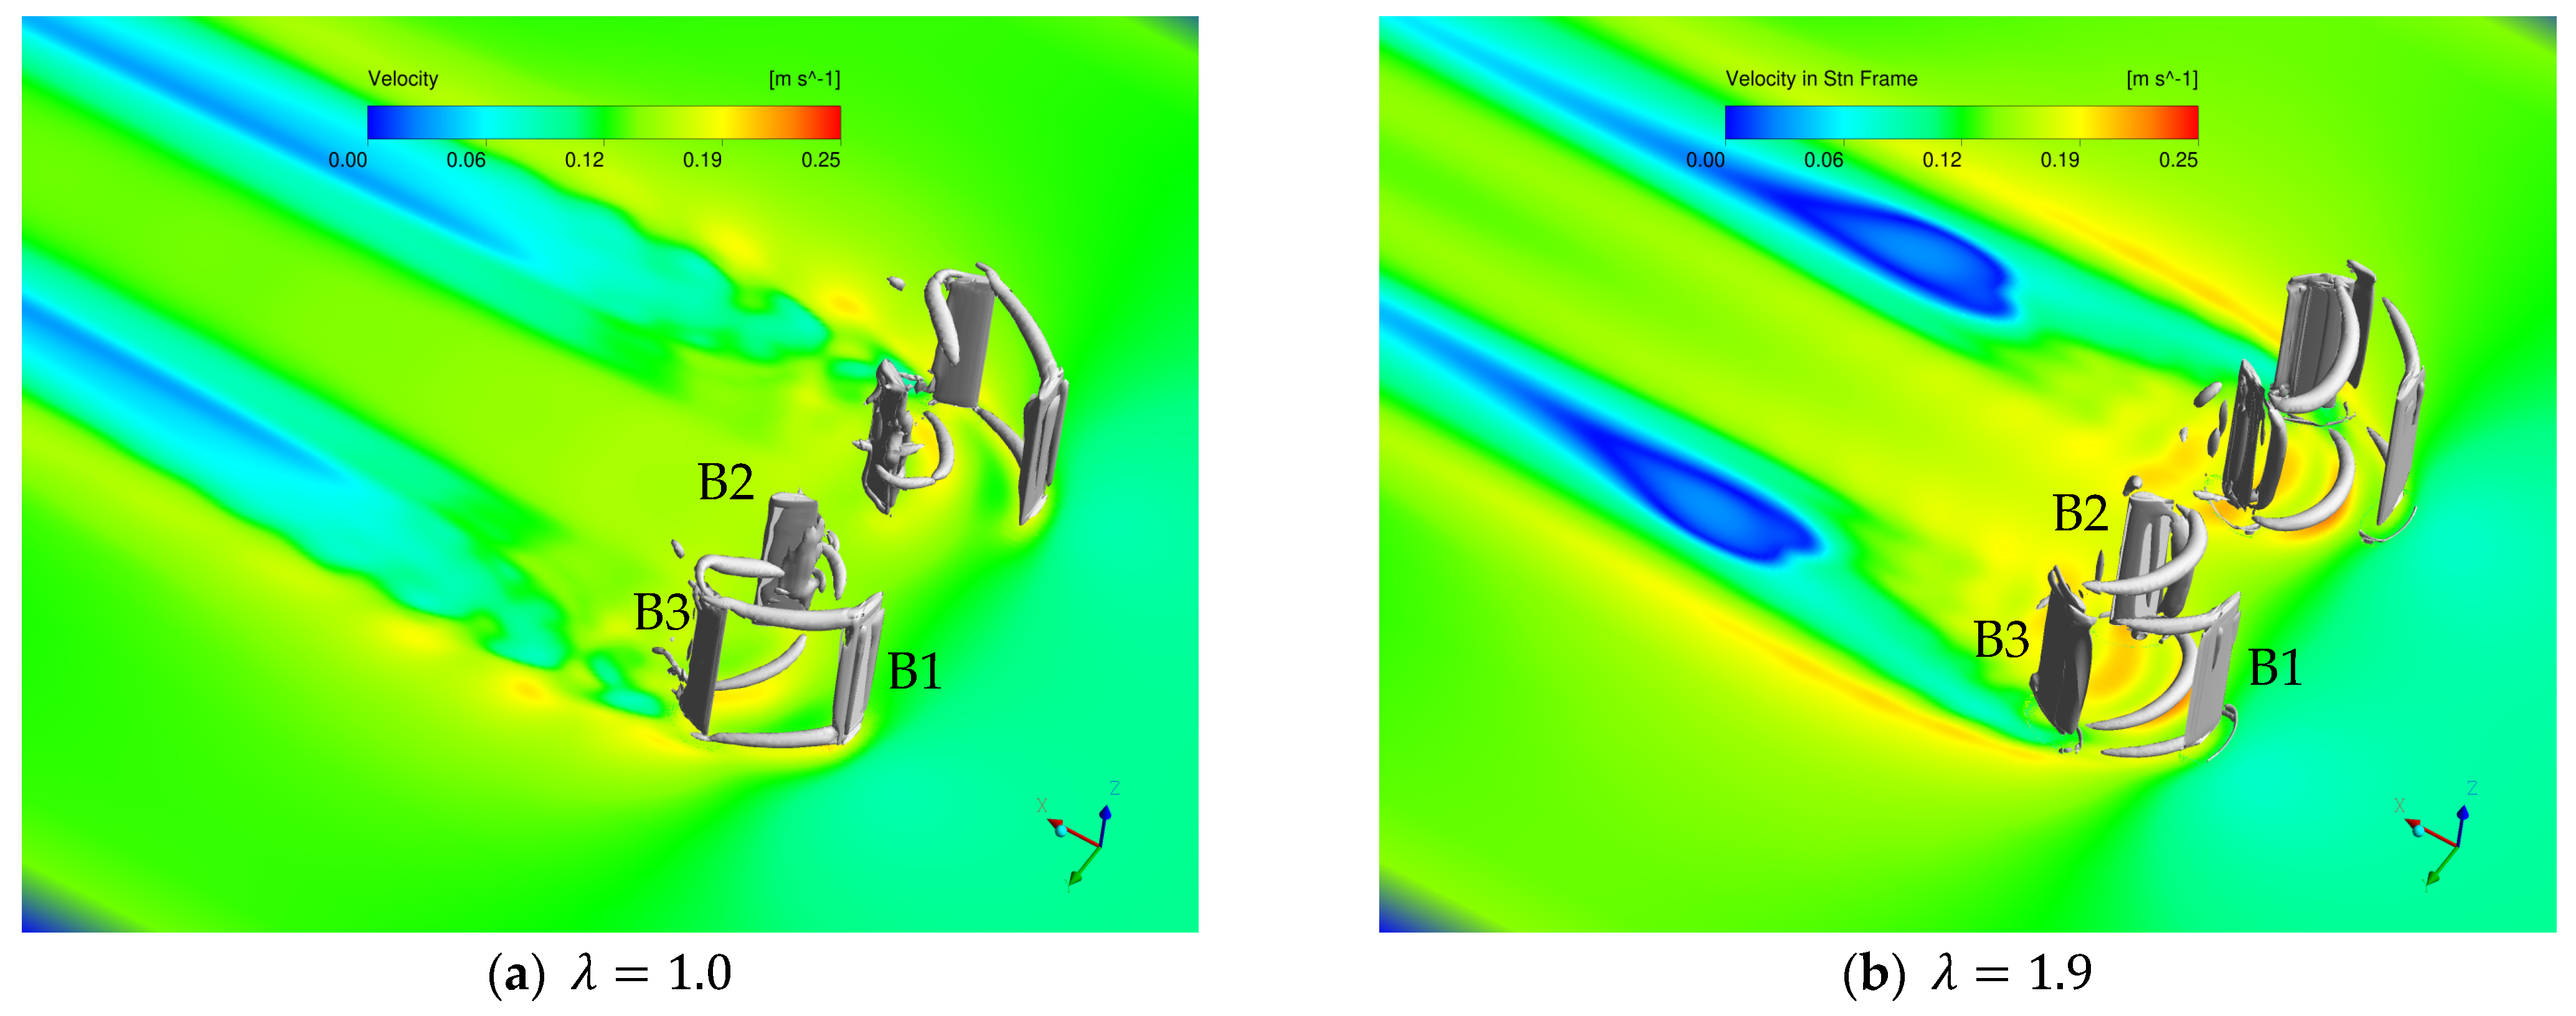
Beyond the impact of the side-by-side twin-turbine arrangement on the performance of a single machine, it is also insightful to examine the induced changes on the aerodynamics of the blade caused by the presence of the second turbine as a function of tip speed ratio. In this context, Figure 13 illustrates the instantaneous vortex system developing in the twin turbine configuration TT2D at two TSR values: λ = 1.0 (Figure 13a), corresponding to the maximum power coefficient, and λ = 1.9 (Figure 13b), that considered in [25].
In Figure 13, vortices are visualized as isosurfaces of the Q-criterion ( Q = 100 s−2) and are depicted in gray. Additionally, the velocity magnitude contour is shown in a plane located 1 cm above the channel floor and 1 cm below the lower blade tip. The blades’ position corresponds to the case where the first blade is at an angular position of θ = 0 ° (see Figure 1). Blades of turbine T1 are identified as B1, B2, and B3.
At low TSR λ = 1.0 (Figure 13a), the trailing vortices shed from the tip of blade B1 are relatively long and extend downstream to blade B3. In this blade, the tip vortices remain attached but are noticeably bent as they are convected downstream while the blade moves upstream. Additionally, a series of shorter vortices detached around mid-span from B2 can also be observed. The velocity field in the plane shows low values in front of the twin turbine system. The velocity increases just below the trailing vortices and in the space between the turbines, while a markedly low-speed region develops on the outer sides, extending several diameters downstream. Figure 13b displays the panorama for higher TSR, λ = 1.9 . In this situation, the trailing vortices from B1 are shorter, while none are observed behind B3. B2 exhibits a vortex system consisting of two distinct trailing vortices and an Omega-type bound vortex [54]. The velocity field in the plane is qualitatively similar to that in Figure 13a; however, in this case the higher rotational speed of the blades induces greater velocity magnitudes beneath the trailing vortices and within the inter-turbine region. The low-velocity wake area (dark blue) is wider and shorter than in the low TSR case.
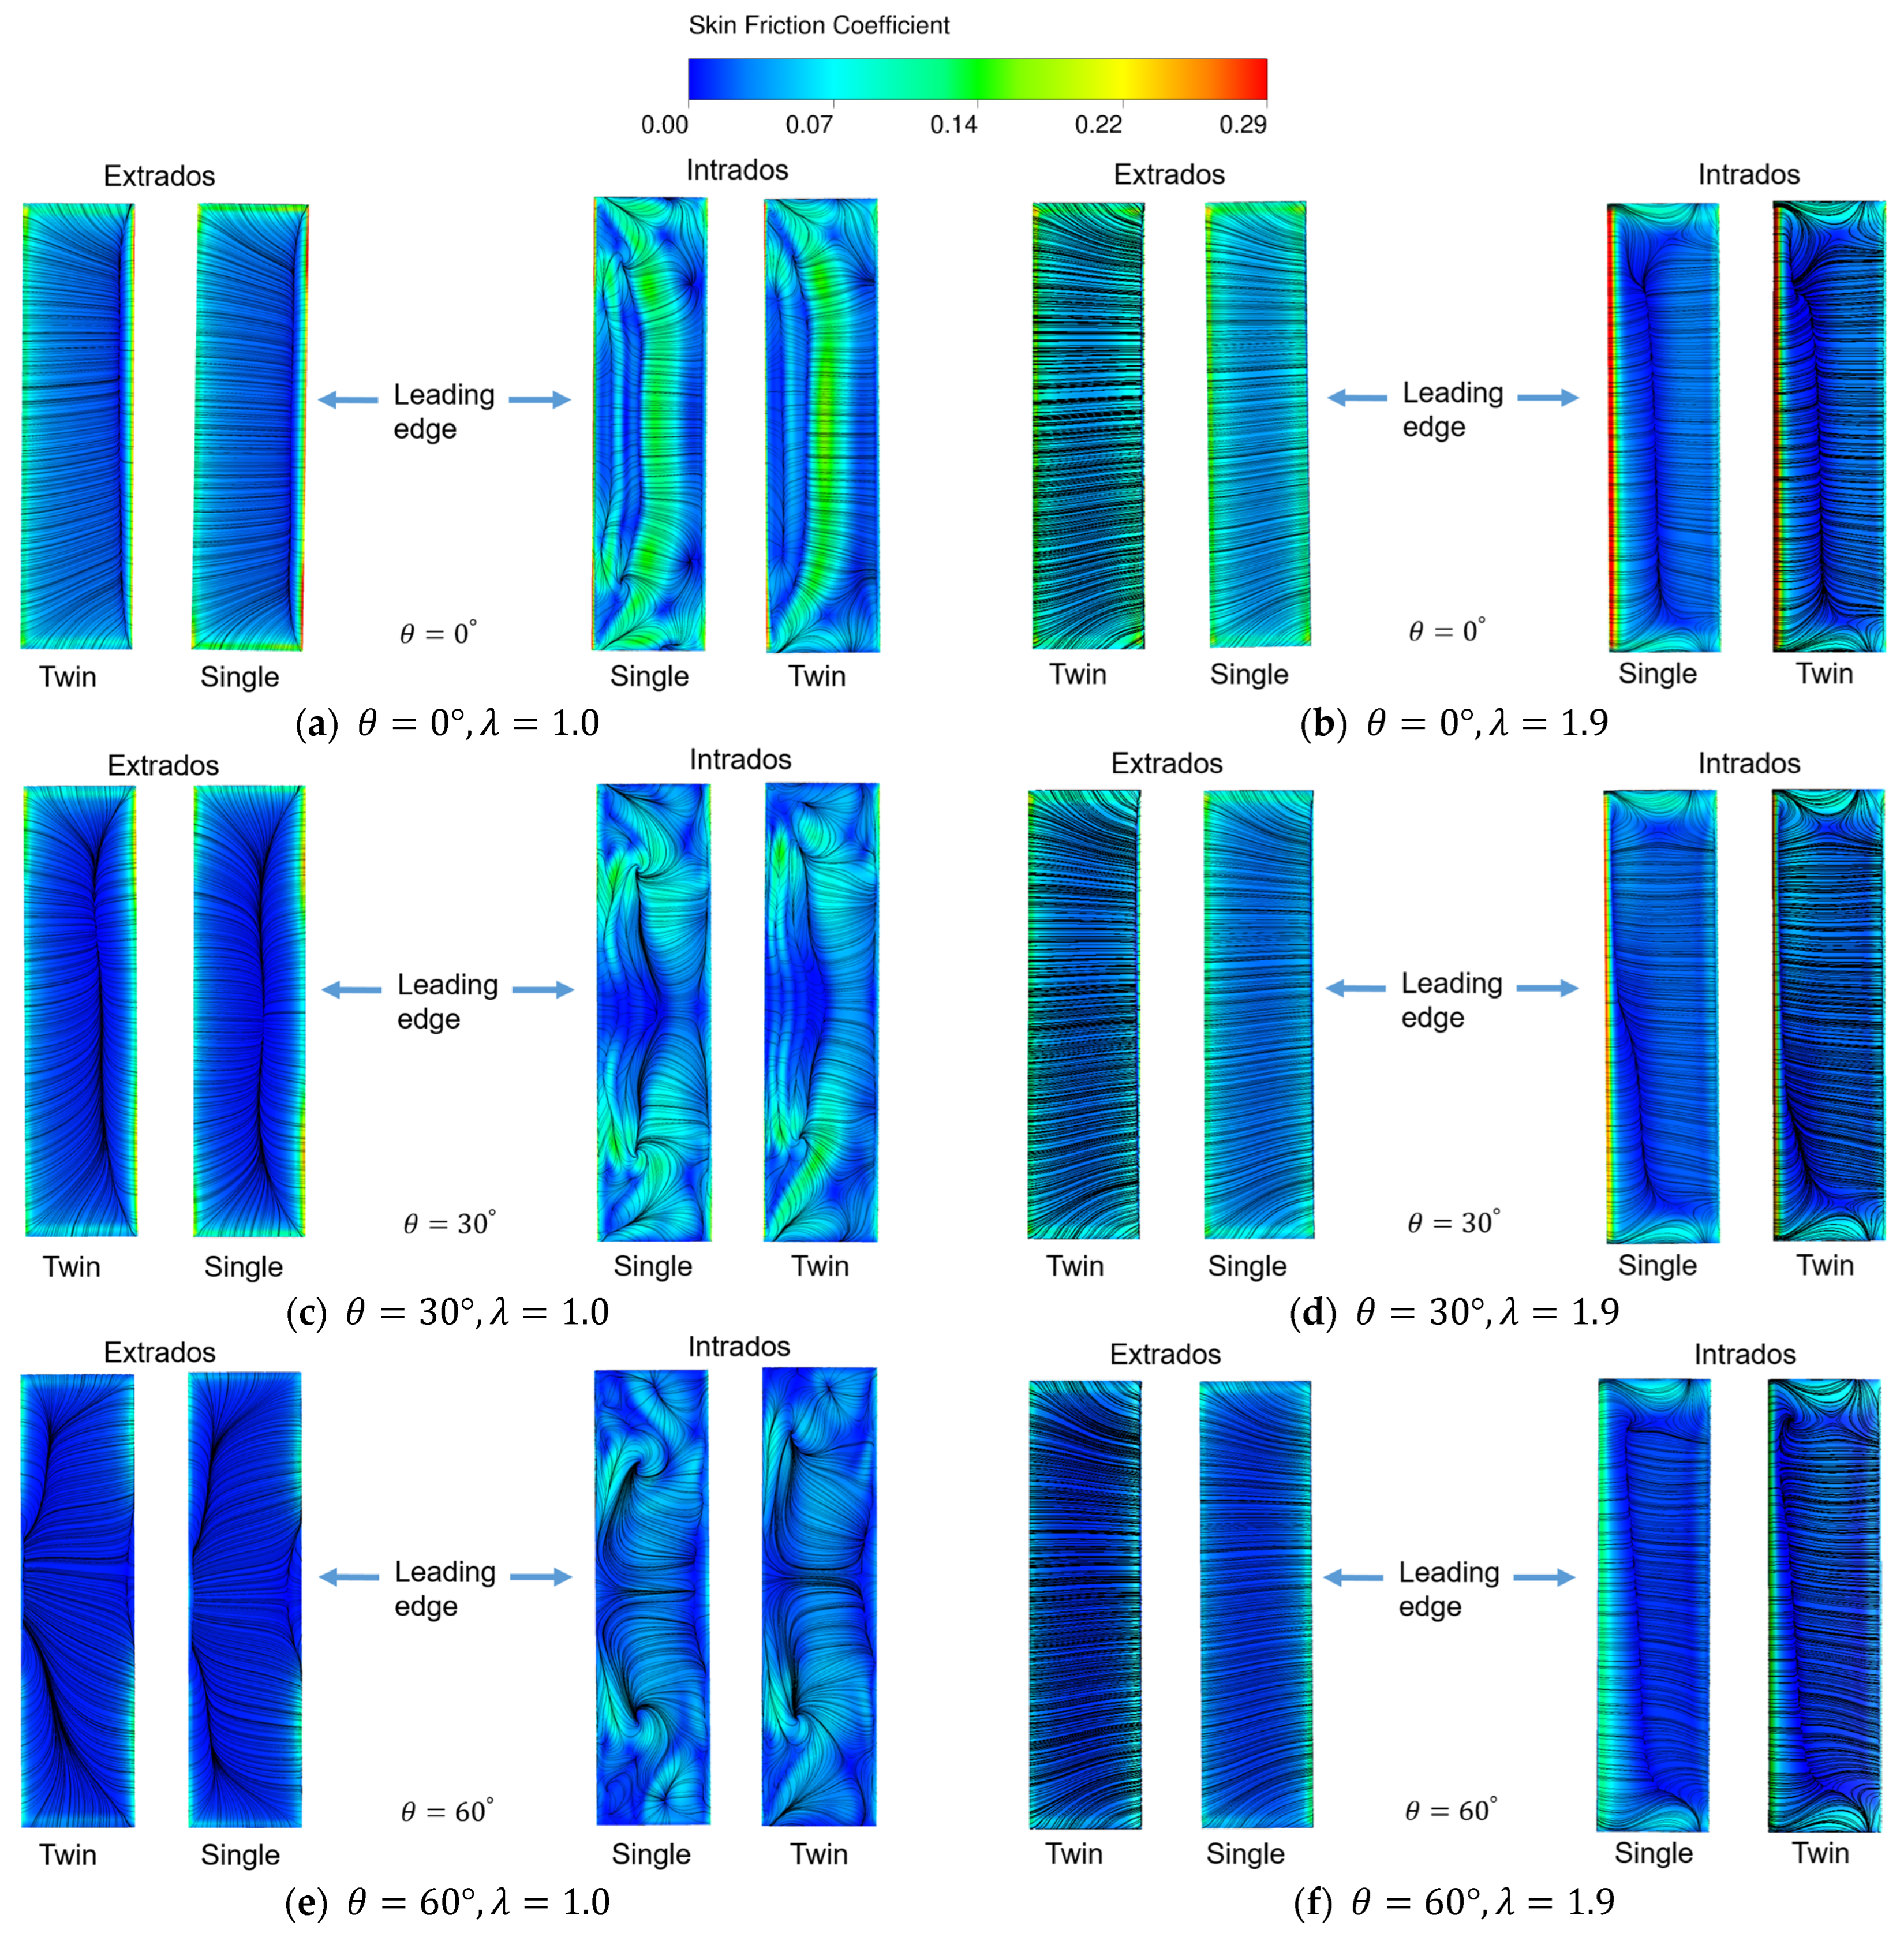
To gain a deeper understanding of flow interaction effects in the twin-turbine system, Figure 14 presents the friction lines together with the skin friction coefficient contour plot on the T1 blade at six different angular locations ( θ = 0 ° , 30 ° , 60 ° , 90 ° , 120 ° , 150 ° ) and two tip speed ratios ( λ = 1.0 , 1.9 ). In each subplot, the aforementioned variables are shown for both the intrados and extrados of the blade, comparing the isolated and TT2D turbine configurations. In the figure, arrows indicate the position of the leading edge.
Results for λ = 1.0 are presented in the left column of Figure 14. In general, the friction lines show a more convoluted pattern in the intrados than extrados, suggesting a separated flow structure around the former (see Figure 14a,c,e,g for θ = 0 ° , 30 ° , 60 ° , 90 ° ), particularly close to the blade’s tips. In fact, such patterns for θ = 0 ° , 90 ° are qualitatively similar to those reported in [41] for their azimuthal locations of 90 ° and 180 ° . For θ = 120 ° , 150 ° (Figure 14i,k), already in the downstream cycle of the turbine rotation, the friction lines’ topology becomes more ordered in the intrados, accompanied by additional attachment and detachment lines in the extrados. On the other hand, although C f contours and lines are qualitatively similar in both turbine arrangements, the TT2D configuration exhibits a more pronounced top–bottom asymmetric flow pattern than the isolated case. This fact indicates that the interaction between turbines amplifies the influence of the channel floor on blade hydrodynamics.
In the case of λ = 1.9 , the corresponding plots are shown in the right column of Figure 14. Overall, the friction lines pattern in the intrados display a less intricate structure than for the lower value of tip speed ratio, showing a few singular (attachment and detachment) lines. On the extrados, at locations θ = 0 ° , 30 ° , 60 ° (Figure 14b,d,f) the flow tends to be attached, reflected in the absence of singular lines; however, for further angles θ = 90 ° , 120 ° , 150 ° (Figure 14h,j,l) the flow separates, developing a bound vortex that can also be observed in Figure 13b (blade B2). Regarding the effect of turbine separation, the interacting flow again intensifies the top–bottom asymmetry in the friction lines’ pattern compared with the isolated turbine arrangement. In this last case, however, such asymmetry is evident in the inclination of the separation line on the intrados (Figure 14b,d,f), which lies closer to the leading edge at the blade’s top than at its bottom.
In summary, in the case of a low tip speed ratio, the flow is already fully separated on the intrados at θ = 0 ° , while an attachment line is clearly observed near the leading edge (LE) on the extrados. On the intrados, the friction lines continue to exhibit a complex pattern consisting of a number of singular points (nodes, foci, and saddles) [55], together with flow attachment and detachment lines spanning the entire blade, up to θ = 120 ° . This behavior suggests the vortex shedding is typically associated with stall conditions. At larger angles the flow becomes more ordered around mid-span, although not at the blade tips where the trailing vortices are still present. On the other hand, at a large tip speed ratio, the intrados exhibits only a separation line at blade mid-span in the angular range 0 ° θ 60 ° , suggesting that vortex detachment is confined to the tips, where trailing vortices develop (see Figure 13b). From θ = 90 ° onward, flow separation begins on the extrados, while on the intrados the detachment lines shift toward the trailing edge. At larger angular positions, a bound Omega vortex [56] develops on the extrados, visible at θ = 120 ° in Figure 13b (blade B2).

Behavior of the Pressure and Skin Friction Coefficients in Single- and Twin-Turbine Setups

Beyond the impact of the side-by-side twin-turbine arrangement on the performance of a single machine, it is also insightful to examine the induced changes in pressure, C p , and skin friction, C f , coefficients on the blades. The analysis of these coefficients is rarely found in previous studies on hydrokinetic turbines, e.g., [41].
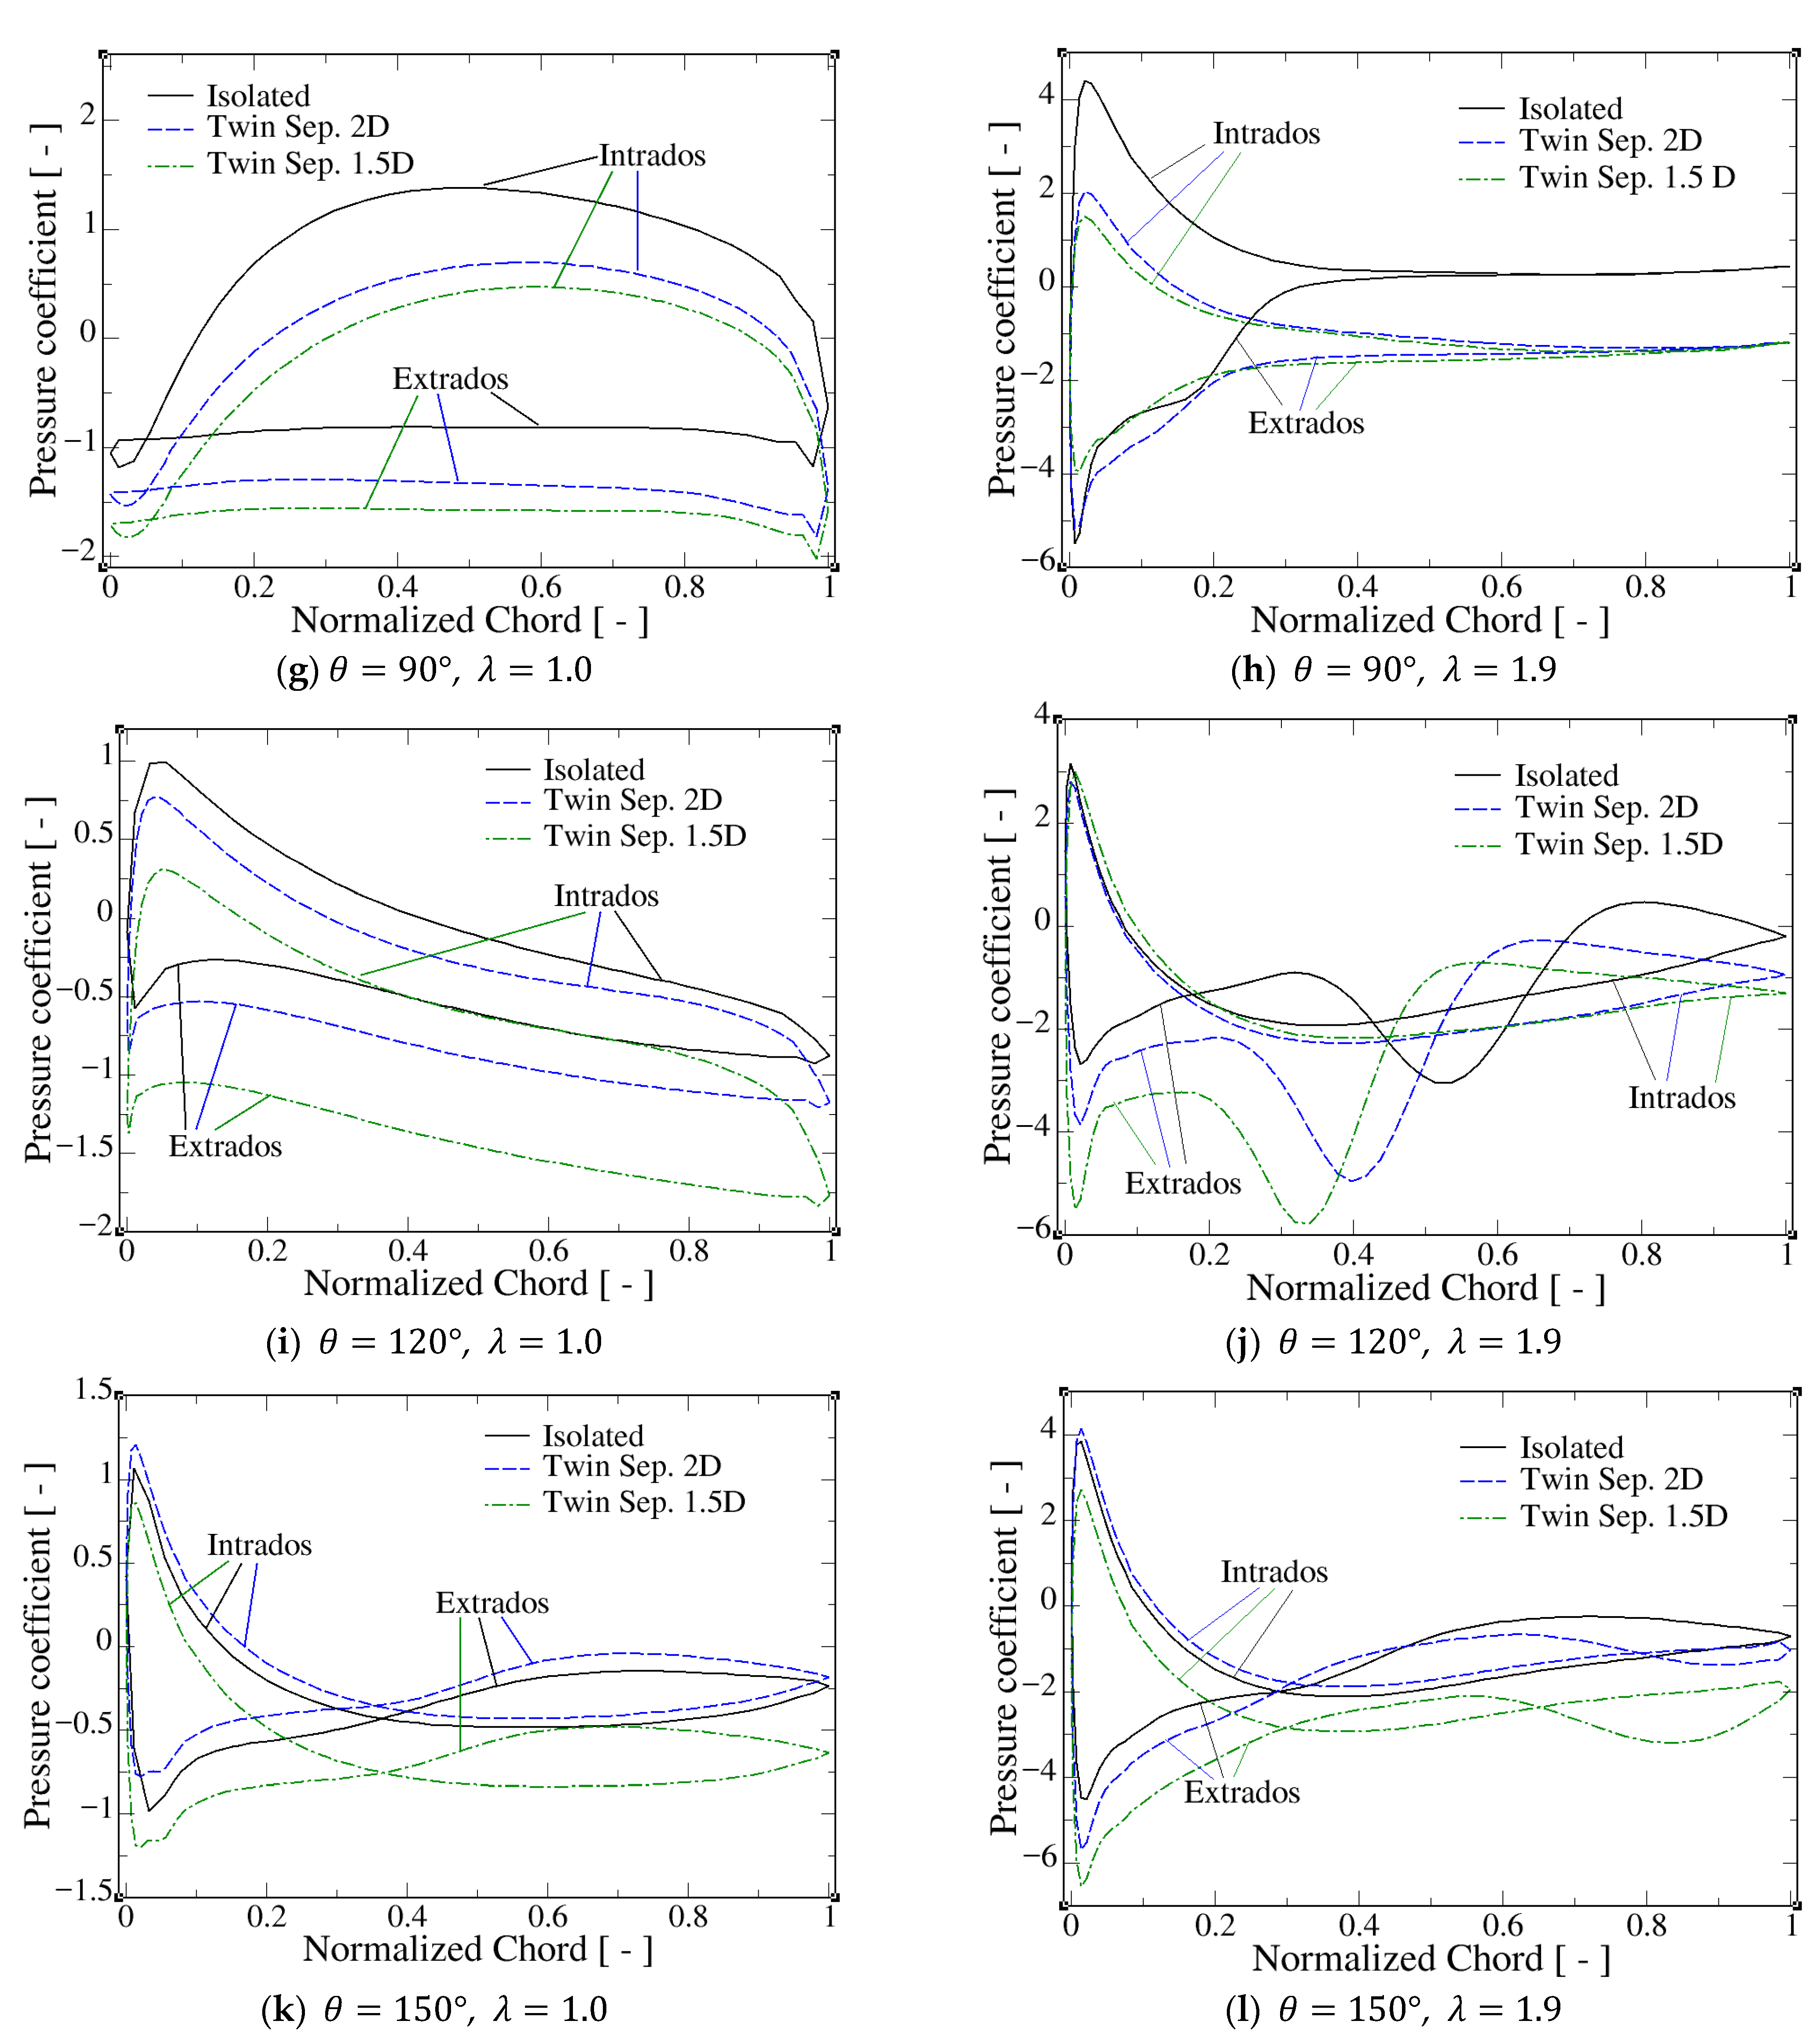
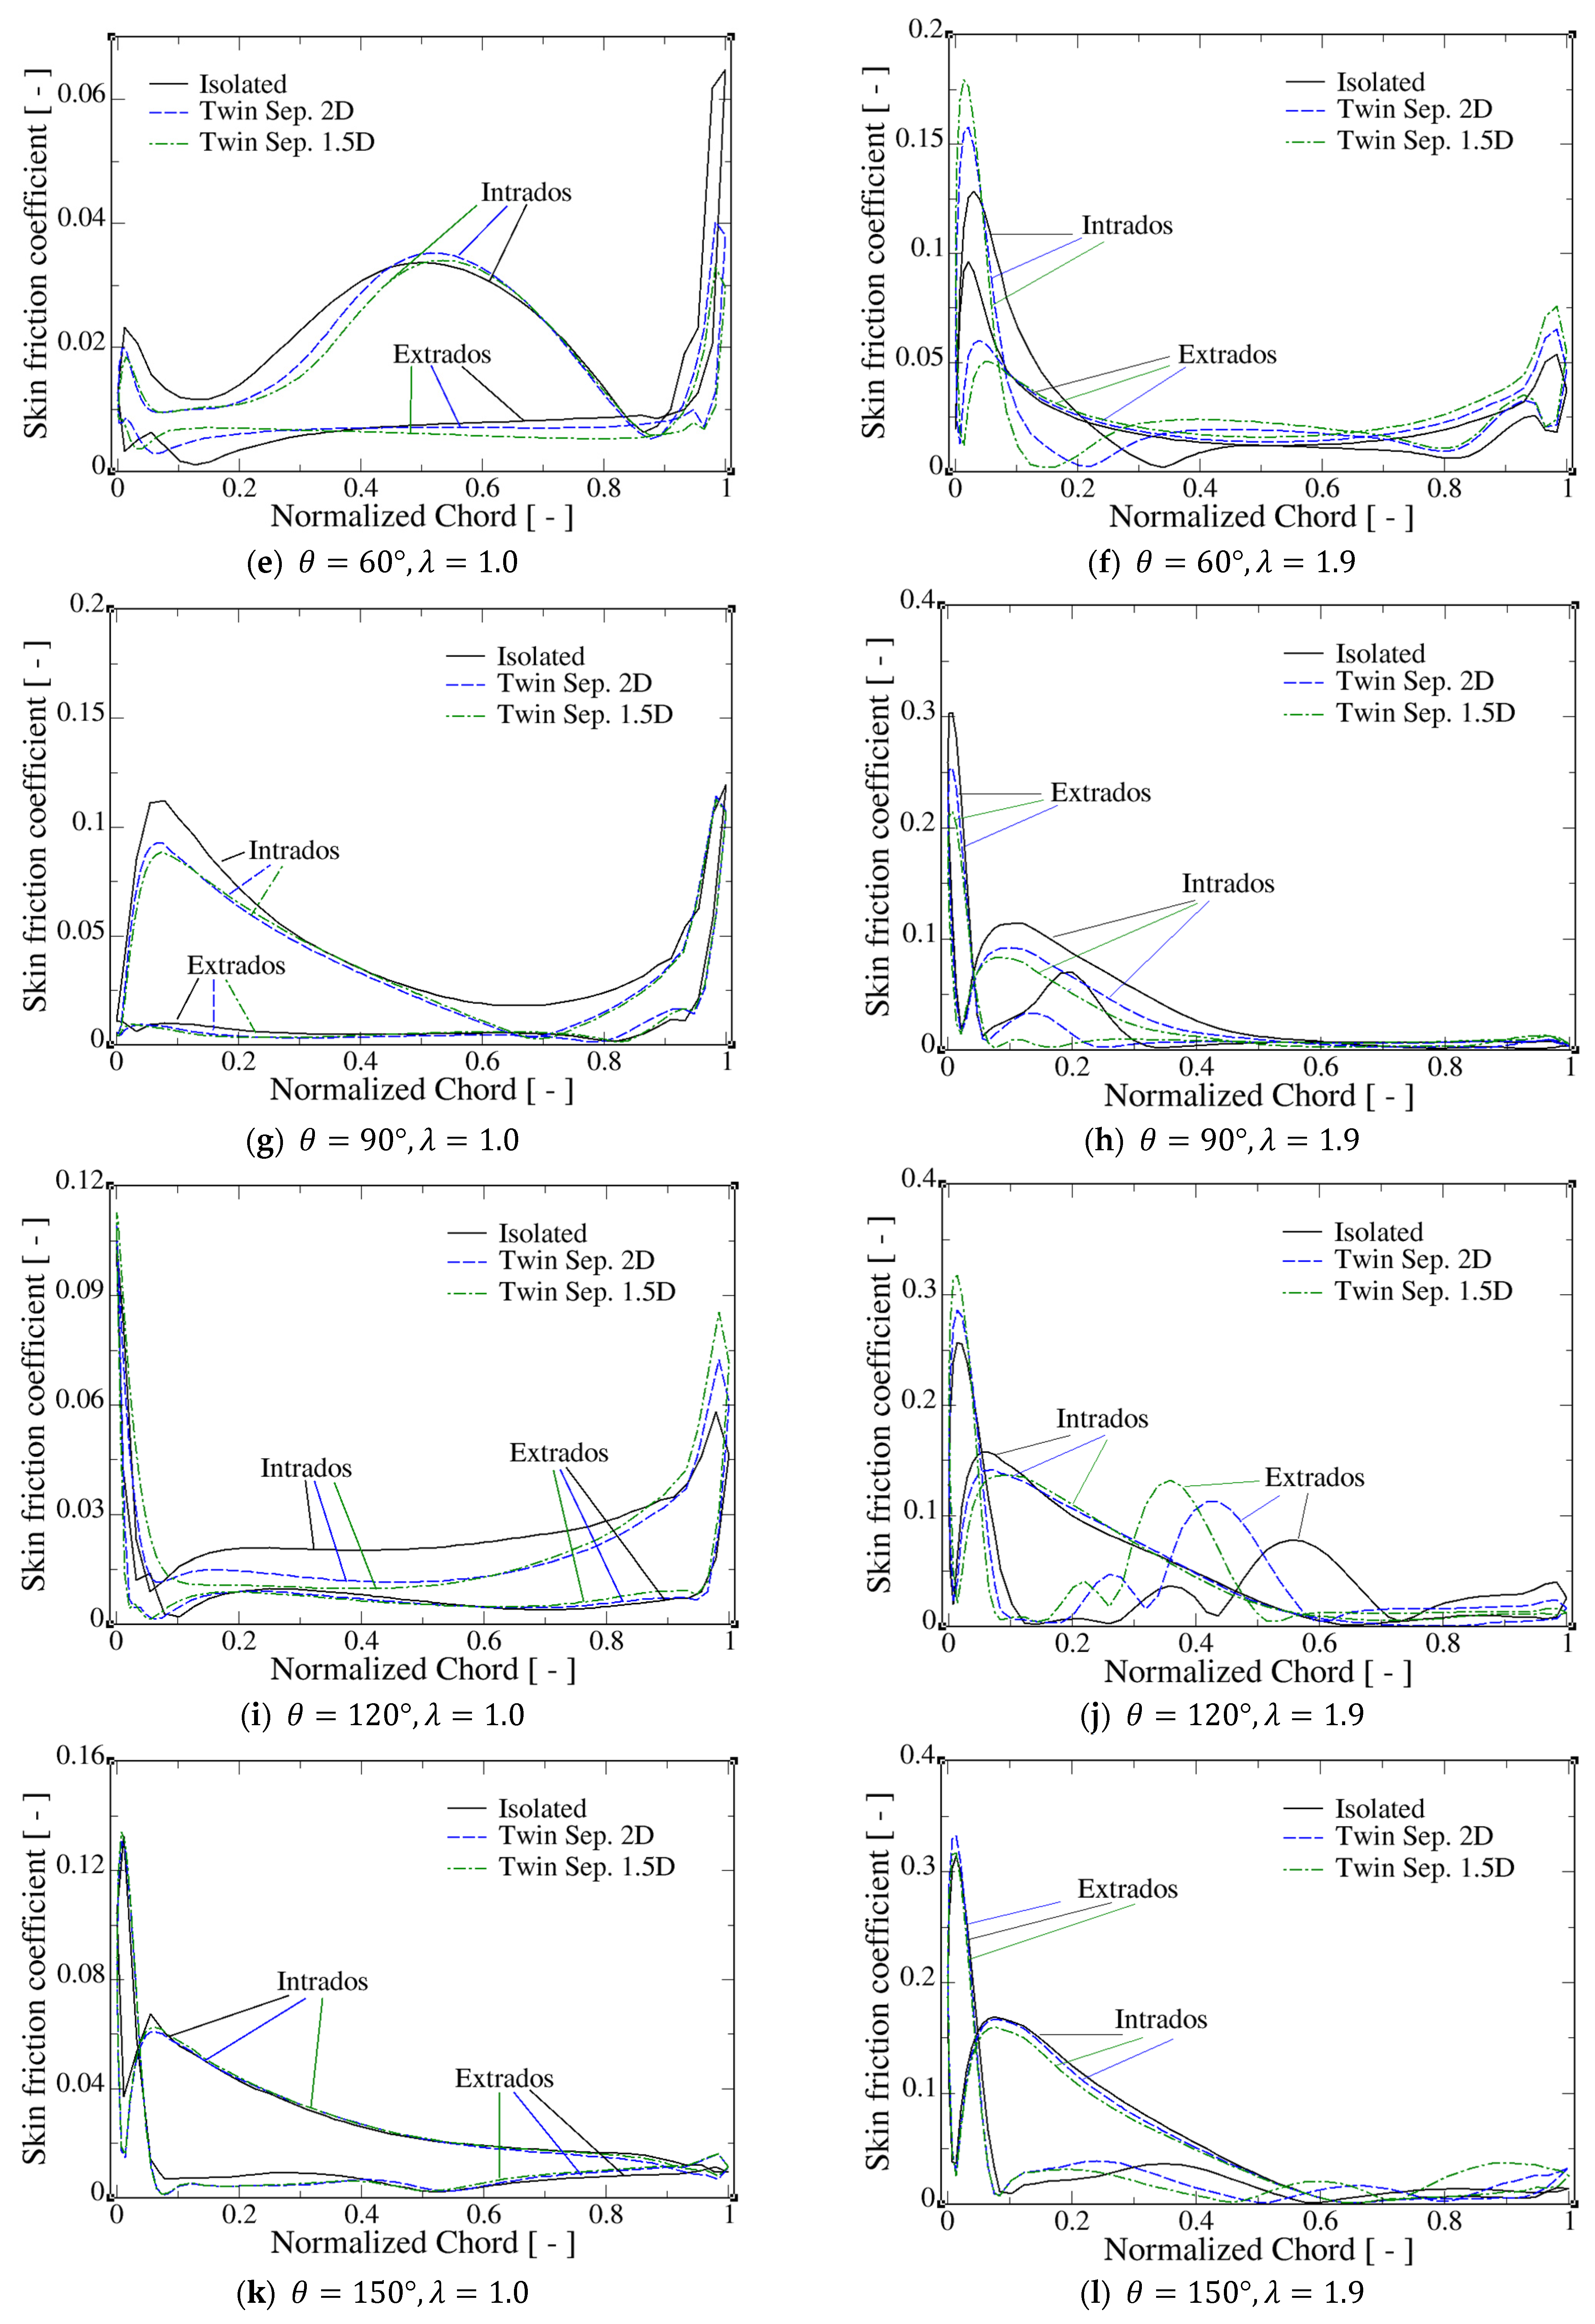
Here, both coefficients have been extracted at blade mid-span, i.e., z = 0 , and are presented via the profile normalized chord, where 0 indicates the leading edge (LE) and 1 the trailing edge (TE). Variations in them on T1 with turbine spacing for the most-affected azimuthal locations (referred to Figure 1) from θ = 0 ° to 150 ° are presented in Figure 15 and Figure 16. In these figures, the coefficients on the left column correspond to λ = 1.0 and those on the right column to λ = 1.9 .
Figure 15 shows the pressure coefficient C p for the isolated turbine, TT2D, and TT1.5D configurations. In this context, it is worth noting that the isolated case represents the theoretical condition where turbine spacing tends toward infinity. For a tip speed ratio near the point of maximum efficiency ( λ = 1.0 ) and at θ = 0 ° , 30 ° , reducing the spacing increases the net pressure force acting on the blade—reflected by a greater difference in C p between extrados and intrados—which results in a higher normal force at these azimuthal positions (Figure 15a,c). As such angular locations, the extrados is subjected to positive pressure along the entire chord length, while the intrados experiences suction and displays a C p wavy profile associated with the presence of bound vortices (see Figure 14a). Notably, the C p curves in Figure 15a show a remarkable similarity to those in Figure 17c of [41]. As the angle increases, the region of higher pressure shifts from the extrados to the intrados, reversing the direction of the resulting force and, at θ = 60 ° , the pressure load on the blade decreases as the turbine spacing is reduced. It is also observed that C p is larger in the trailing edge than in the leading edge (see Figure 15e). At an azimuthal angle of 90 ° , the pressure coefficient profiles are very similar across the three configurations, resulting in nearly identical forces. The main difference is a slight shift toward lower positive values as the spacing decreases (Figure 15g). This situation persists at θ = 120 ° , with pressure force directed from the intrados to extrados which again augments with decreasing turbine separation (Figure 15i). For θ = 150 ° , the shape of the C p curves is again very similar with the result of nearly identical net pressure forces in the three configurations. In this case, the pressure coefficient presents a crossover point around 38% of the chord (Figure 15k).
The pressure coefficients for the tip speed ratio λ = 1.9 are displayed in the right column of Figure 15, following the same format as before. At θ = 0 ° , 30 ° (Figure 15b,d), the pressure force increases as turbine spacing is reduced, the same as for λ = 1.0 ; however, the shape of the C p curves is very different, showing the maximum and minimum coefficients very close to the leading edge. On the extrados, a favorable pressure gradient acts along nearly the entire chord, indicating attached flow. In contrast, the intrados is subjected to an adverse pressure gradient that ultimately leads to flow separation (see Figure 14b,d). A similar situation happens for θ = 60 ° (Figure 15f) where a closer spacing corresponds to a larger pressure force. At the lowest blade position, θ = 90 ° (Figure 15h), the pressure in the intrados overcomes that of the extrados, inverting the direction of pressure force, which tends to be reduced as turbines become closer. It can be observed that, for the three configurations, C p on the extrados and intrados are nearly equal over the rear half of the chord. At the azimuthal angle θ = 120 ° (Figure 15j), the pressure coefficient curves display cross-over points: two in the single turbine and one in the twin-turbine cases. The negative bumps of C p observed on the extrados indicate the locations of bound vortex detachment, which occur earlier (i.e., closer to the leading edge) as the turbine spacing decreases (see Figure 14j). However, at θ = 150 ° (Figure 15k) the twin-turbine configuration exhibits two C p cross-over points whereas the isolated turbine case shows only one. The second of them (closer to the TE) is associated with the final phase of bound vortex detachment in the twin-turbine arrangement. In contrast, in the single-turbine case, the corresponding vortex shedding process has already concluded by this azimuthal position and no additional crossover is observed. This observation suggests that reducing turbine spacing delays vortex detachment—a phenomenon linked to performance degradation—as increased vortex shedding correlates with a lower power coefficient.
Figure 16 presents the evolution of the skin friction coefficient C f . As in Figure 15, the curves for λ = 1.0 are presented in the left column and those for λ = 1.9 in the right column. At θ = 0 ° this coefficient displays a clear peak at LE, associated with the stagnation point, of similar magnitude for the three machine spacings. On the intrados, the bumpy shape of the C f curves reveals the presence of bound vortices (see Figure 14a) resulting from stall conditions induced by the higher angle of attack at this azimuthal position. The shape of these curves is very similar to those shown in Figure 19c of [41]. Figure 16c shows C f at θ = 30 ° for the three arrangements. A prominent peak appears at LE of the extrados, followed by a sharp decline and then a rise to a secondary maximum near TE, albeit of lower magnitude. In the isolated turbine case, however, this second peak slightly exceeds the first. On the intrados, the skin coefficient profiles are very similar for both twin-turbine spacings and exhibit higher values than in the isolated case. As in the previous position, the irregular bumpy C f distribution on the intrados is attributed to the presence of bound vortices near the blade surface (see Figure 14c). At θ = 60 ° (Figure 16e), the skin friction coefficient profiles are qualitatively similar across the three configurations. However, at this angular position, the magnitude of the C f peak near TE is significantly larger than that close to LE. Additionally, on the intrados, a distinct bump with a maximum of the coefficient around mid-chord is observed. While the coefficient remains clearly positive, on the extrados the location of the minimum shifts toward LE as turbine separation decreases. Figure 16g shows that, at θ = 90 ° , the skin friction coefficient on the intrados remains higher than on extrados along the entire chord length, exhibiting very low values there. Once again, the C f profiles for the TT2D and TT1.5D configurations are nearly identical, while the isolated turbine case displays higher values on the intrados. At θ = 120 ° , the coefficient exhibits a narrow spike at LE, followed by a rapid decrease, a relatively constant trend, and a second peak close to TE (Figure 16i). The peak values for the side-by-side turbine arrangements are larger than for the isolated case; however, the difference in C f between intrados and extrados decreases as turbine spacing is reduced. At θ = 150 ° (Figure 16k), the skin friction coefficient profiles are very similar for all the machine arrangements, with only minor differences observed between the isolated and twin-turbine cases on the intrados close to LE. At this angular location, the C f peak near TE has disappeared, and a bump is noticeable on the intrados around 10% of the chord length.
The curves of the skin friction coefficient for λ = 1.9 (right column of Figure 16) are discussed in the following. Different from the low tip speed ratio condition, in this case, C f presents a peak on LE for all angular positions. Figure 16b,d shows the corresponding profiles for the three turbine configurations at θ = 0 ° , 30 ° , which are pretty similar in both azimuthal angles; however, the peak at 0 ° is higher than at 30 ° . Differences in C f appear only on the intrados at θ = 30 ° , where in the twin-turbine arrangement its minimum (corresponding to a critical line) shifts from around 20% to approximately 10% of the chord. Additionally, the peak value is slightly lower in the isolated case. At θ = 60 ° (Figure 16f), the skin friction coefficient curves are qualitatively similar to those at previous angular position. However, in this case, the magnitude of the LE peak augments as turbine spacing is reduced, and the position of the critical line shifts toward mid-chord more rapidly with increasing machine separation (see Figure 14f). C f at θ = 90 ° (Figure 16h) remains close to zero along the second half of the chord for all machine configurations, suggesting separated flow conditions; in addition, critical lines near LE now appear in the extrados. Figure 16j presents the corresponding profiles for θ = 120 ° , which reveal distinct critical lines of flow separation and reattachment on the extrados, interpreted as the signature of the detachment process of a bound vortex (see Figure 13b and Figure 14j). This vortex sheds closer to LE in the twin-turbine arrangements than in the isolated configuration. Finally, Figure 16k depicts C f at θ = 150 ° , where the intrados profiles are similar across all three configurations. However, on the extrados, two critical lines are observed on the extrados of the twin-turbine arrangements, compared to only one in the single turbine. This difference is interpreted as a slowdown in the detachment process of the previously mentioned bound vortex.

5. Conclusions

This study dealt with a comprehensive numerical investigation of twin Darrieus hydrokinetic turbines to evaluate their performance and flow interactions. Using unsteady 3D CFD simulations validated against experimental data, the research has examined the impact of turbine spacing, tip speed ratio, and blade angular location on wake structure, energy extraction, and hydrodynamic parameters such as pressure and skin friction coefficients distribution on blade surfaces. The following points summarize the main conclusions.
  • The simulations revealed predominantly symmetrical wake patterns behind the turbines in computational models, contrasting with experimental results which displayed certain asymmetries. However, despite this discrepancy, qualitative agreement was observed in wake evolution and velocity deficits, especially for the flow regions in proximity to the turbines. The experimental wakes showed earlier wake mixing and faster recovery than simulations predicted, likely due to measurement restrictions and flow perturbations not captured in the numerical models.
  • The twin-turbine configuration yielded improved energy extraction compared to single turbines. Specifically, the combined power output was slightly higher than the sum of individual performances, primarily owing to the interactions between turbines that affected flow acceleration and wake interactions. In particular, the TT2D configuration showed an increase of approximately 40% in the mean power coefficient compared with the single-turbine case. Further reducing the spacing between turbines in the TT1.5D configuration resulted only in a marginal variation of C P , which became negligible at the optimal tip speed ratio of λ = 1.0 . Although wake recovery was slower in the twin system, the overall efficiency gains underscored the potential benefits of turbine clustering for deploying in real-world riverine and tidal flows.
  • Visualization of flow structures and analysis of skin friction and pressure coefficient distributions across the blade surfaces quantified the impact of turbine interactions on blade hydrodynamics. Specifically, in the twin-turbine configuration, the bound vortex detachment process is slowed compared to the single-turbine case, altering the distribution of friction lines on the intrados and extrados and thereby modifying the hydrodynamic forces acting on the blades. This delayed vortex shedding, induced by the interaction between the turbine blades at the angular positions where they are closest to each other, produces a temporary increase in lift, which accounts for the torque enhancement observed in the twin-turbine arrangement.
  • The limitations of the present work are mainly associated with the symmetrical boundary conditions imposed at the flume free surface and with the turbulence model employed. To address cases with lower turbine immersion depths, proper modeling of free surface deformation is required (e.g., through VOF techniques). Likewise, high-fidelity simulations within the Large Eddy Simulation framework would provide a more detailed resolution of wake development. However, implementing both approaches would substantially increase the computational cost, and this challenge will be addressed in our future work.
As a final remark, the findings reinforce the potential of vertical-axis hydrokinetic turbines, especially when configured in pairs or arrays, as viable options for decentralized power generation in water current environments. Properly optimized turbine spacing and design can mitigate efficiency losses caused by wake interactions, leading to more effective harnessing of kinetic water energy.

Author Contributions

Conceptualization, S.L., A.B.-M. and P.O.; methodology, S.L., A.B.-M. and P.O.; software, S.L. and M.V.; validation, S.L. and M.V.; formal analysis, S.L., A.B.-M. and P.O.; investigation, S.L., M.V., A.B.-M. and P.O.; resources, S.L.; data curation, S.L. and M.V.; writing—original draft preparation, S.L. and M.V.; writing—review and editing, S.L., A.B.-M. and P.O.; visualization, S.L. and M.V.; supervision, S.L. and A.B.-M.; project administration, S.L.; funding acquisition, S.L. All authors have read and agreed to the published version of the manuscript.

Funding

This research received no external funding.

Data Availability Statement

The raw data supporting the conclusions of this article will be made available by the authors on request.

Acknowledgments

Computational resources were provided by Universidad Autónoma de Occidente.

Conflicts of Interest

The authors declare no conflicts of interest.

References

  1. Bakken, T.H.; Sundt, H.; Ruud, A.; Harby, A. Development of Small Versus Large Hydropower in Norway—Comparison of Environmental Impacts. Energy Procedia 2012, 20, 185–199. [Google Scholar] [CrossRef]
  2. Lain, S.; Lopez Mejia, O.D. Special Issue on “CFD Modelling and Simulation of Water Turbines”. Processes 2022, 10, 2410. [Google Scholar] [CrossRef]
  3. Reddy, K.B.; Bhosale, A.C.; Saini, R.P. Performance parameters of lift-based vertical axis hydrokinetic turbines—A review. Ocean Eng. 2022, 266, 113089. [Google Scholar] [CrossRef]
  4. Kinzel, M.; Araya, D.B.; Dabiri, J.O. Turbulence in vertical axis wind turbine canopies. Phys. Fluids 2015, 27, 115102. [Google Scholar] [CrossRef]
  5. Gorlov, A. Development of the Helical Reaction Hydraulic Turbine; Final Technical Report; Northeastern University: Boston, MA, USA, 1998. [Google Scholar] [CrossRef]
  6. Mejia, O.D.L.; Quiñones, J.J.; Laín, S. RANS and Hybrid RANS-LES Simulations of an H-Type Darrieus Vertical Axis Water Turbine. Energies 2018, 11, 2348. [Google Scholar] [CrossRef]
  7. López, O.D.; Mejia, O.E.; Escorcia, K.M.; Suarez, F.; Lain, S. Comparison of Sliding and Overset Mesh Techniques in the Simulation of a Vertical Axis Turbine for Hydrokinetic Applications. Processes 2021, 9, 1933. [Google Scholar] [CrossRef]
  8. Lain, S.; Taborda, M.A.; López, O.D. Numerical Study of the Effect of Winglets on the Performance of a Straight Blade Darrieus Water Turbine. Energies 2018, 11, 297. [Google Scholar] [CrossRef]
  9. Kunasekaran, M.; Hyung Rhee, S.; Venkatesan, N.; Samad, A. Design optimization of a marine current turbine having winglet on blade. Ocean Eng. 2021, 239, 109877. [Google Scholar] [CrossRef]
  10. Barbarić, M.; Batistić, I.; Guzović, Z. Numerical study of the flow field around hydrokinetic turbines with winglets on the blades. Renew. Energy 2022, 192, 692–704. [Google Scholar] [CrossRef]
  11. Wang, Y.; Guo, B.; Jing, F.; Mei, Y. Hydrodynamic performance and flow field characteristics of tidal current energy turbine with and without winglets. J. Mar. Sci. Eng. 2023, 11, 2344. [Google Scholar] [CrossRef]
  12. El-Sawy, M.; Shehata, A.S.; Elbatran, A.H.A.; Tawfiq, A. Numerical simulation of flow in hydrokinetic turbine channel to improve its efficiency by using first and second-law efficiency analysis. Ocean Eng. 2022, 244, 110400. [Google Scholar] [CrossRef]
  13. Doan, M.N.; Obi, S. Numerical study of the dynamic stall effect on a pair of cross-flow hydrokinetic turbines and associated torque enhancement due to flow blockage. J. Mar. Sci. Eng. 2021, 9, 829. [Google Scholar] [CrossRef]
  14. Guillaud, N.; Balarac, G.; Goncalvès, E.; Zanette, J. Large Eddy Simulations on Vertical Axis Hydrokinetic Turbines—Power coefficient analysis for various solidities. Renew. Energy 2020, 147, 473–486. [Google Scholar] [CrossRef]
  15. Ouro, P.; Runge, S.; Luo, Q.; Stoesser, T. Three-dimensionality of the wake recovery behind a vertical axis turbine. Renew. Energy 2019, 133, 1066–1077. [Google Scholar] [CrossRef]
  16. Müller, S.; Muhawenimana, V.; Sonnino-Sorisio, G.; Wilson, C.A.M.E.; Cable, J.; Ouro, P. Fish response to the presence of hydrokinetic turbines as a sustainable energy solution. Sci. Rep. 2023, 13, 7459. [Google Scholar] [CrossRef]
  17. Lust, E.E.; Bailin, B.H.; Flack, K.A. Performance characteristics of a cross-flow hydrokinetic turbine in current only and current and wave conditions. Ocean Eng. 2021, 219, 108362. [Google Scholar] [CrossRef]
  18. Gauvin-Tremblay, O.; Dumas, G. Two-way interaction between river and deployed cross-flow hydrokinetic turbines. J. Renew. Sustain. Energy 2020, 12, 034501. [Google Scholar] [CrossRef]
  19. Gauvin-Tremblay, O.; Dumas, G. Hydrokinetic turbine array analysis and optimization integrating blockage effects and turbine-wake interactions. Renew. Energy 2022, 181, 851–869. [Google Scholar] [CrossRef]
  20. Morales-Ramirez, C.M.; Benavides-Morán, A.; López-Mejía, O.D. Integrated overset mesh and volume of fluid method for modeling free-surface dynamics in vertical axis hydrokinetic turbines at low Reynolds numbers. Phys. Fluids 2025, 37, 037106. [Google Scholar] [CrossRef]
  21. Alkan, E.; Yuce, M.I.; Öztürkmen, G. Evaluation of Wake Structure Induced by Helical Hydrokinetic Turbine. Water 2025, 17, 2203. [Google Scholar] [CrossRef]
  22. Runge, S.; Stoesser, T.; Morris, E.; White, M. Technology Readiness of a Vertical-Axis Hydro-Kinetic Turbine. J. Power Energy Eng. 2018, 6, 63–85. [Google Scholar] [CrossRef]
  23. El Fajri, O.; Bhushan, S.; Thompson, D.; O’Doherty, T. Numerical investigation of shallow-water effects on hydrokinetic turbine wake recovery. Int. Mar. Energy J. 2020, 3, 25–35. [Google Scholar] [CrossRef]
  24. Dong, G.; Zhao, Z.; Xu, C.; Qin, J. Wake dynamics of side-by-side hydrokinetic turbines in open channel flows. Phys. Fluids 2024, 36, 115166. [Google Scholar] [CrossRef]
  25. Müller, S.; Muhawenimana, V.; Wilson, C.A.M.E.; Ouro, P. Experimental investigation of the wake characteristics behind twin vertical axis turbines. Energy Convers. Manag. 2021, 247, 114768. [Google Scholar] [CrossRef]
  26. Zhang, A.; Liu, S.; Ma, Y.; Hu, C.; Li, Z. Field tests on model efficiency of twin vertical axis helical hydrokinetic turbines. Energy 2022, 247, 123376. [Google Scholar] [CrossRef]
  27. Moreau, M.; Germain, G.; Maurice, G. Experimental performance and wake study of a ducted twin vertical axis turbine in ebb and flood tide currents at a 1/20th scale. Renew. Energy 2023, 214, 318–333. [Google Scholar] [CrossRef]
  28. Ma, Y.; Zhu, Y.; Zhang, A.; Hu, C.; Liu, S.; Li, Z. Hydrodynamic performance of vertical axis hydrokinetic turbine based on Taguchi method. Renew. Energy 2022, 186, 573–584. [Google Scholar] [CrossRef]
  29. Chen, D.; Ma, Y.; Hu, C.; Zhao, T. Efficiency optimization of twin vertical-axis helical hydrokinetic turbines (VAHHTs) based on Taguchi method. Appl. Ocean Res. 2023, 138, 103618. [Google Scholar] [CrossRef]
  30. Ma, Y.; Hu, C.; Li, Y.; Li, L.; Deng, R.; Jiang, D. Hydrodynamic Performance Analysis of the Vertical Axis Twin-Rotor Tidal Current Turbine. Water 2018, 10, 1694. [Google Scholar] [CrossRef]
  31. Widyawan, H.B.; Satrio, D.; Mukhtasor. Numerical Investigation of Vertical-Axis Hydrokinetic Turbine on Side-by-Side Configuration. J. Phys. Conf. Ser. 2024, 2828, 012027. [Google Scholar] [CrossRef]
  32. Mohamed, O.S.; Melani, P.F.; Soraperra, G.; Brighenti, A.; Ferrara, G.; Betti, V.; Schippa, L.; Guerrero, M.; Balduzzi, F.; Bianchini, A. Three-dimensional CFD-ALM-VOF modeling of hydrokinetic turbines in realistic open-channel conditions. Ocean Eng. 2024, 313, 119411. [Google Scholar] [CrossRef]
  33. Sørensen, J.N.; Shen, W.Z. Numerical Modeling of Wind Turbine Wakes. J. Fluids Eng. 2002, 124, 393–399. [Google Scholar] [CrossRef]
  34. Posa, A. Wake characterization of coupled configurations of vertical axis wind turbines using Large Eddy Simulation. Int. J. Heat Fluid Flow 2019, 75, 27–43. [Google Scholar] [CrossRef]
  35. Posa, A. Dependence of the wake recovery downstream of a Vertical Axis Wind Turbine on its dynamic solidity. J. Wind. Eng. Ind. Aerodyn. 2020, 202, 104212. [Google Scholar] [CrossRef]
  36. Mohamed, O.S.; Melani, P.F.; Soraperra, G.; Brighenti, A.; Ferrara, G.; Betti, V.; Balduzzi, F.; Bianchini, A. Development of a computationally efficient CFD model for vertical-axis hydrokinetic turbines. Ocean Eng. 2025, 324, 120692. [Google Scholar] [CrossRef]
  37. Cacciali, L.; Battisti, L.; Dell’Anna, S. Multi-Array Design for Hydrokinetic Turbines in Hydropower Canals. Energies 2023, 16, 2279. [Google Scholar] [CrossRef]
  38. Velásquez, L.; Rengifo, J.; Saldarriaga, A.; Rubio-Clemente, A.; Chica, E. Optimization of Vertical-Axis Hydrokinetic Turbines: Study of Various Geometric Configurations Using the Response Surface Methodology and Multi-Criteria Decision Matrices. Processes 2025, 13, 1950. [Google Scholar] [CrossRef]
  39. Manwell, J.F.; McGowan, J.G.; Rogers, A.L. Wind Energy Explained: Theory, Design and Application, 2nd ed.; Wiley: Chichester, UK, 2009. [Google Scholar]
  40. Roy, S.; Branger, H.; Luneau, C.; Bourras, D.; Paillard, B. Design of an offshore three-bladed vertical axis wind turbine for wind tunnel experiments. OMAE2017-61512. In Proceedings of the ASME 2017 36th International Conference on Ocean, Offshore and Arctic Engineering OMAE2017, Trondheim, Norway, 25–30 June 2017. [Google Scholar] [CrossRef]
  41. López, O.D.; Botero, N.; Nunez, E.E.; Lain, S. Performance Improvement of a Straight-Bladed Darrieus Hydrokinetic Turbine through Enhanced Winglet Designs. J. Mar. Sci. Technol. 2024, 12, 977. [Google Scholar] [CrossRef]
  42. Handa, B. Three-Dimensional Computational Fluid Dynamic Analysis of a Large-Scale Vertical Axis Wind Turbine. J. Aerosp. Eng. Mech. 2021, 5, 417–440. [Google Scholar] [CrossRef]
  43. Raciti-Castelli, M.; Englaro, A.; Benini, E. The Darrieus wind turbine: Proposal for a new performance prediction model based on CFD. Energy 2011, 36, 4919–4934. [Google Scholar] [CrossRef]
  44. Fertahi, S.D.; Samaouali, A.; Kadiri, I. CFD comparison of 2D and 3D aerodynamics in H-Darrieus prototype wake. E-Prime Adv. Electr. Eng. Electron. Energy 2023, 4, 100178. [Google Scholar] [CrossRef]
  45. Contreras, L.T.; Lopez, O.D.; Lain, S. Computational Fluid Dynamics Modelling and Simulation of an Inclined Horizontal Axis Hydrokinetic Turbine. Energies 2018, 11, 3151. [Google Scholar] [CrossRef]
  46. Gebreslassie, M.G.; Sanchez, S.O.; Tabor, G.R.; Belmont, M.R.; Bruce, T.; Payne, G.S.; Moon, I. Experimental and CFD analysis of the wake characteristics of tidal turbines. Int. J. Mar. Energy 2016, 16, 209–219. [Google Scholar] [CrossRef]
  47. McNaughton, J.; Afgan, I.; Apsley, D.D.; Rolfo, S.; Stallard, T.; Stansby, P.K. A simple sliding-mesh interface procedure and its application to the CFD simulation of a tidal-stream turbine. Int. J. Numer. Methods Fluids 2014, 74, 250–269. [Google Scholar] [CrossRef]
  48. Steger, J.L.; Dougherty, F.; Benet, J.A. A Chimera Grid Scheme; American Society of Mechanical Engineers, Fluids Engineering Division (Publication) FED: New York, NY, USA, 1983; Volume 5. [Google Scholar]
  49. Menter, F.J. Two-Equation Eddy-Viscosity Turbulence Models for Engineering Applications. AIAA J. 1994, 32, 269–289. [Google Scholar] [CrossRef]
  50. Langtry, R.B.; Menter, F.R. Correlation-based transition modeling for unstructured parallelized computational fluid dynamics codes. AIAA J. 2009, 47, 2894–2906. [Google Scholar] [CrossRef]
  51. Karakaya, D.; Elçi, S. Numerical Assessment of Vertical Axis Hydrokinetic Turbine Efficiencies With Different Grate Protections. IET Renew. Power Gener. 2025, 19, e70060. [Google Scholar] [CrossRef]
  52. Yagmur, S.; Kose, F.; Dogan, S. A study on performance and flow characteristics of single and double H-type Darrieus turbine for a hydro farm application. Energy Convers. Manag. 2021, 245, 114599. [Google Scholar] [CrossRef]
  53. Du, L. Numerical and Experimental Investigations of Darrieus Wind Turbine Start-Up and Operation. Ph.D. Thesis, Durham University, Durham, UK, 2016. Available online: http://etheses.dur.ac.uk/11384/1/Longhuan_Du_Thesis.pdf?DDD10+ (accessed on 20 November 2024).
  54. Spentzos, A.; Barakos, G.; Badcock, K.; Richards, B.; Wernert, P.; Schreck, S.; Raffel, M. Investigation of Three-Dimensional Dynamic Stall Using Computational Fluid Dynamics. AIAA J. 2005, 43, 1023–1033. [Google Scholar] [CrossRef]
  55. Tobak, M.; Peak, D.J. Topology of three-dimensional separated flows. Annu. Rev. Fluid. Mech. 1982, 14, 61–85. [Google Scholar] [CrossRef]
  56. Laín, S.; Cortés, P.; López, O.D. Numerical Simulation of the Flow around a Straight Blade Darrieus Water Turbine. Energies 2020, 13, 1137. [Google Scholar] [CrossRef]
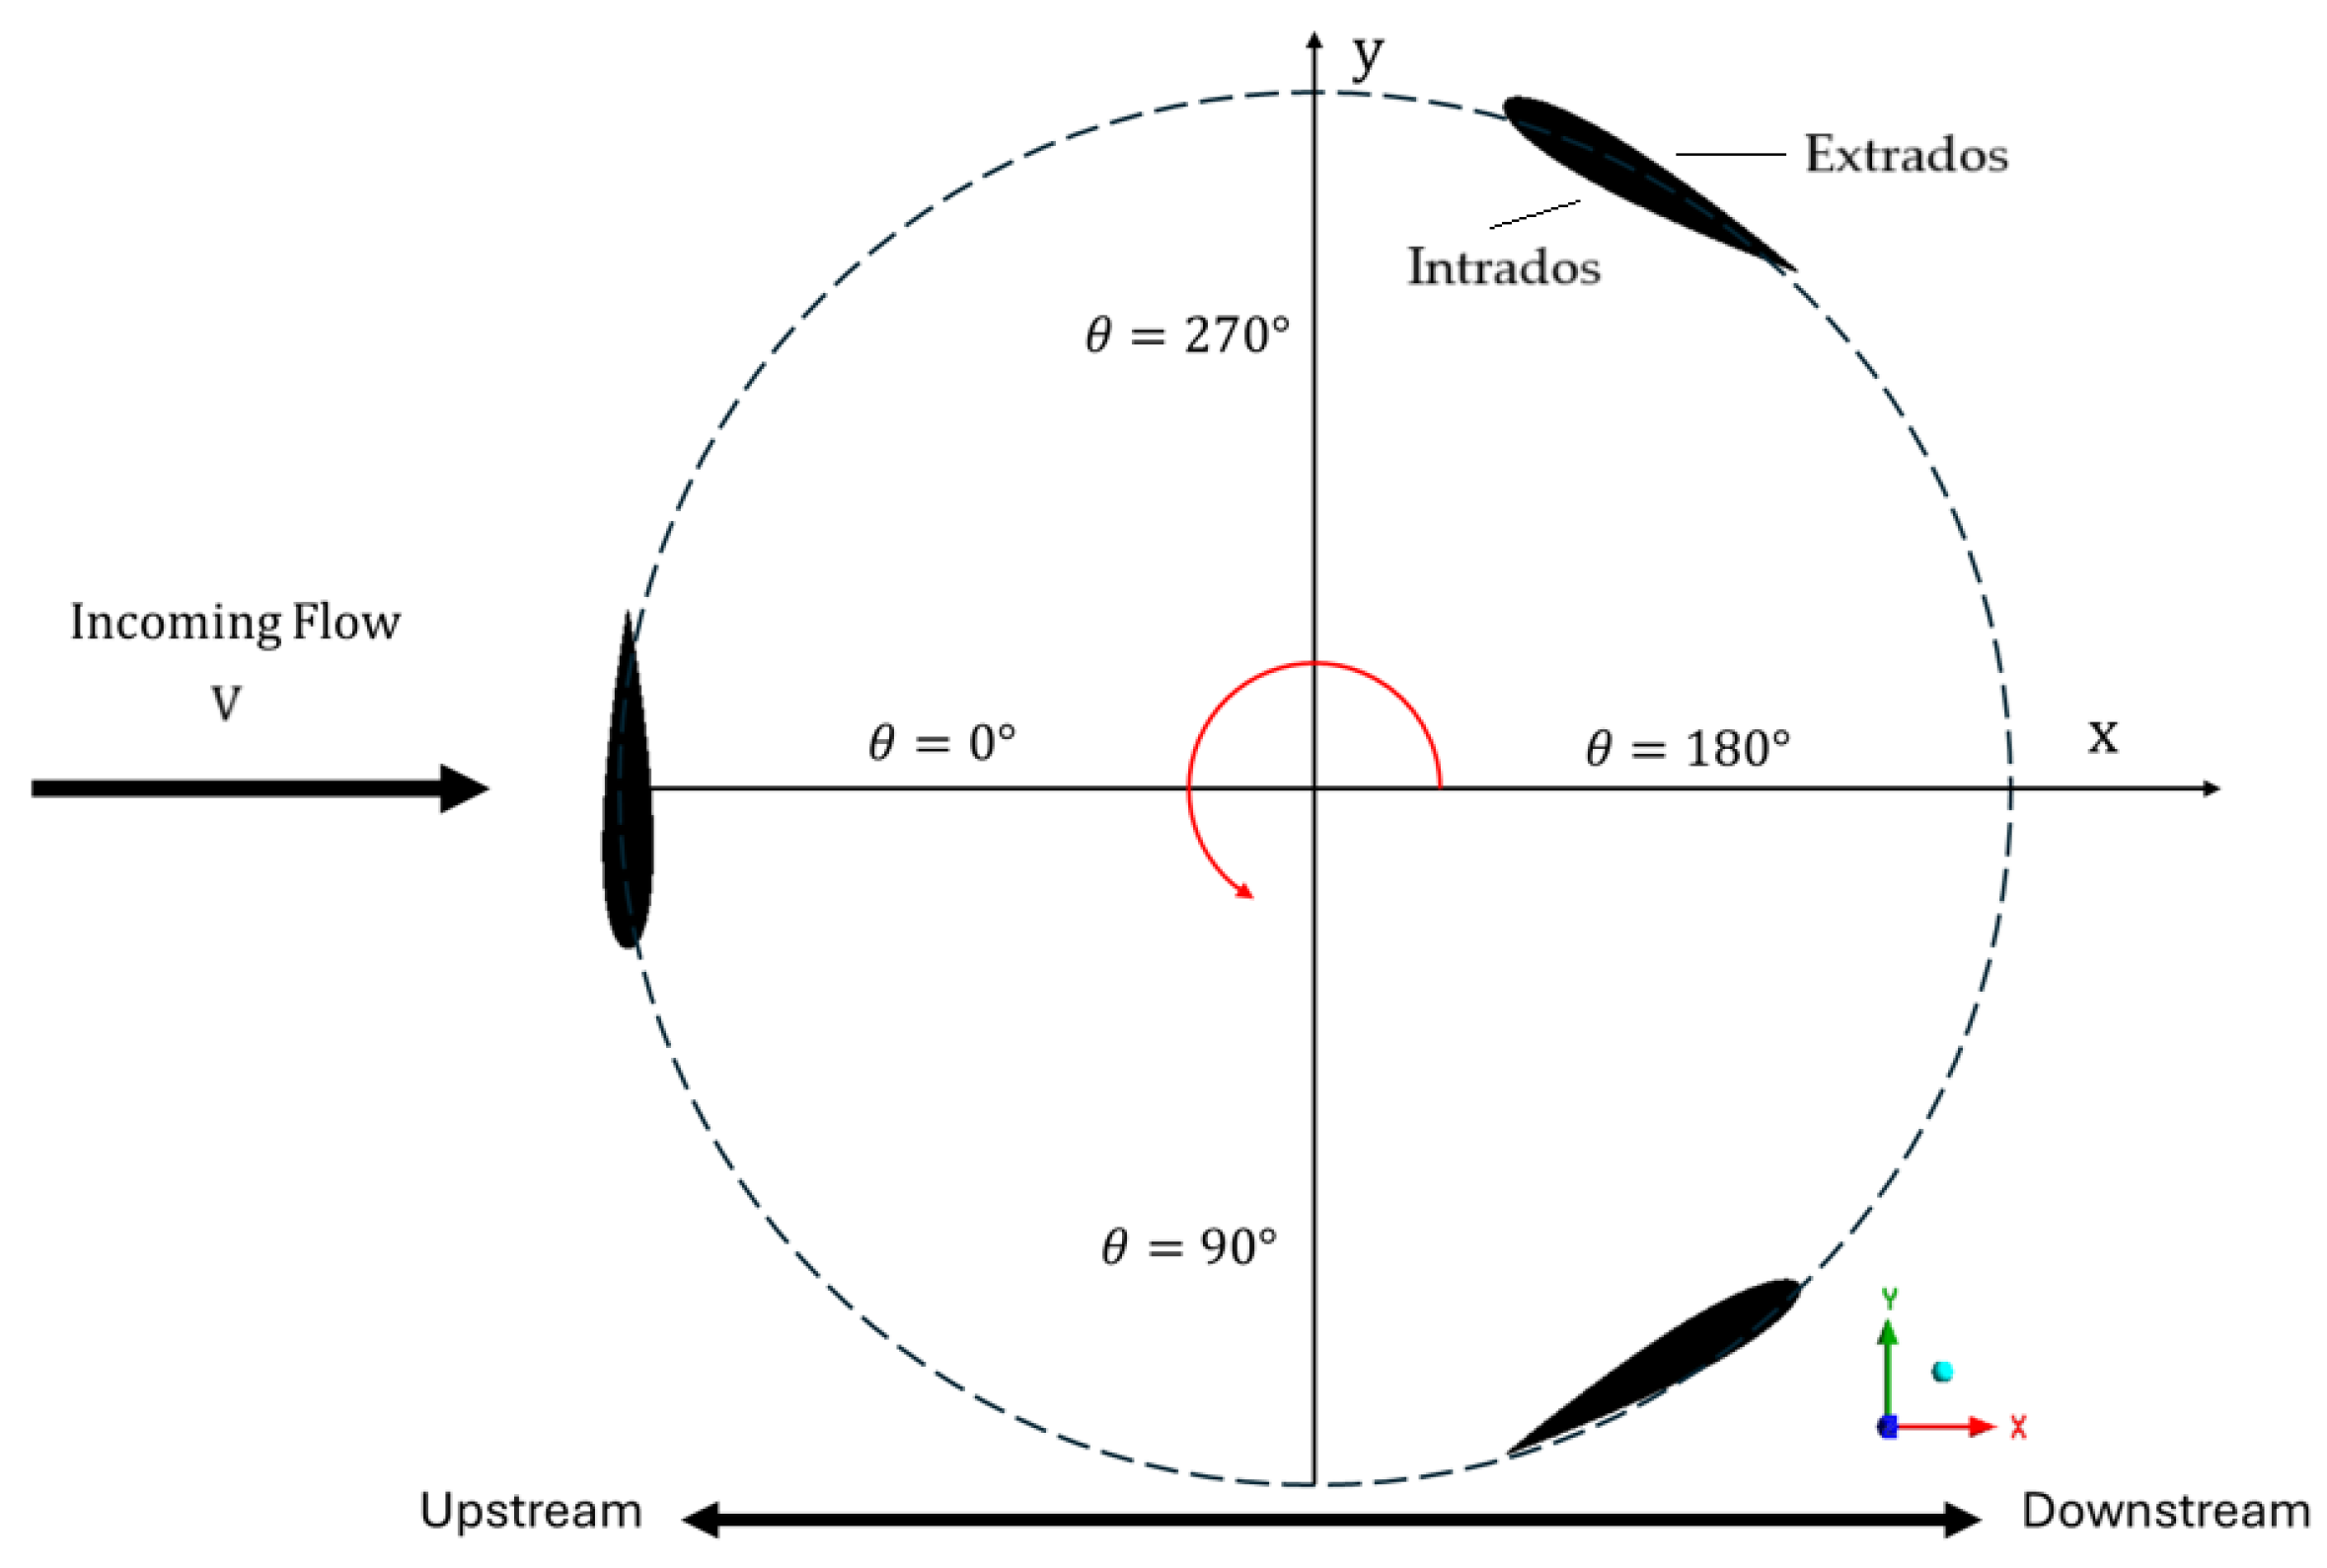
Figure 1. Sketch of the geometrical configuration of the flow around the turbine. Extrados (outer) and intrados (inner) blade surfaces are also identified.
Jmse 13 01947 g001
Figure 2. Sketch of the employed computational domain illustrating the boundary conditions.
Jmse 13 01947 g002
Figure 3. Schematics of the mesh employed in the twin-turbine configuration. (a) Full view; (b) details of the OM around a single blade. Flow develops along the positive direction of x-axis.
Jmse 13 01947 g003
Figure 4. Results of the verification study for the turbine considered in [25] at λ = 1.9 . (a) Average torque coefficient values; (b) C m evolution along a revolution for the three employed grids.
Jmse 13 01947 g004
Figure 5. Performance curves C P ( λ ) of the Yagmur et al. [52] water turbine (a) and Du [53] wind turbine (b). Comparison of present numerical results (squares) versus reference data.
Jmse 13 01947 g005
Figure 6. Contour plots of simulated instantaneous normalized stream-wise velocity. (a) Top view at mid-span ( z = 0 ); (b) side view at channel center ( y = 0 ). Flow progresses along the positive x -direction and turbine rotates counterclockwise.
Jmse 13 01947 g006
Figure 7. Illustration of the flow in the wake of the single-turbine configuration. Comparison of the normalized mean stream-wise velocity experimentally obtained in [25] (left column) and the present numerical computations (right column) at different cross-sections x / D downstream the turbine. The black rectangle represents the perimeter of the turbine rotor.
Jmse 13 01947 g007
Figure 8. Performance curve C P ( λ ) of the Müller et al. [25] isolated water turbine (a) and instantaneous power coefficient for the considered values of λ as functions of the azimuthal angle θ (b).
Jmse 13 01947 g008
Figure 9. Performance curve C P ( λ ) of the Müller et al. [25] twin-turbine configuration for different separations (a) and instantaneous power coefficient for the considered values of λ as functions of the azimuthal angle θ for the 2D-spacing turbine arrangement (b).
Jmse 13 01947 g009
Figure 10. Evolution of the power coefficient over one revolution for different turbine spacings at a tip speed ratio of λ = 1.9 .
Jmse 13 01947 g010
Figure 11. Contour plot of simulated instantaneous normalized stream-wise velocity field around the TT2D in the counter-rotating forward configuration at λ = 1.9 . Flow progresses along the positive x -direction, top view at mid-span ( z = 0 ).
Jmse 13 01947 g011
Figure 12. Illustration of the flow in the wake of the twin-turbine TT2D configuration at λ = 1.9 . Comparison of the normalized mean stream-wise velocity experimentally obtained in [25] (left column) and the present numerical computations (right column) at different cross-sections x / D behind the turbine. The black rectangles represent the perimeter of the turbine rotors.
Jmse 13 01947 g012
Figure 13. Illustration of the flow around the twin-turbine arrangement with 2D spacing. (a) λ = 1.0 ; (b) λ = 1.9 . Contour plot on the horizontal plain z = 1 cm above the channel bottom wall. Flow structures visualized by isosurfaces of Q-criterion Q = 100 s−2. Flow progresses along the positive x -axis.
Jmse 13 01947 g013
Figure 14. Friction lines and skin friction coefficient contour plots of the first blade of turbine 1 (T1) at six azimuthal locations θ = 0 ° , 30 ° , 60 ° , 90 ° , 120 ° , 150 ° for two tip speed ratios, λ = 1.0 (left column) and λ = 1.9 (right column). Comparison of isolated and TT2D configurations.
Jmse 13 01947 g014aJmse 13 01947 g014b
Figure 15. Comparison of profiles of pressure coefficient at λ = 1.0 (left column) and λ = 1.9 (right column) at mid-span of turbine 1 (T1) for different turbine separations and at six azimuthal locations θ = 0 ° , 30 ° , 60 ° , 90 ° , 120 ° , 150 ° .
Jmse 13 01947 g015aJmse 13 01947 g015b
Figure 16. Comparison of profiles of skin friction coefficient at λ = 1 (left column) and λ = 1.9 (right column) at mid-span of turbine 1 (T1) for different turbine separations and at six azimuthal locations θ = 0 ° , 30 ° , 60 ° ,   90 ° ,   120 ° ,   150 ° .
Jmse 13 01947 g016aJmse 13 01947 g016b
Table 1. Geometrical parameters of the turbine [25].
ParameterValue
Profile of the bladesNACA0015
Turbine diameter ( D )0.12 m
Blade span ( H )0.12 m
Chord length ( c )0.03 m
Number of blades ( N )3
Solidity σ = N c / π D 0.24
Table 2. Hydraulic parameters of the experimental flume [25].
ParameterValue
Volumetric flow Q 5.3 × 10 3 m3/s
Flow depth h 0 0.23 m
Average upstream velocity U 0 0.19 m/s
Bulk Reynolds number R e 31,600
Froude number F r 0.13
Table 3. Distribution of cells among the domains in the grid independence study.
Cell Number in Domain (in Million)
GridBackground Overset   ( × 3 )Total
Coarse1.320.432.6
Medium1.850.784.2
Fine2.581.176.1
Table 4. Geometrical parameters of the turbines of Yagmur et al. [52] and Du [53].
ParameterYagmur et al. [52]Du [53]
Profile of the bladesNACA4415NACA0021
Turbine radius ( R )0.125 m0.3 m
Blade span ( H )0.3 m0.7 m
Chord length ( c )0.1 m0.1 m
Number of blades ( N )33
Solidity σ = N c / π D 0.380.16
Disclaimer/Publisher’s Note: The statements, opinions and data contained in all publications are solely those of the individual author(s) and contributor(s) and not of MDPI and/or the editor(s). MDPI and/or the editor(s) disclaim responsibility for any injury to people or property resulting from any ideas, methods, instructions or products referred to in the content.