Article

Mechanism and Optimization of Acoustic Absorption of an Underwater Lattice-Reinforced Meta-Absorber

1
College of Intelligence Science and Technology, National University of Defense Technology, Changsha 410073, China
2
National Key Laboratory of Equipment State Sensing and Smart Support, National University of Defense Technology, Changsha 410073, China
*
Author to whom correspondence should be addressed.
J. Mar. Sci. Eng. 2025, 13(10), 1944; https://doi.org/10.3390/jmse13101944
Submission received: 25 August 2025 / Revised: 18 September 2025 / Accepted: 30 September 2025 / Published: 11 October 2025
(This article belongs to the Section Ocean Engineering)

Abstract

Conventional rubber-based absorbers containing cavities exhibit a decline in acoustic absorption as hydrostatic pressure rises. To improve sound absorption performance under hydrostatic pressure, a lattice-reinforced meta-absorber (LRMA) is proposed in this paper. The rubber layer is embedded with periodic cavities and aluminum pipes as a lattice reinforcement structure. The energy dissipation density, displacement field, and surface acoustic impedance are employed to reveal the sound absorption mechanism of the LRMA. Then, the collaborative design of material and structure for the LRMA is optimized using a differential evolution algorithm. Finally, the experiment verifies that the average sound absorption coefficient is above 0.9 in the frequency range of 500–5000 Hz under hydrostatic pressure of 1 MPa, 2 MPa, and 3 MPa. The results show that the face sheet and the lattice reinforcement structure have good hydrostatic pressure resistance.

1. Introduction

With the advancement of deep-sea detection technology, there is an increasing demand to improve the low-frequency and broadband acoustic stealth of underwater vehicles under high hydrostatic pressure. Underwater vehicles are crucial for maintaining naval superiority. To enhance their survivability, an important approach is to reduce their detectability through the application of acoustic coatings on the hull. These coatings help suppress acoustic scattering, thereby reducing the echo signal perceived by active sonar systems and making it more challenging to be detected [1,2,3]. Enhancement of low-frequency acoustic absorption through material and structural design improves the acoustic stealth capabilities of underwater vehicles [4,5,6]. Early underwater sound-absorber, such as the Alberich tiles used on World War II submarines, utilized cavities in rubber to achieve sound absorption through impedance mismatch and resonance mechanisms. Recent studies have further explored and optimized such systems for modern application, including different shapes of cavities [7,8,9,10], localized resonance units [11,12,13], and various metastructures inspired by the theoretical frameworks established in transformation acoustics and metamaterial research [14,15,16,17,18,19,20,21,22]. The parameters of the rubber matrix can be tuned according to the requirement arranged with a gradient impedance [23,24,25]. Combining two or more acoustic-absorbing structures within the rubber layer is a common approach to achieve broadband sound absorption [26,27,28,29,30].
The low-frequency absorption performance of an acoustic absorber is generally decreased under increasing hydrostatic pressure. If the pressure rises to a specific threshold, the absorber’s internal acoustic structure might be damaged, resulting in failure of acoustic performance of the absorber. Therefore, it is essential to improve the low-frequency absorption performance of the absorber under hydrostatic pressure [31,32,33,34]. Zhang et al. designed a tree-shaped acoustic black hole unit embedded in an elastomer matrix. Experimental verification shows that the average sound absorption coefficient exceeds 0.92 at 0.1, 0.5, and 1.0 MPa in the range of 1200–7500 Hz. At 4.5 MPa, the average sound absorption coefficient in the range of 3–10 kHz is greater than 0.6 [35]. Gao et al. compared the acoustic performance of polyurea embedded with different shapes of aluminum foam and pure polyurea. Experimental verification demonstrated that the average sound absorption coefficients of the samples with four small cones and one large cylinder exceeded 0.5 in the frequency range of 0–4000 Hz under 0–5 MPa. The embedding of aluminum foam was thus demonstrated to enhance the sound absorption performance of polyurea under hydrostatic pressure [36]. Jiang et al. designed a phononic glass combine with aluminum foam, compliant and stiff polyurethane. The metal foam is injected with a thin compliant polymer layer (0.3–0.6 mm) and then stiff polymer. The 10-mm-thick phononic glass achieves a sound absorption coefficient exceeding 0.9 between 12 and 30 kHz [37]. Zheng et al. designed a porous metasurface using topology optimization, which was sandwiched between two rubber layers. This structure acquired an average sound absorption coefficient of 0.93 in the frequency range of 1–10 kHz under 3 MPa [38]. Yang et al. embedded a hollow aluminum cylinder in cavity. Above 1.5 kHz, the structure maintains a sound absorption coefficient above 0.4 under 2 MPa [39].
Z-direction (along the acoustic incidence) reinforced structures are another important type of a technical important approach for enhancing sound absorption under hydrostatic pressure. Z-direction reinforced structures are widely used in composite sandwich structures to improve the pressure resistance [38,40,41,42]. Z-direction reinforced structures mainly include lattice reinforcement [43], grid reinforcement [44], stitching reinforcement [45], and Z-Pin reinforcement [46]. Li et al. designed the rubber core sandwich structure with funnel-shaped cavities reinforced by carbon fiber columns (CFCs). Theoretical analysis results show that this lattice reinforcement can improve the structural compressive performance. However, the low-frequency (f < 3 kHz) sound absorption performance is reduced by the CFC [47]. Luo et al. designed a sandwich structure with a composite face sheet and a honeycomb grid reinforcement structure made of buoyancy material. Localized resonance units were embedded in the rubber inside the grid. At 0 MPa and 3 MPa, the structure exhibits average sound absorption coefficients of 0.306 and 0.309, respectively, in the 2–5 kHz frequency range [48]. Li et al. designed a pressure-resistant sandwich structure, which used a 5 mm carbon fiber composite face sheet. The core rubber layer is embedded periodically with the double-layer cavities and carbon fiber composite truss as a pressure resistance structure. The average sound absorption coefficient is more than 0.7 in the frequency range of 2800–10,000 Hz. The change in sound absorption coefficient is minimal within a pressure of 0–4 MPa [49]. Wang et al. designed the periodical hexagon carbon fiber honeycomb as a grid skeleton for Z-direction reinforcement. A gradient resonant air-filled cavity combines a cylinder and a circular platform to realize broadband sound absorption. Under a hydrostatic pressure of 1.5 MPa, the average sound absorption coefficient reached 0.90 within the 2.4–10 kHz frequency range. However, the use of the carbon fiber honeycomb shifted the absorption peak from 1.5 kHz to 2.0 kHz, leading to a reduction in low-frequency absorption [50]. The absorber design of Z-direction reinforced structures mainly has the advantage of pressure resistance. However, current research has mainly focused on the mid-to-high frequency range, and the sound absorption performance in the low-frequency (below 2 kHz) sound absorption performance is relatively insufficient under high static hydrostatic pressure.
To improve the pressure resistance and the sound absorption performance of the absorber at low frequency range, a novel lattice-reinforced meta-absorber (LRMA) is proposed. The LRMA is designed with a rubber layer covered with a thin aluminum face sheet, and the rubber layer is embedded with periodic cavities and aluminum pipes. A finite element method considering the acoustic–structure interaction and the pressure of LRMA is established to analyze its sound absorption characteristics, and the sound absorption mechanism is revealed. A differential evolution algorithm is used to realize collaborative design of the material and structure. Finally, an experimental verification is carried out for acoustic absorption under different hydrostatic pressures.

2. Analytical Model and Method

2.1. Theoretical Model

The structure of the LRMA is shown in Figure 1. The LRMA consists of a rubber layer and an aluminum face sheet. The rubber layer is embedded periodically with cavities and aluminum pipes. The choice of aluminum for the pipes and face sheet is based on a combination of its advantageous mechanical and chemical properties. It exhibits high Young’s modulus, seawater corrosion resistance, low cost, and easy manufacture ability. The aluminum pipes and cavities are arranged in a square lattice. Aluminum pipes are embedded throughout the rubber, i.e., from the steel backing to the face sheet, to provide lattice reinforcement in the Z-direction for pressure resistance. The single unit cell is denoted by the dashed box as illustrated in Figure 1. Each corner of the cell is occupied by a quarter-section of an aluminum pipe, while a cylindrical cavity is located in the central area. The LRMA is laid on a steel backing, and a plane wave is incident vertically from the water into the LRMA. Figure 2 presents the cross-section of one cell of the LRMA, which is indicated by the dashed box in Figure 2a. The cross-sectional view of the unit cell diagonal line is shown in Figure 2b. The lattice period of the cavities and aluminum pipes is denoted by a. The inner diameter of the aluminum pipe is R p . The pipe wall thickness is t. The height of the aluminum pipe is the same as the thickness of the rubber layer. The height of the cylindrical cavity at the center of the cell is H c with radius R c . The distance between the cavity and the aluminum face sheet is H t . The total thickness of rubber layer is H r . And H g is the aluminum face sheet thickness.

2.2. Finite Element Method

The finite element method is employed to analyze the acoustic absorption characteristics of the LRMA. The contact surface of the LRMA with water is labeled as S 1 . The contact surface of steel backing with air is S 2 . The incident wave can be given by
p i n ( x , y , z ) = p θ e j k x x + k y y + k z z ,
where k x = k sin θ cos φ , k y = k sin θ sin φ , and k z = k cos θ are defined as the wave numbers in the x, y, and z directions, respectively. The parameter θ is the angle relative to the z axis of the incident wave. φ is the angle between its projection onto the x o y plane and the x-axis. The incident wave number k is given by k = ω / c , where ω is the angular frequency and c is the acoustic speed in water.
Because the acoustic structure inside the sound-absorbing layer is arranged in a square lattice and in accordance with Bloch’s theorem, both the sound pressure p in fluid and the displacement u in solid, denoted by χ , satisfy
χ ( x + a , y + a , z ) = χ ( x , y , z ) e j a k x e j a k y ,
where a represents the lattice constant. The sound pressure in water is generated through the superposition of incident and reflected sound waves. Therefore, its total sound field can be expressed as
p t o t ( x , y , z ) = p i n ( x , y , z ) + m , n = + R m n e j [ ( 2 m π / a + k x ) x + ( 2 n π / a + k y ) y + k m n z ] ,
where k m n 2 = k 2 2 m π / a + k x 2 2 n π / a + k y 2 .
Transmitted sound waves can be expressed as
p t ( x , y , z ) = m , n = + T m n e j [ ( 2 m π / a + k x ) x + ( 2 n π / a + k y ) y + k m n z ] ,
where k x , k y , and k m n represent the transmitted acoustic wave vector components in the x, y, and z directions on surface S 2 . They are related to the sound velocity c of the medium at the acoustic transmission domain. The fluid–solid coupling can be
R T K s ω 2 M s K P C Φ ω 2 M P ρ 0 ω 2 R p u = F m C 0 ,
where ρ 0 denotes the density of the water, R denotes the fluid–structure interaction matrix, K P denotes the fluid stiffness matrix, M P represents the water mass matrix, K S represents the solid stiffness matrix, M S represents the solid mass matrix, F m represents the nodal load matrix of the solid structure subjected to mechanical excitation, and C Φ , C 0 is used to indicate the equivalent nodal load matrix related to the boundary. Considering periodic boundary conditions and the continuity of pressure and velocity, the reflected and transmitted wave plane-wave expansion coefficients, denoted by R m n and T m n , can be obtained. The acoustic energy reflection coefficient R is given by
R = m , n = N N R m n 2 k m n / m , n = N N R m n 2 k m n ( p 0 2 k z ) ( p 0 2 k z ) ,
where N represents the propagation order of the reflected plane wave. The transmission coefficient is defined as
T = ρ m , n = N N T m n 2 k m n / ρ m , n = N N T m n 2 k m n ( ρ p 0 2 k z ) ( ρ p 0 2 k z ) ,
where N represents the propagation order of the transmitted plane wave. According to the law of conservation of energy, the sound absorption coefficient is given by
A = 1 R T .
Owing to the significant impedance mismatch between the steel backing and air, the transmission coefficient can be neglected. Consequently, the sound absorption coefficient is given by
A = 1 R .
The surface acoustic impedance ratio on surface S 1 is
Z s = P u ,
where P denotes the total sound pressure on surface S 1 and u represents the particle velocity on surface S 1 in the direction of the incident sound wave.
The normalized surface acoustic impedance ratio is
ζ = Z s Z 0 ,
where Z 0 = ρ 0 c denotes the characteristic impedance of water.
Therefore, the normalized surface acoustic resistance x s is given by
x s = Re ( ζ ) .
Similarly, the normalized surface acoustic reactance y s is given by
y s = Im ( ζ ) .
Generally, sound absorption coefficient α is obtained from the surface acoustic resistance and reactance
α = 4 x s ( 1 + x s ) 2 + y s 2 .

3. Sound Absorption Characteristics and Mechanism

3.1. Sound Absorption Characteristic

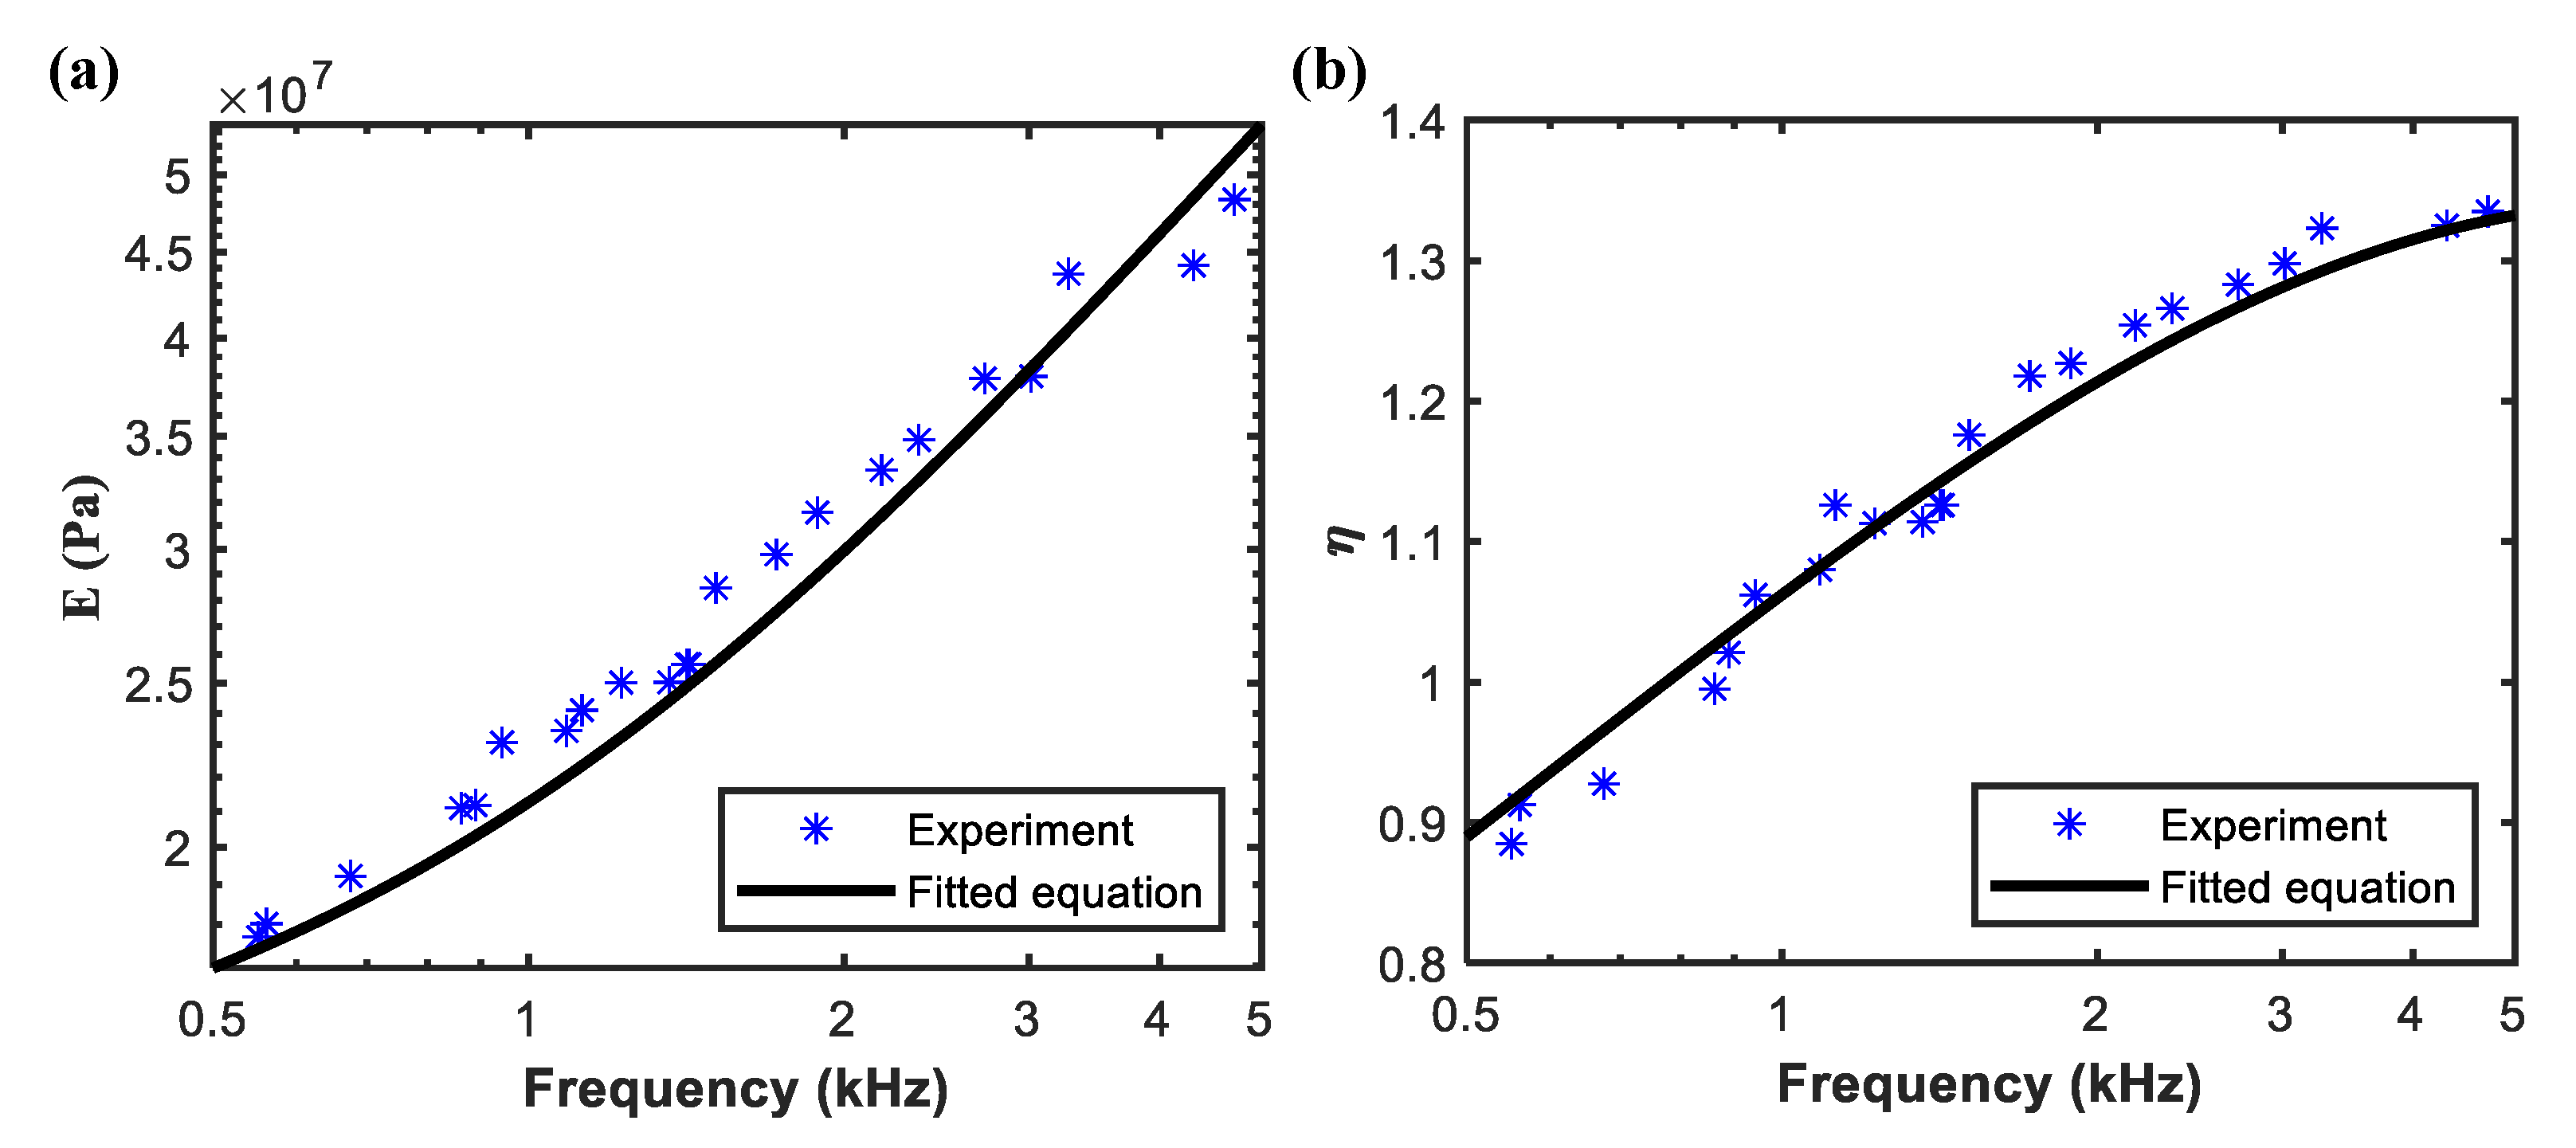
The sound absorption performance of the LRMA, obtained through the finite element method (Section 2.2), is illustrated in Figure 3. The geometrical and material parameters used for this simulation are listed in Table 1. The total thickness of the LRMA in the analysis is 55 mm. The steel backing thickness is 40 mm. The rubber density ρ = 1100 kg / m 3 , Poisson ratio ν = 0.495 . Through DMA testing, the test data are fitted to generate the fitted curves, and the experimental data and fitted curves in the frequency range of 0.5–5 kHz are shown in Figure 4. The equations of the fitted curve for the real part E and the loss factor η are
E = ( 3.52946 × 10 7 ) f ( 7.80764 × 10 7 ) f 2 + ( 7.06355 × 10 7 ) f 3 ( 2.92882 × 10 7 ) f 4 + ( 5.57721 × 10 6 ) f 5 ( 3.76979 × 10 5 ) f 6 + 2.81071 × 10 6 Pa ,
η = 0.269523 f 2 0.0853637 f 0.157293 f 3 + 0.0442431 f 4 + 0.00819747 f 5 0.0051857 f 6 + 0.000535193 f 7 + 0.173839 .
where the unit of frequency f in these equations is hertz (Hz).
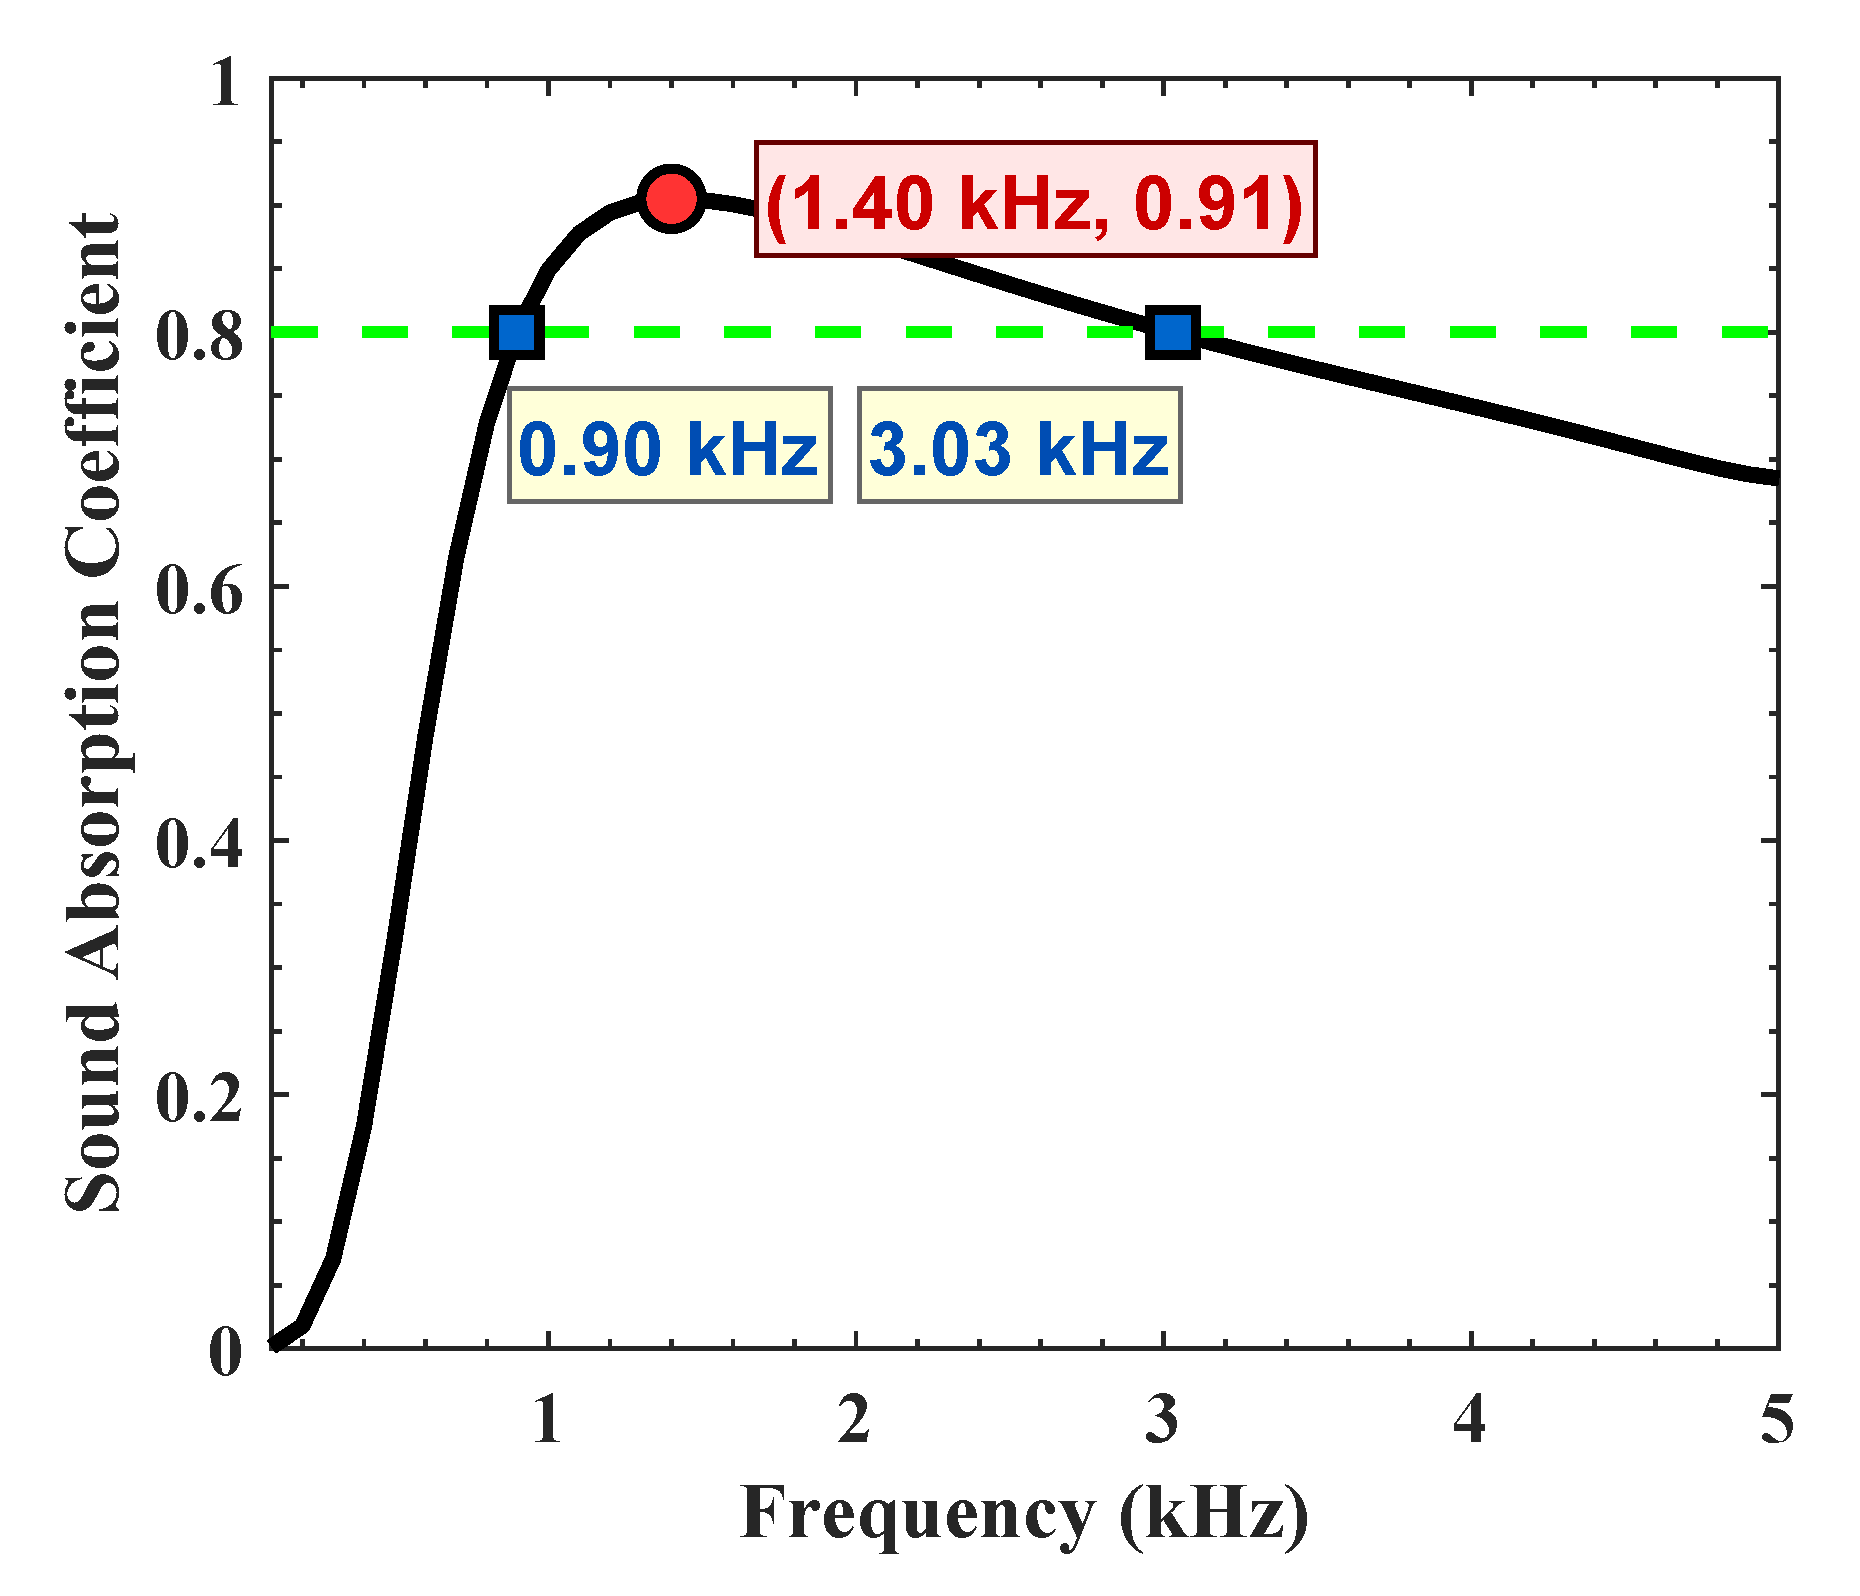
Figure 3 illustrates the sound absorption coefficient of the LRMA. The coefficient first surpasses 0.8 at 900 Hz and reaches its maximum value of 0.91 at 1400 Hz. After this peak, the absorption gradually declines, resulting in an average coefficient of 0.77 within the 2000–50,000 Hz range. In the lower frequency band (500–2000 Hz), the average is slightly higher at 0.79. Overall, the mean sound absorption coefficient across the entire 500–5000 Hz range is 0.78.

3.2. Sound Absorption Mechanism

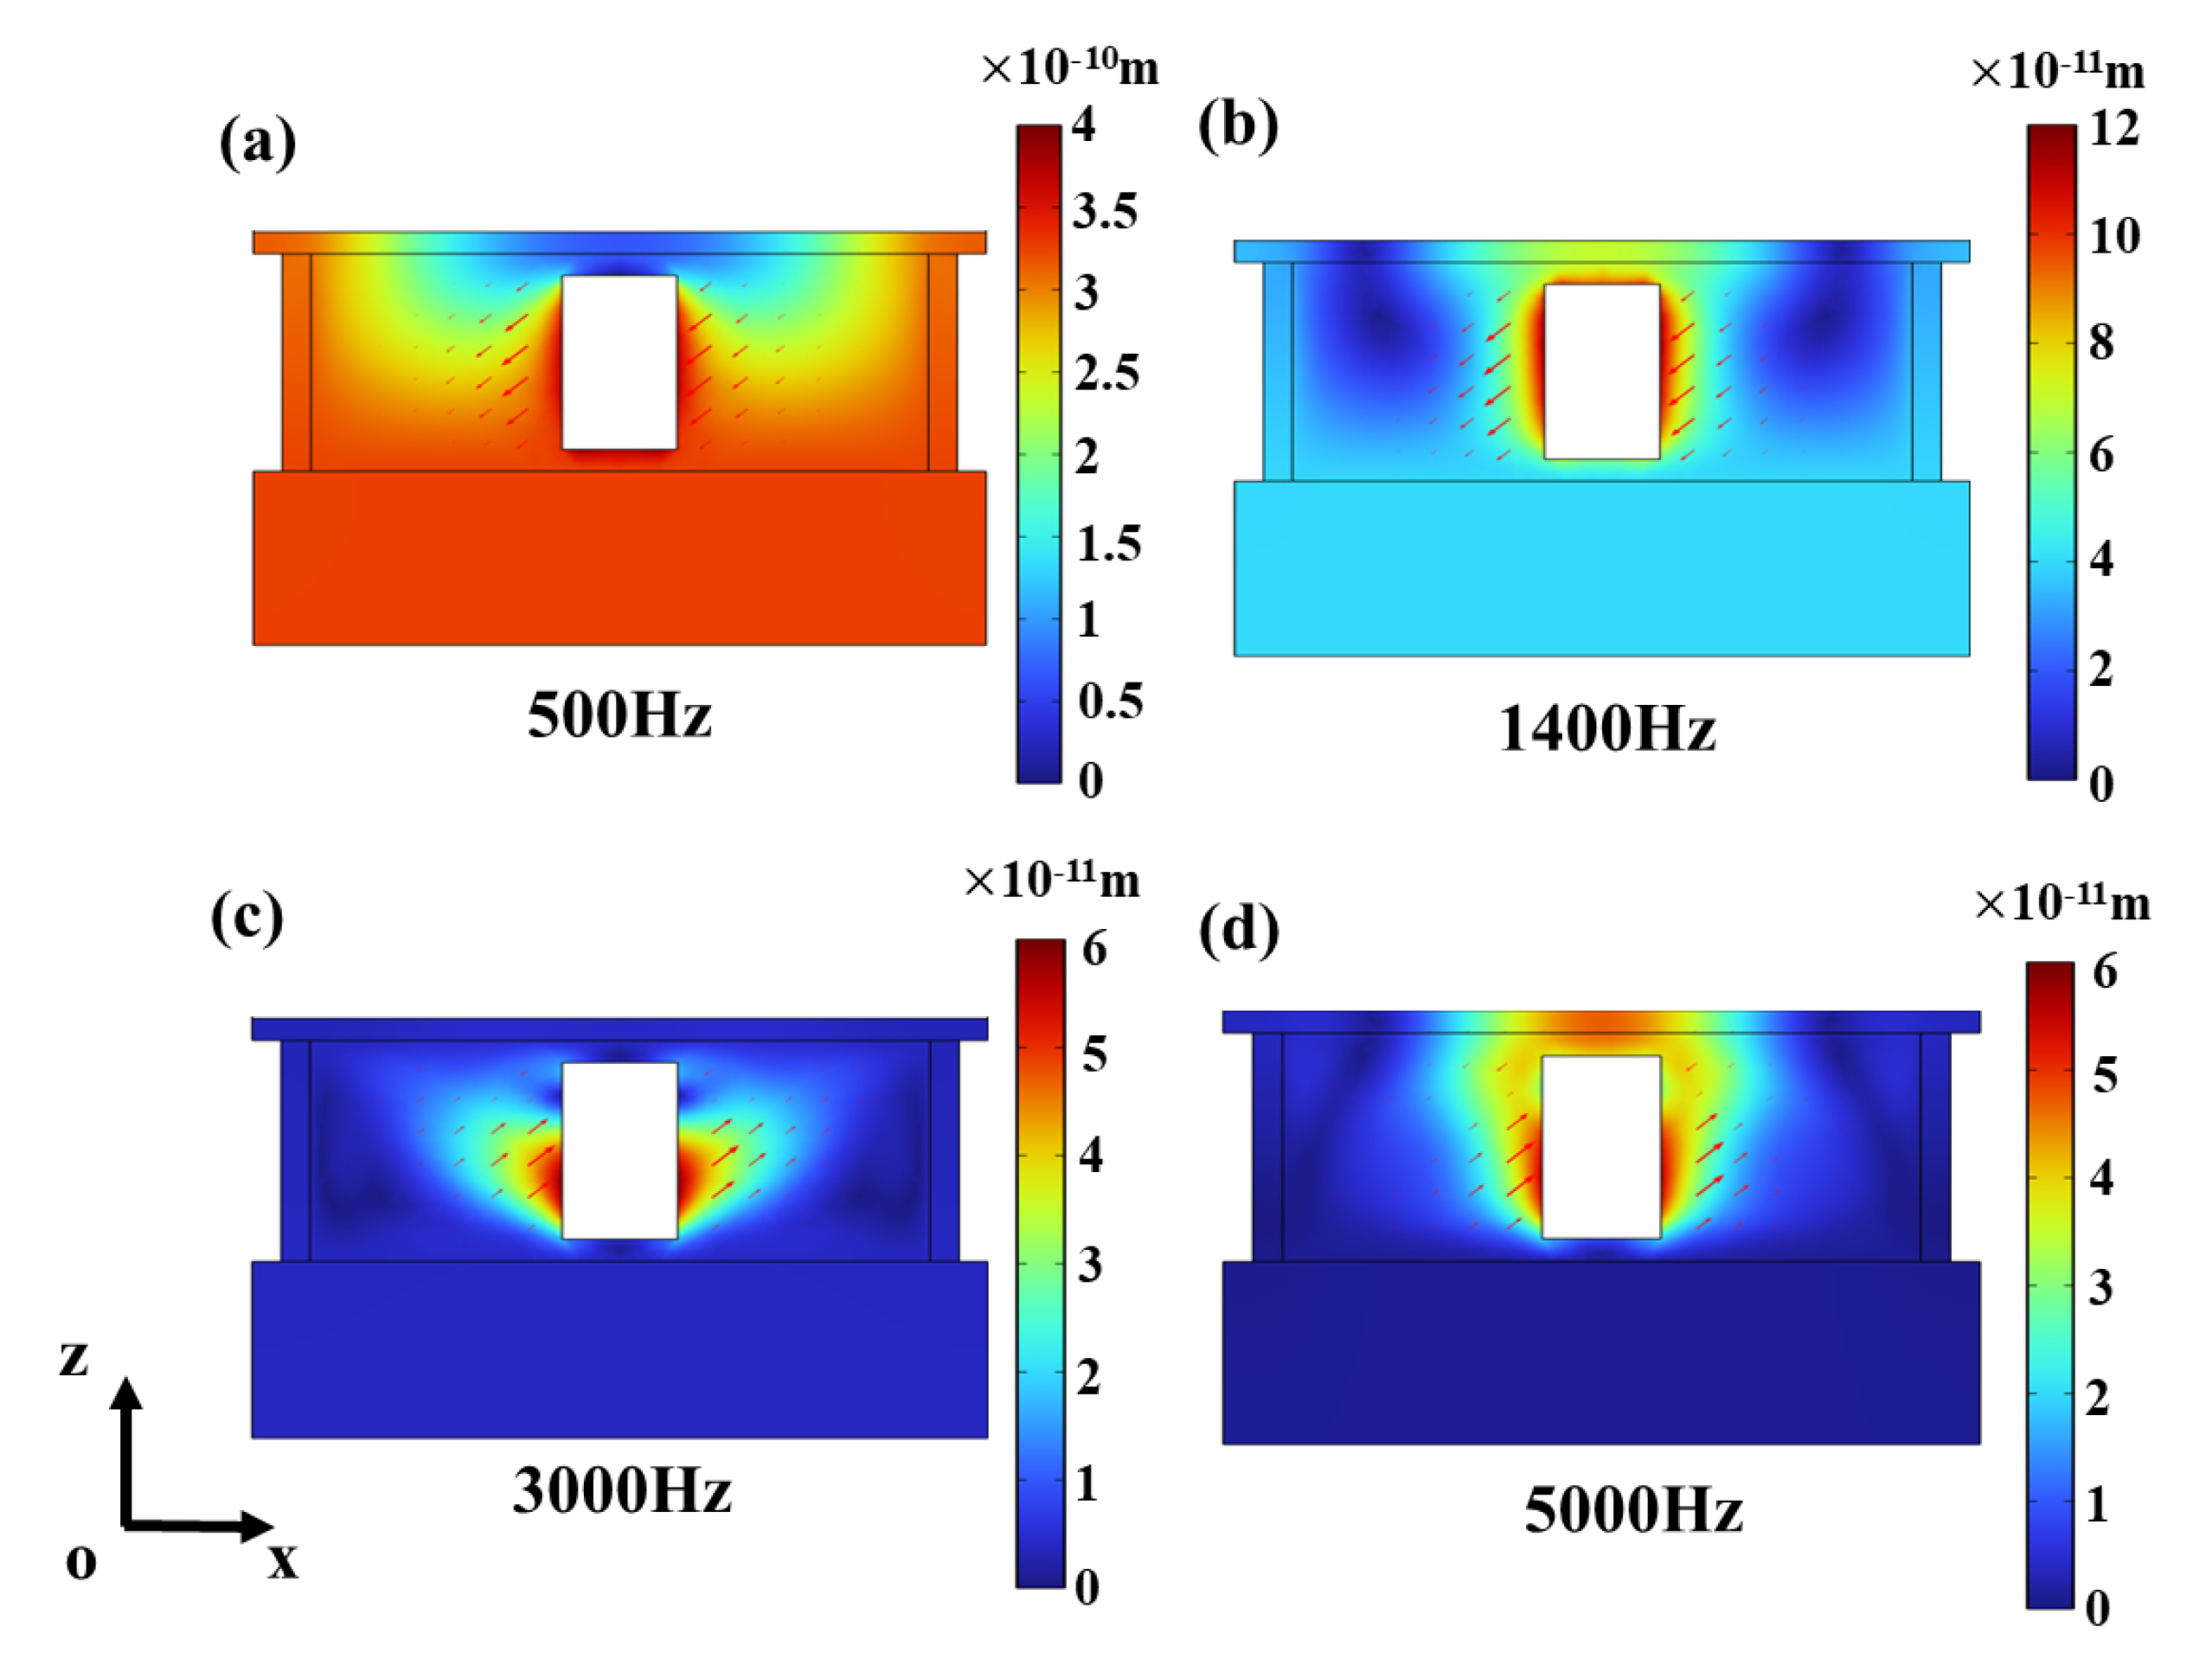
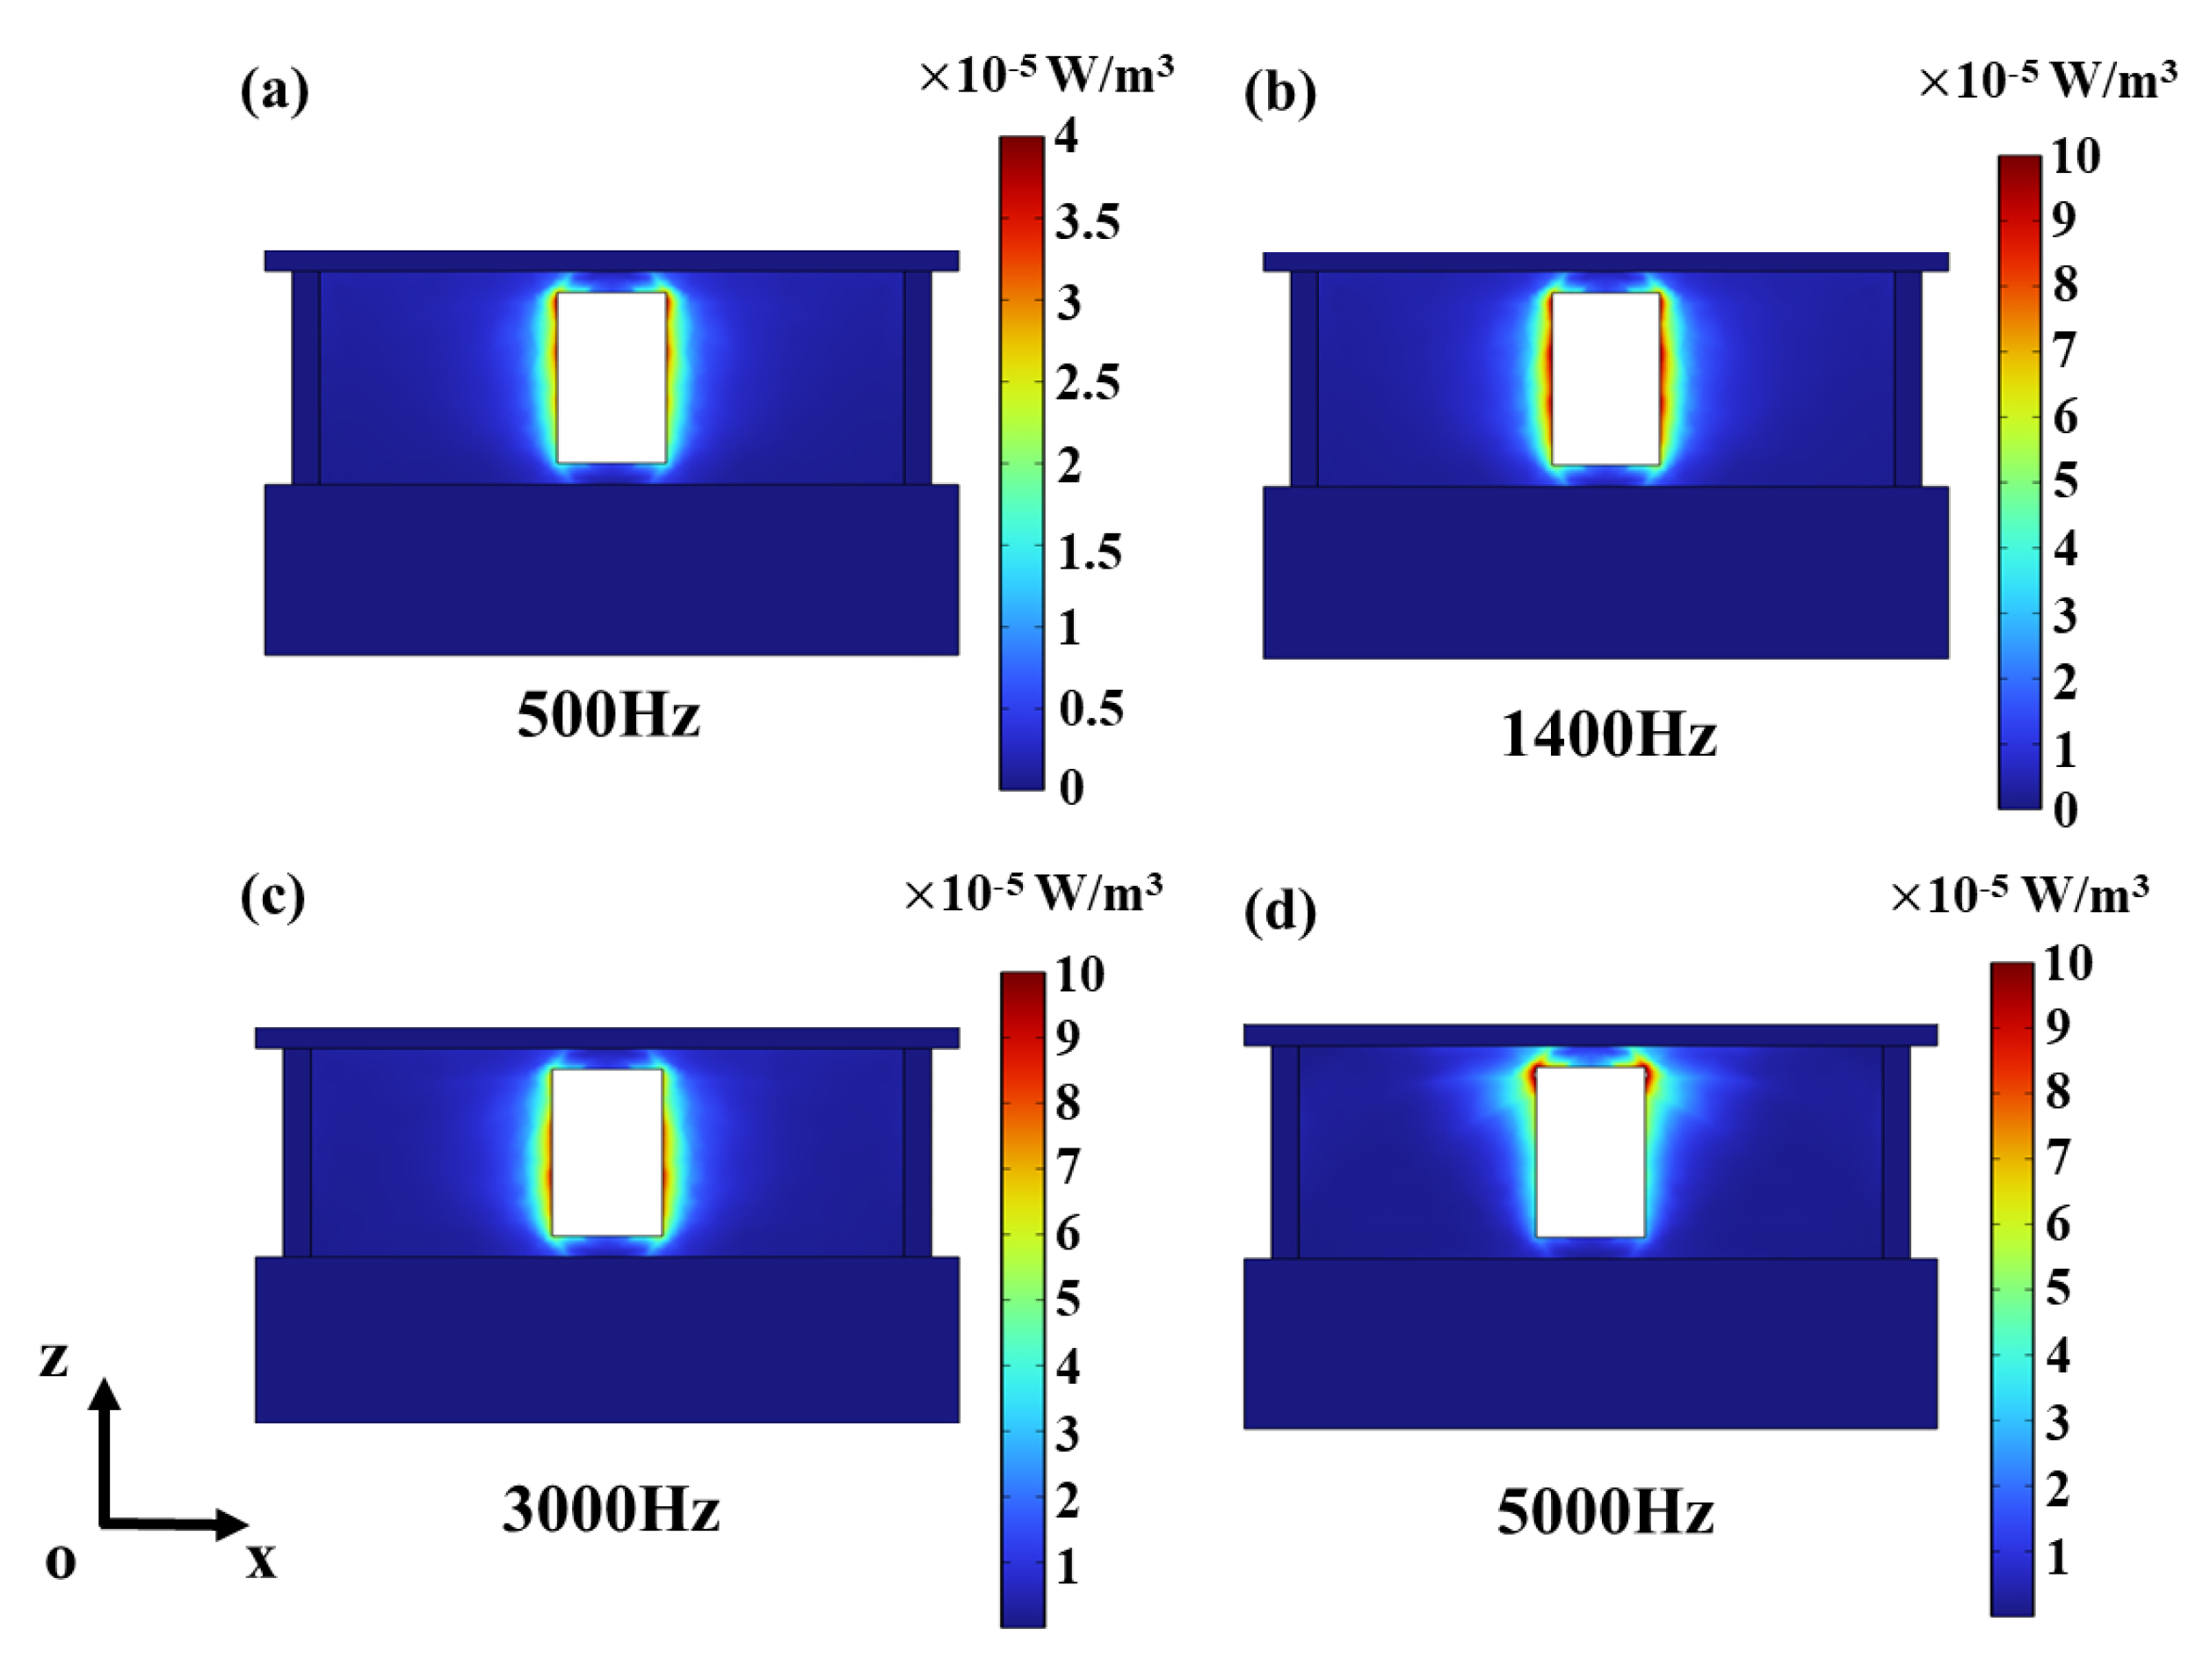
To reveal the sound absorption mechanism of the LRMA, the corresponding displacement field is presented in Figure 5, and the energy dissipation density at different frequencies is shown in Figure 6. At 500 Hz, the steel backing exhibits overall displacement, and the rubber matrix surrounding the cavity undergoes shear motion (Figure 5a). Sound waves are primarily dissipated through cavity deformation. Although the amplitude of the overall displacement is large, the energy dissipation density and area are relatively small (Figure 6a); accordingly, the sound absorption coefficient is low.
With increasing frequency at 1400 Hz, the overall displacement of the rubber layer and steel backing decreases (Figure 5b). However, the energy dissipation density caused by the cavity is high (Figure 6b). The LRMA achieves its absorption peak. At 3000 Hz, the overall displacement of the LRMA and steel backing (Figure 5c) and energy dissipation area are further reduced (Figure 6c), which leads to a decrease in the sound absorption coefficient. At 5000 Hz, the reduction trend of the overall displacement (Figure 5d) and energy dissipation area of the LRMA (Figure 6d) continues, so the sound absorption coefficient is further reduced. Here, the shear motion attributed to wave conversion in the rubber surrounding the cavity enhances the sound absorption.

4. Optimization Design

The differential evolution (DE) algorithm [51] is utilized to optimize the LRMA’s sound absorption performance via collaborative design of material and structure. In the analysis frequency band, the objective function is represented by the average value of the sound energy reflection coefficient R:
L = mean ( R ) .
The optimization frequency band is 500–5000 Hz. During the optimization, the rubber parameters are assumed to remain unchanged. By optimizing the structural parameters of the LRMA to match the selected rubber, the collaborative design of material and structure is carried out. Figure 7 compares the sound absorption of the LRMA before and after optimization. The optimized structure parameters of the LRMA are shown in Table 2. The optimization significantly enhances the LRMA’s sound absorption, achieving better results than the unoptimized version at all frequencies. Before optimization, the LRMA exhibits an absorption peak at 1400 Hz. After optimization, the sound absorption coefficient reaches a peak at 1900 Hz with value of 0.99. The absorption coefficient reaches 0.8 at 700 Hz after optimization, and the ratio of the thickness of LRMA (41 mm) to the wavelength in water at 700 Hz is 1.91%, which shows a deep subwavelength. The average sound absorption coefficient of the optimized LRMA in the frequency range of 500–5000 Hz reaches 0.94, an increase of 0.16 compared to absorption without optimization, and the average sound absorption coefficients in different frequency bands are given in Table 3.
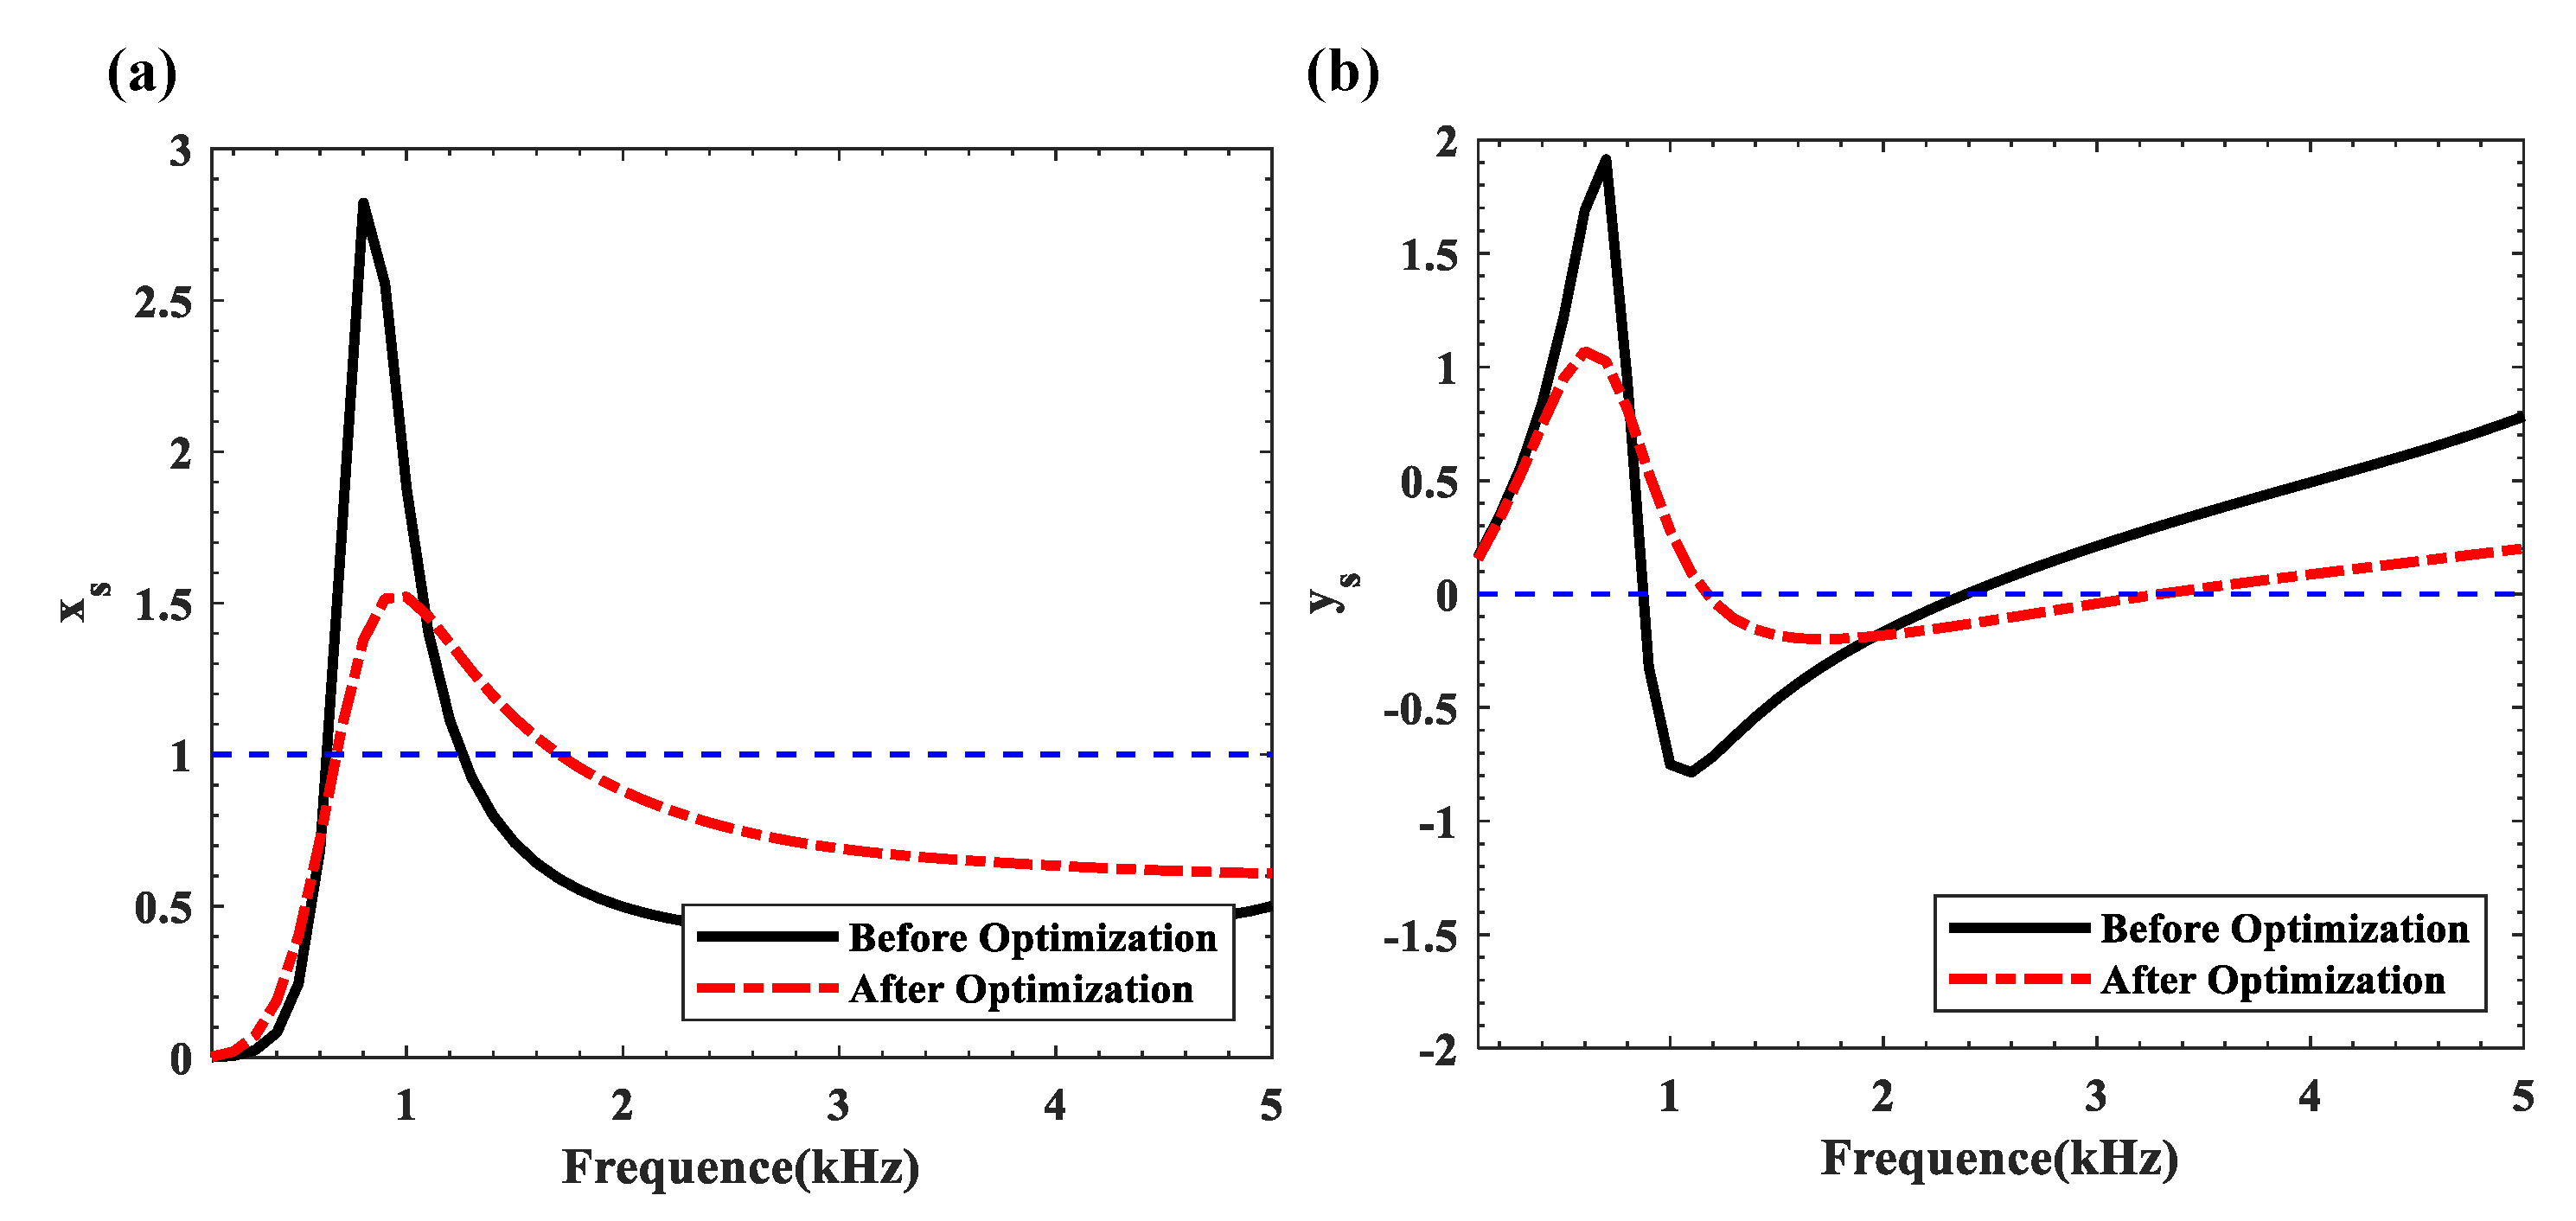
The normalized surface acoustic impedance ratio is shown in Figure 8 to illustrate the factors responsible for the enhanced sound absorption of the LRMA after optimization. After optimization, the surface acoustic resistance of the LRMA exhibits smaller amplitude and approaches 1, while the acoustic reactance moves closer to 0. This indicates that the surface acoustic impedance is better matched to water, resulting in improved sound absorption performance.
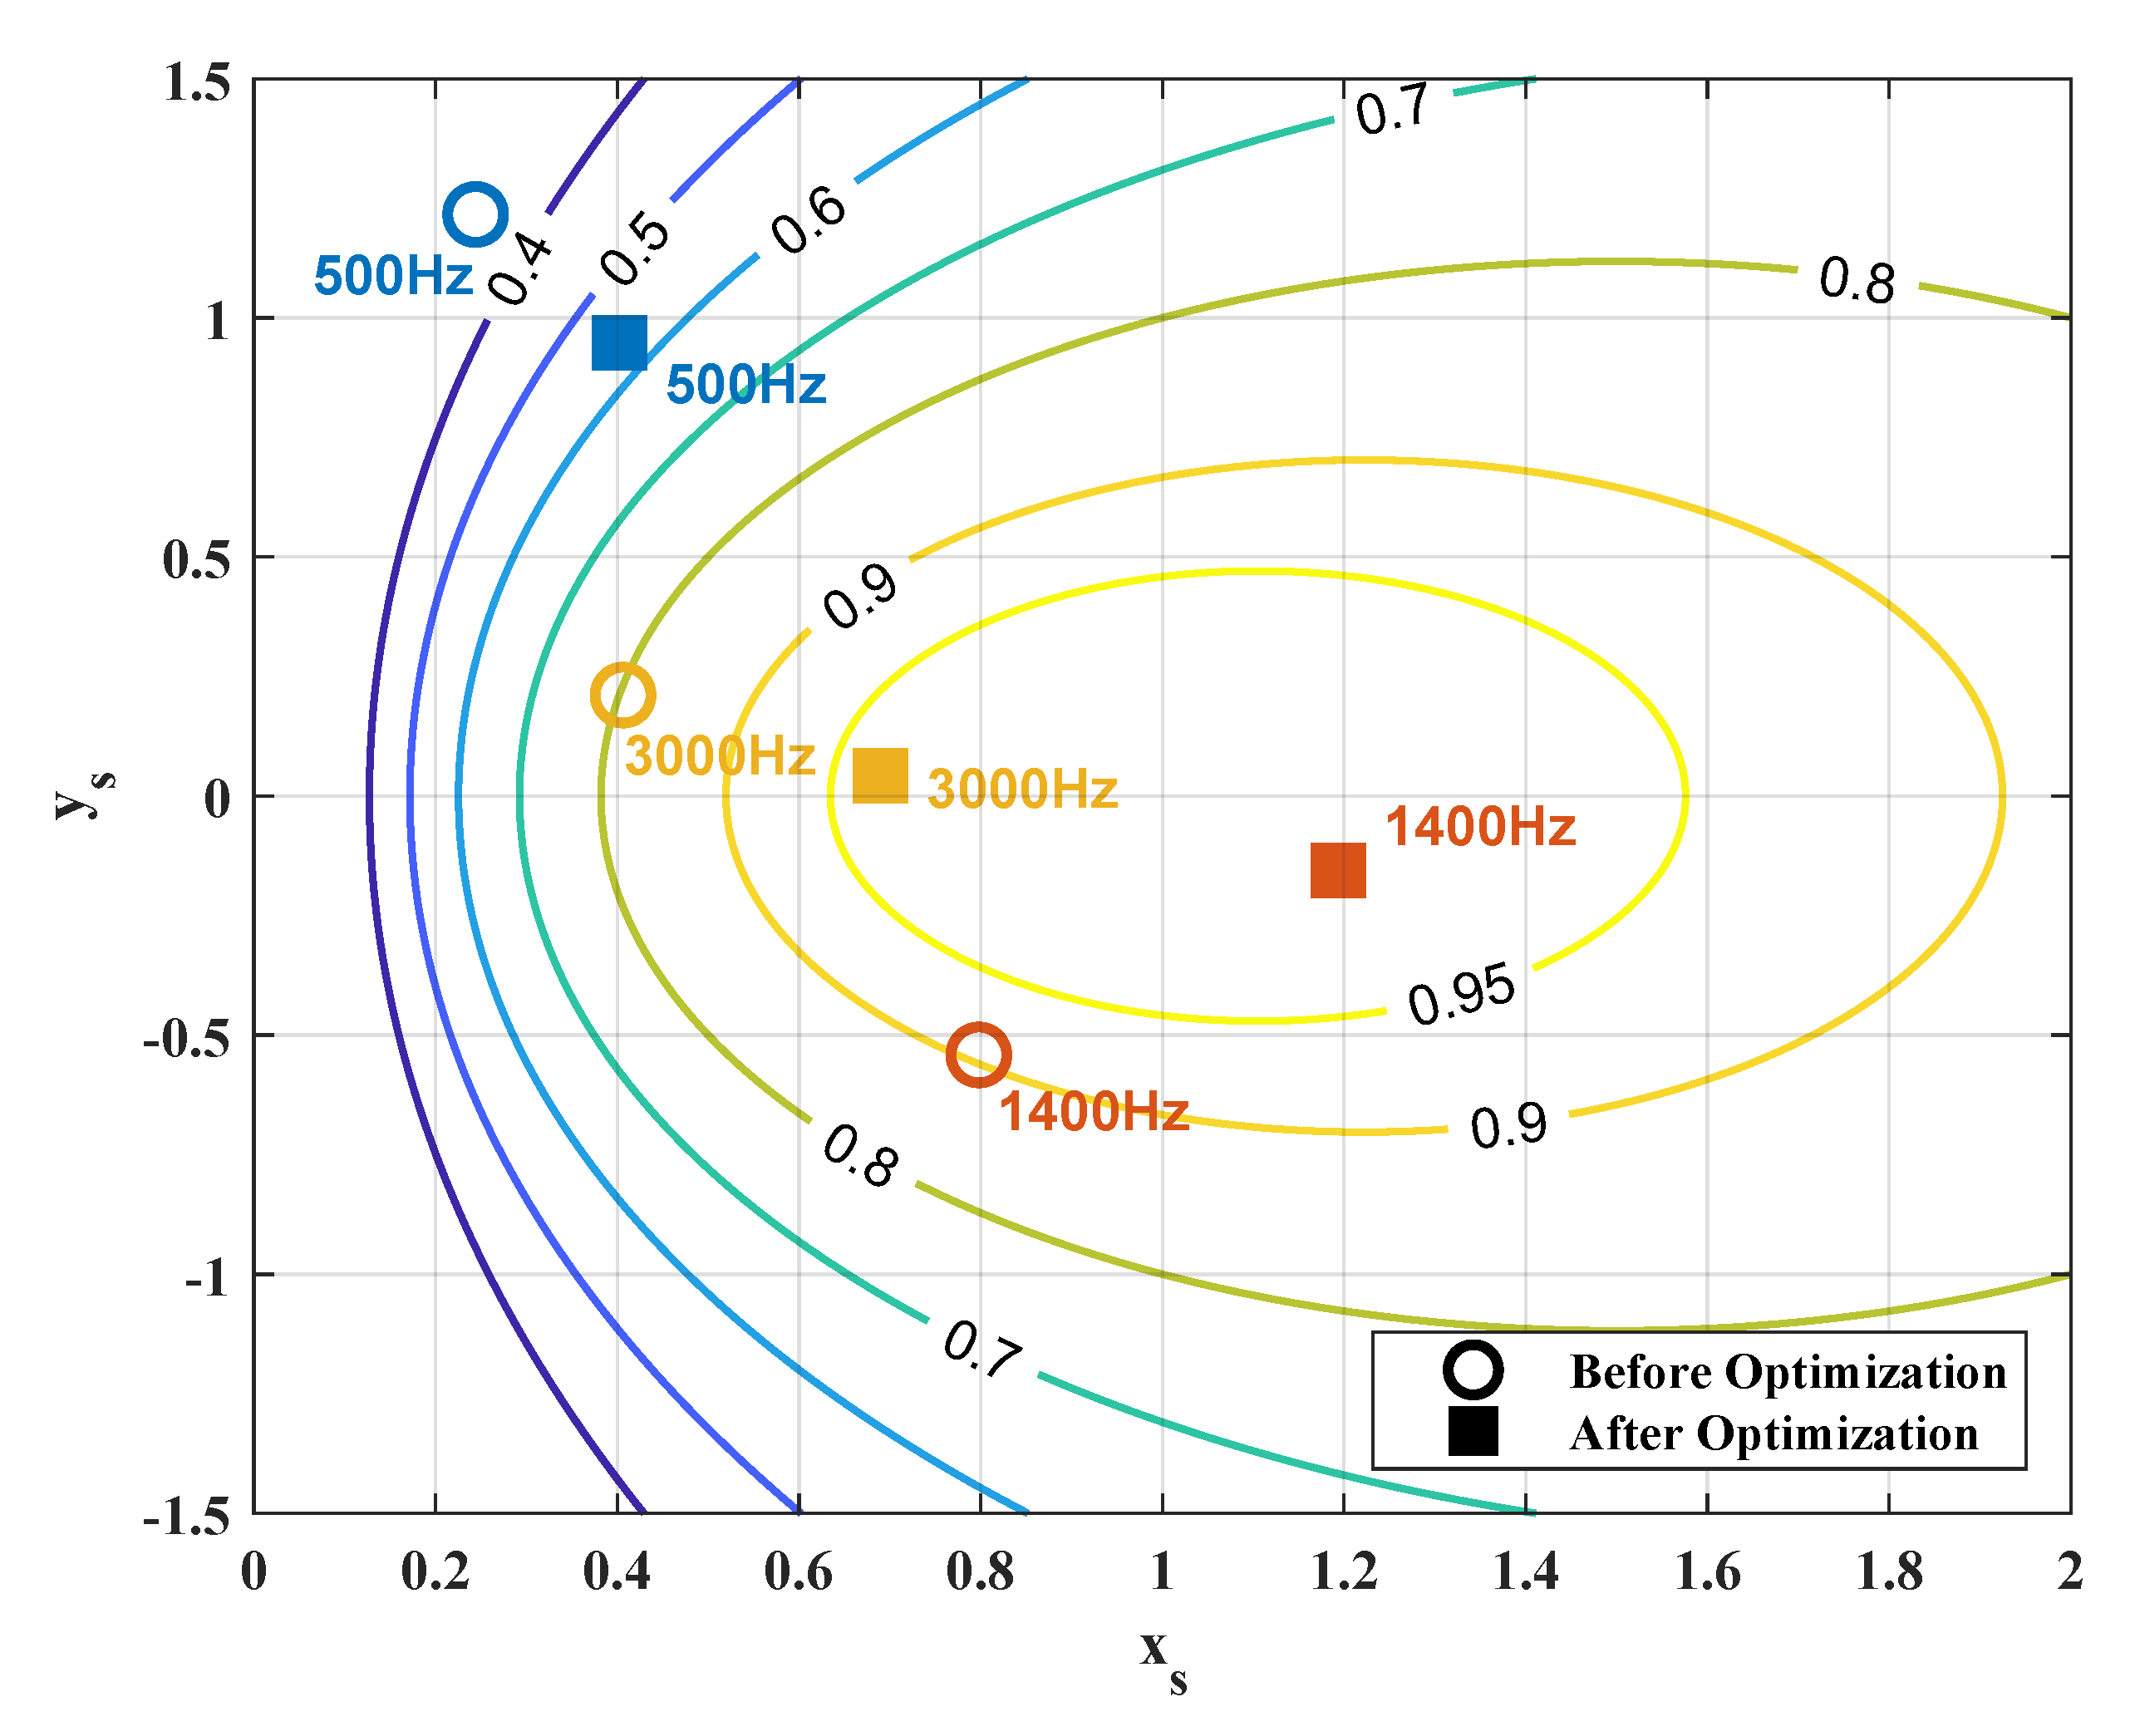
In order to give an intuitive understanding of the normalized surface acoustic impedance ratio on the absorption, the surface acoustic impedance ratio at typical frequencies of the optimized LRMA is presented among the sound absorption coefficient contour lines in Figure 9 according to Equation (14), and the results are compared with those before optimization. It is clear that perfect sound absorption can be achieved under the impedance matching between the LRMA and the surrounding water, which means that the imaginary part of the normalized surface impedance ratio reaches 0 and the real part becomes 1 simultaneously. One can readily see from Figure 9 that the position of the surface acoustic impedance ratio at typical frequency of the LRMA after optimization is more close to the perfect impedance matching point ( x s = 1, y s = 0) than that before optimization. For example, at frequency 500 Hz, the optimized surface impedance ratio is closer to 1 for x s and 0 for y s , so the LRMA gains better sound absorption. A more obvious trend can be observed at 1400 Hz, where the surface impedance ratio of the optimized LRMA is very close to the perfect impedance matching point, resulting in better acoustic absorption.

5. Result Discussions

5.1. Parameter Influence on the Sound Absorption

5.1.1. Influence of Cavity Radius

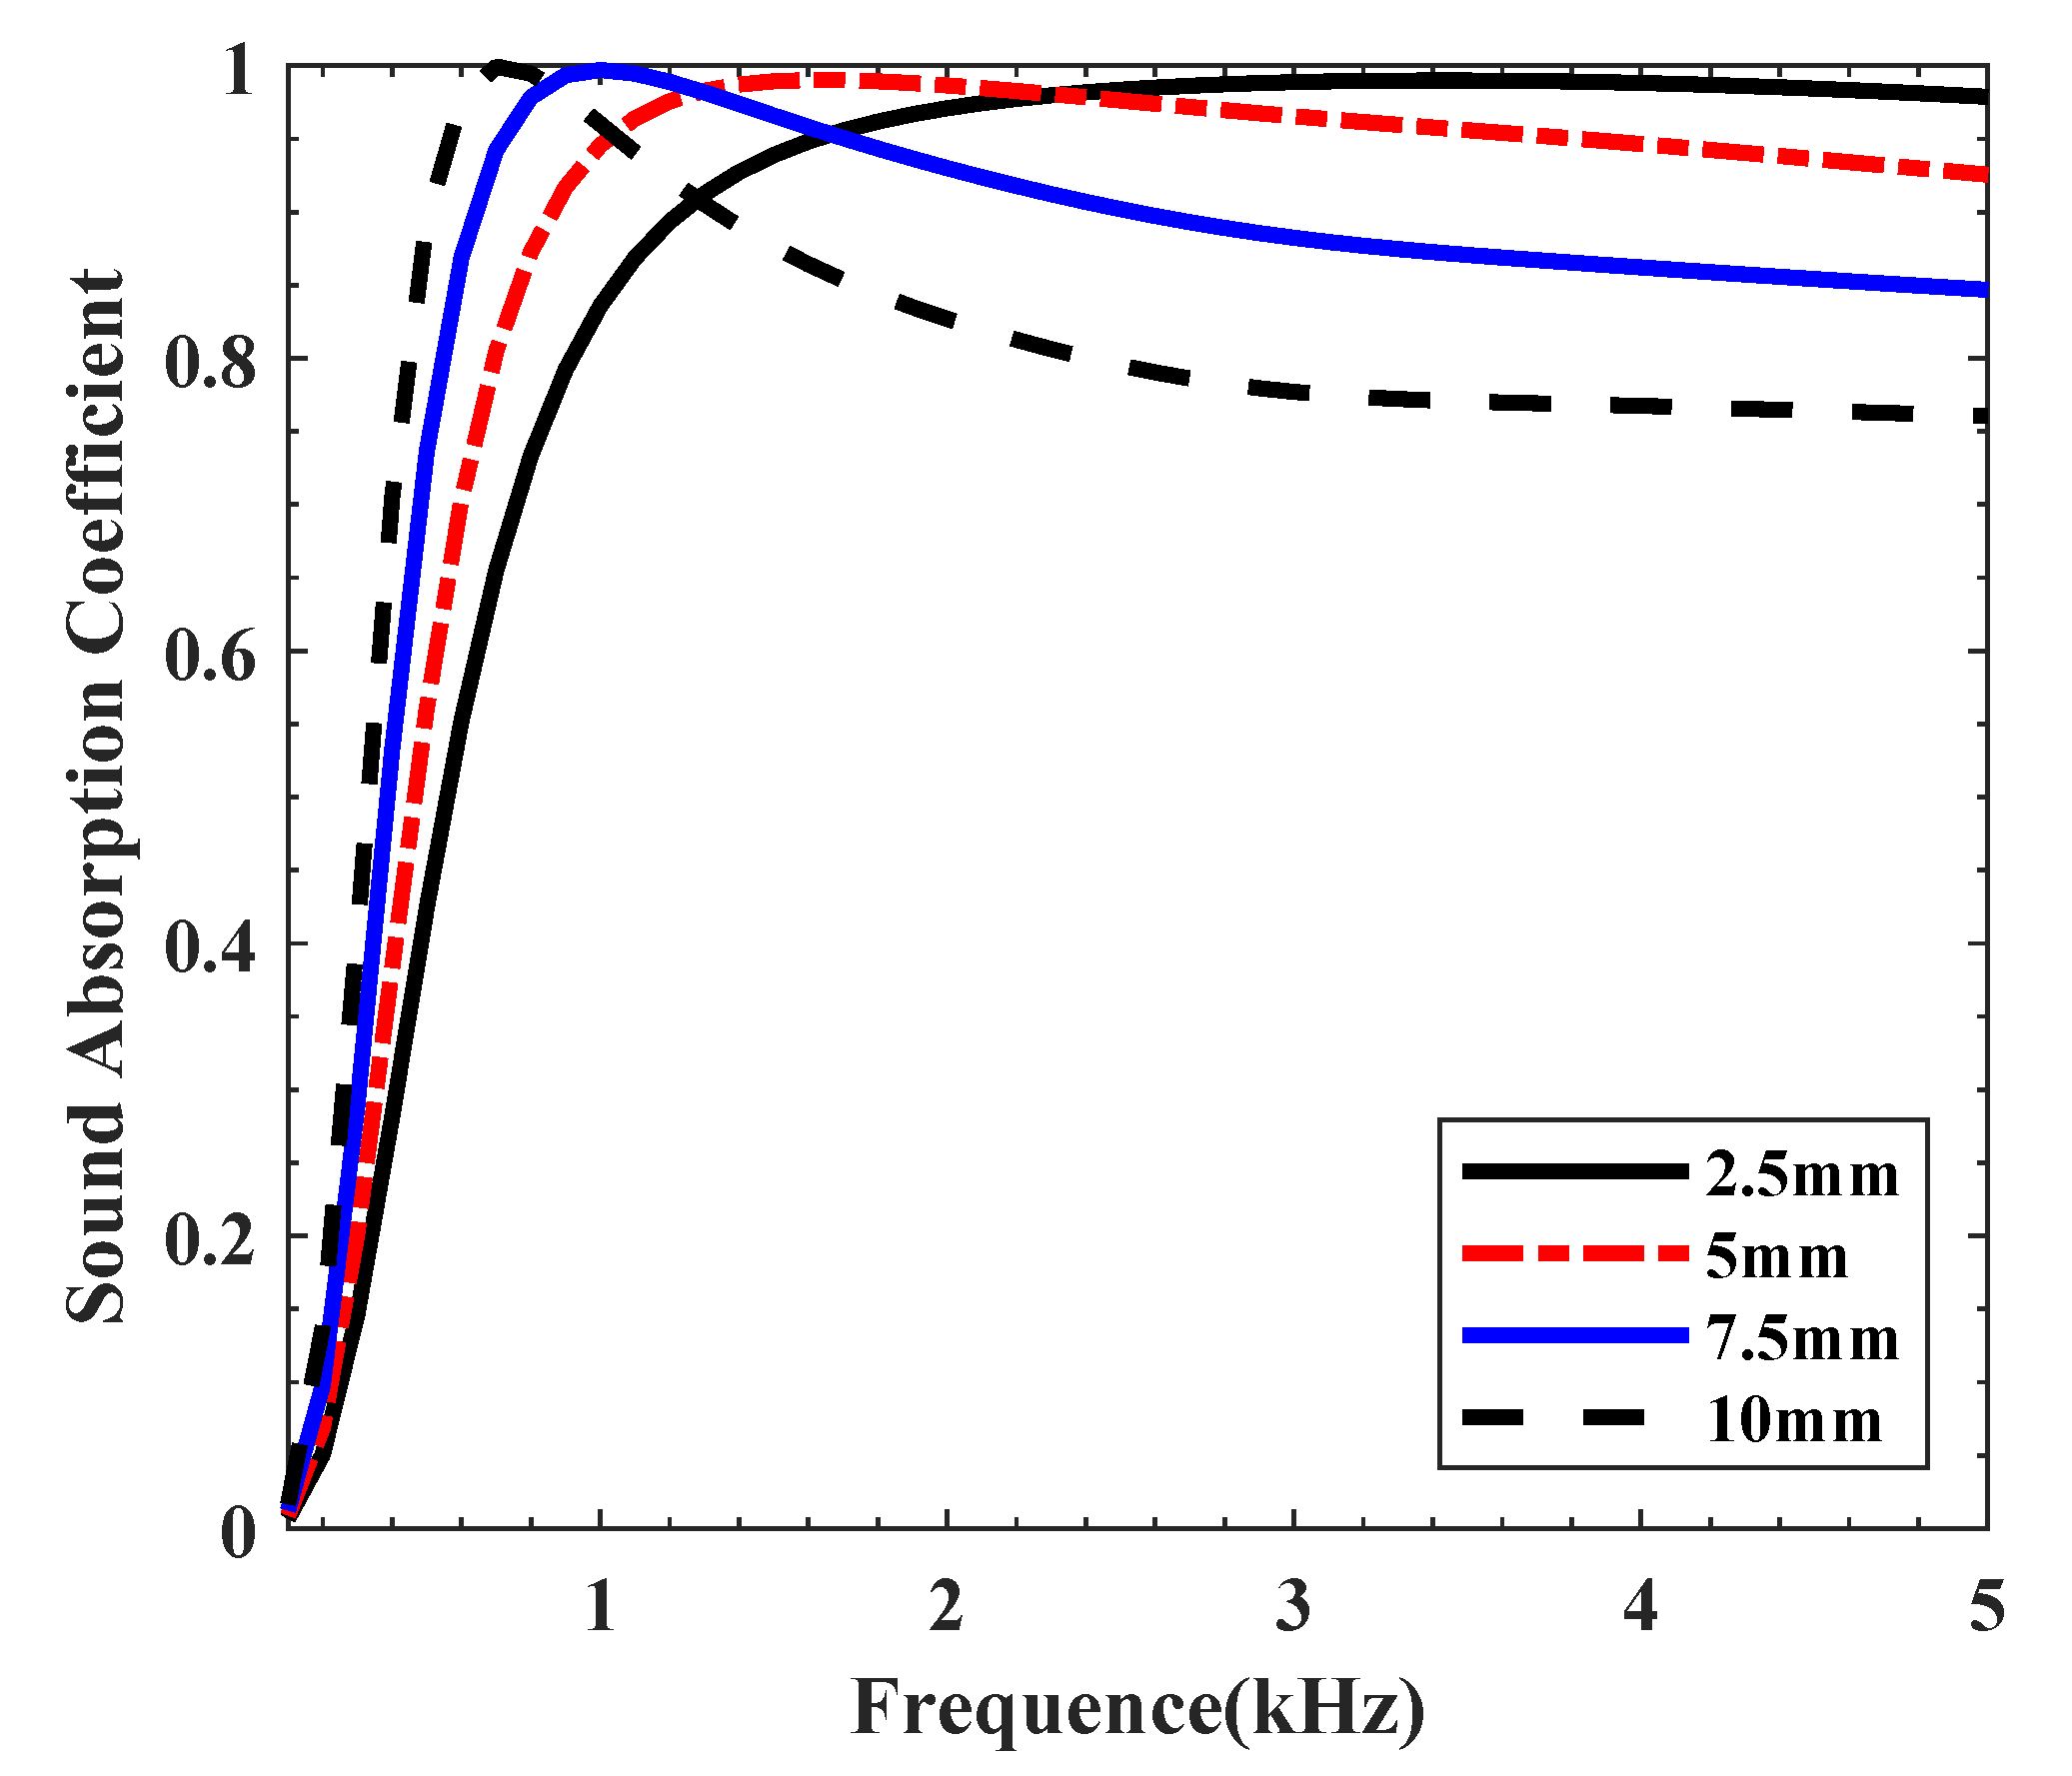
To better clarify the impact of cavity radius on the LRMA’s sound absorption, Figure 10 presents the variation in absorption performance with different cavity radii. When the radius is set to 2.5 mm, 5 mm, 7.5 mm, and 10 mm, the corresponding average sound absorption coefficients in the 500–2000 Hz range are 0.83, 0.91, 0.94, and 0.91, respectively, while in the in the 2000–5000 Hz range they are 0.98, 0.96, 0.87, 0.78. An increase in cavity radius shifts the first absorption peak toward lower frequencies, thereby improving low-frequency absorption. This phenomenon results from the larger cavity volume, which lowers the radial resonance frequency. Beyond the first absorption peak, the sound absorption coefficient is significantly reduced with increasing cavity radius. This reduction is caused by increased acoustic impedance mismatch between the LRMA and water as the cavity radius increases.

5.1.2. Influence of Aluminum Pipe Wall Thickness

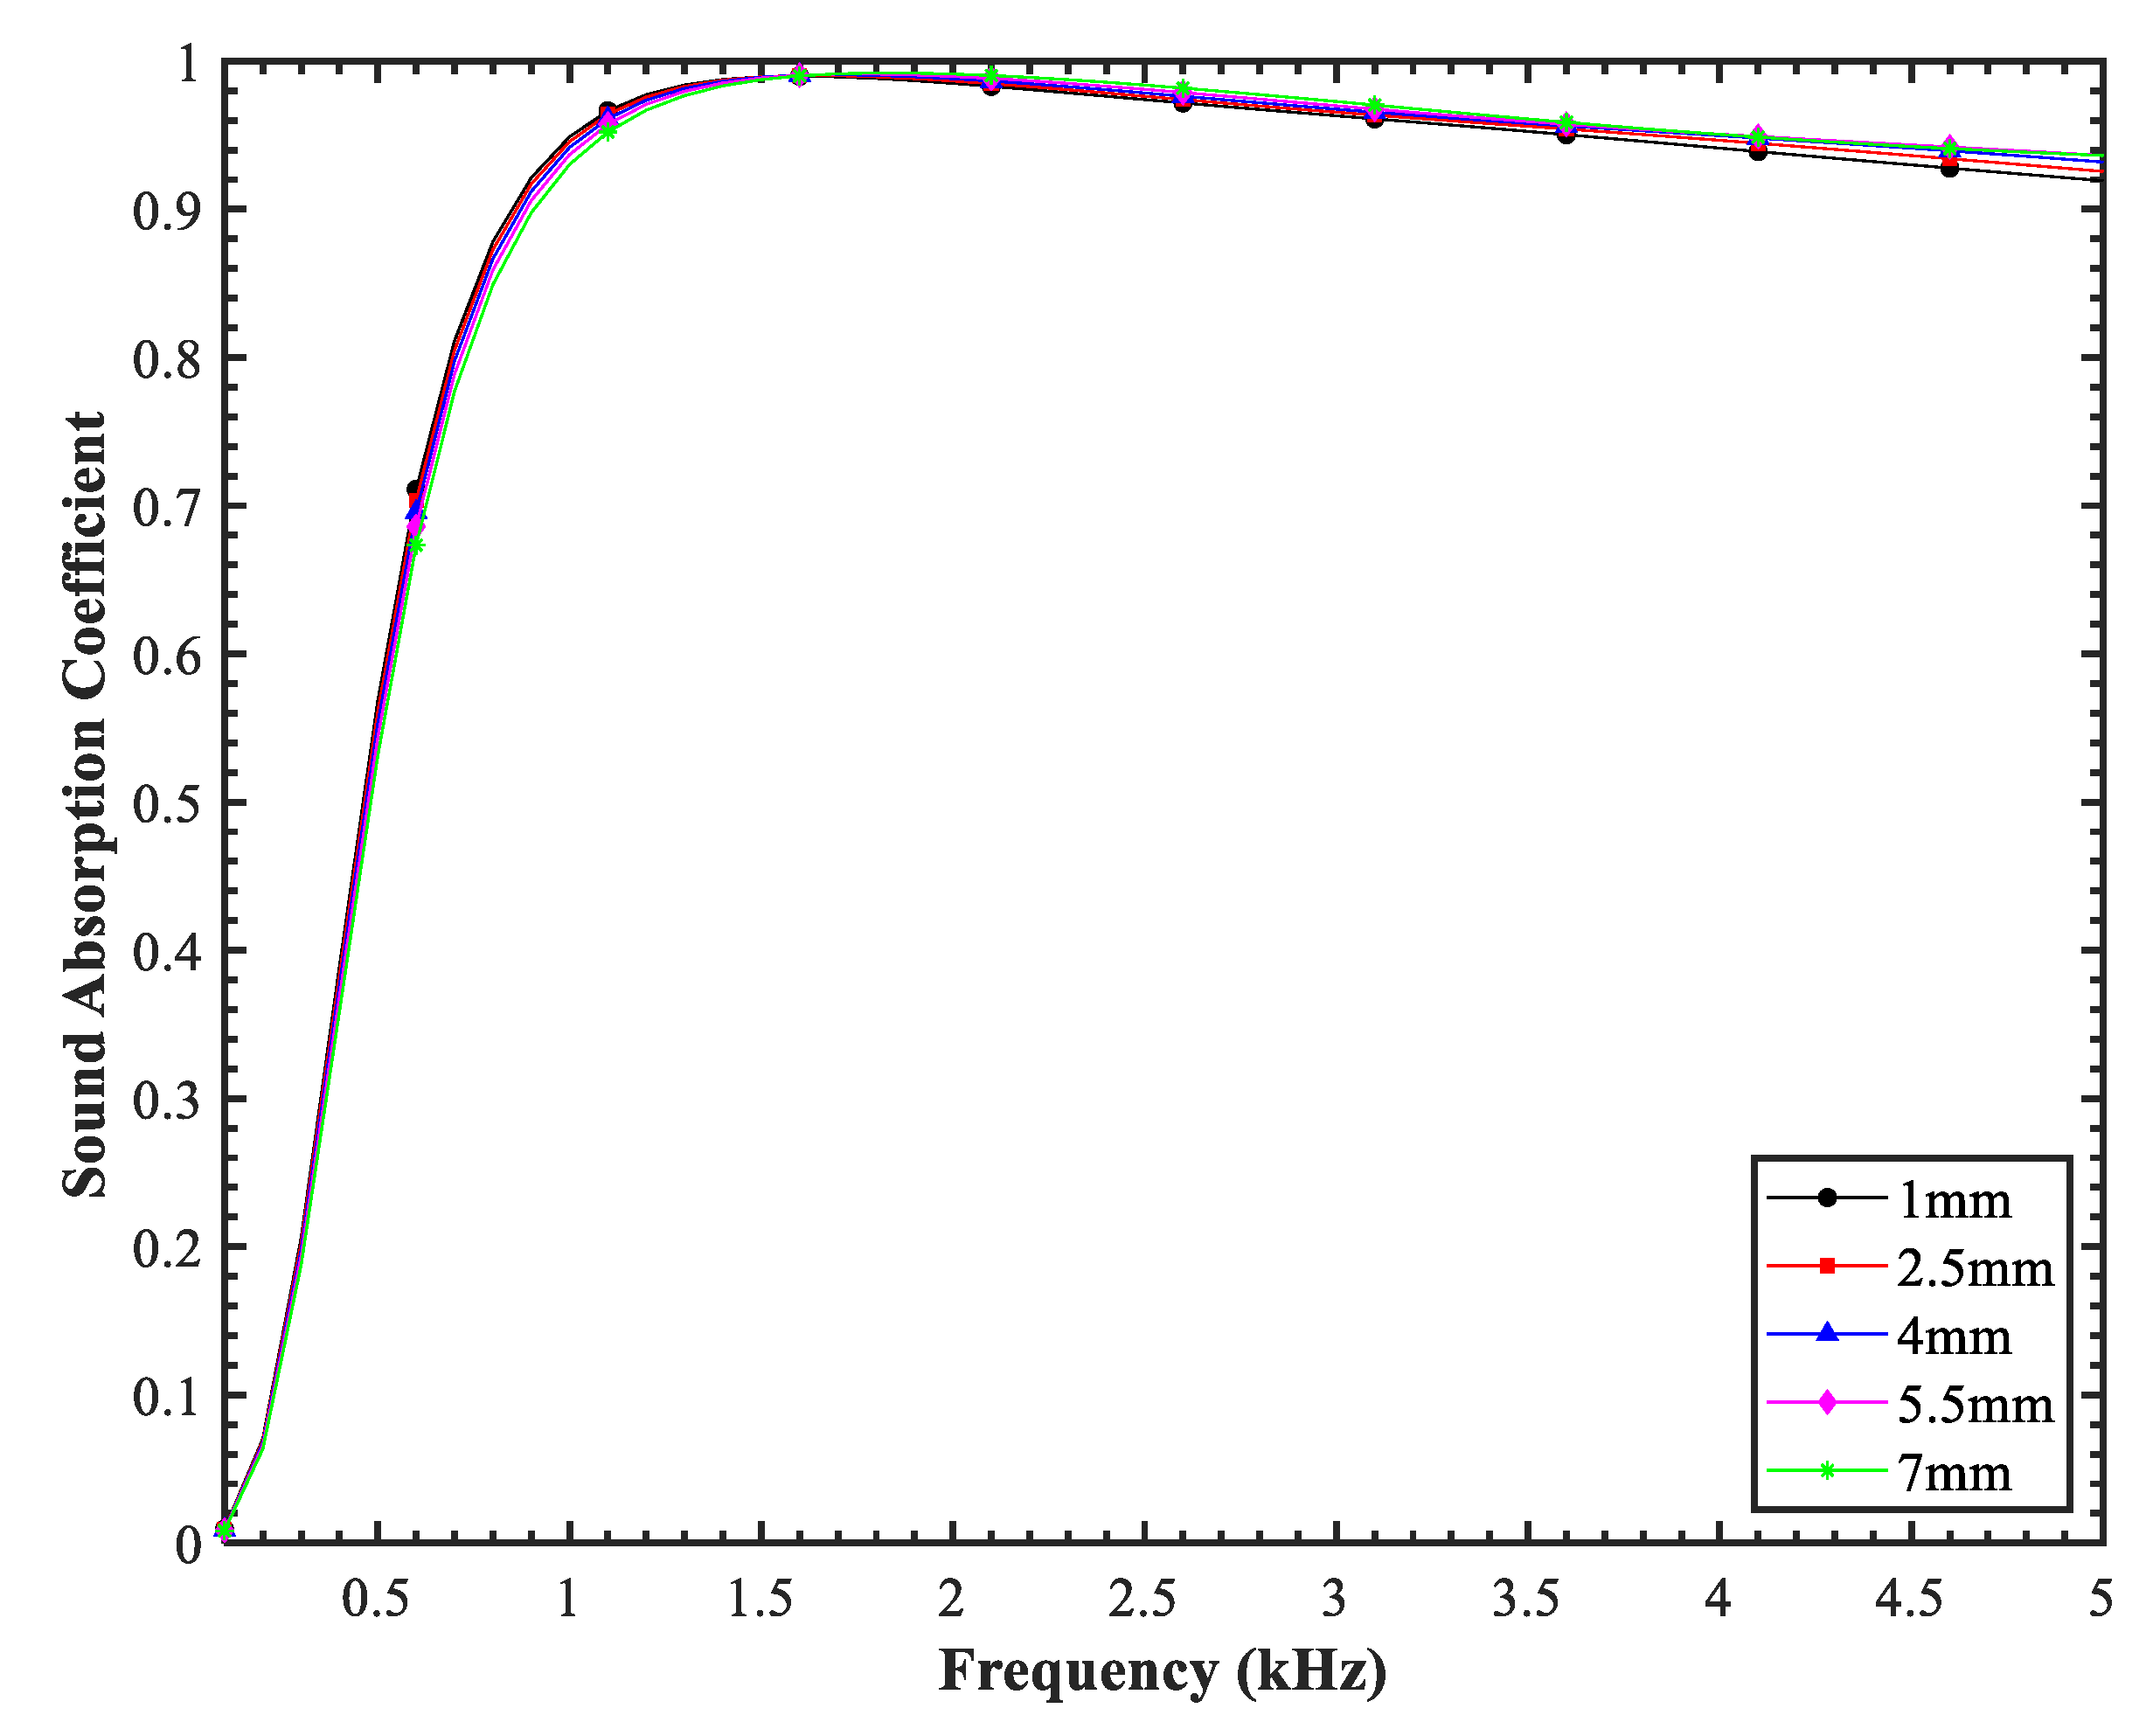
The influence of aluminum pipe wall thicknesses on LRMA sound absorption is presented in Figure 11. In the analysis, the inner diameter of the aluminum pipe keeps constant, and the wall thickness is changed by the outer diameter. The LRMA’s acoustic performance is evaluated for aluminum pipe wall thicknesses of 1 mm, 2.5 mm, 4 mm, 5.5 mm, and 7 mm. Within the 500–2000 Hz band, the average sound absorption coefficients are 0.92, 0.91, 0.91, 0.91, and 0.91, respectively, and within the 2000–5000 Hz band, they are 0.95, 0.96, 0.96, 0.96, and 0.96. Results show that thicker walls produce a marginal decline in low-frequency absorption but yield a slight enhancement in performance at frequencies above the absorption peak.

5.1.3. Influence of Lattice Period

Figure 12 presents the influence of the lattice period on the sound absorption of the LRMA. The lattice period is set as 60 mm, 65 mm, 70 mm, 75 mm, and 80 mm. In the 500–2000 Hz frequency range, the corresponding average sound absorption coefficients of the LRMA are 0.92, 0.92, 0.92, 0.91, and 0.90, respectively, while in the 2000–5000 Hz range they are 0.93, 0.94, 0.95, 0.96, and 0.96. As the lattice period increases, the absorption peak shifts toward higher frequencies, accompanied by a reduction in low-frequency absorption, as shown in Figure 12. Conversely, at frequencies above the absorption peak, the sound absorption performance decreases when the lattice period is reduced. This behavior is primarily attributed to a greater acoustic impedance mismatch between the LRMA and water when the lattice period becomes smaller, which limits sound transmission into the material and reduces energy dissipation.

5.1.4. Influence of Face Sheet Thickness

The influence of face sheet thickness on absorption of the LRMA is illustrated in Figure 13. In this analysis, face sheets with thicknesses of 1 mm, 2 mm, 3 mm, 4 mm, and 5 mm are examined. Increasing the face sheet thickness causes the first absorption peak of the LRMA to shift slightly toward higher frequencies, accompanied by a pronounced reduction in low-frequency absorption. In the 2000–5000 Hz range, the mean sound absorption coefficient is 0.96 for 1 mm thickness, 0.95 for 2 mm, 0.95 for 3 mm, 0.94 for 4 mm, and 0.93 for 5 mm. These results indicate that thinner face sheets improve the absorption capability. The primary mechanism lies in the fact that a thicker face sheet increases the acoustic impedance mismatch between the LRMA and the surrounding water medium, thereby impeding sound wave penetration into the rubber layer, reducing internal energy dissipation, and ultimately diminishing absorption.

5.2. Influence of Hydrostatic Pressure

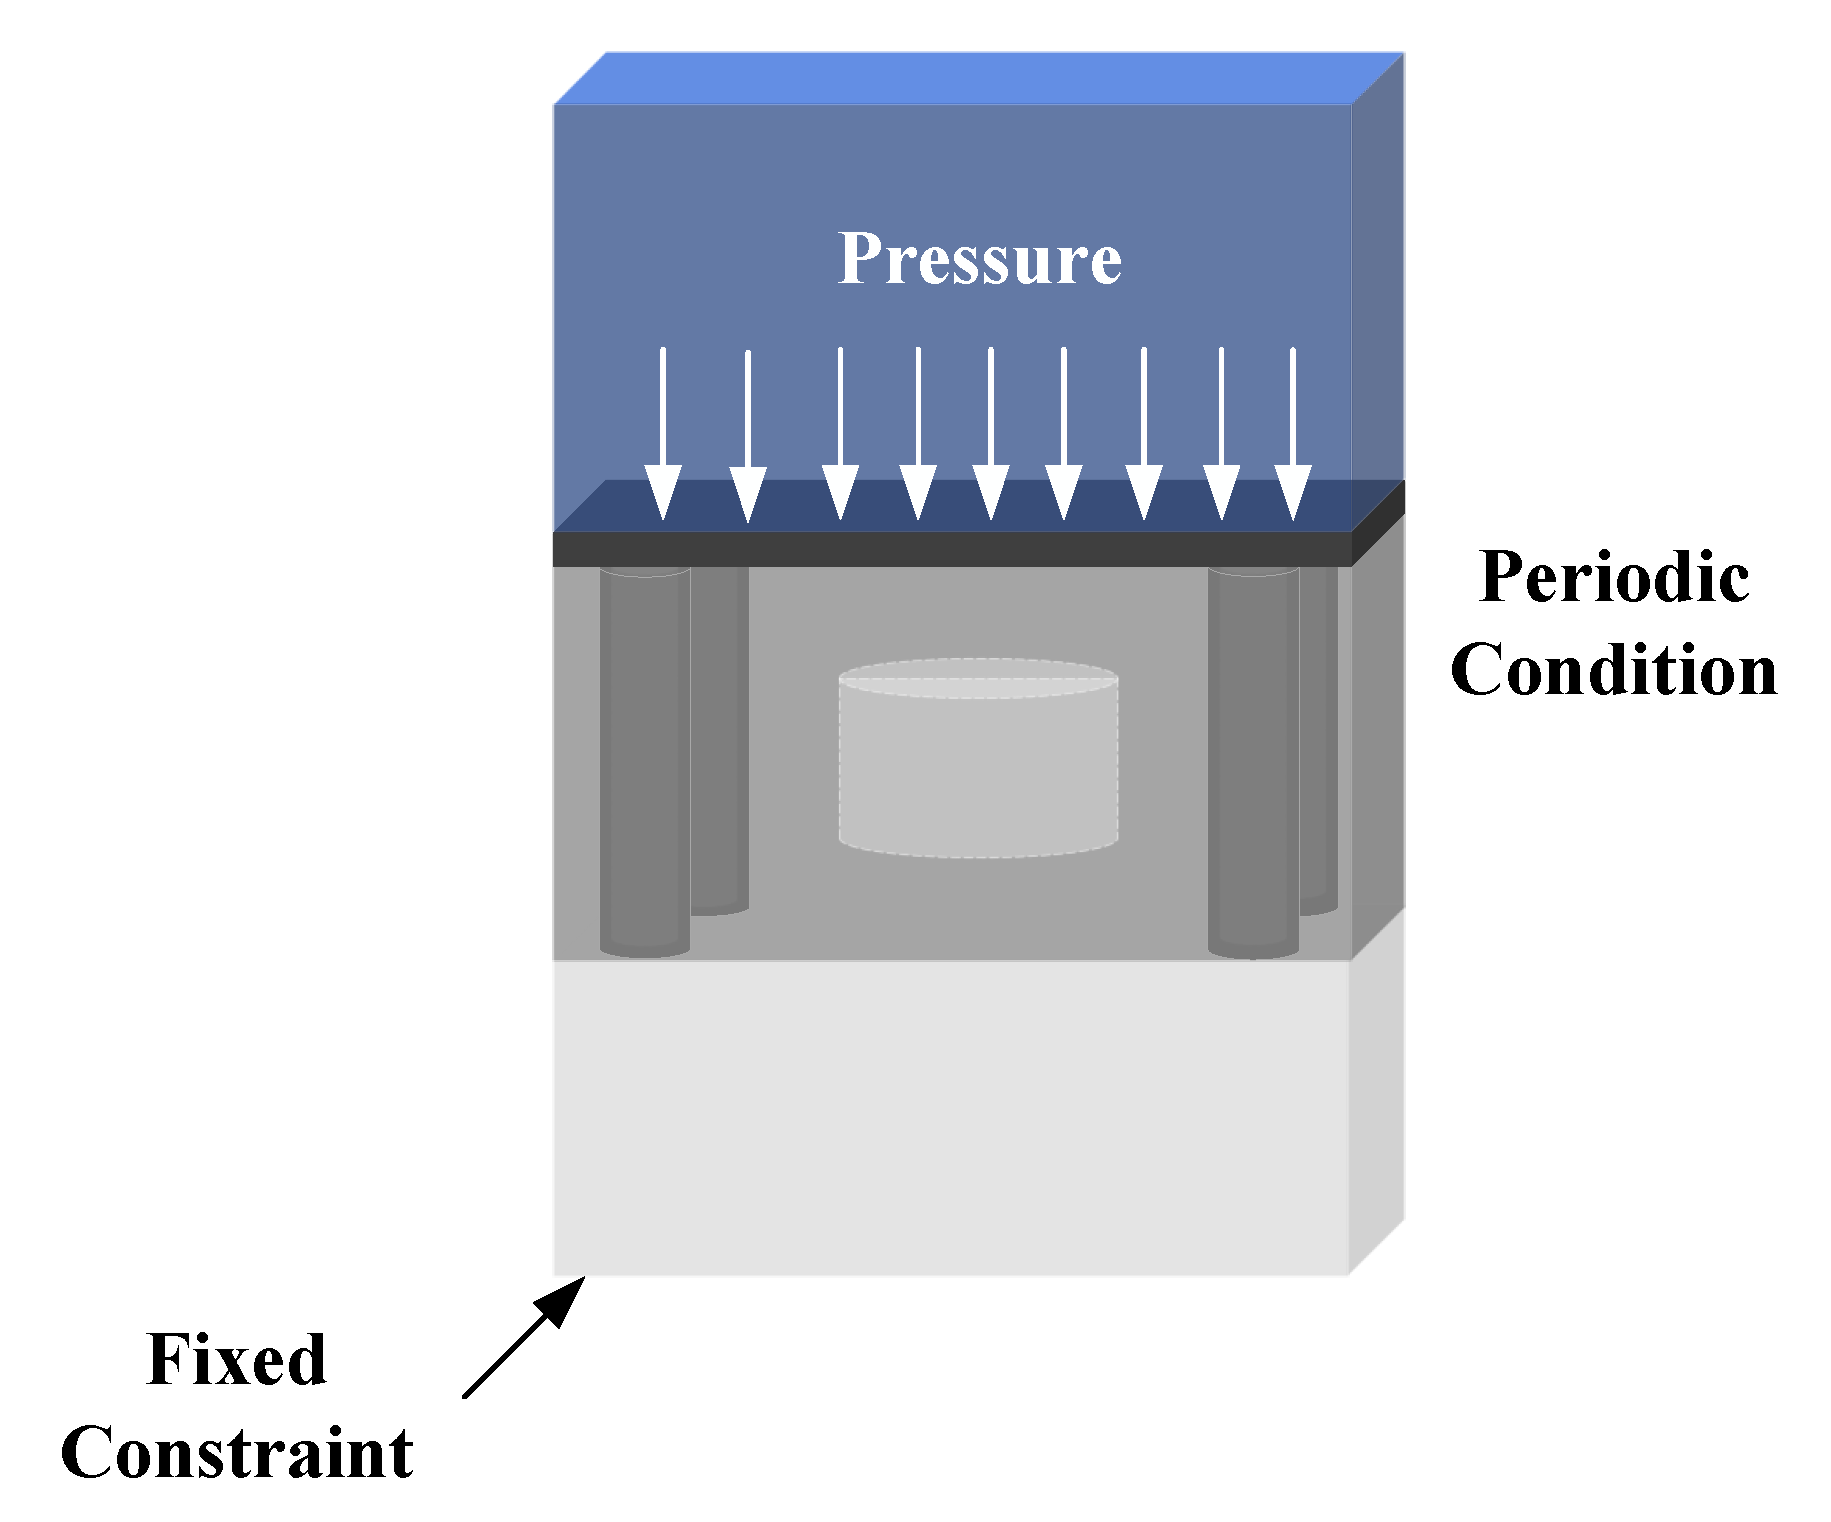
To systematically study the influence of pressure load on the sound absorption performance of the LRMA, a finite element model under pressure is established using COMSOL 5.1 Multiphysics, as illustrated in Figure 14. Fixed constraints are applied to the steel backing, and a uniform pressure load is applied to the aluminum face. Period condition is also applied to the four side faces. After simulating the initial pressure field, the Moving Mesh (ALE) Interface in COMSOL is used to export the geometry deformed by the pressure. This deformed geometry is then utilized as the input for the subsequent acoustic simulation. The acoustic physics settings, boundary conditions, and frequency-domain solver parameters are reconfigured to perform a fully coupled acoustic–structure interaction analysis. Finally, the sound absorption coefficient curve of the LRMA under pressure is obtained. The acoustic and structural domains are discretized using free tetrahedral finite elements for the three-dimensional (3D) solid and fluid media, while mapped quadrilateral elements are applied at coupling interfaces. The final mesh contains 17,378 elements, with local refinement applied in regions of high acoustic pressure and displacement gradients. A frequency-domain solver with a step of 10 Hz is employed.
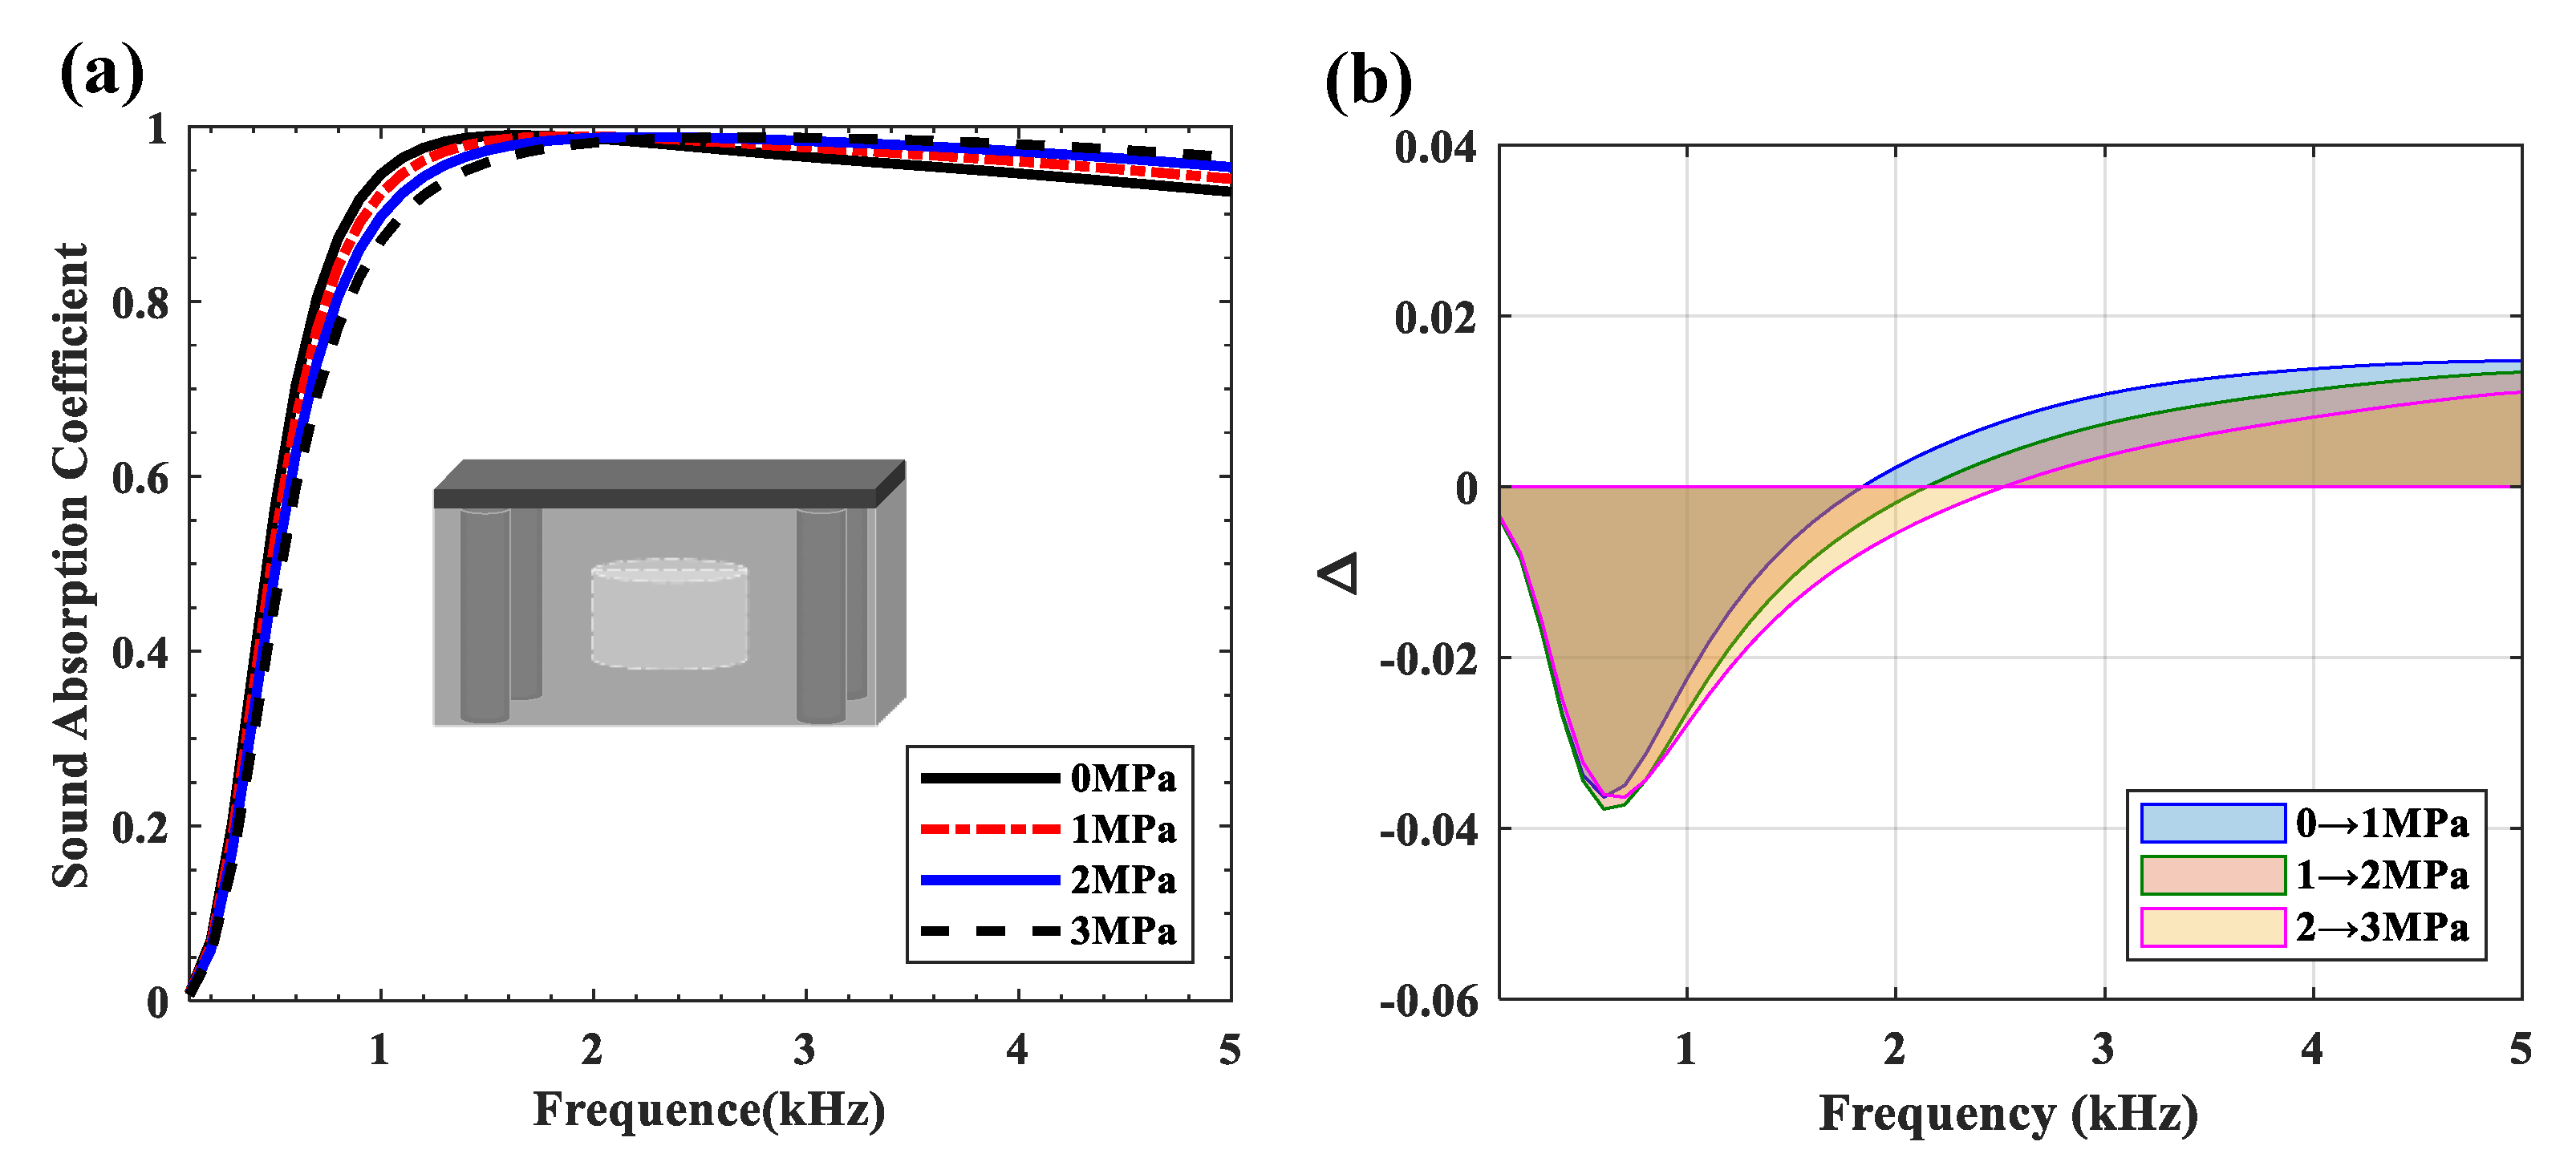
Figure 15 depicts the impact of hydrostatic pressure on the LRMA’s sound absorption coefficient. As the hydrostatic pressure increases, the absorption peak shifts slightly toward higher frequencies while the low-frequency absorption decreases, as shown in Figure 15a, beyond the frequency of the absorption peak, and the LRMA sound absorption coefficient increases. The sound absorption coefficient variation is defined as Δ ( f ) = ( α n α n 1 ) , n = 1, 2, 3. Here, α n ( α n 1 ) denotes the sound absorption coefficient under hydrostatic pressure n ( n 1 ) MPa and α 0 denotes the sound absorption coefficient without hydrostatic pressure. The sound absorption coefficient variation is depicted in Figure 15b. It can be seen that the max of value of Δ is less than 0.04, which means that the design of the LRMA shows good hydrostatic pressure resistance.

6. Experiment

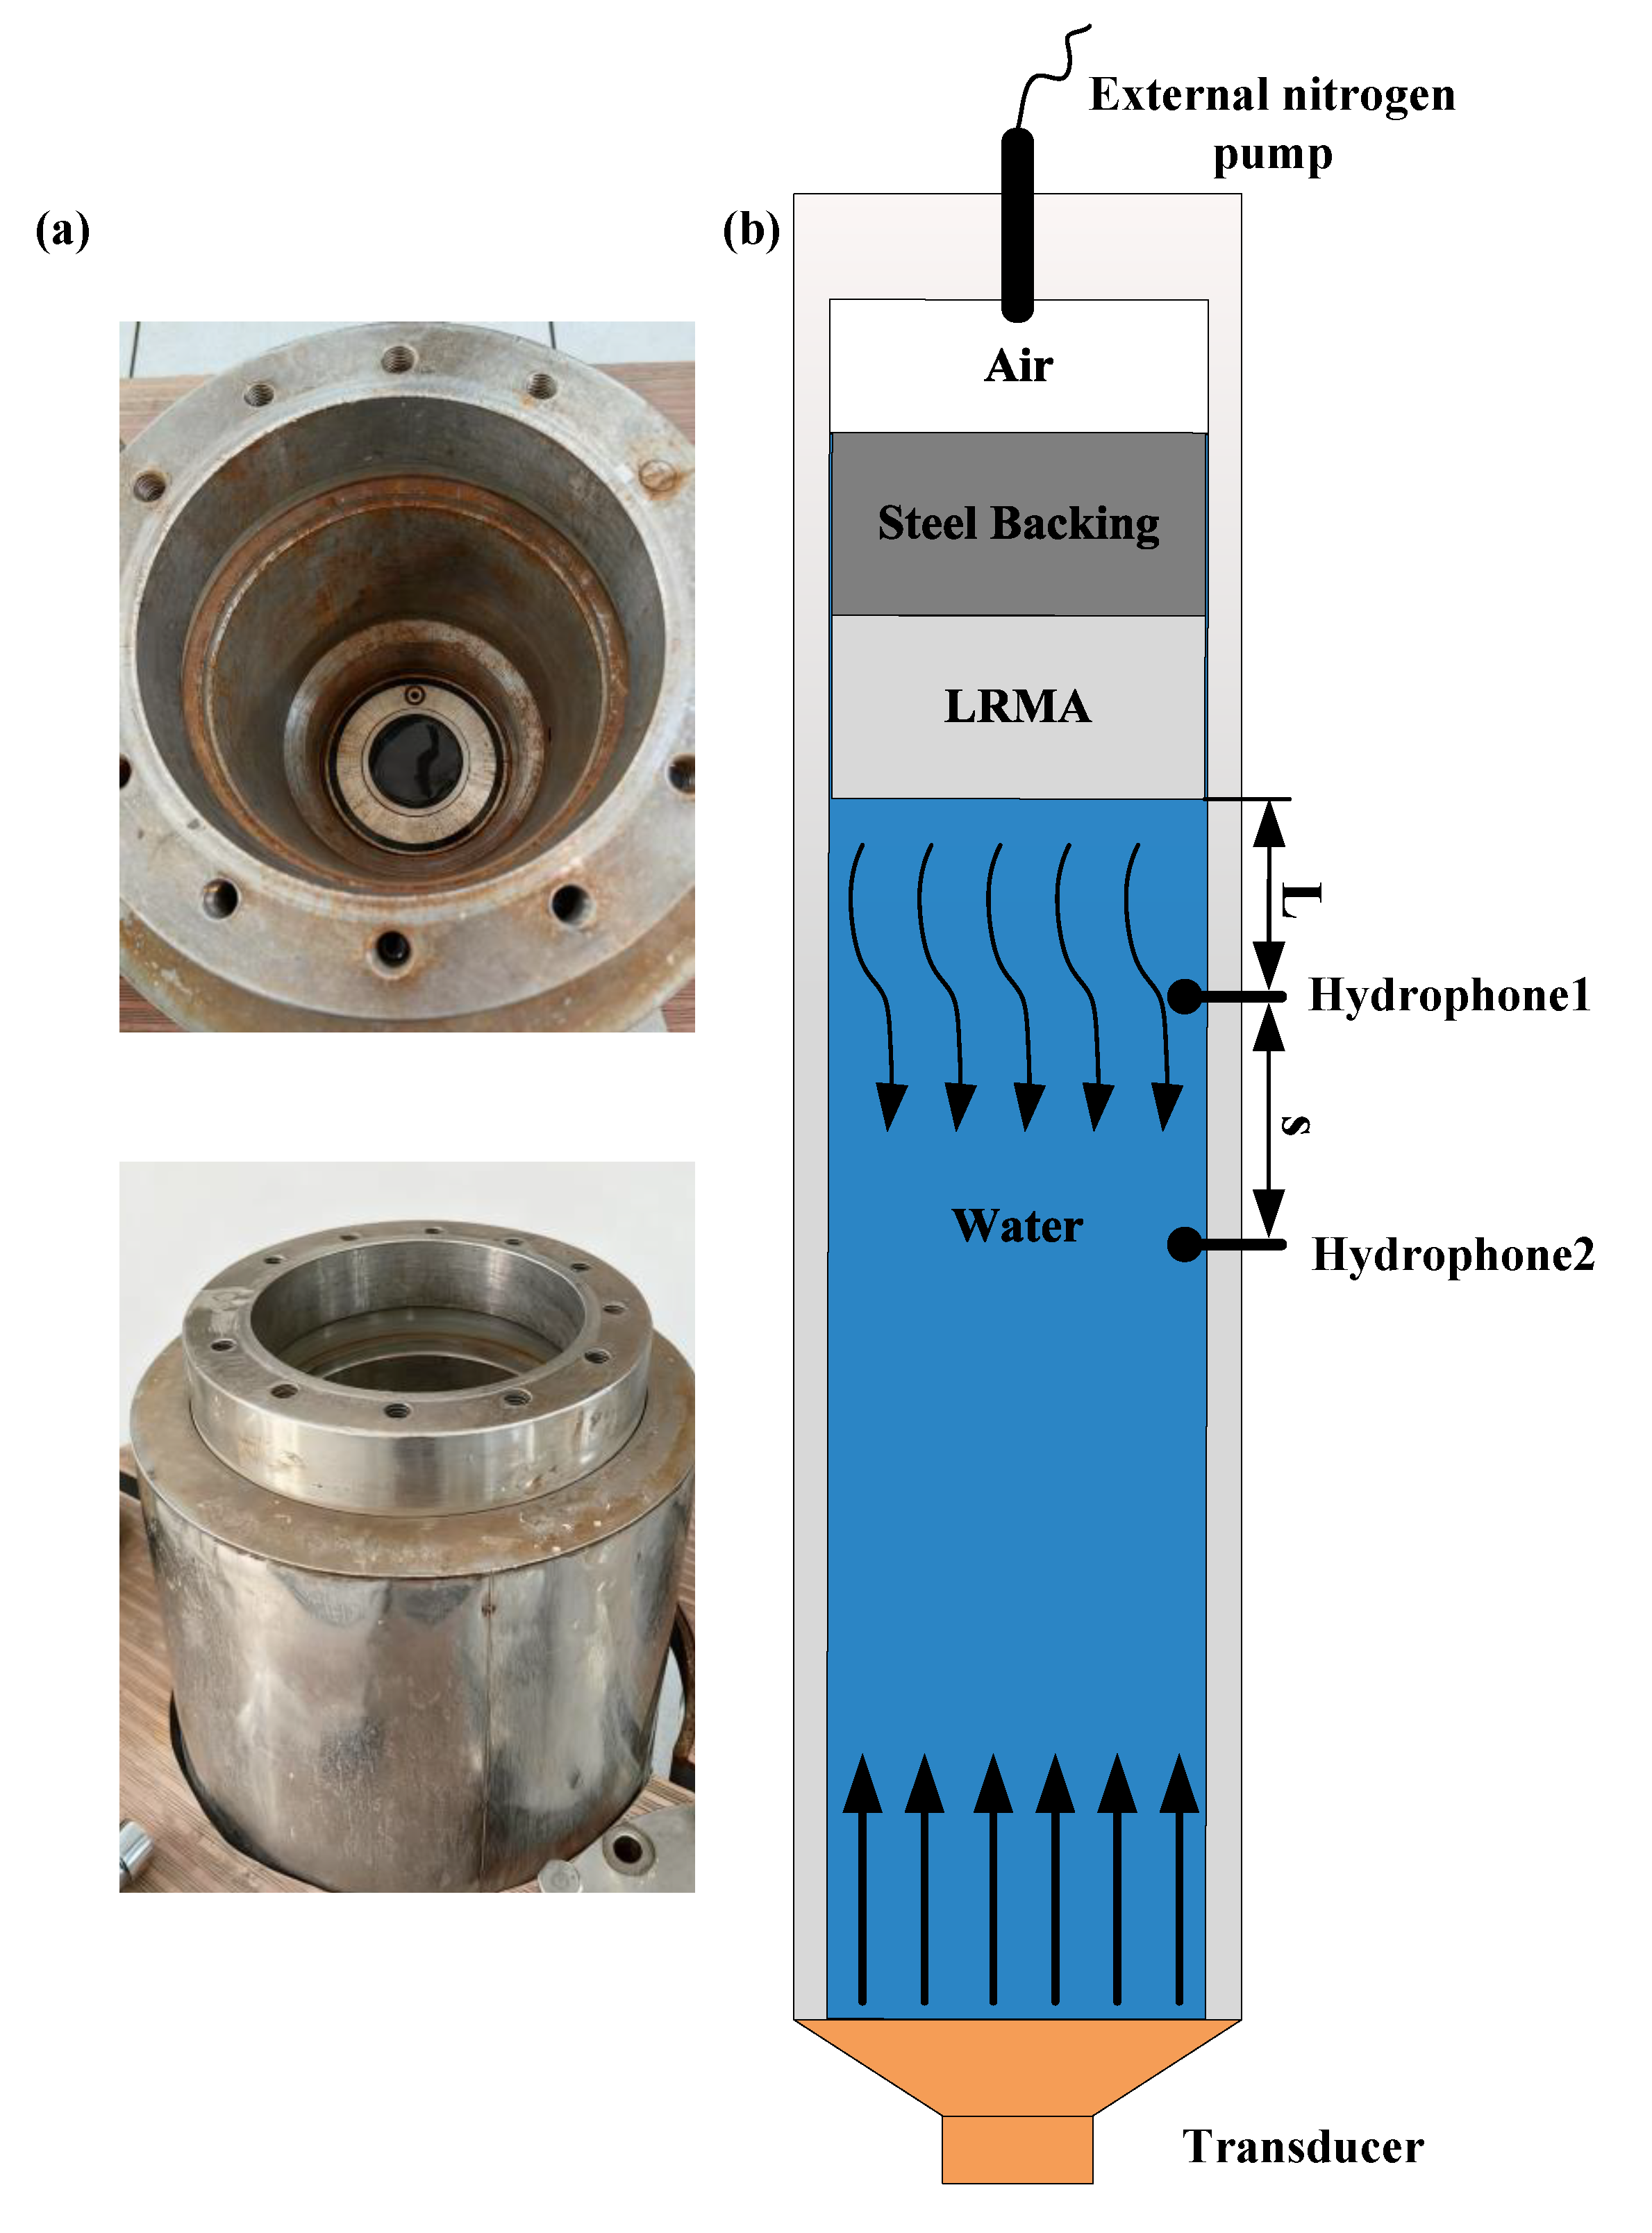
Figure 16 shows the actual photograph of the pulse tube used in the experiment and the experimental schematic diagram. The experimental methodology is based on a frequency response function method (FRFM) utilizing two hydrophones [52]. The frequency response function H 12 = p 2 / p 1 is obtained from the ratio of the acoustic pressures measured by Hydrophone 1 (denoted as p 1 ) and Hydrophone 2 (denoted as p 2 ). The complex pressure reflection coefficient R is given by
R = H 12 e j k L e j k ( L + s ) e j k ( L + s ) H 12 e j k L ,
where the parameter L represents the distance from Hydrophone 1 to the sample surface and s denotes the spacing between the two hydrophones.
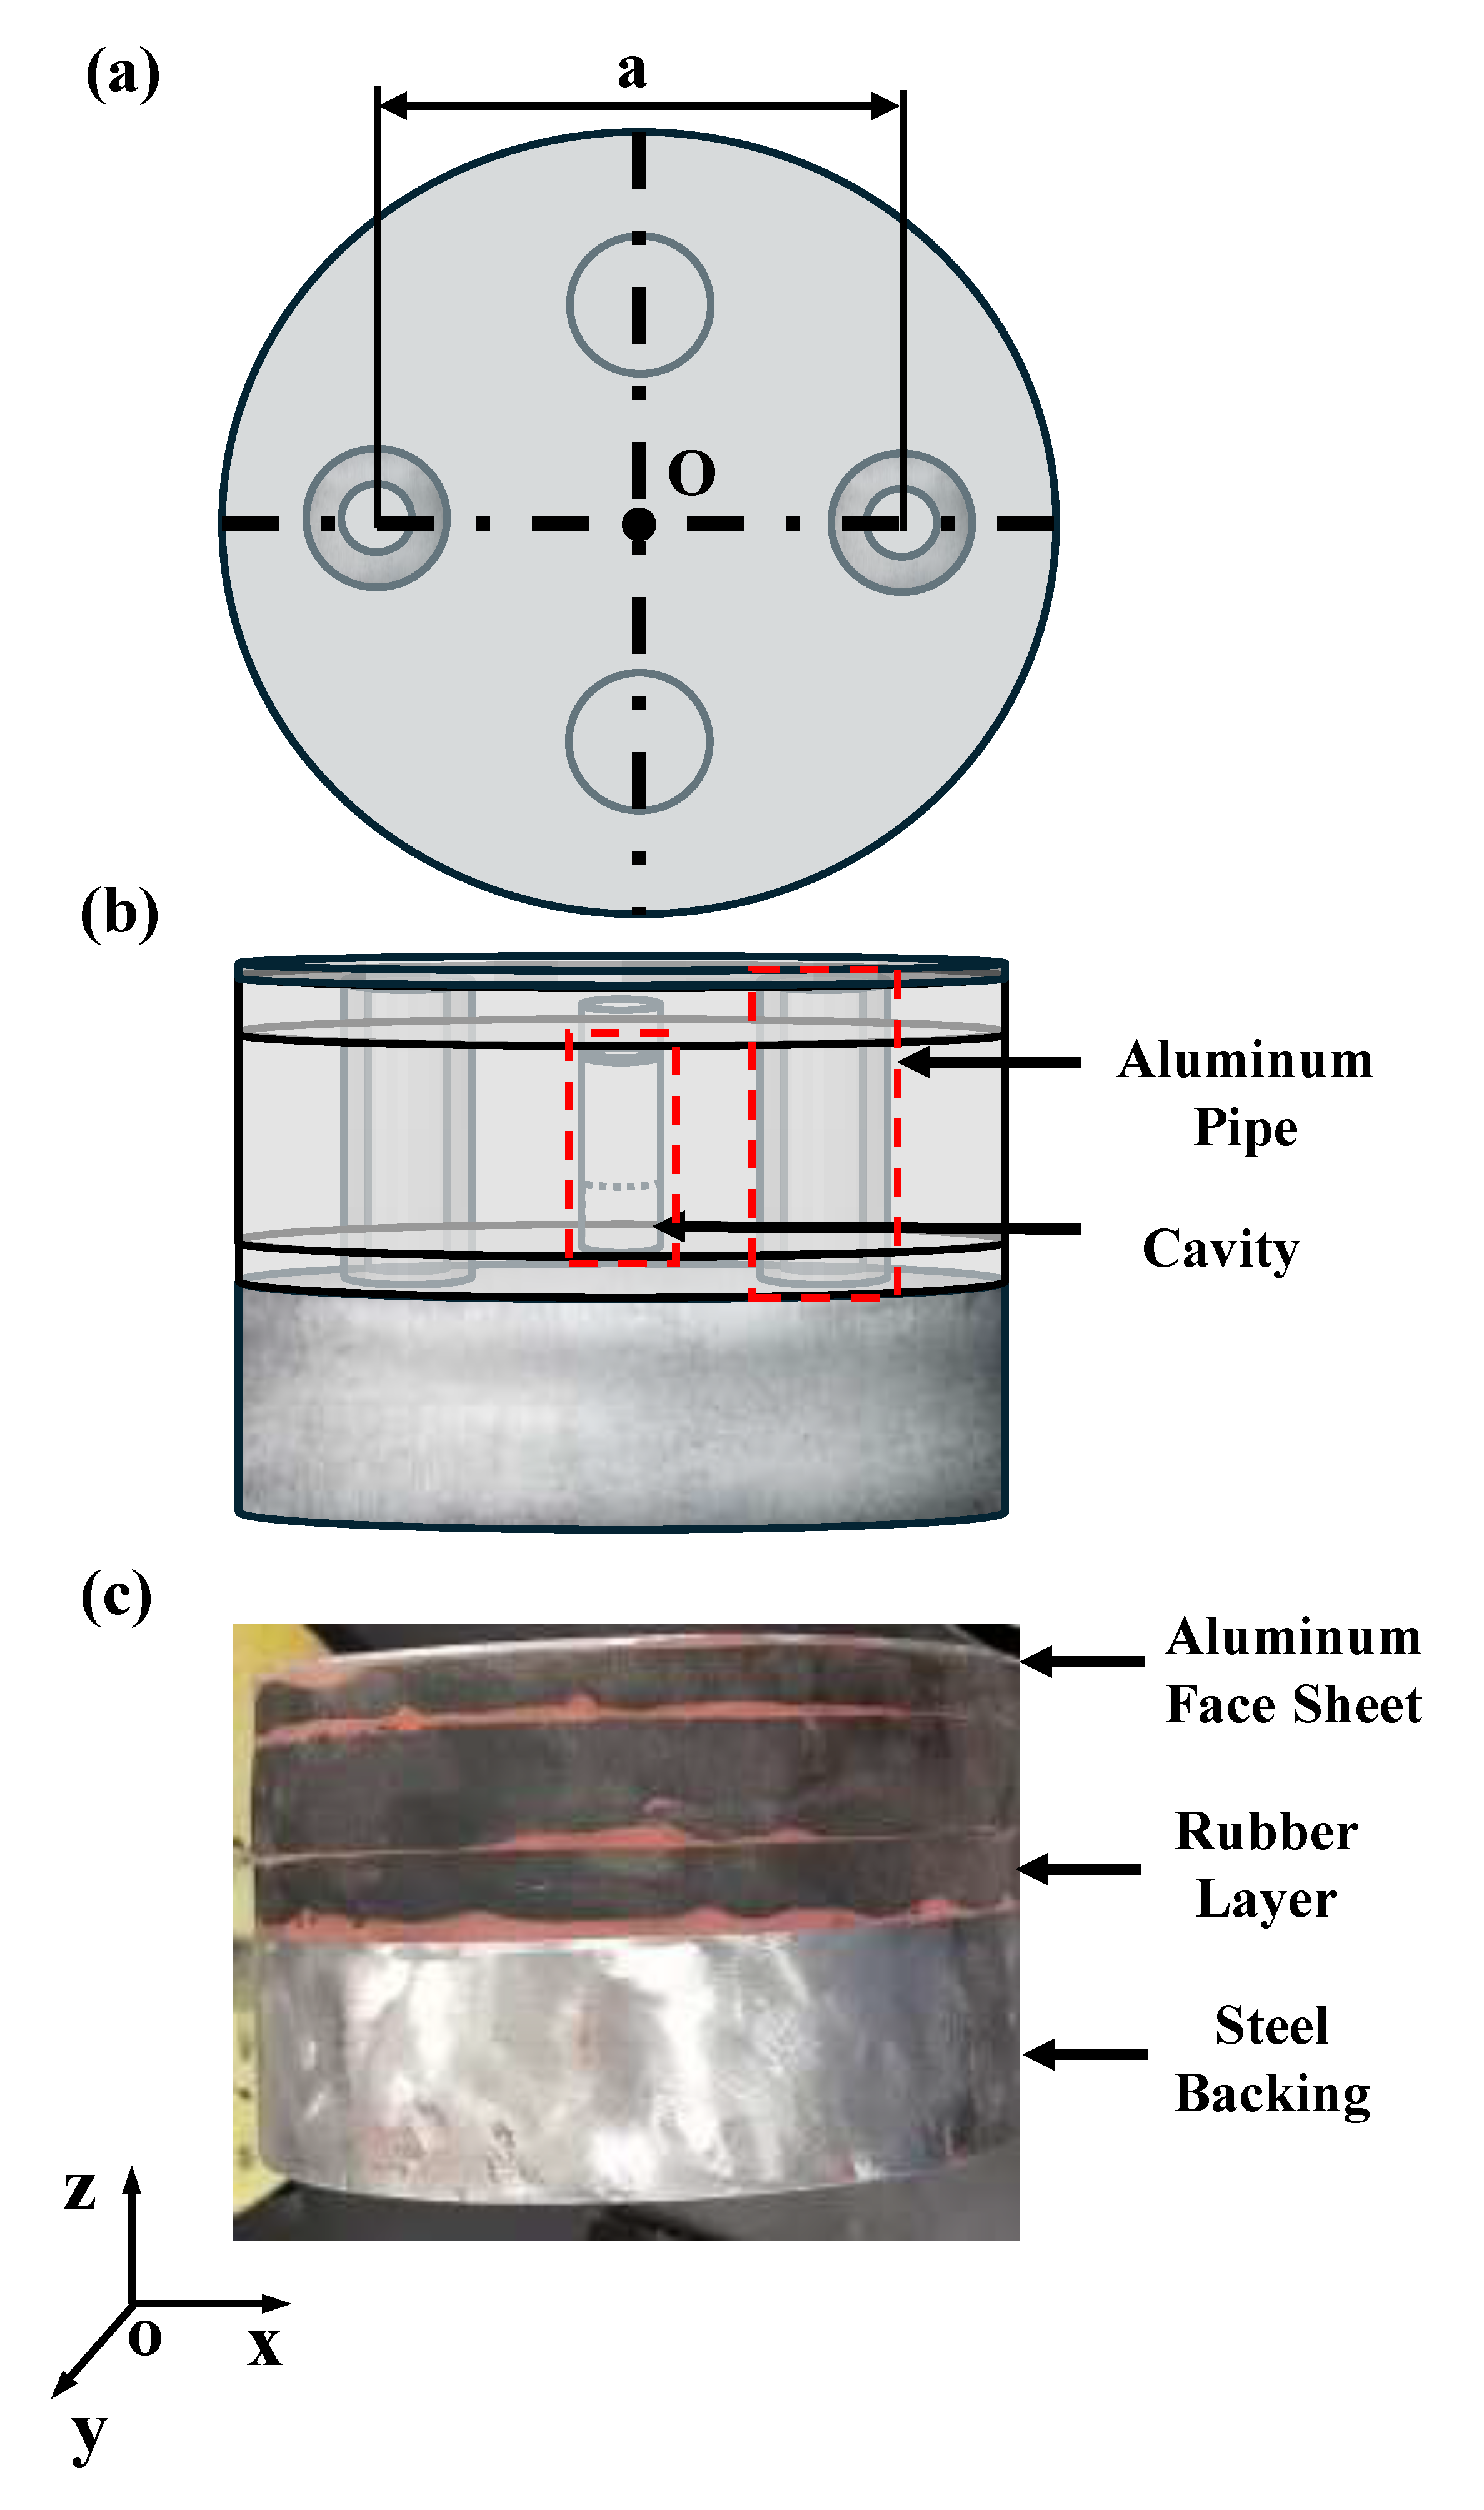
Considering the limitations of the experimental setup, the inner diameter of the impedance pipe is 120 mm. The sample is a short cylinder with a total diameter D = 118 mm. The schematic structure and actual photo of the LRMA sample are shown in Figure 17. Figure 17a,b shows the top and front views of the inner structures using the semi-transparent technique. Figure 17c is the actual photo of the LRMA sample. Other structural parameters in the sample are used according to the optimized structural parameters in Section 4. The filling rate of the cavities is 1.05% in the actual sample, which is almost equal to that of the unit cell of the design. The sample is adhered on a steel backing with thickness of 4 cm.
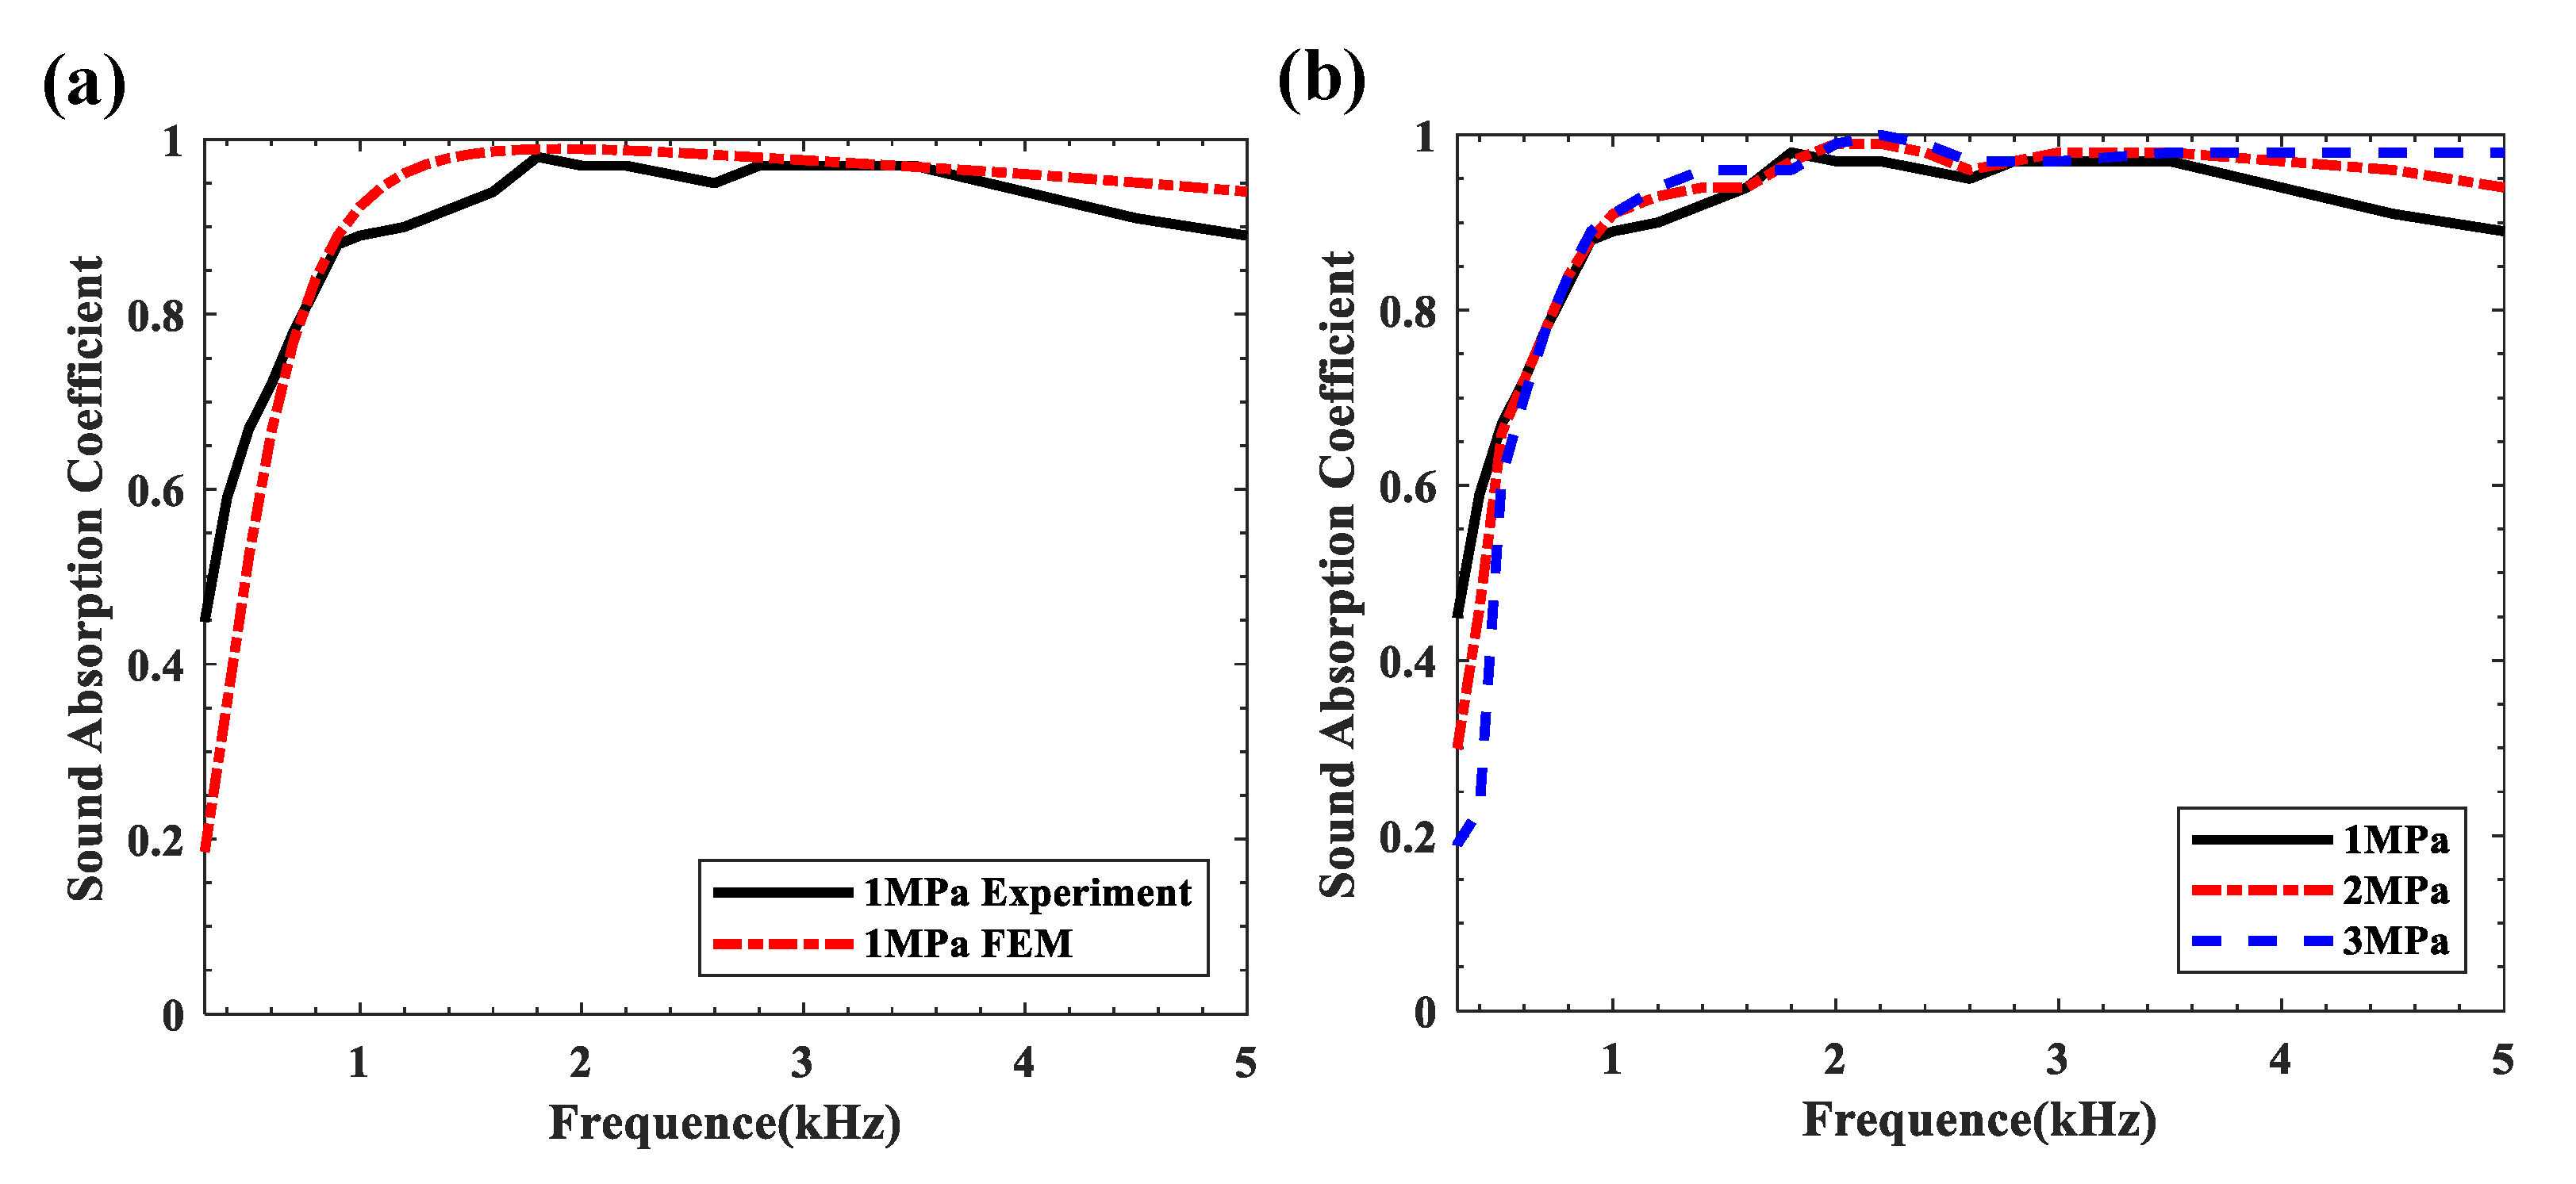
Figure 18a resents a comparison between the experimentally measured and simulated sound absorption coefficients of the LRMA at a hydrostatic pressure of 1 MPa. The sound absorption coefficient by the experiment coincides well with that from simulation, which demonstrates the validation of the experiment and calculation. The average sound absorption coefficient by the experiment is 0.86 in the frequency range of 500–2000 Hz, 0.95 within the frequency range of 2000–5000 Hz.
Figure 18b shows the sound absorption coefficients of the LRMA measured through experiments at hydrostatic pressures of 1 MPa, 2 MPa, and 3 MPa. In the low-frequency range, the sound absorption coefficient decreases with increasing pressure. To gain exactly the absorption variation, Table 4 lists the average sound absorption coefficients under various hydrostatic pressures. It can be observed that, in the frequency range of 500–5000 Hz, it changes by 0.02 from hydrostatic pressure 1 MPa to 3 MPa, which further demonstrates the design of the LRMA having good hydrostatic pressure resistance.

7. Conclusions

A lattice of aluminum pipes as Z-direction reinforced structures was integrated in the meta-absorber to reduce the deteriorating of the absorption under high hydrostatic pressure. An acoustic–structure interaction model of the LRMA was developed using the finite element method (FEM). The sound absorption mechanism of the LRMA was clarified by the displacement, energy dissipation density, and surface acoustic impedance at typical frequencies. It was shown that the acoustic absorption was determined by the surface acoustic impedance ratio, the value of the energy dissipation density, and its area induced by the acoustic scattering among the structures. To further explored the underlying mechanism, we systematically investigated how structural parameters affect the sound absorption performance of the LRMA. The structures were optimized to match the ready-made rubber for low-frequency and wideband absorption of the LRMA using the differential evolution algorithm. The optimization results showed that the LRMA with a thickness of 41 mm achieved an average sound absorption coefficient of 0.94 in the frequency range of 500–5000 Hz, which was demonstrated by the experimental results. At 700 Hz, the sound absorption coefficient reached 0.8, and the thickness-to-wavelength ratio in water was only 1.91%, which showed deep subwavelength characteristics. Finally, the experimental results demonstrated that the optimized LRMA achieved an average sound absorption coefficient exceeding 0.9 under hydrostatic pressures of 1 MPa, 2 MPa, and 3 MPa within the frequency range of 500–5000 Hz, indicating that the present LRMA design exhibits excellent pressure resistance.

Author Contributions

Formal analysis, Z.Y.; Writing—original draft, Z.Y.; Writing—review & editing, Z.Y., H.Z., W.Z., Y.S., Z.L., J.Y. and J.W. All authors have read and agreed to the published version of the manuscript.

Funding

This research was funded by the National Natural Science Foundation of China (No. 52171327).

Data Availability Statement

The original contributions presented in this study are included in the article material. Further inquiries can be directed to the corresponding author.

Conflicts of Interest

The authors declare no conflicts of interest.

References

  1. Chen, X.; Meng, L.; Liu, Z.; Yang, F.; Jiang, X.; Yang, J. Multifunctional Integrated Underwater Sound Absorption Materials: A Review. Appl. Sci. 2023, 13, 5368. [Google Scholar] [CrossRef]
  2. Zhang, W.; Xin, F. Broadband low-frequency sound absorption via Helmholtz resonators with porous material lining. J. Sound Vib. 2024, 578, 118330. [Google Scholar] [CrossRef]
  3. Gao, N.; Wang, M.; Liang, X.; Pan, G. On-demand prediction of low-frequency average sound absorption coefficient of underwater coating using machine learning. Results Eng. 2025, 25, 104163. [Google Scholar] [CrossRef]
  4. Zhang, Z.; Zhao, Y.; Gao, N. Recent study progress of underwater sound absorption coating. Eng. Rep. 2023, 5, e12627. [Google Scholar] [CrossRef]
  5. Liu, J.; Yang, H.; Zhao, H.; Wang, Y.; Yu, D.; Wen, J. A lightweight waterborne acoustic meta-absorber with low characteristic impedance rods. Int. J. Mech. Sci. 2023, 255, 108469. [Google Scholar] [CrossRef]
  6. Zeng, Q.; Zhang, J.; Xiao, Y.; Li, B.; Hou, H.; Cheng, B. Low-frequency broadband underwater metasurface with embedded curved rough neck. Mod. Phys. Lett. B 2025, 39, 2550132. [Google Scholar] [CrossRef]
  7. Lane, R. Absorption mechanisms for waterborne sound in Alberich anechoic layers. Ultrasonics 1981, 19, 28–30. [Google Scholar] [CrossRef]
  8. Meng, H.; Wen, J.; Zhao, H.; Wen, X. Optimization of locally resonant acoustic metamaterials on underwater sound absorption characteristics. J. Sound Vib. 2012, 331, 4406–4416. [Google Scholar] [CrossRef]
  9. Meng, T. Simplified model for predicting acoustic performance of an underwater sound absorption coating. J. Vib. Control 2014, 20, 339–354. [Google Scholar] [CrossRef]
  10. Gao, N.; Huang, Q.; Pan, G. Ultra-broadband sound absorption characteristics in underwater ultra-thin metamaterial with three layer bubbles. Eng. Rep. 2024, 6, e12939. [Google Scholar] [CrossRef]
  11. Jia, X.; Jin, G.; Shi, K.; Bu, C.; Ye, T. A hybrid acoustic structure for low-frequency and broadband underwater sound absorption. J. Low Freq. Noise Vib. Act. Control 2022, 41, 1160–1177. [Google Scholar] [CrossRef]
  12. Zhao, H.; Liu, Y.; Yu, D.; Wang, G.; Wen, J.; Wen, X. Absorptive properties of three-dimensional phononic crystal. J. Sound Vib. 2007, 303, 185–194. [Google Scholar] [CrossRef]
  13. Shi, K.; Jin, G.; Liu, R.; Ye, T.; Xue, Y. Underwater sound absorption performance of acoustic metamaterials with multilayered locally resonant scatterers. Results Phys. 1999, 12, 132–142. [Google Scholar] [CrossRef]
  14. Zou, H.; Su, L.; Zhang, Y.; Zhang, M.; Yu, W.; Wang, X.; Xia, X.; Chen, H.; Zhang, X.; Zhao, A. A novel broadband underwater sound absorption metastructure with multi-oscillators. Int. J. Mech. Sci. 2024, 271, 109137. [Google Scholar] [CrossRef]
  15. Wang, H.; Cui, Z.; He, X.; Ren, Z.; Xiang, P.; Dong, H. Underwater acoustic absorbing metamaterials by material-structure-functionality collaborative optimization. Int. J. Mech. Sci. 2024, 281, 109573. [Google Scholar] [CrossRef]
  16. Liu, Y.; Xiao, B.; Yan, K.; Liu, J.; Chen, M.; Jiang, H.; Wang, Y. Rayleigh beam underwater metamaterial for low-frequency and broadband sound absorption. Mater. Today Commun. 2024, 38, 108332. [Google Scholar] [CrossRef]
  17. Feng, F.; He, C.; Cui, Z.; Ying, T.; Cai, J.; Tao, M. Topology optimization of multi-material underwater broadband sound absorption metamaterial based on genetic algorithm. J. Acoust. Soc. Am. 2025, 157, 3482–3496. [Google Scholar] [CrossRef] [PubMed]
  18. Veselago, V.G. The electrodynamics of substances with simultaneously negative values of ε and μ. Sov. Phys. Uspekhi 1968, 10, 509. [Google Scholar] [CrossRef]
  19. Pendry, J.B.; Schurig, D.; Smith, D.R. Controlling Electromagnetic Fields. Science 2006, 312, 1780–1782. [Google Scholar] [CrossRef] [PubMed]
  20. Cummer, S.; Christensen, J.; Alù, A. Controlling sound with acoustic metamaterials. Nat. Rev. Mater. 2016, 1, 16001. [Google Scholar] [CrossRef]
  21. Iannace, G.; Ciaburro, G.; Trematerra, A. Metamaterials acoustic barrier. Appl. Acoust. 2021, 181, 108172. [Google Scholar] [CrossRef]
  22. Davies, B.; Szyniszewski, S.; Dias, M.A.; de Waal, L.; Kisil, A.; Smyshlyaev, V.P.; Cooper, S.; Kamotski, I.V.; Touboul, M.; Craster, R.V.; et al. Roadmap on metamaterial theory, modelling and design. J. Phys. D Appl. Phys. 2025, 58, 203002. [Google Scholar] [CrossRef]
  23. Feng, Y.; Qiao, J.; Li, L. Acoustic behavior of composites with gradient impedance. Mater. Des. 2020, 193, 108870. [Google Scholar] [CrossRef]
  24. Zhang, Y.; Cheng, L. Ultra-thin and broadband low-frequency underwater acoustic meta-absorber. J. Mech. Sci. 2021, 210, 106732. [Google Scholar] [CrossRef]
  25. Fang, X.; Yin, X.; Wu, J.; Li, Y.; Li, H.; Wang, W.; Li, Y.; Wu, W. Underwater metagratings for sub-kilohertz low frequency and broadband sound absorption. Int. J. Mech. Sci. 2023, 260, 108630. [Google Scholar] [CrossRef]
  26. Shi, K.; Li, D.; Hu, D.; Shen, Q.; Jin, G. A New Multi-Mechanism Synergistic Acoustic Structure for Underwater Low-Frequency and Broadband Sound Absorption. J. Mar. Sci. Eng. 2023, 11, 2373. [Google Scholar] [CrossRef]
  27. Gao, N.; Lu, K. An underwater metamaterial for broadband acoustic absorption at low frequency. Appl. Acoust. 2020, 169, 107500. [Google Scholar] [CrossRef]
  28. Zhang, H.; Hao, P.; Gao, Y.; Cheng, Y.; Li, G.; Hu, N.; Qi, Z. Underwater Low-Frequency Sound Absorbing Metamaterials Based on Wave-Mode Transformation and Local Resonance Mechanism. Acta Phys. Pol. A 2021, 140, 455–462. [Google Scholar] [CrossRef]
  29. Zhang, R.; Song, Y.; Hou, H.; Gao, N. Underwater metastructure with broadband sound absorption capability in low-frequency range above 20 Hz. Mod. Phys. Lett. B 2020, 35, 2150039. [Google Scholar] [CrossRef]
  30. Shi, K.; Li, D.; Hu, D.; Yu, X.; Ding, C.; Jin, G. Underwater sound absorption characteristics of the acoustic metamaterials with multiple coupling substructure. J. Low Freq. Noise Vib. Act. Control 2025, 44, 1001–1019. [Google Scholar] [CrossRef]
  31. Wei, Y.; Zhao, H.; Wang, Y.; Zhong, J.; Sun, Y.; Zheng, Z.; Yang, H.; Wen, J. A review of hydroacoustic absorbing materials under hydrostatic pressure. Chin. Sci. Bull. 2024, 69, 2368–2379. (In Chinese) [Google Scholar] [CrossRef]
  32. Wang, Y.; Zhao, H.; Yan, H.; Zhang, H.; Li, T.; Wang, C.; Liu, J.; Zhong, J.; Yu, D.; Wen, J. Acoustically soft and mechanically robust hierarchical metamaterials in water. Phys. Rev. Appl. 2023, 20, 054015. [Google Scholar] [CrossRef]
  33. Zhang, Y.; Tong, M.; Rui, X.; Wang, G.; Yang, F. Deep-subwavelength and hydrostatic-pressure-resistant meta-absorber for broadband low-frequency underwater sound. Appl. Phys. Express 2024, 17, 077001. [Google Scholar] [CrossRef]
  34. Shi, K.; Hu, D.; Li, D.; Jin, G. Sound absorption behaviors of composite functionally graded acoustic structure under hydrostatic pressure. Appl. Acoust. 2023, 211, 109474. [Google Scholar] [CrossRef]
  35. Zhang, Y.; Tong, M.; Rui, X.; Wang, G.; Yang, F.; Zhou, Q.; Cheng, L.; He, B. Ultrathin and pressure-resistant meta-coating with embedded tree-shaped acoustic black hole for broadband low-frequency underwater sound absorption. Appl. Acoust. 2024, 225, 110171. [Google Scholar] [CrossRef]
  36. Gao, N.; Yu, H.; Liu, J.; Deng, J.; Huang, Q.; Chen, D.; Pan, G. Experimental investigation of composite metamaterial for underwater sound absorption. Appl. Acoust. 2023, 211, 109466. [Google Scholar] [CrossRef]
  37. Jiang, H.; Wang, Y. Phononic glass: A robust acoustic-absorption material. J. Acoust. Soc. Am. 2012, 132, 694–699. [Google Scholar] [CrossRef] [PubMed]
  38. Yang, J.; Zhao, X.; Wang, K.; Song, H.; Cui, Z. Influence of Deformation on Sound-Absorbing Performance Under Hydrostatic Pressure. Int. J. Acoust. Vib. 2022, 27, 344–353. [Google Scholar] [CrossRef]
  39. Zheng, Z.; Yang, H.; Wang, M.; Wang, Y.; Zhong, J.; Ma, W.; Liang, C.; Wen, J.; Chen, X. Realization of lightweight and pressure-resistant sandwich metasurfaces for underwater sound absorption through topology optimization. Mech. Syst. Signal Process. 2025, 224, 112205. [Google Scholar] [CrossRef]
  40. Wang, L.; Hu, Y.; Zhang, X.; Li, S.; Li, S.; Zhang, H. Design and compressive behavior of a wood-based pyramidal lattice core sandwich structure. Eur. J. Wood Wood Prod. 2020, 78, 123–134. [Google Scholar] [CrossRef]
  41. Karagözlü, C.; Ayli, E.; Tanabi, H.; Sabuncuoglu, B. Artificial neural networks for predicted bending properties of additively manufactured pyramidal lattice truss core sandwich structures. Mater. Today Commun. 2025, 47, 112926. [Google Scholar] [CrossRef]
  42. Guo, H.; Yuan, H.; Zhang, J.; Ruan, D. Review of sandwich structures under impact loadings: Experimental, numerical and theoretical analysis. Thin-Walled Struct. 2024, 196, 111541. [Google Scholar] [CrossRef]
  43. Zhou, Z.; Chen, M. Predicting effective moduli of a Z-reinforced core with cavities using a novel theoretical approach and a micromechanics finite element method. Int. J. Mech. Sci. 2019, 161, 105085. [Google Scholar] [CrossRef]
  44. Shi, C.; Wang, J.; Zhu, J.; Ni, A.; Li, X. Flatwise compression properties of trapezoidal lattice-web reinforced foam core sandwich composites. Acta Mater. Compos. Sin. 2022, 39, 590–600. [Google Scholar]
  45. Rasouli Rizi, S.; Nosraty, H.; Mirdehghan, S.A. Effects of stitching parameters on the flexural properties of stitched foam core sandwich composites. J. Compos. Mater. 2024, 58, 2343–2361. [Google Scholar] [CrossRef]
  46. Selver, E.; Kaya, G.; Dalfi, H. Experimental and theoretical study of sandwich composites with Z-pins under quasi-static compression loading. Adv. Struct. Eng. 2021, 24, 2720–2734. [Google Scholar] [CrossRef]
  47. Li, K.; Zhou, Z.; Huang, Z.; Lin, Y.; Chen, M.; Yang, P.; Li, Y. Underwater sound absorption characteristic of the rubber core sandwich structure with funnel-shaped cavities reinforced by carbon fiber columns. Appl. Acoust. 2023, 208, 109375. [Google Scholar] [CrossRef]
  48. Luo, Y.; Lou, J.; Zhang, Y. Sound absorption performance of composite grid sandwich structure with local resonance element. J. Vib. Shock 2022, 41, 291–296. (In Chinese) [Google Scholar]
  49. Li, K.; Mao, L.; Chen, Z.; Huang, Z.; Zhou, Z.; Li, Y. Sound absorption mechanism and characteristic of a pressure-resistant sandwich structure supported by carbon fiber truss and embedded cavities in rubber core. Appl. Acoust. 2025, 229, 110386. [Google Scholar] [CrossRef]
  50. Wang, Z.; Huang, Y.; Zhang, X.; Li, L.; Chen, M.; Fang, D. Broadband underwater sound absorbing structure with gradient cavity shaped polyurethane composite array supported by carbon fiber honeycomb. J. Sound Vib. 2020, 479, 115375. [Google Scholar] [CrossRef]
  51. Storn, R.; Price, K. Differential Evolution? A Simple and Efficient Heuristic for global Optimization over Continuous Spaces. J. Glob. Optim. 1997, 11, 341–359. [Google Scholar] [CrossRef]
  52. Chung, J.Y.; Blaser, A. Transfer function method of measuring in-duct acoustic properties. I. Theory. J. Acoust. Soc. Am. 1980, 68, 914–921. [Google Scholar] [CrossRef]
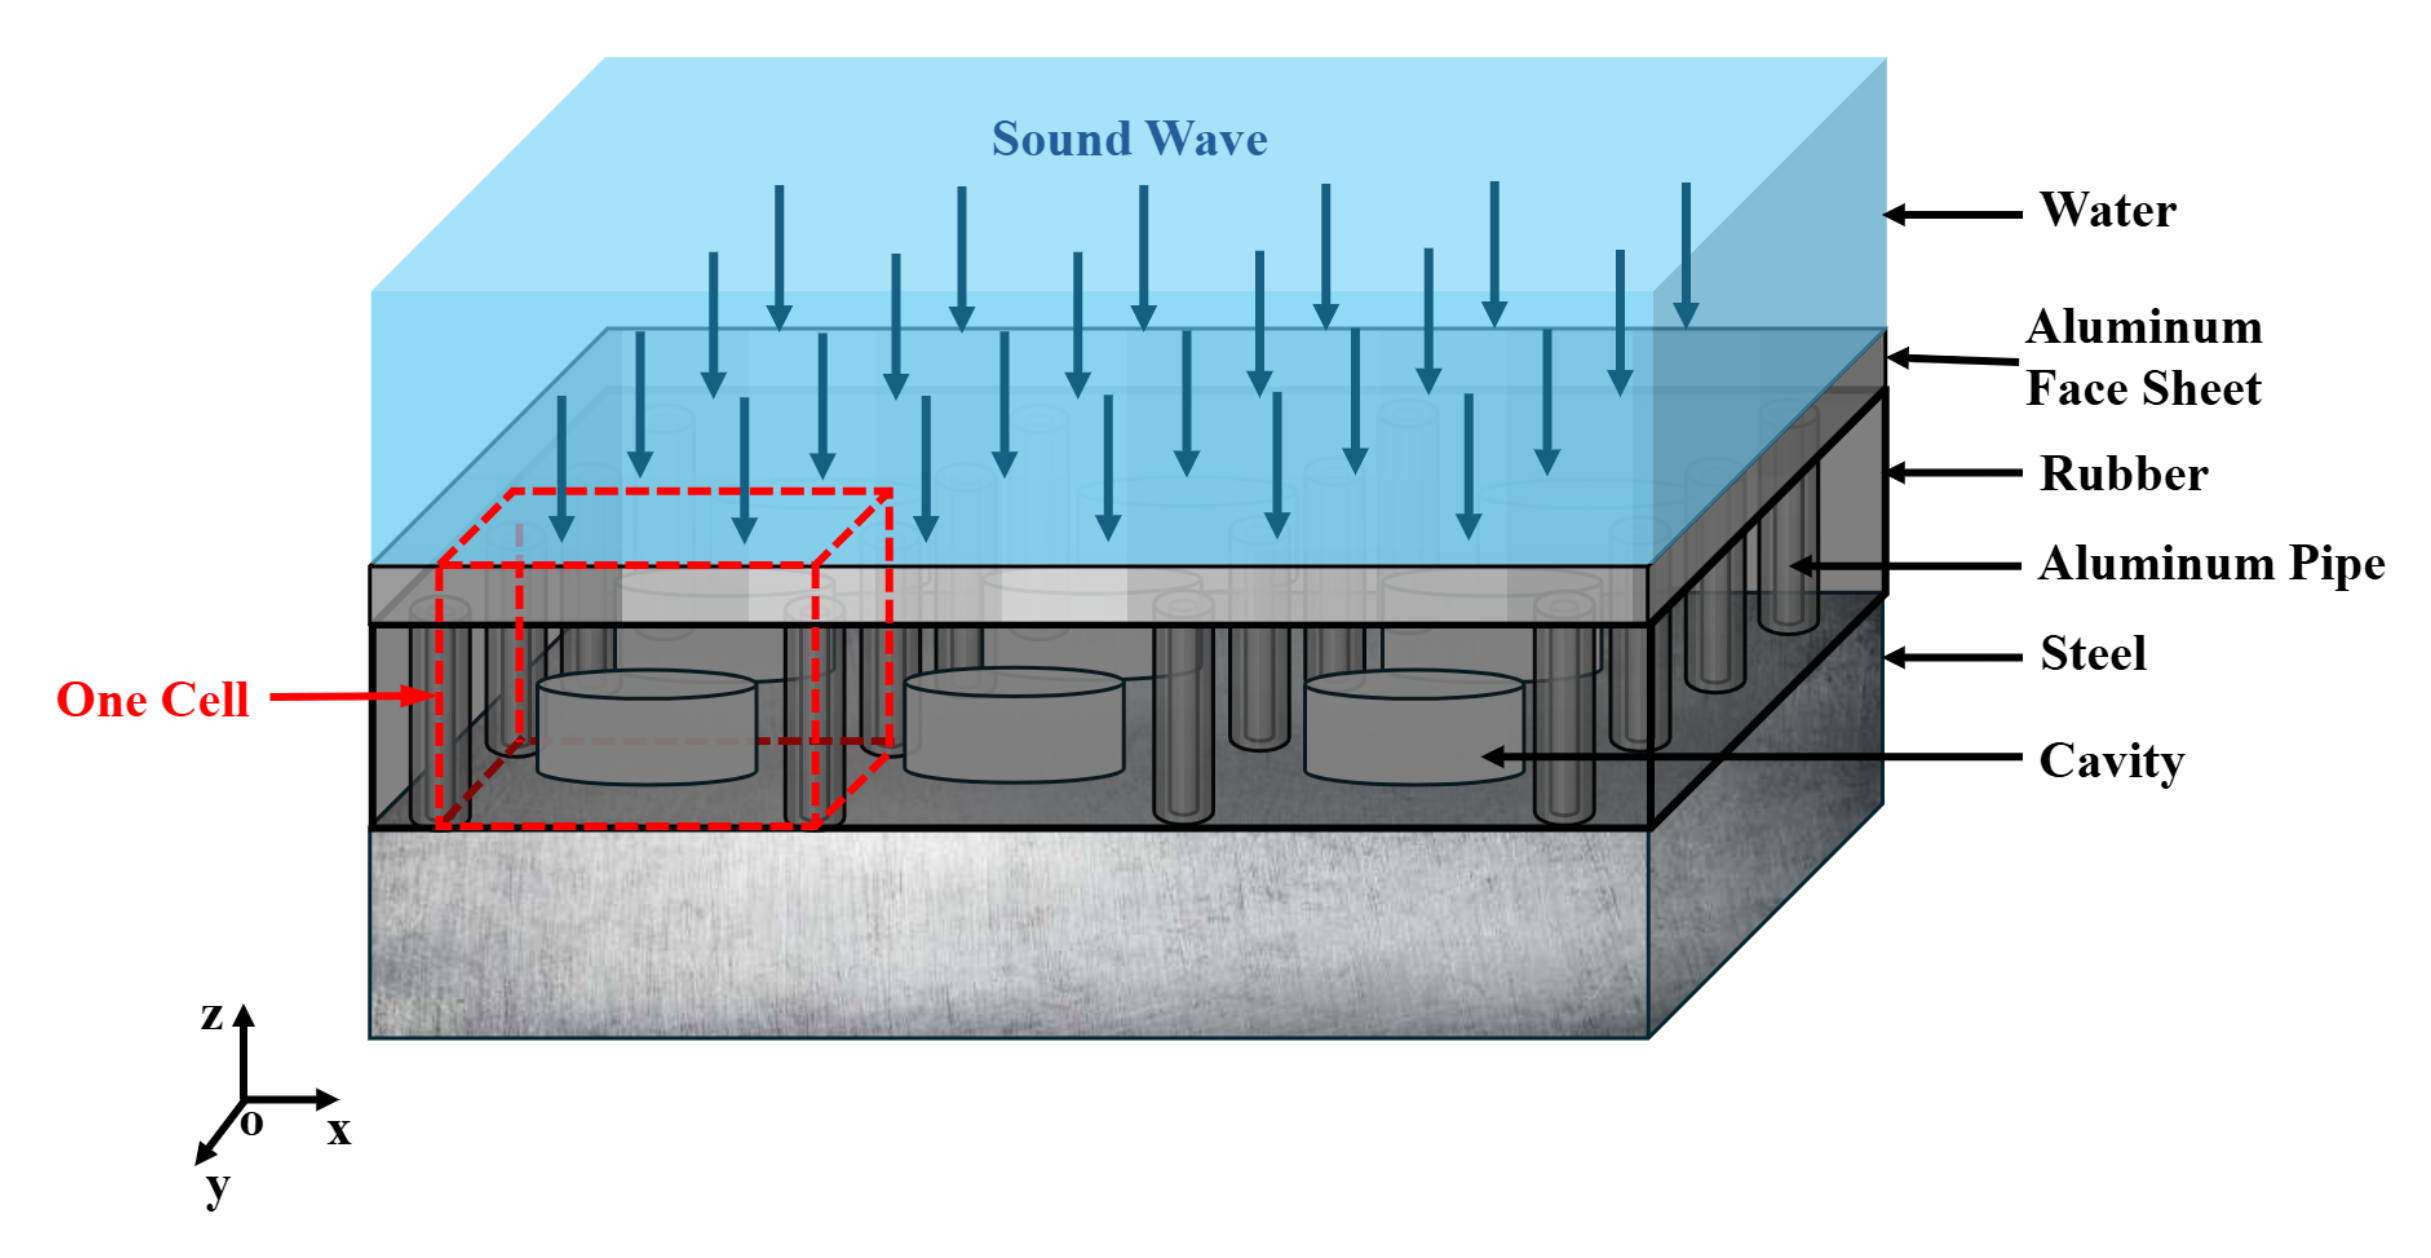
Figure 1. The LRMA and one cell structure.
Jmse 13 01944 g001
Figure 2. The LRMA structure of one unit cell. (a) Top view. (b) Diagonal cross-section view.
Jmse 13 01944 g002
Figure 3. The sound absorption coefficient of the LRMA.
Jmse 13 01944 g003
Figure 4. Experimental data and fitted curves. (a) The real part E. (b) The loss factor η .
Jmse 13 01944 g004
Figure 5. Displacement field of the LRMA at different frequencies.
Jmse 13 01944 g005
Figure 6. Energy dissipation density of the LRMA at different frequencies.
Jmse 13 01944 g006
Figure 7. Acoustic absorption coefficients before and after optimization.
Jmse 13 01944 g007
Figure 8. Normalized surface acoustic impedance ratio before and after optimization. (a) Acoustic resistance. (b) Acoustic reactance.
Jmse 13 01944 g008
Figure 9. Comparison of normalized surface acoustic impedance ratio before and after optimization among sound absorption coefficient contour pattern.
Jmse 13 01944 g009
Figure 10. Sound absorption coefficient under different cavity radius.
Jmse 13 01944 g010
Figure 11. Sound absorption coefficient under different pipe wall thicknesses.
Jmse 13 01944 g011
Figure 12. Sound absorption coefficient under different lattice periods.
Jmse 13 01944 g012
Figure 13. Sound absorption coefficient for different face sheet thicknesses.
Jmse 13 01944 g013
Figure 14. LRMA pressure simulation model.
Jmse 13 01944 g014
Figure 15. Influence of different pressures on the lattice reinforcement structure. (a) Sound absorption coefficient. (b) Sound absorption coefficient variation ( Δ ).
Jmse 13 01944 g015
Figure 16. (a) Actual photograph of the pulse tube. (b) Experimental schematic diagram.
Jmse 13 01944 g016
Figure 17. Schematic diagram and actual photo of the LRMA’s sound tube model structure. (a) Top view. (b) Front view. (c) Actual photo.
Jmse 13 01944 g017
Figure 18. (a) Absorption coefficients of the LRMA from the experiment and simulation under 1 MPa. (b) Experimental absorption coefficients at 1 MPa, 2 MPa, and 3 MPa.
Jmse 13 01944 g018
Table 1. The structure parameters of the LRMA.
Notationa R p t H c R c H t H r H g
Value (mm)905540105505
Table 2. The optimized structure parameters of the LRMA.
Notationa R p t H c R c H t H r H g
Value (mm)704.52.53057401
Table 3. The average sound absorption coefficients before and after optimization.
Frequency BandBefore OptimizationAfter Optimization
500–5000 Hz0.780.94
500–2000 Hz0.790.91
2000–5000 Hz0.770.96
Table 4. The average absorption coefficient from experiment under different pressures.
Pressure (MPa)Frequency Band (Hz)
500–5000500–20002000–5000
10.900.860.95
20.910.870.97
30.920.870.98
Disclaimer/Publisher’s Note: The statements, opinions and data contained in all publications are solely those of the individual author(s) and contributor(s) and not of MDPI and/or the editor(s). MDPI and/or the editor(s) disclaim responsibility for any injury to people or property resulting from any ideas, methods, instructions or products referred to in the content.