Article

Ecological Suitability Assessment of Larimichthys crocea in Coastal Waters of the East China Sea and Yellow Sea Based on MaxEnt Modeling

1
Marine and Fishery Institute, Zhejiang Ocean University, Zhoushan 316021, China
2
School of Fishery, Zhejiang Ocean University, Zhoushan 316022, China
3
Zhejiang Marine Fisheries Research Institute, Zhoushan Field Comprehensive Scientific Observation and Research Station of the Ministry of Agriculture and Rural Affairs Zhejiang Marine Fisheries Research Institute, Zhoushan 316021, China
4
Jiangsu Marine Fisheries Research Institute, Nantong 226007, China
*
Author to whom correspondence should be addressed.
J. Mar. Sci. Eng. 2025, 13(10), 1945; https://doi.org/10.3390/jmse13101945 (registering DOI)
Submission received: 12 August 2025 / Revised: 6 September 2025 / Accepted: 21 September 2025 / Published: 11 October 2025
(This article belongs to the Section Marine Ecology)

Abstract

The Larimichthys crocea represents a critically important economic marine species in China’s East Yellow Sea. However, its populations have experienced significant decline due to overexploitation. Despite implemented conservation measures—including stock enhancement, spawning ground protection, and seasonal fishing moratoria—the recovery of yellow croaker resources remains markedly slow. To address this, our study employed the Maximum Entropy (MaxEnt) model to evaluate and characterize the habitat selection patterns of Larimichthys crocea, thereby providing a theoretical foundation for scientifically informed stock enhancement and resource recovery strategies. Species occurrence data were compiled from field surveys conducted during April and November (2019–2023), supplemented with records from the GBIF database and peer-reviewed literature. Concurrent environmental variables, including primary productivity, current velocity, depth, temperature, salinity, silicate, nitrate, phosphate, and pH, were obtained from the Copernicus and NOAA databases. After rigorous screening, 136 distribution points (April) and 369 points (November) were retained for analysis. The model performance was robust, with an AUC (Area Under the Curve) value of 0.935 for April (2019–2023) and 0.905 for November (2019–2023), indicating excellent predictive accuracy (AUC > 0.9). April (2019–2023): Nitrate, salinity, phosphate, and silicate were identified as the primary environmental factors influencing habitat suitability. November (2019–2023): Silicate, salinity, nitrate, and primary productivity emerged as the dominant drivers. Spatially, Larimichthys crocea exhibited high-density distributions in offshore regions of Zhejiang and Jiangsu, particularly near the Yangtze River estuary. Populations were also associated with island-reef systems, forming continuous distributions along Zhejiang’s offshore waters. In Jiangsu, aggregations were concentrated between Nantong and Yancheng. This study delineates habitat suitability zones for Larimichthys crocea, offering a scientific basis for optimizing stock enhancement programs, designing targeted conservation measures, and establishing marine protected areas. Our findings enable policymakers to develop sustainable fisheries management strategies, ensuring the long-term viability of this ecologically and economically vital species.

1. Introduction

The Larimichthys crocea is a warm-temperate marine fish of significant economic importance, distributed primarily in the coastal waters of China’s East Yellow Sea and South China Sea. Taxonomically, it belongs to the order Acanthuriformes [1]. This species exhibits notable longevity, with maximum recorded ages of 27 years for females and 29 years for males [2]. The Larimichthys crocea comprises three distinct geographic populations: the Daiqu Stock, Min-Yuedong Stock, and Naozhou Stock [3]. As one of China’s most historically significant fishery resources, Larimichthys crocea is renowned for its high culinary value and is traditionally classified among the “Four Major Seafoods” of the East China Sea, alongside the Larimichthys polyactis, the Sepiella maindroni, and the Trichiurus lepturus [4]. However, advancements in fishing technology and escalating harvest efficiency—coupled with unsustainable practices such as Percussion fishing and the overexploitation of spawning adults and juveniles—have precipitated a severe population collapse since the late 20th century [5,6]. Despite the implementation of conservation measures (e.g., seasonal moratoria, habitat protection), resource recovery has remained protracted, underscoring the need for science-based management strategies.
Species distribution models (SDMs) are tools used to predict and assess species’ distribution ranges [7]. Their development began with the BIOCLIM model, followed by other approaches such as the Maximum Entropy Model (MaxEnt), Random Forest Model, and Habitat Suitability Model [8]. The Maximum Entropy (MaxEnt) model, based on the principle of maximum entropy [9], is one of the most widely used species distribution models [10]. This model predicts habitat suitability for target species by integrating species occurrence data with environmental variables from their distribution areas. The MaxEnt model is extensively applied in species distribution modeling, with published studies spanning biogeography, conservation biology, and ecology [11]. Originating from statistical mechanics, the model enables predictions and inferences even with incomplete information [12]. The MaxEnt model assesses and predicts habitat suitability for each grid cell by generating a probability distribution [13]. Despite limited data availability or short temporal coverage, the model can generate highly accurate inferences [14] (Figure 1).
The study area encompasses the coastal waters from Zhejiang to Jiangsu, a critical habitat for the economically important Larimichthys crocea. This region also hosts some of China’s most significant offshore fishing grounds, including the Zhoushan, Yangtze River Estuary, Lvsi, and Dasha fishing grounds [15,16]. Among these, the Zhoushan fishing ground is globally renowned as a productive inshore fishery [17], situated at the confluence of the Qiantang, Yangtze, and Yongjiang Rivers [18]. The Zhoushan fishing ground comprises numerous islands influenced by multiple ocean currents, providing abundant nutrient salts and prey resources that support marine organisms’ feeding, growth, survival, and reproduction [19]. Historically, this region has contributed nearly one-third of China’s total marine catch [20]. In Jiangsu’s offshore waters, the Yangtze River discharges nutrient-rich freshwater, creating an abundant prey base. The Lvsi and Dasha fishing grounds serve as critical spawning and nursery habitats for numerous species. Previous studies confirm that this area is a key spawning ground and juvenile feeding habitat for Larimichthys crocea [21].

2. Materials and Methods

2.1. Data Collection and Processing

The Maximum Entropy (MaxEnt) model necessitates the compilation of both environmental variables and species occurrence records. For this study, the primary datasets include the distribution records of Larimichthys crocea and corresponding environmental parameters from 2019 to 2023, supplemented by historical survey data for reference.

2.2. Collection and Processing of Environmental Factor Data

The environmental variables utilized in this study were sourced from two authoritative databases: the Copernicus Marine Service (https://marine.copernicus.eu/ (accessed on 1 May 2025)) and the National Oceanic and Atmospheric Administration (NOAA) (CHAL https://coastwatch.noaa.gov/erddap/griddap/noaacwNPPN20VIIRSchlociDaily.html (accessed on 1 May 2025)) These parameters included salinity, sea surface temperature, pH, current velocity, phosphate concentration, chlorophyll content, nitrate levels, dissolved oxygen, water depth, silicate concentration and primary productivity.
The environmental variables obtained from different databases were standardized using the following methodology. First, the acquired data were resampled, cropped, and averaged in R (Version 4.4.3) using the terra, gstat, sf, ncdf4, and stringr packages. All environmental layers were unified to a spatial resolution of 0.083° and clipped to the coastal waters of Zhejiang and Jiangsu provinces. Monthly environmental data for April and November from 2019 to 2023 were averaged across the five-year period, yielding composite April and November datasets. The final outputs were saved in ASCII (.asc) format for compatibility with the Maximum Entropy (MaxEnt) model.

2.3. Further Screening of Environmental Factors

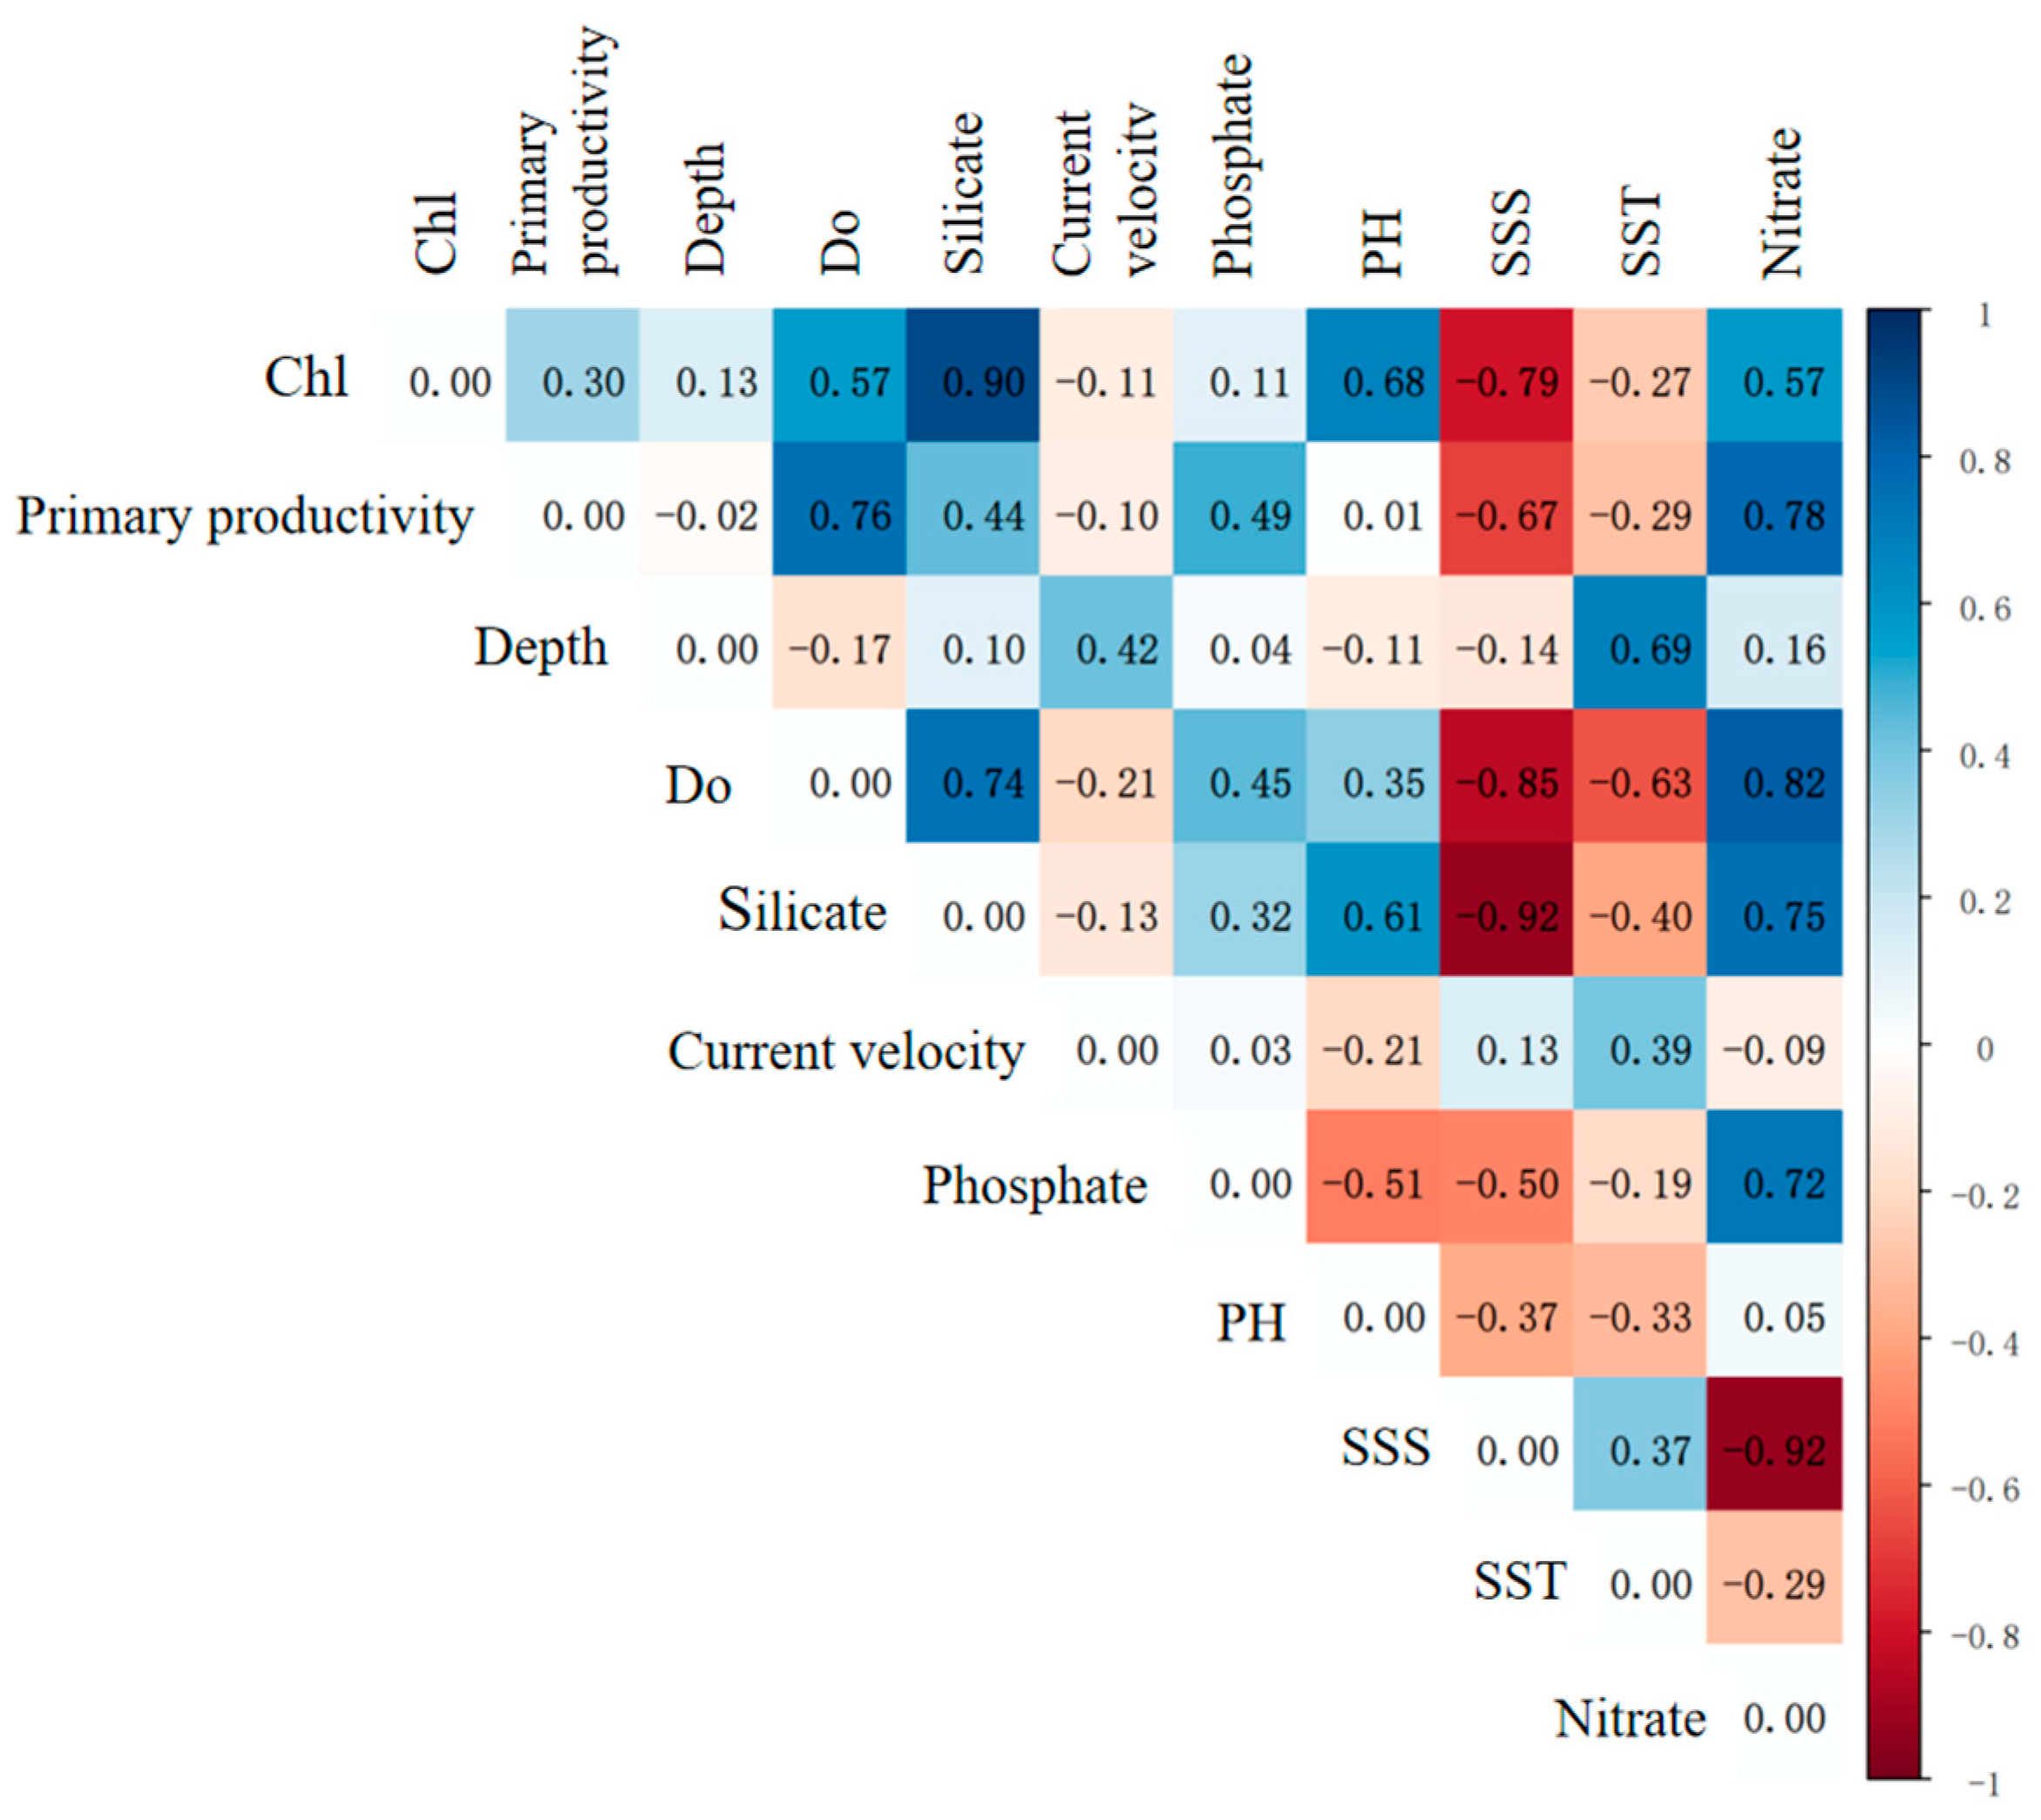
To optimize the MaxEnt model’s performance, we conducted a preliminary screening of environmental variables. First, variables with zero contribution in preliminary runs were excluded based on their permutation importance scores. Next, we performed pairwise correlation analysis using ENMTools to assess collinearity among the remaining variables. Environmental factors with absolute correlation coefficients (|r|) exceeding 0.8 were identified and removed to reduce multicollinearity. This two-step screening process—combining contribution analysis and correlation assessment—ensured the selection of biologically relevant and statistically independent predictors for final model construction.

2.4. Species Distribution Data Collection and Processing

The species occurrence data for this study were compiled from two primary sources: (1) field surveys conducted between 2019 and 2023 in the offshore waters of Zhejiang and Jiangsu provinces using standardized bottom trawl methods, and (2) existing records obtained from the Global Biodiversity Information Facility (GBIF; https://www.gbif.org/occurrence/search?q=Larimichthys%20crocea (accessed on 18 October 2024)) and literature. This dual-source approach ensured comprehensive spatial coverage while maintaining data quality through methodological consistency in field collections and verification of published records.
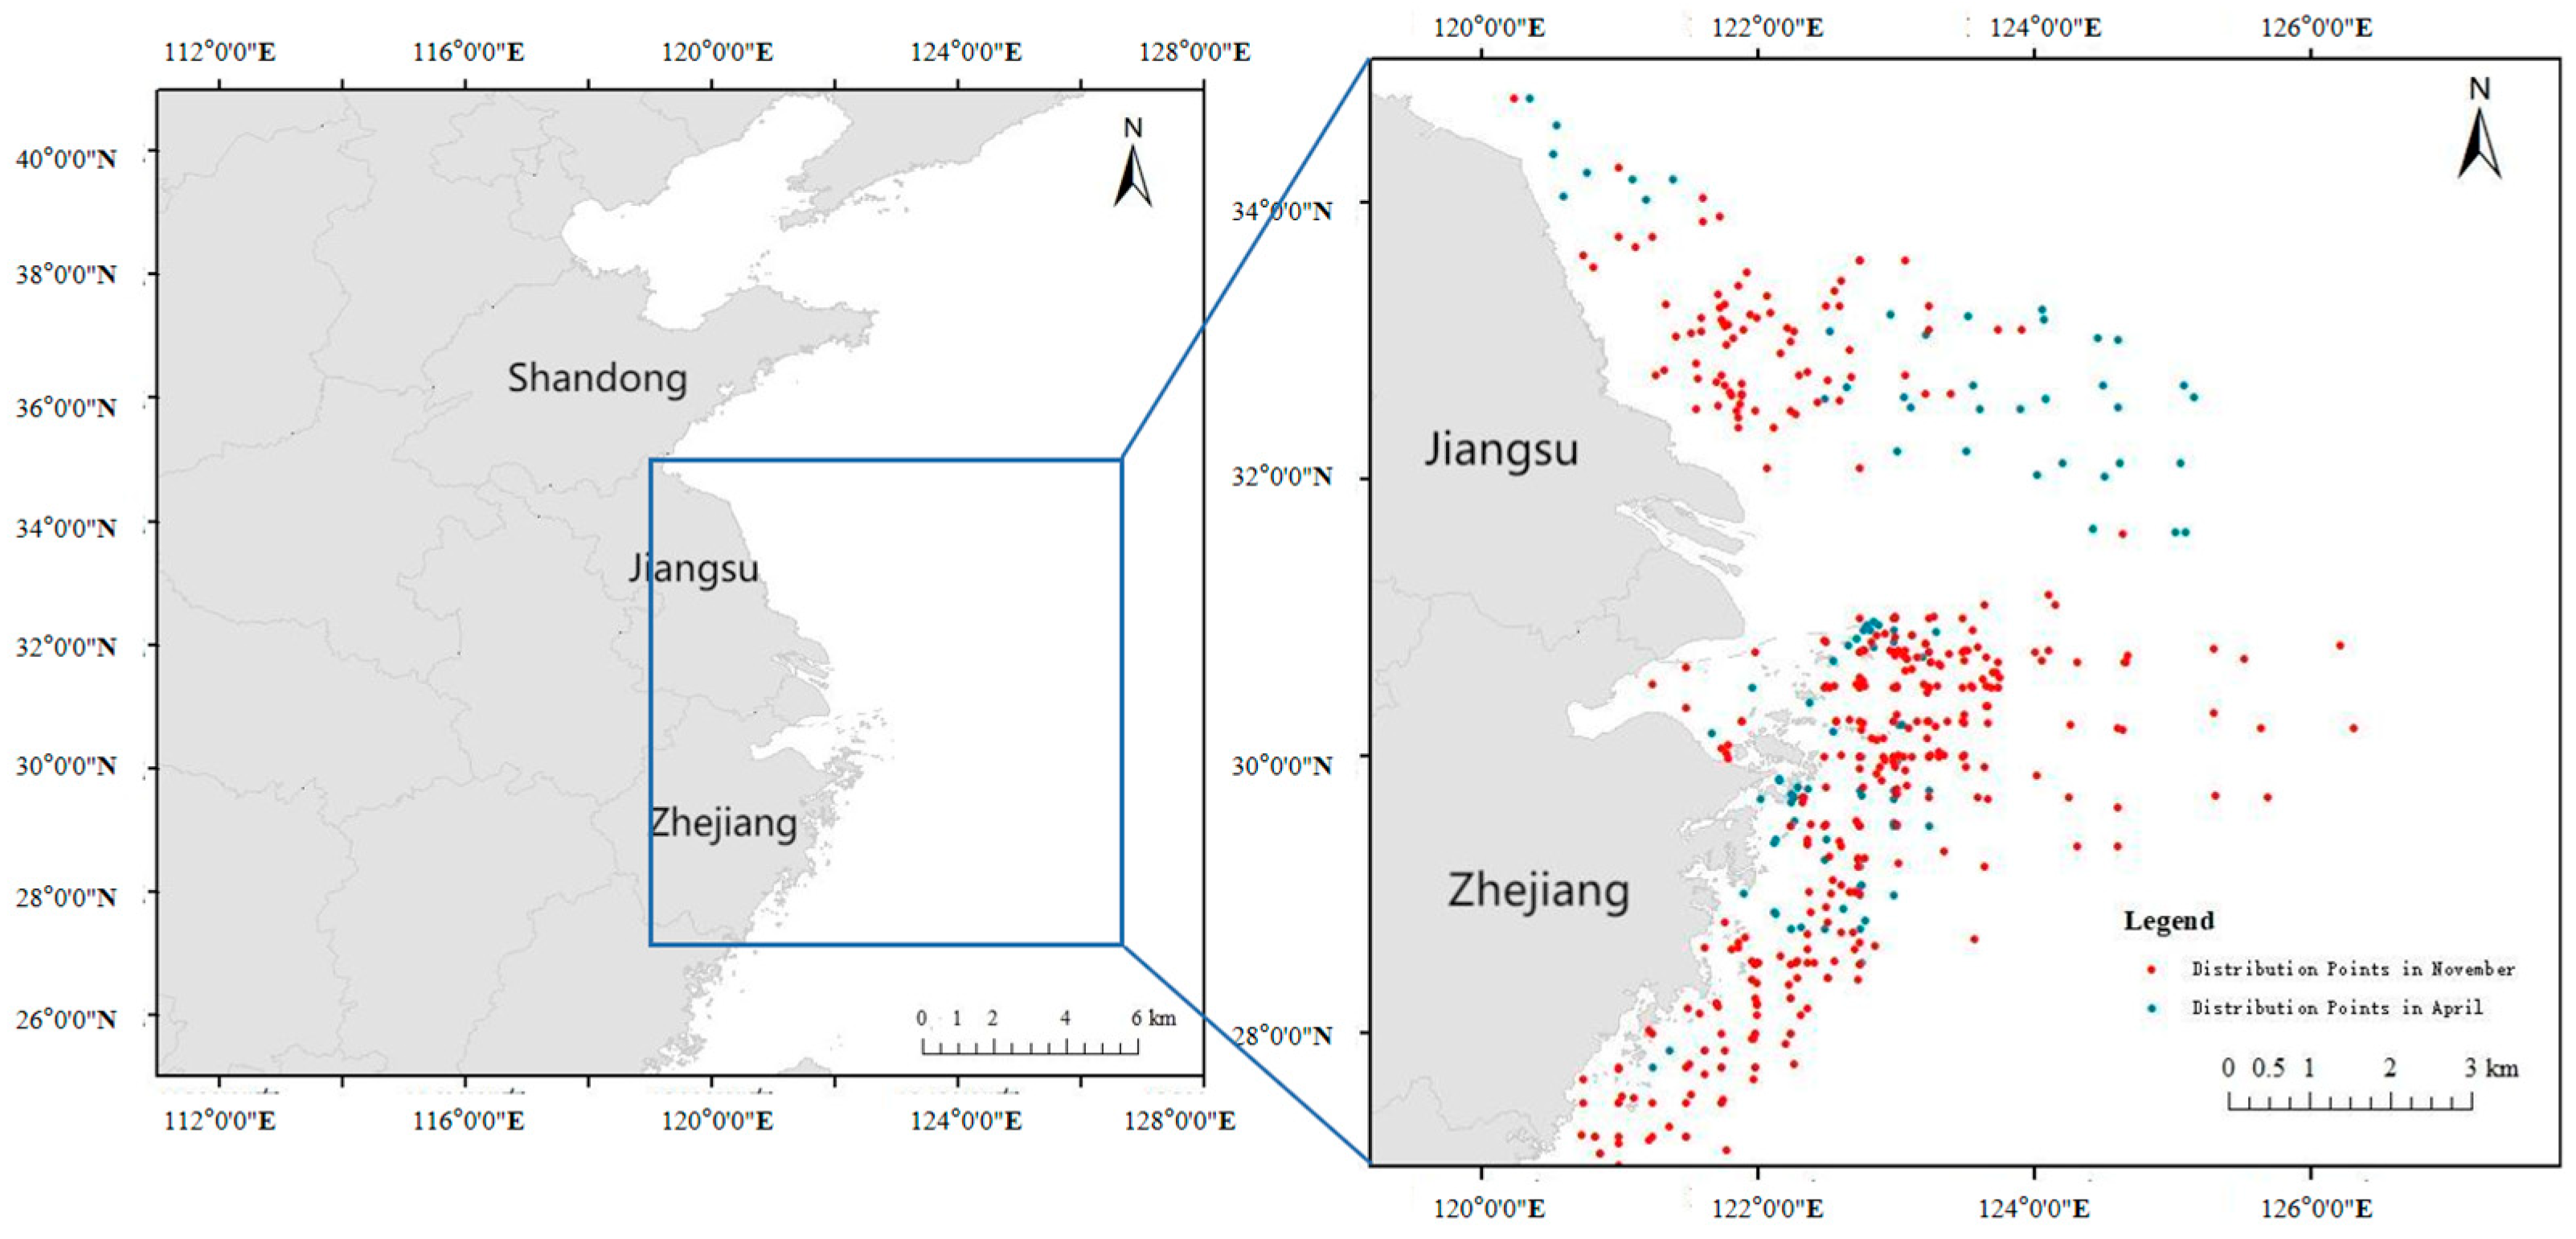
A total of 136 and 369 valid occurrence records were obtained for April and November, respectively, during the 2019–2023 study period. These spatially unique distribution points were processed to eliminate redundancy and subsequently formatted into (.csv) files for compatibility with MaxEnt (Maximum Entropy) modeling (Figure 2).

2.5. Map Data Collection

The provincial administrative boundary data were obtained from the Resource and Environmental Science Data Center (RESDC) of the Chinese Academy of Sciences (https://www.resdc.cn/ (accessed on 8 November 2024)). These geographic datasets, including China’s provincial administrative boundaries, were imported into ArcGIS (Version 10.8.2) for spatial analysis and mapping.

2.6. Optimization of the MaxEnt Model

The MaxEnt model was optimized in R using species distribution data and filtered environmental variables, along with the “ecospat,” “dismo,” and “ENMeval” packages. We set the regularization multiplier (RM) to 1 and the feature classes (FC) to L.

2.7. MaxEnt Modeling

The species distribution data and screened environmental variables were imported into the MaxEnt model. Approximately 75% of the Larimichthys crocea distribution points were allocated to the training set, while the remaining 25% served as the test set. To ensure model stability, the calculations were repeated 10 times, with all other parameters retained as default values. The output was generated in logistic (Logist) format as raster data, and the MaxEnt model produced the final results.

2.8. Mapping of Suitable Areas

The ASC files generated from the MaxEnt model results, along with China’s provincial administrative boundary maps, were imported into ArcGIS (Version 10.8.2). Using the spatial analysis tools, we reclassified the habitat suitability index according to five distinct categories based on the natural breaks classification method: unsuitable zone (|K| < 0.07), low-suitability zone (0.07 ≤ |K| < 0.2), moderate-suitability zone (0.2 ≤ |K| < 0.36), suboptimal habitat zone (0.36 ≤ |K| < 0.55), and high-suitability habitat zone (0.55 ≤ |K| ≤ 0.8).

3. Results

We removed the environmental factor with lower contribution (Table 1 and Table 2) from any pair exhibiting a correlation coefficient |r| > 0.8 (Figure 3 and Figure 4).
The environmental variable selection process yielded the following results: For April 2019–2023, the selected variables included primary productivity, flow velocity, water depth, temperature, salinity, silicate, nitrate, phosphate, and pH. The November 2019–2023 analysis identified the same set of environmental variables. Among them, dissolved oxygen and chlorophyll were removed.
This study employed receiver operating characteristic (ROC) curve analysis to evaluate model performance. The area under the ROC curve (AUC) serves as a measure of prediction accuracy, where values closer to 1 indicate better predictive performance [22]. Following established interpretation guidelines, AUC values > 0.9 represent excellent predictions, while values > 0.8 indicate good predictions. Using MaxEnt modeling, we assessed environmental variables at Larimichthys crocea sampling sites and throughout the study area. The ROC curve evaluation yielded the following results: for April, training and test set AUC values were 0.939 and 0.935, respectively; for November, the corresponding values were 0.922 and 0.905. All AUC values exceeded 0.9 (Figure 5 and Figure 6), demonstrating high model accuracy suitable for simulating Larimichthys crocea habitat suitability distribution.
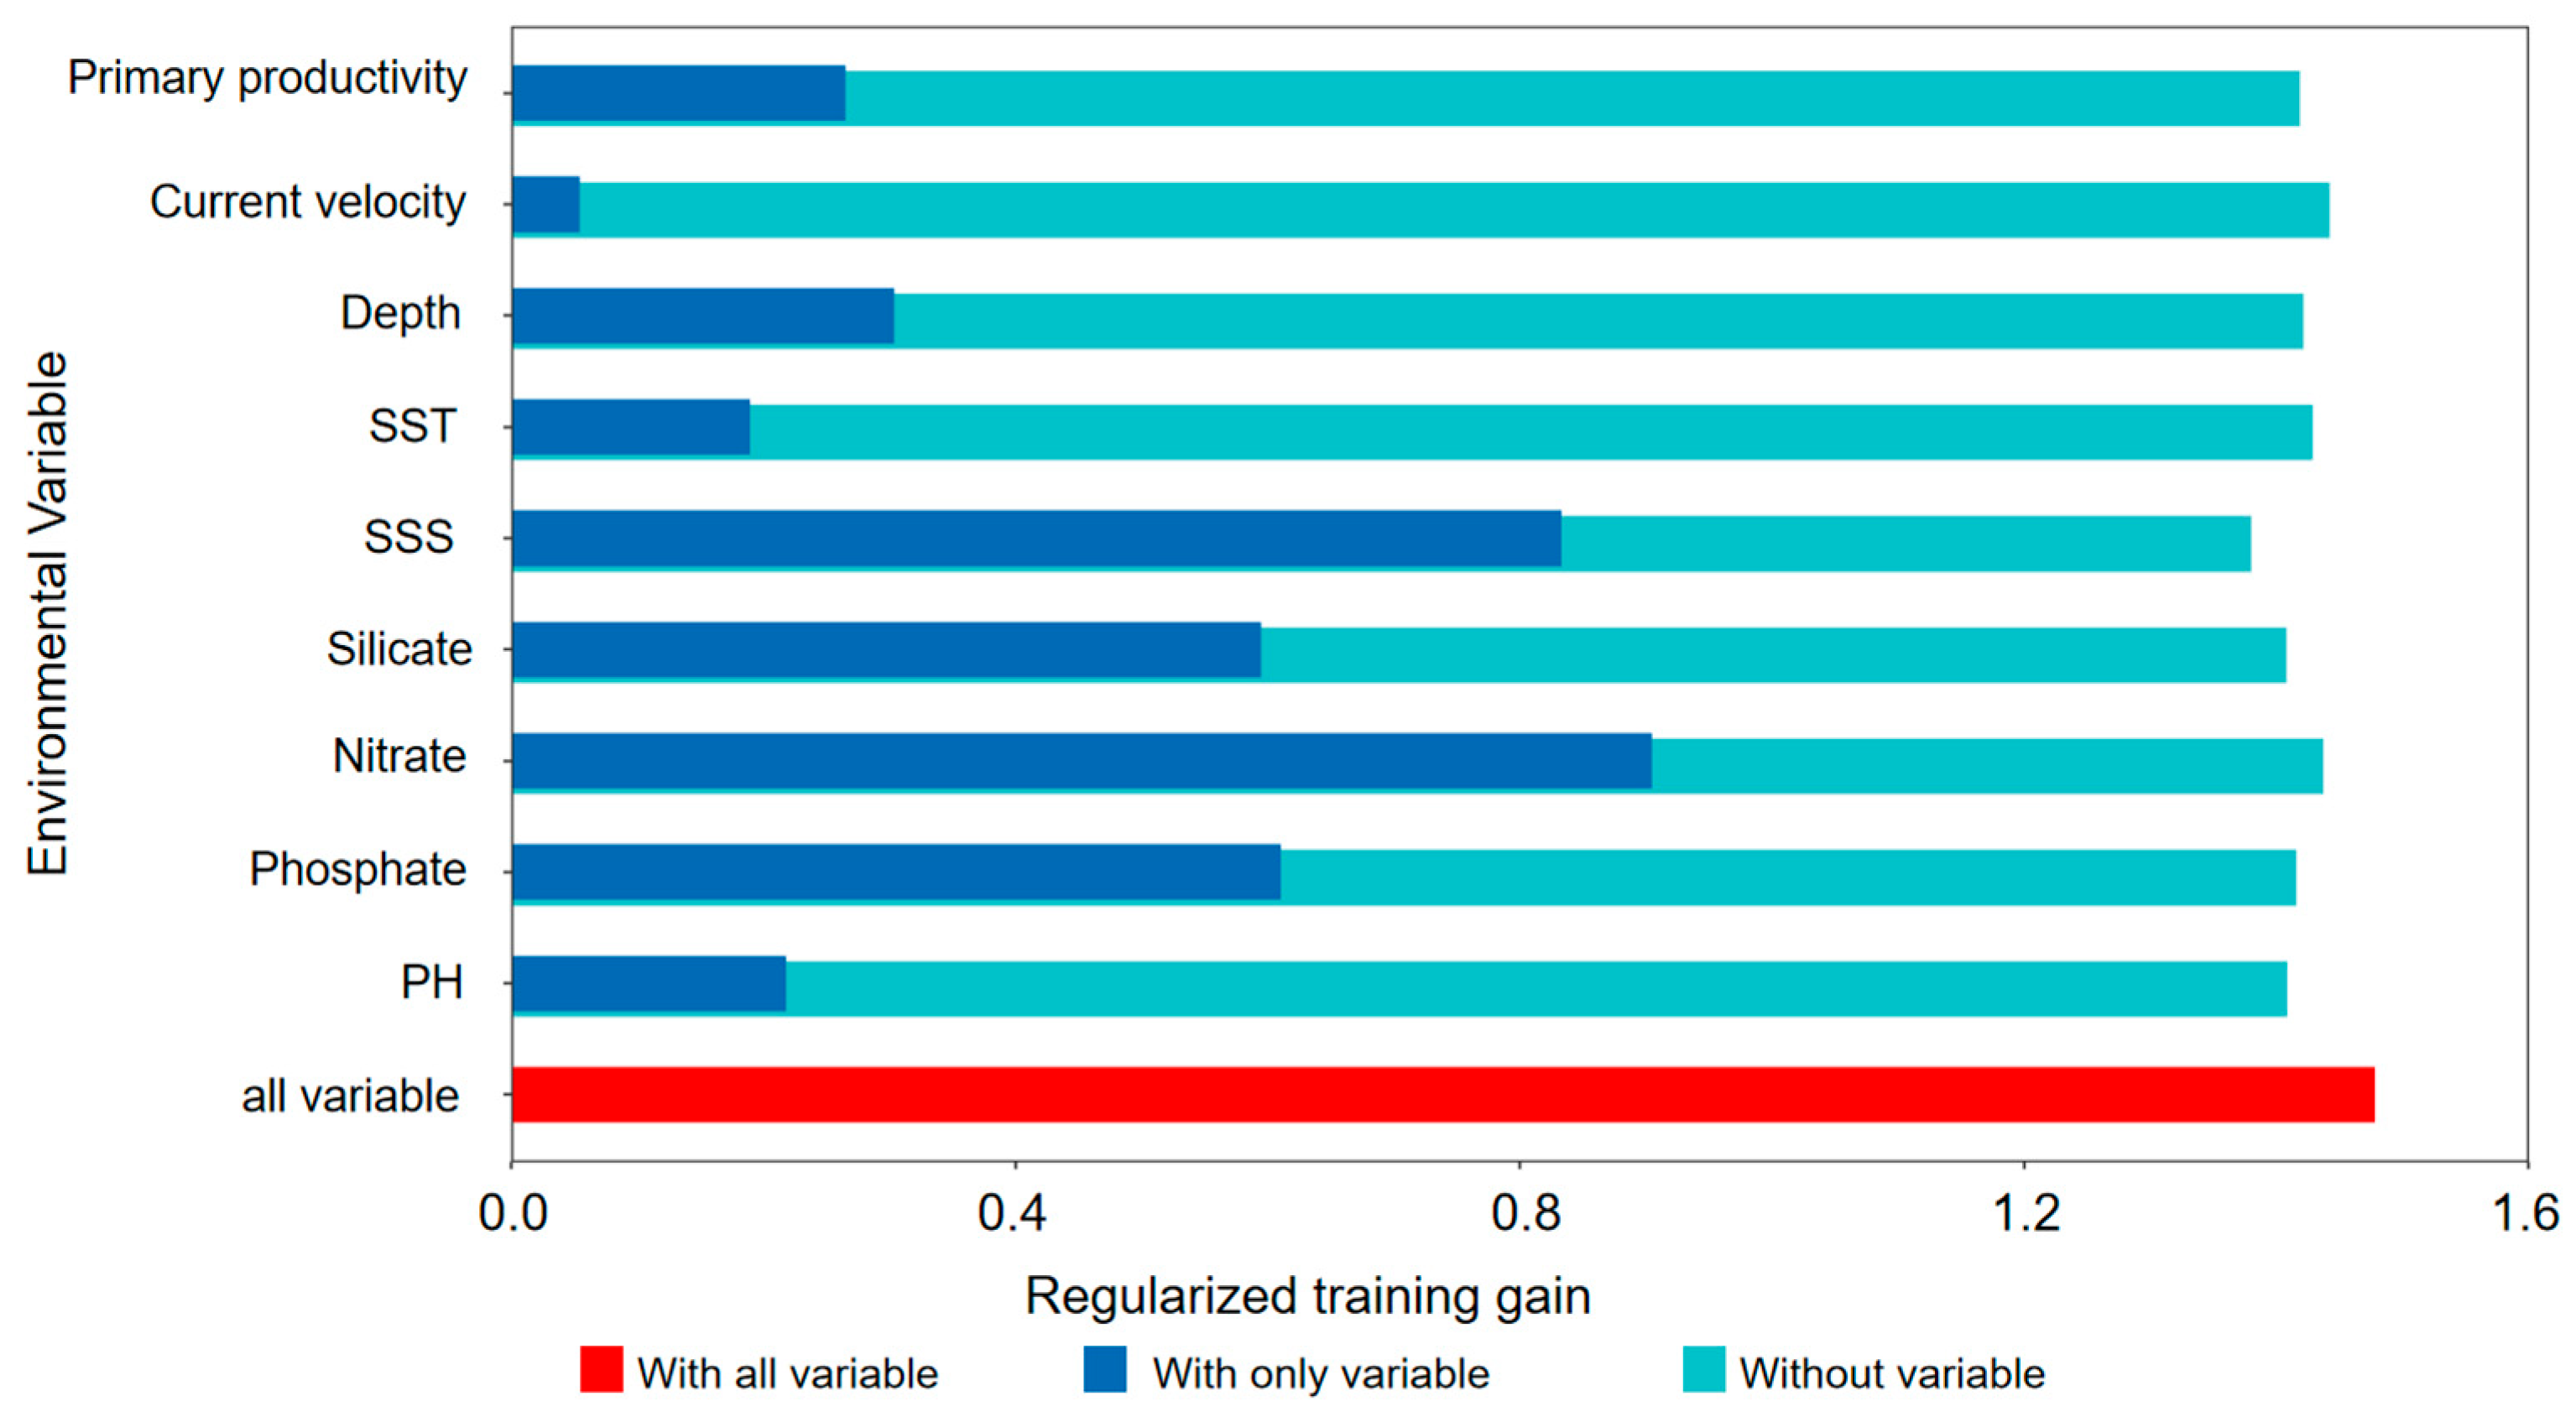
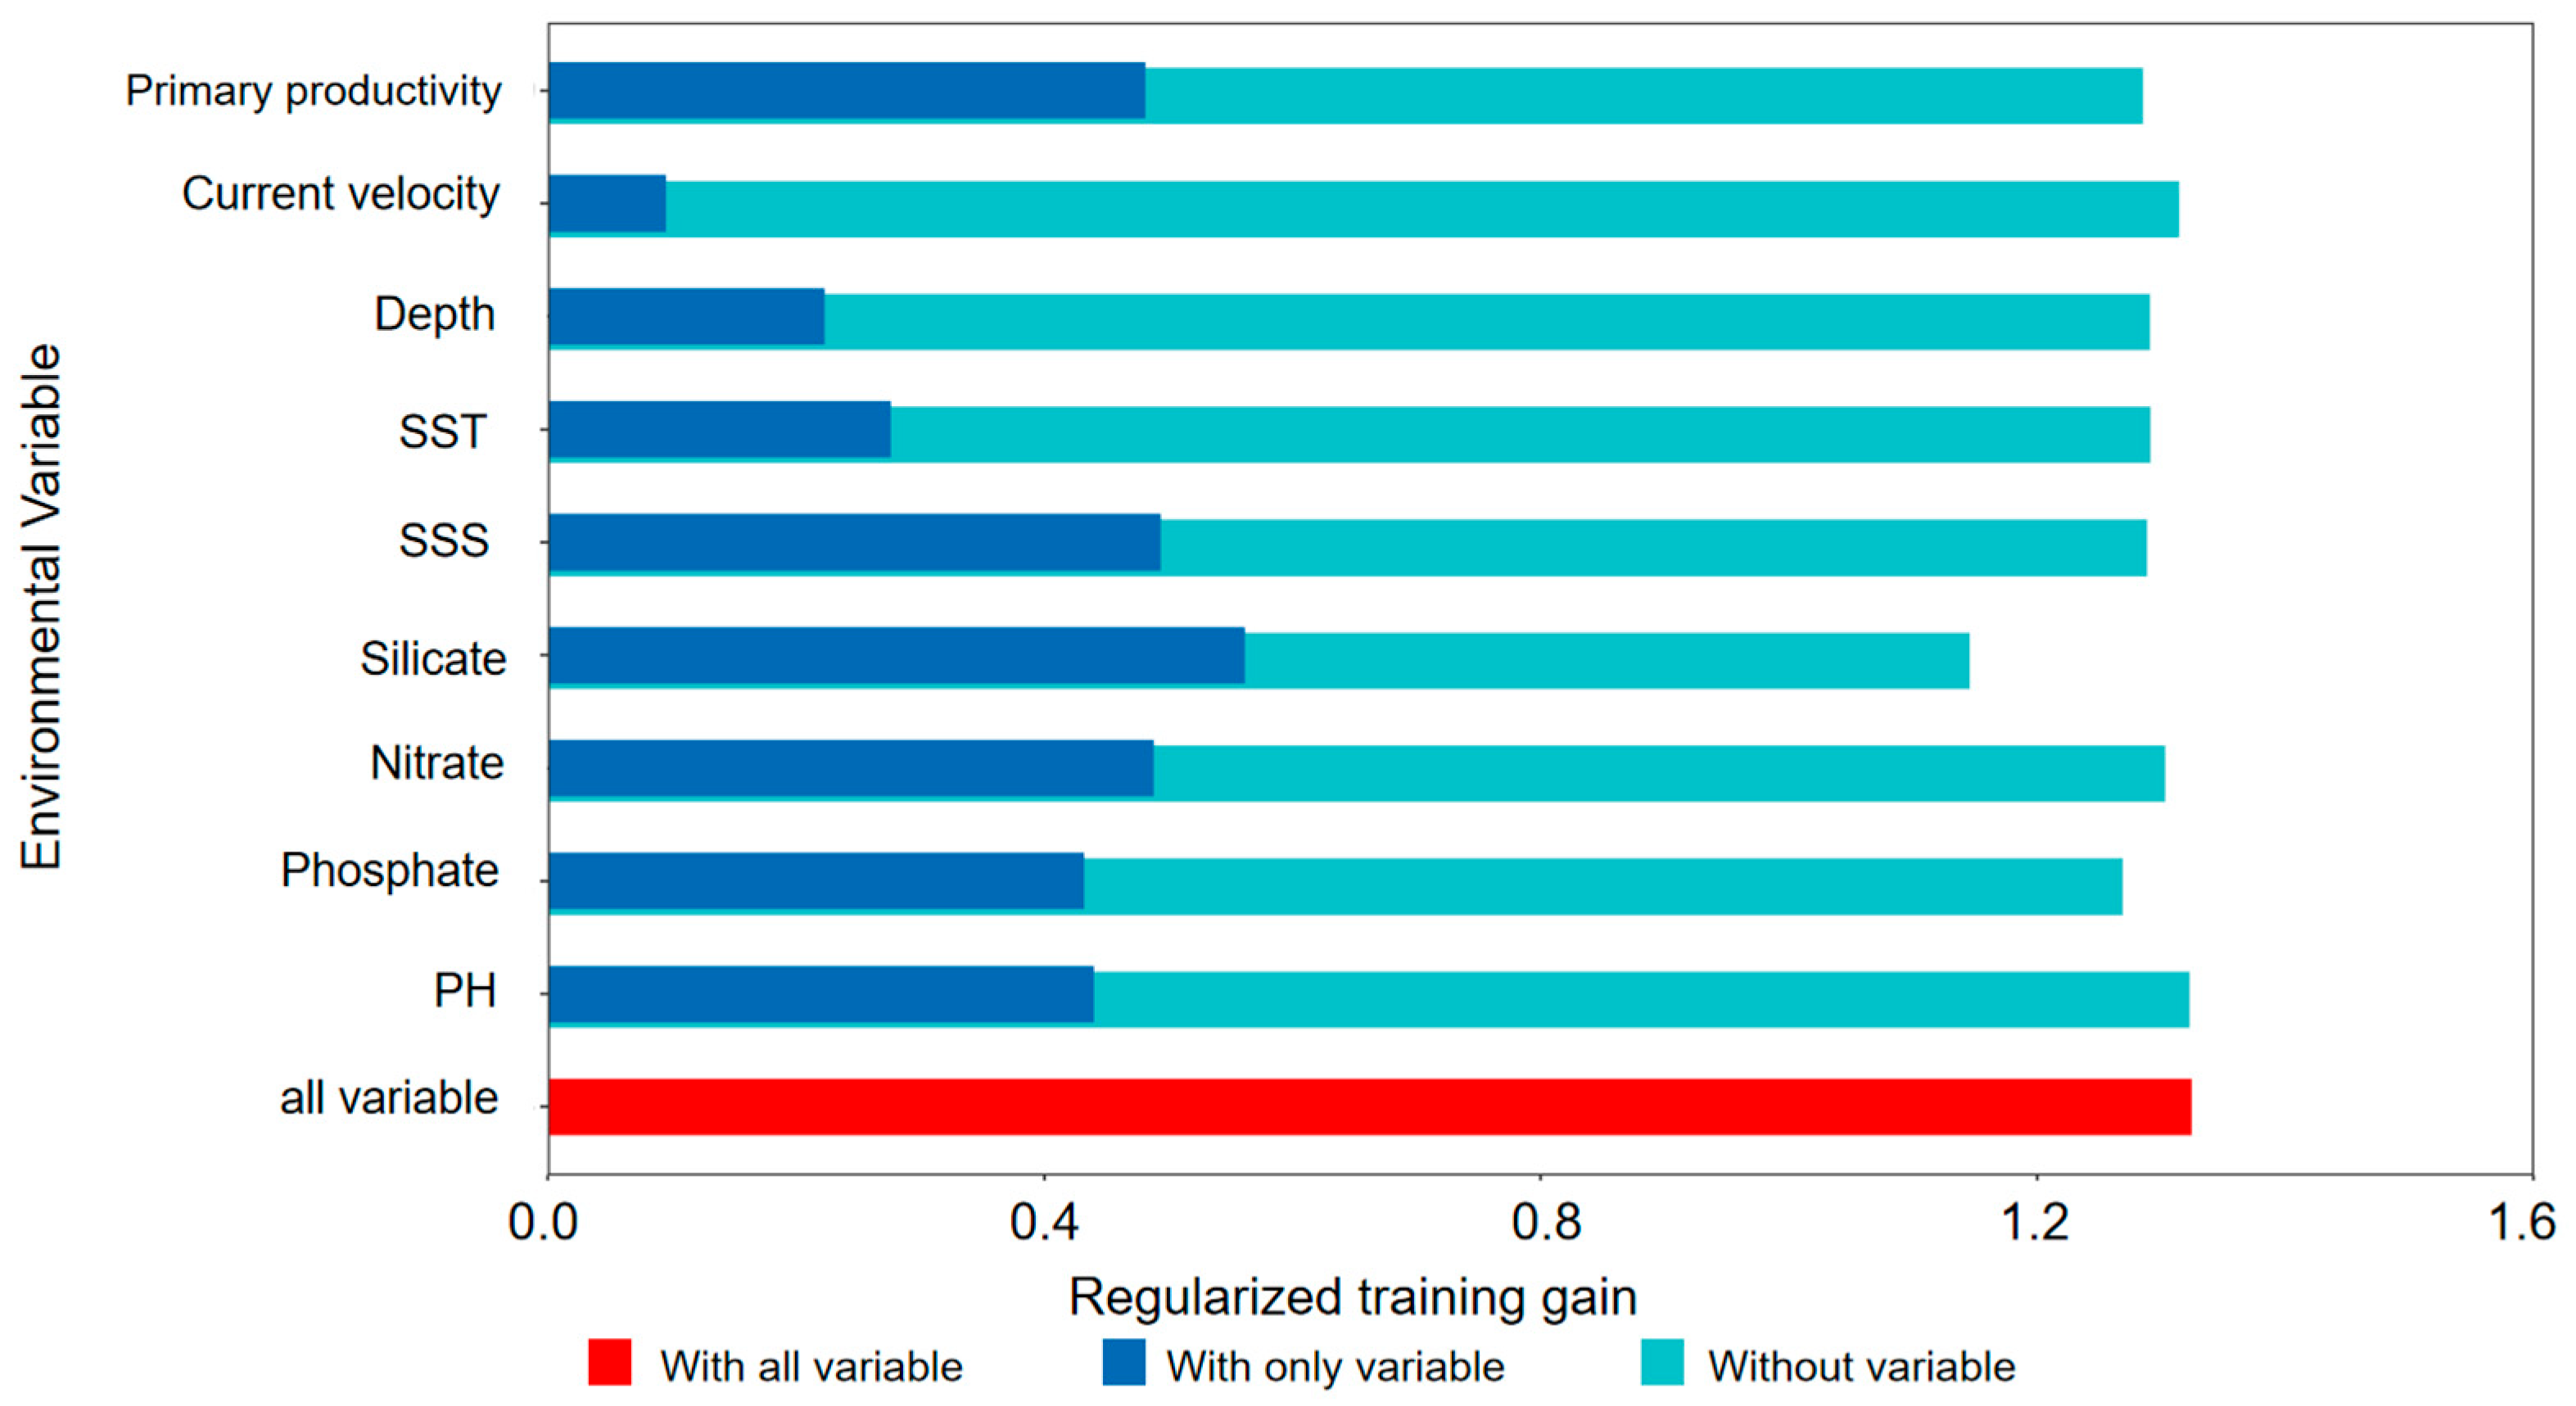
The MaxEnt model employed the knife-cut method to assess the relative importance of each environmental factor in influencing the distribution of Larimichthys crocea. The contributions of individual environmental factors are presented in Figure 7 and Figure 8.
Among the tested environmental factors, nitrate, salinity, phosphate, and silicate exhibited high gain values in April, indicating their significant role in the ecological selection of Larimichthys crocea. Similarly, depth and primary productivity showed high gain values, suggesting their considerable influence on habitat selection. In November, silicate, salinity, and temperature displayed high gain values, as did nitrate and primary productivity. Additionally, phosphate, pH, and temperature were influential during this season. In summary, silicate, nitrate, and salinity contributed substantially across both seasons, underscoring their ecological importance. Temperature, depth, phosphate, pH, and primary productivity also significantly influenced the habitat selection of Larimichthys crocea.
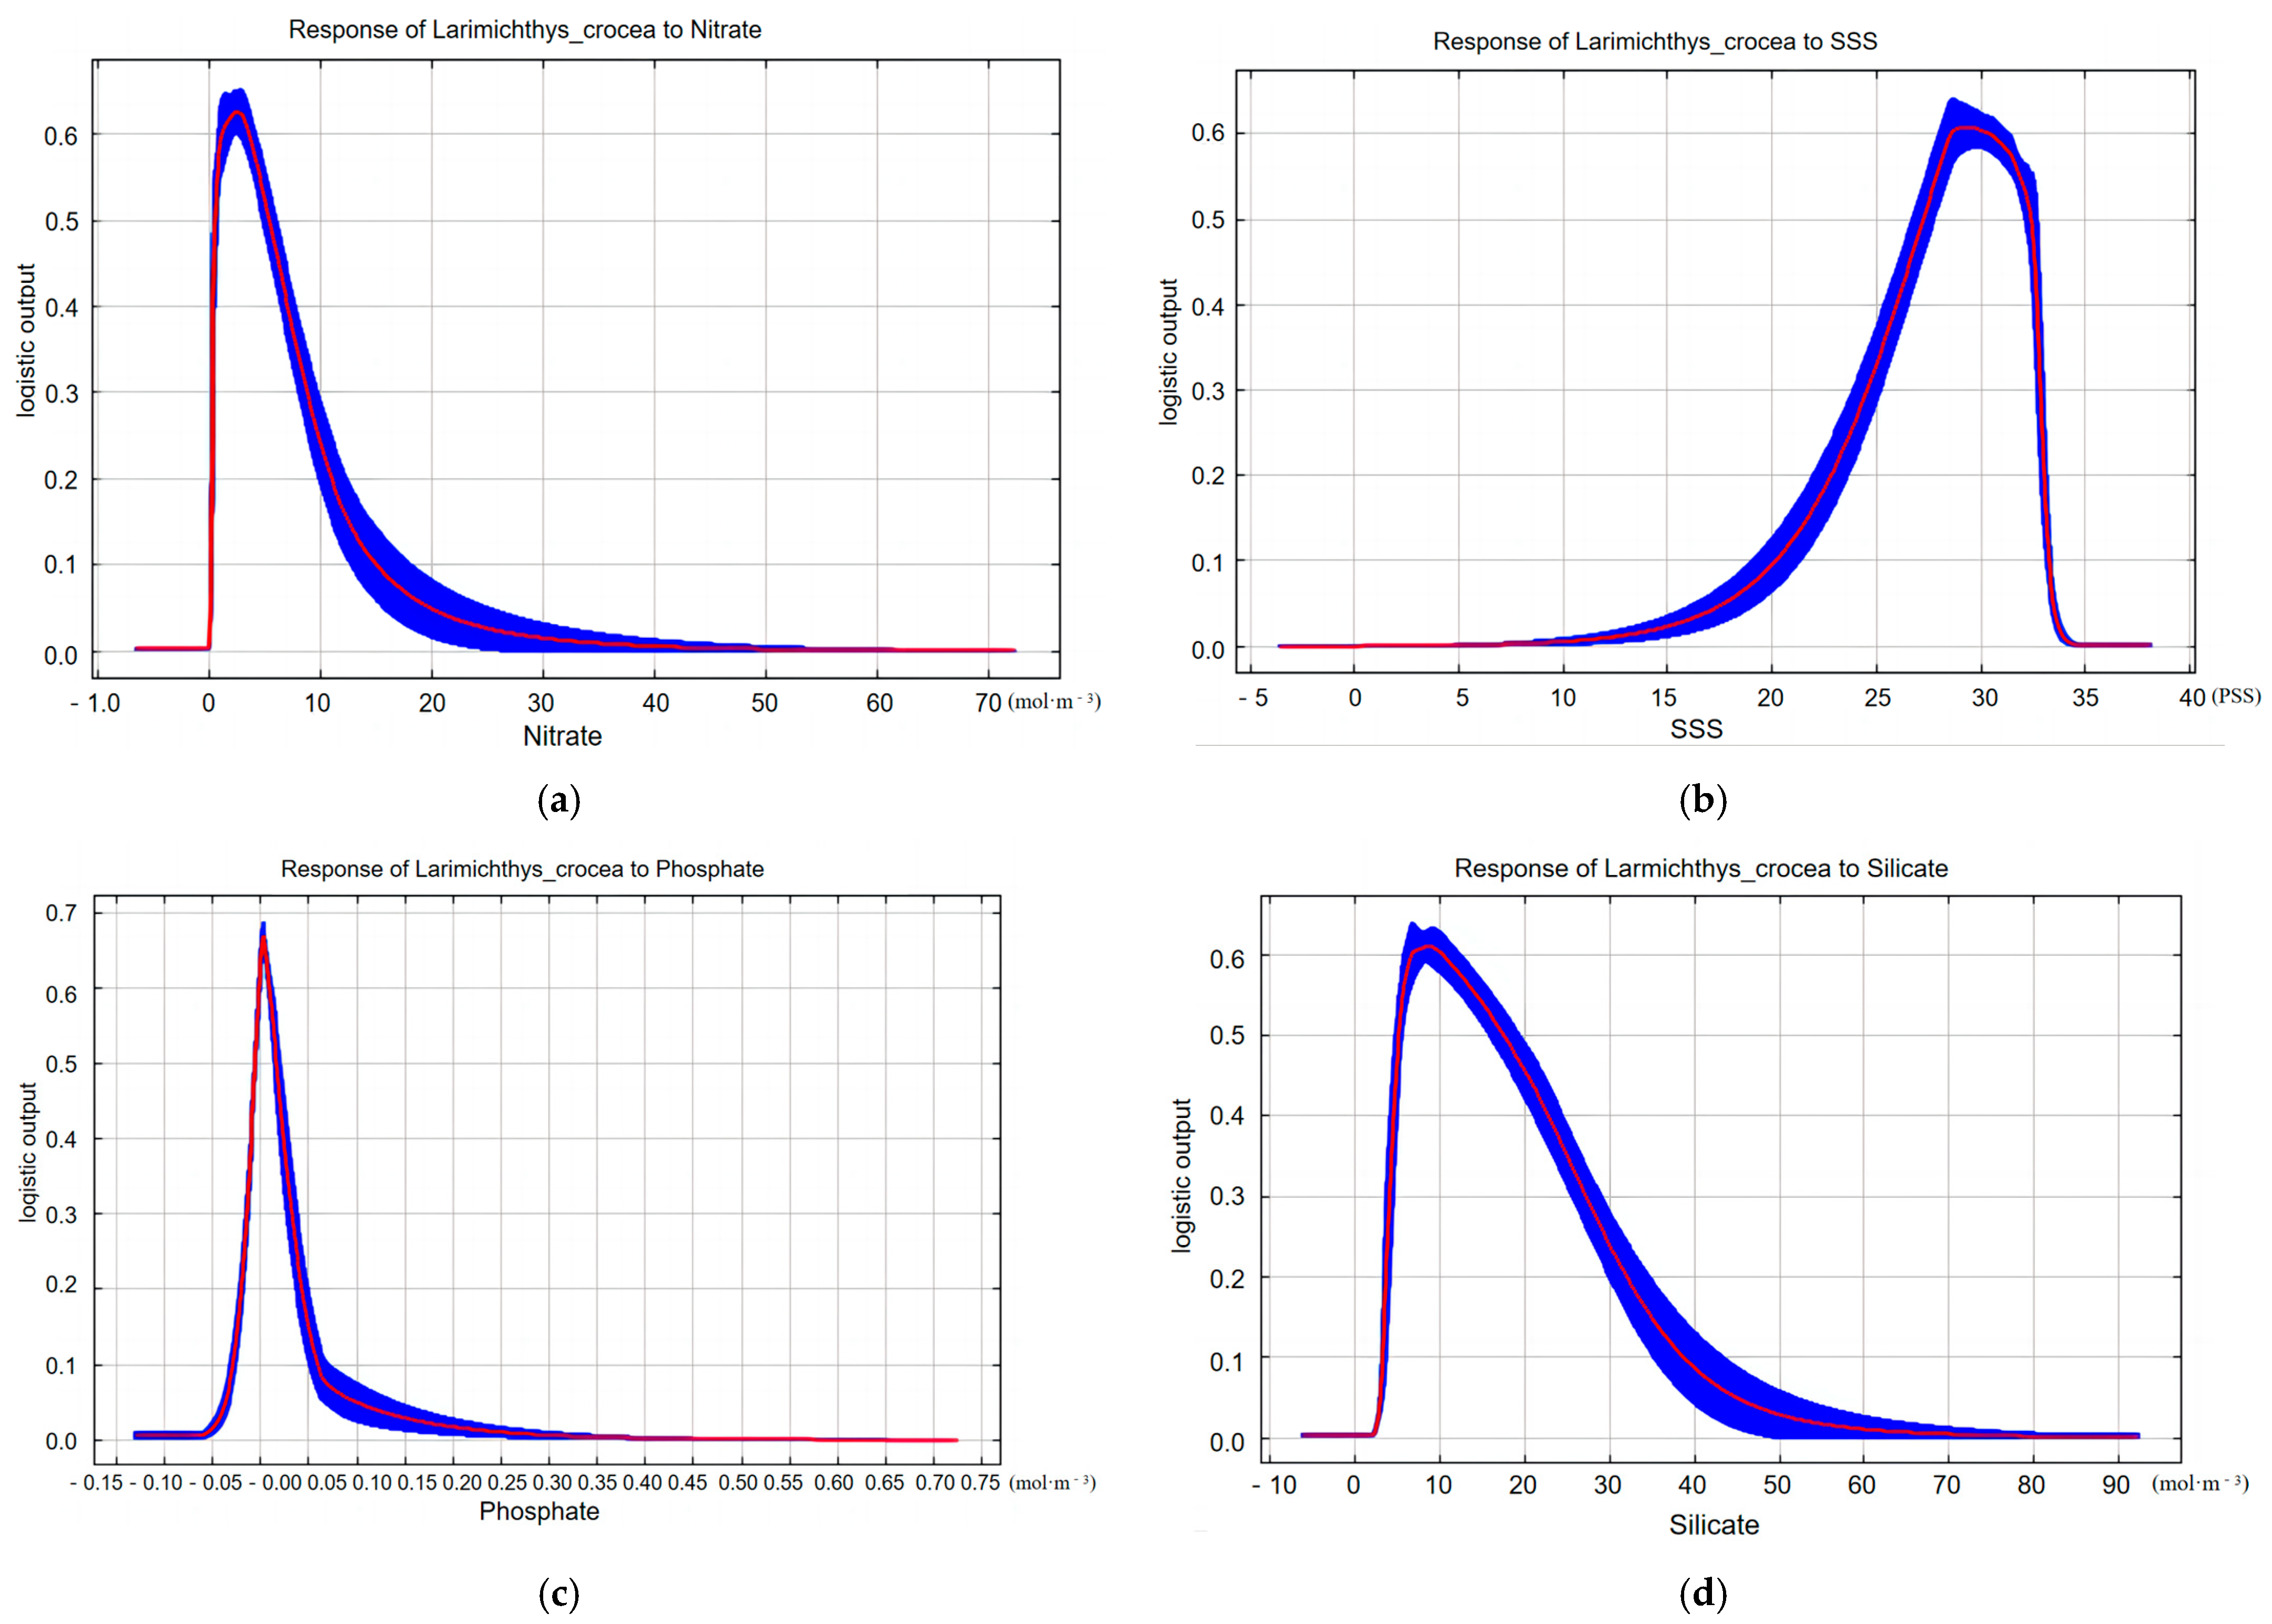
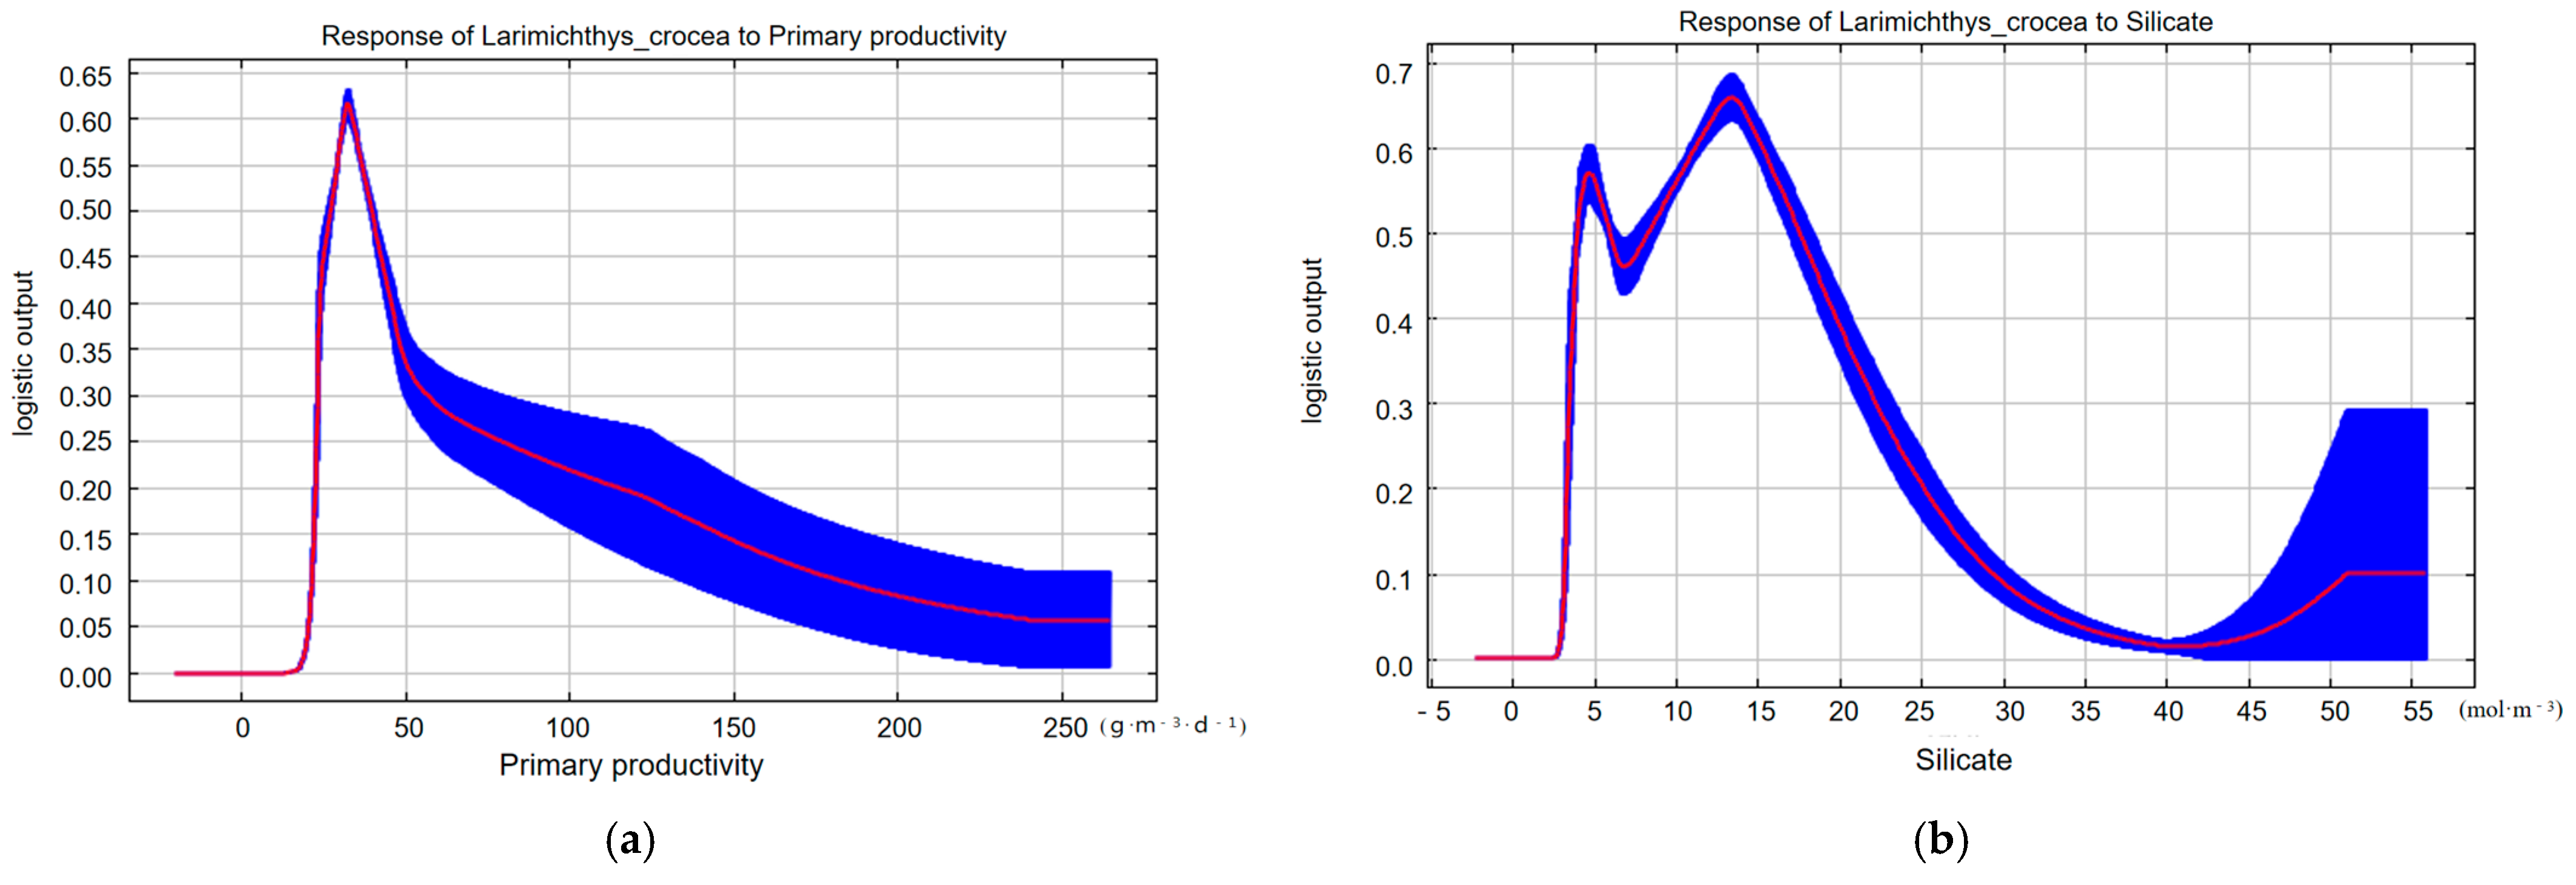
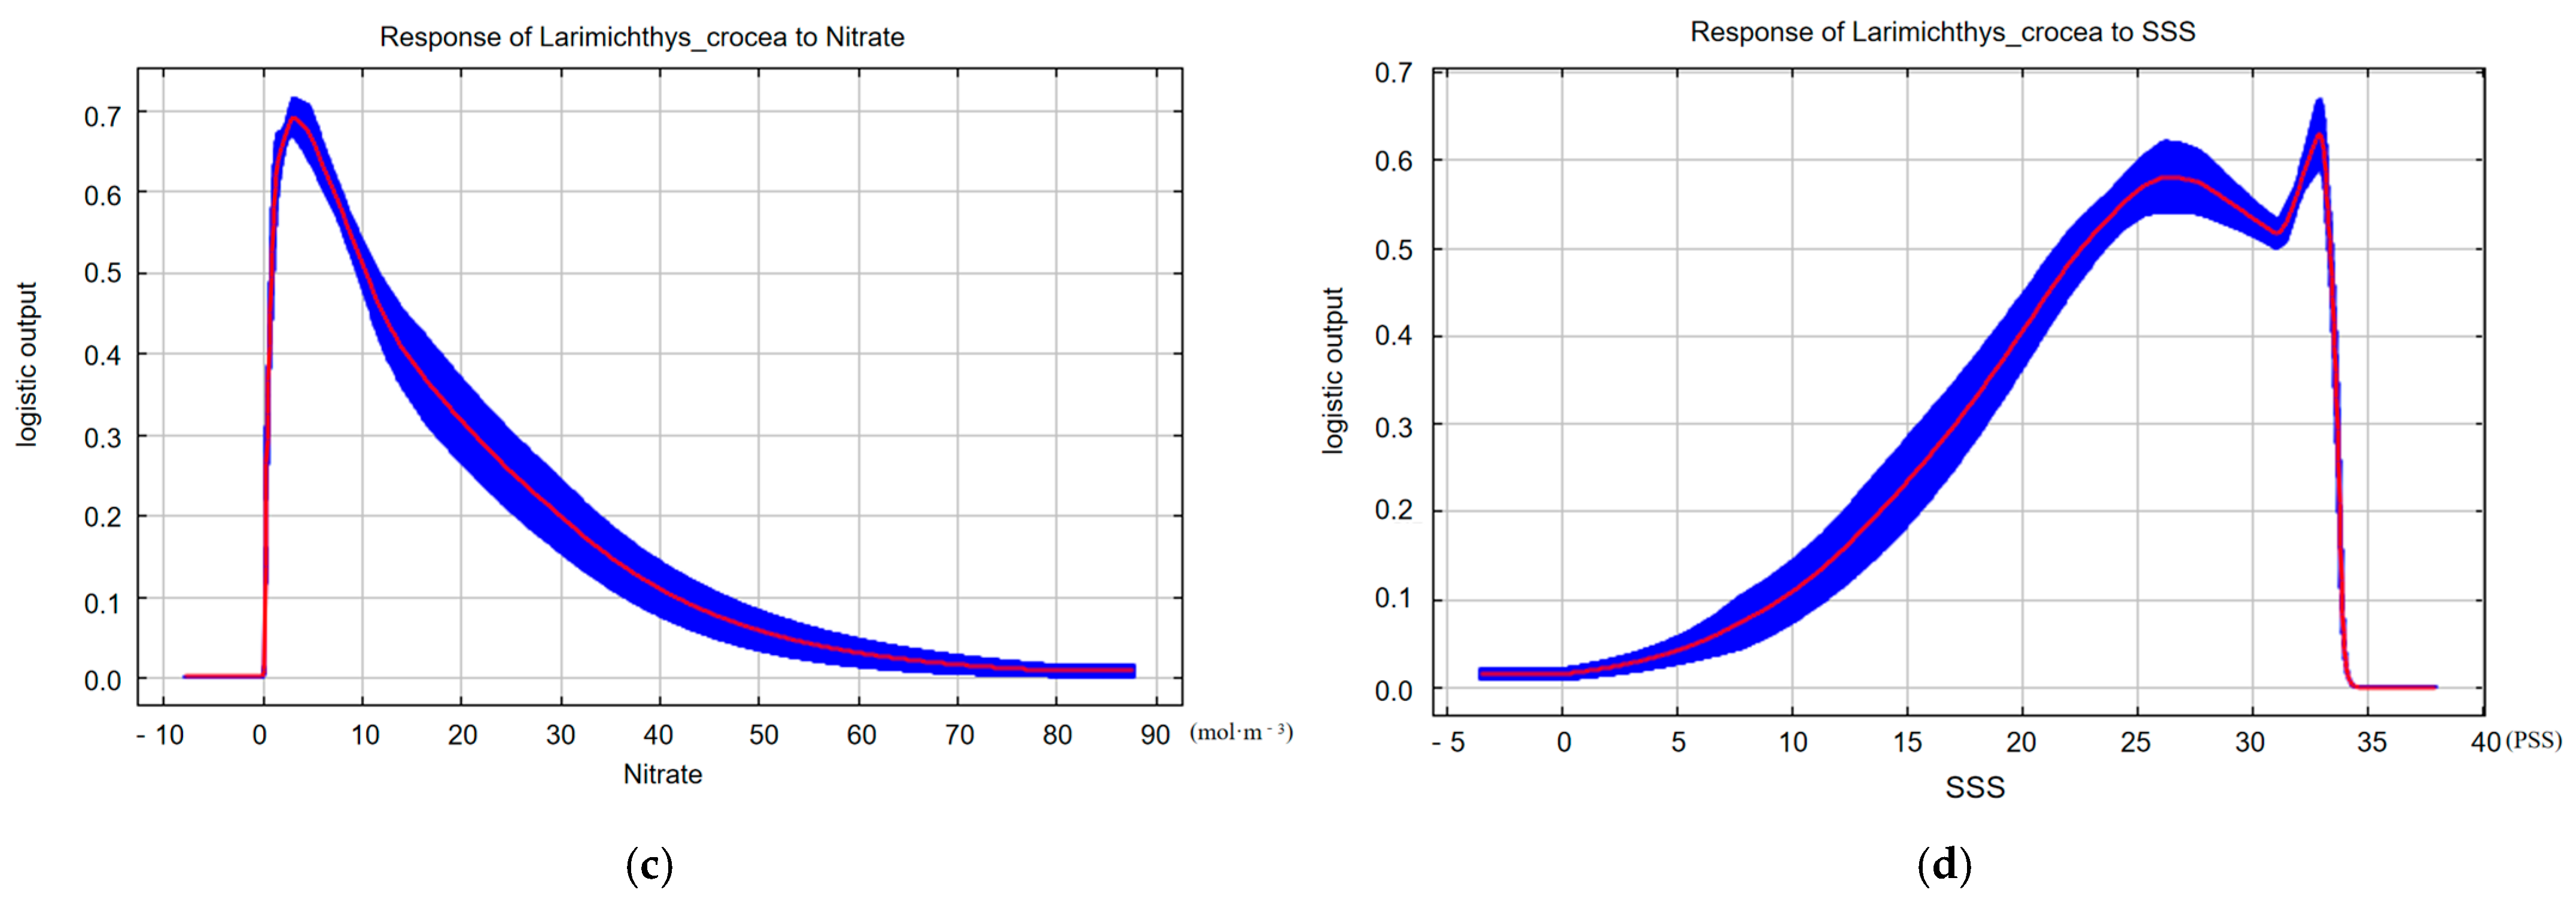
The MaxEnt-generated ecological factor response curves identified the optimal ranges of environmental factors influencing the distribution of Larimichthys crocea. These results are presented in Figure 9 and Figure 10.
In April, nitrate concentration peaked at 1 and subsequently declined, followed by a gradual decrease after 20 mol·m−3. The response curve for salinity (range: 10–30) indicated that the probability of Larimichthys crocea presence increased with salinity, exceeding 0.6, before exhibiting a slow increase followed by a sharp decline. The phosphate response curve displayed a linear rise to its peak, followed by a linear decrease. For silicate, the highest probability of Larimichthys crocea presence occurred at a value of 7 mol·m−3, with the overall response curve demonstrating a linear increase followed by a gradual decline.
In November, primary productivity peaked at 30 g·m−3·d−1 and then declined linearly until 50 g·m−3·d−1, followed by a gradual decrease. The silicate response curve exhibited a wave-like pattern, rising sharply between 0 and 5 mol·m−3 before a slight decline, peaking at 13 mol·m−3, and then decreasing slowly. The nitrate response curve showed an initial linear increase, reaching its peak at 4 mol·m−3, followed by a gradual decline. For salinity (range: 0–26), the response curve initially increased with salinity, then decreased slightly, and finally displayed a linear rise to the peak before a linear decline.
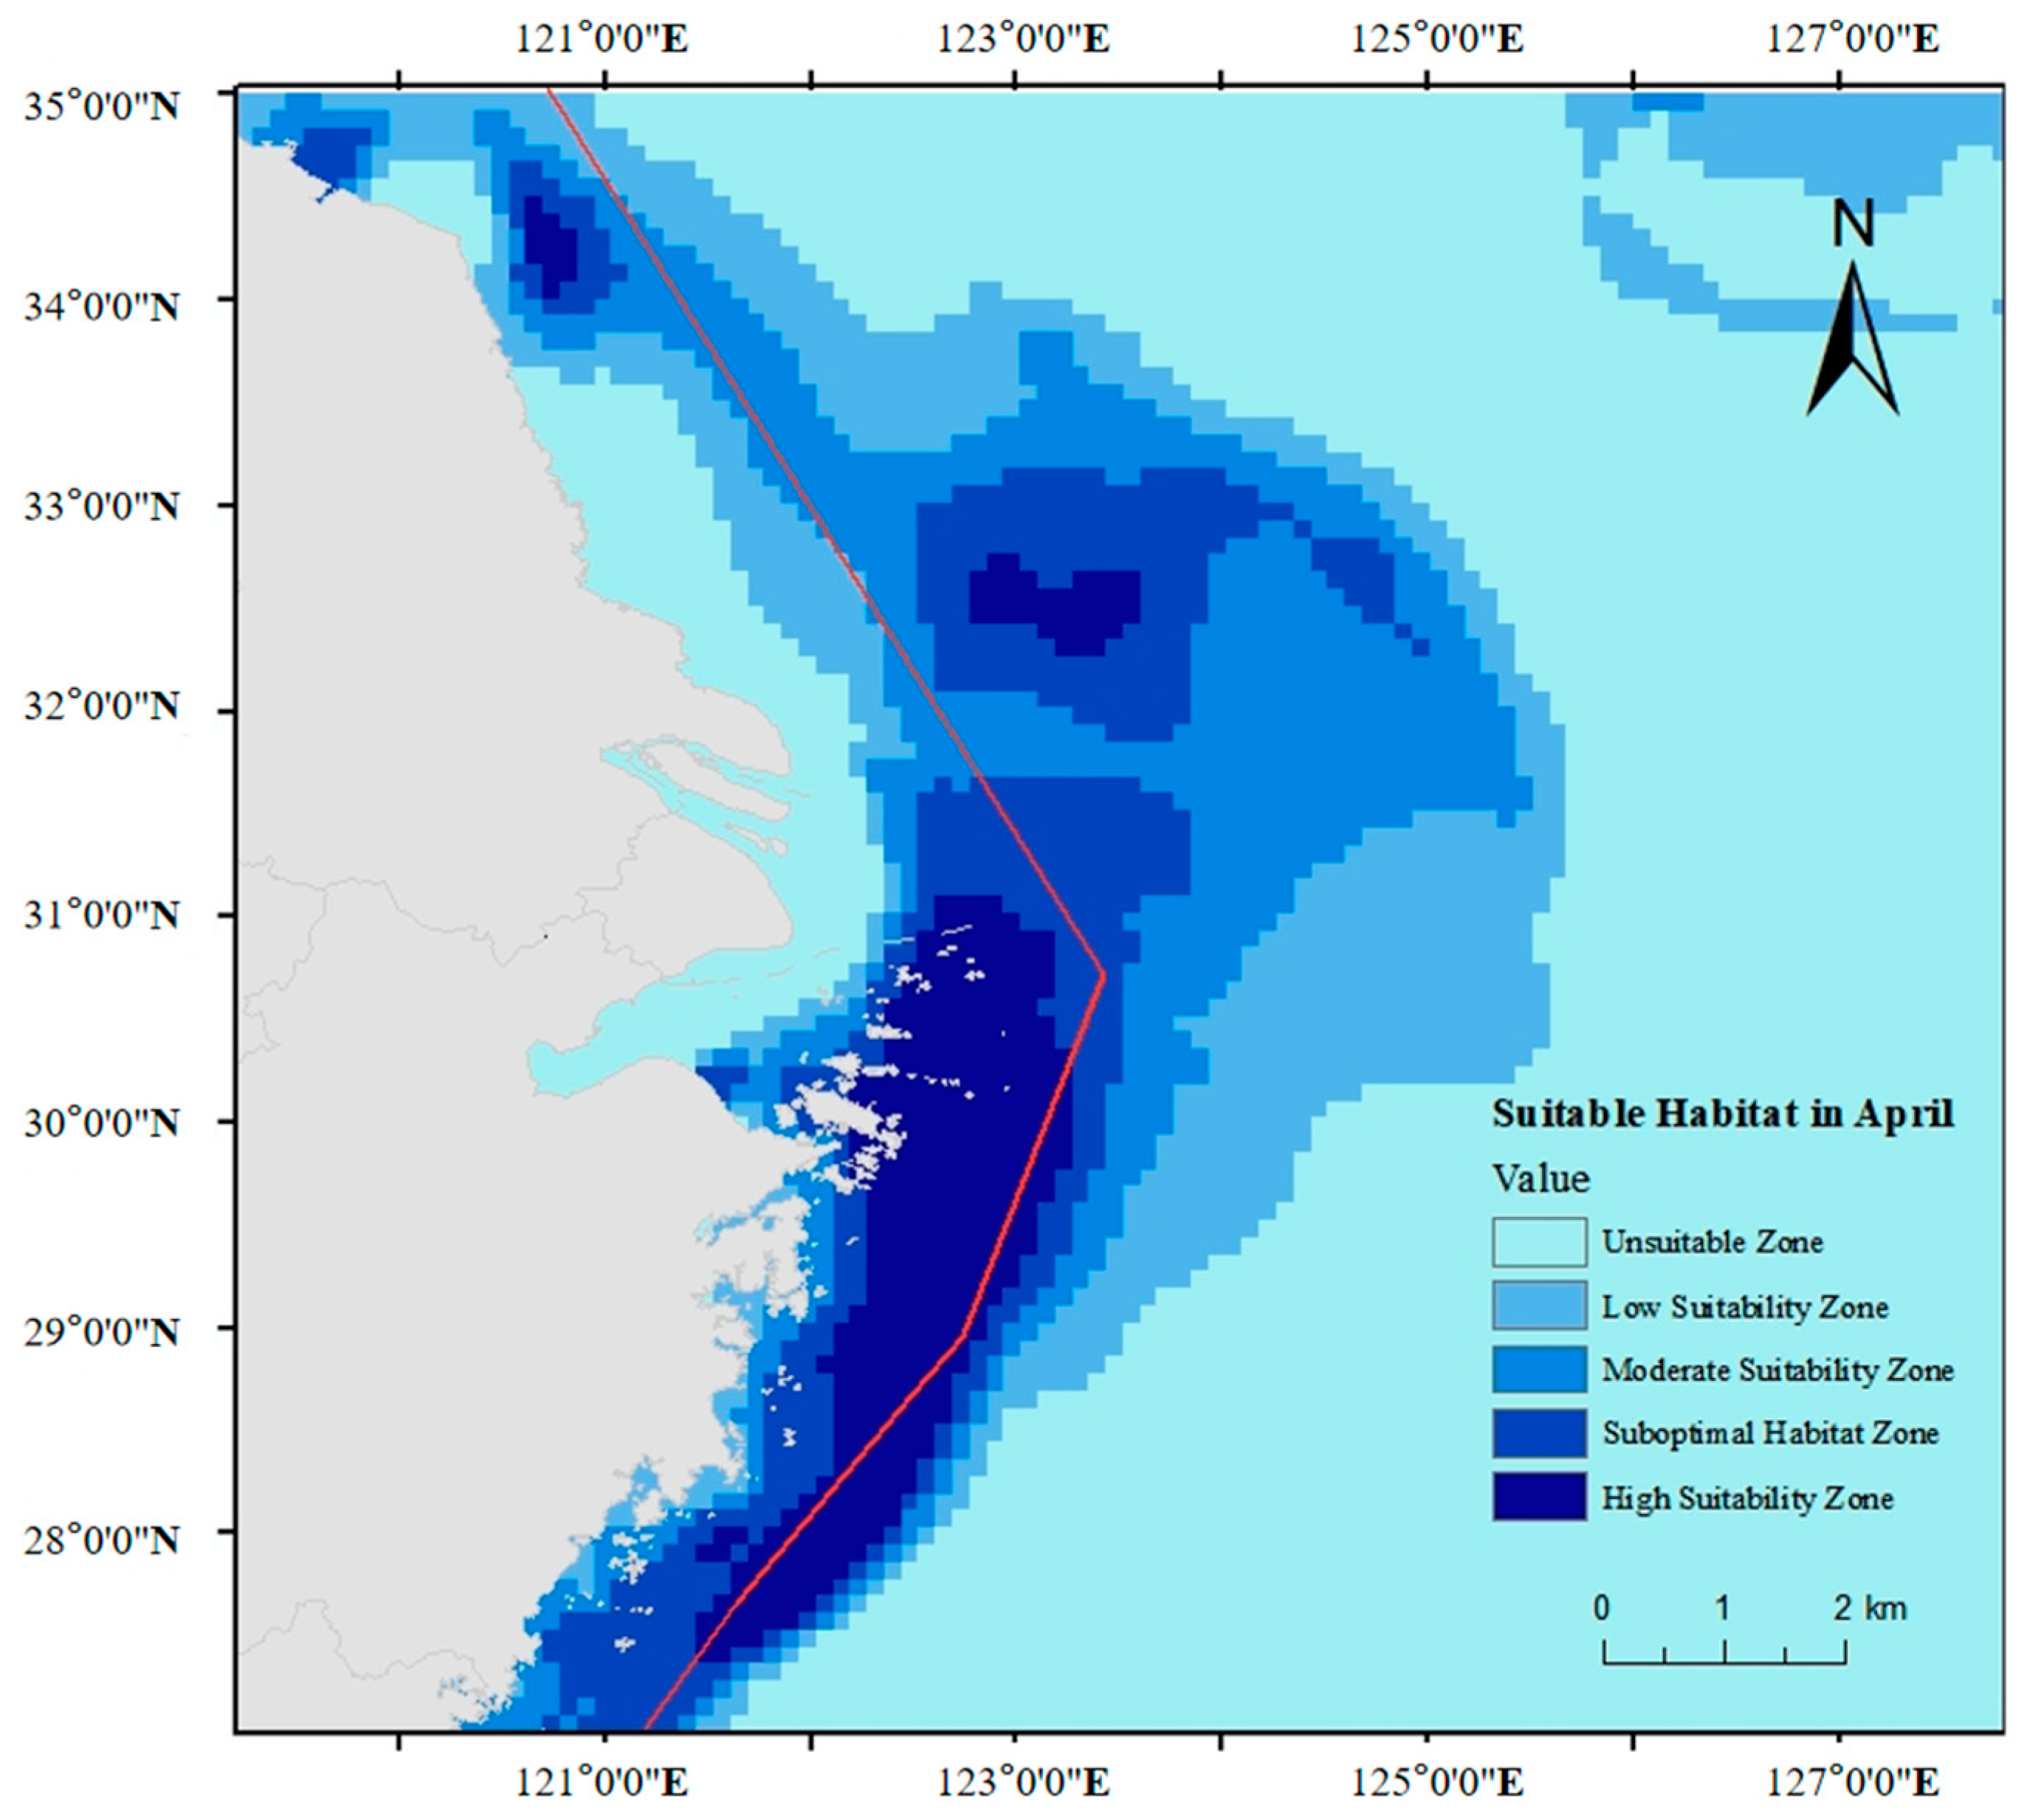
Using the natural breaks classification method to establish suitability thresholds. The resulting habitat suitability distribution patterns are presented in Figure 11, Figure 12 and Figure 13.
During April 2019–2023, habitat suitability zones were classified as follows: unsuitable zone (0 < |K| < 0.072651), low-suitability zone (0.072651 < |K| < 0.212741), moderate-suitability zone (0.212741 < |K| < 0.369632), suboptimal habitat zone (0.369632 < |K| < 0.55489), and high-suitability habitat zone (0.55489 < |K| < 0.78895).
During November 2019–2023, the habitat suitability zones were classified as follows: unsuitable zone (0.000004 < |K| < 0.065559), low-suitability zone (0.065559 < |K| < 0.184133), moderate-suitability zone (0.184133 < |K| < 0.335926), suboptimal habitat zone (0.335926 < |K| < 0.535888), and high-suitability habitat zone (0.535888 < |K| < 0.804993).
The optimal habitat zone for Larimichthys crocea in Zhejiang coastal waters showed a concentrated distribution pattern, primarily located off the coasts of Zhejiang and Jiangsu provinces. Quantitative analysis revealed the following areal distributions: In April, the high-suitability habitat zone covered (11,504.63 km2), followed by the suboptimal habitat zone (22,251.47 km2), moderate-suitability zone (16,326.93 km2), low-suitability zone (22,320.36 km2), and unsuitable zone (268,602.1 km2). In November, the corresponding areas were 27,831.56 km2 (high-suitability habitat zone), 20,322.55 km2 (suboptimal habitat zone), 18,255.85 km2 (moderate-suitability), 48,774.12 km2 (low-suitability zone), and 225,821.4 km2 (unsuitable zone).

4. Discussion

The selection of environmental factors significantly influences the stability and accuracy of MaxEnt model outputs [23]. To optimize model performance, we selected environmental variables based on the following: (1) the ecological characteristics of the target species, (2) relevant historical studies, and (3) correlation analyses among candidate factors. This rigorous selection process enhances model reliability by identifying the most biologically meaningful predictors while minimizing multicollinearity effects.
Habitat suitability critically influences species’ growth, survival, and reproductive success, with its quality principally determined by the positive effects of local environmental factors. The spatial–temporal dynamics of these environmental factors directly shape species distribution patterns. As the fundamental ecological space supporting individual organisms, populations, and communities, habitats represent the integrated combination of physical (e.g., light, temperature) and biological environmental components [24]. Species selectively occupy these habitats based on their specific environmental preferences, a process commonly termed habitat selection. Our analysis identified silicate, nitrate, and salinity as the primary environmental factors influencing Larimichthys crocea habitat selection during April and November, with secondary effects from temperature, depth, phosphate, pH, and primary productivity. While these results align with previous reports emphasizing primary productivity [25], temperature, and salinity [26] as dominant factors, our study specifically highlights the ecological significance of silicate and nitrate. These nutrients serve as essential growth factors for phytoplankton, forming the foundation of marine primary productivity and food webs. This finding complements existing knowledge about nutrient requirements (silicate, phosphate, nitrate) in marine ecosystems and their trophic relationships. Furthermore, Larimichthys crocea demonstrates notable dietary plasticity, with its diverse prey base (characterized by abundant and widely distributed species) contributing to population stability [27]. Larimichthys crocea exhibits an ontogenetic dietary shift, with adults primarily consuming fish and decapods [28], while juveniles initially rely on yolk sac nutrition before transitioning to external feeding. This species demonstrates a progressive dietary transition from selective planktivory to generalized predatory behavior during development [29]. Notably, marine primary productivity—defined as the photosynthetic conversion of inorganic compounds to organic matter by primary producers [30] forms the fundamental basis of these trophic interactions. As the foundation of marine trophic dynamics [31], primary productivity directly influences population biomass and ecosystem carrying capacity. Our study area exhibits particularly high primary productivity, creating optimal conditions for prey species development and consequently supporting robust Larimichthys crocea populations. This trophic linkage explains the significant influence of primary productivity on Larimichthys crocea habitat selection. Seasonal analysis revealed distinct environmental drivers: during April, silicate, phosphate, and primary productivity dominated as key factors, supporting spawning grounds through enhanced planktonic food resources for larval stages. Conversely, November habitats functioned primarily as feeding grounds, with nitrate, silicate, chlorophyll, and primary productivity emerging as predominant factors influencing prey availability for adult fish. Primary productivity-driven trophic webs support abundant populations of fish and decapods, which constitute the primary prey resources for Larimichthys crocea. pH serves as a crucial indicator of aquatic acid–base balance, where deviations can significantly impact marine organisms and ecosystem stability [32]. Specifically, ocean acidification may impair fish sensory functions and behavioral responses, compromising predation efficiency and predator avoidance capabilities [33], ultimately affecting population survival and reproductive success. Consequently, pH represents a critical factor in Larimichthys crocea habitat selection. Furthermore, salinity emerges as another vital environmental parameter influencing marine organisms’ growth, development, and reproductive processes [34,35], Therefore, salinity has a major influence on the selection of habitat for Larimichthys crocea. Temperature, while critically influencing marine organisms’ survival, growth, reproduction, and distribution patterns [36], demonstrates a more moderate effect on Larimichthys crocea in our study area. Although this warm-water species typically exhibits temperature-dependent habitat preferences, the relatively uniform thermal conditions across our study region result in temperature being an important—but not dominant—environmental factor for this population.
The habitat suitability map reveals that Larimichthys crocea primarily inhabits the coastal waters of Zhejiang and Jiangsu provinces, particularly in Zhejiang waters, where numerous islands and reefs are distributed along the coast. This distribution pattern likely results from the abundant prey resources near these structures, coupled with their topographical complexity providing refuge from predators. The species’ habitat range was significantly broader in November compared to April, with sampling data indicating a higher frequency of occurrences in November. In Jiangsu waters, where sampling sites were sparse in April, historical data were incorporated to supplement observations. This seasonal variation may reflect spawning activities in April, followed by post-spawning migration to foraging grounds by November. Using the same methodology, we integrated sampling data from April and November to generate an annual habitat suitability distribution map (Figure 9). The resulting suitability zones exhibited similar spatial patterns to the monthly distributions. However, the comparatively lower volume of sampling data obtained from Jiangsu waters relative to Zhejiang may reduce the reliability of the habitat suitability assessment for this region. Overall, Zhejiang’s offshore waters demonstrated consistently high habitat suitability for Larimichthys crocea, while suitable habitats in Jiangsu were primarily confined to the coastal waters between Nantong and Yancheng.
The MaxEnt model was initially applied to habitat assessment of terrestrial endangered species and invasive organisms, including Abies ziyuanensis [37] and Rhinopithecus bieti [38]. With advancements in marine data collection technologies, it has been subsequently employed to evaluate habitat ranges of marine species such as Illex argentinus [39], Uca arcuata [40], and Xiphias gladius [41]. The model has demonstrated increasing utility in assessing ecological suitability for marine organisms, particularly for species with declining populations such as Larimichthys crocea. MaxEnt can reliably predict habitat suitability for such vulnerable species, enabling targeted conservation efforts to enhance population recovery. This approach provides valuable support for protecting species survival and promoting sustainable populations.
This study has several limitations: (1). Although MaxEnt modeling provides reasonable accuracy, the results remain constrained by data limitations, particularly regarding species distribution records and study area boundaries [42]. The fishery-dependent sampling method for obtaining occurrence data is inherently subject to sampling bias and stochasticity. (2). This study investigated habitat suitability for Larimichthys crocea during April and November. As Larimichthys crocea is a migratory species, the current analysis was conducted without considering its complete migratory cycle. Subsequent MaxEnt modeling could further refine the spatial distributions of its three critical habitats (overwintering, spawning, and feeding grounds) and migration corridors [43], enabling a more comprehensive understanding of its habitat requirements across different life stages. (3). The significant difference in the number of species distribution records between April and November may affect the interpretation and reliability of the comparative results for these two seasons. Therefore, future studies should use relatively balanced sample sizes for comparative analysis. (4). An important limitation of this study is the lack of consideration for prey density. As a predatory species, the distribution of Larimichthys crocea is likely influenced by the spatial distribution of its prey. Future research could incorporate prey data to better predict the ecological suitability of Larimichthys crocea.
The resource restoration strategy for Larimichthys crocea should adopt a multifaceted approach, implementing integrated conservation strategies including protected area establishment and fishing regulations (e.g., seasonal closures and gear restrictions). Interdisciplinary research is essential to comprehensively understand the species’ life history, trophic ecology, and habitat selection, while standardized data collection protocols will improve the precision of scientific assessments to inform conservation planning. Habitat restoration represents a fundamental mechanism for fisheries management [44]. Specifically, protected areas should be established in key habitats, particularly spawning, feeding, and overwintering grounds, along with migration corridors. These measures must maintain ecological integrity and ensure unimpeded migratory pathways to support the species’ survival and reproductive success. Implementing seasonal fishing moratoria during peak spawning seasons (April–May and September–October), with strict prohibitions on harvesting spawning adults and juveniles, represents a critical conservation measure. Anthropogenic pressures, particularly overfishing, have precipitated dramatic population declines in Larimichthys crocea [45], necessitating regulatory measures including minimum mesh sizes and harvestable size limits [2]. Stock enhancement has been widely implemented as a long-term restoration strategy [46] demonstrating effectiveness in replenishing depleted populations [47]. Optimal implementation requires releasing genetically appropriate juveniles within identified habitat suitability zones, significantly improving post-release survival rates. Complementing these measures, targeted public outreach programs can enhance conservation awareness among stakeholders, particularly fishers, emphasizing sustainable practices and policy compliance.

Author Contributions

Conceptualization, S.Y.; methodology, S.Y., Y.Z., Y.Q. and Q.Z.; validation, S.Y.; investigation, H.Z., H.G. and L.W.; resources, Y.Z.; data curation, H.Z., H.G. and L.W.; writing—original draft preparation, S.Y.; writing—review and editing, Y.Z. and W.M.; project administration, Y.Z.; funding acquisition, Y.Z. All authors have read and agreed to the published version of the manuscript.

Funding

This research was funded by the National Key R&D Program “Production Process and Driving Mechanisms of Important Fishery Resources in the East China Sea”: 2023YFD2401901; National Key R&D Program “Blue granary scientific and technological innovation” Key special topics: 2020YFD0900804; Zhejiang Province Science and Technology Special Project: HYS-CZ-202502.

Data Availability Statement

The original contributions presented in this study are included in the article; further inquiries can be directed to the corresponding author.

Conflicts of Interest

The authors declare that this research was conducted in the absence of any commercial or financial relationships that could be construed as a potential conflict of interest.

References

  1. Nelson, J.S.; Grande, T.C.; Wilson, M.V.H. Fishes of the World, 5th ed.; John Wiley & Sons: Hoboken, NJ, USA, 2016; pp. 497–500. [Google Scholar]
  2. Zhou, Y.; Li, S. Atlas of the Main Economic Categories in the East China Sea: Three Fields, One Channel and Protected Areas, 1st ed.; China Ocean Press: Beijing, China, 2018; pp. 1–105. (In Chinese) [Google Scholar]
  3. Tian, M.; Xu, G.; Yu, R. Geographical variation of morphological characters and geographical population of Larimichthys crocea pseudosciaena crocea. Stud. Mar. Sin. 1962, 2, 79–97. (In Chinese) [Google Scholar]
  4. Lu, N.; Zhou, Z.; Dong, F. Large Yellow Ceoaker—The first of the four marine products in China. Fortune Life 2018, 17, 30. (In Chinese) [Google Scholar]
  5. Hong, G.; Chen, B.; Zhang, C. Resource status of Larimichthys crocea overwintering in eastern and central Fujian fishing grounds. J. Fish. Res. 1983, 4, 12–16. (In Chinese) [Google Scholar]
  6. Xu, K.; Liu, Z. The current stock of Larimichthys crocea Pseudosciaena crocea in the East China sea with respects of its stock decline. J. Dalian Fish. Univ. 2007, 22, 392–396. (In Chinese) [Google Scholar]
  7. Murphy, J.S.; Smith, B.A. What can community ecologists learn from species distribution models? Ecosphere 2021, 12, e03864. [Google Scholar] [CrossRef]
  8. Xu, Z.; Peng, H.; Peng, S. The development and evaluation of species distribution models. Acta Ecol. Sin. 2015, 35, 557–567. (In Chinese) [Google Scholar] [CrossRef]
  9. Yang, J.; Dong, M.; Zhong, Y. Application of maximum entropy model in the prediction of marine biological suitable areas. J. Appl. Oceanogr. 2023, 42, 698–707. (In Chinese) [Google Scholar] [CrossRef]
  10. Anderson, R.P. Maximum entropy (MaxEnt) modeling of species geographic distributions based on presence-only occurrence data. N. Y. Acad. Sci. Ann. 2012, 1260, 66–80. [Google Scholar] [CrossRef]
  11. Phillips, S.J.; Hastie, T.; Miroslav Dudík, M. A statistical explanation of MaxEnt for ecologists. Divers. Distrib. 2011, 17, 43–57. [Google Scholar] [CrossRef]
  12. Jaynes, E.T. Information Theory and Statistical Mechanics. Phys. Rev. 1957, 106, 620. [Google Scholar] [CrossRef]
  13. Phillips, S.J.; Anderson, R.P.; Schapire, R.E. Maximum entropy modeling of species geographic distributions. Ecol. Model. 2006, 190, 231–259. [Google Scholar] [CrossRef]
  14. Yin, X.; Zhou, G.; Sui, X.; He, Q.; Li, R. Dominant climatic factors of Quercus mongolica geographical distribution and their thresholds. Acta Ecol. Sin. 2013, 33, 103–109. (In Chinese) [Google Scholar] [CrossRef]
  15. Qi, J. Study on the Spatio-Temporal Changes of Eutrophication in Zhejiang Coastal Sea. Ph.D. Thesis, Zhejiang University, Hangzhou, China, 2021. (In Chinese). [Google Scholar]
  16. Yao, D. Economic Status Quo and Industry Development of Marine Fishery in Jiangsu. J. Huaihai Inst. Technol. 2009, 7, 60–62. (In Chinese) [Google Scholar]
  17. Zhao, H.; Wang, Y.; Zhang, C.; Wang, Y. Assessment of several fishing gear management strategies on economic species yield and biocommunity in Zhoushan fishing ground from the perspective of mixed fisheries. Acta Hydrobiol. Sin. 2025, 49, 042514. (In Chinese) [Google Scholar] [CrossRef]
  18. Wang, Y.; Wang, J.; Zhou, Y. Spatial and temporal distribution characteristics of Larimichthys polyactis in Zhoushan fishing ground and the adjacent waters based on two-stage GAM. J. Fish. Sci. China 2022, 29, 633–641. (In Chinese) [Google Scholar]
  19. Zhao, S.; Xia, L.; Li, R. The past, present and future of Zhoushan’s fisheries. Ocean Dev. Manag. 2015, 32, 44–48. (In Chinese) [Google Scholar]
  20. Wang, J.; Zheng, Y.; Li, Y.; Wang, Y. Potential risks, source apportionment, and health risk assessment of dissolved heavy metals in Zhoushan fishing ground, China. Mar. Pollut. Bull. 2023, 189, 114751. [Google Scholar] [CrossRef]
  21. Liu, H.; Zhong, X.; Tang, J. Seasonal variation of fish community composition and diversity in Jiangsu coastal waters. Mar. Fish. 2017, 39, 9–20. (In Chinese) [Google Scholar]
  22. Wang, Y.; Xie, B.; Wan, F. Application of ROC curve analysis in evaluating the performance of alien species’ potential distribution models. Biodivers. Sci. 2007, 15, 365–372. (In Chinese) [Google Scholar] [CrossRef]
  23. Zhang, H.; Zhao, H.X.; Wang, H. Potential geographical distribution of Populus euphratica in China under future climate change scenarios based on MaxEnt model. Acta Ecol. Sin. 2020, 40, 6552–6563. (In Chinese) [Google Scholar]
  24. Han, M. Pharmaceutical Botany, 14th ed.; Higher Education Press: Beijing, China, 2008; pp. 1–345. (In Chinese) [Google Scholar]
  25. Yang, W.; Hu, W.; Chen, B.; Tan, H. The potential distribution of main Sciaenidae species in coastal China based on MaxEnt model. Chin. J. Ecol. 2022, 41, 1825–1834. (In Chinese) [Google Scholar] [CrossRef]
  26. Yu, C.; Yan, X.; Jiang, Q.; Zhang, Y. Cause analysis of resources change and reconstruction strategy of Larimichthys crocea Daiqu group in the East China Sea. J. Fish. China 2022, 46, 616–625. (In Chinese) [Google Scholar] [CrossRef]
  27. Yang, J.; Zheng, Y. Feeding habits and seasonal variation of the food contents of the large yellow ceoaker, pseudosciaena crocea, pseudosciaena crocea (richardson), off chekiang and kiandsu. Stud. Mar. Sin. 1962, 2, 14–30. (In Chinese) [Google Scholar]
  28. Xu, J.; Chen, J.; Tian, F. Summer diet composition and feeding ecology of large yellow croaker (Larimichthys crocea) in Guanjing Yang. J. Fish. Sci. China 2012, 19, 94–104. (In Chinese) [Google Scholar] [CrossRef]
  29. Zheng, Y.; Yang, J. Feeding habits of Larimichthys crocea larvae, Juveniles and juveniles in Zhejiang coastal waters. Oceanol. Limnol. Sin. 1965, 4, 355–372. (In Chinese) [Google Scholar]
  30. Field, C.B.; Behrenfeld, M.J.; Randerson, J.T.; Falkowski, P. Primary Production of the Biosphere: Integrating Terrestrial and Oceanic Components. Science 1998, 281, 237–240. [Google Scholar] [CrossRef]
  31. Yang, R.; Wang, X.; Han, X. Research on the particle size distribution and distribution and it’s effect on the physiology of marine phytoplankton. Mar. Sci. 2003, 11, 5–9. (In Chinese) [Google Scholar]
  32. Shi, X.; Song, J.; Li, X. Seasonal change of PH in the waters off Changjiang river estuary and its impact factors. Oceanol. Limnol. Sin. 2019, 50, 1033–1042. (In Chinese) [Google Scholar]
  33. Zhao, X.; Liu, G.; Chen, B. Effects and mechanisms of CO2-driven ocean acidification on marine fish behavior: A review. Acta Ecol. Sin. 2019, 39, 5389–5403. (In Chinese) [Google Scholar] [CrossRef]
  34. Brown, S.; Bert, T.; Tweedale, W. The effects of temperature and salinity on survival and development of early life stage Florida stone crabs Menippe mercenaria (Say). J. Exp. Mar. Biol. Ecol. 1992, 157, 115–136. [Google Scholar] [CrossRef]
  35. Velasco, J.; Gutiérrez-Cánovas, C.; Botella-Cruz, M.; Sánchez-Fernández, D.; Arribas, P.; Carbonell, J.A.; Millán, A.; Pallarés, S. Effects of salinity changes on aquatic organisms in a multiple stressor context. Philos. Trans. R. Soc. Lond. B Biol. Sci. 2019, 374, 20180011. [Google Scholar] [CrossRef]
  36. Yao, C.; Somero, G.N. The impact of ocean warming on marine organisms. Chin. Sci. Bull. 2015, 60, 805–816. (In Chinese) [Google Scholar] [CrossRef]
  37. Li, S.; Mo, S.; Hu, X.; Deng, T. Prediction of potential suitable areas of endangered plant Abies ziyuanensis based on MaxEnt and ArcGIS. Chin. J. Ecol. 2024, 43, 533–541. (In Chinese) [Google Scholar] [CrossRef]
  38. Shi, X.; Shen, J.; He, C. Analysis of Habitat Suitability and Conservation Gap of the Yunnan Snub-nosed Monkey Based on MaxEnt Model. Chin. J. Wildl. 2025, 46, 14–23. (In Chinese) [Google Scholar]
  39. Chen, P.; Chen, X. Analysis of habitat distribution of Argentine shortfin squid (Illex argentinus) in the southwest Atlantic Ocean using maximum entropy model. J. Fish. China 2016, 40, 893–902. (In Chinese) [Google Scholar] [CrossRef]
  40. Zhou, X.; Zhang, L.; He, C. Comparison of habitat suitability of fiddler crab (Uca arcuata) based on habitat suitability index model and maximum entropy model. J. Dalian Fish. Univ. 2023, 38, 819–827. (In Chinese) [Google Scholar] [CrossRef]
  41. Tang, W.; Wang, X.; Wu, F. Simulation of spatio-temporal distribution of swordfish habitat in the western Indian Ocean based on maximum entropy model. Acta Oceanol. Sin. 2022, 44, 100–108. (In Chinese) [Google Scholar] [CrossRef]
  42. Ji, Q.; Wang, R.; Huang, Z. Effects of sample size and study range on accuracy of MaxEnt in predicting species distribution: A case study of the black-and-white snub-nosed monkey. Acta Theriol. Sin. 2019, 39, 126–133. (In Chinese) [Google Scholar]
  43. Zhang, M.; Shi, W.; Gui, F. Study of suitable habitats for Sepiella maindroni in Zhoushan sea areas based on MaxEnt model. S. China Fish. Sci. 2023, 19, 22–31. (In Chinese) [Google Scholar] [CrossRef]
  44. Lorenzen, K.; Agnalt, A.; Blankenship, H. Evolving Context and Maturing Science: Aquaculture-Based Enhancement and Restoration Enter the Marine Fisheries Management Toolbox. Rev. Fish. Sci. 2013, 21, 213–221. [Google Scholar] [CrossRef]
  45. Yan, L.; Jiang, Y.; Xu, Q. Reproductive Dynamics of the Large Yellow Croaker Larimichthys crocea (Sciaenidae), A Commercially Important Fishery Species in China. Front. Mar. Sci. 2022, 9, 868580. [Google Scholar] [CrossRef]
  46. Lorenzen, K. Understanding and managing enhancements: Why fisheries scientists should care. J. Fish Biol. 2015, 85, 1807–1829. [Google Scholar] [CrossRef] [PubMed]
  47. Richardson, L.; Lenfant, P.; Clarke, L. Examining current best-practices for the use of wild post-larvae capture, culture, and release for fisheries enhancement. Front. Mar. Sci. 2023, 9, 1058497. [Google Scholar] [CrossRef]
Figure 1. Schematic Diagram of the MaxEnt Model.
Jmse 13 01945 g001
Figure 2. Distribution on Points in April and November.
Jmse 13 01945 g002
Figure 3. Correlation analysis of environmental factors in April.
Jmse 13 01945 g003
Figure 4. Correlation analysis of environmental factors in November.
Jmse 13 01945 g004
Figure 5. ROC curve validation results for April.
Jmse 13 01945 g005
Figure 6. ROC curve validation results for November.
Jmse 13 01945 g006
Figure 7. April knife cut plots.
Jmse 13 01945 g007
Figure 8. November knife cut plots.
Jmse 13 01945 g008
Figure 9. Ecological factor response curve for April. (a) Ecological Response Curve for Nitrate. (b) Ecological Response Curve for SSS. (c) Ecological Response Curve for Phosphate. (d) Ecological Response Curve for Silicate.
Jmse 13 01945 g009
Figure 10. Ecological factor response curve for November. (a) Ecological Response Curve for primary productivity. (b) Ecological Response Curve for silicate. (c) Ecological Response Curve for nitrate. (d) Ecological Response Curve for SSS.
Jmse 13 01945 g010aJmse 13 01945 g010b
Figure 11. Suitable Habitat in April for Larimichthys crocea.
Jmse 13 01945 g011
Figure 12. Suitable Habitat in November for Larimichthys crocea.
Jmse 13 01945 g012
Figure 13. Annuial Habitat Suitability Zones for Larimichthys crocea, 2019–2023.
Jmse 13 01945 g013
Table 1. Percent contributions of environmental factors to the MaxEnt model for April.
VariablePercent Contribution
Nitrate37
SSS29.6
Silicate8.3
SST7.9
pH5.7
Depth3.8
Chl2.5
Do2.4
Flow velocity1.4
Primary productivity1
Phosphate0.4
Table 2. Percent contributions of environmental factors to the MaxEnt model for November.
VariablePercent Contribution
Silicate23
Chl19.1
Phosphate15.6
Depth14.9
Nitrate10.9
Primary productivity6.4
SST5.8
SSS2.8
pH1.1
Do0.3
Flow velocity0.1
Disclaimer/Publisher’s Note: The statements, opinions and data contained in all publications are solely those of the individual author(s) and contributor(s) and not of MDPI and/or the editor(s). MDPI and/or the editor(s) disclaim responsibility for any injury to people or property resulting from any ideas, methods, instructions or products referred to in the content.