Abstract
Offshore platforms need to be made, from the start of their construction, to withstand the extreme environmental conditions they will be facing. This study investigates the welding-induced residual stress and distortion in a Y-shaped tubular joint extracted from an offshore wind turbine jacket substructure. While similar joints are commonly used in offshore platforms, their welding behavior remains underexplored in the existing literature. The joint configuration is representative of critical load-bearing connections commonly used in offshore platforms exposed to harsh marine environments. A finite element model has been developed to simulate the welding process in a typical offshore tubular joint through thermal and mechanical simulation. Validation of the model has been achieved with results against reference experimental data, with temperature and distortion errors of 3.9 and 5.3%, respectively. Residual stress and distortions were analyzed along predefined paths in vertical, transverse, and longitudinal directions. A mesh sensitivity study was conducted to balance computational efficiency and result accuracy. Furthermore, clamped and free displacement boundary conditions are analyzed, demonstrating reduced deformation and stress for the second case.
1. Introduction
Offshore platforms are large steel structures that support critical operations such as oil and gas extraction, wind energy generation, and marine research [1,2,3,4]. These systems, including wind turbine foundations and oil and gas facilities, rely extensively on welded tubular joints to maintain structural integrity under harsh environmental conditions [5,6]. Such joints are subjected to cyclic wave loads, corrosion, and temperature fluctuations, making welding quality a decisive factor in platform durability. Accumulated deformations can lead to small gaps between tubular elements, complicating the subsequent construction process. High residual stresses may also trigger cracks in the material, which must be repaired before proceeding to the next assembly stage [7]. This underlines the importance of thoroughly understanding the effects of welding.
Recent studies have extensively investigated the influence of welding parameters on thermal and mechanical responses in welded structures. Malik et al. [8] analyzed how welding velocity affects residual stress fields and geometric imperfections in cylindrical and plate components. Heat input and energy distribution have also been shown to significantly impact temperature gradients and cooling behavior, as demonstrated by Gery et al. [9].
In addition, the welding sequence and number of passes play a critical role in distortion control and residual stress evolution. Chen et al. [10] examined stiffened plate structures and confirmed that optimized sequencing can reduce peak deformation. To balance simulation accuracy and computational cost, adaptive meshing and remeshing techniques have been proposed [11,12], enabling efficient modeling of complex welds without excessive node counts.
Indeed, improving the overall understanding of the welding effects has long been a key motivation for the industry. Numerous studies have addressed this subject, though the majority have focused on T-joint welding between a plate and a stiffener [13,14,15,16,17]. These models have contributed to a better understanding of the mechanisms involved during welding and have led to the optimization of the process. A numerical model of a T-joint was previously created, and the welding process was simulated. The results obtained were compared with Fu’s work [18] to validate the accuracy of the model.
Despite extensive research on welding simulation, few studies have specifically addressed the offshore context, where environmental constraints and structural demands differ significantly from onshore applications. This study seeks to bridge this gap by analyzing a tubular joint from an offshore wind platform, thereby providing insights into welding behavior on structural configurations typical of offshore platforms. In practice, offshore platforms involve relatively few welds between flat plates and stiffeners. Indeed, many of the structural elements used during construction are cylindrical, forming what are commonly referred to as tubular joints. Simulating the residual stress and distortion caused by welding between two such components can yield solutions more relevant for the offshore industry. While previous research has addressed welding in offshore structures, many studies rely on simplified geometries and do not fully capture the complexity of weld paths or simulation conditions [19,20].
This study investigates a Y-shaped tubular joint with a non-linear welding trajectory, offering a more representative model of real-world offshore applications. The joint’s angled configuration introduces unique stress and deformation patterns that are not adequately covered in existing literature, particularly in relation to boundary conditions and mesh sensitivity. The objective of the present study is to simulate the residual stress and distortion in welded joints of offshore platforms. A finite element method supported by the software ANSYS APDL Mechanical, version 2022 R2, will be used. A specific tubular joint from an offshore platform structure is chosen as the most relevant for the present study. To achieve this objective, the paper is organized into three chapters in addition to the present introduction.
Firstly, the materials and methods used in this study are defined in Section 2 to establish the technical background necessary for the study. This includes the characteristics of the present model. Secondly, the results obtained for the temperature distribution, deformation, and residual stress are presented in Section 3. A comparison between different mesh sizes and boundary conditions is also provided. Lastly, a conclusion in Section 4 summarizes the accomplishments of this study by going through its different stages. The future research directions on this topic are also discussed.
2. Materials and Methods
2.1. Heat Source Model
To produce the fusion zone (FZ) at the welding spot, a heat input needs to be applied in a highly localized manner [21,22]. Even though heat concentration can be generated by different means depending on the welding technique [23], the principal parameter to create the temperature field remains the heat flow or power density [W/m3].
The idea of a distributed heat source was later introduced by Pavelic et al. [24], who proposed a disc-shaped solution based on a Gaussian distribution of the thermal flux. Eagar further advanced the field by enabling the prediction of the weld pool shape [25], establishing links between welding and material parameters and the FZ geometry. Finally, Goldak et al. [26] improved the previous solutions with a double ellipsoid configuration, as illustrated in Figure 1.
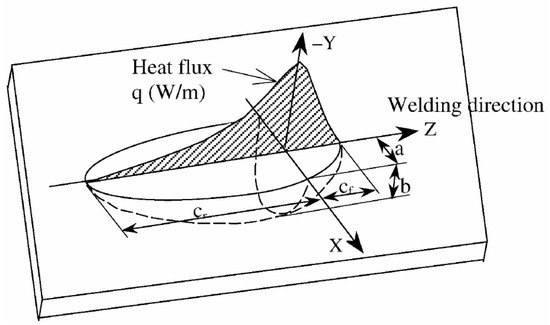
Figure 1.
Goldak’s double-ellipsoid distribution of the heat source model.
The size and shape of this classic model of the heat source can be determined to match the weld pool dimensions, allowing for precise results even in the fusion zone. The fraction f of heat deposited regulates the front and rear sections, maintaining ff + fr = 2. The power density distribution for the front and rear ellipsoid regions is expressed as follows [26]:
While Goldak’s model is widely used today, many researchers have proposed variations based on it [27]. Moreover, choosing the shape parameters of the double ellipsoid remains the main limitation of the models. As a result, expressing analytic solutions for the thermal field geometry has become a priority, and several mathematical expressions have been proposed [28,29,30].
2.2. Tubular Joint
The structure is modelled with a material of low-carbon grade DH36 ferric steel. This material is typically employed in industry, and its temperature-dependent properties are well documented [31,32]. The liquidus temperature of the DH36 steel was experimentally measured to be 1483 °C. The mechanical properties of this low-carbon steel are presented in Figure 2, including thermal conductivity, elastic modulus, specific heat, thermal expansion, density, and yield strength. The yield strength at room temperature is 483 MPa. These parameters were directly input into the simulation software to characterize the temperature-dependent behavior of the material.
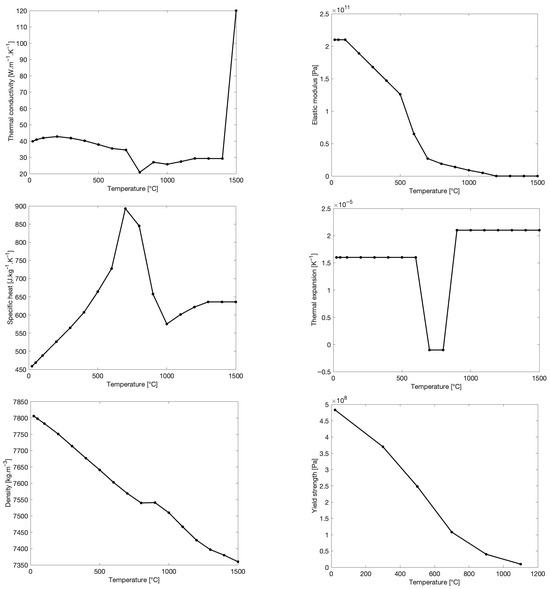
Figure 2.
Evolution of the material properties depending on temperature (the data was from [32]).
The tubular joint considered in this study is extracted from a 4-legged jacket substructure from a wind farm in Republic of Korea [33], with the main dimensions presented in Table 1. For reference, the related wind turbine has a rating of 3 MW and is located in a water depth of 14 m. Jacket-type foundations are widely used in offshore wind farms due to their robustness and adaptability to varying seabed conditions. The selected joint represents a typical offshore platform connection exposed to cyclic wave loading and harsh marine conditions. Understanding the welding-induced stress and deformation in such joints is essential for ensuring structural integrity and minimizing maintenance in offshore environments.

Table 1.
Main dimensions of the jacket structure, in mm (the data was from [33]).
The angle between the cylinders is equal to 45°. The length of the two cylinders was arbitrarily fixed. They were chosen to be long enough to minimize the impact of the boundary conditions on the displacement in the welding zone, while avoiding excessive length to keep a reasonable computational cost. The influence of the tubes’ length on thermal behavior and residual stress near the welding line is considered small [34]. However, it significantly affects the overall distortion of the structure and must be considered when evaluating global deformation.
Two CAD software were used for the 3D design. Firstly, ANSYS Design Modeler (version 2022 R2) for the shape and welding bead. Then, Rhinoceros 3D (version 8) is used to define the path followed by the heat source during the thermal simulation, with two sets of key points in the model serving as local coordinate systems of the moving heat source. ANSYS Design Modeler was used for geometry creation and meshing due to its integration with APDL, while Rhinoceros 3D was employed to define the complex non-linear weld path, which is more efficiently handled using its parametric modeling capabilities. This hybrid approach allowed for precise control over the heat source trajectory.
The structure is divided into nine volumes to locally adapt the mesh refinement. On the geometry shown in Figure 3, two paths were defined to facilitate data collection.
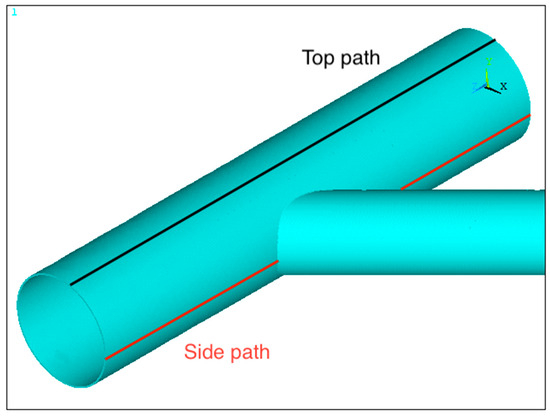
Figure 3.
Perspective view of a typical offshore tubular joint, with top and side paths.
2.3. Mesh Characteristics
The term Finite Element (FE) was introduced by Clough during a conference in 1960 [35]. Yet the method itself can be traced back to the beginning of the 1950s, when aeroplane companies started using matrix notation for aircraft structural engineering [36].
In structural analyses, the deformations were approximated by a combination of simple strain fields acting inside the element [37]. Finite elements were later used in other fields of engineering. However, they remained expensive in terms of computational time, especially for multi-pass welding [38]. Michalieris et al. presented a technique addressing this issue: the welding thermal simulation was only done in two dimensions, while the structural analysis was still three-dimensional [39]. Decoupling the thermal and mechanical simulations implies reducing the computational cost while maintaining great performance.
Using solid elements for the meshing of the volume enables the representation of the stresses close to the weld, where a surface element cannot account for the thickness temperature variation [40]. In the present model, the mesh is composed of 10-node tetrahedral solid elements SOLID98, suitable for a thermal–structural analysis. It is well-suited to model irregular meshes produced by CAD systems. The degrees of freedom can be changed when finishing the thermal analysis, from temperature only to translations in the directions X, Y, and Z. It gave better convergence results than using two distinct element types for each part of the analysis, such as SOLID87 and SOLID187. The mesh consists of solid elements distributed across nine volumes of the joint structure, with localized refinement near the weld line to enhance accuracy in regions of high thermal and mechanical gradients.
Five different mesh sizes were implemented, see Table 2, by progressively increasing the element sizes. A limit is reached for the welding bead, at 4 mm for the smallest elements, as larger sizes would prevent the convergence of the computation. The decrease in the total number of elements is then only done by playing with the regions distant from the welding zone. On the other hand, issues will quickly arise if using more nodes: computational time and necessary storage are too demanding.

Table 2.
Number of nodes, in thousands, and element sizes, in mm.
Figure 4 gives a close view of the refinement of the mesh close to the welding line. This model corresponds to the simulation mesh containing approximately 198,000 nodes and 135,000 elements. All contour plots presented in the subsequent sections of this paper are based on this specific mesh configuration.
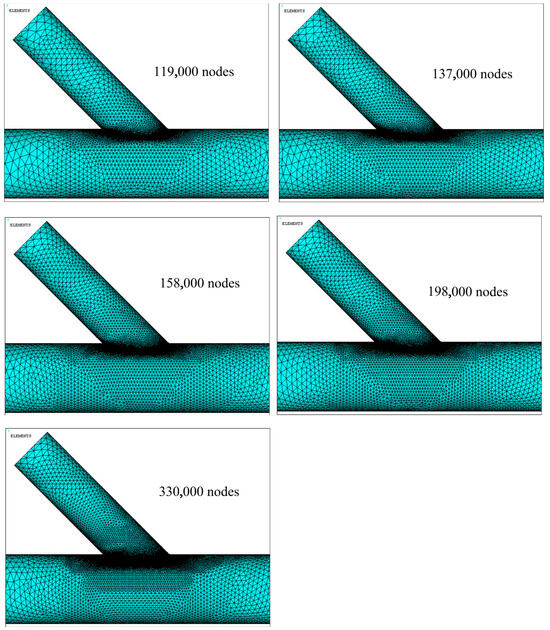
Figure 4.
Perspective close-up on the model meshing, showing localized refinement near the welding line.
2.4. Welding Simulation
In this paper, the fillet weld studied is composed of a single pass. The simulation framework is intended for fusion welding processes, such as Flux-Cored Arc Welding (FCAW) and Gas Metal Arc Welding (GMAW), which are widely used in offshore platform construction. This pass is considered constant in terms of parameters, as presented in Table 3. The required velocity is achieved via the number of key points in the welding line. The energy input rate is then calculated with an efficiency of the welding method η = 80% [41,42]. Although this type of joint typically requires multi-pass welding in practice, this simulation aims to evaluate the thermal and mechanical behavior of a simplified weld configuration, representative of a localized weld segment.

Table 3.
Parameters of the welding process.
As no experimental data were accessible for the study, the double ellipsoid heat source parameters were selected based on commonly accepted values in the literature and refined through multiple simulation iterations to best match the expected weld pool geometry, as presented in Table 4. Its geometry matches the welding bead width of 6 mm, with a rear part four times longer than the front one. It is also fixed that ff + fr = 2. After 708 s of welding, the structure cools for one hour.

Table 4.
Parameters of the double ellipsoid model.
To optimize computational efficiency, the calculation frequency is gradually reduced. For the last half hour, results are computed only once per minute. The heat transfer between the material and the surrounding environment at a temperature of 25 °C is applied to all the outside surfaces, and during the entirety of the thermal analysis, with a heat transfer coefficient of 20 W/(m2 K) [41]. Radiative heat losses were considered in the simulation by assigning an emissivity value of 0.9 [15,18,42] to the material surface. The Stefan–Boltzmann constant (5.67 × 10⁻⁸ W/m2·K4) is internally used by ANSYS for radiative heat transfer calculations. The latent heat effect could be considered in the material model by increasing the specific heat at the melting temperature, but it is not explicitly modeled in the current study.
Across the five thermal simulations that were run, the value reached at the end of the cooling was 26.59 °C, with a standard deviation of 0.15 °C, showing a perfect correlation independently of the mesh size.
The numerical simulation in ANSYS is based on a transient thermal and mechanical analysis. The nonlinear equations are solved using the full Newton–Raphson method with automatic convergence control. Thermal loads are applied in discrete steps, and all material properties are defined as temperature-dependent.
2.5. Birth and Death
The moving heat source creates a molten pool on the welding line. When the steel becomes liquid, above 1483 °C for DH36 steel, its mechanical interactions with the rest of the structure decrease immensely.
The distortion and stress accumulated in these elements need not be considered. The molten area is numerically killed, with a passive state of the elements achieved by giving them low stiffness and heat conductivity [43,44]. Figure 5 shows the area of dead elements synonymous with the molten pool location. When their temperature falls below the limit, they will be reactivated.
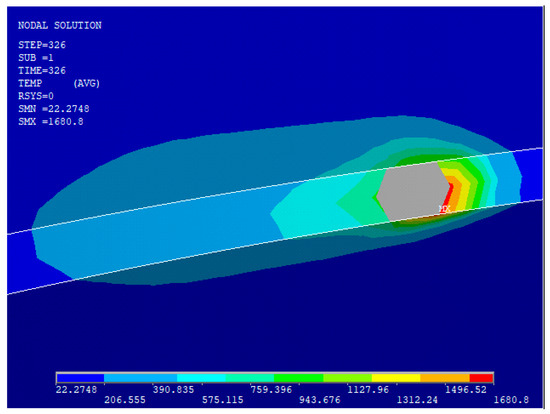
Figure 5.
Deactivated elements in grey, with temperature values indicated in °C.
It is worth noting that the birth and death element method remains a widely recommended and effective approach for welding simulation, particularly in thermal analysis. By selectively deactivating and reactivating elements based on temperature thresholds, this method enables accurate representation of the molten pool and heat-affected zones without excessive computational cost. In our study, it allowed for precise control of thermal gradients and cooling behavior, which are critical for predicting residual stress and distortion. While effective for capturing thermal gradients, the method does not capture fluid flow or metallurgical phase transitions in detail, and stiffness discontinuities may arise during reactivation. These effects are mitigated in our model by using temperature-dependent material properties and a refined mesh near the weld line.
2.6. Validation in Temperature Distribution
Due to the limited availability of welding studies specifically focused on tubular members in offshore platform structures, the validation of the proposed moving heat source finite element model was conducted using a welded stiffened plate configuration. This configuration, widely studied in the literature, provides a reliable reference for assessing the accuracy of thermal and mechanical responses. The comparison confirms the model’s ability to capture the key features of welding-induced residual stress and distortion, thereby supporting its application to more complex tubular joint geometries.
The configuration of the fillet joint, as shown in Figure 6, follows the dimensions provided in Reference [18], with a joint length and flange width of 500 mm, a web height of 300 mm, and a uniform thickness of 9 mm. The welding sequence begins on one side of the stiffener and continues on the opposite side. The mesh consists of exactly 120,480 nodes. Along the length of the joint, a uniform element size of 2 mm is used. In the perpendicular direction, a refined mesh is applied near the weld bead to improve accuracy in the heat-affected zone while maintaining a manageable total number of elements. The thickness of both the web and flange is divided into four elements, and the weld bead is also discretized with four elements along its inclined direction. These elements are automatically deformed by the software to better fit the triangular shape of the weld bead.
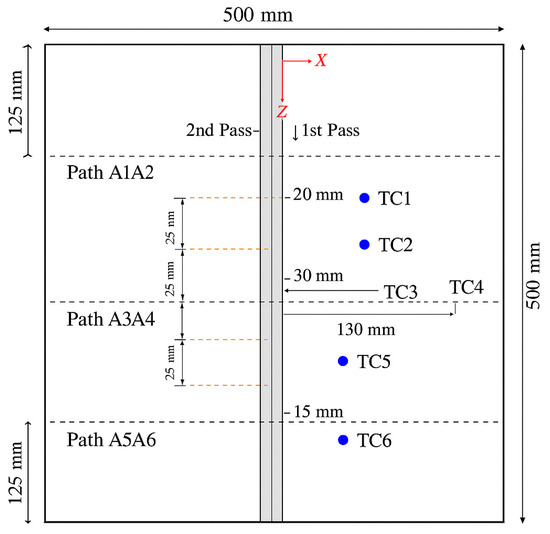
Figure 6.
Schematic representation of the welded stiffened plate (top view) and the locations of the thermocouples.
The double ellipsoid heat source model is applied to each node along the weld path. Final deformations were measured one hour after the second pass. Figure 7 illustrates the temperature distribution during the first welding pass. Nine isosurfaces describe the heat-affected zone, clearly showing the double ellipsoidal shape of the heat source, with the rear part being four times longer than the front. The maximum temperature, located at the center of the HAZ, reaches 1787 °C (above the material’s transformation point), indicating the presence of a molten weld pool.
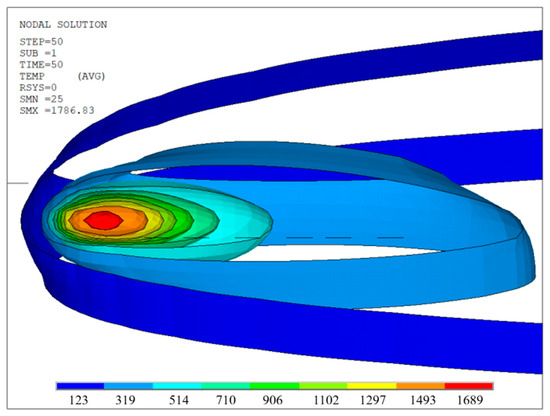
Figure 7.
Temperature distribution in the heat-affected zone in the welded stiffened plate, in °C.
To assess the accuracy of the developed finite element model, a comparison was made between the simulated maximum temperatures and reference values reported in [18] at several thermocouple positions. As shown in Table 5, the numerical results closely match the reference data, with relative errors ranging from 0.67% to 6.94%. These low error percentages confirm the reliability of the thermal simulation, and the suitability of the double ellipsoid heat source model used in this study.

Table 5.
Maximum temperature characteristics, in mm.
The selected measurement points cover various distances from the weld centerline, allowing for a comprehensive validation across different thermal gradients. The consistency between the numerical and reference temperatures demonstrates that the model accurately captures the heat distribution during welding, thereby supporting its application to more complex geometries such as tubular joints in offshore structures.
To validate the numerical model, distortion results were compared with experimental data from Reference [18], which used an identical fillet joint configuration. The comparison along three paths (A1A2, A3A4, A5A6) in Table 6 shows close agreement, with relative errors of 3.1%, 3.3%, and 9.3%, respectively. The relatively high value 9.3% error at path A5A6 can be attributed to our use of a single-pass welding model and the stiffness jumps inherent to the birth–death element technique.

Table 6.
Comparison of numerical and experimental distortion values along three paths.
3. Results and Discussion
Physical boundary conditions need to be defined to fix the displacement of the model in space. The analysis will start with clamped boundary conditions, where the three extremities of the cylinders are fixed in translation in all directions. Another set of conditions was implemented, which will lead to a discussion later in this paper.
3.1. Distortion
The results of the different meshes in terms of deformation will be compared. The vertical distortion is plotted along the top path while the X and Z translations follow the side path. The greatest difference between the meshes is observed in the vertical deformation, in the Y direction. In Figure 8, all the curves are almost identical to each other. The peaks are reached at the same position on the Z axis, and the curves separate only near the extremities of the leg. Nevertheless, taking into consideration all the models, the maximum deformation differs between the meshes with a root mean square error of 0.025 mm, compared to the results of the densest mesh.
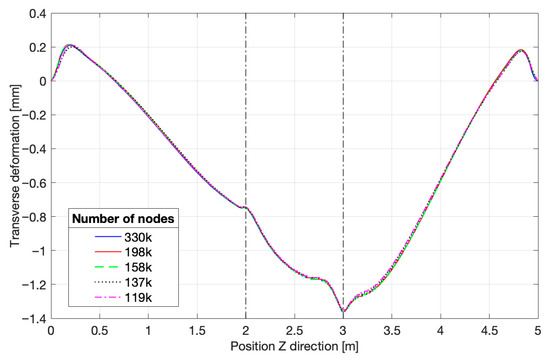
Figure 8.
Vertical deformation for each mesh, top path.
The vertical deformation represents the highest global distortion compared to the two other directions, explaining partly why the differences between the meshes are easier to grasp. On the graph displayed in Figure 9 for the transverse deformation, it is hard to distinguish each of the curves.
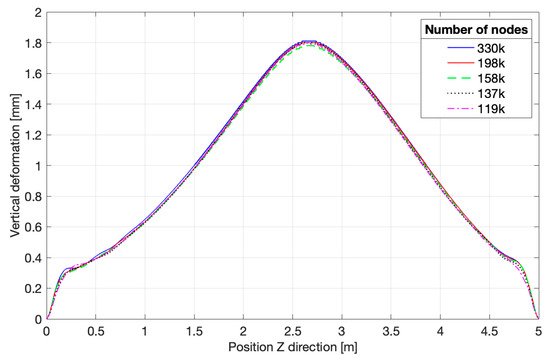
Figure 9.
Transverse deformation for each mesh, side path.
The two dotted vertical lines represent the welding line, on both sides of the second cylinder, as the side path passes through it. It justifies the small peaks located at these two positions. Finally, the longitudinal distortion in Figure 10 is almost negligible as it reaches only a maximum of 0.35 mm across the full structure, a value four times smaller than in the two other directions. Along the path, the maximum value changes from one mesh to another, with a steady decrease going to the denser ones. However, while looking at the full model, the Root Mean Square Error (RMSE) of the maximum value, compared to the densest mesh, is only 0.008 mm, as presented in Table 7. It means that changing the element size did not impact the value, but its location on the structure.
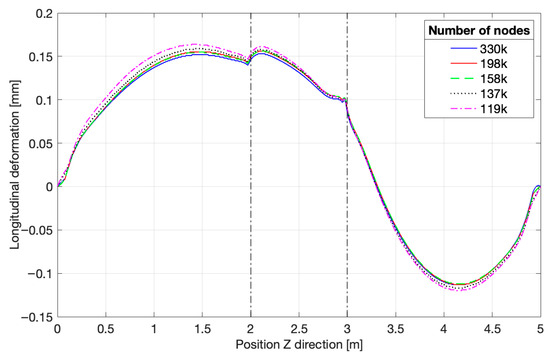
Figure 10.
Longitudinal deformation for each mesh, side path.

Table 7.
Maximum deformation characteristics, in mm.
Regarding the transverse and longitudinal deformation, the curves are almost indistinguishable from each other. It is worth noting that the longitudinal deformation is much smaller than the other two components. The evolution of the distortion along the Z axis is asymmetric, due to the angle of the vertical brace. Even if the element sizes did not impact the distortion results much, it was still decided to remove the densest mesh, as it was too demanding in terms of computational power.
The mesh sensitivity study presented here serves as a verification step to ensure numerical stability. The subsequent analysis focuses on the thermal and mechanical behavior of a tubular joint, which represents a complex and industrially relevant configuration.
3.2. Temperature Distribution
The element sizes are directly linked to the number of nodes at which the heat source is applied at each time step. The more locations, the more stable the generated thermal flux will be. Table 8 collects the maximum temperature between 100 s and 114 s.

Table 8.
Maximum temperature characteristics.
The samples’ RMSE, based on the average values, helps classify the meshes. The 198,103 nodes’ mesh appears as the most precise, while maintaining acceptable computational time.
The temperature evolution was measured at positions 1.90, 1.95, 1.98, and 1.99 m along the Z axis, corresponding to distances of 100, 50, 20, and 10 mm away from the welding line. As shown in Figure 11, the temperature peaks become smaller and occur later as the distance from the welding line increases. By the end of the simulation, the values stabilize, which justifies the completion of the cooling phase. Achieving uniform temperatures across the structure is important, as it indicates relatively constant mechanical properties throughout the joint.
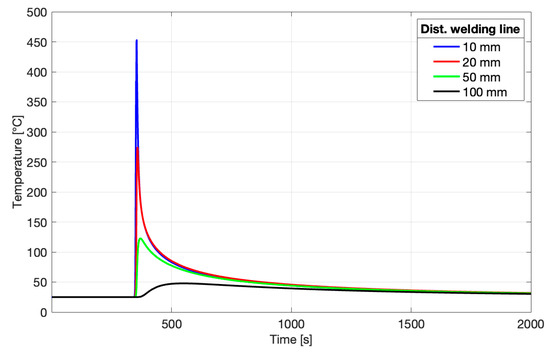
Figure 11.
Temperature evolution at various distances from the welding line.
Finally, the transient thermal distribution at the beginning and at the end of the cooling process is analyzed in Figure 12 and Figure 13. The bottom side of the welding zone remains at a higher temperature, due to the fact that it was the last area affected by the heat source. After 900 s, the peak temperature near the weld toe reaches approximately 83 °C (see Figure 12). In Figure 13, the temperature across the joint has largely stabilized, with the entire surface cooling to around 26 °C, confirming the end of the transient thermal phase.
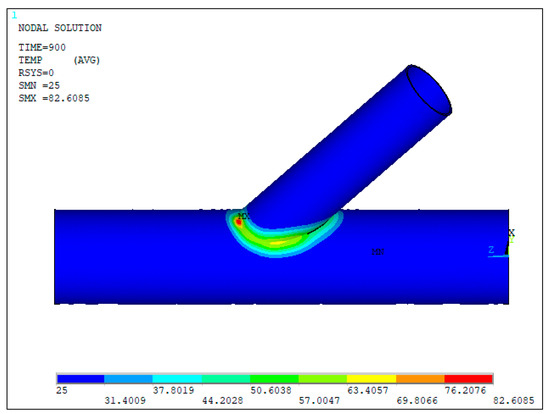
Figure 12.
Thermal distribution in the tubular joint, 3 min after the end of welding, in °C.
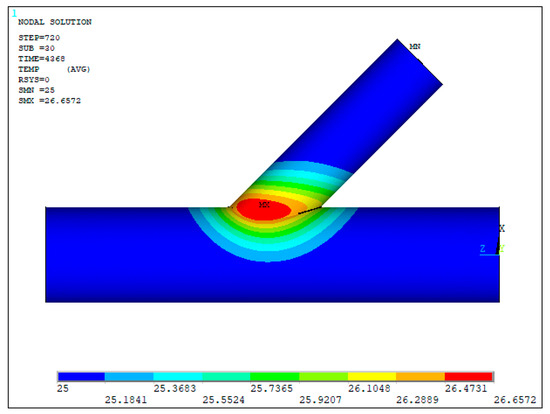
Figure 13.
Thermal distribution in the tubular joint, end of cooling, bottom view, in °C.
Beyond the weld zone, the temperature decreases gradually with increasing distance from the welding line. The extremities of both the leg and the vertical brace remain unaffected, as their considerable distance from the weld area prevents any significant thermal influence.
Elsewhere, the temperature decreases progressively with increasing distance from the welding line. The extremities of the leg and of the vertical brace show no significant change in temperature, due to their considerable separation from the welded region.
3.3. Residual Stress
The maximum of the transverse stress is reached at the extremities of the cylinder and is compressive, as shown in Figure 14. The value is −220 MP, induced by the clamped conditions. In the center part of the leg, it becomes tensile, reaching a maximum of 43 MPa. The longitudinal stress follows a more complex evolution, as shown in Figure 15. The same increase is observed at the two extremities of the leg, but it is not there that the maximum value is reached. The two dotted lines represent, as before, the position on the welding line, and peaks can be observed. Mainly with a compressive value for the stress at 3 m along the side path line.
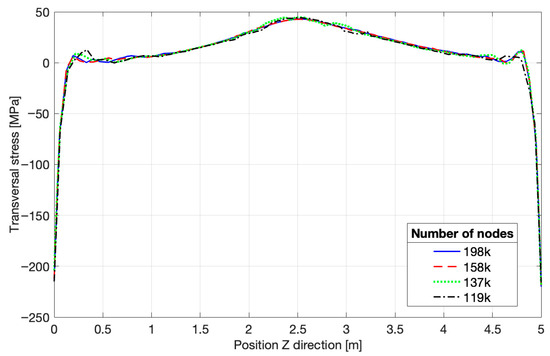
Figure 14.
Transverse stress, top path.
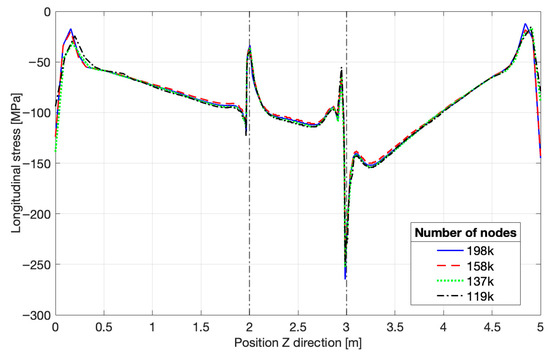
Figure 15.
Longitudinal stress, side path.
This tendency of the zone at the welding line to be tensile shows that the vertical brace is straightening its angle during the welding process, as if the two sides want to balance each other.
3.4. Boundary Conditions
During the previous part of the study, the mechanical boundary conditions remained the same, which were clamped on the three extremities of the cylinder. It aimed to focus more on the distortion of the structure in its central part, closer to the welding line.
However, these types of boundary conditions did not replicate at all real-life welding conditions. It is needed to compare the results obtained with different boundary conditions. In this part, the focus is put on the free displacement condition: one extremity is fixed in all directions, the other in two (X and Y), and the last one in only one direction (X), as explained in Figure 16.
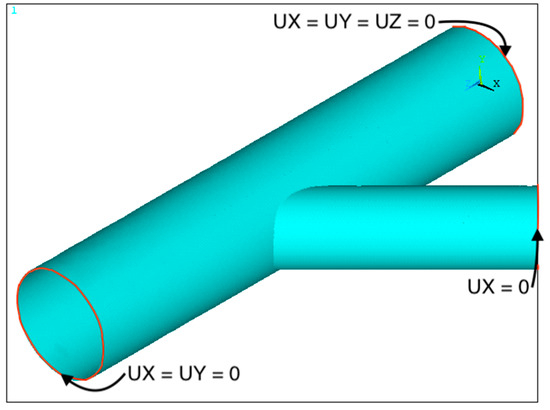
Figure 16.
Free displacement boundary conditions.
The following three graphs compare the results for the clamped conditions, in blue line, and the results for the free displacement conditions, in red dashed line. In the X and Y directions, the evolution of the distortion follows the same pattern as before. However, the maximum values attained are way smaller. In Figure 17, the peak distortion shifts from one side of the vertical brace to the other. In Figure 18, the peak is located closer to the position Z = 0, with a displacement of approximately 0.3 m.
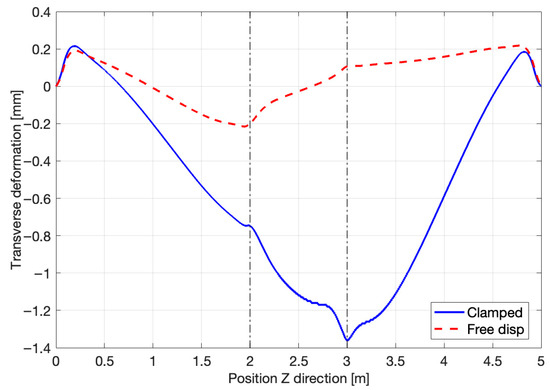
Figure 17.
Transverse deformation by boundary conditions.
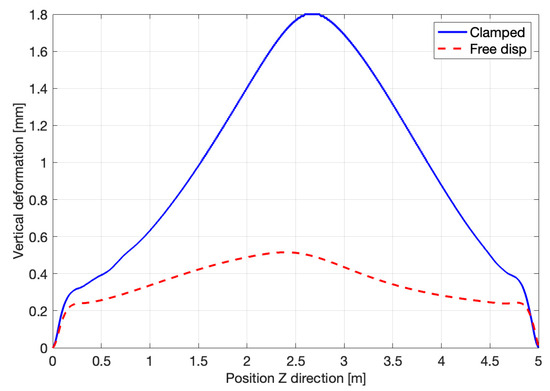
Figure 18.
Vertical deformation by boundary conditions.
The deformation is mainly visible in the longitudinal direction, as it is the one with no constraints outside of the origin extremity. It means that the structure is free to elongate in the Z direction, which it does progressively, as one can observe in Figure 19. The distortion can be characterized by a linear evolution with a coefficient of 0.404 mm/m.
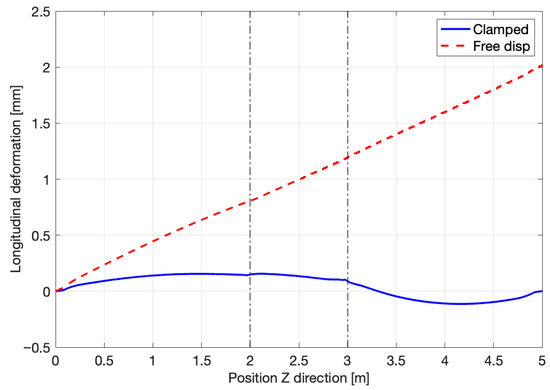
Figure 19.
Longitudinal deformation by boundary conditions.
This progressive deformation of the leg in the longitudinal direction is visible in Figure 20. It is interesting to note that the extremity of the vertical brace follows an opposite displacement. As the leg elongates, the angle it makes with the brace tends to decrease, forcing a negative displacement along the Z axis of its extremity.
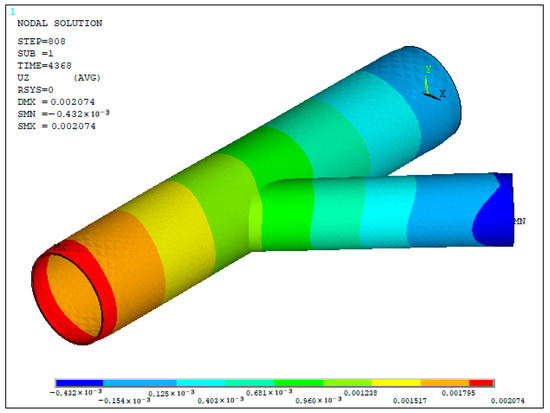
Figure 20.
Longitudinal distortion under free displacement condition, measured in meters.
It is possible to quantify objectively the difference observed between these two boundary conditions. Table 9 gives the relative value between the maximum reached in each direction for the clamped and free displacement scenarios.

Table 9.
Relative difference in deformation.
At first read, the distortion in the Z direction appears much higher than for the previous clamped conditions. It creates a greater total deformation, summed in all three directions. However, this overall displacement is expressed only along the longitudinal axis Z. It follows that advantages for the construction and assembly process. The longitudinal elongation is easier to predict and to control during the construction of the structure: the initial leg length can be made shorter to compensate for the extension induced by the welding. Furthermore, the vertical and lateral deformations are almost nonexistent, requiring less control and precision for these two dimensions.
Considering that the structure is less constrained with the free displacement conditions, it also leads to smaller values of the stresses in all three directions, as presented in Figure 21 and Figure 22. This will help obtain a more resistant structure after the welding process is concluded.
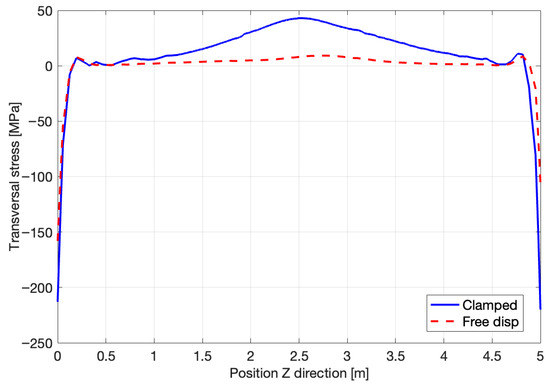
Figure 21.
Transverse stress by boundary conditions.
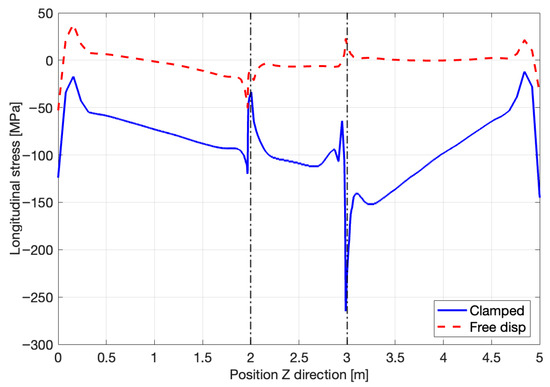
Figure 22.
Longitudinal stress by boundary conditions.
The transverse and longitudinal stresses remain the same independently of the boundary conditions. Nevertheless, the maximum values of the tensile and compressive stress are significantly minimized. Table 10 gives the relative difference between the maximum reached in each direction for the clamped and free displacement scenarios. For each category, the stress is indeed reduced with the second set of boundary conditions. The greatest gap is observed in the longitudinal direction, as expected, because it is the least constrained.

Table 10.
Relative difference in stress.
To conclude this paper, it is interesting to present a visual representation of the resulting deformation of the structure. Figure 23a highlights the distortion in the vertical direction on both the top and bottom surfaces of the leg. In contrast, Figure 23b proves that the distortion of the main cylinder is nearly negligible, with only the extremity of the brace exhibiting slight distortion.
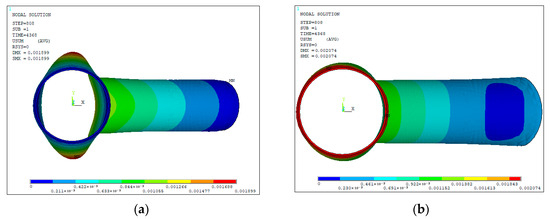
Figure 23.
Total displacement for (a) Clamped and (b) Free displacement conditions, in meters.
The longitudinal distortion observed under free displacement conditions reflects the typical elongation behavior of offshore tubular joints during in situ welding. In offshore construction, such deformation can lead to misalignment during platform assembly, affecting load transfer and fatigue performance. The clamped condition, while idealized, simulates scenarios where temporary fixtures are used to control deformation during offshore welding operations. Introducing a release period for the clamped boundary conditions at the end of the simulation would better reflect onshore welding practices and allow for a clearer comparison with the free boundary condition scenario. The residual stress distribution, particularly in the heat-affected zone, has implications for crack initiation and corrosion susceptibility in marine environments. These results underscore the importance of accurate welding simulation in offshore structural design and quality assurance.
4. Conclusions
In this paper, a finite element model is developed to investigate the distortion and residual stress induced by the welding of the leg and brace of an offshore platform structure. The model is first applied to a T-joint weld well studied in the literature [18], and the results in both temperature distribution and distortion are compared with experimental values. The relative error obtained is low enough to validate the model. Then, the influence of the element and mesh sizes and of the boundary conditions is studied to simulate the transverse and longitudinal residual stress and the distortion in all three directions. The following key conclusions can be drawn:
- The findings derived from the simulation of a tubular joint provide new insights into welding behavior in offshore platforms. The simulation of a Y-shaped tubular joint reveals stress and distortion patterns that differ from those found in simpler configurations. These findings help bridge the gap between academic modeling and industrial practice in offshore platform construction.
- Based on the deformation and thermal distribution results, a good balance between result quality and computational efficiency is achieved. All tested meshes yielded similar deformation values, with a root mean square error below 0.03 mm. The final mesh adopted for the analysis consisted of approximately 198,000 nodes.
- The results in both distortion and residual stress indicate that the free displacement conditions yield better performance. Overall distortion increases by 8%, while the vertical and transverse components decrease by an average of 76%.
- Defining appropriate boundary conditions remains one of the most challenging aspects of welding simulations. The findings highlight the influence of boundary conditions on deformation behavior and stress concentration, which are critical factors in offshore structural integrity.
- There are several promising directions for future work. The main objective will be to propose ways to improve the welding of these tubular members, aiming to reduce the final deformation and residual stress. Introducing multi-pass welding would be a valuable extension of this research. Proposing an optimization of these variables can have a significant impact on the industrial construction of offshore structures. Incorporating effects from environmental factors such as saltwater exposure and cyclic loading would also be an interesting direction for future work.
- Based on the findings of this study, the implementation of automatic mesh refinement techniques is recommended. Finally, conducting experiments to replicate the welding process would allow for validation of the simulation results. This could potentially be done on a scaled model. It would also provide an opportunity to measure the welding bead geometry, enabling more accurate calibration of the heat source parameters.
Author Contributions
Methodology, J.M.; validation, J.M.; writing—original draft preparation, J.M.; writing—review and editing, J.M., X.-H.S. and B.-Q.C.; supervision, B.-Q.C. All authors have read and agreed to the published version of the manuscript.
Funding
This study contributes to the Strategic Research Plan of the Centre for Marine Technology and Ocean Engineering, which is financed by the Portuguese Foundation for Science and Technology (FCT), under contract UIDB/UIDP/00134/2020.
Data Availability Statement
The original contributions presented in this study are included in the article. Further inquiries can be directed to the corresponding author.
Conflicts of Interest
The authors declare no conflicts of interest.
References
- Wang, M.; Qiao, D.; Zhou, X.; Tang, G.; Lu, L.; Ou, J. Dynamic responses analysis of submerged floating tunnel under impact load. Brodogradnja 2024, 75, 75208. [Google Scholar] [CrossRef]
- Wang, B.; Jiao, Y.; Qiao, D.; Gao, S.; Li, T.; Ou, J. Modified p-y curves for monopile foundation with different length-to-diameter ratio. Brodogradnja 2023, 74, 74208. [Google Scholar] [CrossRef]
- Chen, B.Q.; Liu, K.; Yu, T.; Li, R. Enhancing reliability in floating offshore wind turbines through digital twin technology: A comprehensive review. Energies 2024, 17, 1964. [Google Scholar] [CrossRef]
- Zhang, J.; Wang, S.; Shadman, M.; Amiri, M.M.; Chen, B.Q.; An, C.; Estefen, S.F. Environmental contour methods for long-term extreme response prediction of offshore wind turbines. J. Marine Sci. Appl. 2025. [Google Scholar] [CrossRef]
- Thibaux, P.; Thiele, M.; Van Wittenberghe, J.; Baessler, M. Comparison of resonance and hydraulic testing on large scale fatigue tests of welded tubular joints for offshore wind turbine foundations. Int. J. Fatigue 2025, 193, 108797. [Google Scholar] [CrossRef]
- Sun, H.; Dong, J.; Liu, H.; Shi, W.; Feng, Q.; Yao, K.; Huang, S.; Peng, L.; Cai, Z. Review of Non-Destructive Testing for Wind Turbine Bolts. Sensors 2025, 25, 5726. [Google Scholar] [CrossRef]
- Chen, B.Q.; Guedes Soares, C. Numerical investigation on weld-induced imperfections in aluminum ship plates. J. Offshore Mech. Arct. Eng. 2019, 141, 061605. [Google Scholar] [CrossRef]
- Malik, A.M.; Qureshi, E.M.; Ullah Dar, N.; Khan, I. Analysis of circumferentially arc welded thin-walled cylinders to investigate the residual stress fields. Thin Walled Struct. 2008, 46, 1391–1401. [Google Scholar] [CrossRef]
- Gery, D.; Long, H.; Maropoulos, P. Effects of welding speed, energy input and heat source distribution on temperature variations in butt joint welding. J. Mat. Process Technol. 2005, 167, 393–401. [Google Scholar] [CrossRef]
- Chen, Z.; Chen, Z.; Shenoi, R.A. Influence of welding sequence on welding deformation and residual stress of a stiffened plate structure. Ocean Eng. 2015, 106, 271–280. [Google Scholar] [CrossRef]
- Lindgren, L.-E.; Häggblad, H.-A.; McDill, J.M.J.; Oddy, A.S. Automatic remeshing for three-dimensional finite element simulation of welding. Comput. Methods Appl. Mech. Eng. 1997, 147, 401–409. [Google Scholar] [CrossRef]
- Runnemalm, H.; Hyun, S. Three-dimensional welding analysis using an adaptive mesh scheme. Comput. Methods Appl. Mech. Eng. 1999, 189, 515–523. [Google Scholar] [CrossRef]
- Teng, T.-L.; Fung, C.-P.; Chang, P.-H.; Yang, W.-C. Analysis of residual stresses and distortions in T-joint fillet welds. Int. J. Press. Vessels Pip. 2001, 78, 523–538. [Google Scholar] [CrossRef]
- Gannon, L.; Liu, Y.; Pegg, N.; Smith, M. Effect of welding sequence on residual stress and distortion in flat-bar stiffened plates. Mar. Struct. 2010, 23, 385–404. [Google Scholar] [CrossRef]
- Chen, B.Q.; Hashemzadeh, M.; Guedes Soares, C. Numerical and experimental studies on temperature and distortion patterns in butt-welded plates. Int. J. Adv. Manuf. Technol. 2014, 72, 1121–1131. [Google Scholar] [CrossRef]
- Sepe, R.; Gianella, V.; Greco, A.; De Luca, A. FEM simulation and experimental tests on the SMAW welding of a dissimilar T-joint. Metals 2021, 11, 1016. [Google Scholar] [CrossRef]
- Li, Y.; Li, Y.; Zhang, C.; Lei, M.; Luo, J.; Guo, X.; Deng, D. Effect of structural restraint caused by the stiffener on welding residual stress and deformation in thick-plate T-joints. J. Mater. Res. Technol. 2022, 21, 3397–3411. [Google Scholar] [CrossRef]
- Fu, G.; Lourenco, M.I.; Duan, M.; Estefen, S.F. Effect of boundary conditions on residual stress and distortion in T-joint welds. J. Constr. Steel Res. 2014, 102, 121–135. [Google Scholar] [CrossRef]
- Corigliano, P.; Crupi, V. Review of fatigue assessment approaches for welded marine joints and structures. Metals 2022, 12, 1010. [Google Scholar] [CrossRef]
- Besten, H.D. Fatigue damage criteria classification, modelling developments and trends for welded joints in marine structures. Ships Offshore Struct. 2018, 13, 787–808. [Google Scholar] [CrossRef]
- Radaj, D. Heat Effects of Welding, 1st ed.; Springer: Berlin/Heidelberg, Germany, 1992; pp. 19–21. [Google Scholar] [CrossRef]
- Chen, B.Q.; Liu, K.; Xu, S. Recent advances in aluminum welding for marine structures. J. Mar. Sci. Eng. 2024, 12, 1539. [Google Scholar] [CrossRef]
- Rosenthal, D. The theory of moving sources of heat and its application to metal treatments. Trans. ASME 1946, 68, 849–865. [Google Scholar] [CrossRef]
- Pavelic, V.; Tanbakuchi, R.; Uyehara, O.A.; Myers, P.S. Experimental and computed temperature histories in gas tungsten arc welding of thin plates. Weld. Res. Suppl. 1969, 48, 296–305. [Google Scholar]
- Eagar, T.W.; Tsai, N.-S. Temperature fields produced by travelling distributed heat sources. In Proceedings of the 64th Annual AWS Convention, Philadelphia, PA, USA, 24–29 April 1983; Available online: https://eagar.mit.edu/publications/Eagar036.pdf (accessed on 8 October 2025).
- Goldak, J.; Chakravarti, A.; Bibby, M. A new finite element model for welding heat sources. Metall. Trans. B 1984, 15, 299–305. [Google Scholar] [CrossRef]
- Wahab, M.A.; Painter, M.J.; Davies, M.H. The prediction of the temperature distribution and weld pool geometry in the gas metal arc welding process. J. Mater. Process. Technol. 1998, 77, 233–239. [Google Scholar] [CrossRef]
- Nguyen, N.T.; Ohat, A.; Matsuoka, K.; Suzuki, N.; Maeda, Y. Analytical solutions for transient temperature of semi-infinite body subjected to 3-D moving heat sources. Weld. Res. Suppl. 1999, 78, 265–274. [Google Scholar]
- Fachinotti, V.D.; Anca, A.A.; Cardona, A. Analytical solutions of the thermal field induced by moving double-ellipsoidal and double-elliptical heat sources in a semi-infinite body. Int. J. Numer. Methods. Biomed. Eng. 2011, 27, 595–607. [Google Scholar] [CrossRef]
- Fu, G.; Gu, J.; Lourenco, M.I.; Duan, M.; Estefen, S.F. Parameter determination of double-ellipsoidal heat source model and its application in the multi-pass welding process. Ships Offshore Struct. 2015, 10, 204–217. [Google Scholar] [CrossRef]
- Camilleri, D.; McPherson, N.; Gray, T.G.F. The applicability of using low transformation temperature welding wire to minimize unwanted residual stresses and distortions. Int. J. Press. Vessels Pip. 2013, 110, 2–8. [Google Scholar] [CrossRef]
- Bechetti, D.H.; Semple, J.K.; Zhang, W.; Fisher, C.R. Temperature-Dependent Material Property Databases for Marine Steels–Part 1: DH36. Integr. Mater. Manuf. Innov. 2020, 9, 257–286. [Google Scholar] [CrossRef]
- Tran, T.-T.; Kim, E.; Lee, D. Development of a 3-legged jacket substructure for installation in the southwest offshore wind farm in South Korea. Ocean Eng. 2022, 246, 110643. [Google Scholar] [CrossRef]
- Chen, B.Q.; Guedes Soares, C. Experimental and numerical investigation on welding simulation of long stiffened steel plate specimen. Mar. Struct. 2021, 75, 102824. [Google Scholar] [CrossRef]
- Clough, R.W. The finite element method in plane stress analysis. In Proceedings of the 2nd American Society of Civil Engineers Conference on Electronic Computation, Pittsburgh, PA, USA, 8–9 September 1960; Available online: https://ci.nii.ac.jp/naid/10027962709 (accessed on 8 October 2025).
- Clough, R.W. Original formulation of the finite element method. Finite Elem. Anal. Des. 1990, 7, 89–101. [Google Scholar] [CrossRef]
- Turner, M.J.; Clough, R.W.; Martin, H.C.; Topp, L.J. Stiffness and deflection analysis of complex structures. J. Aeronaut. Sci. 1956, 23, 805–823. [Google Scholar] [CrossRef]
- Kussmaul, K.; Roos, E.; Guth, W.; Szimmat, J. A contribution to the numerical and experimental determination of residual stresses in welds. Nucl. Eng. Des. 1989, 112, 337–348. [Google Scholar] [CrossRef]
- Michalieris, P.; DeBiccari, A. Prediction of welding distortion. Weld. J. 1997, 76, 172s–181s. Available online: https://www.osti.gov/biblio/477340 (accessed on 8 October 2025).
- Näsström, M.; Wikander, L.; Karlsson, L.; Lindgren, L.E.; Goldak, J. Combined solid and shell element modelling of welding. In Mechanical Effect of Welding, 1st ed.; Karlsson, L., Lindgren, L., Jonsson, L.E., Eds.; Springer: Berlin/Heidelberg, Germany, 1992; pp. 197–205. [Google Scholar] [CrossRef]
- Dupont, J.N.; Marder, A.R. Thermal Efficiency of Arc Welding Processes. Weld. Res. Suppl. 1995, 74, 406–416. [Google Scholar]
- Pépe, N.; Egerland, S.; Colegrove, P.A.; Yapp, D.; Leonhartsberger, A.; Scotti, A. Measuring the process efficiency of controlled gas metal arc welding processes. Sci. Technol. Weld. Join. 2011, 16, 412–417. [Google Scholar] [CrossRef]
- Rybicki, E.F.; Stonesifer, R.B. Computation of Residual Stresses due to Multipass Welds in Piping Systems. J. Press. Vessel Technol. 1979, 101, 149–154. [Google Scholar] [CrossRef]
- Lindgren, L.-E.; Runnemalm, H.; Näsström, M.O. Simulation of multipass welding of a thick plate. Int. J. Numer. Methods Eng. 1999, 44, 1301–1316. [Google Scholar] [CrossRef]
Disclaimer/Publisher’s Note: The statements, opinions and data contained in all publications are solely those of the individual author(s) and contributor(s) and not of MDPI and/or the editor(s). MDPI and/or the editor(s) disclaim responsibility for any injury to people or property resulting from any ideas, methods, instructions or products referred to in the content. |
© 2025 by the authors. Licensee MDPI, Basel, Switzerland. This article is an open access article distributed under the terms and conditions of the Creative Commons Attribution (CC BY) license (https://creativecommons.org/licenses/by/4.0/).