Article

Research on Aerodynamic Load Simulation Techniques for Floating Vertical-Axis Wind Turbines in Basin Model Test

1
China Ship Scientific Research Center, Wuxi 214064, China
2
Taihu Laboratory of Deepsea Technology Science, Wuxi 214064, China
3
State Key Laboratory of Ocean Engineering, Shanghai Jiao Tong University, Shanghai 200240, China
*
Author to whom correspondence should be addressed.
J. Mar. Sci. Eng. 2025, 13(10), 1924; https://doi.org/10.3390/jmse13101924
Submission received: 9 September 2025 / Revised: 1 October 2025 / Accepted: 2 October 2025 / Published: 8 October 2025
(This article belongs to the Section Ocean Engineering)

Abstract

Floating vertical−axis wind turbines present unique advantages for deep−water offshore deployments, but their basin model testing encounters significant challenges in aerodynamic load simulation due to Reynolds scaling effects. While Froude−scaled experiments accurately replicate hydrodynamic behaviors, the drastic reduction in Reynolds numbers at the model scale leads to substantial discrepancies in aerodynamic forces compared to full−scale conditions. This study proposed two methodologies to address these challenges. Fully physical model tests adopt a “physical wind field + rotor model + floating foundation” approach, realistically simulating aerodynamic loads during rotor rotation. Semi−physical model tests employ a “numerical wind field + rotor model + physical floating foundation” configuration, where theoretical aerodynamic loads are obtained through numerical calculations and then reproduced using controllable actuator structures. For fully physical model tests, a blade reconstruction framework integrated airfoil optimization, chord length adjustments, and twist angle modifications through Taylor expansion−based sensitivity analysis. The method achieved thrust coefficient similarity across the operational tip−speed ratio range. For semi−physical tests, a cruciform−arranged rotor system with eight dynamically controlled rotors and constrained thrust allocation algorithms enabled the simultaneous reproduction of periodic streamwise/crosswind thrusts and vertical−axis torque. Numerical case studies demonstrated that the system effectively simulates six−degree−of−freedom aerodynamic loads under turbulent conditions while maintaining thrust variation rates below 9.3% between adjacent time steps. These solutions addressed VAWTs’ distinct aerodynamic complexities, including azimuth−dependent Reynolds number fluctuations and multidirectional force coupling, which conventional methods fail to accommodate. The developed techniques enhanced the fidelity of floating VAWT basin tests, providing critical experimental validation tools for emerging offshore wind technologies.

1. Introduction

China’s high−quality offshore wind resources are predominantly located in waters with depths exceeding 50 m. At such depths, the costs associated with fixed−bottom wind turbines become prohibitively high, leading to the emergence of large−scale floating offshore wind power technology, commonly referred to as floating wind turbines [1,2]. Floating wind turbines are primarily categorized into horizontal−axis and vertical−axis configurations based on the orientation of their rotor shafts. As wind turbine systems evolve toward higher power capacities and deployment in deeper waters, the advantages of vertical−axis floating wind turbines have become increasingly apparent. These advantages include omnidirectional wind capture capability, simpler structural design, easier installation and maintenance due to the placement of the generator and gearbox at the base of the tower, longer operational lifespan, better scalability for large−scale applications, environmental and ecological benefits, broad adaptability, reduced wake effects during operation, and the ability to enable high−density wind farm layouts with the efficient use of maritime space [3]. These characteristics position vertical−axis floating wind turbines as a promising solution for large−scale, cost−effective commercialization, making them a focal point of research in both academic and industrial circles in recent years.
Floating wind turbine scaled−model basin testing is widely recognized as one of the most accurate, reliable, and economically feasible methods for studying floating wind turbine dynamics, validating novel floating platform concepts and calibrating numerical simulation tools. Since basin tests primarily focus on the hydrodynamic behavior of the floating platform and mooring system, floating wind turbine model tests are typically designed based on Froude scaling. Basin model testing can be classified into fully physical model tests and semi−physical model tests. Fully physical model tests adopt a “physical wind field + physical rotor model + physical floating foundation” approach, realistically simulating aerodynamic loads during rotor rotation. Semi−physical model tests employ a “numerical wind field + numerical rotor model + physical floating foundation” configuration, where theoretical aerodynamic loads are obtained through numerical calculations and then are equivalently reproduced using controllable actuator structures [4].
However, under Froude similarity laws, the Reynolds number decreases by several orders of magnitude, resulting in a significant reduction in rotor aerodynamic loads compared to theoretical values—a phenomenon known as the Reynolds scaling effect. Given that rotor aerodynamic loads serve as critical excitation forces affecting floating wind turbine motion, an inaccurate representation of these loads inevitably leads to erroneous assessments of motion performance. To address thrust mismatch caused by scale effects in floating horizontal−axis wind turbine model tests, researchers have successively proposed various methods including the increased wind speed approach [5], thrust compensation mechanisms [6], aerodynamically similar rotor design [7], and equivalent aerodynamic load simulation via controllable actuator structures. In addition, passive flow control devices such as winglets and trailing−edge flaps have gained significant attention for enhancing wind turbine efficiency without complex active mechanisms. For instance, winglets have been shown to reduce tip vortices, thereby improving the lift−to−drag ratio. Abdelghany et al. [8] demonstrated that an optimally sized winglet can increase thrust force. Similarly, Farghaly and Abdelghany [9] reported that trailing−edge flaps, when deflected optimally at different wind speeds, can significantly enhance lift and stall behavior. These studies highlight the potential of passive devices in mitigating aerodynamic losses and optimizing performance across various operational conditions. Among the methods mentioned above, redesigning model−scale blades to match aerodynamic loads under low Reynolds number conditions in fully physical model tests, as well as employing aerodynamic load equivalent devices to simulate wind turbine aerodynamic forces in semi−physical model tests, are recognized as the most reliable alternative methods [10].
The majority of fully physical [11,12,13,14] and semi−physical [10,15,16,17,18,19,20] model test methods for aerodynamic load equivalence have been developed for horizontal−axis wind turbines, with very limited research conducted on aerodynamic load simulation for vertical−axis floating wind turbines in basin model tests. In existing vertical−axis floating wind turbine basin tests, researchers have almost exclusively relied on geometrically scaled blades [21,22,23,24,25], as shown in Figure 1. This would lead to significantly underestimated thrust on the turbine blades during testing and substantially affects the results. Previous studies have proposed blade reconstruction methods, but these were limited to modifying airfoil profiles and chord lengths, only ensuring thrust and lateral force matching at a few tip speed ratios (TSRs) [26,27,28]. Another study introduced a thrust−similarity blade design method, but it primarily ensured thrust similarity without guaranteeing lateral force similarity [29]. Blade reconstruction for vertical−axis floating wind turbines presents greater challenges compared to their horizontal−axis counterparts due to several key factors.
For horizontal−axis floating wind turbines, spanwise adjustments to chord length and twist angle can achieve aerodynamic load similarity at low Reynolds numbers in fully physical basin tests. However, vertical−axis wind turbine (VAWT) blades cannot vary in chord length or twist angle along the span, making this approach far more difficult to implement. Additionally, while horizontal−axis wind turbines exhibit significant variation in local Reynolds numbers along the blade span—with aerodynamic load analysis typically using a fixed Reynolds number at 70% blade radius—vertical−axis configurations experience Reynolds number fluctuations with the azimuthal angle, making aerodynamic load simulation considerably more challenging. Furthermore, horizontal−axis wind turbines experience nearly constant aerodynamic loads per rotor revolution, requiring only mean load simulation, whereas VAWTs undergo dramatic load fluctuations due to continuously changing blade angles of attack, resulting in significant forces and moments in streamwise, crosswise, and rotational directions. This complexity makes aerodynamic load equivalence for vertical−axis floating wind turbines particularly challenging and underscores the importance of research on experimental simulation techniques for these systems.
This paper proposed a thrust−matched blade reconstruction method for fully physical model tests and a cruciform−arranged rotor system to simulate the aerodynamic forces for semi−physical model tests. In the fully physical model tests, this study replaced the airfoil profiles of the model blades and employed the Taylor expansion method to simultaneously reconstruct both chord length and twist angle, optimizing the model−scale blades for best performance. The optimized blades could match the thrust coefficient of the full−scale VAWT rotor across a wide range of TSRs while accurately simulating the two−degree−of−freedom aerodynamic loads on the turbine. In the semi−physical model tests, this study arranged eight rotors in a cruciform pattern to accurately reproduce the periodic aerodynamic thrust in both streamwise and crosswind directions, as well as the aerodynamic torque around the vertical axis. A height adjustment device was used to control the elevation of the cruciform frame, enabling accurate reproduction of the aerodynamic bending moment at the tower base while maintaining thrust reproduction. This research ensured the accuracy of VAWT testing, supported technological innovation in VAWTs, and promoted the development of new marine engineering equipment technologies. Although demonstrated through a specific 10 MW case study, the developed methodology presents a generalized approach that can be extended to VAWTs of various sizes and configurations, enhancing its potential impact across offshore wind energy applications.

2. Theoretical Basis

2.1. Similarity Criteria for Model Testing

2.1.1. Description of Similarity Criteria

In model testing where hydrodynamic effects dominate, adherence to the Froude similarity criterion is essential. The Froude number (Fr) ensures the proper scaling of gravitational, inertial, and wave−induced forces governing the dynamic response of the floating structure. It is defined as
V m g L m = V s g L s
where V and L denote characteristic velocity and length, respectively, g is gravitational acceleration, and subscripts m and s refer to model and full−scale values.
Conversely, in aerodynamically dominated tests, Reynolds similarity must be satisfied to accurately replicate viscous and inertial force interactions. The Reynolds number (Re) is given by
L m V m v = L s V s v
where v represents the kinematic viscosity of the fluid.
For basin testing of floating wind turbine systems, simultaneous fulfillment of both Froude and Reynolds similarity criteria is unattainable. Since the primary objective is to validate the dynamic response of the floating foundation and mooring system under properly scaled environmental conditions, Froude scaling must take precedence in basin experiments.
Additionally, if tests are conducted in a freshwater basin, a density correction factor ( γ = 1.025 ) must be applied to compensate for the difference between freshwater and seawater densities.
To ensure accurate simulation of wind−induced loads, the wind turbine model must satisfy the following:
  • Thrust similarity criterion
To ensure the correct input of wind−induced environmental loads, i.e., to guarantee the accuracy of aerodynamic load simulation, the wind turbine model design should satisfy the thrust similarity criterion. The aerodynamic thrust similarity for the rotor model follows the Froude scaling criterion, as given by
T m = T s γ λ 3
where λ is the geometric scaling ratio, γ is the density correction factor, and T represents the aerodynamic thrust on the rotor model, which is closely related to factors such as airfoil profile, spanwise length, chord length, twist angle, and pitch angle.
  • TSR similarity criterion
The TSR ensures proper scaling of rotor dynamics under varying wind conditions and is given by
Ω m R m V w m = Ω s R s V w s
where Ω is the rotor angular velocity, R is the rotor radius, and V w is the incoming wind speed. This ensures that the dynamic characteristics of the wind turbine, including its rotational behavior under varying wind conditions, are accurately represented in the scaled model.

2.1.2. The Phenomenon of Scale Effects

For a Froude−scale rotor (FSR), the ratio of the model−scale Reynolds number to the prototype−scale Reynolds number is determined by the scaling factor.
Re m Re p = ρ V m L m μ ρ V p L p μ = 1 λ 3 2 ,
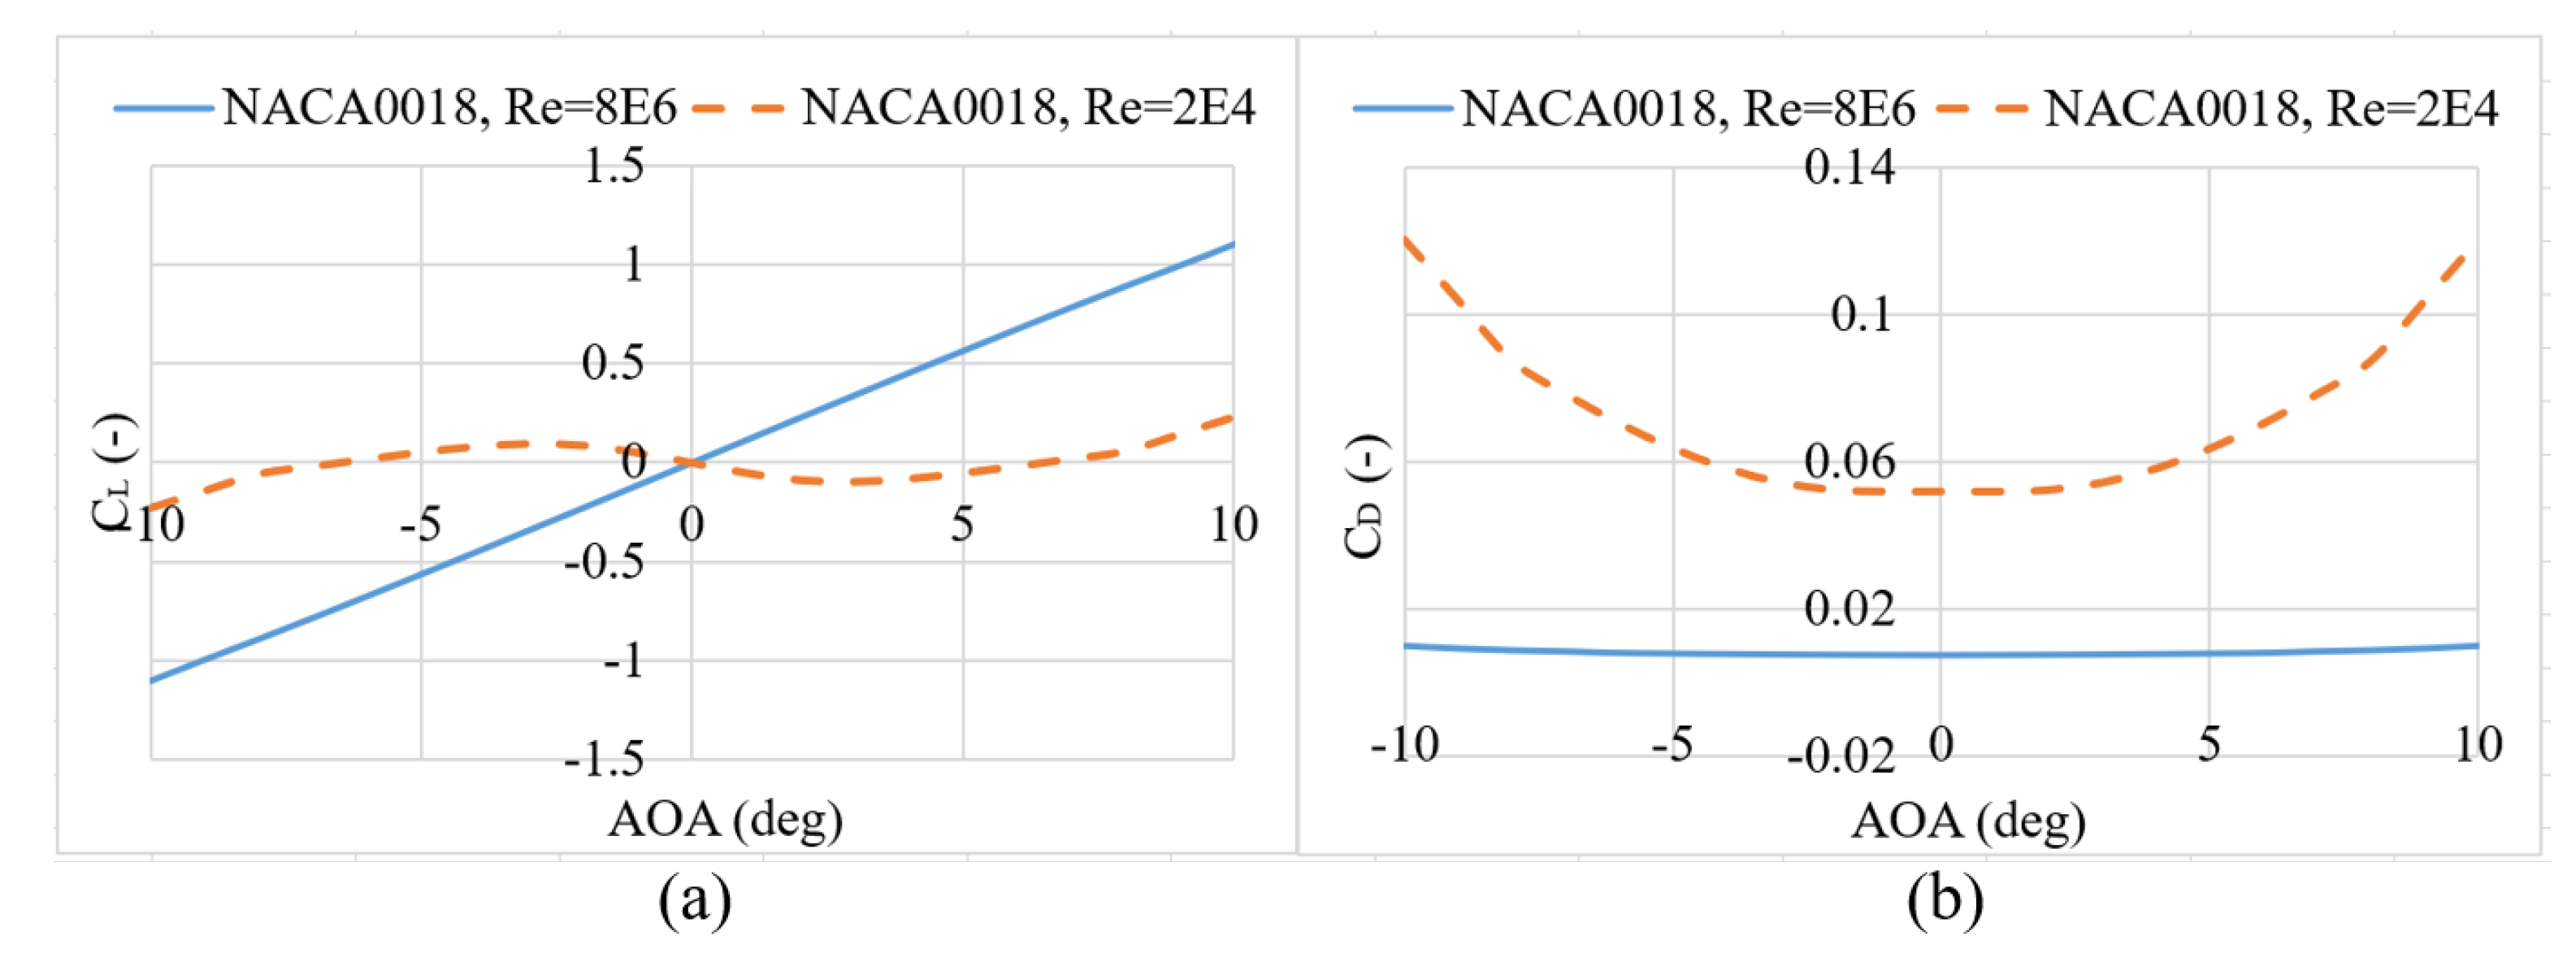
Assuming a scale ratio ( λ = 60 ), the Reynolds number decreases substantially from 8 × 10 6 for the full−scale prototype to 2 × 10 4 at model scale. This substantial reduction in the Reynolds number significantly influences airfoil characteristics, as illustrated in Figure 2. At such low Reynolds numbers, the NACA0018 blade profile exhibits a marked reduction in aerodynamic lift coefficients C L alongside a considerable increase in drag coefficients C D . Both effects, diminished C L and elevated C D , adversely affect rotor performance.
A comparison of thrust coefficients between the full−scale rotor (operating at the prototype Reynolds number of 8 × 10 6 ) and the Froude−scale rotor (operating at the model Reynolds number of 2 × 10 4 ) is presented in Figure 3. The results demonstrate that, across a range of TSRs, the aerodynamic thrust coefficients of the FSR are significantly lower than those of the full−scale rotor. Consequently, the aerodynamic thrust generated during basin model tests is substantially reduced, leading to a deviation from actual operational conditions. This discrepancy is known as the scale effect [30].

2.2. Aerodynamic Modeling of VAWTs

As shown in reference [31], the thrust coefficient ( C T ) and lateral force coefficient ( C S ) of the VAWT rotor can be calculated using the following equations:
C T = 0 2 π Q n ( θ ) sin ( θ ) + Q t ( θ ) cos ( θ ) d θ
C S = 0 2 π Q t ( θ ) sin ( θ ) Q n ( θ ) cos ( θ ) d θ
where θ is the azimuthal angle of rotor rotation and Q n ( θ ) and Q t ( θ ) are the dimensionless normal force and tangential force acting on the actuator cylinder, respectively:
Q n ( θ ) = B F n B 2 π R V 2 = B ( F n cos ( β ) F t sin ( β ) ) 2 π R V 2
Q t ( θ ) = B F t B 2 π R V 2 = B ( F n sin ( β ) + F t cos ( β ) ) 2 π R V 2
where B is the number of blades, R is the rotor radius, another variable is the incoming wind speed, β is the blade twist angle, F n B and F t B are the normal and tangential forces acting on the cylindrical surface of the rotor, and F n and F t are the forces perpendicular and parallel to the chord length acting on the local blade element.
The forces F n and F t can be expressed as
F n = L cos ( θ ) + D sin ( θ )
F t = L sin ( θ ) D cos ( θ )
where L and D are the lift and drag forces per unit blade length:
L = 1 2 ρ V 2 · c · C L ( R e , α )
D = 1 2 ρ V 2 · c · C D ( R e , α )
where ρ is the air density, c is the chord length, C L and C D are the lift and drag coefficients, α is the angle of attack, and R e is the Reynolds number.

3. Blade Reconstruction Methodology in Fully Physical Model Tests

3.1. Alternative Solutions

Based on Equation (6), several approaches can be identified to enhance the aerodynamic force of model−scale blades:
  • Increasing air density ( ρ ) by substituting air with a higher−density medium: However, this method is impractical for wind tunnel or wave basin testing due to operational constraints.
  • Elevating wind speed ( V ) beyond the Froude−scaled value: Although this could augment lift, it would compromise the TSR similarity criterion. Additionally, the resulting increase in wind loading on both the tower and platform would introduce significant distortions in the floating wind turbine system’s dynamic response, leading to substantial measurement inaccuracies.
  • Increasing the Reynolds number (Re) through high−pressure wind tunnel testing: This approach presents practical limitations, as most experimental facilities are conventional wind tunnels or wave basins where achieving sufficiently high Reynolds numbers remains technically challenging.
  • Enhancing the lift coefficient ( C L ) by employing airfoils optimized for low–Reynolds–number conditions: While feasible, this method fundamentally modifies the angle–of–attack dependence of both lift and drag coefficients, altering the aerodynamic behavior.
  • Increasing chord length ( c ), which scales linearly with aerodynamic loads: However, the associated increase in blade mass would elevate the rotor’s center of gravity, thereby violating Froude scaling requirements for the floating system.
  • Adjusting the blade twist angle ( β ) to modify the effective angle of attack ( α ), thereby operating at higher lift coefficients: Although this can partially improve rotor thrust, relying solely on twist angle adjustments proves inadequate for achieving target load values.
In summary, none of the aforementioned methods can significantly increase blade lift without violating critical scaling criteria. However, a synergistic strategy combining multiple approaches may effectively achieve the desired aerodynamic loads while adhering to essential similarity laws. Such an integrated solution must carefully balance aerodynamic enhancement with structural and hydrodynamic scaling constraints to ensure the validity of the model test results.

3.2. Blade Reconstruction Methodology

The blade reconstruction process comprises six systematic steps to ensure accurate scaling from prototype to model dimensions while maintaining aerodynamic performance characteristics.
  • Step 1: Scaling ratio determination
    Geometric similarity forms the fundamental basis for model testing, requiring strict adherence to consistent scaling relationships. The scaling ratio ( λ ) is mathematically expressed as
    λ = L m L p
    where L m and L p represent corresponding linear dimensions of the model and prototype, respectively, encompassing length parameters, draft measurements, centers of gravity and buoyancy, water depth, and wave height characteristics. The optimal selection of λ necessitates a comprehensive evaluation of multiple constraints including physical model dimensions, laboratory facility limitations, and specific experimental objectives.
  • Step 2: Initial blade parameter calculation
    Applying Froude scaling principles, the initial model blade parameters are derived from prototype values through the following relationships:
    c 0 = c 0 p × λ
    β 0 = β 0 p
    where c 0 p and β 0 p denote the prototype blade chord length and twist angle, respectively. These equations establish the baseline geometric configuration for subsequent aerodynamic optimization.
  • Step 3: Airfoil profile optimization
    Following geometric parameter determination, the methodology addresses the critical challenge of maintaining aerodynamic performance at reduced Reynolds numbers through specialized airfoil selection. The significant Reynolds number reduction in scaled testing renders conventional airfoils inadequate for lift generation, necessitating profiles specifically optimized for low−Re conditions. These airfoils must simultaneously achieve high lift coefficients and controlled structural thickness to balance aerodynamic and structural requirements.
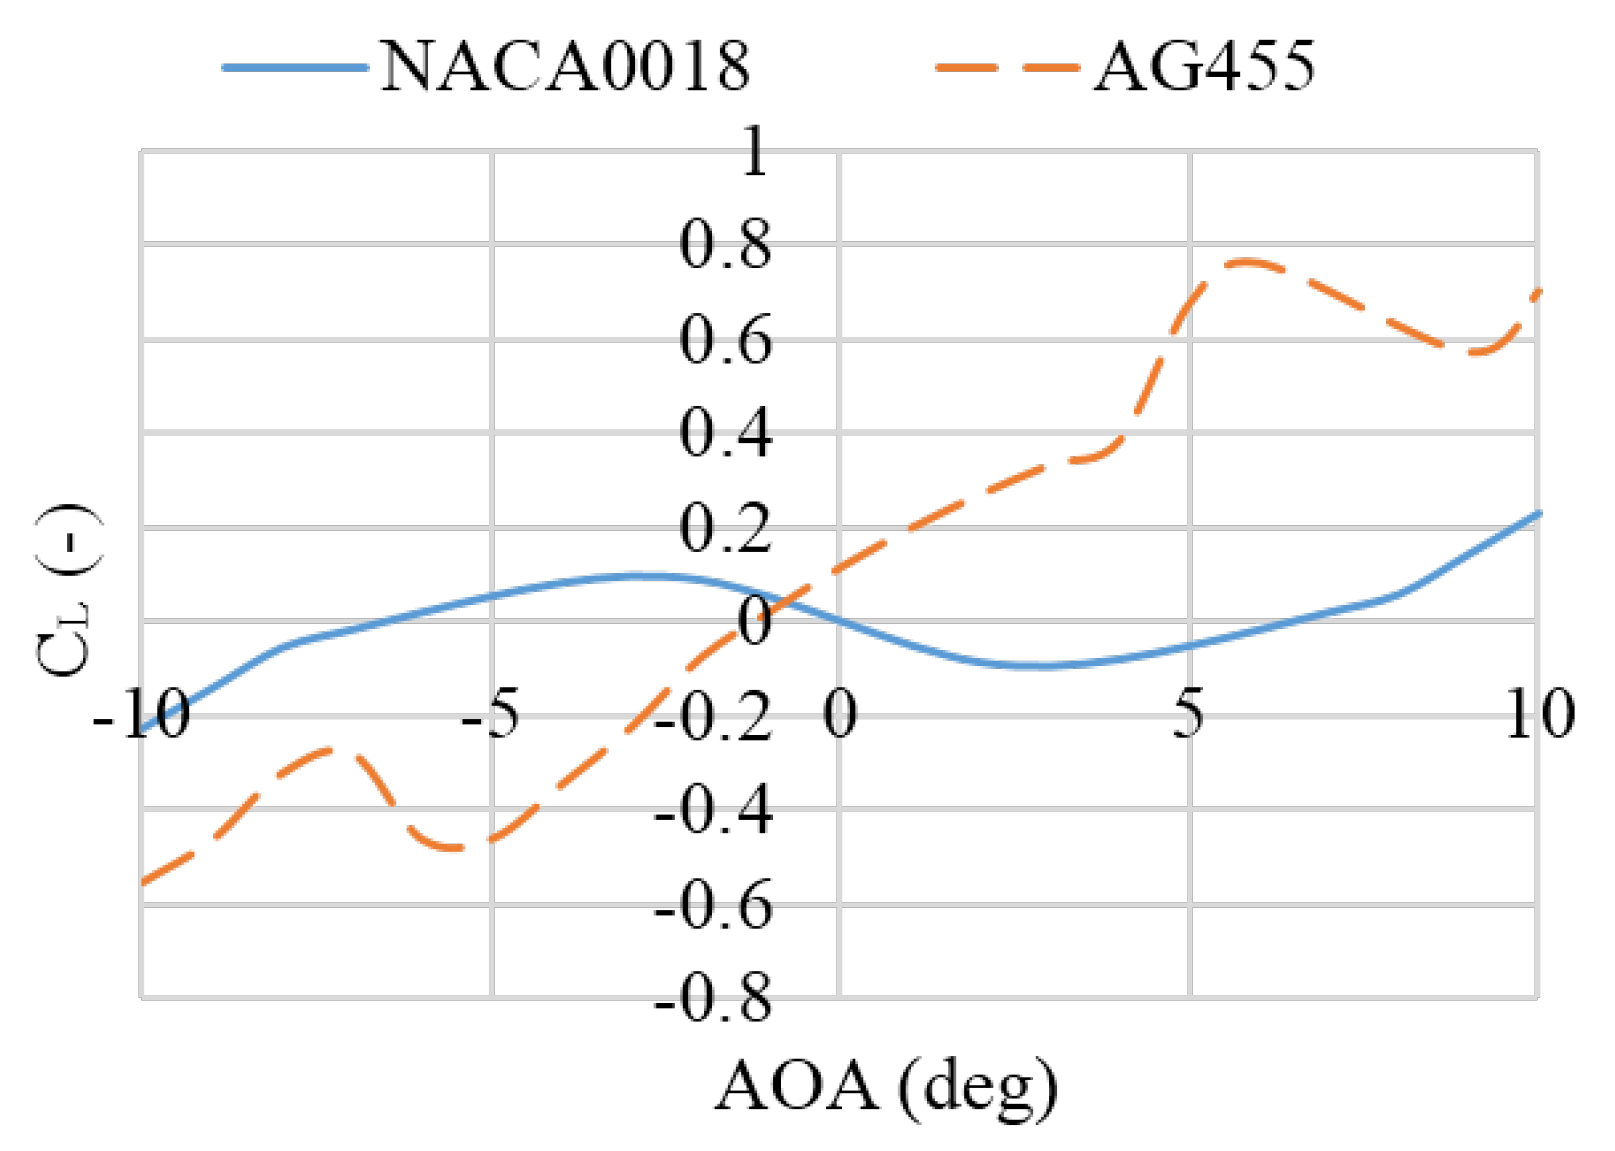
    The comparative analysis between AG455 and NACA0018 airfoils (Figure 4 and Figure 5) demonstrates the superior performance of the AG455 profile in low−Re conditions, exhibiting enhanced lift generation, improved stall characteristics, and better aerodynamic efficiency. Its reduced thickness−to−chord ratio provides additional advantages in weight management and structural integration for scaled models. This airfoil selection critically influences both local blade performance and global system dynamics during testing, ensuring proper simulation of full−scale behavior while accommodating testing constraints.
  • Step 4: Taylor series expansion formulation
    The thrust coefficient ( C T ) and side force coefficient ( C S ) are expanded using a first−order Taylor series approximation about the initial design point ( c 0 , β 0 ):
    C T ( c , β ) = C T 0 ( c 0 , β 0 ) + C T c ( c 0 , β 0 ) ( c c 0 ) + C T β ( c 0 , β 0 ) ( β β 0 )
    C S ( c , β ) = C S 0 ( c 0 , β 0 ) + C S c ( c 0 , β 0 ) ( c c 0 ) + C S β ( c 0 , β 0 ) ( β β 0 )
    By substituting the target values C T target and C S target into the equations, a linear system is derived for solving c c 0 and β β 0 .
  • Step 5: Sensitivity coefficient calculation
    The partial derivatives are determined through methodical parameter variation.
    (1) Baseline coefficients:
    The initial thrust and side force coefficients ( C T 0 , C S 0 ) are computed for the geometrically scaled blade (chord c 0 , twist β 0 ).
    (2) Chord length sensitivity:
    • For fixed β = β 0 , C T and C S are evaluated at multiple chord lengths c.
    • Least−squares regression yields the functional relationships C T ( c ) and C S ( c ) , from which C T c ( c 0 , β 0 ) and C S c ( c 0 , β 0 ) at ( c 0 , β 0 ) are extracted.
    (3) Twist angle sensitivity:
    • For fixed c = c 0 , C T and C S are evaluated at multiple twist angles β .
    • Similarly, regression provides C T β ( c 0 , β 0 ) and C S β ( c 0 , β 0 ) at ( c 0 , β 0 ) .
  • Step 6: Solution and blade reconstruction
    The linear system is solved to determine the optimal chord length ( c ) and twist angle ( β ). This completes the blade reconstruction process, ensuring the scaled model achieves target aerodynamic loads while preserving similarity laws.

4. Research on Aerodynamic Load Simulation Devices for Semi−Physical Model Tests

4.1. Physical Structure of the Cruciform−Arranged Rotor System

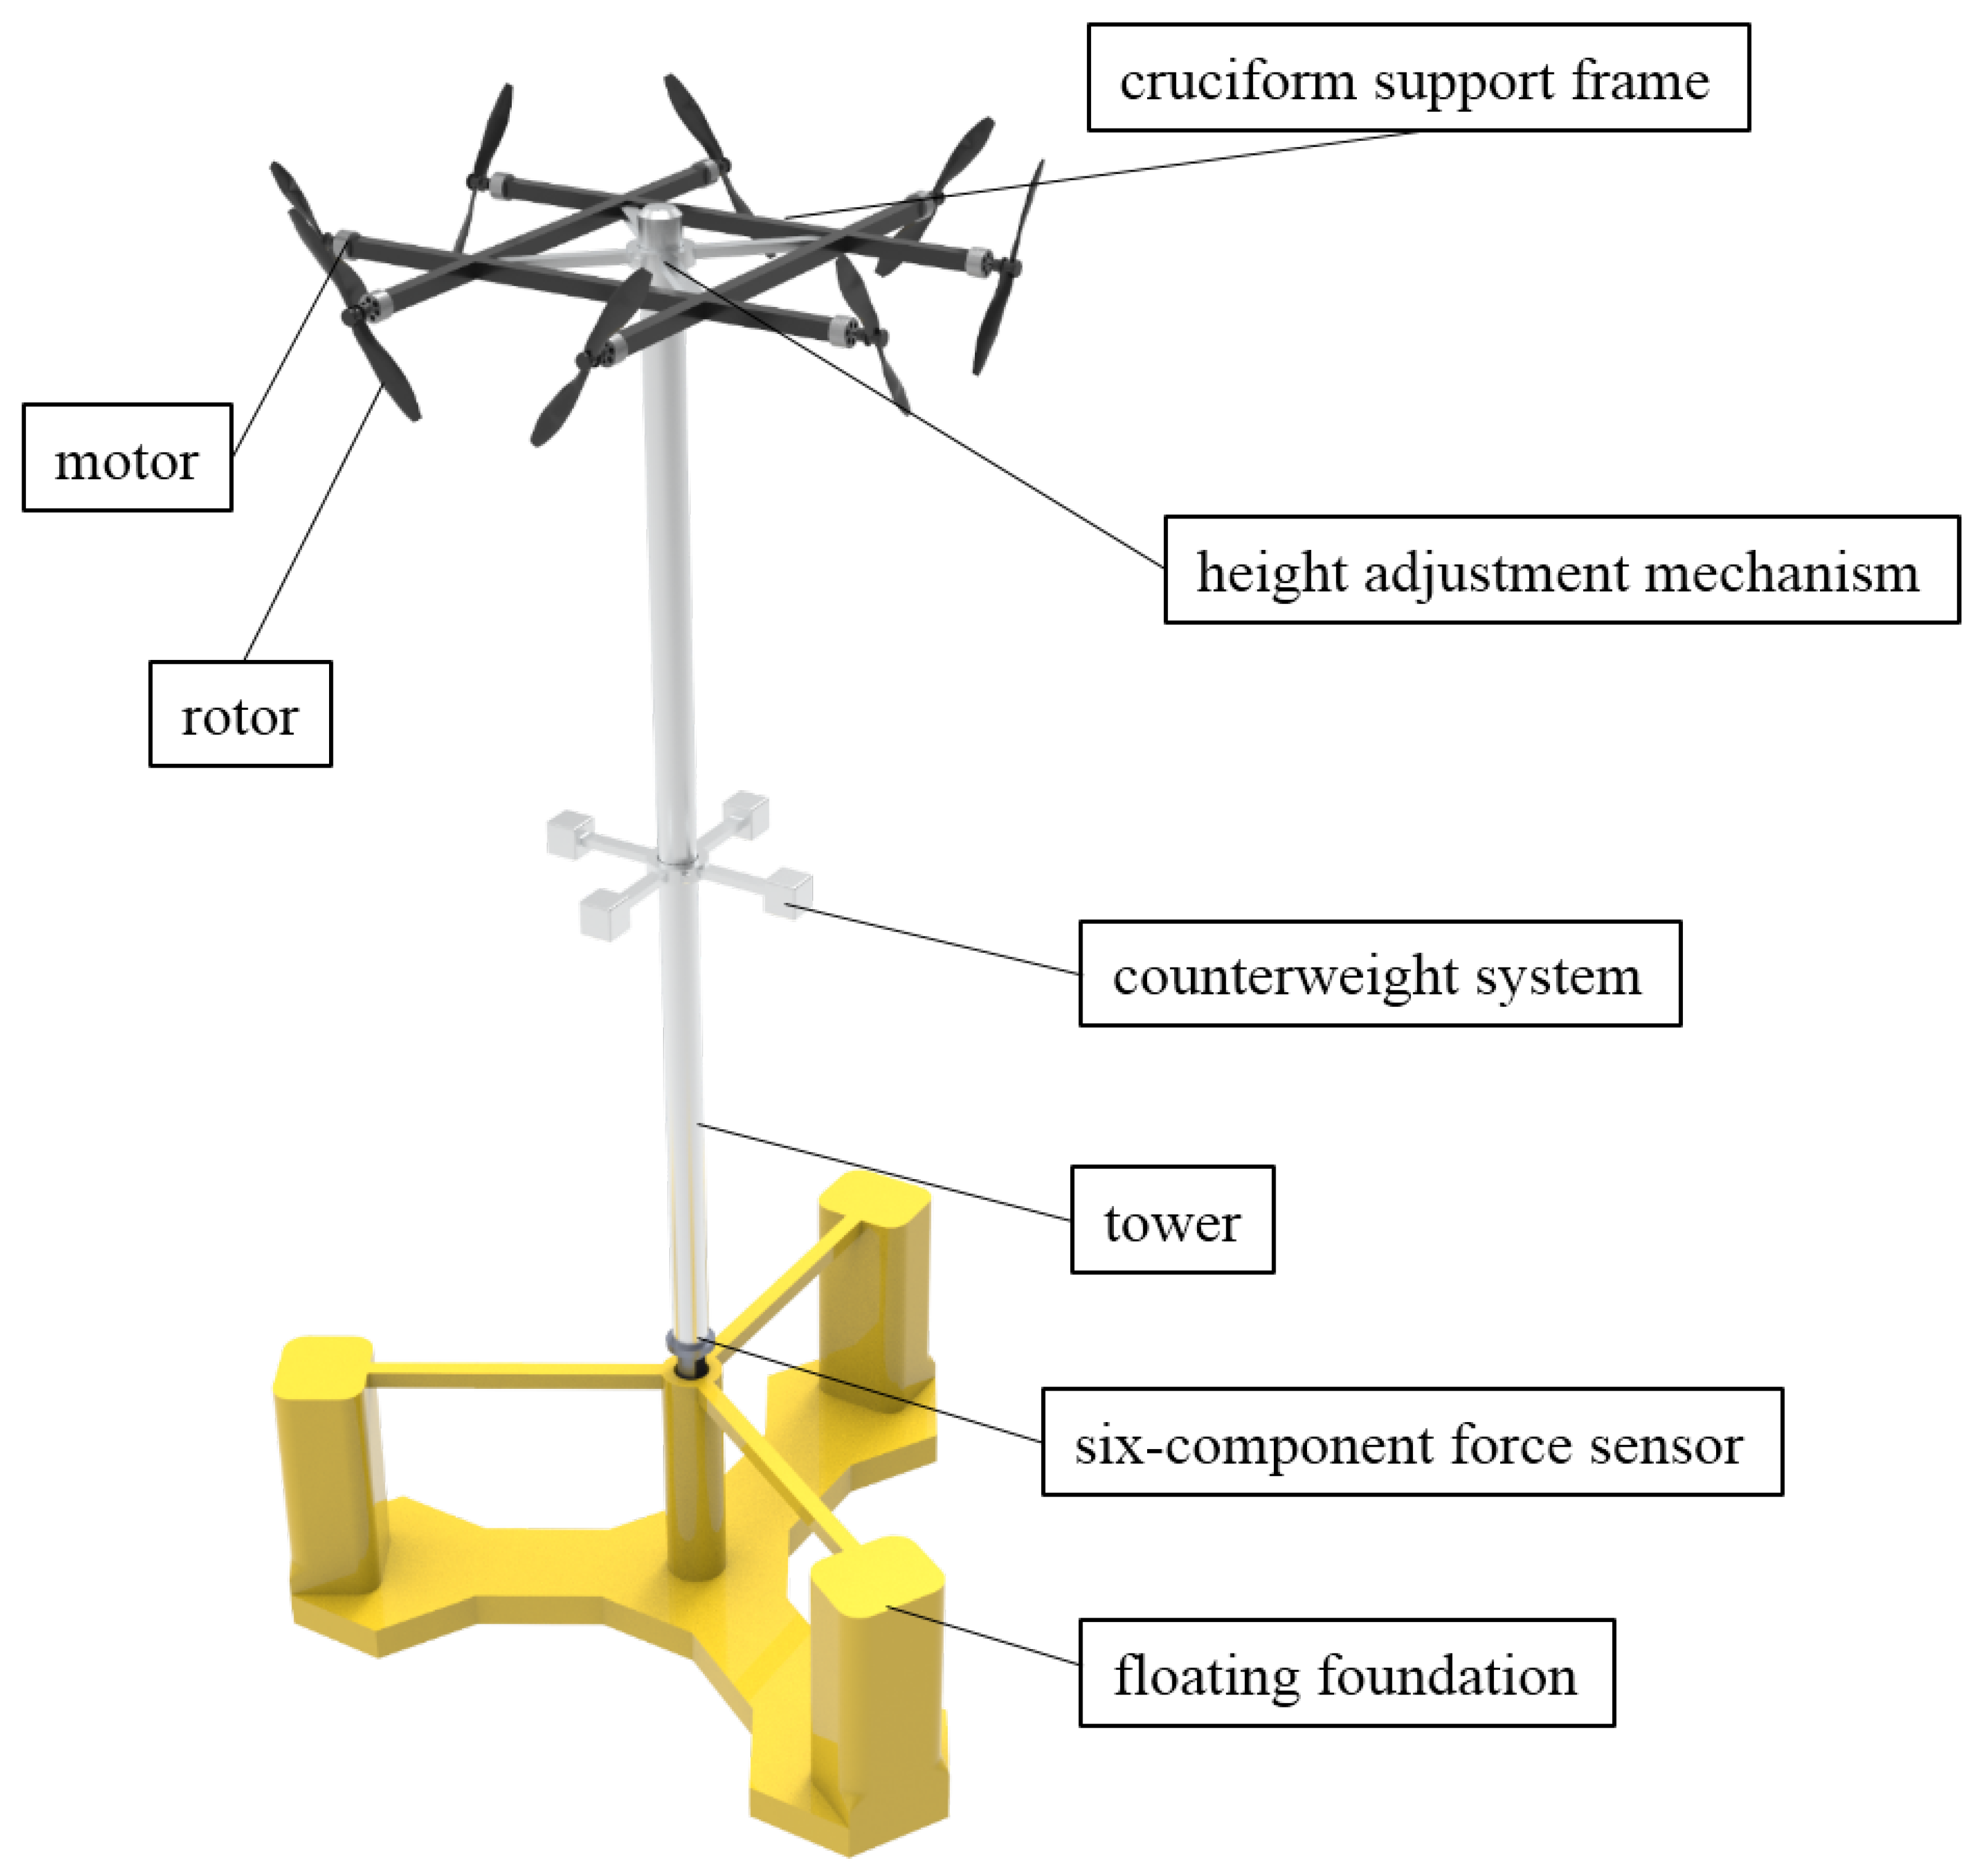
The described aerodynamic load equivalent simulation device primarily consists of the following components: eight rotors with their respective motors, a cruciform support frame, height adjustment mechanism, tower structure, six−component force sensor, and counterweight system, as shown in Figure 6. The installation procedure for the cruciform−arranged rotor system comprises the following steps:
  • Step 1: Connect the tower structure to the supporting column of the floating foundation via the six−component force sensor.
  • Step 2: Secure the cruciform support frame to the tower using the height adjustment mechanism, setting the installation height at the aerodynamic force application point:
    H m = M X m F X m
    Since the aerodynamic force application height varies under different wind conditions, this adjustment mechanism enables precise simulation of both the aerodynamic force arm and consequent tower base bending moment.
  • Step 3: The cruciform support frame consists of four parallel support arms arranged in pairs, with each parallel arm set equidistant from the central point.
  • Step 4: Mount the eight rotors to the endpoints of the cruciform frame via their respective motors. The two rotors on each side are installed in opposing rotational directions to create counter−rotation, effectively canceling individual rotor torque effects. Thrust magnitude is determined by rotor speed, with control signal input methods detailed in subsequent steps.
  • Step 5: Install the counterweight system onto the tower structure, configuring it to meet three key parameters, namely the target mass (Froude−scaled weight), target center of gravity (vertical positioning), and target moment of inertia (adjustable through support arm length modification).
The geometric symmetric configuration enables decoupled multi−degree−of−freedom control, effectively eliminating the additional inertial disturbances caused by rotating shafts in existing technologies. Furthermore, the symmetric cruciform arrangement inherently suppresses centrifugal interference induced by rotating counterweights, thereby establishing an accurate data foundation for higher−order motion coupling analysis.

4.2. Force Allocation Algorithm

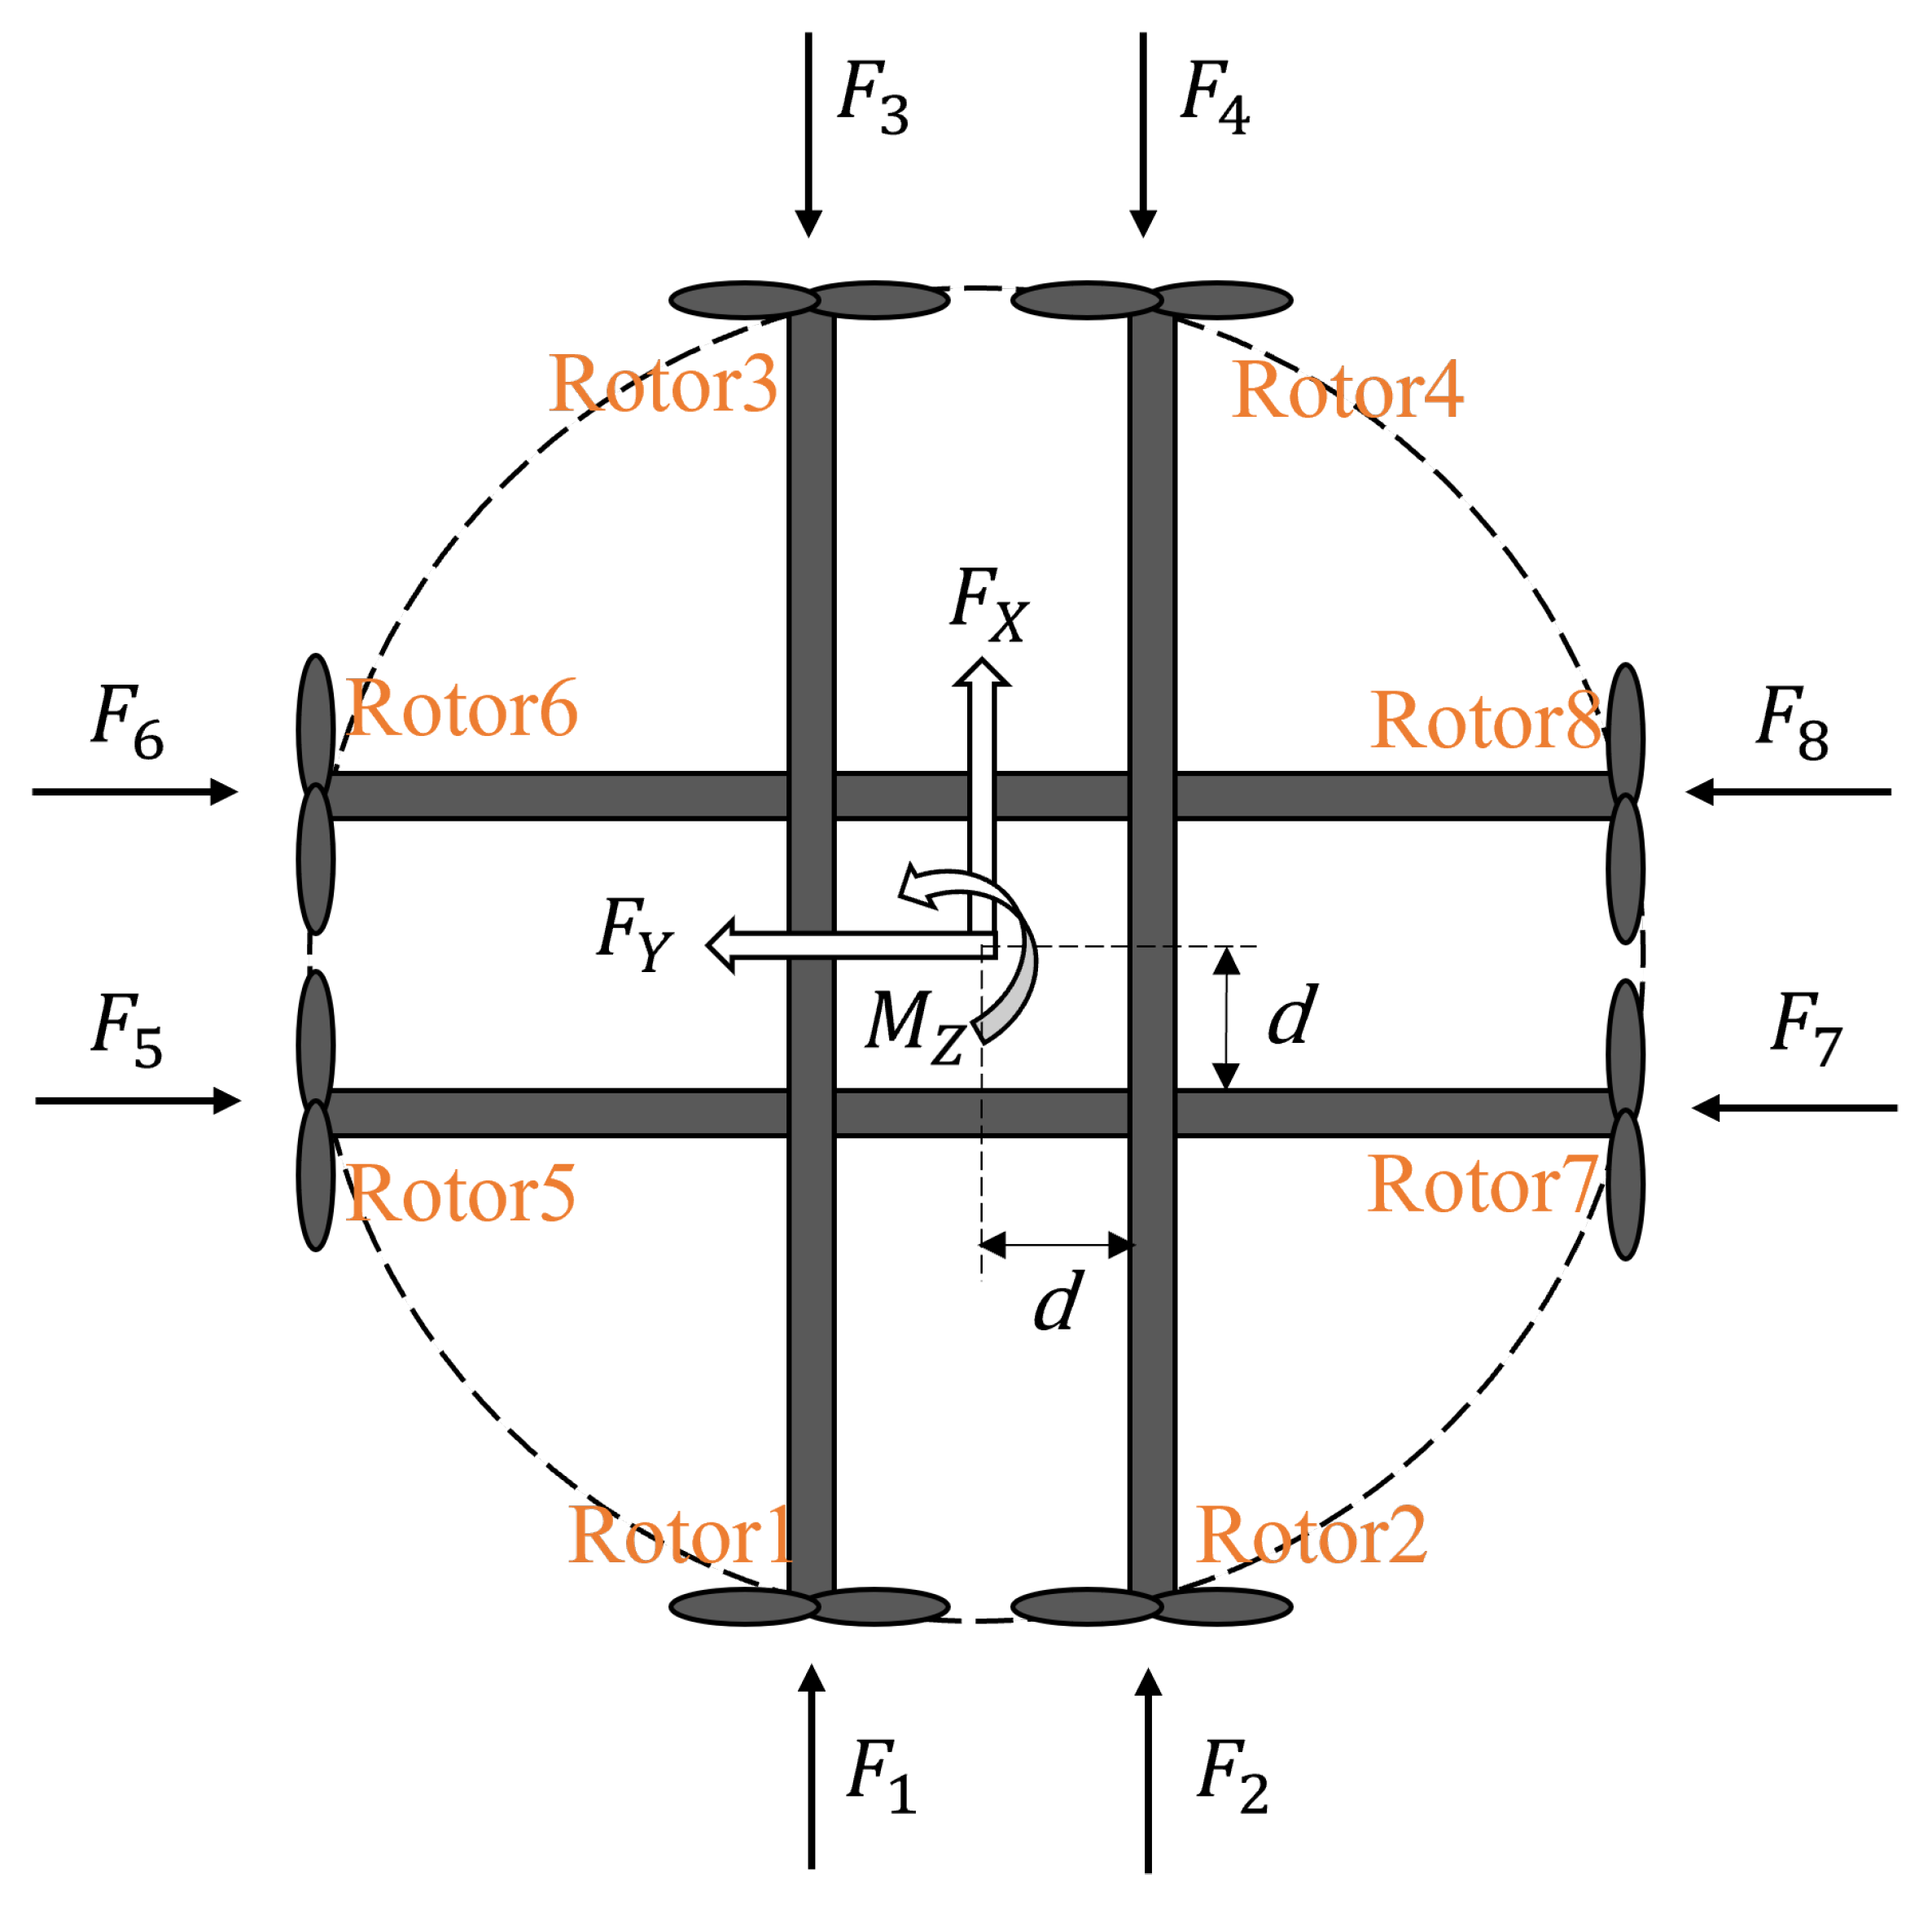
The thrust allocation algorithm of the cruciform−arranged rotor system is shown in Figure 7. The target aerodynamic thrust time series along the wind direction and crosswind direction are defined as F X m ( t ) and F Y m ( t ) , respectively, and the aerodynamic torque time series about the vertical axis is defined as M Z m ( t ) . The thrusts to be provided by the eight rotors are defined as F 1 ( t ) to F 8 ( t ) , and the distance between the two parallel support arms of the cruciform frame and the central point is d.
This study achieves, for the first time, the synchronous and precise reproduction of six−degree−of−freedom (6−DoF) aerodynamic loads at the tower base of VAWTs through a cruciform−arranged rotor array with geometric symmetry and dynamic thrust allocation algorithms. In contrast, conventional solutions are limited by the two−degree−of−freedom thrust superposition principle, which fails to account for torque about the vertical axis.
The thrust allocation principles are as follows:
  • Load Distribution: The target aerodynamic thrust time series along the wind direction, F X m ( t ) , is achieved by rotors 1−4. The target aerodynamic thrust time series along the crosswind direction, F Y m ( t ) , is achieved by rotors 5−8, with rotors 5 and 6 generating identical aerodynamic thrusts and rotors 7 and 8 generating identical aerodynamic thrusts. The target aerodynamic torque time series about the vertical axis, M Z m ( t ) , is achieved by rotors 1−4.
  • Load Equalization: The thrust difference among all eight propellers should be minimized at each time instant. In conventional multi−rotor systems, certain rotors often operate under sustained high loads while others remain idle, leading to localized overheating and accelerated lifespan deterioration. This study enforces uniform load distribution across all rotors through thrust equalization constraints.
  • Load temporal smoothness: The thrust variation between adjacent time steps must not exceed prescribed limits to ensure rapid and accurate aerodynamic load response. Traditional approaches require abrupt thrust reversal when load direction changes suddenly, inducing phase lag due to motor inertial delay and consequent load tracking distortion. By constraining inter−step thrust variation rates and leveraging the redundant degrees of freedom inherent in the cruciform configuration, this study fundamentally eliminates thrust discontinuities. When step changes occur in target loads, the algorithm autonomously selects smooth transition sequences for multiple rotor thrust groups while compensating load variations through a coordinated adjustment of remaining rotors, significantly reducing dynamic response time. This capability proves particularly critical for turbulent wind condition simulations. However, conventional methods fail to capture peak loads due to phase lag. The present invention successfully reproduces instantaneous aerodynamic load fluctuations across all wind regimes.
In summary, the thrust allocation must satisfy the following equations:
F X m ( t ) = ( F 1 ( t ) + F 2 ( t ) ) ( F 3 ( t ) + F 4 ( t ) )
F Y m ( t ) = ( F 5 ( t ) + F 6 ( t ) ) ( F 7 ( t ) + F 8 ( t ) )
M Z m ( t ) = ( F 2 ( t ) + F 3 ( t ) ) · d ( F 1 ( t ) + F 4 ( t ) ) · d
F 5 ( t ) = F 6 ( t )
F 7 ( t ) = F 8 ( t )
F i ( t ) 0
The optimization objective is formulated as
min J = min t = 1 T i = 1 8 ( F i ( t ) ) 2 + λ t = 1 T 1 i = 1 8 ( F i ( t + 1 ) F i ( t ) ) 2
In Equation (26), the first term represents the minimization of thrust differences, expressed mathematically as the sum of squared thrust amplitudes in the spatial dimension, which achieves the effect of equalizing the load distribution among all rotors. The second term represents temporal smoothness, formulated mathematically as the sum of squared thrust variations in the temporal dimension, which serves to suppress abrupt thrust fluctuations. By solving Equations (20)−(26), the required thrust values F 1 ( t ) to F 8 ( t ) for all eight rotors at each time instant can be determined. Consequently, the required thrust for each of the eight rotors can be calculated at every time instant.

4.3. Control System and Drive System

The control system of the rotor assembly is primarily implemented through an upper computer and an Arduino Uno. The upper computer calculates the time series of control signals for aerodynamic loads, while the Arduino generates corresponding pulse width modulation (PWM) waves based on the received signals. The electronic speed controller (ESC) adjusts motor speed according to the duty cycle of the received PWM waves. During preliminary debugging and calibration tests of individual rotors, the system employs open−loop control. The calibration process involves the following steps: first, we progressively increase the throttle signal from minimum to maximum to measure the thrust values at each throttle setting, thereby establishing a “throttle signal−thrust” curve. Then, we subsequently map the aerodynamic thrust time series onto this curve to derive the respective throttle signal time histories for each rotor. This enables real−time dynamic control of the aerodynamic loads generated by the cruciform−arranged rotor system.

5. Numerical Verification Case Study

5.1. The Introduction of the Research Object

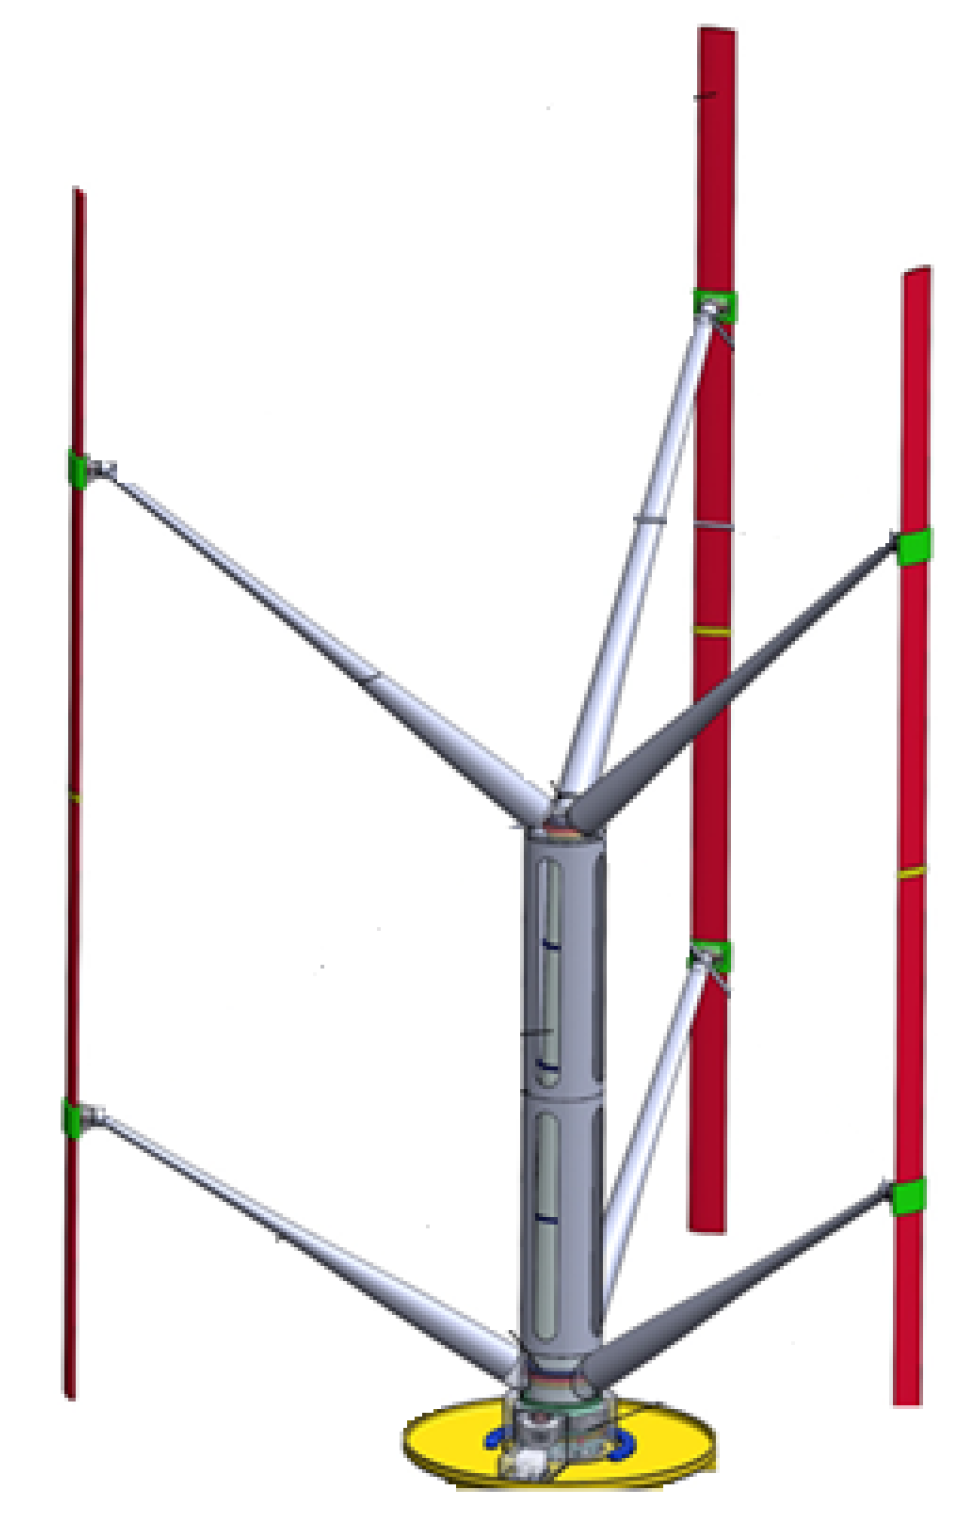
Figure 8 shows the conceptual design of a 10 MW VAWT, which includes three lift−type straight blades, a blade pitch adjustment mechanism, cross struts, a hub, a hub connection structure, a tapered tower, and the nacelle. Table 1 presents the structural parameters of the wind turbine rotor. The turbine has a rated power of 10 MW, with a rated wind speed of 13.2 m/s and a rated rotational speed of 9.68 rpm. The table also provides geometric parameters such as rotor diameter, blade length, and hub height.

5.2. Numerical Verification in Fully Physical Model Tests

Table 1 presents a comparative overview of the full−scale wind turbine and the reconstructed model−scale turbine when employing the fully physical model testing approach. The blade airfoil was modified from NACA0018 to AG455, with the chord length initially scaled down by a factor of 1:60 before being enlarged to 0.056 m. Additionally, the blade twist angle was decreased from 0 deg to −0.6 deg.
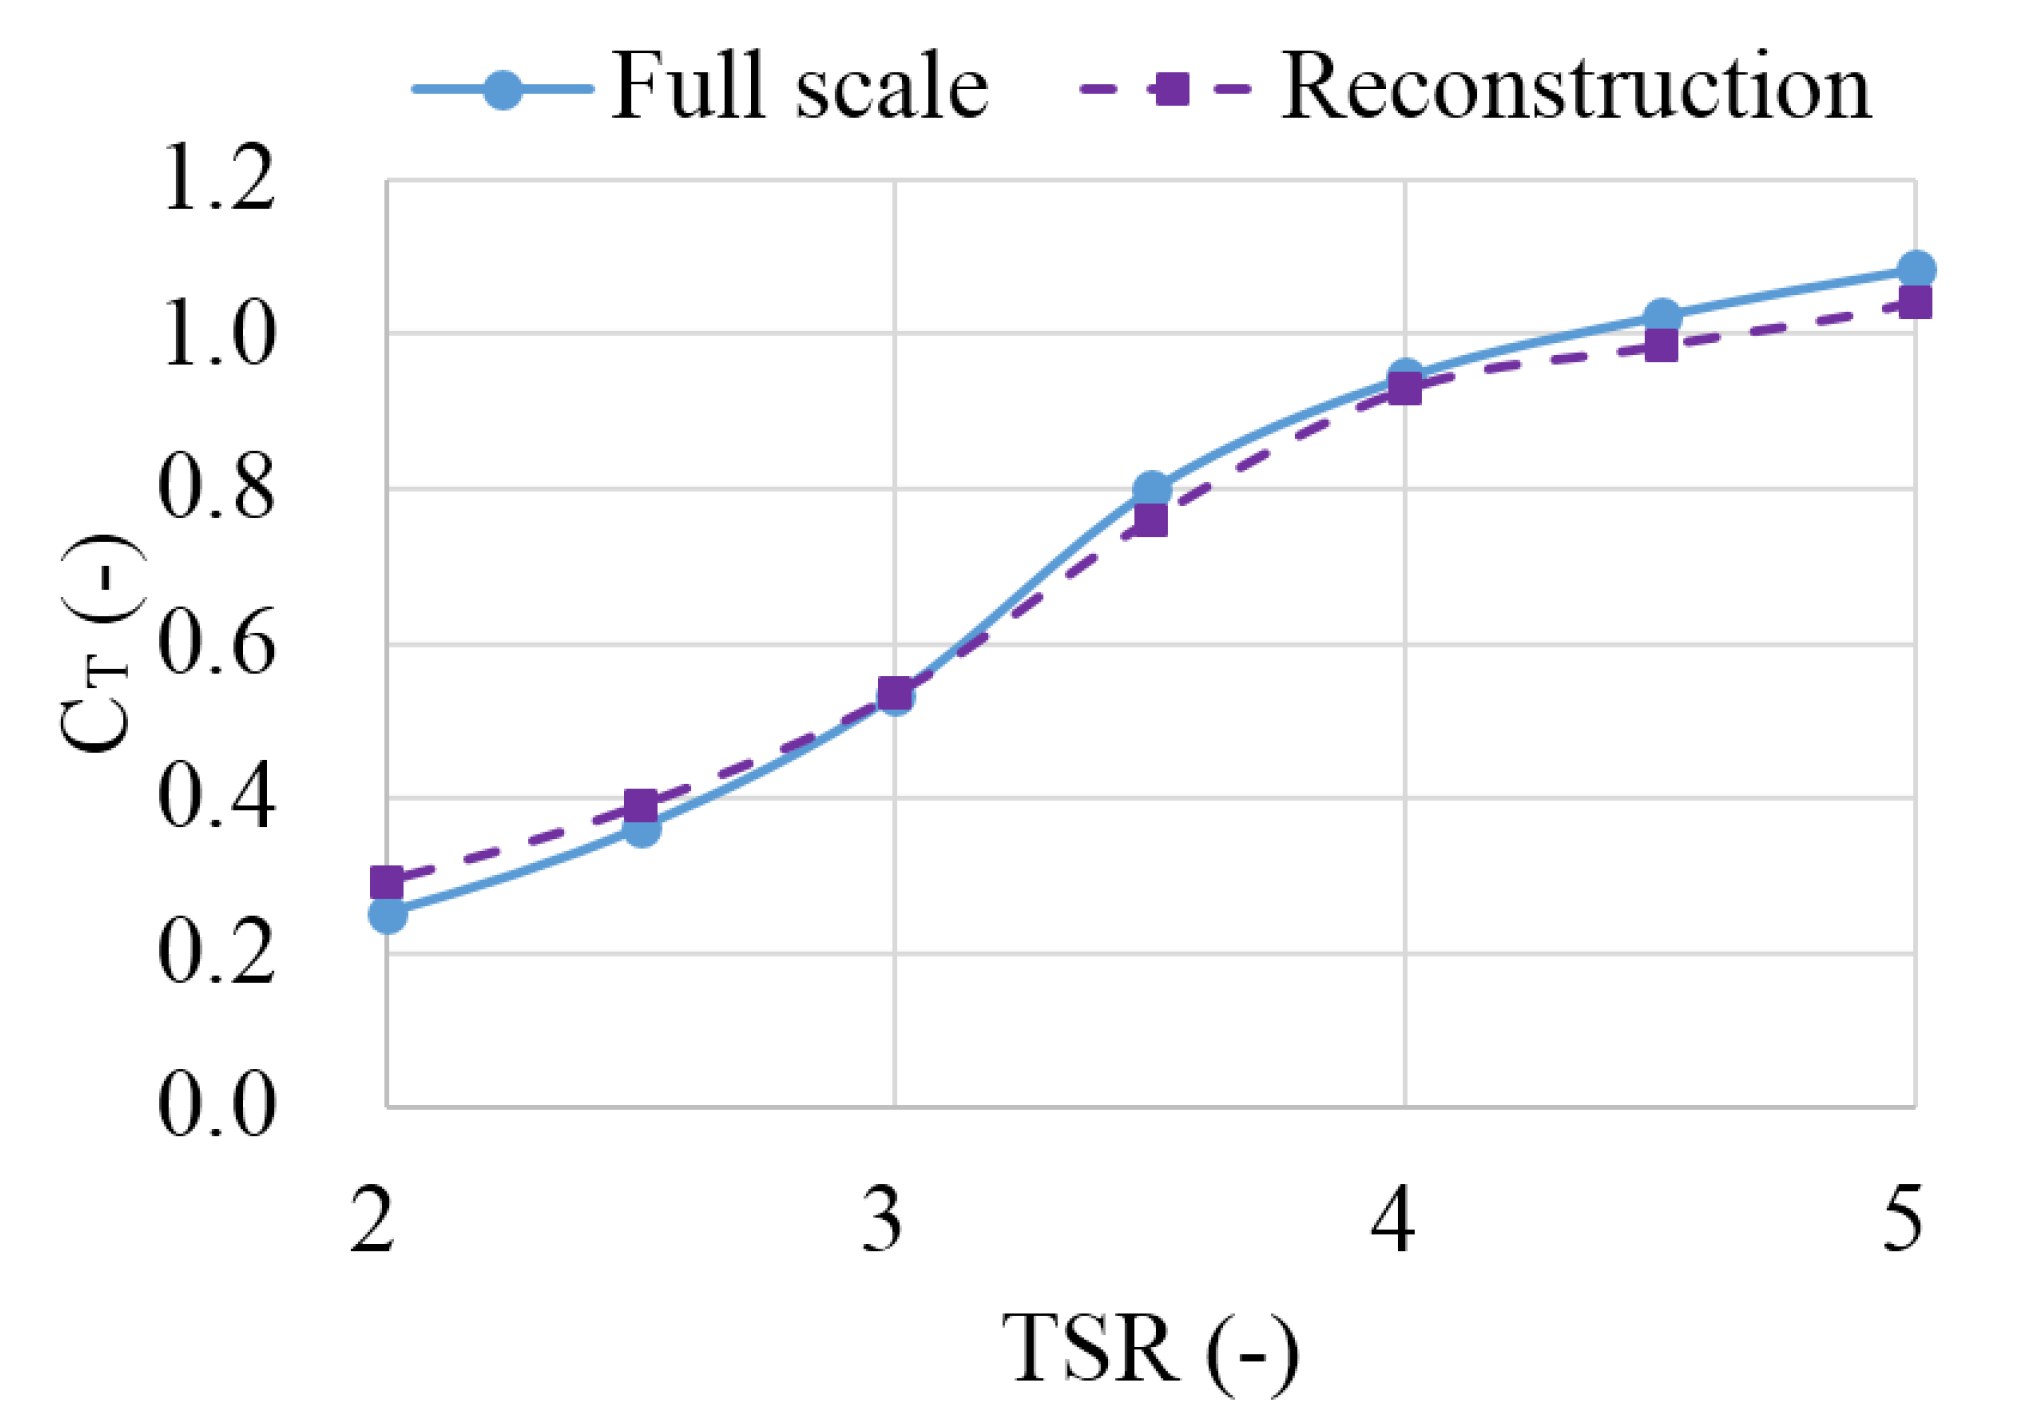
Figure 9 displays the mean thrust coefficients of the reconstructed blades across various TSRs. Throughout the operational TSR range of 1.37−3.97, the mean thrust coefficients demonstrate excellent agreement. As the mean side force coefficients remain at zero, no comparative analysis was conducted for this parameter. The TSR range of 1.37−3.97 adequately covers conventional operational conditions. Consequently, the blade reconstruction methodology employed in this case study yields a turbine model capable of accurately simulating aerodynamic loads, thereby ensuring the validity of VAWT testing while enhancing both measurement precision and experimental feasibility.
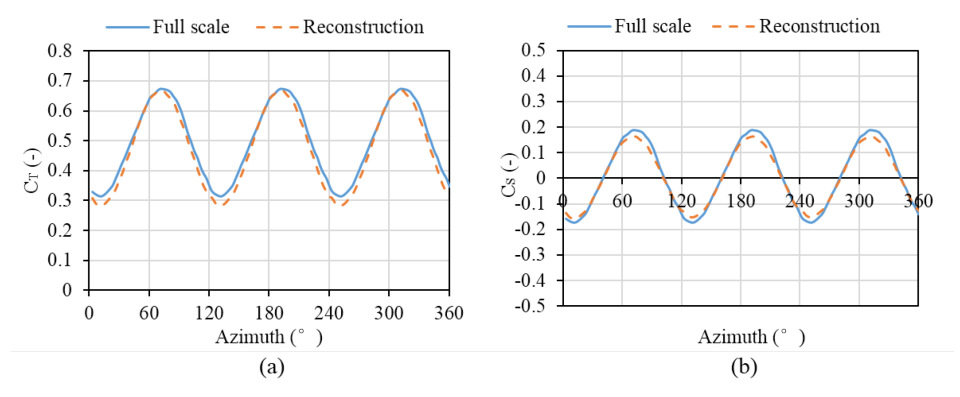
The side force coefficients of the reconstructed blades also show good agreement. Figure 10 presents the matching performance across all azimuth angles under a specific operational condition. Specifically, Figure 10a compares the thrust coefficients between the reconstructed blades and the full−scale blades at high Reynolds numbers over all azimuth angles under rated operational conditions, while Figure 10b compares their side force coefficients under the same conditions.
The blade reconstruction method presented in this case study demonstrates broad applicability for both the basin model test and wind tunnel test. This comprehensive reconstruction approach simultaneously considers three critical aerodynamic parameters, namely blade airfoil profile, chord length, and twist angle distribution, thereby optimizing the performance characteristics of model−scale blades.

5.3. Numerical Verification in Semi−Physical Model Tests

The numerical software QBlade was used to calculate the full–scale six–degree–of–freedom loads at the tower base of a VAWT under rated conditions, including aerodynamic load along the wind direction ( F X ), vertical aerodynamic load ( F Y ), gravitational load of the turbine ( F Z ), aerodynamic bending moments at the tower base ( M X , M Y ), and driving torque about the vertical axis ( M Z ).
To demonstrate the capability of the aerodynamic load simulation system in this study to reproduce highly fluctuating aerodynamic loads, the rated condition was simulated with turbulent wind featuring a turbulence intensity of 16.4%, rather than steady wind. The full−scale aerodynamic load time histories were then scaled down to model scale using the Froude scaling criterion. The target synthesized loads ( F X , F Y , M Z ) of the aerodynamic load simulation system are shown in Figure 11. The aerodynamic loads displayed in the figure exhibit significant fluctuations around a mean value during each rotation cycle of the VAWT. The fluctuation frequency, when converted to full scale, is approximately 28.8 rpm, which is three times the turbine rotational speed of 9.6 rpm, corresponding to the 3P frequency.
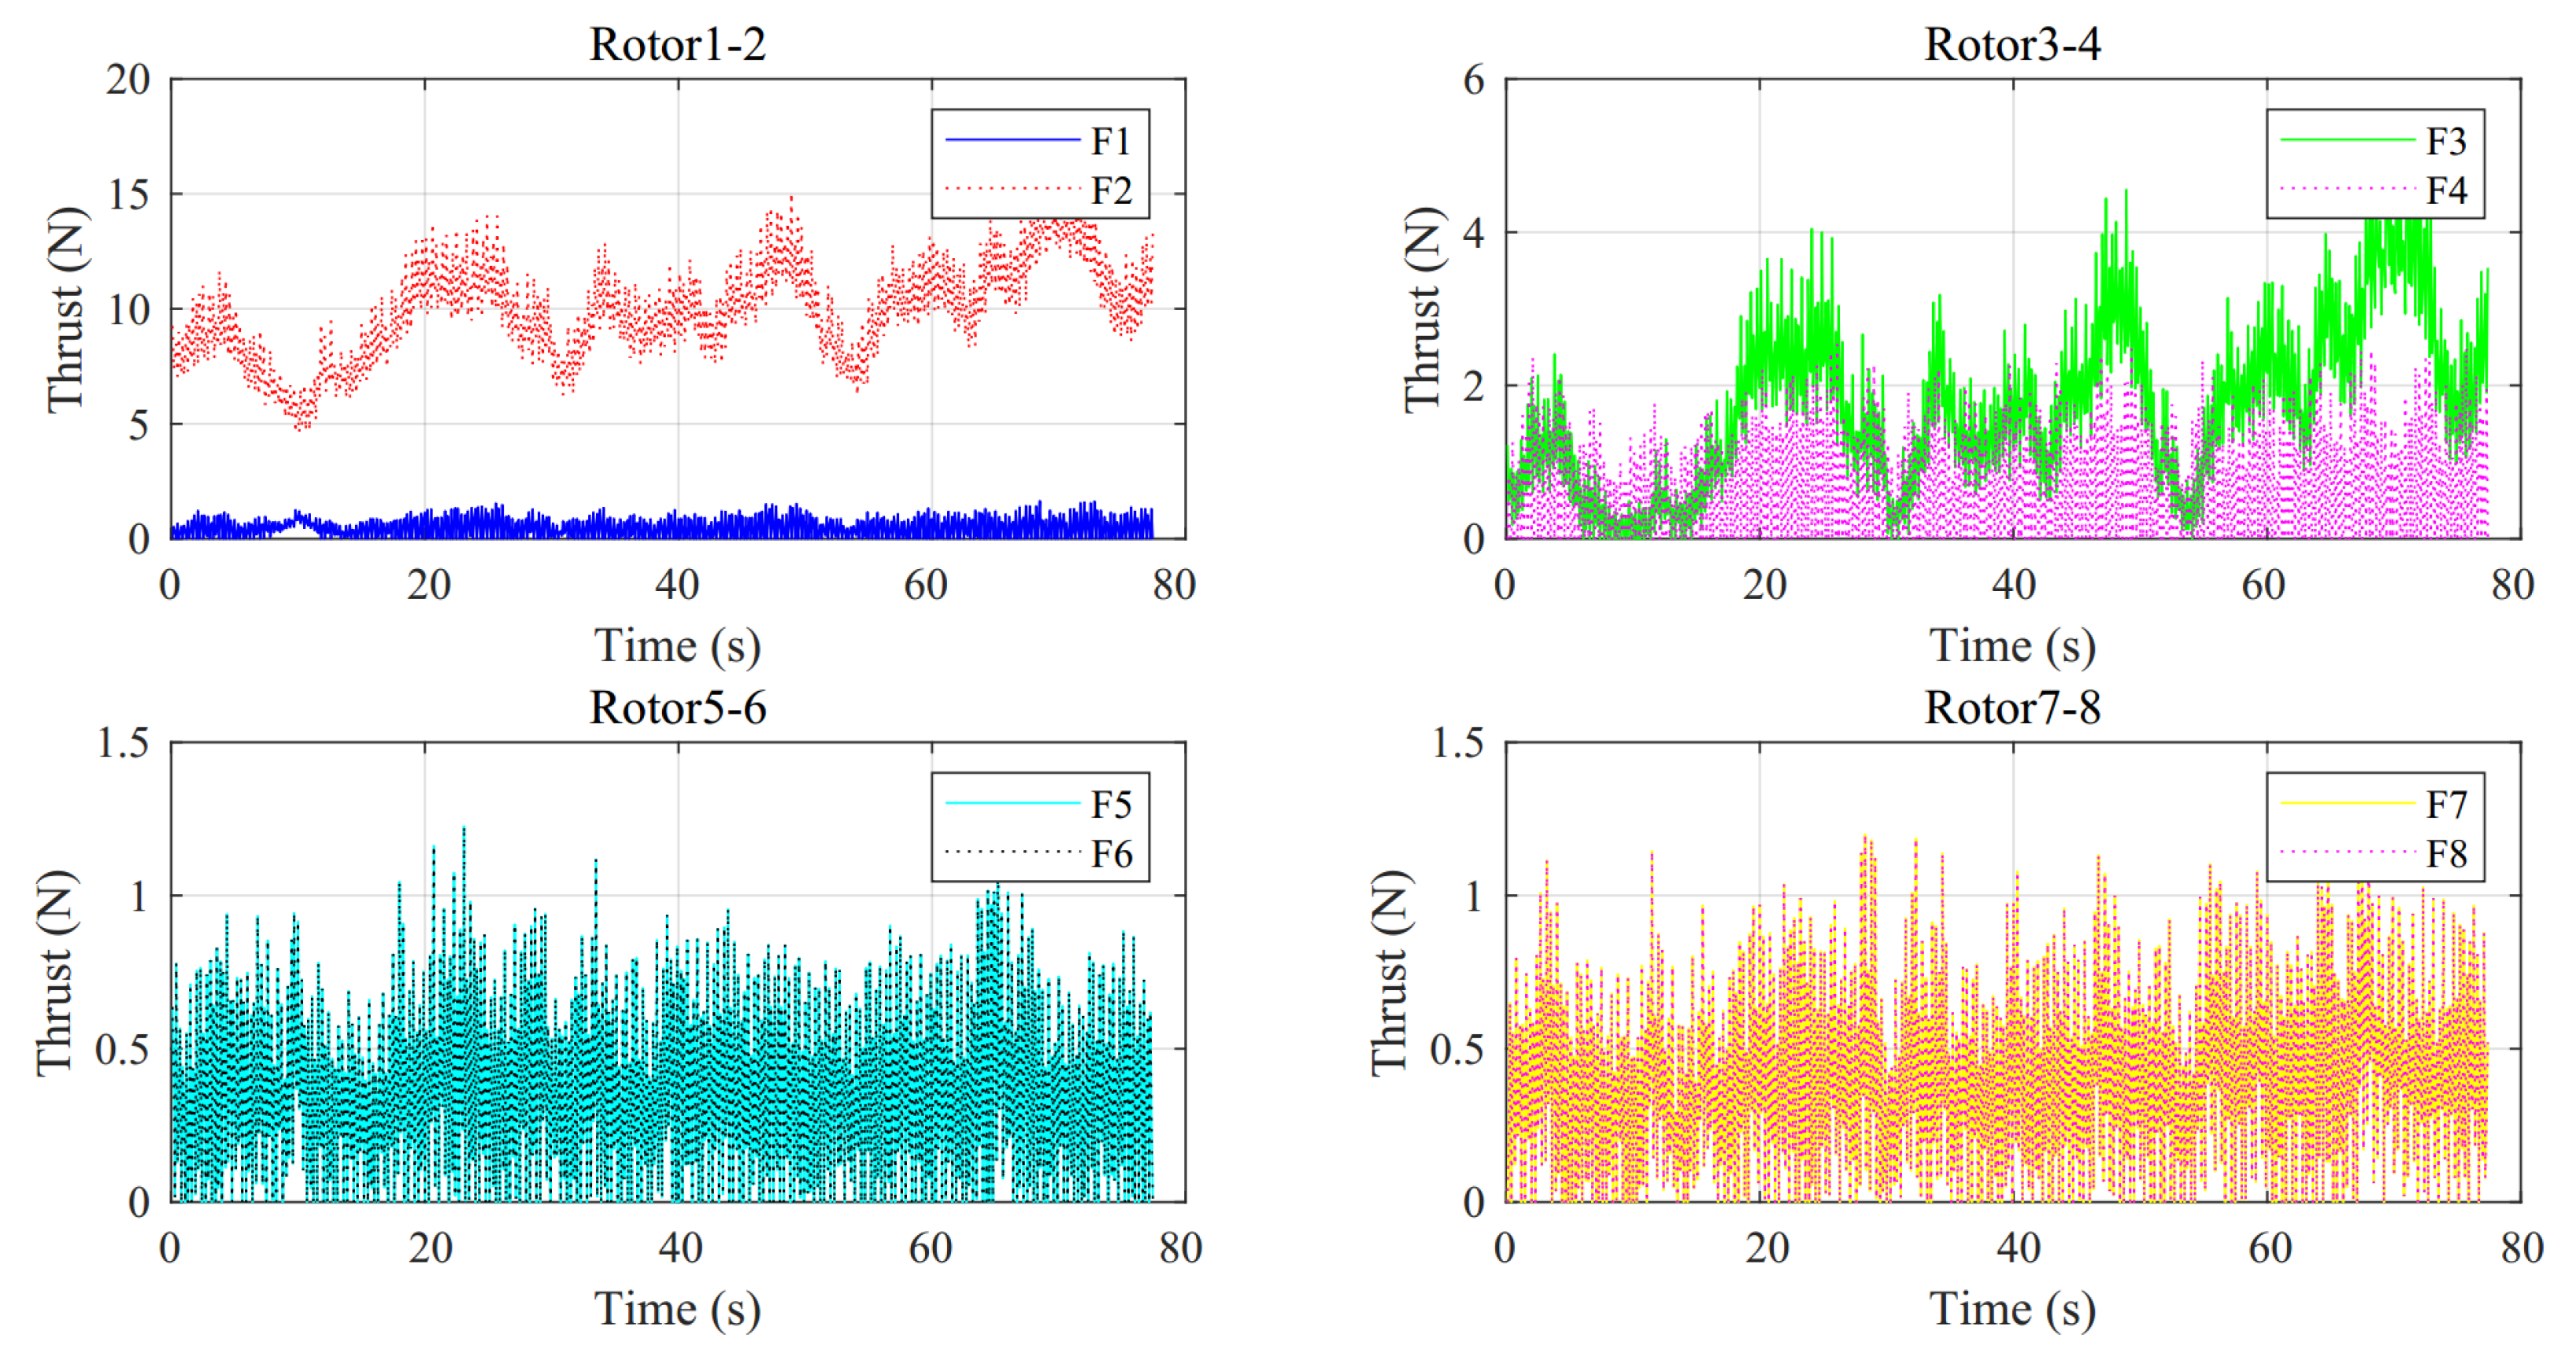
The thrust allocation algorithm described in the previous section was applied to distribute the loads among eight rotors, and the time histories of the allocated loads for each rotor are shown in Figure 12. This study achieves, for the first time, the synchronous and accurate reproduction of six−DoF aerodynamic loads at the tower base of a VAWT through the geometrically symmetric layout of a cross−shaped rotor array and a dynamic thrust allocation algorithm. Traditional schemes, limited by the principle of two−degree−of−freedom thrust superposition, fail to reproduce the torque about the vertical axis.
The thrust allocation results adhere to the principle that “the thrust variation of each of the eight rotors between adjacent time steps should be minimized as much as possible.” This ensures that the rotational speed of the motor−driven rotors does not change too abruptly between adjacent time steps, thereby avoiding delays in reproducing the aerodynamic loads. The thrust allocation program in this study incorporates a smoothing coefficient to suppress abrupt thrust variations, and the thrust variation rate between adjacent time steps is calculated using Equation (27):
Δ F i ( t ) = | F i ( t + 1 ) F i ( t ) | max ( F i ( t + 1 ) , F i ( t ) )
The maximum relative variation rate of Rotor 2 between adjacent time steps decreased from 28.8% (before constraint implementation) to 9.3%. The thrust curves in Figure 12 exhibit continuous and gradual characteristics, verifying the smoothing effect of temporal regularization on dynamic processes. In previous studies, abrupt directional changes in target loads required a forced thrust reversal of rotors, leading to phase lag due to motor inertia delays and resulting in load−tracking distortion. This study employs a dual−constraint optimization algorithm that simultaneously limits thrust variation rates between adjacent time steps and thrust differences at the same moment, combined with the redundant degrees of freedom in the cross−shaped rotor array, fundamentally avoiding abrupt thrust changes.
When step changes occur in target loads, the algorithm automatically selects smooth transition schemes for multiple rotor thrusts and compensates for load variations through coordinated adjustments of the remaining rotors, significantly reducing dynamic response time. This feature is particularly critical for simulating turbulent wind conditions—traditional methods lose peak loads due to phase lag, whereas this invention successfully captures instantaneous fluctuations in aerodynamic loads under various wind conditions.
A statistical analysis of thrust values from the eight rotors yields a box plot, as shown in Figure 13, which shows that Rotor 2 has the highest median thrust, indicating its dominant role in load distribution. This suggests that Rotor 2 could be designed with different specifications compared to the other seven rotors to improve energy efficiency. Thrust standard deviation analysis reveals that Rotors 5−8 exhibit lower dispersion than Rotors 1−4, which is directly related to the symmetric constraint design of the F Y channel.
In traditional multi−rotor schemes, certain rotors may operate under prolonged high loads while others remain idle, leading to localized overheating and rapid lifespan degradation. This study enforces load uniformity across all rotors through thrust−balancing constraints. Furthermore, traditional systems are prone to collapse under single−rotor failure or extreme load fluctuations due to localized overload, whereas this study achieves fault tolerance through dynamic redistribution algorithms and closed−loop feedback mechanisms. When a rotor suddenly fails, the algorithm rapidly redistributes its load to the remaining rotors within an extremely short time. Under extreme conditions, conventional methods may destabilize due to abrupt thrust changes, forcing test termination, whereas this study reduces aerodynamic load errors through real−time correction algorithms.

6. Conclusions

Unlike horizontal−axis wind turbines, VAWTs experience continuous variations in blade attack angles throughout each rotation cycle as a function of azimuthal position, resulting in significant fluctuations in aerodynamic loading. Furthermore, VAWTs are subject to substantial forces and moments in three key directions, namely along−wind, crosswind, and about the vertical axis. For model testing to accurately simulate target aerodynamic loads, it must precisely reproduce three critical characteristics, which are mean values, amplitudes, and variation periods. This makes the simultaneous fulfillment of test condition parameters while achieving multi−degree−of−freedom aerodynamic load simulation particularly complex.
For fully physical model tests, a blade reconstruction method was employed in this study to achieve aerodynamic load similarity under scale effects for VAWTs. Following Froude scaling laws, the turbine model was proportionally reduced in size, and low−Reynolds−number airfoils were selected. By leveraging the computational expressions for thrust and side force coefficients of the turbine model, key factors affecting blade aerodynamic loads are comprehensively considered. Target values based on full−scale thrust and side force coefficients were used to formulate binary linear equations for chord length and twist angle, enabling the direct calculation of reconstruction parameters for the model turbine. This blade reconstruction approach simultaneously matched full−scale aerodynamic parameters in both thrust and side force dimensions, delivering accurate results with high efficiency and straightforward implementation. Through effective blade reconstruction for VAWTs, the method accurately simulated aerodynamic loads without violating other similarity criteria, ensuring test accuracy and supporting advancements in VAWT technology. While the current validation focuses on a 10 MW straight−bladed configuration, the proposed blade reconstruction methodology exhibits strong generalizability across different VAWT scales, blade numbers, and airfoil types.
For semi−physical model tests, this study adopted a “numerical rotor model + physical floating foundation” approach. Theoretical aerodynamic loads were first obtained through numerical simulations and then equivalently reproduced using a controllable cruciform−arranged rotor actuator system based on a thrust distribution algorithm. This streamlined process accurately replicated the periodic aerodynamic thrusts in both along−wind and crosswind directions, as well as the aerodynamic bending moment at the tower base. Simultaneously, the cruciform−arranged rotor system overcomes traditional limitations through spatial force decoupling and temporal smoothing algorithms, enabling six−DoF load simulation in turbulent load replication. This system’s dynamic thrust allocation minimizes abrupt variations (<9.3% inter−step thrust rate), critical for capturing 3P frequency fluctuations inherent to VAWT operation.
It is worth noting that this paper focused primarily on proposing these two technical methods. The comparative validation between the methods or between model tests and theoretical calculations is beyond its current scope. Subsequent validation will involve both fully physical and semi−physical model tests, which were conducted on the same floating VAWT model. Future work will include detailed comparisons between the two methods as well as between experimental and theoretical results, with research to be published separately. In addition, a thorough integrated error analysis of the entire experimental system as well as a sensitivity analysis of how key design parameters affect the final load output will be conducted as well.

Author Contributions

Conceptualization, Q.C. and X.Z.; methodology, Q.C. and X.Z.; software, Q.C. and K.Z.; validation, Q.C., Z.J., and K.Z.; formal analysis, Q.C.; investigation, Q.C. and Y.C.; resources, Q.C. and Y.C.; data curation, Q.C. and K.Z.; writing—original draft preparation, Q.C.; writing—review and editing, Z.C. and X.C.; visualization, Q.C.; supervision, Q.C.; project administration, Q.C.; funding acquisition, Q.C. All authors have read and agreed to the published version of the manuscript.

Funding

This research was funded by the National Natural Science Foundation of China (Grant No. 42406229) and the Natural Science Foundation of Jiangsu Province (Grant No. BK20240302).

Data Availability Statement

The data presented in this study are available upon request from the corresponding author. The data are not publicly available due to data security management regulations of the China Ship Scientific Research Center.

Conflicts of Interest

The authors declare no conflicts of interest.

Nomenclature

SymbolDescriptionSI Unit
α Angle of attackdeg or rad
β Blade twist angledeg or rad
γ Density correction factor ( ρ freshwater / ρ seawater )
θ Azimuthal angle of rotor rotationdeg or rad
λ Geometric scaling ratio ( L m / L p )
ρ Air densitykg/m3
Ω Rotor angular velocityrad/s
ν Kinematic viscosity of the fluidm2/s
BNumber of blades
cBlade chord lengthm
C D Drag coefficient
C L Lift coefficient
C S Lateral (side) force coefficient
C T Thrust coefficient
DDrag force per unit blade lengthN/m
F r Froude number ( V / g L )
F n , F t Forces perpendicular and parallel to the chordN
F n B , F t B Normal and tangential forces on the actuator cylinderN
F X , F Y Aerodynamic thrust in streamwise and crosswind directionsN
gGravitational accelerationm/s2
LLift force per unit blade lengthN/m
L m , L p Characteristic length (model and prototype)m
M x , M y , M z Aerodynamic moments about x, y, and z axesN·m
Q n , Q t Dimensionless normal and tangential force
RRotor radiusm
R e Reynolds number ( V c / ν )
TAerodynamic thrustN
VCharacteristic velocitym/s
V w Incoming wind speedm/s

Abbreviations

AbbreviationFull Form
6−DoFSix−Degree−of−Freedom
AOAAngle of Attack
ESCElectronic Speed Controller
FSRFroude−Scale Rotor
HAWTHorizontal−Axis Wind Turbine
PWMPulse Width Modulation
ReReynolds Number
TSRTip−Speed Ratio ( Ω R / V w )
VAWTVertical−Axis Wind Turbine

References

  1. Wang, X.; Li, H.; Zhang, W. State-of-the-art floating vertical-axis wind turbines: A review of design and modeling approaches. Renew. Energy 2021, 178, 185–201. [Google Scholar] [CrossRef]
  2. Liu, C.; Yu, X.; Sun, Z. Aerodynamic load modeling for vertical-axis wind turbines in wind tunnel tests. J. Phys. Conf. Ser. 2022, 2121, 012034. [Google Scholar] [CrossRef]
  3. Martin, S.; Jensen, P.; Sørensen, J.N. Aerodynamic force simulation devices for semi-physical model tests of vertical-axis wind turbines. Renew. Energy 2021, 172, 821–835. [Google Scholar] [CrossRef]
  4. Kim, H.; Park, J.; Lee, K. Performance evaluation of floating vertical-axis wind turbines under extreme wind conditions. In Proceedings of the ASME 2022 41st International Conference on Ocean, Offshore and Arctic Engineering (OMAE2022), Hamburg, Germany, 5–10 June 2022; p. V008T10A028. [Google Scholar]
  5. Nielsen, F.G.; Hanson, T.D.; Skaare, B. Integrated dynamic analysis of floating offshore wind turbines. In Proceedings of the International Conference on Offshore Mechanics and Arctic Engineering, Hamburg, Germany, 4–9 June 2006; Volume 47462, pp. 671–679. [Google Scholar]
  6. Hall, M.; Goupee, A.; Jonkman, J. Development of performance specifications for hybrid modeling of floating wind turbines in wave basin tests. J. Ocean. Eng. Mar. Energy 2018, 4, 1–23. [Google Scholar] [CrossRef]
  7. Martin, H.R.; Kimball, R.W.; Viselli, A.M.; Goupee, A.J. Methodology for wind/wave basin testing of floating offshore wind turbines. J. Offshore Mech. Arct. Eng. 2014, 136, 020905. [Google Scholar] [CrossRef]
  8. Abdelghany, E.S.; Sarhan, H.H.; Alahmadi, R.; Farghaly, M.B. Study the Effect of Winglet Height Length on the Aerodynamic Performance of Horizontal Axis Wind Turbines Using Computational Investigation. Energies 2023, 16, 5138. [Google Scholar] [CrossRef]
  9. Farghaly, M.B.; Abdelghany, E. Study the effect of trailing edge flap deflection on horizontal axis wind turbine performance using computational investigation. Int. J. Renew. Energy Res. 2022, 12, 1942–1953. [Google Scholar] [CrossRef]
  10. Muller, K.; Sandner, F.; Bredmose, H.; Azcona, J.; Manjock, A.; Pereira, R. Improved tank test procedures for scaled floating offshore wind turbines. In Proceedings of the International Wind Engineering Conference (IWEC), Hannover, Germany, 3–5 September 2014. [Google Scholar]
  11. Adam, F.; Myland, T.; Dahlhaus, F.; Großmann, J. Scale tests of the GICON®-TLP for wind turbines. In Proceedings of the International Conference on Offshore Mechanics and Arctic Engineering, San Francisco, CA, USA, 8–13 June 2014; Volume 45530, p. V09AT09A011. [Google Scholar]
  12. De Ridder, E.J.; Otto, W.; Zondervan, G.J.; Huijs, F.; Vaz, G. Development of a scaled-down floating wind turbine for offshore basin testing. In Proceedings of the International Conference on Offshore Mechanics and Arctic Engineering, San Francisco, CA, USA, 8–13 June 2014; Volume 45530, p. V09AT09A027. [Google Scholar]
  13. Goupee, A.J.; Fowler, M.J.; Kimball, R.W.; Helder, J.; de Ridder, E.J. Additional wind/wave basin testing of the DeepCwind semi-submersible with a performance-matched wind turbine. In Proceedings of the International Conference on Offshore Mechanics and Arctic Engineering, San Francisco, CA, USA, 8–13 June 2014; Volume 45547, p. V09BT09A026. [Google Scholar]
  14. Yu, W.; Lemmer, F.; Bredmose, H.; Borg, M.; Pegalajar-Jurado, A.; Mikkelsen, R.F.; Larsen, T.S.; Fjelstrup, T.; Lomholt, A.K.; Boehm, L.; et al. The triple spar campaign: Implementation and test of a blade pitch controller on a scaled floating wind turbine model. Energy Procedia 2017, 137, 323–338. [Google Scholar] [CrossRef]
  15. Azcona, J.; Bouchotrouch, F.; González, M.; Garciandía, J.; Munduate, X.; Kelberlau, F.; Nygaard, T.A. Aerodynamic thrust modelling in wave tank tests of offshore floating wind turbines using a ducted fan. In Proceedings of the Journal of Physics: Conference Series; IOP Publishing: Bristol, UK, 2014; Volume 524, p. 012089. [Google Scholar]
  16. Fontanella, A.; Liu, Y.; Azcona, J.; Pires, O.; Bayati, I.; Gueydon, S.; De Ridder, E.J.; Van Wingerden, J.W.; Belloli, M. A hardware-in-the-loop wave-basin scalemodel experiment for the validation of control strategies for floating offshore wind turbines. In Proceedings of the Journal of Physics: Conference Series; IOP Publishing: Bristol, UK, 2020; Volume 1618, p. 032038. [Google Scholar]
  17. Bachynski, E.E.; Chabaud, V.; Sauder, T. Real-time hybrid model testing of floating wind turbines: Sensitivity to limited actuation. Energy Procedia 2015, 80, 2–12. [Google Scholar] [CrossRef]
  18. Hall, M.; Goupee, A.J. Validation of a hybrid modeling approach to floating wind turbine basin testing. Wind Energy 2018, 21, 391–408. [Google Scholar] [CrossRef]
  19. Wen, B.; Liang, Z.; Zhang, H.; Fan, K.; Wang, Y.; Li, D.; Tian, X.; Peng, Z. A multi-drive aerodynamic load simulator for floating wind turbine model tests: Development, test and application. Ocean. Eng. 2023, 286, 115579. [Google Scholar] [CrossRef]
  20. Liu, G.; Jiang, Z.; Zhang, H.; Du, Y.; Tian, X.; Wen, B.; Peng, Z. A novel real-time hybrid testing method for Twin-Rotor Floating Wind Turbines with Single-Point Mooring systems. Ocean. Eng. 2024, 312, 119151. [Google Scholar] [CrossRef]
  21. Zhang, Y.; Zhao, J.; Grabrick, B.; Jacobson, B.; Nelson, A.; Otte, J. Dynamic response of three floaters supporting vertical axis wind turbines due to wind excitation. J. Fluids Struct. 2018, 80, 316–331. [Google Scholar] [CrossRef]
  22. Ikoma, T.; Tan, L.; Moritsu, S.; Aida, Y.; Masuda, K. Motion characteristics of a barge-type floating vertical-axis wind turbine with moonpools. Ocean Eng. 2021, 230, 109006. [Google Scholar] [CrossRef]
  23. Rajeswari, K.; Nallayarasu, S. Experimental and numerical investigation on the suitability of semi-submersible floaters to support vertical axis wind turbine. Ships Offshore Struct. 2021, 17, 1743–1754. [Google Scholar] [CrossRef]
  24. Zheng, H.; Zheng, X.; Lei, Y.; Li, D.; Ci, X. Experimental validation on the dynamic response of a novel floater uniting a vertical-axis wind turbine with a steel fishing cage. Ocean Eng. 2022, 243, 110257. [Google Scholar] [CrossRef]
  25. Deng, W.; Guo, Y.; Liu, L.; Li, Y.; Jiang, Y.; Xie, P. Dynamic response analysis of a floating vertical axis wind turbine with helical blades based on the model test. Ocean Eng. 2023, 273, 113930. [Google Scholar] [CrossRef]
  26. Jiang, Y.; Cheng, Z.; Chen, P.; Chai, W.; Xiao, L. Performance-scaled rotor design method for model testing of floating vertical axis wind turbines in wave basins. Renew. Energy 2023, 219, 119425. [Google Scholar] [CrossRef]
  27. Jiang, Y.; Chen, P.; Wang, S.; Cheng, Z.; Xiao, L. Dynamic responses of a 5?MW semi-submersible floating vertical-axis wind turbine: A model test study in the wave basin. Ocean. Eng. 2024, 296, 117000. [Google Scholar] [CrossRef]
  28. Jiang, Y.; Cheng, Z.; Deng, S.; Chen, P.; Liu, L.; Xiao, L. An experimental study on the strain responses of blades and struts of a 5MW semi-submersible floating vertical-axis wind turbine. Mar. Struct. 2025, 102, 103794. [Google Scholar] [CrossRef]
  29. Cao, Q.; Chen, Y.; Zhang, K.; Zhang, X.; Cheng, X.; Wen, B. Design approach of thrust-matched rotor for basin model tests of floating straight-bladed vertical axis wind turbines. J. Renew. Sustain. Energy 2023, 15, 063308. [Google Scholar] [CrossRef]
  30. Martin, H.R. Development of a Scale Model Wind Turbine for Testing of Offshore Floating Wind Turbine Systems. Master’s Thesis, The University of Maine, Orono, ME, USA, 2011. [Google Scholar]
  31. Madsen, H.; Larsen, T.; Paulsen, U.; Vita, L. Implementation of the actuator cylinder flow model in the HAWC2 code for aeroelastic simulations on vertical axis wind turbines. In Proceedings of the 51st AIAA Aerospace Sciences Meeting Including the New Horizons Forum and Aerospace Exposition, Grapevine, TX, USA, 7–10 January 2013. [Google Scholar]
Figure 1. The basin model tests of vertical−axis floating wind turbines. ((a) Liu et al. Liu et al. [20], (b) Zhang et al. [21], (c) Ikoma et al. [22], (d) Rajeswari and Nallayarasu [23], (e) Zheng et al. [24], (f) Deng et al. [25]).
Jmse 13 01924 g001
Figure 2. The (a) C L and (b) C D characteristics under full−scale and model−scale Reynolds numbers.
Jmse 13 01924 g002
Figure 3. The thrust coefficients of the full−scale rotor and the FSR under different TSRs.
Jmse 13 01924 g003
Figure 4. The comparisons of geometries between NACA0018 airfoil and AG455 airfoils.
Jmse 13 01924 g004
Figure 5. Lift coefficient comparison between AG455 and NACA0018 airfoils at low Reynolds numbers for different angles of attack (AOAs).
Jmse 13 01924 g005
Figure 6. The schematic diagram of the cruciform−arranged rotor system structure.
Jmse 13 01924 g006
Figure 7. Schematic of thrust allocation principle for cruciform−arranged rotor system.
Jmse 13 01924 g007
Figure 8. Conceptual design of offshore floating 10 MW VAWT.
Jmse 13 01924 g008
Figure 9. Comparison of mean thrust coefficients between reconstructed blades and full−scale blades at different TSRs.
Jmse 13 01924 g009
Figure 10. The (a) thrust coefficients and (b) side force coefficients between the reconstructed blades and the full−scale blades at high Reynolds numbers over all azimuth angles under rated operational conditions.
Jmse 13 01924 g010
Figure 11. Target synthesized loads ( F X , F Y , M Z ) of the aerodynamic load simulation system.
Jmse 13 01924 g011
Figure 12. Time histories of the allocated loads for each rotor.
Jmse 13 01924 g012
Figure 13. Statistical analysis of thrust values from the eight rotors.
Jmse 13 01924 g013
Table 1. Main structural parameters of floating 10 MW VAWT.
ParameterFull−ScaleModel−Scale (1:60)
Rated power10 MW/
Configuration3−blade3−blade
Rotor diameter160 m0.65 m
Blade length200 m1.33 m
Blade airfoilNACA0018AG455
Blade chord3.0 m0.056 m
Blade twist−0.6°
Rated wind speed13.2 m/s1.70 m/s
Rated rotor speed9.68 rpm74.98 rpm
Wind speed range3.0−25.0 m/s0.39−3.23 m/s
Rotor speed range2.2−7.97 rad/s17.04−61.74 rad/s
TSR range2.09−4.802.90−4.80
Disclaimer/Publisher’s Note: The statements, opinions and data contained in all publications are solely those of the individual author(s) and contributor(s) and not of MDPI and/or the editor(s). MDPI and/or the editor(s) disclaim responsibility for any injury to people or property resulting from any ideas, methods, instructions or products referred to in the content.