1. Introduction
In recent years, with the rapid development and continuous expansion of marine engineering projects such as oil platforms, submarine pipelines, and offshore wind power, the research, design, and implementation of deep foundations in marine engineering have become increasingly in-depth and refined [
1]. As a key form of deep foundation widely used in marine engineering, the bearing capacity of pile foundations directly determines the overall safety and long-term service stability of the superstructure. Therefore, to ensure that the pile foundation possesses the required design bearing capacity, the importance of pile foundation testing in the construction and acceptance phases of engineering projects has become increasingly important [
2]. Among these techniques, Rapid Load Testing (RLT), as a pile testing method, which is based on the core principle of applying an impact load to the pile head with a duration that is relatively long but significantly shorter than that of traditional static load tests. Through control of the loading rate and waveform, this method ensures that key characteristics—such as the distribution pattern of compressive stress, the relative displacement behavior of various points along the pile, and the soil-pile interaction mechanism— are closely approximate or equivalent to those observed in traditional static load tests [
3]. The Rapid Load Testing technique not only enables a comprehensive and in-depth analysis of the homogeneity of the pile material but also allows for accurate estimation of the actual ultimate bearing capacity and load-settlement behavior of the pile detected under static loading conditions. Consequently, it provides a more scientific, systematic, and holistic evaluation of the vertical bearing capacity of pile foundations [
4]. This enhances the precision and reliability of quality control in pile foundation construction, significantly shortens the evaluation cycle, and thereby improves the overall safety and long-term service reliability of the engineering projects.
During the Rapid Load Testing process, in addition to acquiring acceleration and force signals at the pile head, practical engineering applications also require precise measurement of the settlement data at the pile head throughout the entire loading process to plot a complete load–displacement (P-S) curve and conduct in-depth analysis, which serves as the fundamental basis for evaluating the bearing capacity of the pile foundation. However, due to the distinctive nature condition of the marine environment—characterized by significant tidal fluctuations and continuous dynamic wave actions—the settlement measurement in Rapid Load Testing for pile foundations faces considerable challenges. Pile foundation testing is greatly constrained by site conditions [
5]. For example, water movement around the pile makes it difficult to establish a stable measurement reference; in some cases, it is even impossible to identify a suitable fixed reference point for settlement measurement in such dynamic conditions [
6]. Consequently, traditional non-contact remote measurement devices (total stations and laser rangefinders) often struggle to directly and reliably capture real-time displacement changes at the pile head [
7].
In response to this critical challenge in marine engineering practice, this study proposes and investigates an alternative approach. Specifically, it aims to indirectly measure and reconstruct the real time settlement at the pile head by performing double integration of the acquired acceleration signals in the time domain, utilizing high-precision accelerometers. However, during the service and testing of marine pile foundations, continuous impact from tidal currents and wave actions results in acceleration signals—obtained via Rapid Load Testing—that are highly complex and rich in vibrational components. These signals not only include the acceleration of the pile’s rigid-body motion but also inevitably incorporate various elastic and plastic vibrational by the impact loading (bending and longitudinal vibrations of the pile), ever-present mechanical and fluid noise interference in the testing environment (wave slapping, platform vibration, and equipment noise) [
8], as well as complex dynamic disturbances caused by the propagation, reflection, and attenuation of stress waves within the pile [
9]. In most practical engineering applications, research on Rapid Load Testing primarily focuses on the rigid-body acceleration component that reflects the overall response of the pile-soil system, while other vibrational components are typically treated as disturbance that must be suppressed or separated [
10].
Signal perception plays a crucial role in the signal analysis of pile foundation detection. The occurrence of acceleration signals is unpredictable and requires signal perception to receive and capture them. By identifying the regularity of the signals, the signal waveforms can be synchronized and displayed stably [
11]. At high sampling rates, a large amount of data is generated within a unit time. Due to the limitations of the storage space and processing speed of digital systems, only a portion of the data can be stored and analyzed, while the data that cannot be processed in time will be forcibly discarded. The actual effective observation time is very short, and it is easy to miss occasional transient signals [
12]. To improve the observation efficiency, it is necessary to rely on signal perception algorithms to locate key signals. To adapt to different working scenarios and improve sampling accuracy, it is necessary to develop an adaptive sampling strategy. The adaptive sampling strategy will adjust the filters, mixers, and sampling rates at the front end of the acquisition system according to the characteristics of the signals to limit the bandwidth and reduce noise components, thereby improving accuracy and test reliability. To achieve adaptive sampling, it is necessary to perceive the signal characteristics before formal sampling. The results of signal perception can more actively mobilize the corresponding resources in the acquisition system to improve the efficiency of test resources, reduce input noise, and enhance the stray dynamic range of sampling [
13]. In high-speed signal sampling, occasional abnormal signals often have a significant impact on the performance of the entire system. Signal perception plays a core role in detecting occasional abnormal signals. Accurately capturing abnormal signals is of great significance for improving fault diagnosis efficiency and enhancing system performance [
14]. Segmented storage technology only stores the key waveform segments to save the memory capacity overhead in the system. Its function is entirely dependent on the application of signal sensing methods to identify the key waveform segments. Therefore, to achieve signal characteristic perception, scholars have conducted research from multiple perspectives on the perception methods. The most fundamental idea is to adopt triggering technology. The signal sensing method based on time-domain characteristics triggering utilizes features such as signal amplitude, edges, and pulse width [
14,
15]. As the signal forms become increasingly complex, to meet the detection requirements of different time-domain characteristic signals, researchers have proposed the concept of advanced triggering, that is, combining multiple time-domain feature types of the signal in signal numerical simulation to make the signal perception method more flexible and diverse. Another triggering method is frequency-domain triggering. This method can be applied to scenarios such as spectrum allocation in monitoring systems and spectrum management, and the implemented triggering methods include frequency edge triggering, frequency masking triggering, and digital fluorescence triggering. Among them, frequency edge triggering determines the frequency change situation of the signal by using the rate of phase change, and frequency template triggering searches and locates the signal waveform that matches the user-defined spectrum characteristics, digital fluorescence triggering is a new type of spectral analysis triggering algorithm for capturing transient signals [
15].
In addressing the mixed acceleration signals acquired through Rapid Load Testing under various complex working conditions, conventional signal processing techniques—such as frequency domain bandpass filtering or wavelet threshold denoising—often require repeated manual adjustments by experienced technicians [
16]. These methods rely on spectral characteristics and empirical judgments to determine appropriate filter cutoff frequencies or noise threshold parameters before applying necessary filtering to the raw signals. Such an approach is not only cumbersome, time-consuming, and inefficient but also introduces significant subjective human judgment, leading to considerable variability in the extracted effective signals (rigid-body acceleration) among different operators. This compromises the reproducibility and objectivity of the results [
17]. Particularly for complex marine engineering signals exhibiting strong non-stationary and nonlinear characteristics, these traditional analysis methods—often based on steady-state assumptions or global optimization—struggle to accurately capture instantaneous dynamic changes or subtle local features. As a result, they limit the depth of pile response analysis and the accuracy of bearing capacity assessments [
18].
The primary objective of this study is to conduct an in-depth analysis and enhancement of the signal interpretation methodology in Rapid Load Testing (RLT) for pile foundation assessment. Specifically, this study introduces and implements Variational Mode Decomposition (VMD) [
19] to optimize and refine the processing of acceleration signals acquired during RLT. This technique adaptively and effectively separates and filters out noise components and extraneous vibrational modes, significantly improving the signal-to-noise ratio and the fidelity of essential signal elements, thereby enhancing the accuracy of pile bearing capacity evaluations. In response to the critical practical challenge in marine engineering—where direct measurement of pile head settlement is often impeded by harsh environmental conditions—this study proposes an innovative displacement inversion solution. The key point is the application of the theoretical assumption that the velocity of the pile head should be zero both before impact loading (initial static state) and after full unloading (return to static state). The baseline of the integrated original velocity and displacement signals was corrected under physical constraints to suppress cumulative errors and baseline drift during the integration process. To operationalize this framework, an adaptive signal processing method based on VMD was developed using MATLAB. This method enables intelligent signal decomposition, extraction of rigid-body motion modes, and physical constraint-integrated displacement reconstruction. It not only facilitates efficient and automated processing of complex signals but also significantly improves the accuracy and engineering practicality of inverted settlement displacement.
2. Principles of Variational Mode Decomposition
The integration of traditional dynamic acceleration signals can be categorized into hardware-based and software-based methods. Hardware integration primarily utilizes integration circuits, which is often unsuitable for measuring signals containing complex frequency components. In contrast, software integration, implemented through computational algorithms, is further divided into time domain and frequency domain integration techniques [
20].
Time domain integration [
21], based on the fundamental principles of kinematics, enables the conversion of measured acceleration signals
a(
t) into velocity and displacement signals through integration operations. Let the acquired acceleration data be denoted as
a(
t); the velocity expression after a single integration is given by
The displacement expression obtained through double time domain integration is expressed as
In the equation, v0 and s0 denote the initial velocity and initial displacement, respectively.
However, in practical engineering measurements, acceleration signals are often subject to various interfering factors, leading to the inclusion of a direct-current offset error
δ. Thus, the measured acceleration signal can be expressed as
Integrating the above acceleration signal once yields the expression for the velocity signal as follows:
At this stage, the error term δ becomes accumulated and amplified during the integration process. Furthermore, due to the uncertainty of the initial integration value, a linear error trend term δt + ε is introduced into the velocity signal.
Following a second integration, the displacement expression can be written as
In this formula, ‘c’ represents the arbitrary constant of the indefinite integral. The integration errors are progressively amplified during the computation process, leading to linear drift in the velocity signal and a quadratic drift trend in the displacement signal. To eliminate such errors, a polynomial fitting approach can be employed to extract the first and second-order error components, respectively, thereby achieving error correction by subtracting the fitted values.
Based on the previous research results of frequency-domain integration [
22], expresses the acceleration signal component at any frequency
ω as
In the equation, a(t) denotes the Fourier component corresponding to frequency ω, and A represents the amplitude coefficient of this frequency component.
By means of frequency domain integration, the acceleration component can be converted into the velocity component as follows:
Through further integration operations, the displacement component expression can be derived as follows:
The computational procedure of this method comprises three key steps: First, a forward Fourier transform is applied to the original acceleration signal to convert it into the frequency domain. Subsequently, in the frequency domain, the spectral components of the acceleration are divided by (−ω2) to equivalently perform double integration. Finally, an inverse Fourier transform is applied to convert the result back to the time domain, yielding the displacement signal. By operating in the frequency domain, this method effectively avoids the error accumulation issues inherent in time domain integration.
The time domain integration trend term correction method based on polynomial fitting demonstrates significant effectiveness in mitigating linear errors induced by sensor zero drift. By assuming the systematic error δ to be a constant value, this approach effectively eliminates integration bias resulting from sensor zero drift. However, due to the inherent limitation of its constant-error assumption, the corrective efficacy diminishes notably when the test signal contains trend components caused by random noise. Furthermore, inappropriate application of polynomial fitting for trend removal may adversely affect the signal baseline and introduce additional errors. For instance, eliminating trend terms from displacement signals obtained via double time domain integration may remove the authentic terminal displacement.
Frequency domain integration effectively circumvents the issue of error accumulation during double integration by operating in the frequency domain, demonstrating higher stability compared to time domain integration. However, the Fourier transform process in this method introduces spectral leakage, causing a portion of the signal energy to disperse into adjacent frequency components. Moreover, for low frequency signals, even minor measurement errors can be amplified significantly during processing, making the low frequency region a critical factor which affect the integration accuracy. Direct application of high-pass filtering, while removing low-frequency noise, also eliminates meaningful low-frequency signal components—effectively forcing the final displacement to zero. For Rapid Load Testing, where permanent settlement is expected, deriving displacement signals through frequency domain integration of acceleration data is therefore considered unsuitable [
22].
The Variational Mode Decomposition (VMD) proposed by Dragomiretskiy and Zosso [
19] represents an advanced signal processing technique. This method decomposes the original signal into a set of modal components with limited bandwidth by constructing and solving a variational problem through an iterative optimization strategy. Its theoretical foundation lies in the assumption that any complex signal can be expressed as a superposition of multiple sub-signals, each characterized by a specific center frequency and finite bandwidth.
The core of the VMD method lies in decomposing the input signal into several Intrinsic Mode Functions (IMFs), each is capable of characterizing distinct time-frequency properties within the signal. Compared to conventional approaches, this technique demonstrates significant advantages in processing nonlinear and non-stationary vibration signals, primarily by effectively suppressing modal aliasing and substantially reducing end effects. Owing to these strengths, VMD has been widely adopted in fields such as engineering vibration analysis.
The Variational Mode Decomposition (VMD) method demonstrates significant theoretical innovation and practical value in the field of signal processing. Based on a variational optimization framework, this approach achieves effective signal decomposition by formulating and solving a constrained optimization problem. Its theoretical origins can be traced back to classical Wiener filtering theory, while also incorporating key techniques such as the Hilbert transform and analytic signal representation. The implementation process comprises three key steps: determining the center frequencies and bandwidth constraints of individual modal components, identifying effective constituents in the frequency domain, and ultimately extracting physically meaningful intrinsic mode functions.
From an algorithmic implementation perspective, the solution process of Variational Mode Decomposition (VMD) can be decomposed into two primary phases: the mathematical formulation of the variational problem and its optimization-based solution [
23]. This procedure adheres to two fundamental constraints: the aggregate bandwidth of the center frequencies of all modal components must be minimized, and the linear combination of all modal components must exactly equal the original input signal [
24].
These constraints guarantee the reliability and accuracy of the decomposition results. As an adaptive signal decomposition technique, VMD effectively represents complex signals as a linear superposition of multiple Intrinsic Mode Functions (IMFs), thereby enabling the precise extraction of local time-frequency characteristics embedded within the signal.
In contrast to conventional methods, VMD utilizes a fully non-recursive variational framework and dynamically adjusts the number of modes and parameter configurations through an adaptive mechanism. During the solution process, it automatically optimizes the center frequencies and bandwidth parameters of each mode, effectively addressing issues such as mode mixing and end effects inherent in Empirical Mode Decomposition (EMD). Benefiting from its solid mathematical foundation, VMD demonstrates outstanding performance in processing non-stationary time series, enabling the decomposition of complex signals into multiple sub-sequences that exhibit relative stability in frequency scaling.
In terms of mathematical representation, VMD imposes stricter constraints on the definition of an Intrinsic Mode Function (IMF) compared to conventional methods [
25,
26]. Specifically, each IMF is defined as an amplitude-modulated and frequency-modulated (AM-FM) signal, which can be mathematically expressed as
where the phase function
ϕk(
t) is a non-decreasing function, satisfying
ϕ′
k(
t) ≥ 0; the envelope amplitude
Ak(
t) ≥ 0, and its rate of change is much slower than that of the phase
ϕk(
t).
Under the premise of a real signal, its analytic signal can be expressed as
where H denotes the Hilbert transform of the signal, and its transfer function can be expressed as
The introduction of the analytic signal concept significantly enhances the characterization performance of signals. For a single Intrinsic Mode Function (IMF), its corresponding analytic signal can be expressed as
The mathematical principle of VMD can be formulated as the following optimization problem:
For a given input signal
x(
t), VMD aims to identify a set of K IMFs and a corresponding residual component
r(
t). These components satisfy
To determine the extremum of the variational mode functions, specifically to minimize the aggregate bandwidth of the center frequencies of all intrinsic mode functions, the method proposes an optimization problem aimed at minimizing the following cost function:
where
uk represents each IMF order and
ωk denotes the corresponding center frequency of each IMF. According to the fundamental principles of the VMD algorithm, the linear superposed result of all decomposed IMFs must strictly equal the original input signal. Each IMF component exhibits limited bandwidth and possesses a well-defined center frequency, and the sum of the bandwidths of all IMFs is minimized.
From the perspective of algorithmic principles, the core optimization objective of VMD is to minimize a specific objective function that simultaneously measures the smoothness of each IMF and the orthogonality among different IMFs. From a time-frequency analysis standpoint, this optimization process can be analogized to a Wiener filtering procedure operating in the time-frequency domain. The implementation workflow of the algorithm can be summarized as follows:
Determine the initial value of modes K and the penalty factor α, the initial value of k is generally related to the number of main frequencies, and the initial value of the penalty factor α is set to be consistent with the sampling data;
Solve for the optimal set of IMFs under constraints of smoothness and orthogonality; Dynamically optimize K and α until convergence criteria are met;
Obtain the final IMF components and the residual signal.
This iterative optimization process involves cyclically updating each IMF and its associated center frequency parameters until predefined convergence criteria are met, ultimately achieving effective signal decomposition. Throughout the computation, the algorithm dynamically adjusts two critical parameters—the penalty factor α and the number of modes K—to strike an optimal balance between decomposition accuracy and computational efficiency. Through this procedure, VMD enables efficient modal decomposition of the input signal, yielding physically interpretable IMF components and extracting multifrequency features embedded in the data accurately. While preserving the essential information of the original signal, the method effectively suppresses noise interference. These characteristics demonstrate the outstanding performance of VMD in the field of signal denoising.
Due to its exceptional decomposition capability for non-stationary and multi-component signals, the application of the VMD method in signal processing can significantly improve the accuracy of analytical results while markedly enhancing the robustness of the algorithm. In contrast, within the measured acceleration signals from Rapid Load Testing, the vibrational response of the pile, stress wave propagation effects and various types of interference noise are predominantly concentrated in the high-frequency range, whereas the rigid-body acceleration of the pile manifests as a low-frequency signal. After decomposing the measured signal via VMD to obtain IMF components, adaptively extracting the rigid-body acceleration signal of the pile requires an effective analytical method capable of identifying and distinguishing each IMF order, thereby achieving reliable separation between meaningful signal components and noise.
Boudraa and Cexus [
27] proposed a significant theoretical hypothesis based on the distribution patterns of IMF components in the frequency domain: within the ordered IMF sequence obtained from decomposition, there necessarily exists a critical component that components below this order primarily consist of noise, while those above it are dominated by meaningful signal content. This leads to a discrimination method based on consecutive mean square error. The mathematical essence of this approach lies in determining the optimal estimation of the original signal by calculating the mean square error between successively reconstructed signals. The method posits that a noise-contaminated test signal
y(
t) can be expressed as
where
x(
t) represents the desired effective signal, and
n(
t) denotes the noise interference. After decomposing the test signal into a series of IMF orders and a residual term, the low-frequency components beyond the
k-th order are superimposed and reconstructed to estimate the effective signal, expressed as
where
denotes the reconstruction of the low-frequency portion of the signal, which also is the estimation of the effective signal
x(
t). To obtain the optimal estimation of the effective signal, the Consecutive Mean Square Error (CMSE) between two successively reconstructed signals is computed as follows:
Equation (17) also reflects the energy distribution characteristics of the k-th order IMF component. In the actual detection of pile foundation rapid loading method, the detection time is relatively short (about 100 ms), so the amount of data is quantitative. Although the test data in the rapid loading method is limited, the detection data of the rapid loading method is generated in real time during the detection process. In theory, we only need to compare the new data with the current minimum value each time it arrives. If it is smaller, update the minimum value. In MATLAB, we can use the data stream minimum tracker to perform the minimum value determination. Therefore, it is feasible to obtain the global minimum value for a limited number of data.
By calculating the mean square error between consecutive reconstructed signals, the optimal estimate of the effective signal is achieved when this error value reaches the global minimum. The corresponding IMF component at this point can thus be regarded as the demarcation point between high-frequency noise interference and low-frequency effective signal. During signal processing, IMF components before this demarcation point can be discarded as noise, while subsequent components are retained as effective low-frequency elements for signal reconstruction. This approach enables optimal extraction of meaningful information from the original signal.
Given that Rapid Load Testing induces permanent settlement in the pile, frequency-domain integration—which inherently forces the final displacement to zero—is unsuitable for this scenario [
28,
29]. Consequently, time domain integration should be applied to the acceleration signal reconstructed via VMD to derive the displacement. Under the assumption that the pile head velocity is zero both before loading and after unloading, the reconstructed signal is first adjusted by subtracting its mean value to eliminate the direct current offset. The resulting signal is then integrated once in the time domain to obtain the velocity, which is subsequently linearly corrected based on the aforementioned assumption. Finally, the corrected velocity signal is integrated again in the time domain to yield the displacement signal.
3. Signal Simulation and Analysis
In Rapid Load Testing, the equipment significantly extends the duration of the impact force applied to the pile head, thereby enlarging the width of the force pulse [
2]. This ensures that all sections of the pile exhibit similar settlement behavior, and characteristics such as stress distribution along the pile and relative displacements of mass points approximate those observed in static load tests. Specifically, the Rapid Load Testing system represents a quasi-static testing approach that requires only 5% to 10% of the load used in conventional static load tests while achieving equivalent pile detection capacity. It operates under accelerations of 10 g to 25 g, with load-holding durations ranging from 100 ms to 800 ms. For signal simulation purposes, the sampling frequency is set to
fs = 1000 Hz. The vibrational acceleration signal has an amplitude of 5 m/s
2 and a frequency of 2.5 Hz, superimposed with a direct current component of 0.1 m/s
2 and random noise:
In the formula, rand() is a function used to generate random numbers. Assuming that v(0) = 0 and s(0) = 0, substituting the Formula (18) at
t = 0 into Formulas (1) and (2) will yield
Implement using MATLAB R2022a simulation.
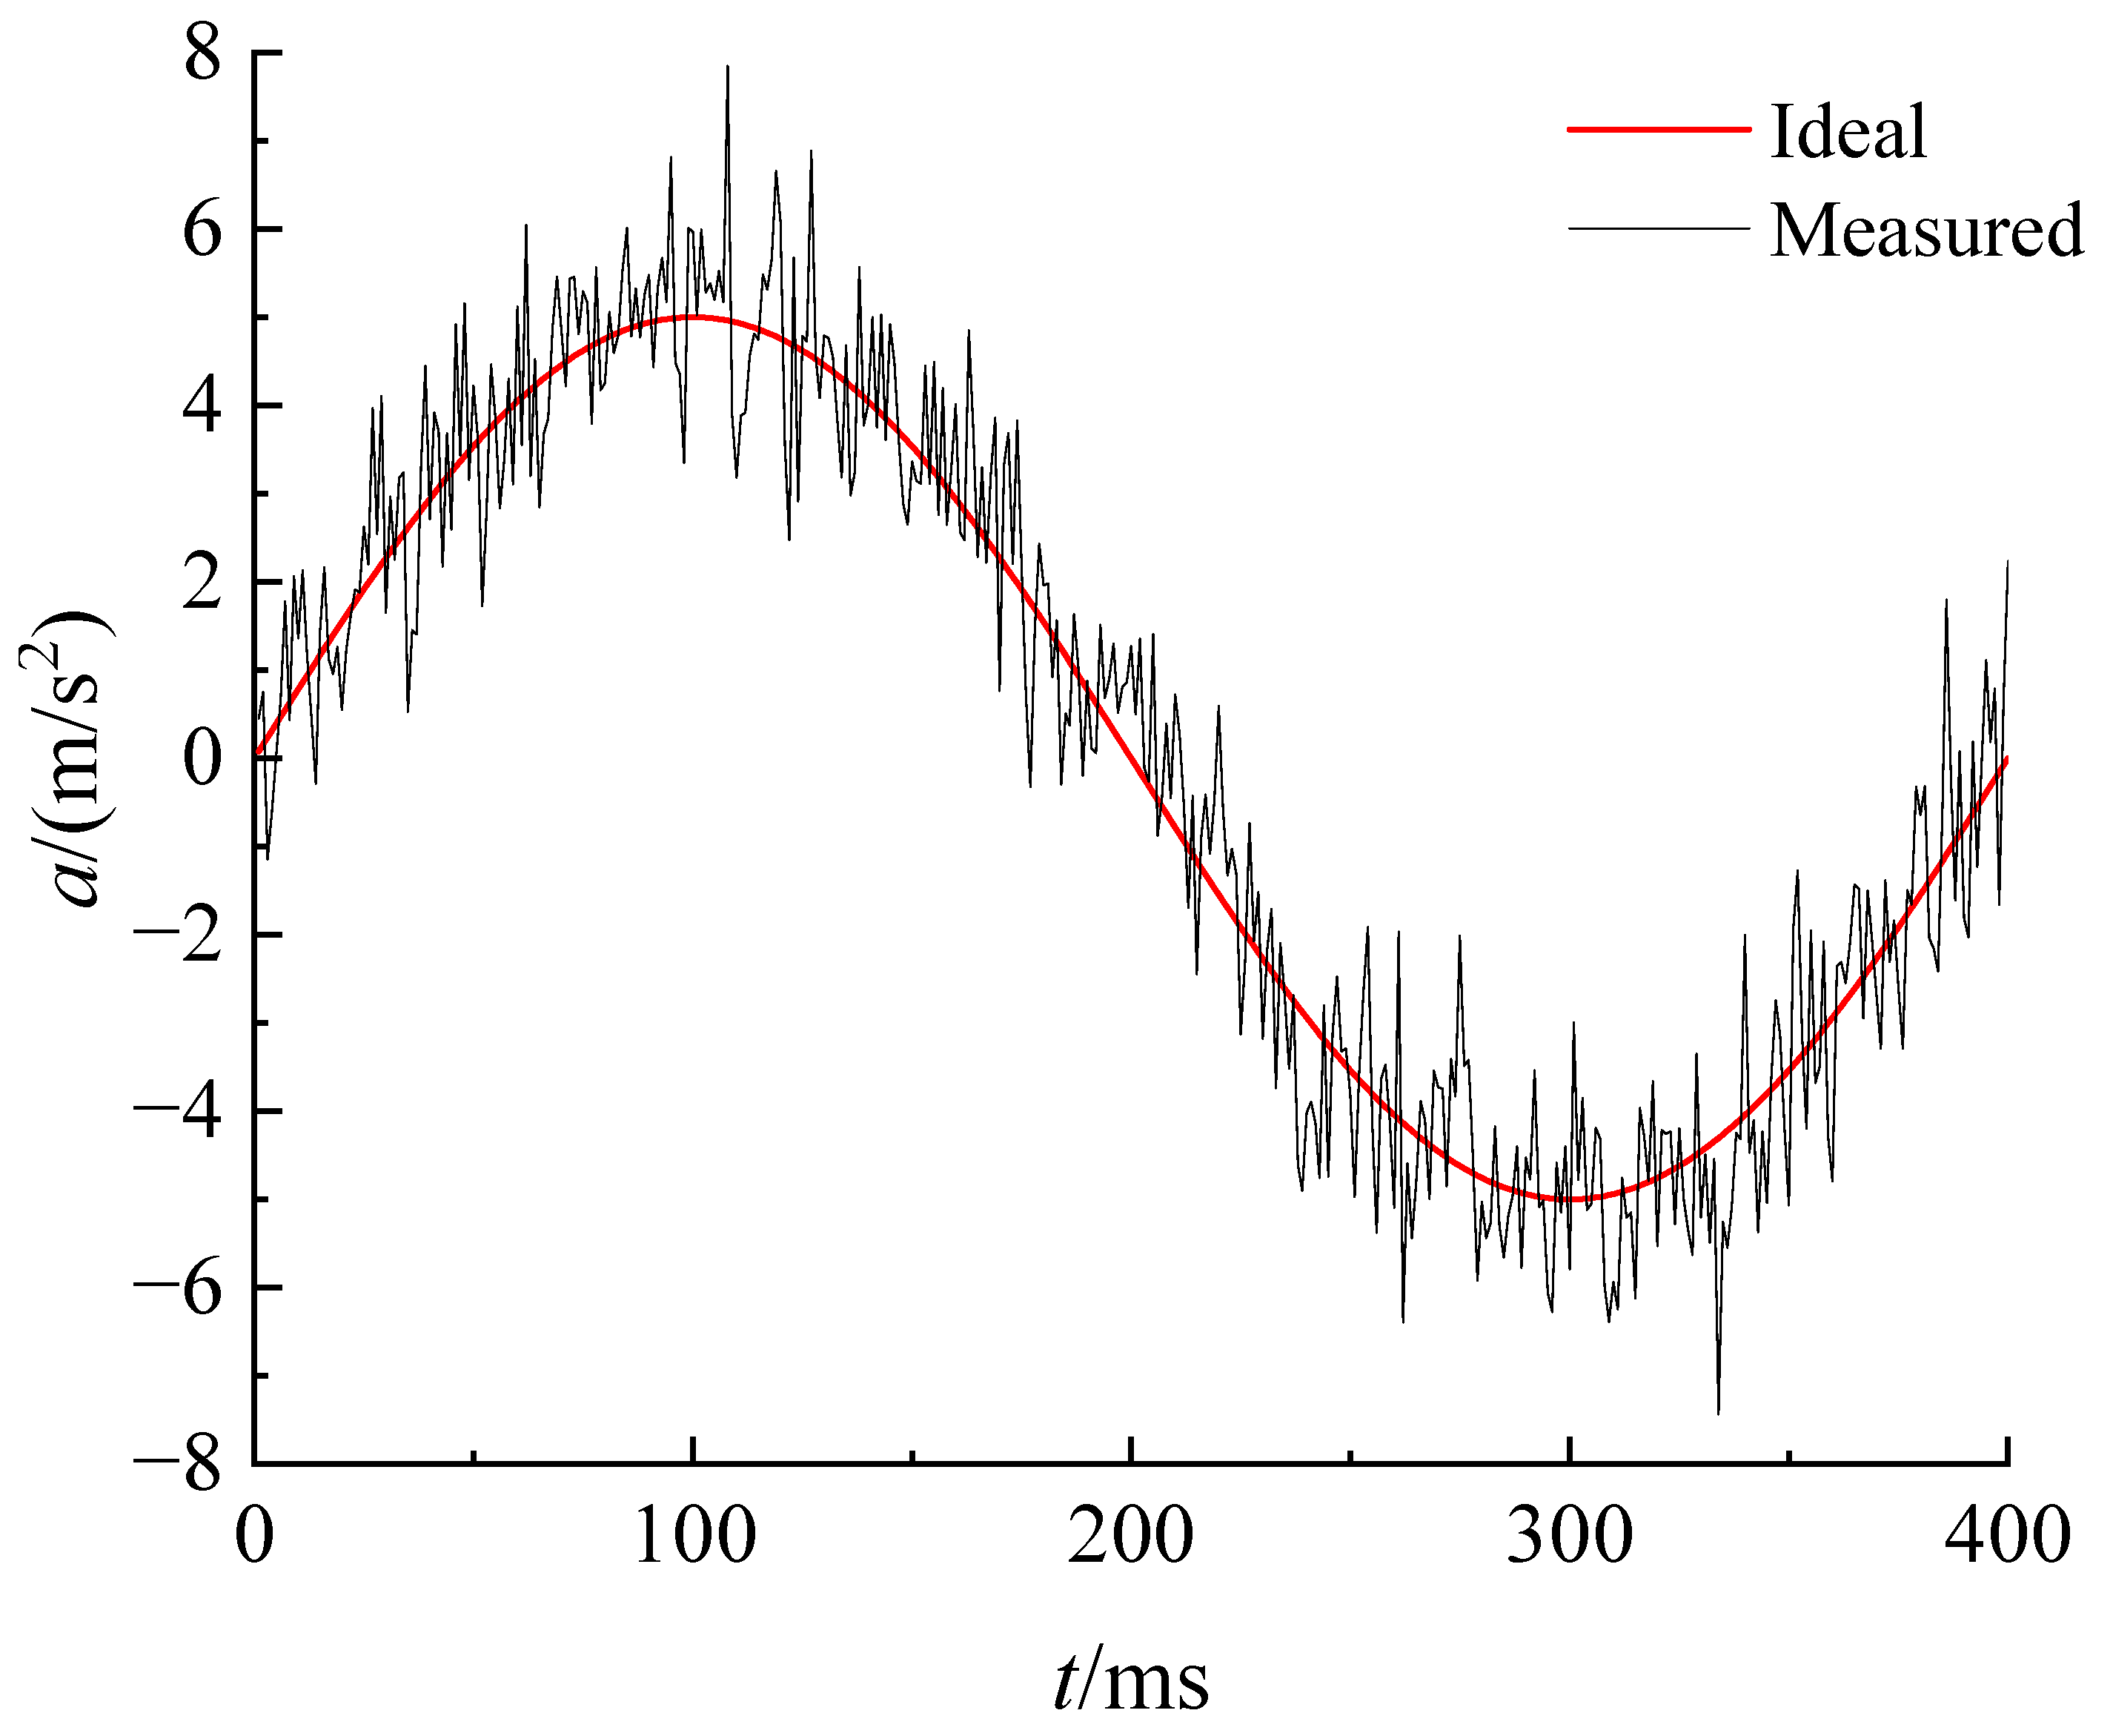
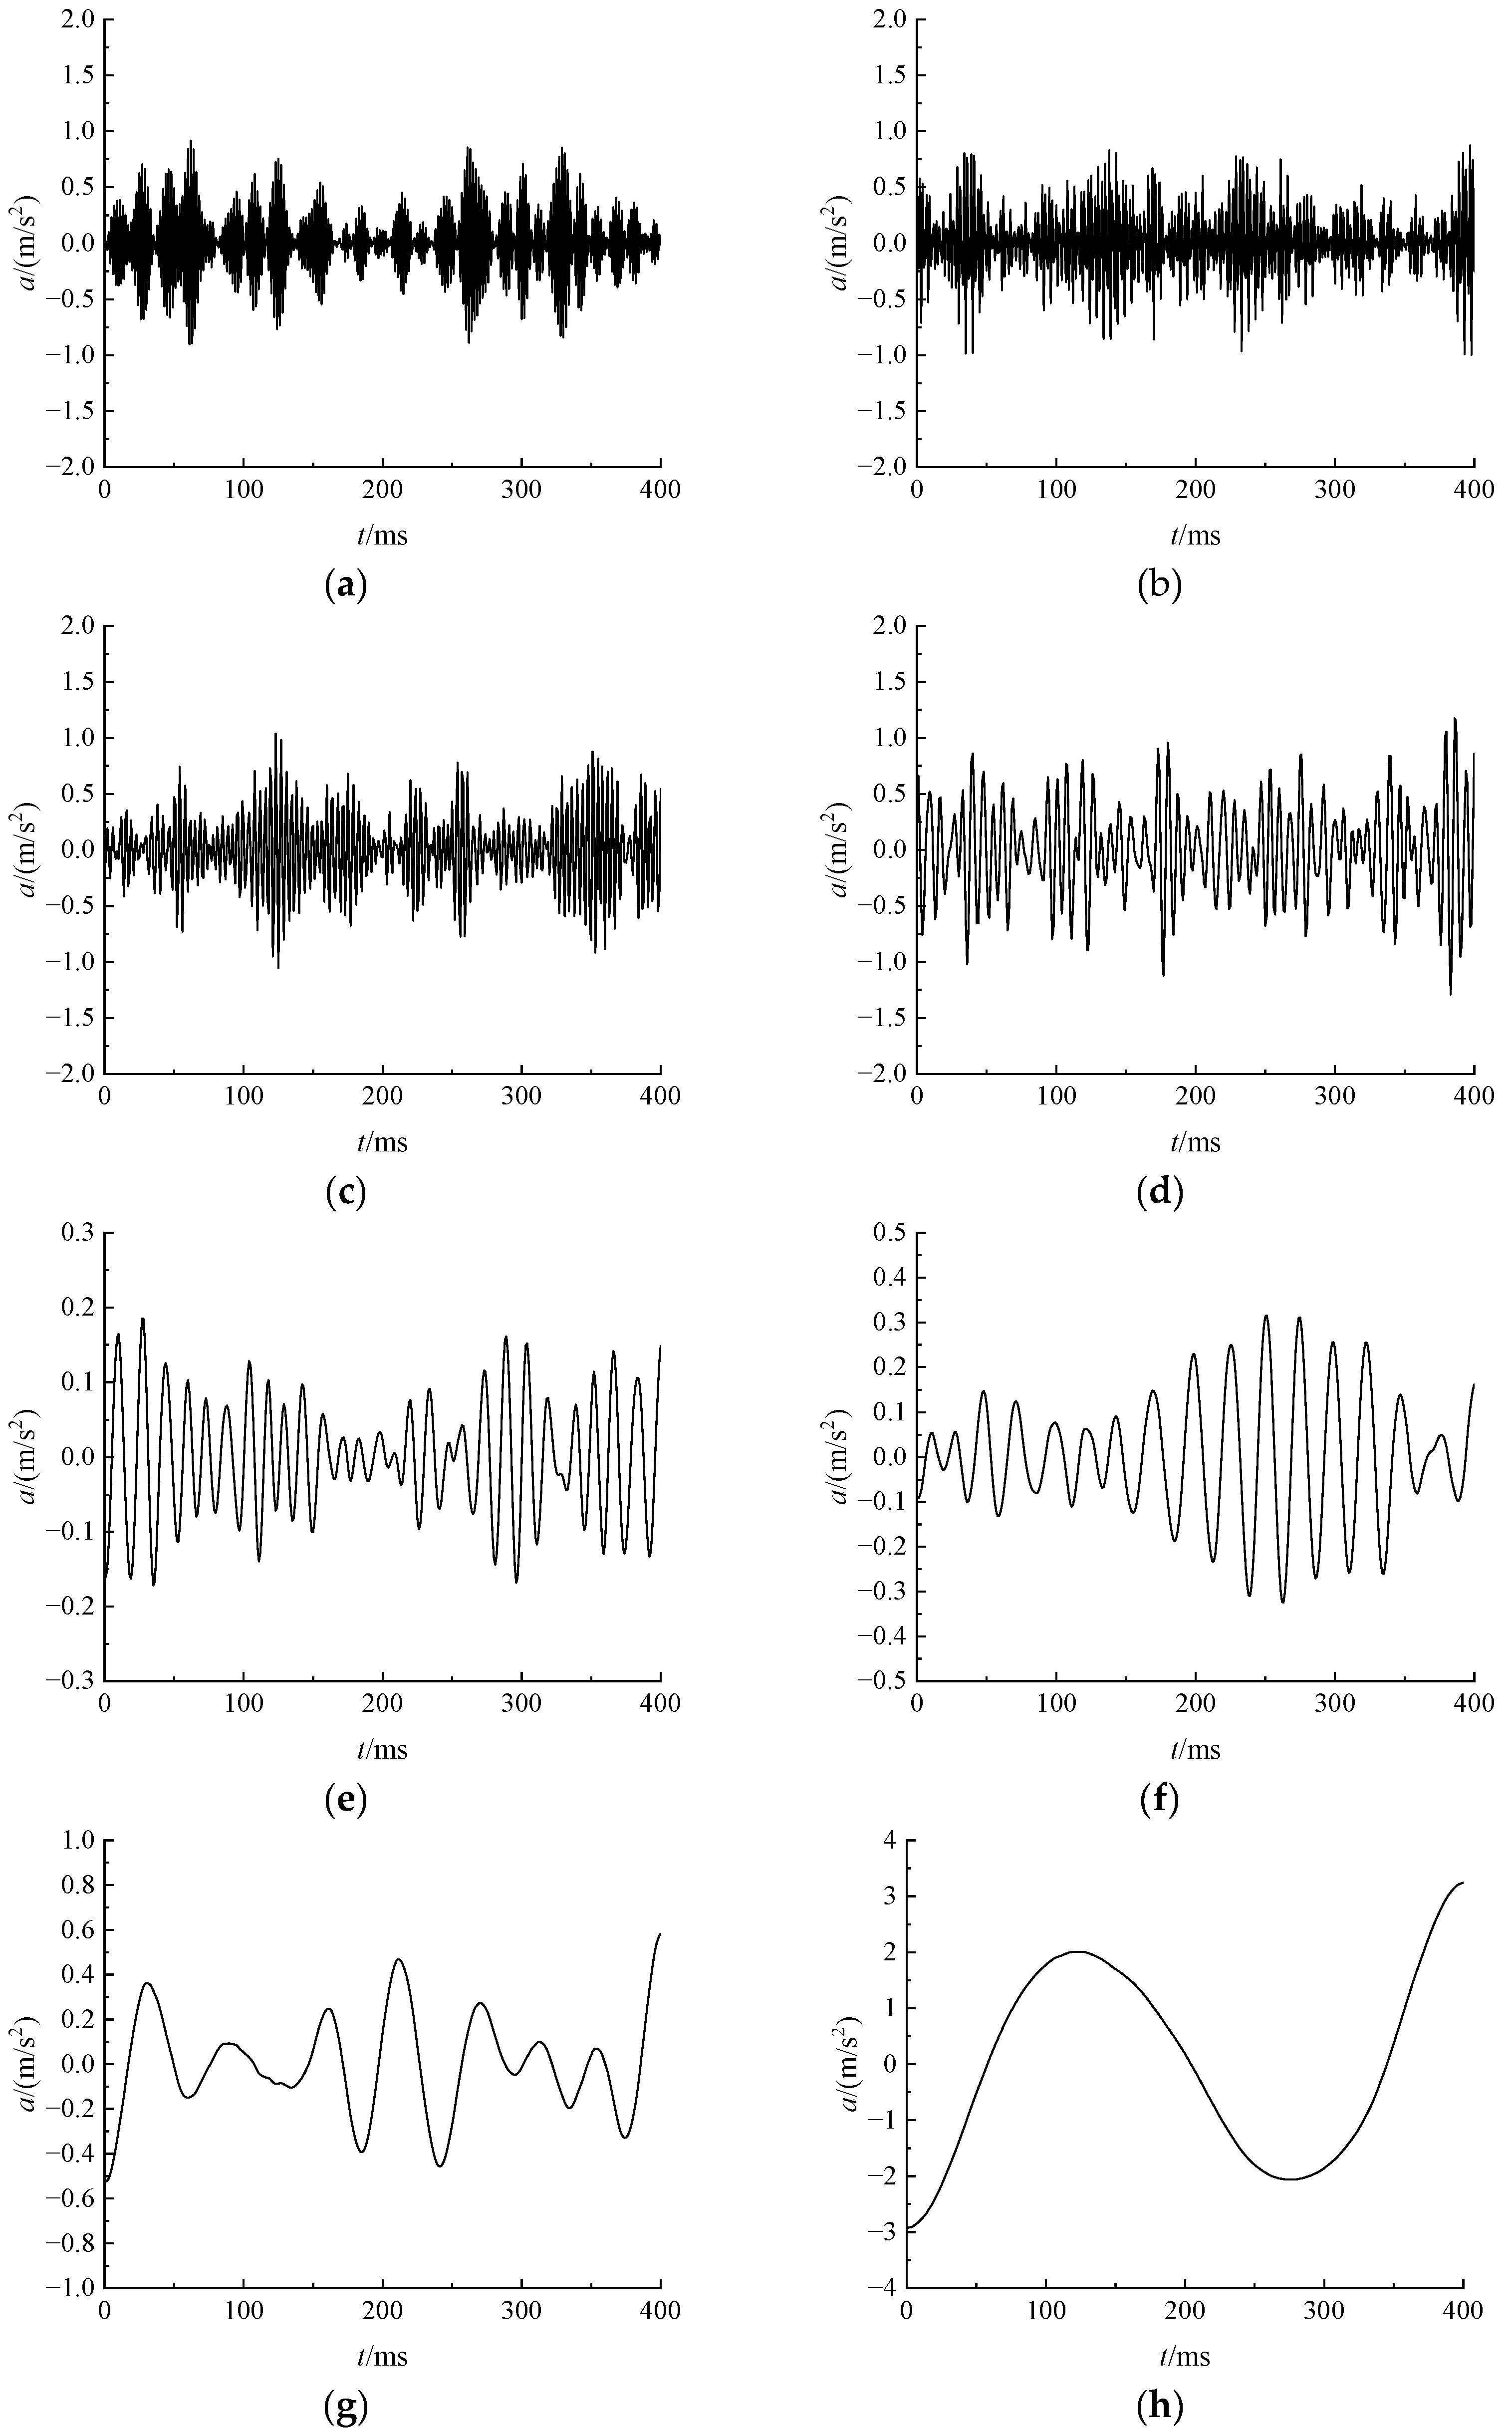
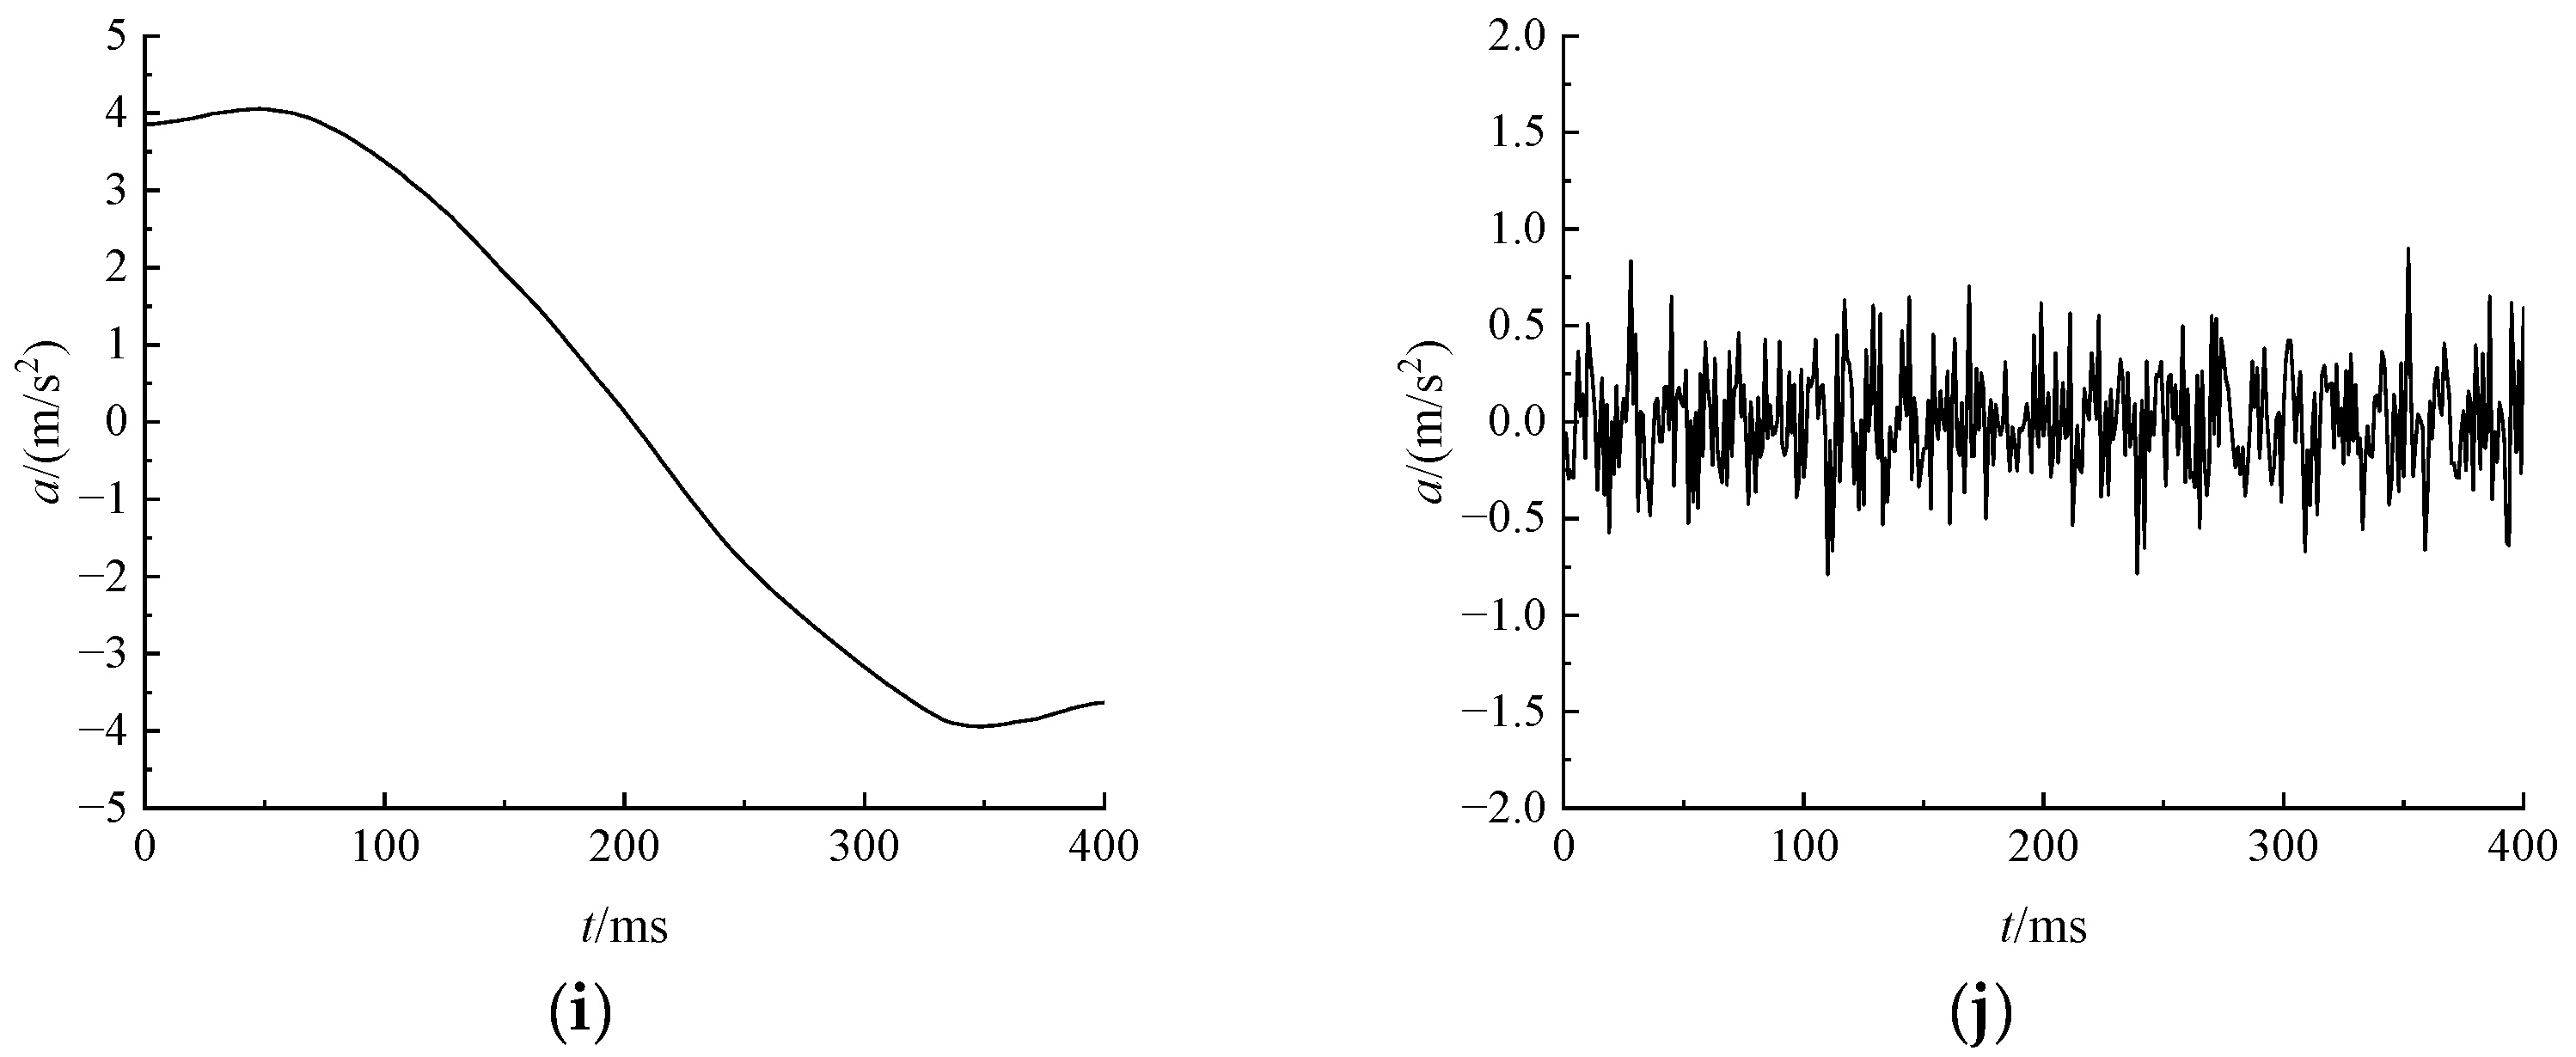
Figure 1 displays the vibration acceleration signal contaminated by direct current offset and random noise. The waveform exhibits both low-frequency drift components and high-frequency random disturbances, characterized by typical non-stationary features. The sampled signal was decomposed using Variational Mode Decomposition (VMD), yielding nine Intrinsic Mode Function (IMF) orders and one residual term. The relevant results are illustrated in
Figure 2.
As shown in
Figure 2, each order of IMF components exhibits a clear transition from high to low frequencies. The 9th order IMF component belongs to the category of low-frequency effective signals, capable of reflecting the underlying trend of the original signal to a certain extent. However, it does not represent the complete effective signal and must be superimposed with several preceding IMF components to reconstruct the full meaningful content. In contrast, the residual term consists of high-frequency noise and should be discarded during signal reconstruction. The entire VMD process progressively sieves out high-frequency components from the signal to extract its intrinsic trend.
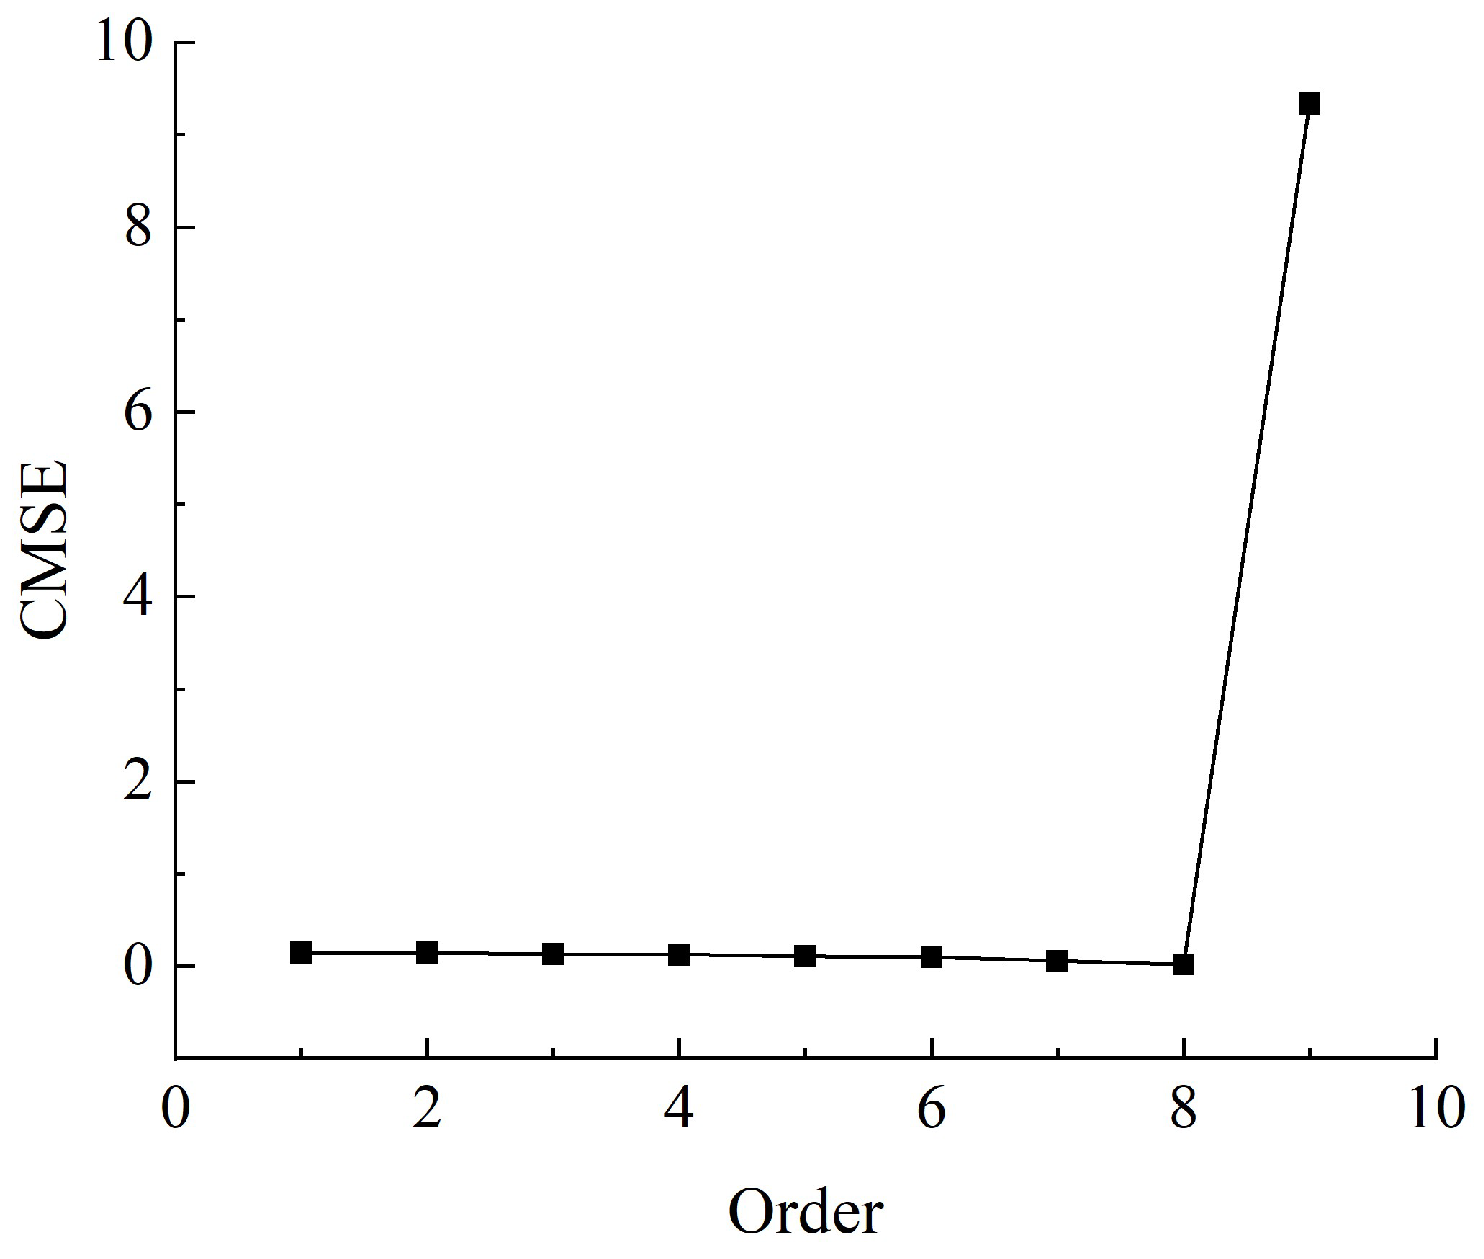
After decomposing the signal into multiple IMF components via Variational Mode Decomposition (VMD), the Consecutive Mean Square Error (CMSE) method, as defined in Equation (17), was applied to determine the demarcation point between effective signal components and irrelevant noise. The resulting variation curve of CMSE values is illustrated in
Figure 3. As shown in
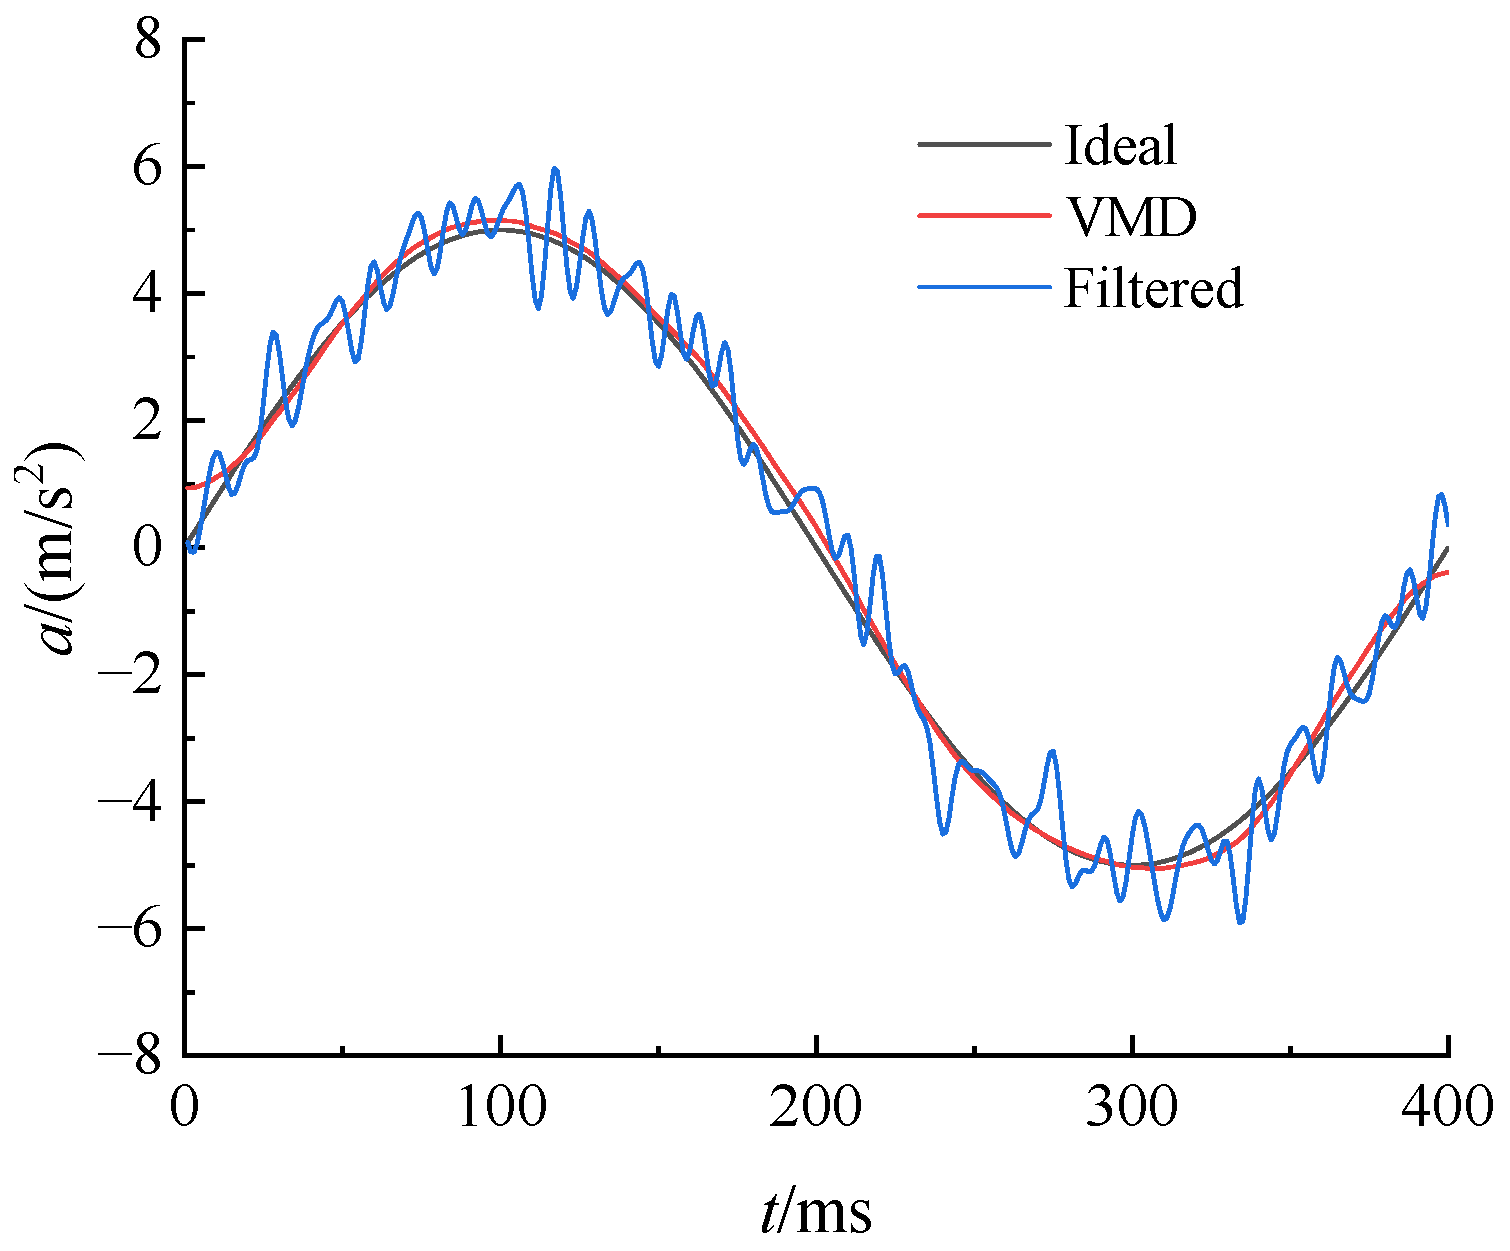
Figure 3, the minimum value of the consecutive mean square error occurs at the 8th order IMF. According to the above theoretical framework, noise and other irrelevant interference are primarily concentrated within the first seven IMF components, while components starting from the 8th order are dominated by meaningful signal content. Superimposing the low-frequency IMF components, including the 8th order and beyond, yields the reconstructed signal which is depicted in
Figure 4. Compared to the filtered signal, the reconstructed version contains almost no high-frequency noise and accurately captures the underlying trend of the effective signal.
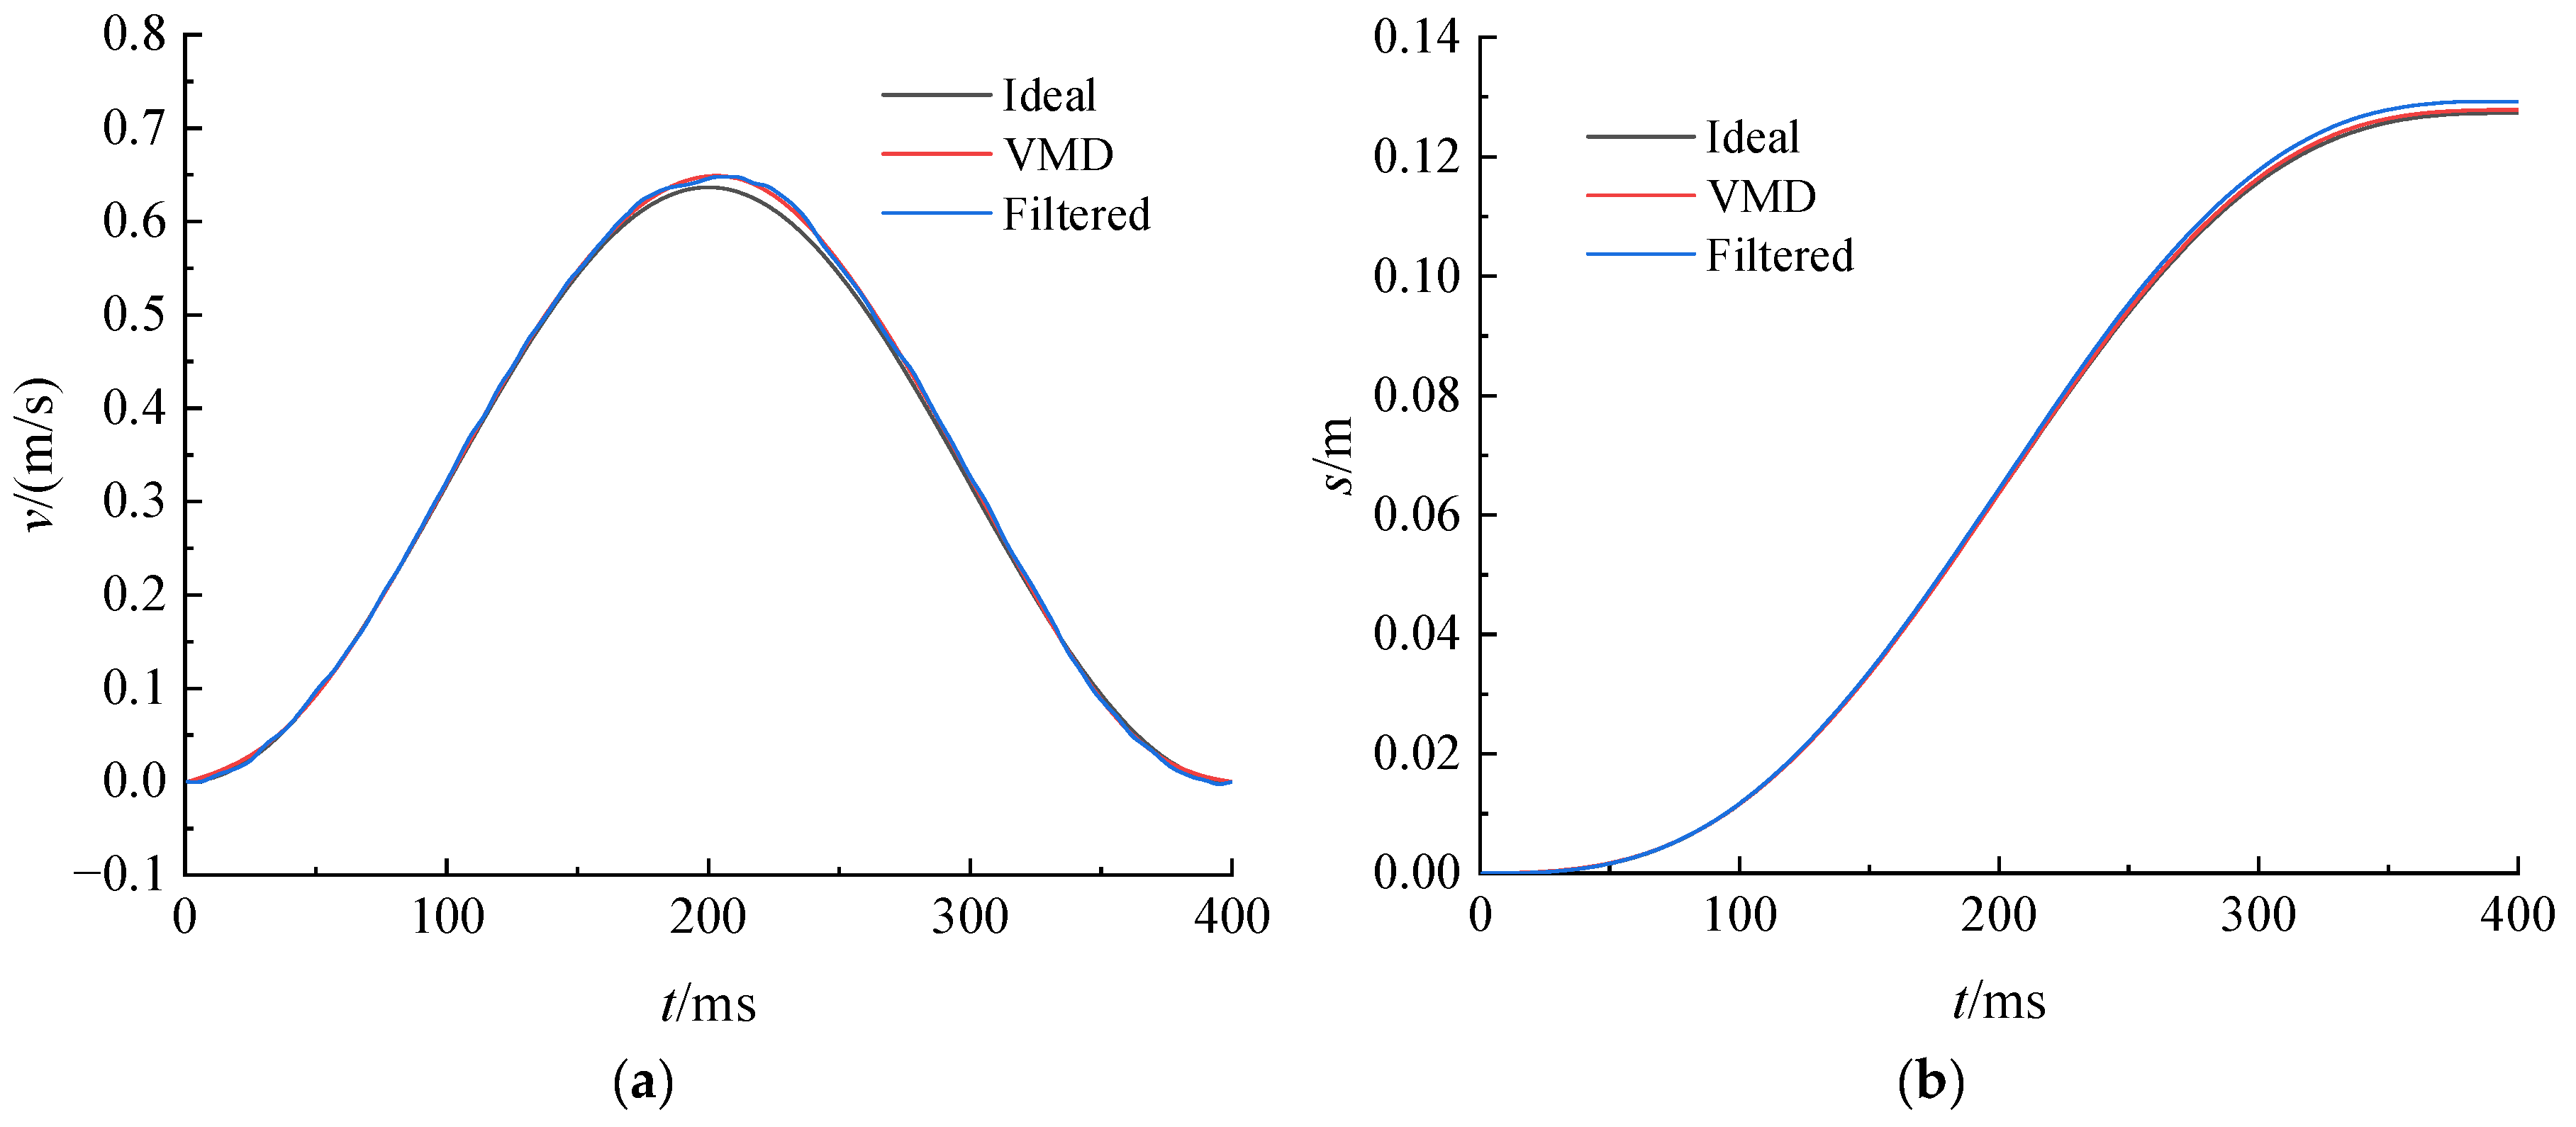
In this study, a systematic comparative analysis was conducted between the VMD-reconstructed signal and the conventionally filtered signal using time domain integration, aiming to evaluate the precision differences between the two signal processing techniques. Time domain integration, as a technique that directly processes time-series data, effectively captures the dynamic evolution characteristics of signals. As shown in
Figure 5, both signals underwent first integration to obtain velocity time history curves and second integration to derive displacement time history curves, enabling a comprehensive performance comparison.
At the 400 ms, the ideal displacement value was 0.1273 mm. The displacement derived from the conventionally filtered signal was 0.1293 mm, while that from the VMD-reconstructed signal was 0.1279 mm. This result indicates that the VMD-reconstructed signal improved displacement accuracy by 1.1% compared to the filtered signal, demonstrating a clear enhancement. Further in-depth analysis of the entire time history curve clearly reveals that the VMD-reconstructed signal not only aligns more closely with the ideal values at this specific point but also maintains superior consistency throughout the overall velocity and displacement profiles.
This consistency validates the significant advantage of the VMD method in effectively extracting critical information from the original signal while avoiding noise interference, thereby yielding more reliable and precise analytical results. Consequently, the VMD method demonstrates higher practical value in processing complex engineering signals.
4. Experimental Program
To further validate the feasibility of the equivalent conversion analysis method for Rapid Load Testing (RLT) pile signals based on Variational Mode Decomposition (VMD), this study utilized the outcomes of signal simulation to conduct verification through indoor model tests.
4.1. Soil for Model Testing
The soil used in the experiment was Xiamen Aisiou Standard Sand, with its Basic physical parameters provided in
Table 1 and Basic chemical parameters in
Table 2.
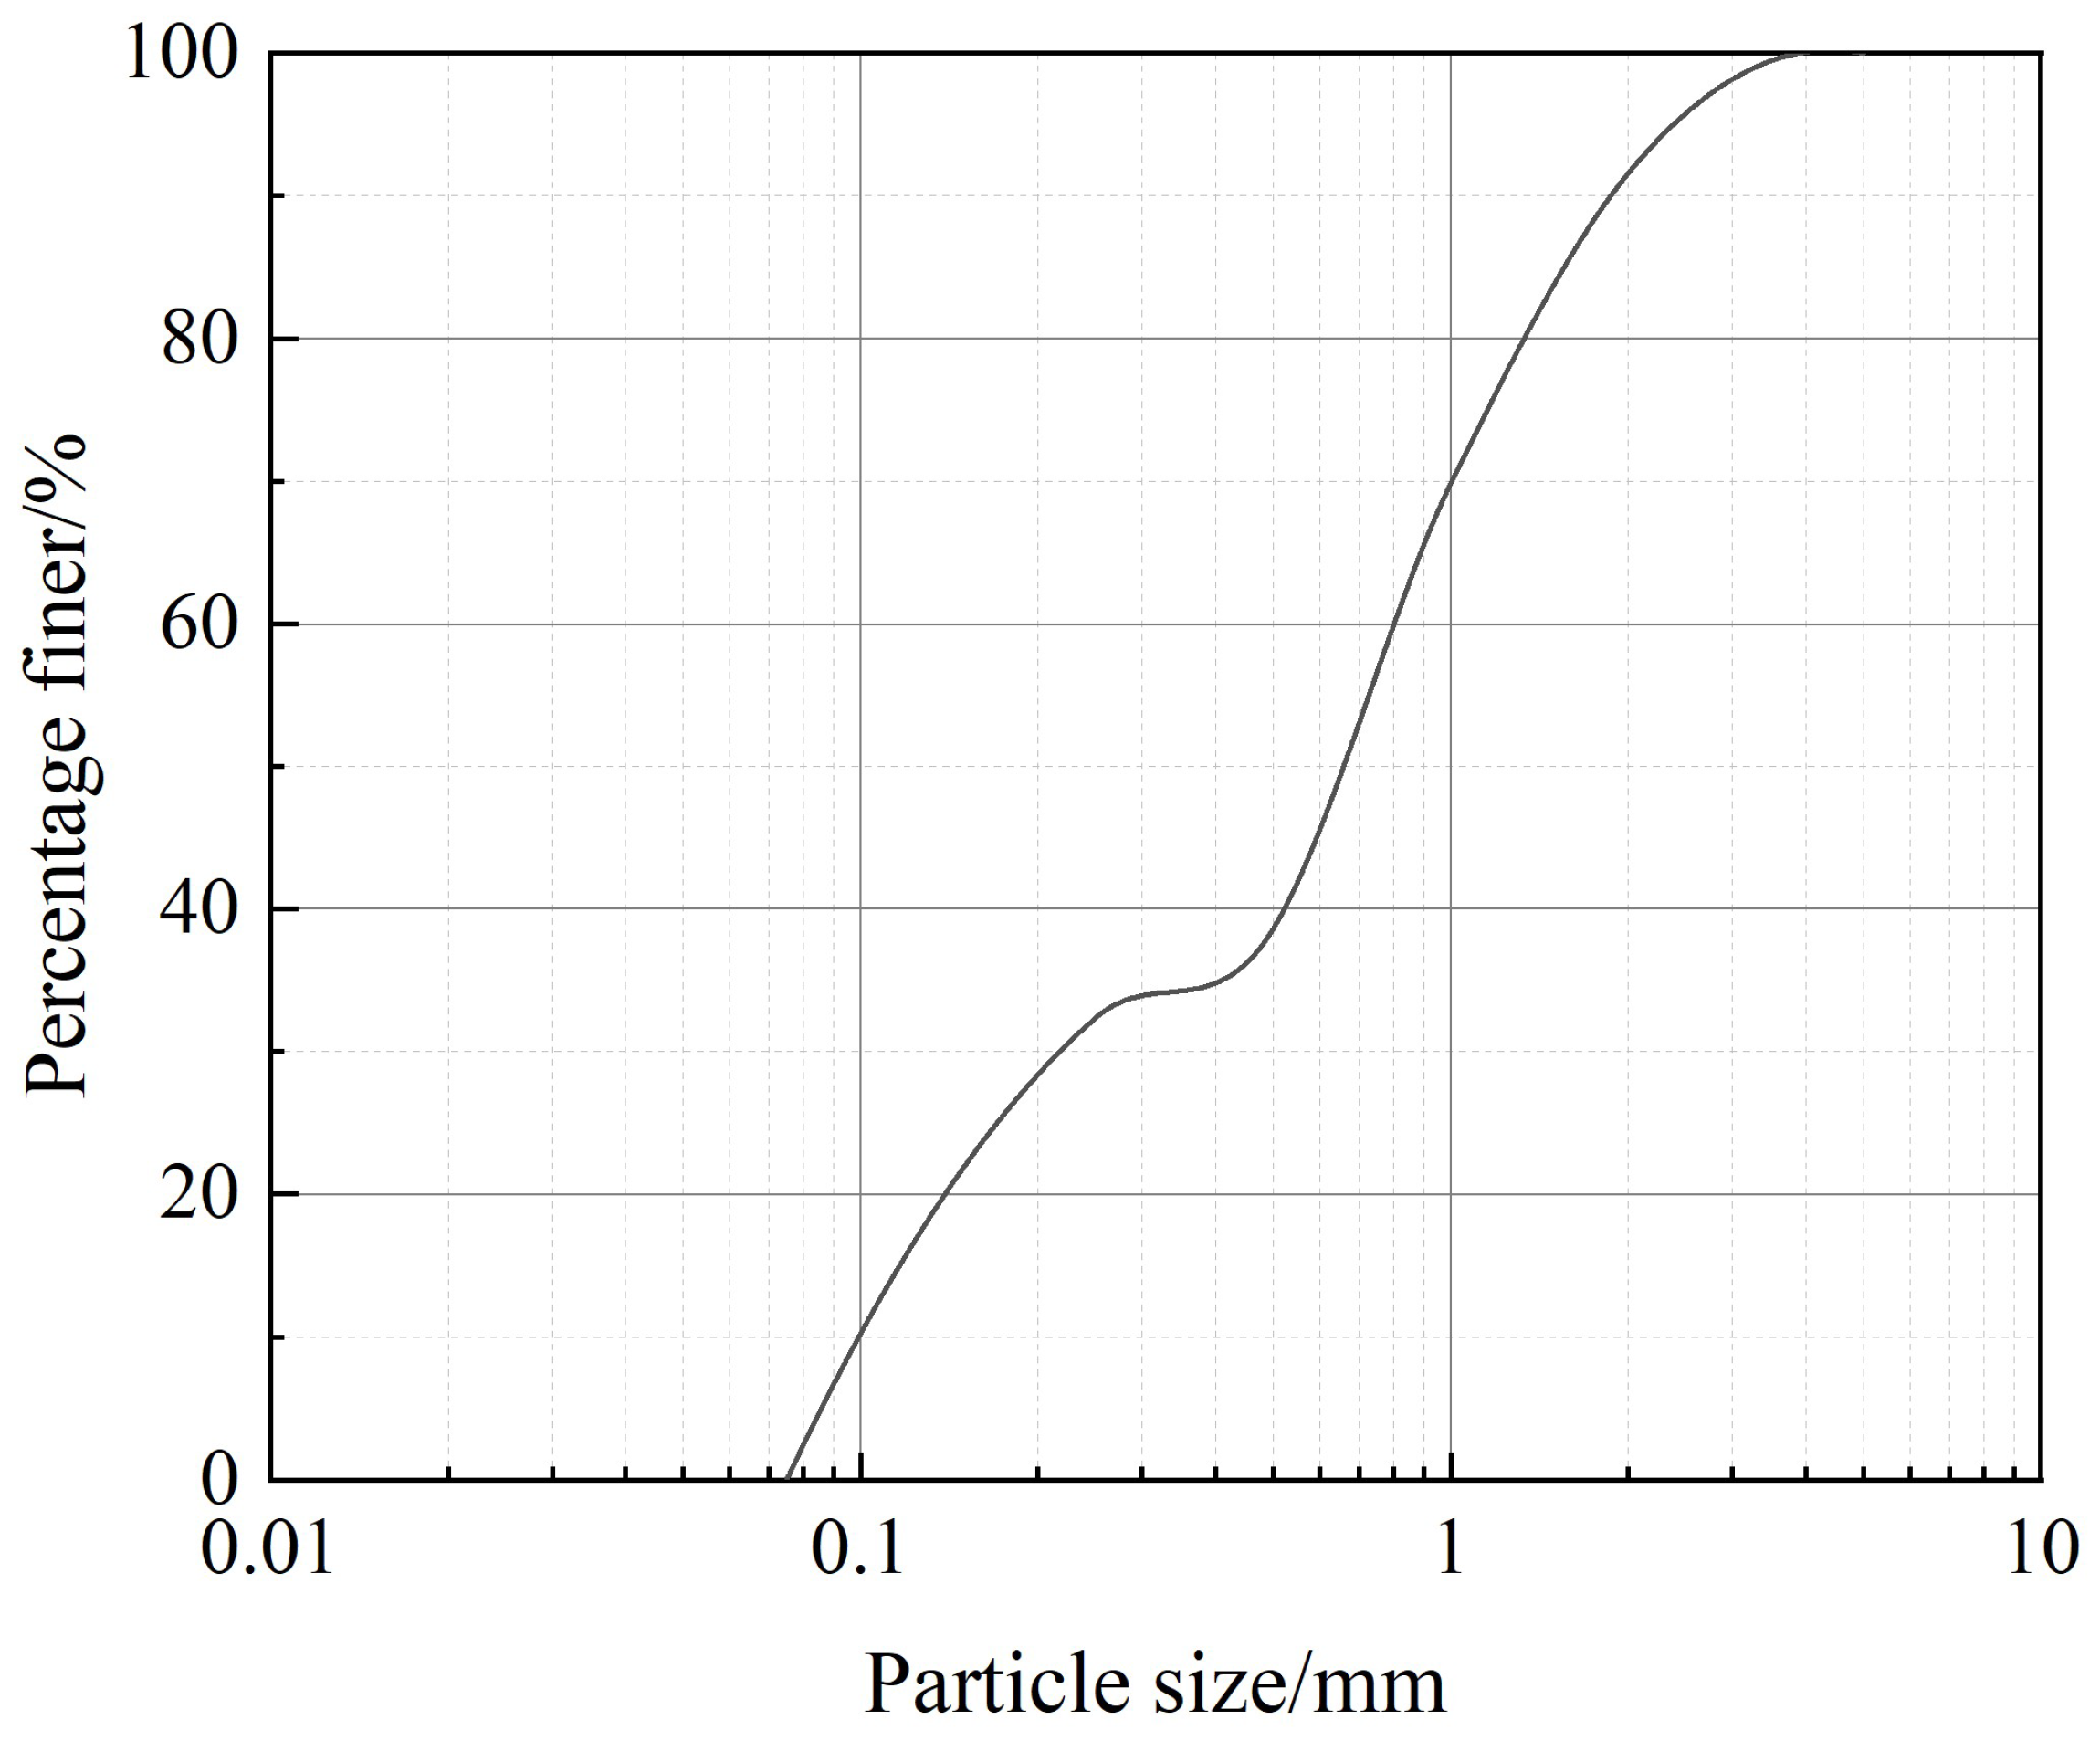
The particle size distribution curve is presented in
Figure 6, indicating that the standard sand exhibits a well-graded composition with characteristic particle diameters of
d10 = 0.10 mm,
d30 = 0.22 mm, and
d60 = 0.81 mm, yielding a uniformity coefficient
Cu = 8.1 and a curvature coefficient
Cc = 0.60.
The model test utilized a transparent acrylic container with an internal diameter of 36 cm and a height of 50 cm. The soil was prepared using a layered compaction method, with each layer spread to a thickness of 5 cm during testing, resulting in a soil volume of 5089.38 cm3 per layer; based on the designed relative density (Dr = 90%), the required mass of standard sand per layer was calculated to be 8667.6 g.
Each soil layer was compacted using a laboratory compaction apparatus through multiple passes until the sand surface reached the designed elevation. Upon completion of the filling process, the model was allowed to settle for more than 7 days.
4.2. Preparation of Model Piles
The model piles (
Table 3) comprised 60 cm-long steel tubes, each with an outer diameter
D = 20 mm and wall thickness t = 2 mm. To facilitate pile head settlement measurement, a 10 cm × 2 cm × 0.2 cm iron plate was symmetrically welded 7 cm below the pile top. A 0.6 cm-diameter hole was drilled on the iron plate 2 cm from the pile axis for install an accelerometer, while a displacement sensor was installed at a distance further from the pile.
The strain gauges, with a sensitivity coefficient of 2.06 mV/με, were symmetrically arranged at 10 cm intervals along the pile shaft. To prevent the interference of strain gauges, the steel tube was longitudinally split into two halves, and the strain gauges were installed on the inner surface. Before installation, the inner surface was abraded with sandpaper along a 45° angle relative to the grid orientation of the strain gauges, followed by cleaning with alcohol-soaked cotton swabs. A small amount of cyanoacrylate adhesive (502) was applied to the target area, and a plastic film was placed over the strain gauge for finger pressing to ensure even adhesion. After installation, the gauges were sealed with sealant 704, and the connections between gauges and leads were secured with electrical tape. The integrity of each strain gauge was verified with an ohmmeter immediately after installation. Once the sealant 704 had cured, the split steel tube was welded back together, and the strain gauges were re-tested with the ohmmeter after cooling to confirm functionality. Post-processing tests repeatedly demonstrated that the welded section exhibited deformation compatibility with the pile structure, meeting all experimental requirements.
After the model piles were prepared, they were calibrated according to the “Test Method for Elastic Modulus and Poisson’s Ratio of Metallic Materials” [
30]. After calibration, the elastic modulus of the steel piles was determined to be 210 GPa.
4.3. Experimental Equipment
The Rapid Load Testing utilized an AZ416_Z dynamic signal acquisition instrument (Nanjing Anzheng Software Engineering Co., Ltd., Nanjing, China) with a sampling frequency of 2560 Hz. The force sensor was connected to a TS3826D dynamic strain conditioner (Yangzhou Test Electric Co., Ltd., Yangzhou, China) to capture the pressure at the pile head. The pile head acceleration was measured using a Lance LC0103T piezoelectric accelerometer (Lance Measure Technology Co., Ltd., Qinhuangdao, China) with a range of 100 g, a frequency response of 0.35–1000 Hz, and a resonant frequency of 32 kHz. The pile head displacement was monitored with a Keyence IL-300 sensor, operating within a measurement range of 16–45 cm.
A polyethylene foam (EPE) cushion was employed as a buffer layer. Preliminary tests indicated that under the condition of a 2 kg weight freely dropped from a height of 1.0 m, a 6 cm thick EPE foam layer extended the duration of pile head loading to approximately 100 ms, the equipment has been verified as a rapid load testing system.
4.4. Experimental Methodology
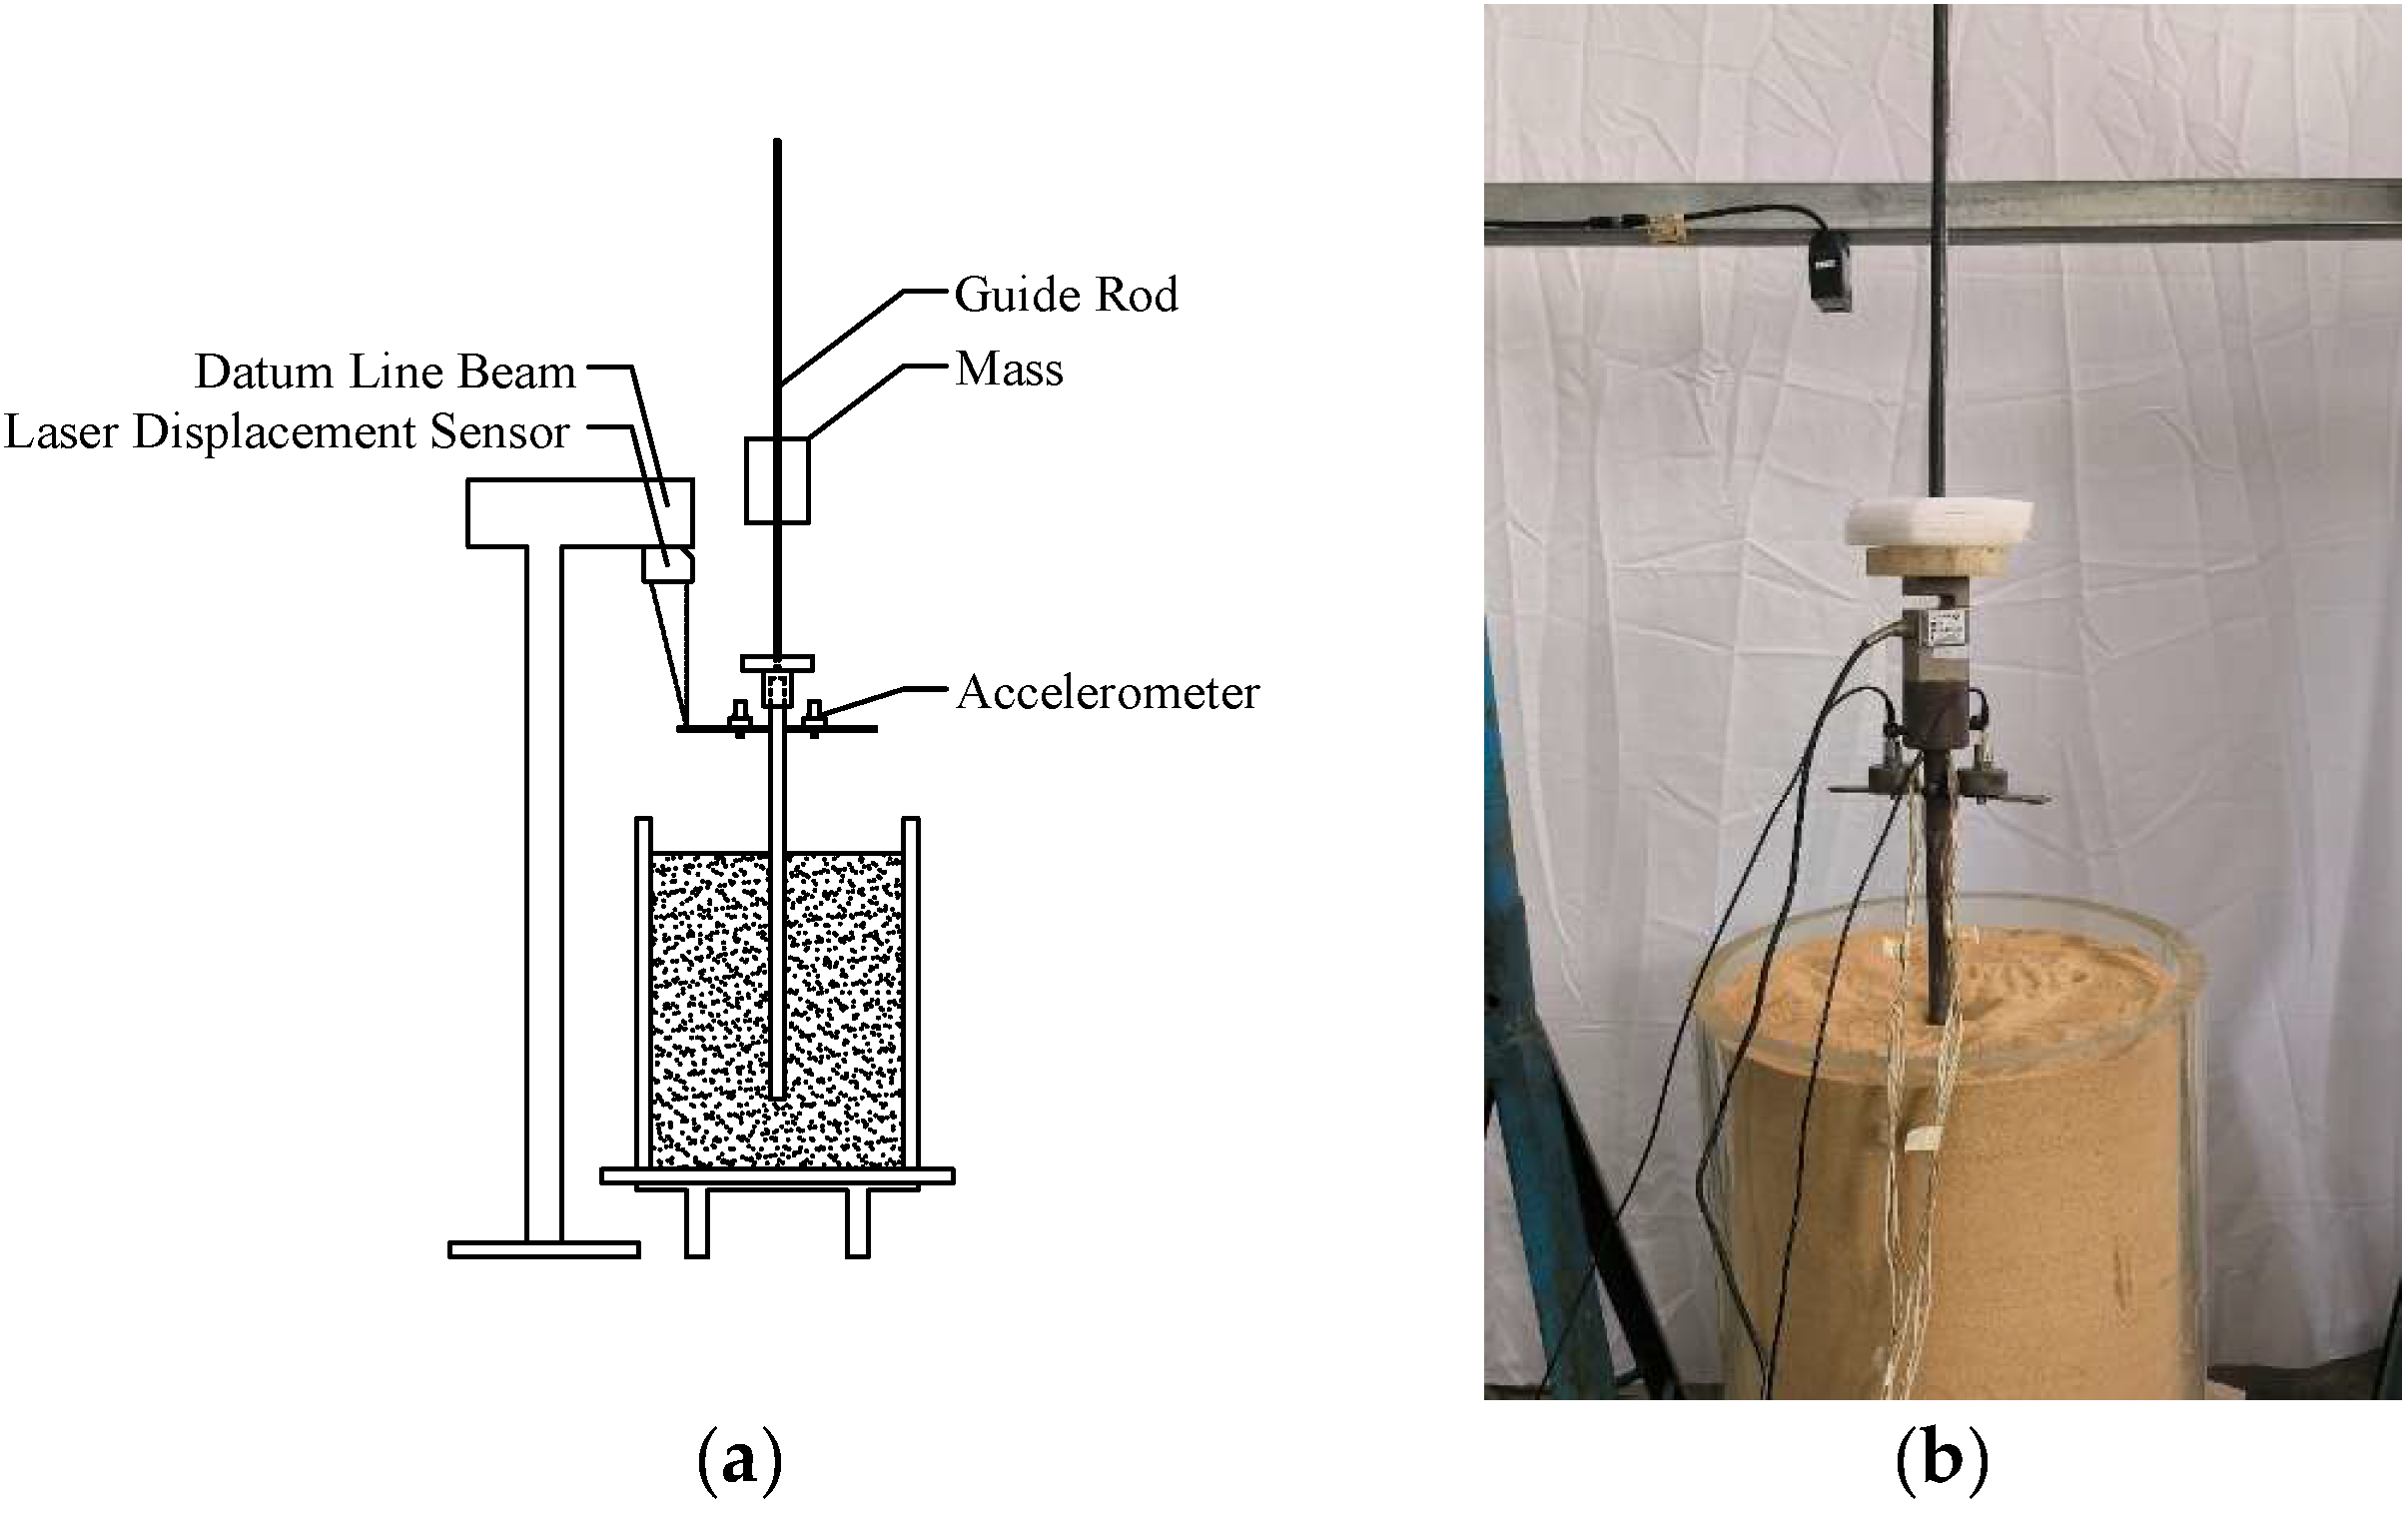
Based on the conclusions from simulation analyses and the methodology of Rapid Load Testing (RLT), this study conducted a comparative analysis of equivalent conversion for displacement detection signals in RLT pile foundations. Using the above model piles and pre-mixed soil, corresponding pile-soil systems were constructed. The RLT simulation was carried out with the setup illustrated in
Figure 7.
The system consists of loading system, Guide Rod system, cushioning system, sensing and acquisition system and model piles. A stable directional loading force is generated by the dropping mass and the guide rod. A Keyence IL-300 non-contact displacement sensor was installed on a datum beam, while an accelerometer was rigidly attached to the cap plate on the pile head.
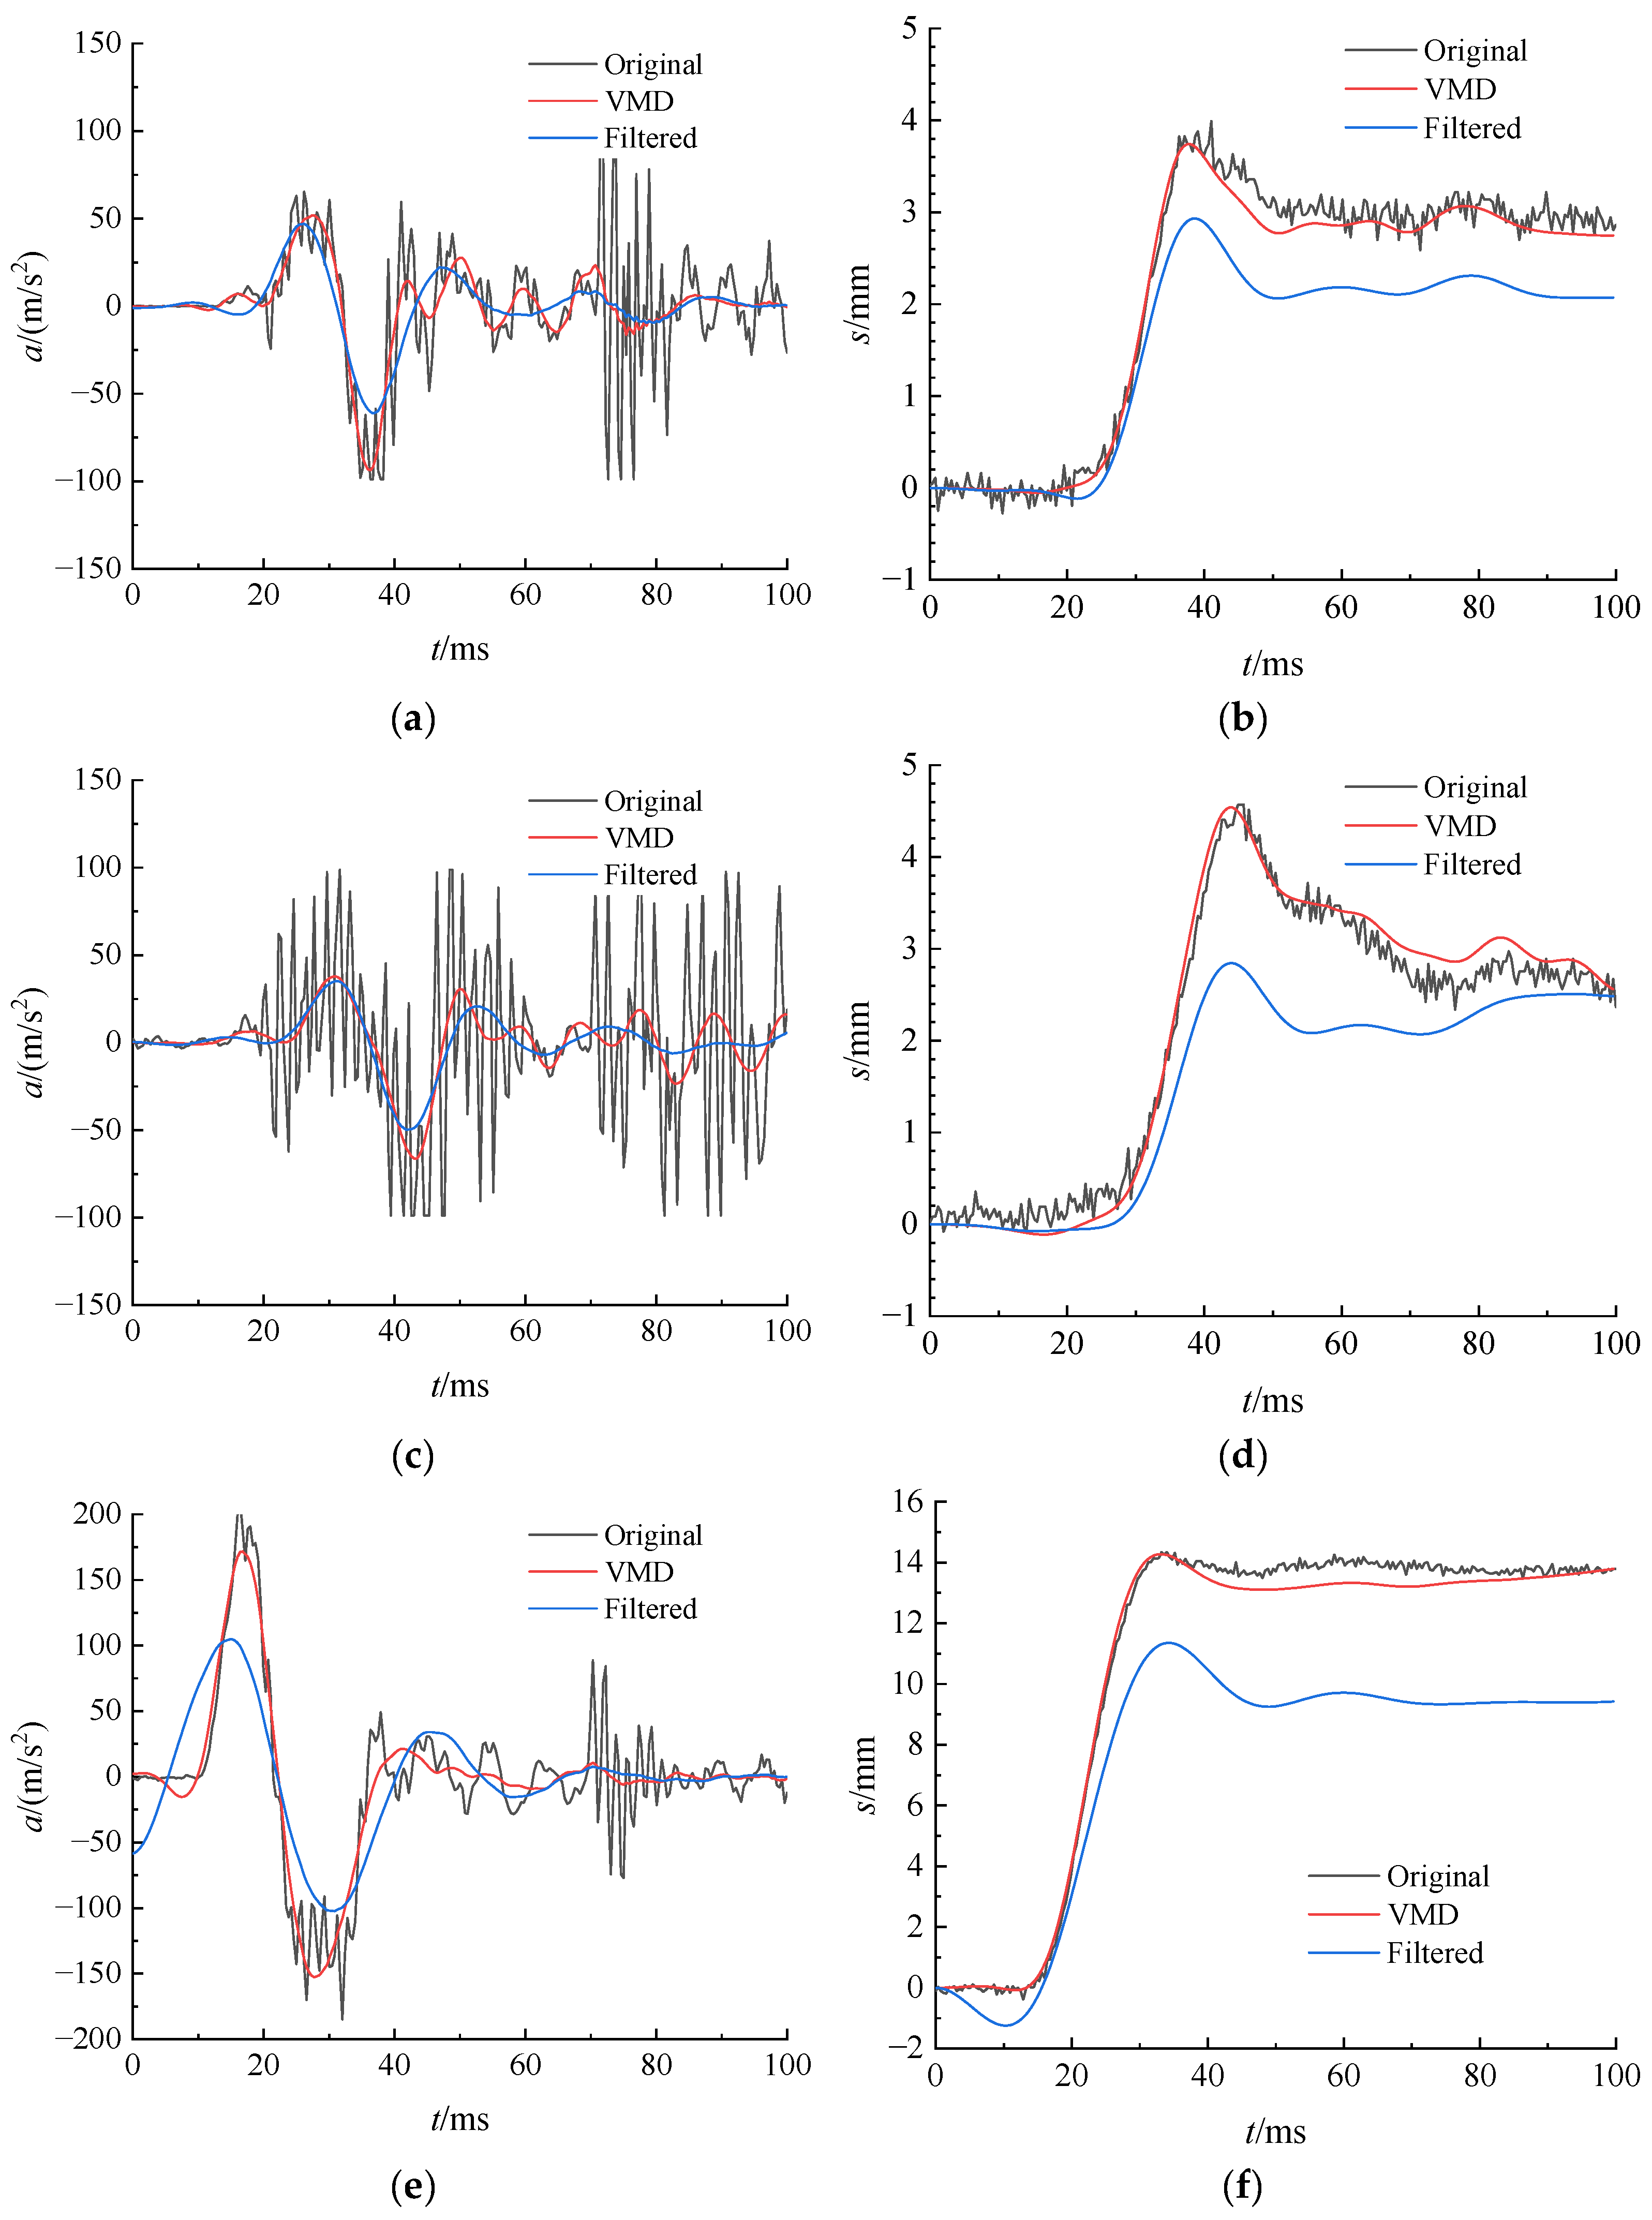
The test involved releasing the mass from drop heights of 30 cm, 50 cm, and 70 cm above the pile head to perform RLT on the model piles (The operating conditions are shown in
Table 4). During loading, the acceleration and displacement time-history signals at the pile head were acquired. The acceleration signals were processed using both Variational Mode Decomposition (VMD) reconstruction and conventional filtering techniques to compare the differences between the two approaches. The results were further compared with the true displacement time-history signals to validate the feasibility of equivalent conversion analysis for RLT pile displacement detection based on VMD technology.
4.5. Analysis of Experimental Results
The comparative validation test results for the pile displacement detection signal based on Variational Mode Decomposition (VMD) technology in Rapid Load Testing are shown in
Figure 8. Throughout the comparative tests, the pile-soil model remained stationary, all data acquisition was completed within 15 min, and no characteristic changes occurred in the surrounding environment of the model box, indicating the absence of specific environmental interference during the detection process.
By analyzing the acceleration signal’s time course curve, its highly complex composition becomes evident. This signal encompasses not only the acceleration component generated by the pile’s rigid body motion as a whole but also significantly incorporates diverse vibration effects arising from the pile’s structural response during loading, alongside inevitable noise interference within the testing system. Despite the combined influence of these mixed factors, within the key segment crucial for bearing capacity detection, the fundamental acceleration component representing the pile’s rigid body motion exhibits a pronounced dominant trend. Its distinct time-varying pattern is clearly distinguishable, possessing excellent signal characteristics. Consequently, utilizing this acceleration signal as the source for real-time inversion analysis within the dynamic load method is entirely feasible. This approach effectively captures and characterizes the pile foundation’s displacement response under dynamic impact loading, furnishing a solid basis for bearing capacity determination.
From the displacement time course curve, observations under the 30 cm and 50 cm drop weight height conditions reveal the pile foundation’s displacement response manifested as a smooth, progressive characteristic curve. The displacement growth rate remained uniform throughout, devoid of obvious abnormal fluctuations or sudden inflection points. This indicates the pile foundation remained in a stable, elastic working state under this impact energy, possessing ample bearing capacity reserve and not nearing its limit state. Conversely, under the 70 cm drop weight height condition, the displacement curve displayed a pronounced sudden sinking phenomenon during the middle and later loading stages. Specifically, the displacement surged dramatically within a short period, forming a steep, abrupt descent. This sudden change directly reflects that the pile foundation structure sustained irreversible damage, signifying its official entry into a failure bearing state, where structural integrity was substantially compromised and bearing capacity effectively lost.
Under normal bearing conditions (30 cm and 50 cm drop heights), the original acceleration curves obtained through conventional filtering and VMD-based signal processing exhibited minimal differences, with nearly overlapping waveforms in the time domain, indicating that traditional methods remain applicable under stable signal conditions. However, after conversion processing to derive displacement time history curves, notable discrepancies emerged between the two approaches: the VMD-generated curve appeared smoother and richer in detail, whereas the conventional method introduced oscillatory distortions. This further validates the theoretical advantage of VMD in handling non-stationary and multi-component signals, as it adaptively separates different modal components within the signal. Applying VMD to signal processing significantly enhances the accuracy of analytical results and reduces the risk of misinterpretation. Under failure conditions (70 cm drop height), the displacement curve derived from VMD-reconstructed signals demonstrated markedly better correlation compared to that from traditional filtering, exhibiting higher consistency between measured displacement data and reduced amplitude fluctuations. This indicates that the VMD method maintains strong robustness even when the pile foundation is subjected to destructive loading.
Compared to the measured displacement time history curve, the displacement curve derived from double integration of the VMD-reconstructed acceleration signal aligns more closely with the true values than that obtained through conventional filtering processing. This further validates the rationale for using time domain integration of the VMD-reconstructed acceleration signal to derive displacement: under the assumption that the pile head velocity is zero before and after loading, the reconstructed signal is first adjusted by subtracting its mean value to remove the direct current offset. After the first time domain integration, the resulting velocity signal is linearly corrected based on the aforementioned assumption. The corrected velocity is then integrated again in the time domain to obtain the displacement signal. This approach ensures that even under strong noise and transient conditions, VMD effectively extracts the core signal components, making it a reliable source for generating displacement time-history curves and providing a solid foundation for engineering safety assessments.
