Article

Research on High-Precision Long-Range Positioning Technology in the Deep Sea

1
National Key Laboratory of Underwater Acoustic Technology, Harbin Engineering University, Harbin 150001, China
2
Key Laboratory of Marine Information Acquisition and Security (Harbin Engineering University), Ministry of Industry and Information Technology, Harbin 150001, China
3
College of Underwater Acoustic Engineering, Harbin Engineering University, Harbin 150001, China
*
Author to whom correspondence should be addressed.
J. Mar. Sci. Eng. 2025, 13(10), 1898; https://doi.org/10.3390/jmse13101898
Submission received: 8 September 2025 / Revised: 24 September 2025 / Accepted: 25 September 2025 / Published: 3 October 2025
(This article belongs to the Special Issue Advances in Underwater Positioning and Navigation Technology)

Abstract

Conventional acoustic positioning systems are typically confined to regions where direct-path measurements are available. However, in long-range underwater environments, acoustic rays undergo multiple reflections at the sea surface and seafloor, complicating the modeling of sound speed and introducing uncertainty due to seafloor bathymetric errors. To address these challenges, a high-precision positioning technology suitable for long-range deep-sea scenarios is proposed. This technology constructs an effective sound speed model based on ray-tracing principles to accommodate multipath propagation. To mitigate model errors caused by inaccurate seafloor bathymetry, a sound speed compensation mechanism is introduced to enhance the precision of reflected-path measurements. The experimental results demonstrate that, with an array baseline of 8 km, the proposed method reduces the maximum ranging error over a 50 km horizontal distance from 137.9 m to 15.5 m. The root-mean-square positioning error is decreased from 157.9 m to 31.0 m, representing an improvement in positioning precision of 80.4%. These results confirm the feasibility of high-precision long-range acoustic positioning.

1. Introduction

Autonomous underwater vehicles (AUVs) play a vital role in marine scientific exploration, resource development, and environmental monitoring [1]. To perform long-duration underwater missions effectively, robust autonomous navigation and positioning capabilities are essential. Acoustic positioning systems, which are unaffected by water depth and capable of continuous operation under all weather conditions, provide AUVs with reliable long-term navigation support [2,3,4,5]. However, the operational range of existing acoustic positioning systems is largely confined to regions where direct-path acoustic transmission is available [6,7,8]. This limitation significantly constrains the coverage and operational flexibility of AUVs, making it difficult to meet the growing demands of large-scale ocean observation and offshore operations [9,10,11,12]. Therefore, overcoming the reliance on direct-path propagation and extending positioning capabilities into long-range reflected-path regions has become a critical bottleneck that must be addressed in the advancement of underwater navigation technologies.
Acoustic positioning systems typically determine the target’s position by measuring acoustic travel times to multiple seafloor transponders, converting them to distances using a sound speed model, and solving geometric intersection equations [13,14,15,16]. The current deep-sea positioning systems can achieve a measurement precision better than 10 m using a 10 kHz signal at a depth of 3000 m and a range of 11 km [17,18]. Zhang et al. considered the effects of Earth’s curvature and Doppler shifts, achieving a root-mean-square positioning error of 14 m within the longest distance of 20 km using a low-frequency 3 kHz signal [19]. However, as the range increases beyond 20 km, the direct path usually disappears due to geometric shadowing. Acoustic signals inevitably undergo multiple reflections at the sea surface and seafloor. This gives rise to a complex multipath structure, significantly increasing the difficulty of sound speed modeling [20,21]. In this context, the sensitivity of reflected paths to environmental disturbances is considerably enhanced. Sound speed profile (SSP) changes, sea surface fluctuations, and bathymetric errors can all cause propagation path deviation, thereby interfering with ray tracing results and leading to sound speed estimation deviation [22]. Consequently, in long-range scenarios dominated by multipath propagation, traditional acoustic positioning technologies based on the direct-path assumption are ineffective because they cannot accurately describe the reflected paths and their error propagation mechanisms, which greatly increases positioning error.
Traditional sound speed estimation technologies mainly include weighted average sound speed (WASS), equivalent sound speed profile (ESSP), and effective sound speed (ESS) [23,24,25]. WASS calculates a weighted average of sound speed values within the profile, offering the advantage of high computational efficiency. However, it fails to account for the effects of ray bending and reflections in underwater environments. ESSP simplifies ray tracing by assuming a constant-gradient SSP, but it is typically applied only in short-range multibeam sonar systems within tens of meters [26]. As a sound speed correction method based on the principle of ray tracing, ESS offers a good balance between modeling precision and computational efficiency, and it has been widely applied in acoustic positioning systems [27]. Recently, researchers have successively proposed several strategies to optimize the effective sound speed table (ESST), including genetic algorithms, particle swarm optimization, and B-spline surface fitting methods [28,29,30]. These have shown excellent performance in direct-path regions. However, in long-range acoustic propagation, the sound field is no longer dominated by a stable and predictable direct path. Instead, it is formed by the superposition of numerous reflected paths, resulting in a highly complex relationship between travel time and sound speed, which has not been adequately investigated or addressed by existing sound speed estimation methods.
Under long-range conditions, acoustic propagation paths exhibit stronger sensitivity to environmental perturbations. In practical applications, SSP datasets are collected using conductivity temperature depth (CTD) or sound velocity profilers (SVPs), which provide relatively accurate measurements. The influence of sea surface disturbances is also controllable [31]. However, bathymetric error is a major uncontrollable error source in measurement systems due to their hidden nature and the limitations of database resolution and precision [32,33]. The commonly used seafloor bathymetry databases include Earth Topography (ETOPO), Technical University of Denmark (DTU), and General Bathymetric Chart of the Oceans (GEBCO) [34]. Previous studies have shown that, in typical deep-sea areas such as the South China Sea, the bathymetry values recorded in these databases have measurement errors within 88 m compared to actual ship-based multibeam data [35,36]. Specifically, in this sea area, the standard deviation of seafloor bathymetry is 30 m, with 87.2% of the data having errors less than 50 m, and errors are larger in areas like seamounts and trenches. Liu et al. proposed a seafloor topography distortion correction method based on SVP inversion to improve measurement precision [37]. Chao et al. proposed a correction method for bathymetric error caused by the effect of seafloor topography slope at the footprint scale. It was used to correct data collected in the South China Sea and verified by the bathymetric data captured by a ship-borne multibeam echo sounder [38]. Nevertheless, in scenarios involving long-range reflected paths at low grazing angles, unknown seafloor topographic deviations no longer manifest as simple vertical offsets. They alter the overall geometry of the acoustic ray paths, introducing complex and nonlinear systematic errors. This error propagation mechanism can cause significant and unpredictable deviations in ranging results, posing a major obstacle to long-range positioning. In most practical applications, it is unrealistic to obtain large-scale high-resolution bathymetric maps through comprehensive inversion over vast ocean areas. The more fundamental challenge lies in accurately modeling and correcting the ranging model bias caused by bathymetric errors using only limited external calibration data.
To solve the problems of estimating sound speed in reflected paths and how errors in seafloor topography affect measurement precision, this paper suggests a new technology for precise acoustic positioning over long ranges. Based on the principle of ray tracing, it extends the ESS concept to longer ranges and constructs a basic sound speed model for long-range multipath propagation. Simultaneously, starting from the geometric changes regarding propagation paths, the technology establishes an analytical relationship between bathymetric error and the influence on the sound speed model. A compensation strategy is proposed to improve the precision of sound speed estimation and distance measurement for reflected paths. This paper validates the technology’s feasibility through deep-sea experiments, expands the effective range, and compensates for model deviation caused by bathymetric error. These results provide a new approach for achieving high-precision long-range positioning in deep-sea environments.
The remainder of this paper is organized as follows: Section 2 describes the basic principles of acoustic positioning and ESS. Section 3 details the proposed method, which includes long-range multipath sound speed modeling and positioning correction based on compensation for bathymetric error. Section 4 describes the simulation experiments, analyzing the construction of the multipath sound speed model, the impact of bathymetric errors, and the effectiveness of the proposed method. Section 5 presents the deep-sea experimental results. The conclusion is provided in Section 6.

2. Basic Principles

2.1. Principle of Acoustic Positioning

The spherical intersection model is commonly used in acoustic positioning, where distance measurements are used to construct intersection equations for solving the target position in the array coordinate system. The fundamental observation equation is provided by
d i = X X i , i = 1 , , N
where i is the number of seafloor beacons. Let the spatial coordinates of the seafloor beacon i and the target be denoted as X i = [ x i , y i , z i ] T and X = [ x , y , z ] T .
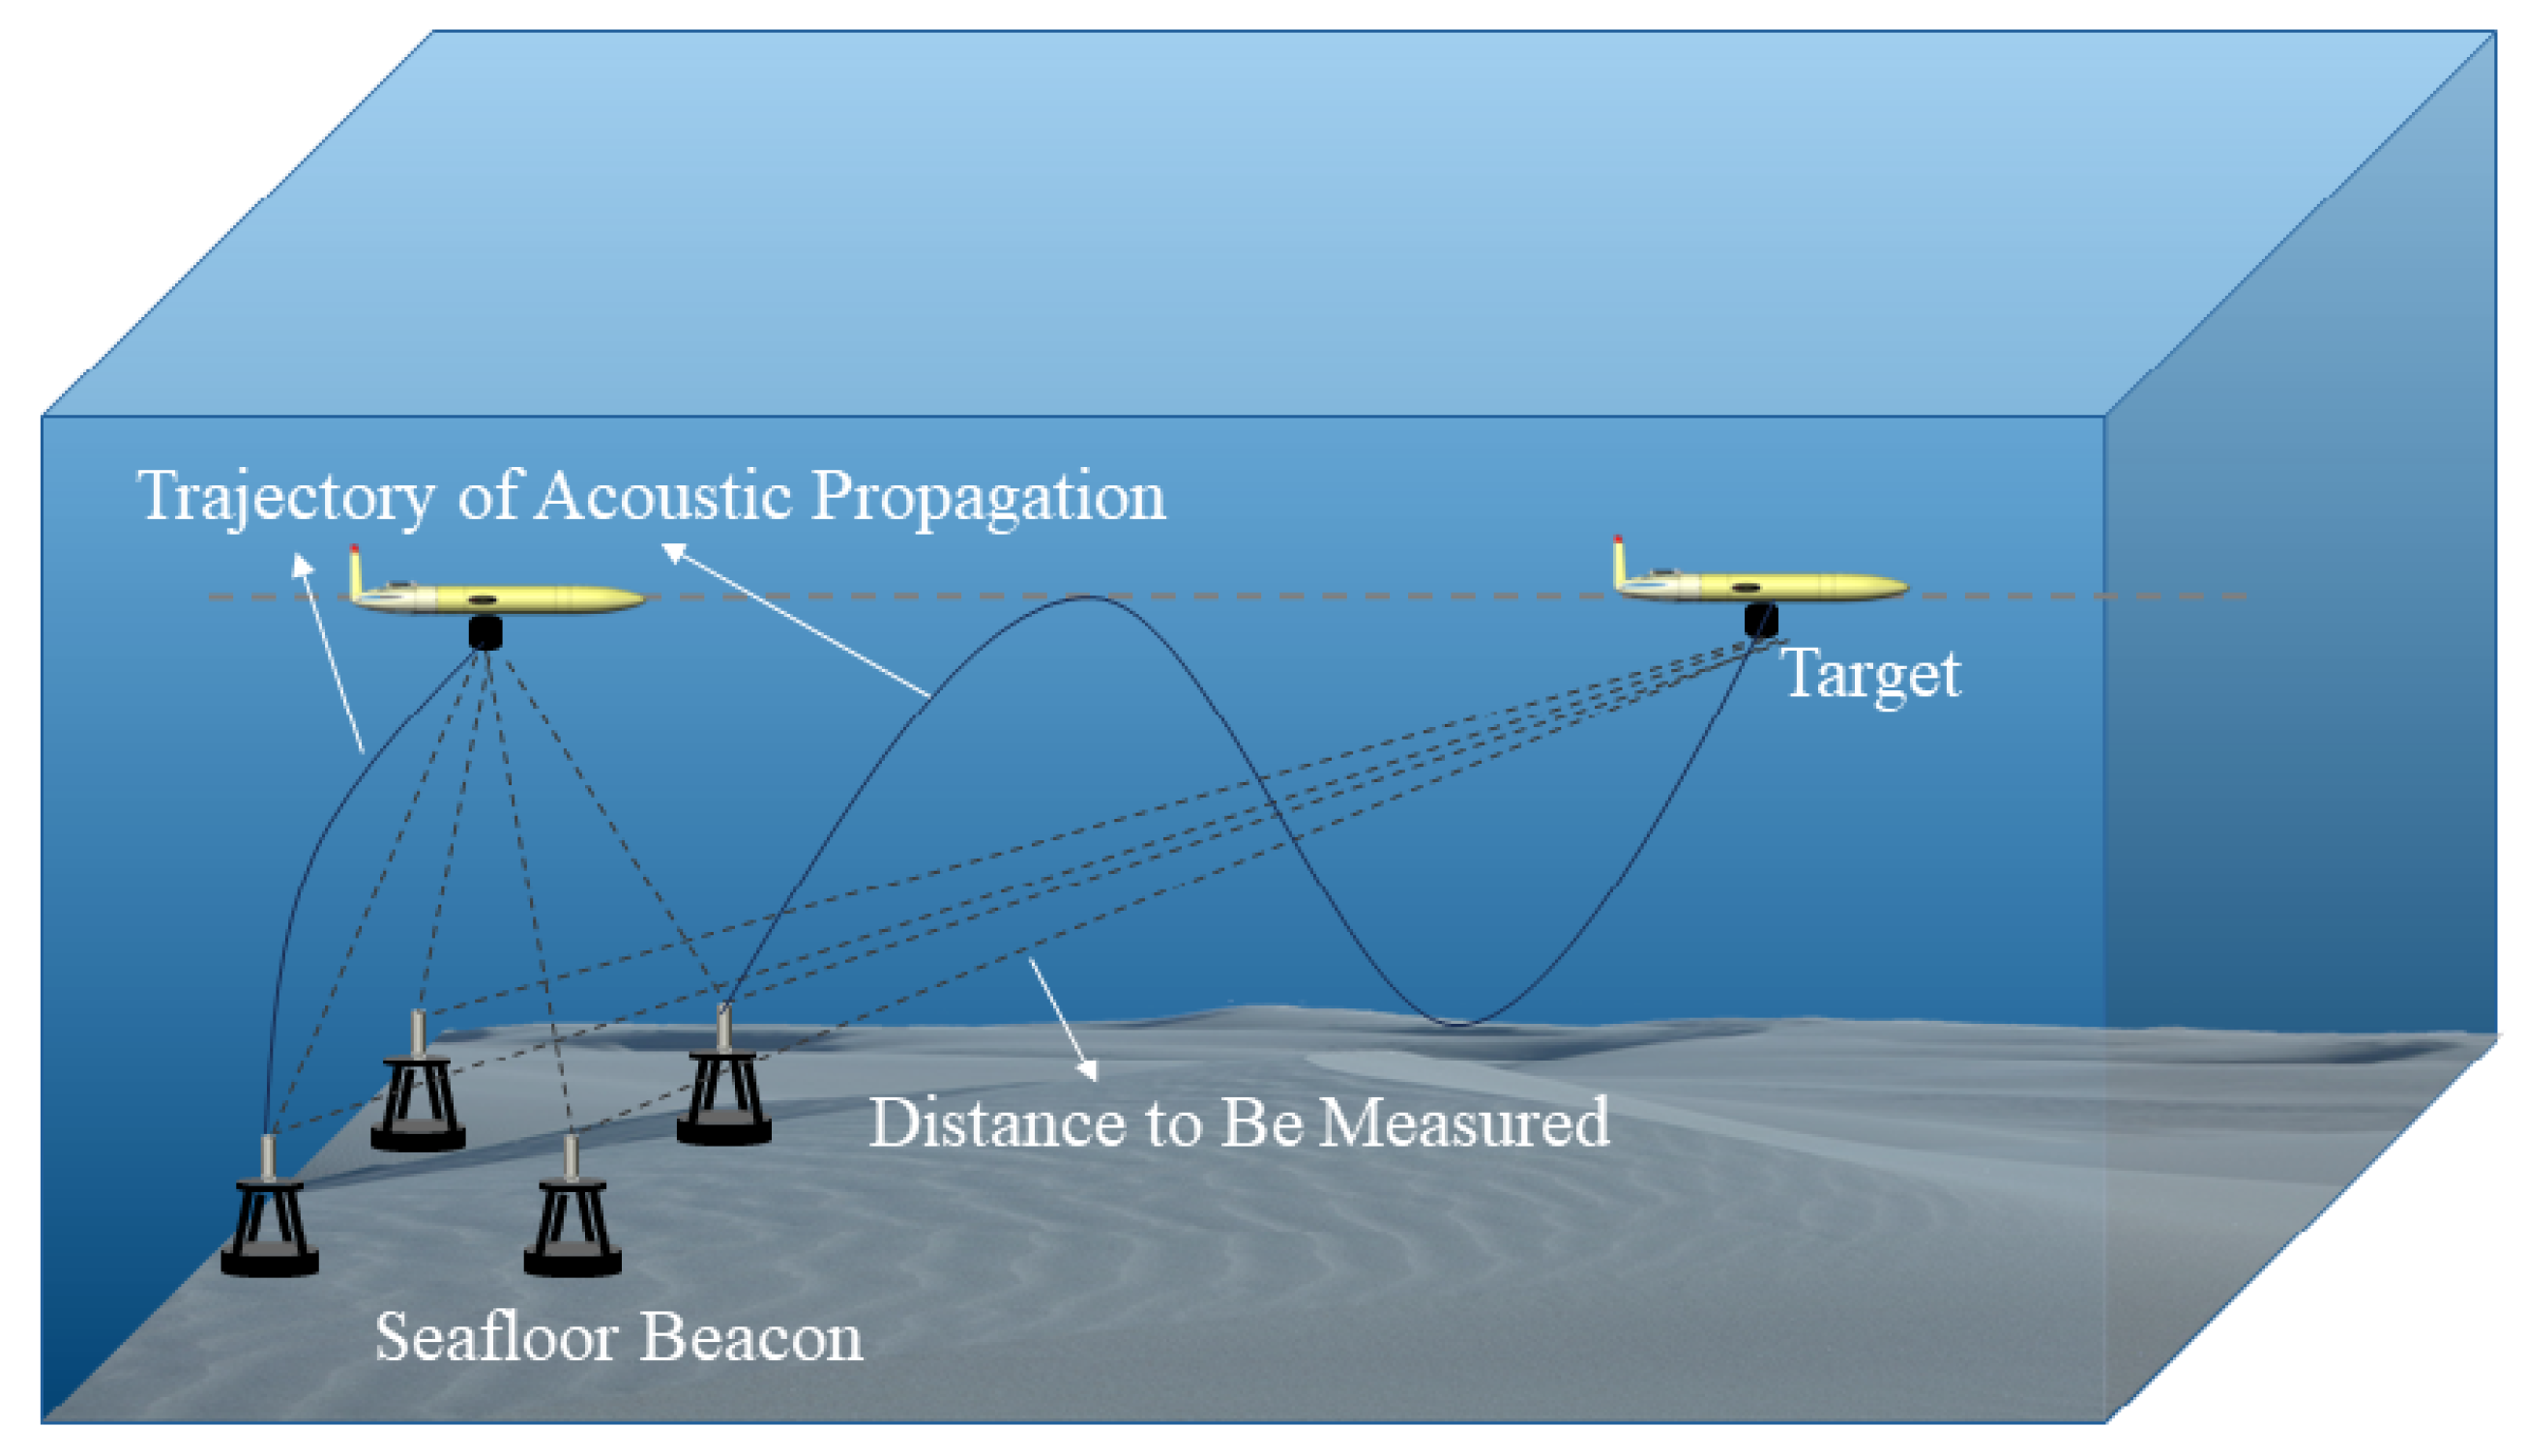
The positioning model is illustrated in Figure 1. When three beacons are available, the target position can be uniquely determined. If more than three beacons are deployed, the position can be estimated using the least squares method. The positioning equation corresponding to the i th observation is formulated as
f i = ( x x i ) 2 + ( y y i ) 2 + ( z z i ) 2 d i = 0
Assuming an initial estimate of the target position denoted as X 0 , the final position is obtained using a nonlinear iterative method. The iterative update equation can be written as
X = X 0 + Δ X
Δ X = ( A T A ) 1 A T F
where
A = ( f 1 , f 2 , , f N ) ( x , y , z ) X 0
F = [ f 1 , f 2 , , f N ] T X 0
It can be seen that the positioning error Δ X is primarily determined by matrices A and F, where A is governed by the geometric configuration between the target and the beacons, and F represents the ranging errors.
The precision of positioning largely depends on distance measurements, which in turn rely fundamentally on accurate estimations of both travel time and sound speed. The travel time is recorded through a time-synchronization mechanism between the target and the beacons. Due to multipath propagation in underwater environments, a single beacon may receive multiple arrival time signals corresponding to different propagation paths. Then, the set of propagation times for the M acoustic rays received by beacon i is provided by
T i = { t i 1 , t i 2 , , t i M }
In long-range positioning scenarios, the direct path disappears, and reflected paths dominate. The resulting propagation paths are complex and non-unique, leading to increased distance measurement uncertainty. The distance measurement error can be expressed as
f i ( x , y ) = c i j · Δ t i j + Δ c i j · t i j
where c i j , Δ t i j , and Δ c i j represent the sound speed, time measurement error, and sound speed estimation error, respectively, for the j-th propagation path between the target and beacon i.
When the system has good time synchronization precision and employs precise time-delay detection methods, the time measurement error can be controlled within a relatively small range. As a result, the sound speed estimation error becomes the main factor affecting the system’s precision, and its impact is linearly amplified with increasing travel time. In classical positioning methods, the sound speed is typically treated as a constant (usually 1500 m/s), which inevitably introduces significant errors. Therefore, accurate sound speed estimation is one of the key challenges in long-range positioning.

2.2. Principle of ESS

ESS is defined as the ratio of the slant range between the source and the receiver to the travel time, and is expressed as
c = d t = χ 2 + ( z s z r ) 2 t
where χ is the horizontal distance, z s is the source depth, and z r is the receiver depth. The depths are typically measured in situ using pressure sensors or other measurement instruments and are treated as known parameters.
Sound speed estimation methods primarily rely on ray tracing theory, in which acoustic ray propagation at any depth follows Snell’s law, provided by
cos θ ( z ) c ( z ) = ρ
where c ( z ) and θ ( z ) , respectively, represent the sound speed and grazing angle at depth z, and ρ is the ray parameter provided by Snell’s law.
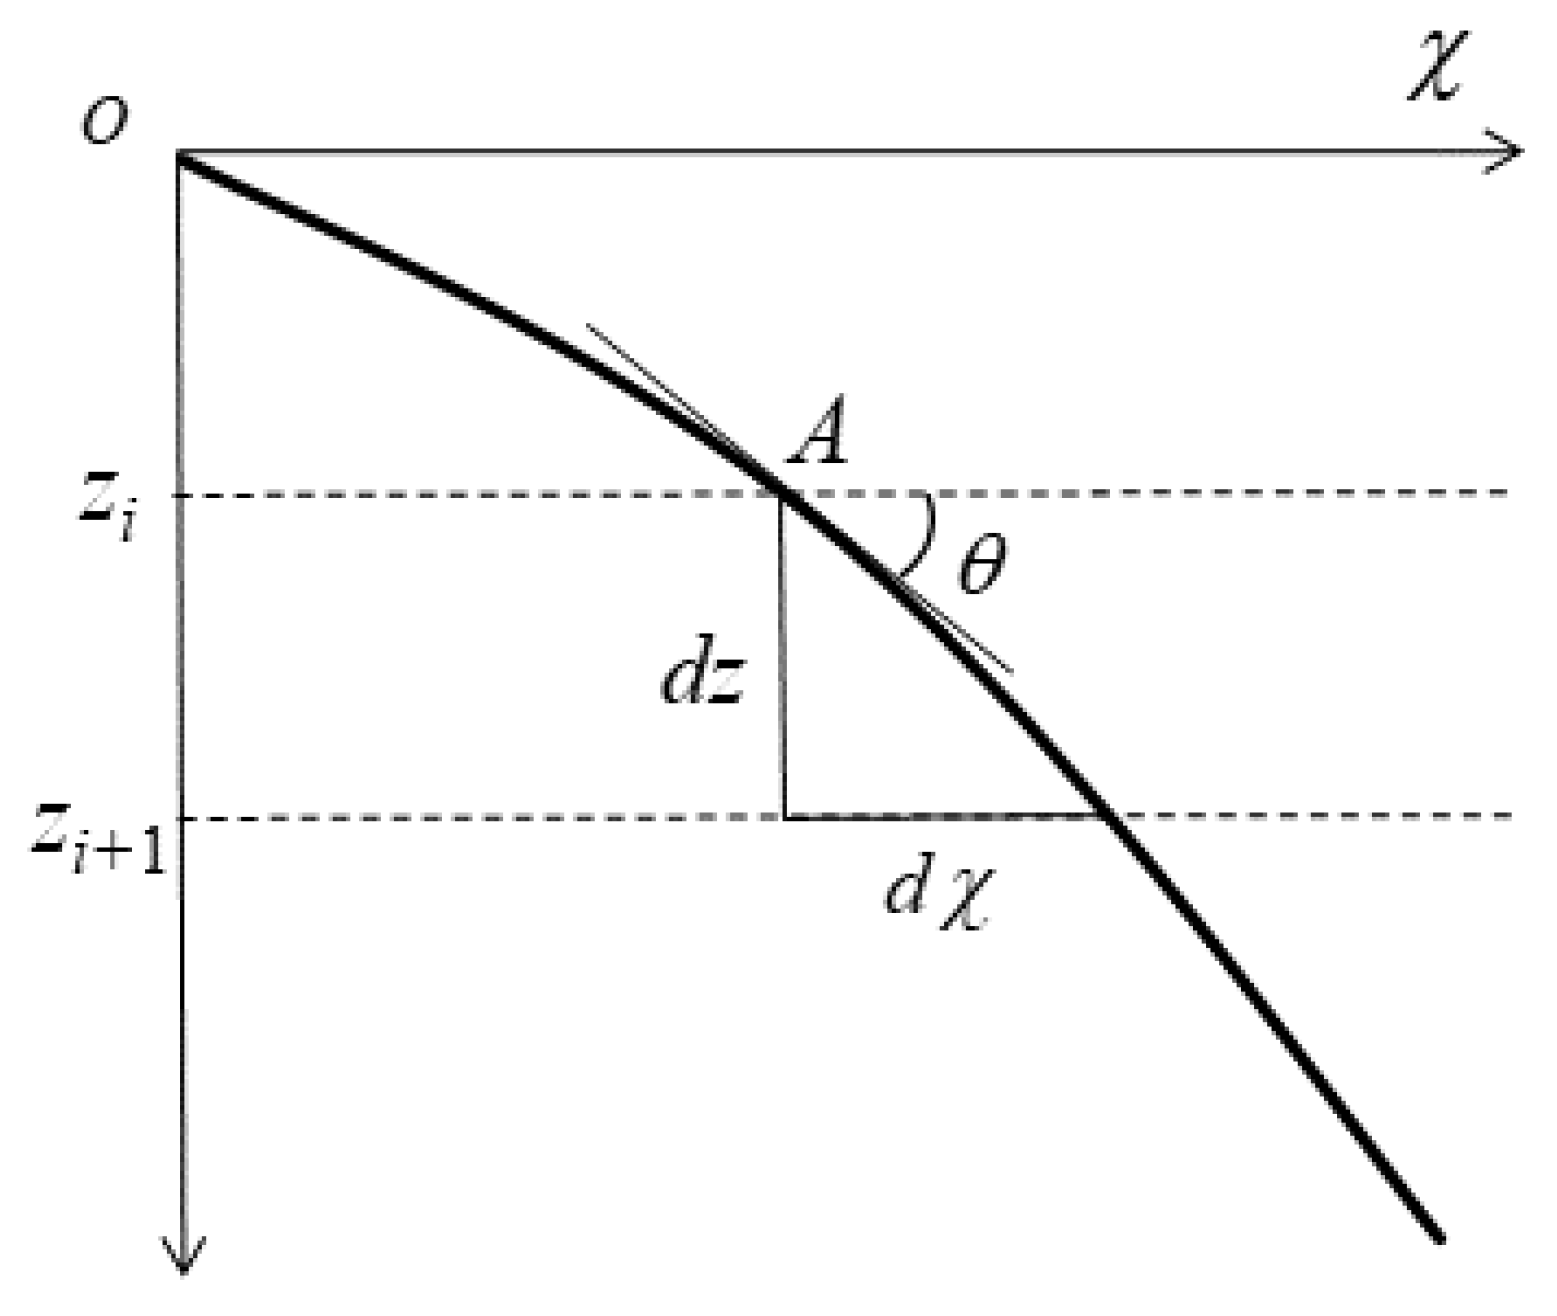
Figure 2 is a schematic diagram of ray tracing. The differential element of horizontal propagation distance can be obtained by extracting an infinitesimally small segment of the acoustic ray at point A:
d χ = d z tan θ
By integrating along the ray path, the total horizontal distance can be expressed as
χ = z s z r ρ c ( z ) 1 ρ 2 c ( z ) 2 d z
The travel time can be obtained as follows:
t = z s z r 1 c ( z ) 1 ρ 2 c ( z ) 2 d z
The SSP is divided into I layers along the depth direction, and the gradient in each layer is assumed to be constant, expressed as
g i = c ( z i + 1 ) c ( z i ) z i + 1 z i
The propagation time and horizontal distance are deduced by the following:
χ = i = 0 I 1 1 g i ρ sin θ ( z i ) sin θ ( z i + 1 )
t = i = 0 I 1 1 g i ln tan θ ( z i + 1 ) 2 + π 4 / tan θ ( z i ) 2 + π 4
Therefore, the ESS can be expressed as
c = ( i = 0 I 1 1 g i ρ sin θ ( z i ) sin θ ( z i + 1 ) ) 2 +   ( z s z r ) 2 i = 0 I 1 1 g i ln tan θ ( z i + 1 ) 2 + π 4 / tan θ ( z i ) 2 + π 4
Unlike direct-path propagation, long-range acoustic rays undergo reflections at the sea surface or seafloor before reaching the receiver. In such cases, sound speed calculation must account for the change in the sign of the grazing angle during reflection. The boundary condition can be expressed as
θ ( z i + 1 ) = θ ( z i )
The sound speed modeling and its application for reflected paths are more complex, and the position of the boundary reflection points will be influenced by the seafloor topography depth. Under conditions of accurate SSP measurement, if the actual seafloor depth deviates, it will change the sound ray’s reflection points, ultimately leading to overall changes in horizontal distance, travel time, and ESS. Therefore, it is necessary to construct a sound speed model for reflected paths. Furthermore, the impact of bathymetric error on sound speed and distance measurement needs to be considered, thus achieving long-range high-precision ranging.

3. Proposed Method

Addressing the challenges brought by long-range deep-sea measurement, namely sound ray reflection leading to complexity in sound speed estimation and the problem of the bathymetric error increasing distance measurement uncertainty, this paper proposes a high-precision reflected-path-based positioning technology. The entire workflow of this method is illustrated in the flowchart in Figure 3. As shown, the method consists of two main components: long-range reflected-path sound speed modeling and positioning correction based on compensation of bathymetric error. The partitioned effective sound speed table (PESST) is constructed based on the number of reflections along each propagation path. Starting from the geometric variations of propagation paths, a response expression is derived to quantify the impact of bathymetric error on the measurement. Topography-Compensated PESST (TC-PESST) is developed, enabling sound speed compensation for reflected paths and improving measurement precision under long-range deep-sea conditions.

3.1. Long-Range Reflected-Path Sound Speed Modeling

The construction of a long-range sound speed model requires a regional strategy based on propagation characteristics, such as the initial grazing angle, the number of surface reflections, and the number of seafloor reflections. They determine the spatial distribution of ray paths and their relative contributions to distance measurement. A propagation path involving m surface reflections and n seafloor reflections is assigned to the propagation region m , n , defined as
R m , n = φ R + | m   surface   reflections ,   n   seafloor   reflections
For each propagation region, an independent mapping function between travel time and ESS can be constructed, expressed as
c m , n ( t ) = d m , n ( t ) t
d m , n ( t ) = i L χ i 2 + ( z s z r ) 2
where L = m + n + 1 is the number of path segments, and χ i is the horizontal distance of the ith segment.
The seafloor topography information required for modeling is obtained from a bathymetric database, which provides topography profile data along the line connecting the initial estimated target position and the beacon. By combining Equations (15) and (18), the travel time and corresponding ESS for various paths at different distances can be derived. Subsequently, these values are fitted through polynomial interpolation to generate a table that can be looked up in real time. The sound speed functions for each propagation region collectively form the complete PESST, and its structure is defined as follows:
C PESST ( t ) = c m , n ( t ) | ( m , n ) N 2 , t T m , n
where T m , n represents the travel time range corresponding to the first-arriving ray path under the current transmission distance condition. When such ray paths disappear due to energy loss or other reasons, their corresponding ESS terminates, and the system enters the next propagation region. PESST completes region matching and sound speed estimation through discretely stored data, achieving basic modeling of long-range multipath sound speed.

3.2. Positioning Correction Based on Compensation of Bathymetric Error

Disturbances in ocean boundary conditions affect the precision of sound speed estimation for reflected paths. To account for this, the sound speed model can be corrected as
C ( t ) = C PESST ( t ) + Δ c ( t )
where Δ c ( t ) represents the sound speed deviation at the travel time t.
By combining Equations (13) and (21), the starting and ending points of the reflected path segments typically correspond to the source depth, the receiver depth, or the sea surface or seafloor reflection points. Therefore, the bathymetric error has become a primary source of sound speed estimation error, and its error transfer equation can be written as
Δ c ( t ) = c ( t ) H · Δ H = K ( t ) · Δ H
where H is the seafloor depth, Δ H is the bathymetric error, and K ( t ) represents the sensitivity coefficient of sound speed to the bathymetric error.
To derive the sensitivity coefficient K ( t ) , we must first quantify how a bathymetric error, Δ H , impacts the fundamental ray parameters of horizontal distance, χ , and travel time, t. For a path with n seafloor reflections, these effects can be expressed through integration over the error segment. Under the condition of a fixed initial grazing angle, the effects of the bathymetric error on horizontal distance and travel time can be expressed as
Δ χ = 2 n H H + Δ H ρ c ( z ) 1 ρ 2 c ( z ) 2 d z
Δ t = 2 n H H + Δ H 1 c ( z ) 1 ρ 2 c ( z ) 2 d z
Since Δ H H , the sound speed varies little within the range H , H + Δ H and can be approximated as a constant c ( H ) . This reasonable approximation allows us to simplify the integrals into the following linear relationships:
Δ χ K 1 Δ H , K 1 = 2 n ρ c ( H ) 1 ρ 2 c 2 ( H )
Δ t K 2 Δ H , K 2 = 2 n c ( H ) 1 ρ 2 c 2 ( H )
With the deviations in horizontal distance and travel time established, their combined effect on the ESS can now be determined. By taking the total derivative of the ESS definition, the sound speed deviation, Δ c , can be expressed as follows:
Δ c = c d Δ d + c t Δ t = Δ d t d Δ t t 2
where the slant range deviation, Δ d , is primarily driven by the change in horizontal distance,  Δ χ :
Δ d = d χ Δ χ = χ χ 2 + ( z s z r ) 2 · Δ χ
By substituting the expressions for Δ t and Δ χ into Equations (27) and (28), respectively, the full relationship between the sound speed deviation and the bathymetric error can be established as
Δ c ( t ) = χ t χ 2 + ( z s z r ) 2 K 1 χ 2 + ( z s z r ) 2 t 2 K 2 · Δ H
Therefore, K ( t ) can be further derived as
K ( t ) = χ t χ 2 + ( z s z r ) 2 K 1 χ 2 + ( z s z r ) 2 t 2 K 2
The variable K ( t ) characterizes how the bathymetric error propagates through horizontal distance and travel time error to affect sound speed estimation. Under fixed travel time conditions, the sound speed estimation error exhibits a linear relationship with the bathymetric error.
The bathymetric error is the deviation between the actual seafloor depth and the seafloor depth obtained from the database. Its acquisition method can usually be either directly measured using high-precision pressure sensors at reference points in the current experimental area or indirectly calculated by sound speed inversion in multipath overlapping areas. The final expression for the TC-PESST is
C TC PESST ( t ) = C PESST ( t ) + K ( t ) Δ H
While retaining the multipath structure characteristics, this correction model effectively incorporates the dynamic modulation mechanism of the bathymetric error on sound speed estimation, optimizes the reflected path sound speed model, and improves long-range distance measurement precision. To fully elaborate on the correction process, it is crucial to define Δ H as an equivalent bathymetric error. This parameter is not intended to be a precise geophysical measurement of the seafloor but rather a powerful data-driven lumped parameter. Its purpose is to correct for the net discrepancy between the idealized PESST model and the complex reality of acoustic propagation. The inversion of Δ H is thus a calibration procedure. At a reference point where the ground-truth distance is known, the true ESS can be determined. The difference between this true sound speed and the one predicted by the initial PESST model constitutes the total model error. Leveraging the topography sensitivity coefficient K ( t ) derived in Equation (30), it can then analytically solve for the single scalar value of Δ H that accounts for this observed error. This calibrated Δ H is then applied to the entire TC-PESST model, as shown in Equation (31), effectively aligning the model with the real-world conditions.
The final distance measurement process is as follows (Algorithm 1):
Algorithm 1 Proposed Method for Long-Range Positioning
  • Require: 
  •        SSP
  •        Target depth ( z s )
  •        Beacon depth ( z r )
  •        The travel time between target and beacon i ( t i )
  •        Topography data from GEBCO
  • Ensure: 
  •        Final corrected target position (X)
  •        return
    •    (1) Perform ray tracing in a flat seafloor environment using z s , z r , and SSP.
    •    (2) Obtain the initial distances between the target and each beacon to estimate an initial position.
    •    (3) Retrieve the topography profile between this position and each beacon from the database.
    •    (4) Under the current bathymetric conditions, obtain the PESST and derive the initial sound speed model c TC PESST ( t ) .
    •    (5) Use the reference point to obtain the equivalent bathymetric error value Δ H .
    •    (6) Compensate for the sound speed deviation by Δ c = K ( t ) Δ H .
    •    (7) Obtain corrected TC-PESST.
    •    (8) Compute final distance: d i = C TC PESST ( t i ) · t i .
    •    (9) Obtain the corrected positioning result (X).

3.3. Computational Complexity and Real-Time Feasibility Analysis

A critical aspect for any AUV navigation algorithm is its feasibility for real-time implementation on computationally constrained onboard systems. The proposed TC-PESST method is designed with this consideration in mind by decoupling the computationally intensive modeling from the real-time operational tasks. The process is divided into an offline pre-computation stage and an online real-time operational stage.
  • Offline pre-computation: The offline stage, performed on a shore-based computer, involves extensive ray tracing to generate the PESST and the topography sensitivity coefficient table, K ( t ) . Let I be the number of SSP layers, R the number of (surface, bottom) reflection regions, and N R the number of discretized travel-time samples per region. Constructing the PESST evaluates the ray geometry and fits the mapping d m , n ( t ) for each region. This stage requires O ( R N R I ) arithmetic operations and stores O ( R N R ) tabulated values.
  • Online real-time operation: The online stage, executed on the AUV’s onboard processor, is highly efficient. For each acoustic ping, we (i) locate the active region, (ii) perform one binary search over the N R entries followed by a local polynomial interpolation, and (iii) solve a least-squares problem over N beacons. Steps (i)–(ii) take O ( log 2 N R ) + O ( 1 ) ; step (iii) is O ( N 3 ) in the worst case but constant in practice as N is small (≤4). Thus, the online stage has bounded time and memory and is appropriate for real-time usage.
In summary, for high-precision positioning across such large operational scales, the initial computational investment in offline ray tracing is both justified and unavoidable. This preparatory phase, which generates essential a priori data, is precisely what guarantees the high efficiency of the AUV during real-time operations. To place the online performance in context, the acoustic propagation time over a 50 km distance is on the order of tens of seconds, whereas the computational latency of the online algorithm is in the millisecond range. Therefore, the processing delay is negligible when compared to the physical measurement period.

4. Simulation Analysis

To comprehensively and systematically evaluate the performance of the proposed method, this section presents a series of simulation experiments. The basic simulation setup is first introduced, followed by a conceptual explanation of the proposed long-range sound speed modeling framework. The influence of the topography-induced error on ranging precision is then analyzed under representative bathymetric error scenarios. Finally, the effectiveness of the method is quantitatively evaluated.

4.1. Simulation Setup

The simulation experiments presented in this section were designed to evaluate the proposed method. Specifically, the acoustic ray tracing was performed using the BELLHOP toolbox, and the subsequent long-range positioning algorithms were implemented in MATLAB (Version R2022b). The experimentally measured SSP is shown in Figure 4. In the simulation, the target is located at a depth of 10 m, and the beacons are positioned at a depth of 3400 m. To simplify the model and highlight the influence of bathymetric errors, an idealized flat seafloor is defined as the ground-truth topography, with a constant depth of 3500 m. The initial bathymetric database used in the method is generated by superimposing a specific error model onto the true topography. The expression is provided by
H 0 ( x ) = H true ( x ) + Δ H ( x )
where x denotes the distance, H 0 represents the initial bathymetric data, and Δ H denotes the bathymetric error modeled by different error scenarios.
GEBCO integrates measurement data of varying quality and resolution using spatial interpolation, resulting in a gridded model with a resolution of 15 , corresponding to a horizontal precision of approximately 500 m. However, due to factors such as satellite gravity inversion, sparse shipborne measurements, and interpolation across data gaps, the dataset contains both systematic and random errors. To realistically represent these errors in the simulation, three representative bathymetric error scenarios are constructed, each reflecting a different type of error commonly observed in practice. It is important to note that these three simplified scenarios are not intended to represent all possible seafloor terrains but rather to serve as a tool for a systematic and controlled analysis of the method’s response to fundamental error archetypes (i.e., constant bias, linear trend, and periodic undulations).
Scenario 1: The error model is defined as Δ H ( x ) = a , representing a constant bias in the vertical reference plane. This scenario simulates cases where the dataset contains a constant offset, such as when the original survey data are referenced to a local mean sea level but the offset is not properly corrected during data integration.
Scenario 2: The error model is defined as Δ H ( x ) = a x , representing a linear error trend. This scenario simulates the presence of systematic gradient errors caused by the merging of datasets from different survey areas. For example, when adjacent regions are surveyed in different years using different equipment, the fusion of these datasets into a unified database may introduce large-scale approximately linear slope errors near the stitching boundaries.
Scenario 3: The error model is defined as Δ H = a sin ( 2 π x / b ) , representing a smooth periodic error added over distance. This scenario simulates regional-scale undulations introduced by grid model interpolation. For example, in areas where historical and low-resolution bathymetric data are used, the resulting bathymetry model often represents a smoothed approximation of the actual seafloor. This smoothing effect can obscure periodic geomorphological features formed by ocean currents and sedimentary processes, such as submarine sand slopes, dunes, or ridges.
These three error models reflect typical error characteristics that may exist in practical bathymetric datasets used in ocean applications. Based on these models, the impact of bathymetric error on the performance of long-range acoustic positioning can be systematically analyzed.

4.2. Performance Analysis

4.2.1. Construction of the Sound Speed Model

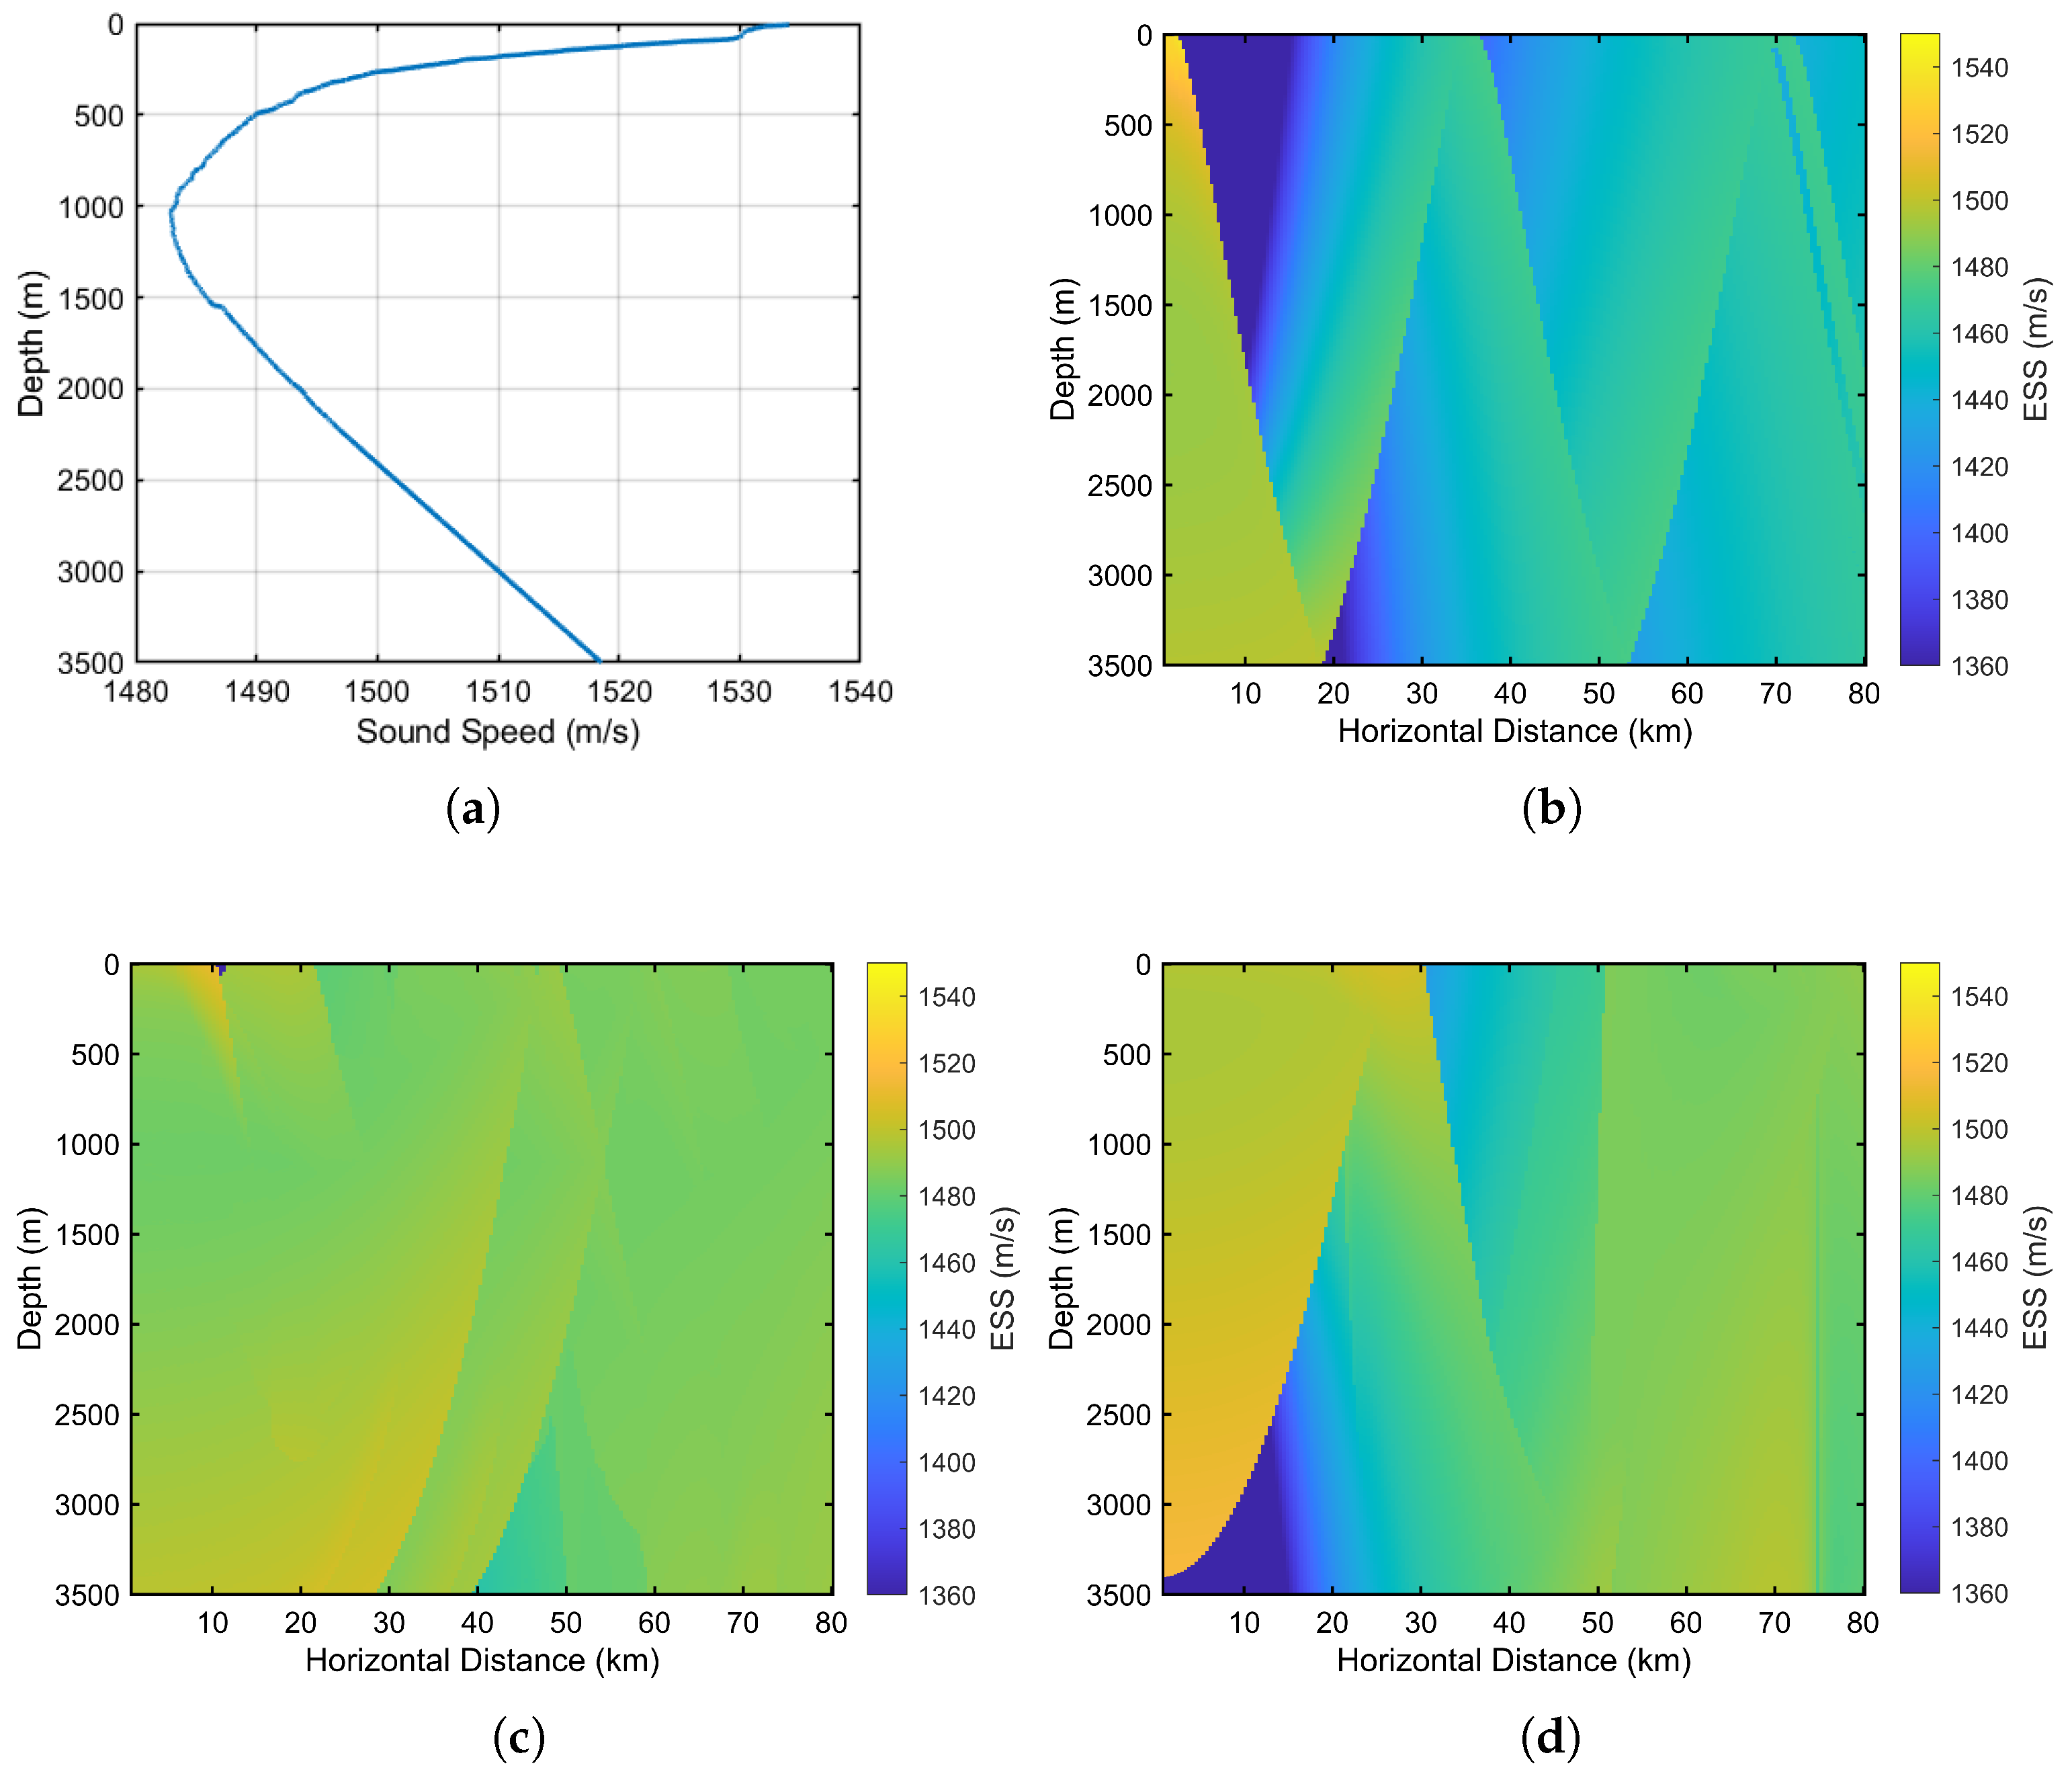
The simulation is configured for a flat seabed environment with a water depth of 3500 m. The SSP employed is based on in situ data measured in the South China Sea. Figure 4a presents the measured SSP, which is characteristic of a deep-water channel, featuring a sound channel axis at approximately 1100 m. The subsequent panels, Figure 4b–d, illustrate the resulting spatial distribution of the ESS for sources placed at three distinct depths: 10 m, 1100 m, and 3400 m. These figures reveal that the source depth critically influences this distribution. For a near-surface source (10 m, Figure 4b), the acoustic rays experience numerous surface and bottom reflections, causing the ESS to exhibit substantial spatial variations and periodic fluctuations at extended ranges. In contrast, a source located at the sound channel axis (1100 m, Figure 4c) yields highly stable propagation paths, with acoustic energy largely trapped within the channel. This results in a more uniform distribution and a lower gradient of the ESS at long distances. For a near-bottom source (3400 m, Figure 4d), the ESS shows attenuated variations in the upper ocean layers but a more intricate distribution in deeper water. Comprehensive analysis confirms that the transmitting and receiving depths jointly determine the main propagation characteristics, which in turn determine the spatial distribution of the ESS over long distances.
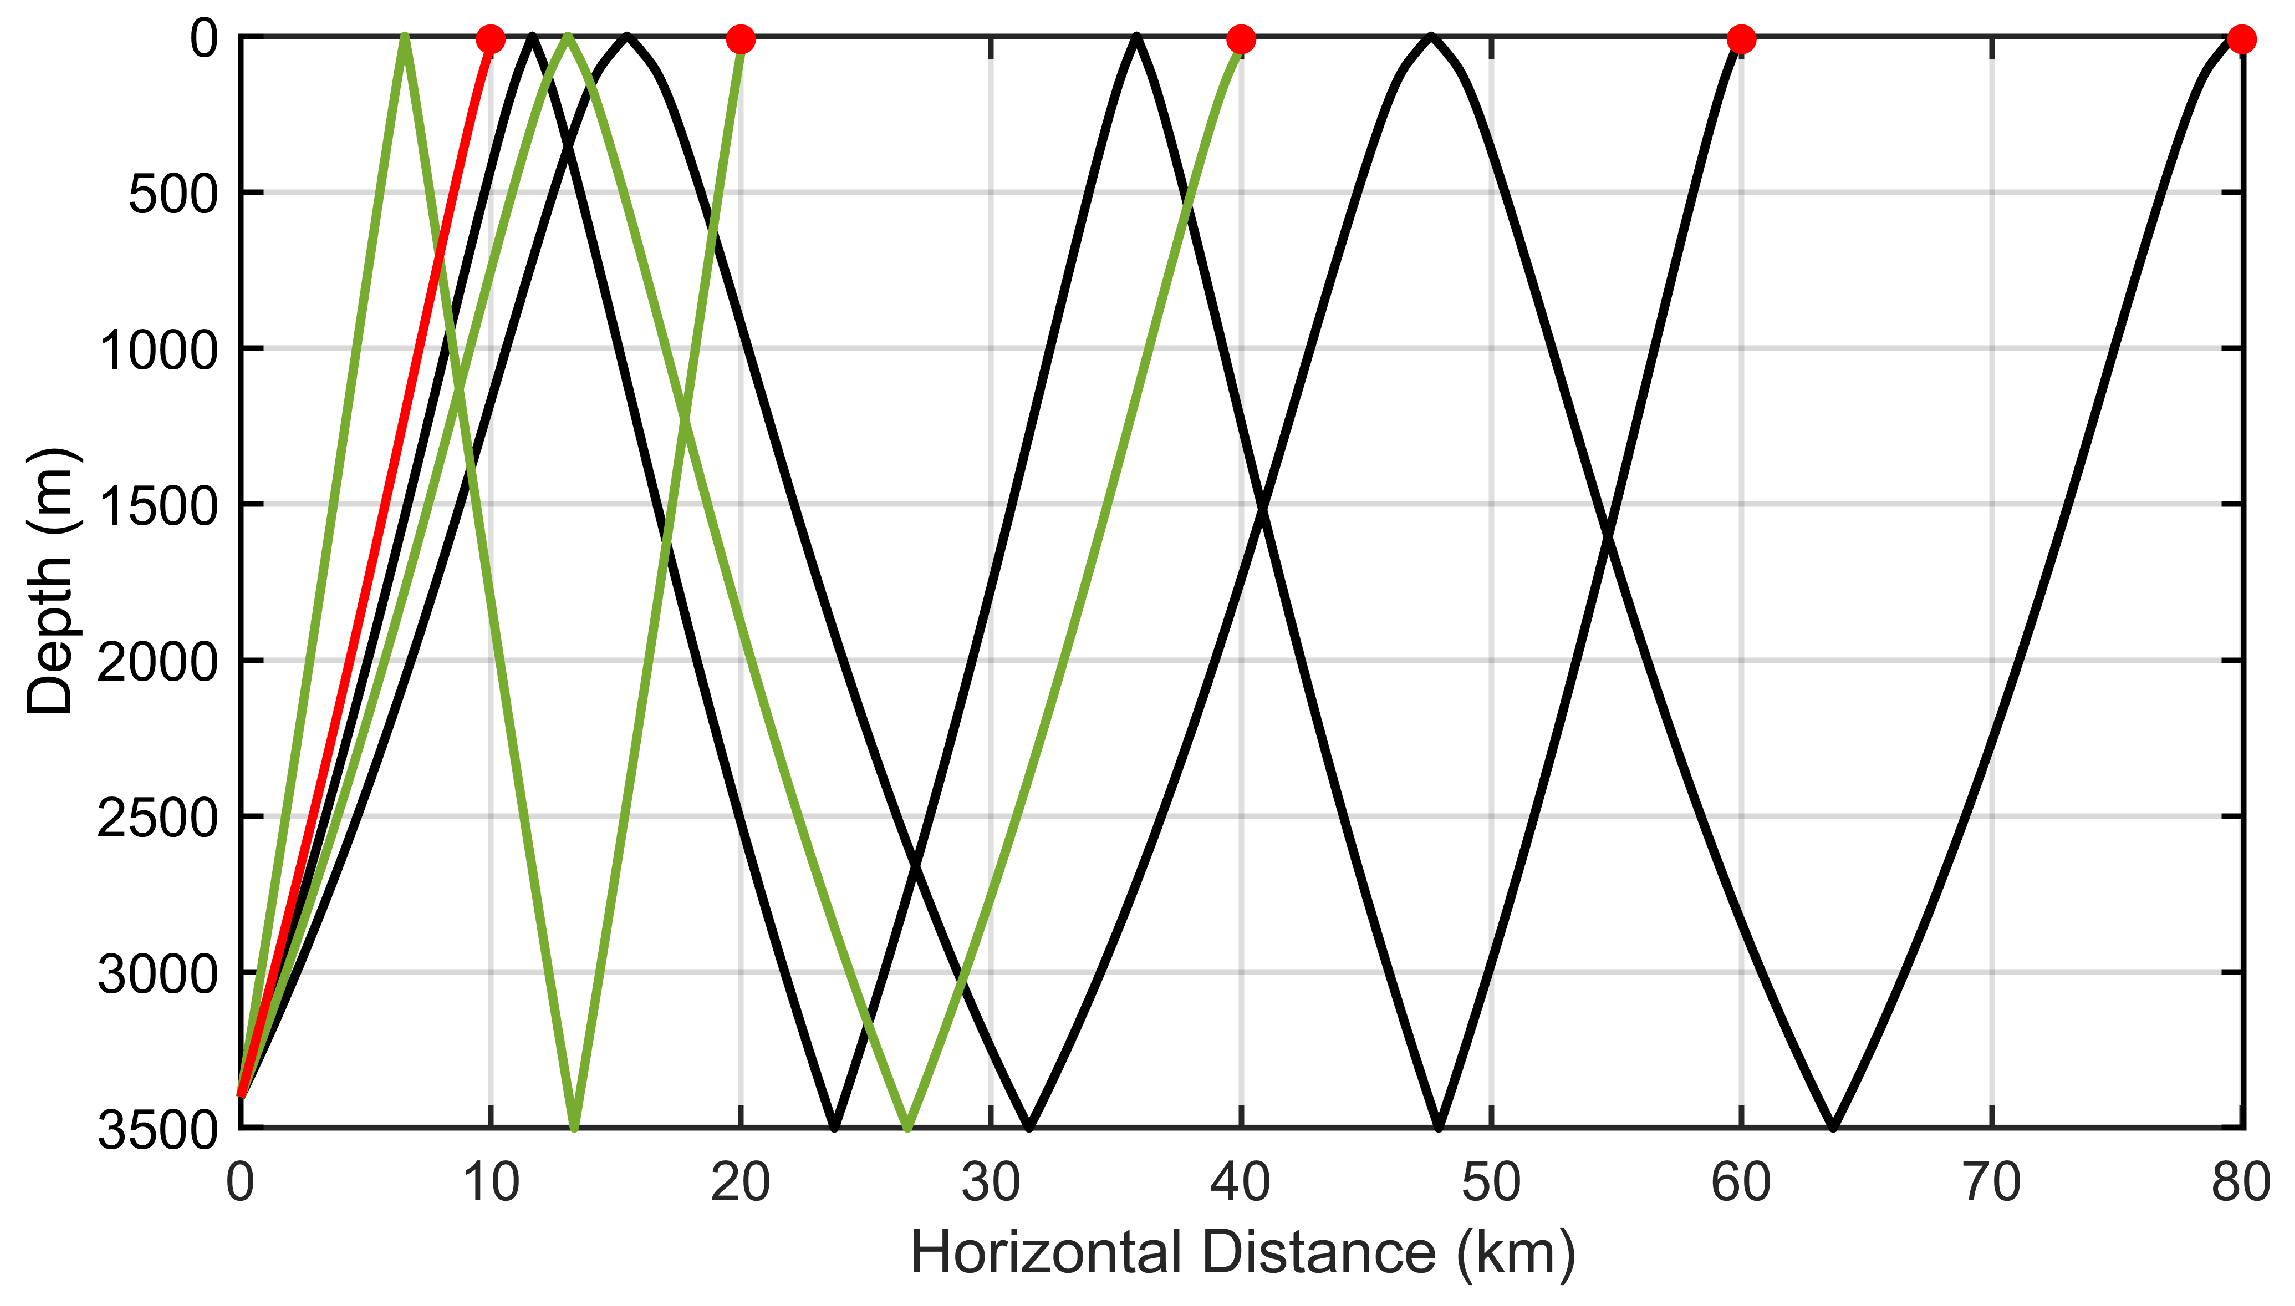
The algorithm proposed herein is subsequently demonstrated using a scenario with a target at 10 m depth and a beacon at 3400 m depth. Figure 5 illustrates the variation in acoustic propagation paths at horizontal distances of 10 km, 20 km, 40 km, 60 km, and 80 km. It can be observed that, as the propagation distance increases, the direct path gradually disappears, and the acoustic rays undergo multiple reflections between the sea surface and the seafloor. As a result, n-th order surface–bottom reflected paths become the dominant propagation mode for long-range positioning.
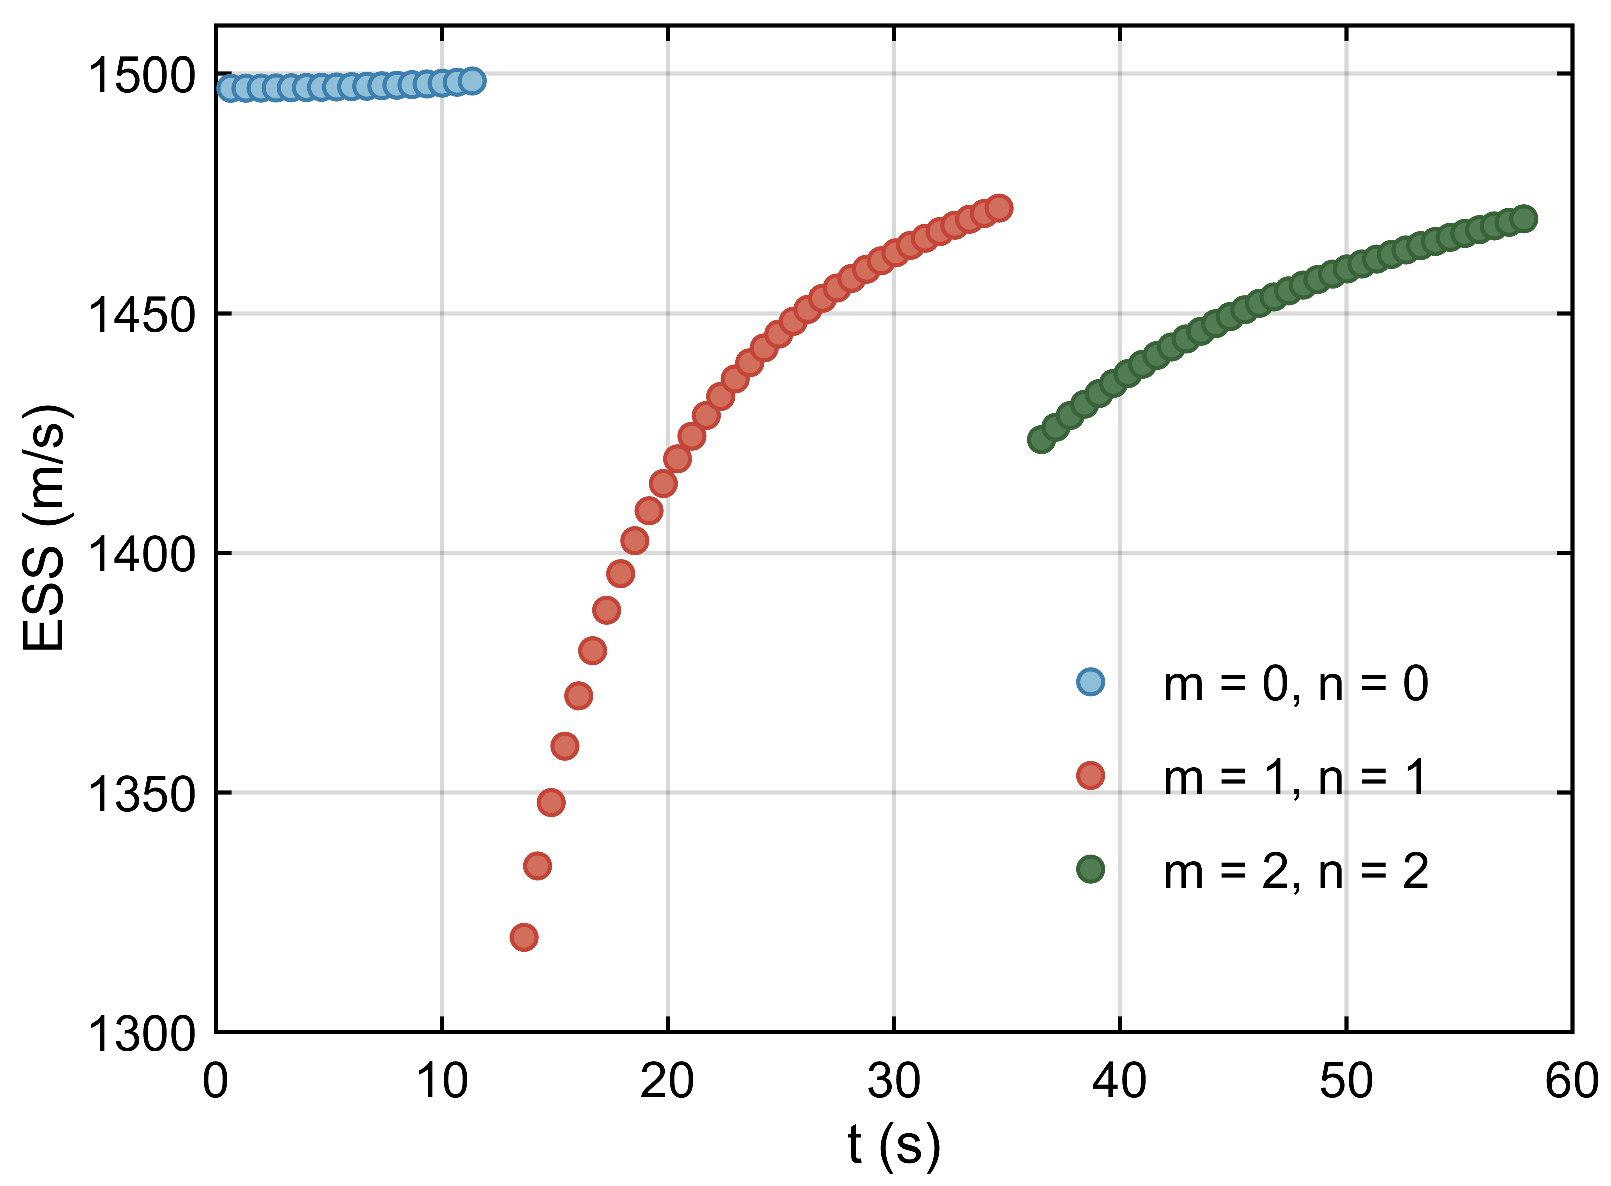
Using the PESST modeling framework described in Section 3.1, a sound speed model is constructed assuming a flat seafloor, and the spatial distribution characteristics of the ESS are analyzed. Figure 6 presents the PESST, which includes the direct path, surface–bottom reflected path, and the surface–bottom–surface–bottom reflected path. These paths reach maximum travel times of 11.3 s, 34.7 s, and 57.8 s, with corresponding horizontal distances of 17 km, 51 km, and 85 km. The change in dominant propagation paths leads to abrupt adjustments in the ESS near inter-region boundaries, exhibiting a typical discontinuity. The aforementioned theory and simulation establish a physical basis for modeling long-range multipath propagation, thereby supporting subsequent sound speed error correction and long-range measurement model optimization.

4.2.2. Analysis of the Impact of the Bathymetric Error

Using a uniform flat seafloor at 3500 m as the reference ground truth, various types of bathymetric errors are introduced into the observation region. A comparative analysis of the effects of three typical bathymetric error models on long-range acoustic propagation paths is shown in Figure 7. Although all acoustic rays are simulated with a fixed propagation distance of 40 km, differences in the underlying bathymetry models lead to variations in the reflection point locations, which in turn cause deviations in the integrated acoustic travel time. It is important to note that the bathymetric errors discussed in this study do not refer to depth errors at the measurement point but rather to depth deviations at the ray reflection points. This distinction increases the complexity of bathymetric error estimation and compensation.
Within the analytical framework adopted in this study, all reference bathymetry models are ultimately mapped into the relationship between travel time and sound speed. The sound speed model thus forms the foundation for both distance and position estimation. The measurement errors caused by different types of bathymetric errors are shown in Figure 8, respectively.
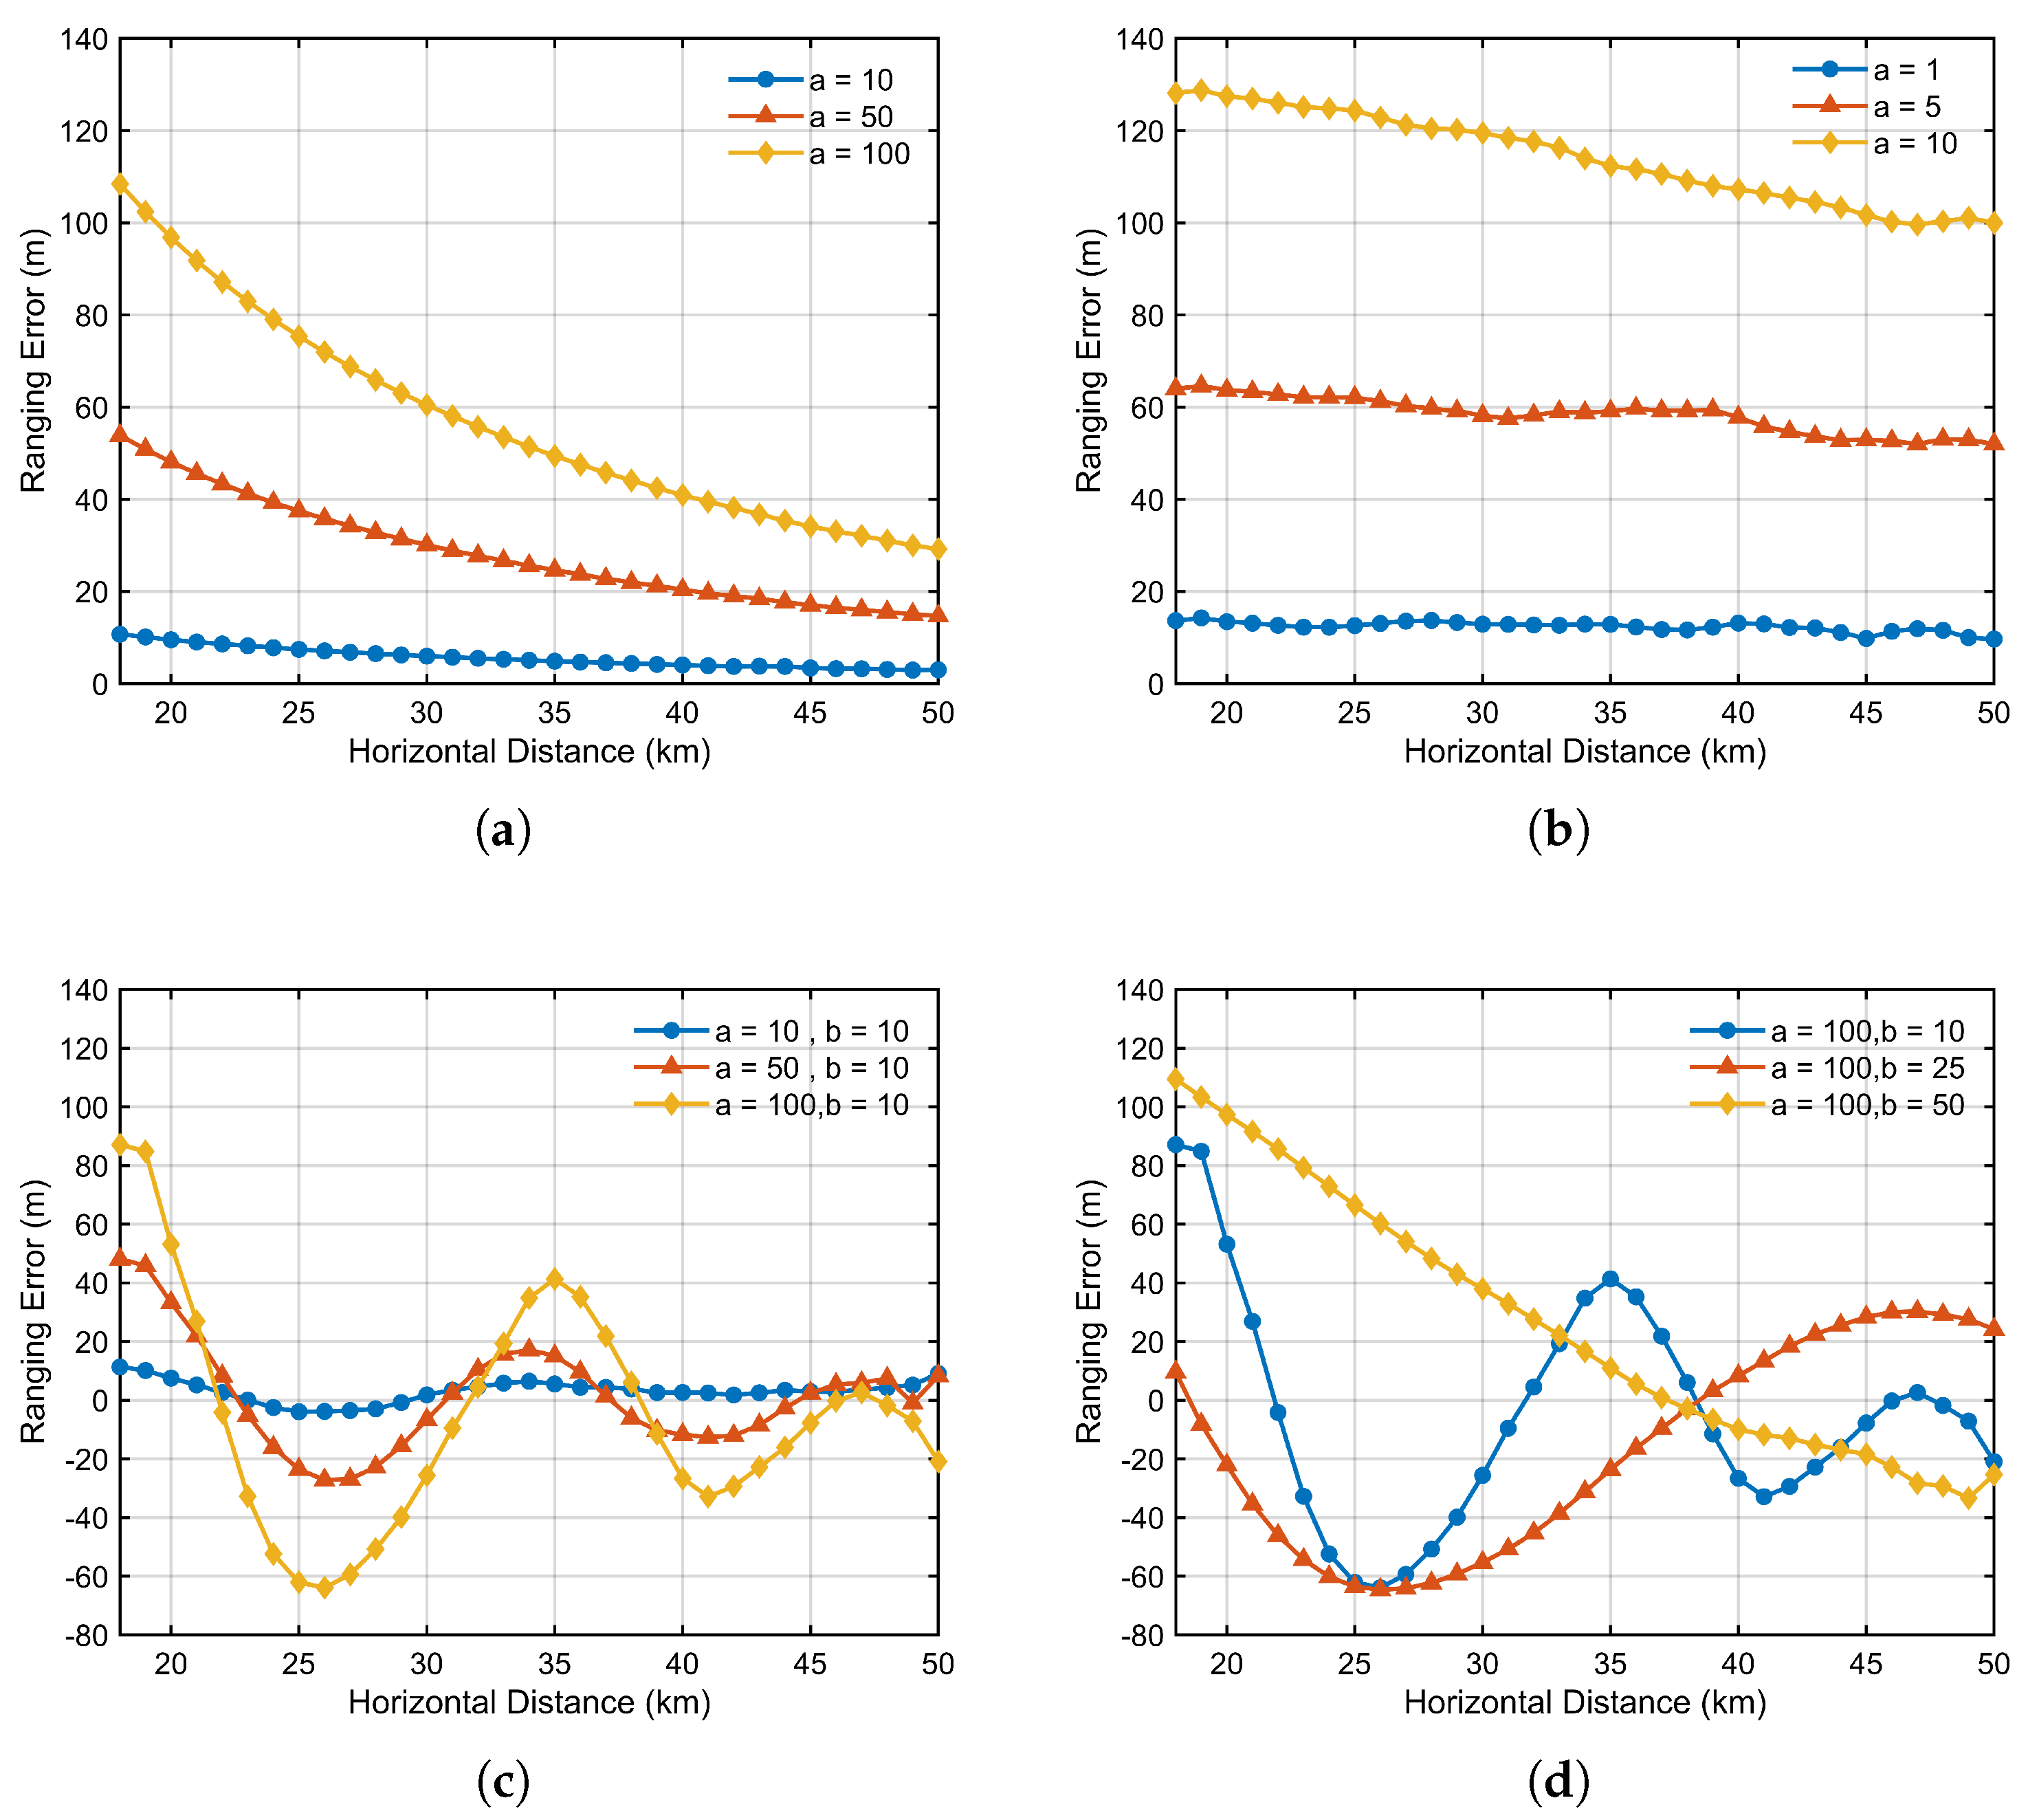
Under different bathymetric error scenarios, the trends of sound speed estimation error and ranging error are generally consistent. Within the same reflected-path region, shorter horizontal distances tend to be more sensitive to topography perturbations, often resulting in ranging errors of the same order of magnitude as the bathymetric deviation. For example, in the constant bias scenario in Figure 8a, when the bias reaches 100 m, the ranging error exceeds 110 m at a horizontal distance of 18 km. In the linear error scenario in Figure 8b, the bathymetric deviation increases with distance. However, even at a horizontal distance of 50 km, the resulting ranging error remains smaller than that observed at 18 km, indicating that long-range propagation exhibits greater tolerance to topography-induced errors. The most complex behavior is observed in the sinusoidal error scenario, as shown in Figure 8c,d. This case analyzes the impact of sinusoidal bathymetry perturbations with varying amplitudes and frequencies on ranging precision. The depth profiles at the seafloor reflection points reveal that the ranging error varies periodically, consistent with the underlying bathymetric error. However, the amplitude of this error oscillation decreases as the propagation distance increases.
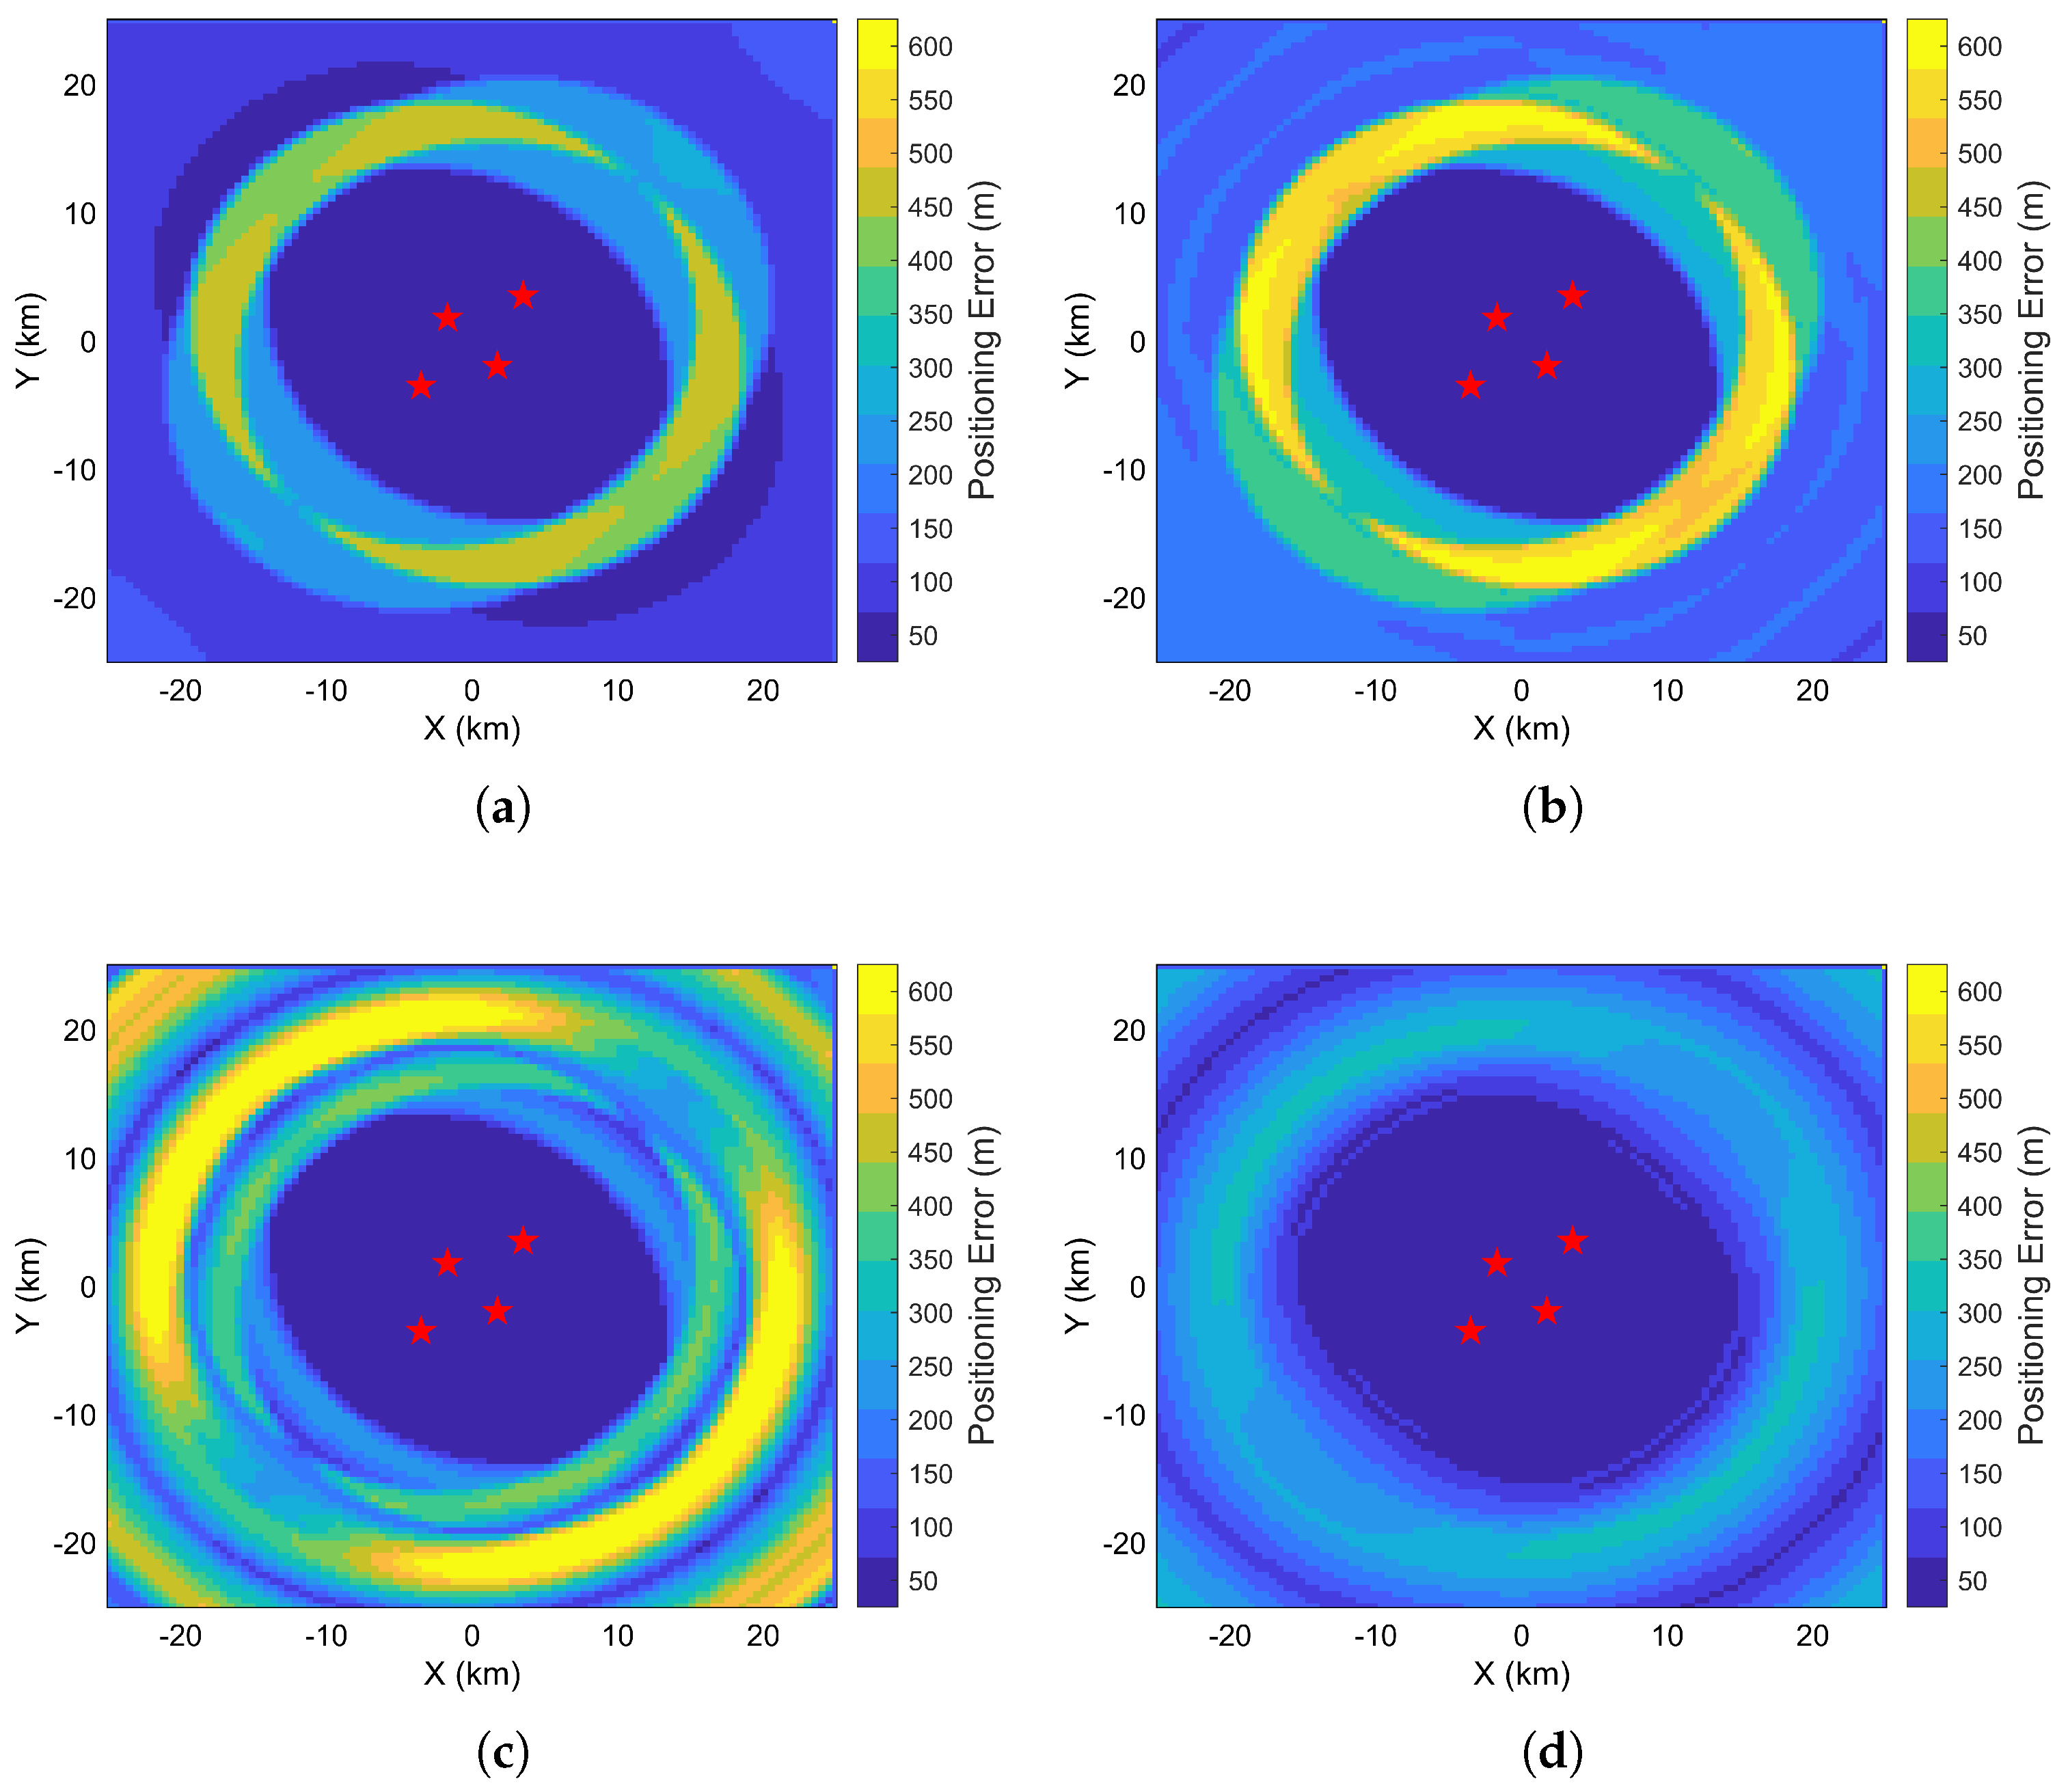
On this basis, the resulting positioning errors are shown in Figure 9, with the array configuration consistent with that used in the subsequent South China Sea experiment. Compared to the ideal case considering only the geometric layout of the stations, the introduction of topography effects causes a substantial increase in the overall positioning error. More importantly, the spatial distribution of the error is fundamentally transformed: it no longer follows the symmetric and smooth pattern dictated by the GDOP. Instead, it evolves into a complex irregular structure with strong directional dependence. These findings highlight the sensitivity of long-range acoustic positioning to seafloor topography sensitivity and emphasize the necessity of incorporating bathymetric error compensation into the positioning framework to ensure robust and reliable performance in practical applications.
In summary, regardless of the error scenario, the depth error at the seafloor reflection point corresponding to a given propagation distance determines the magnitude of the sound speed estimation error and the resulting ranging error at that measurement point. Moreover, the observed complex nonlinear mapping relationship is consistent with the topography sensitivity coefficient introduced in Section 3.2, providing a theoretical foundation for modeling and compensating for topography-induced errors.

4.2.3. Simulation-Based Validation of the Bathymetric Error Compensation Method

In practical data processing, accurately estimating and inverting large-scale bathymetric errors poses a significant challenge. However, the resulting errors in sound speed estimation and ranging represent a non-negligible source of uncertainty in acoustic positioning systems. Sound speed model correction essentially serves as a compensation for propagation errors caused by bathymetric deviations. In this study, a reference-station-based compensation approach is adopted. The selection of reference stations can be interpreted as an inversion of the bathymetric error at the seafloor reflection points corresponding to specific propagation ranges. The locally inferred bathymetric deviation from the reference station is then used as a proxy to approximate the regional distribution of topography-induced errors. Although this inversion method may not fully capture the actual complexity of seafloor bathymetric variations, it offers a practical means of enabling real-time correction of the model within the target region.
The compensation strategy in the proposed method is divided into two approaches:
  • Short-range compensation (SRC): Given the higher sensitivity of short distances to bathymetric errors, the SRC approach uses the ground-truth value at 18 km, located in the overlapping region of the direct and reflected paths, to calibrate the ranging across the entire area.
  • Multi-range compensation (MRC): As indicated by the previous analysis of bathymetric error effects, more reference points are required in complex regions to ensure compensation precision. Therefore, the MRC approach employs multiple reference values spaced at 10 km intervals within the region to perform ranging correction.
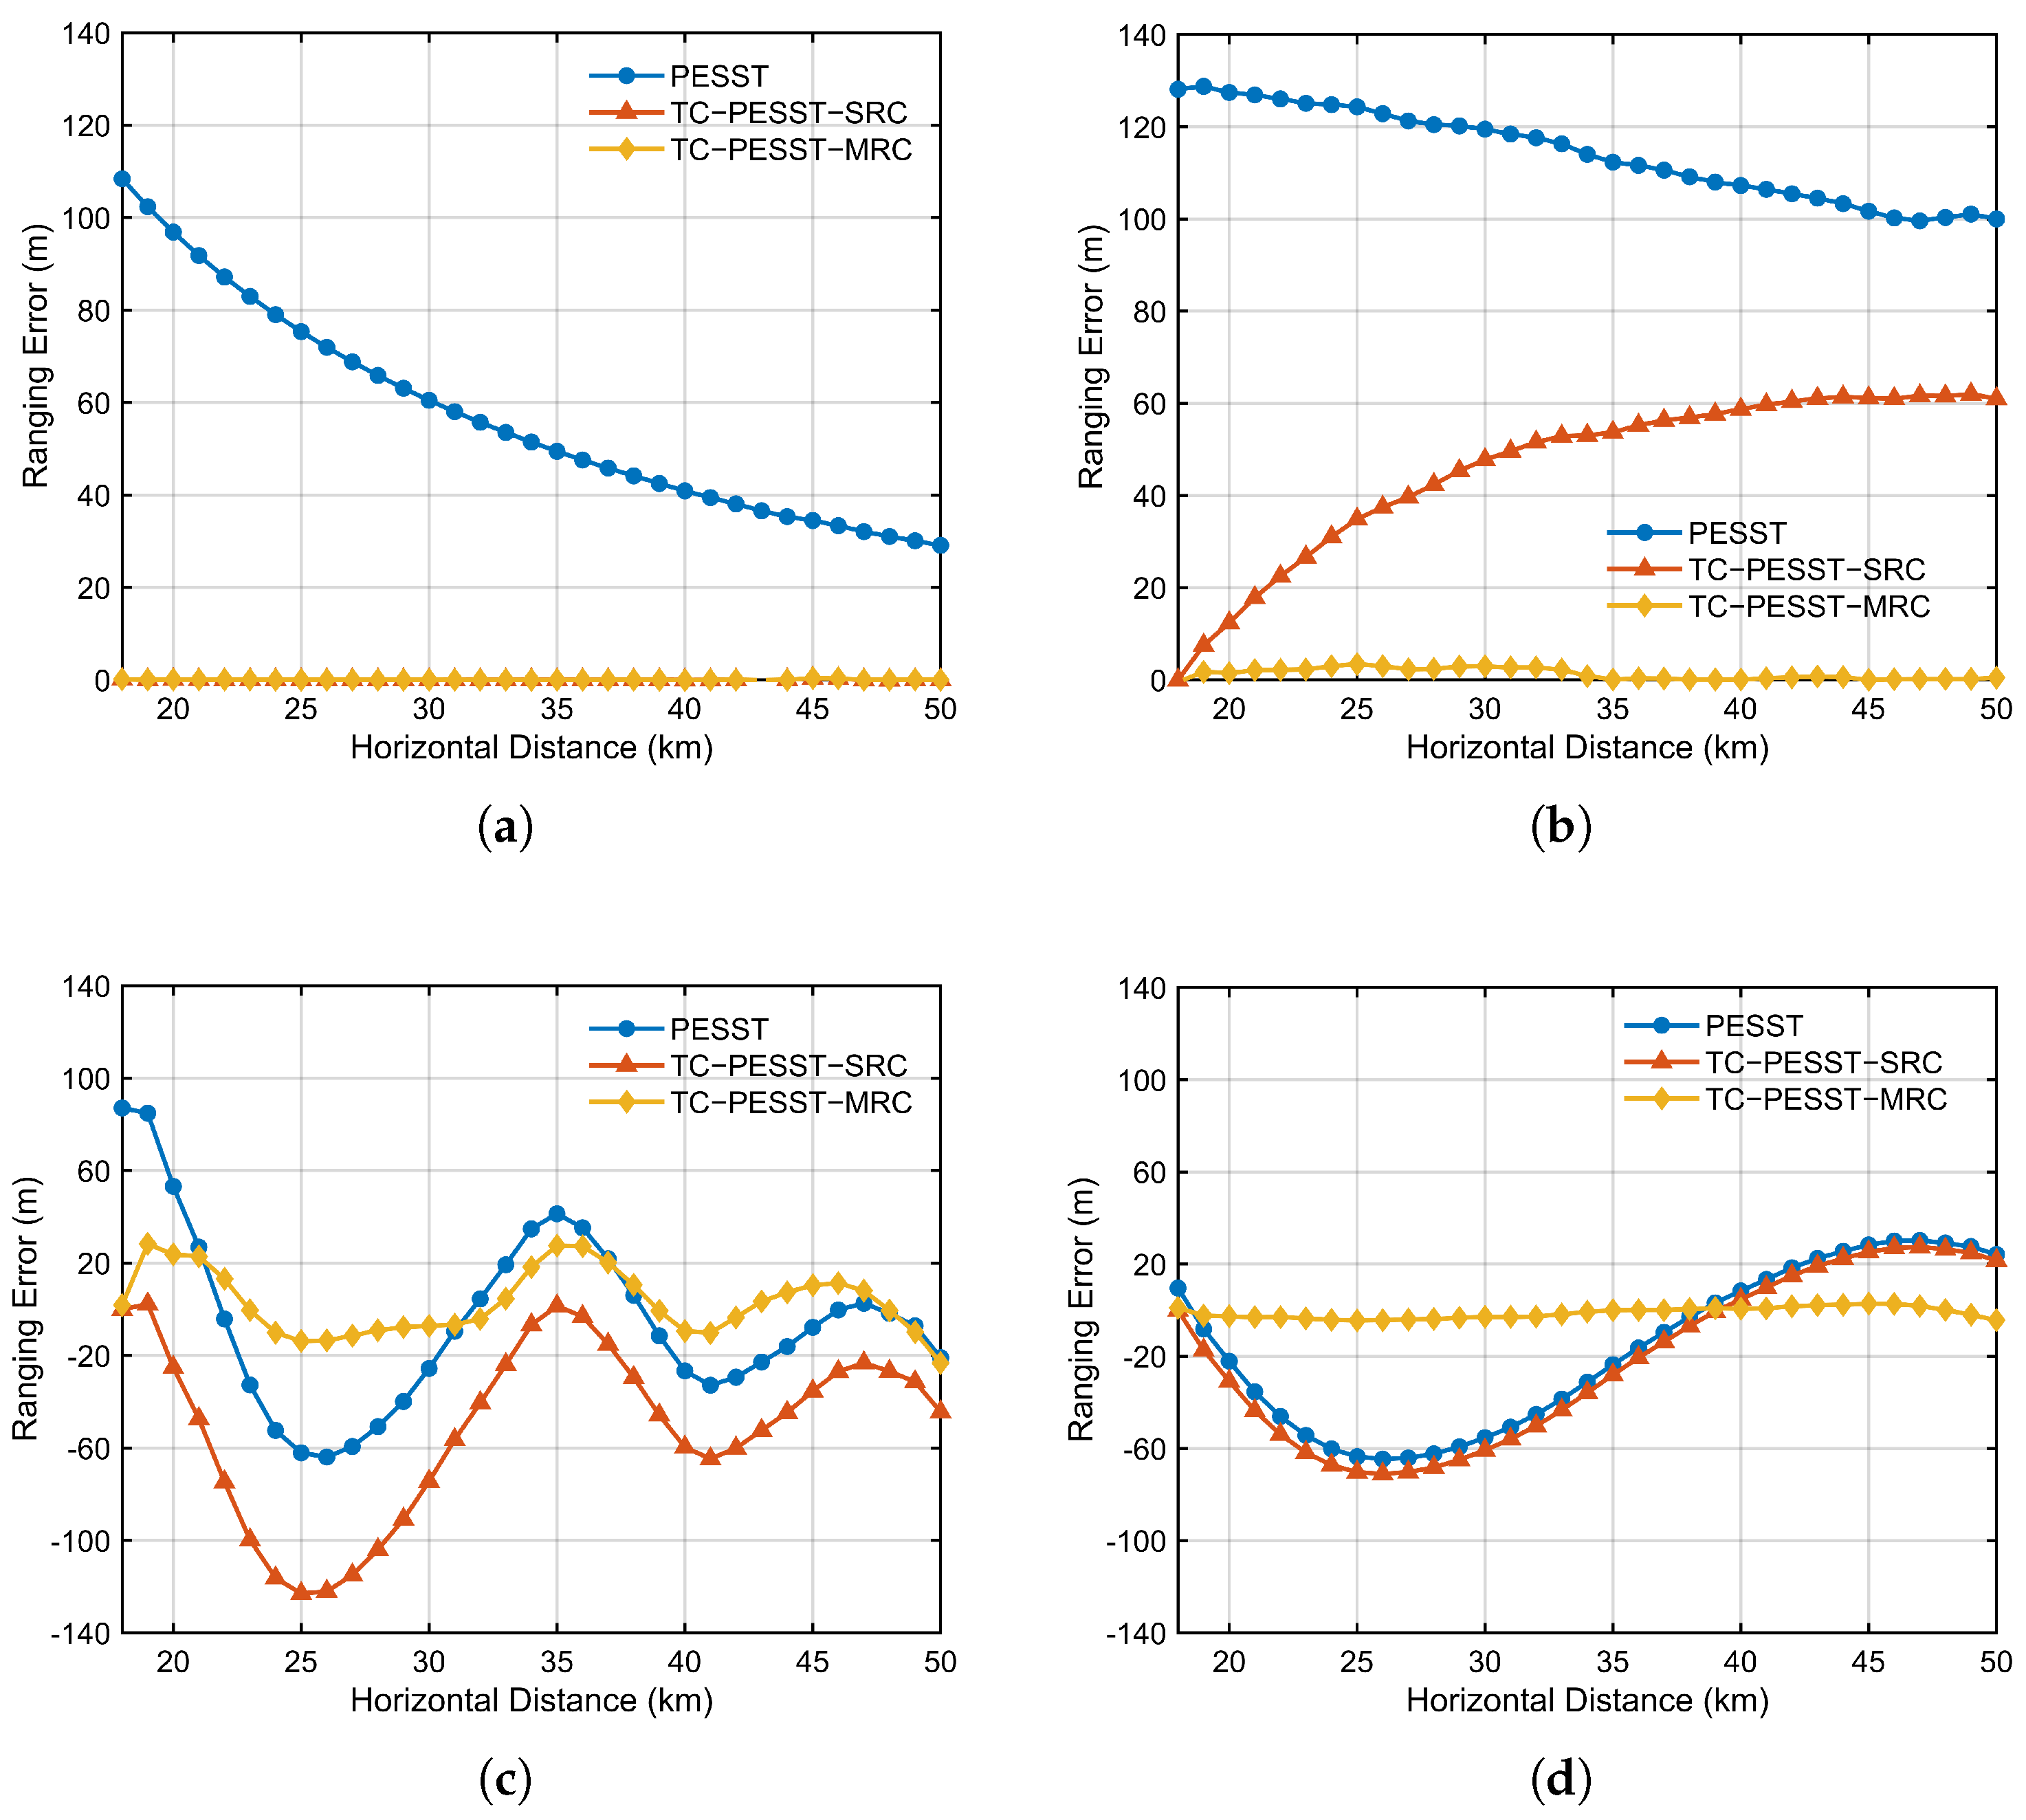
As shown in Figure 10, the ranging compensation results under different bathymetric error models are presented. In Figure 10a, where the bathymetric error is constant, the single-point compensation approach is sufficient to achieve high-precision ranging across the entire region. In contrast, under linearly varying bathymetric error conditions in Figure 10b, single-point correction inevitably introduces new slope errors at other locations, leading to incomplete compensation. This issue can be mitigated by increasing the number of reference points. For periodic bathymetric errors, the compensation performance under different oscillation wavelengths is shown in Figure 10c,d. In such cases, the spatially oscillating deviations cannot be effectively corrected by a single reference point and may even amplify the ranging error. Increasing the number of reference points improves the compensation performance under these conditions.
To quantitatively evaluate the positioning performance in the simulation, the root mean square error (RMSE) and error suppression ratio (ESR) are used as the primary metrics. The RMSE is defined as
RMSE = 1 N k = 1 N X ^ k X k 2
where N is the total number of samples, X ^ k is the estimated value, and X k is the true reference value.
The ESR is defined as
ESR = E before E after E before × 100 %
where E before and E after denote the error levels before and after suppression, respectively.
In order to study the effect of reference point density on algorithm performance, Figure 11 shows the changes in these two metrics under different oscillation periods and reference point densities within the reflected-path region. The results indicate that deploying a denser network of reference points in complex environments can effectively reduce the impact of environmental uncertainties and improve the precision of long-range ranging and positioning.
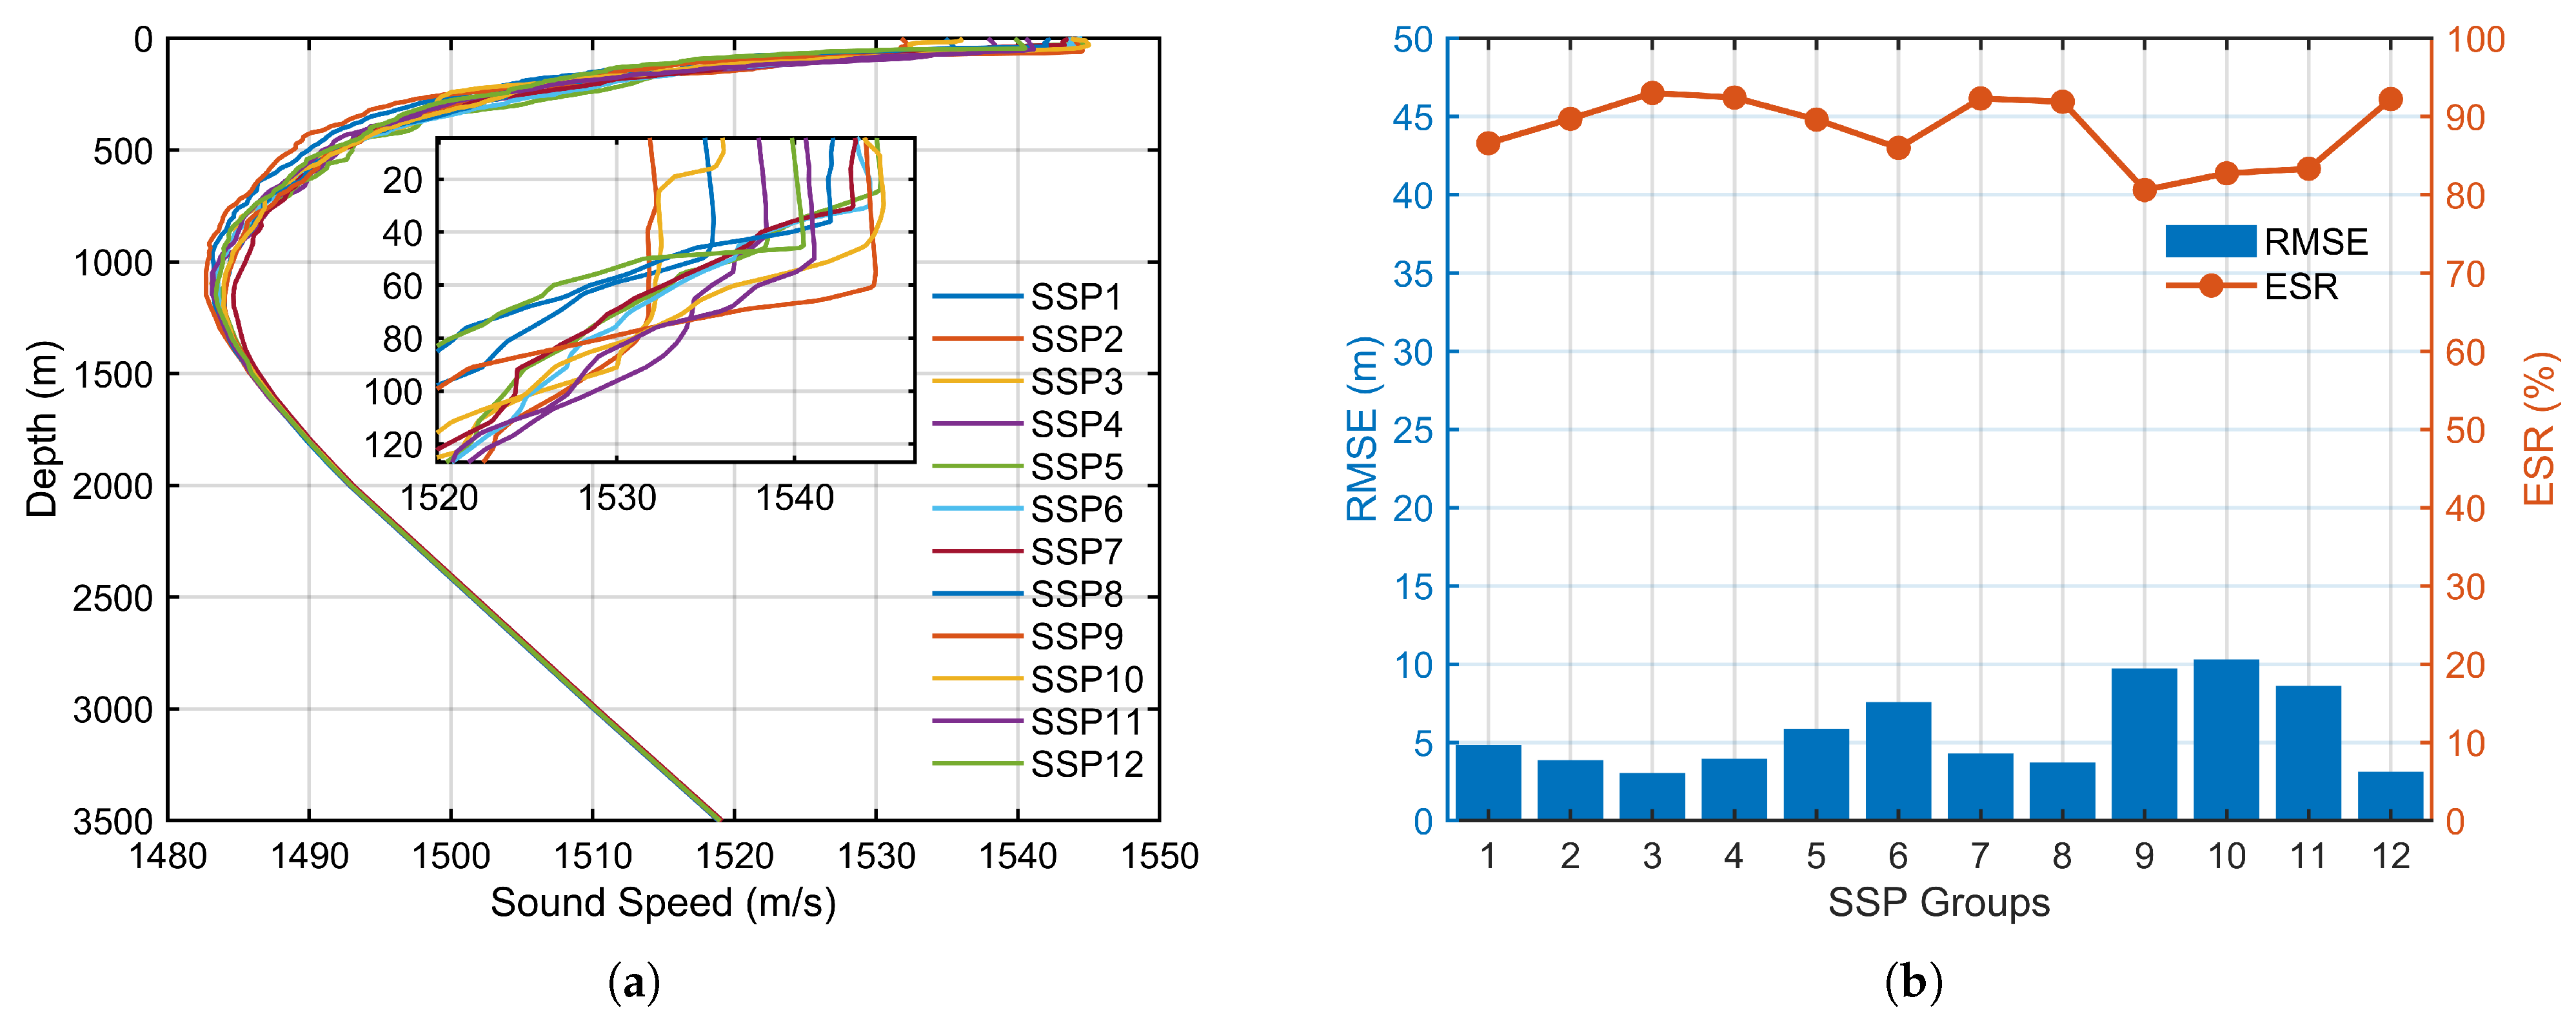
To rigorously evaluate the algorithm’s robustness against realistic temporal variations in the ocean environment, we expanded our simulation study. We utilized 12 historical experimentally measured SSPs obtained from a public database for the same sea region as our experiment, with each profile corresponding to a different month of the year, as shown in Figure 12a. The proposed compensation method was then systematically tested against different SSP conditions, assuming a consistent underlying bathymetric error model, as shown in Figure 12b. The final ranging RMSE was consistently maintained below 10 m. Concurrently, the ESR remained stable and consistently above 80%. This consistent performance, despite significant month-to-month variations in the sound speed structure, confirms the robustness of our proposed compensation algorithm. It validates the method’s effectiveness for practical applications in dynamic deep-sea environments where environmental conditions fluctuate over time.
5. Experimental Validation

5.1. Overview of Experimental Conditions

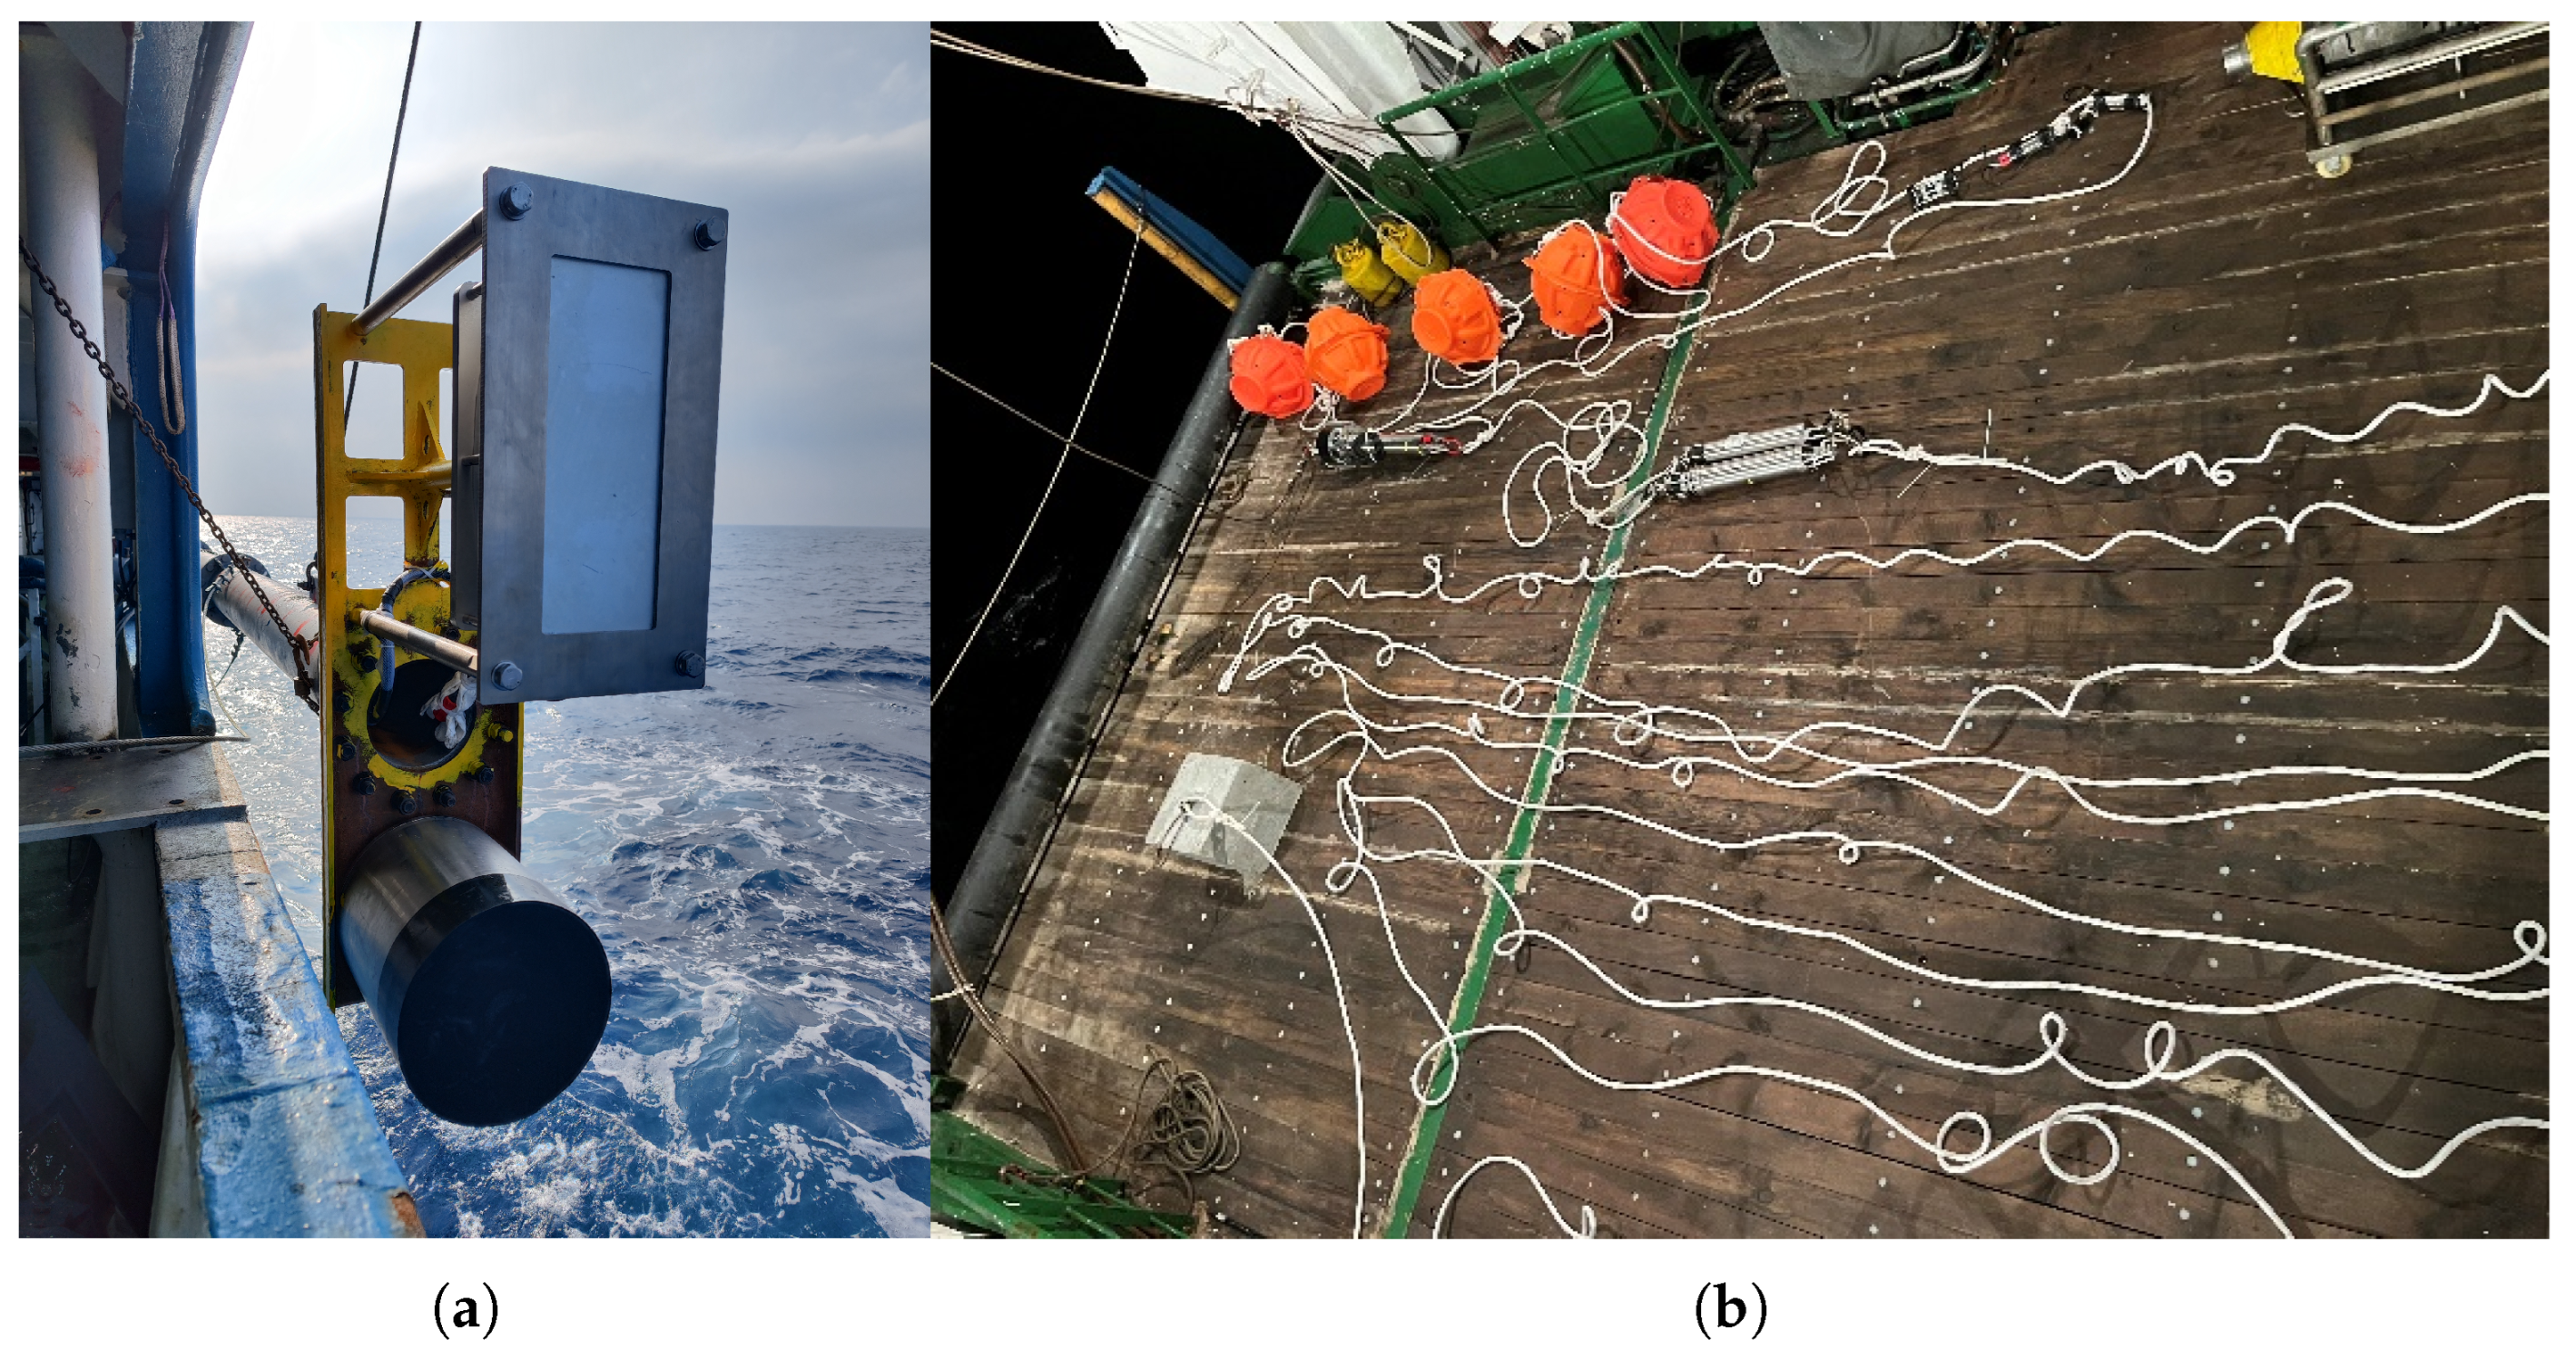
In April 2023, a long-range deep-sea measurement experiment was conducted in the South China Sea. The experimental setup is shown in Figure 1. A low-frequency acoustic source was rigidly mounted on the side of the ship at a depth of 10 m in Figure 13a. The sound source level (SSL) utilized in the experiment was maintained at approximately 168 dB. A schematic and a photograph of the seafloor beacon system are shown in Figure 13b. The system consists of a heavy weight, a calibration beacon, an underwater sound recorder (USR), and several floats. By utilizing sea surface circling track and crossing track positioning, the absolute position of the beacon can be determined. The depth of the USR is calculated to be 3380 m. Synchronization among the beacons and the target was achieved via a post-processing methodology, enabled by high-stability rubidium atomic clocks integrated within each USR. Prior to deployment, the clocks were synchronized, and the USRs were programmed with a common start time. The signal transmission time was logged at the start of the experiment. Upon instrument recovery, the signal’s time of arrival (TOA) was determined from the acoustic waveform, allowing the propagation time to be calculated as the difference between the TOA and the transmission time. The accuracy of this method is underpinned by the clock’s exceptional stability, and pre-deployment testing confirmed a time drift of less than 40 µs over a 10 h period, ensuring the integrity of the propagation time measurements.
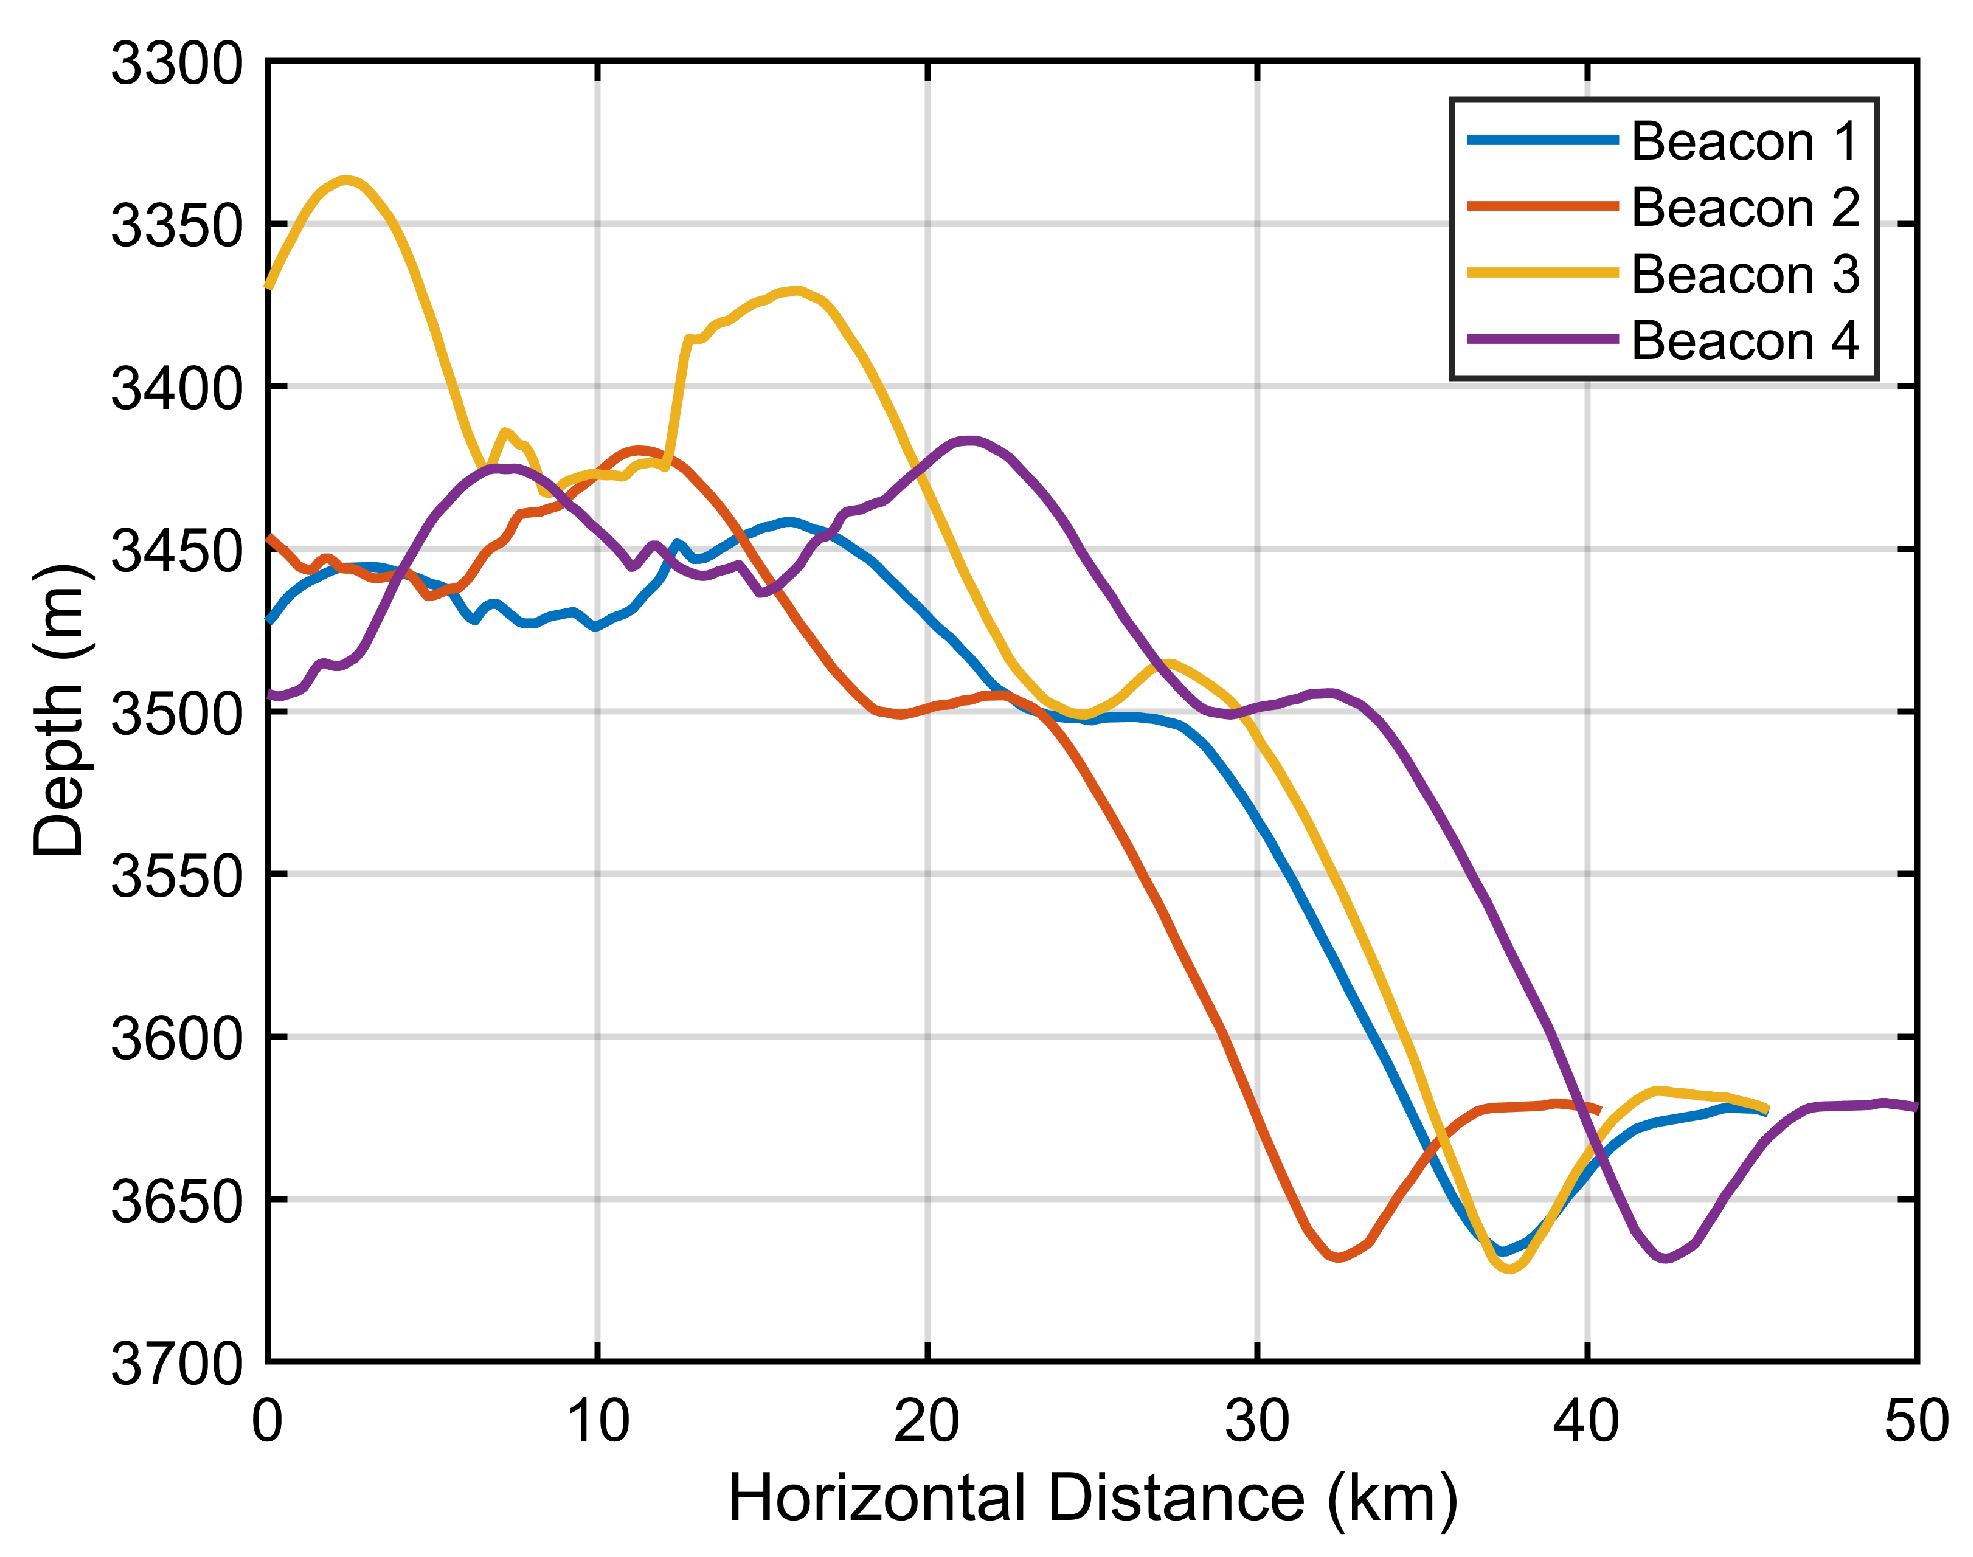
The experimentally measured SSP is shown in Figure 4. The relative position between the target trajectory and the beacon is shown in Figure 14, with the maximum distance reaching up to 50 km. The seafloor profile along the line connecting the target endpoint and the beacon is shown in Figure 15, where the depth ranges from approximately 3400 m to 3700 m. The figure indicates that the experimental area lies at the boundary between a seamount and a trench. Such complex topography may lead to measurement errors in the database and negatively affect long-range measurement precision. This complex and realistic environment serves as an ideal testbed for evaluating the proposed method’s generalization capability beyond the simplified scenarios analyzed in the simulation. Furthermore, the deployment of beacons in this area adhered to standard operational practices, which typically avoid the most extreme topographical features to ensure stability and reliable acoustic paths, making our validation representative of practical application scenarios.

5.2. Experimental Results

During the experiment, a synchronizer periodically triggered the acoustic source. The source emitted hyperbolic frequency modulation (HFM) signals with a center frequency of 350 Hz, a bandwidth of 150 Hz, a pulse duration of 10 s, and a transmission interval of 300 s. A total of 88 datasets were recorded during the experiment.
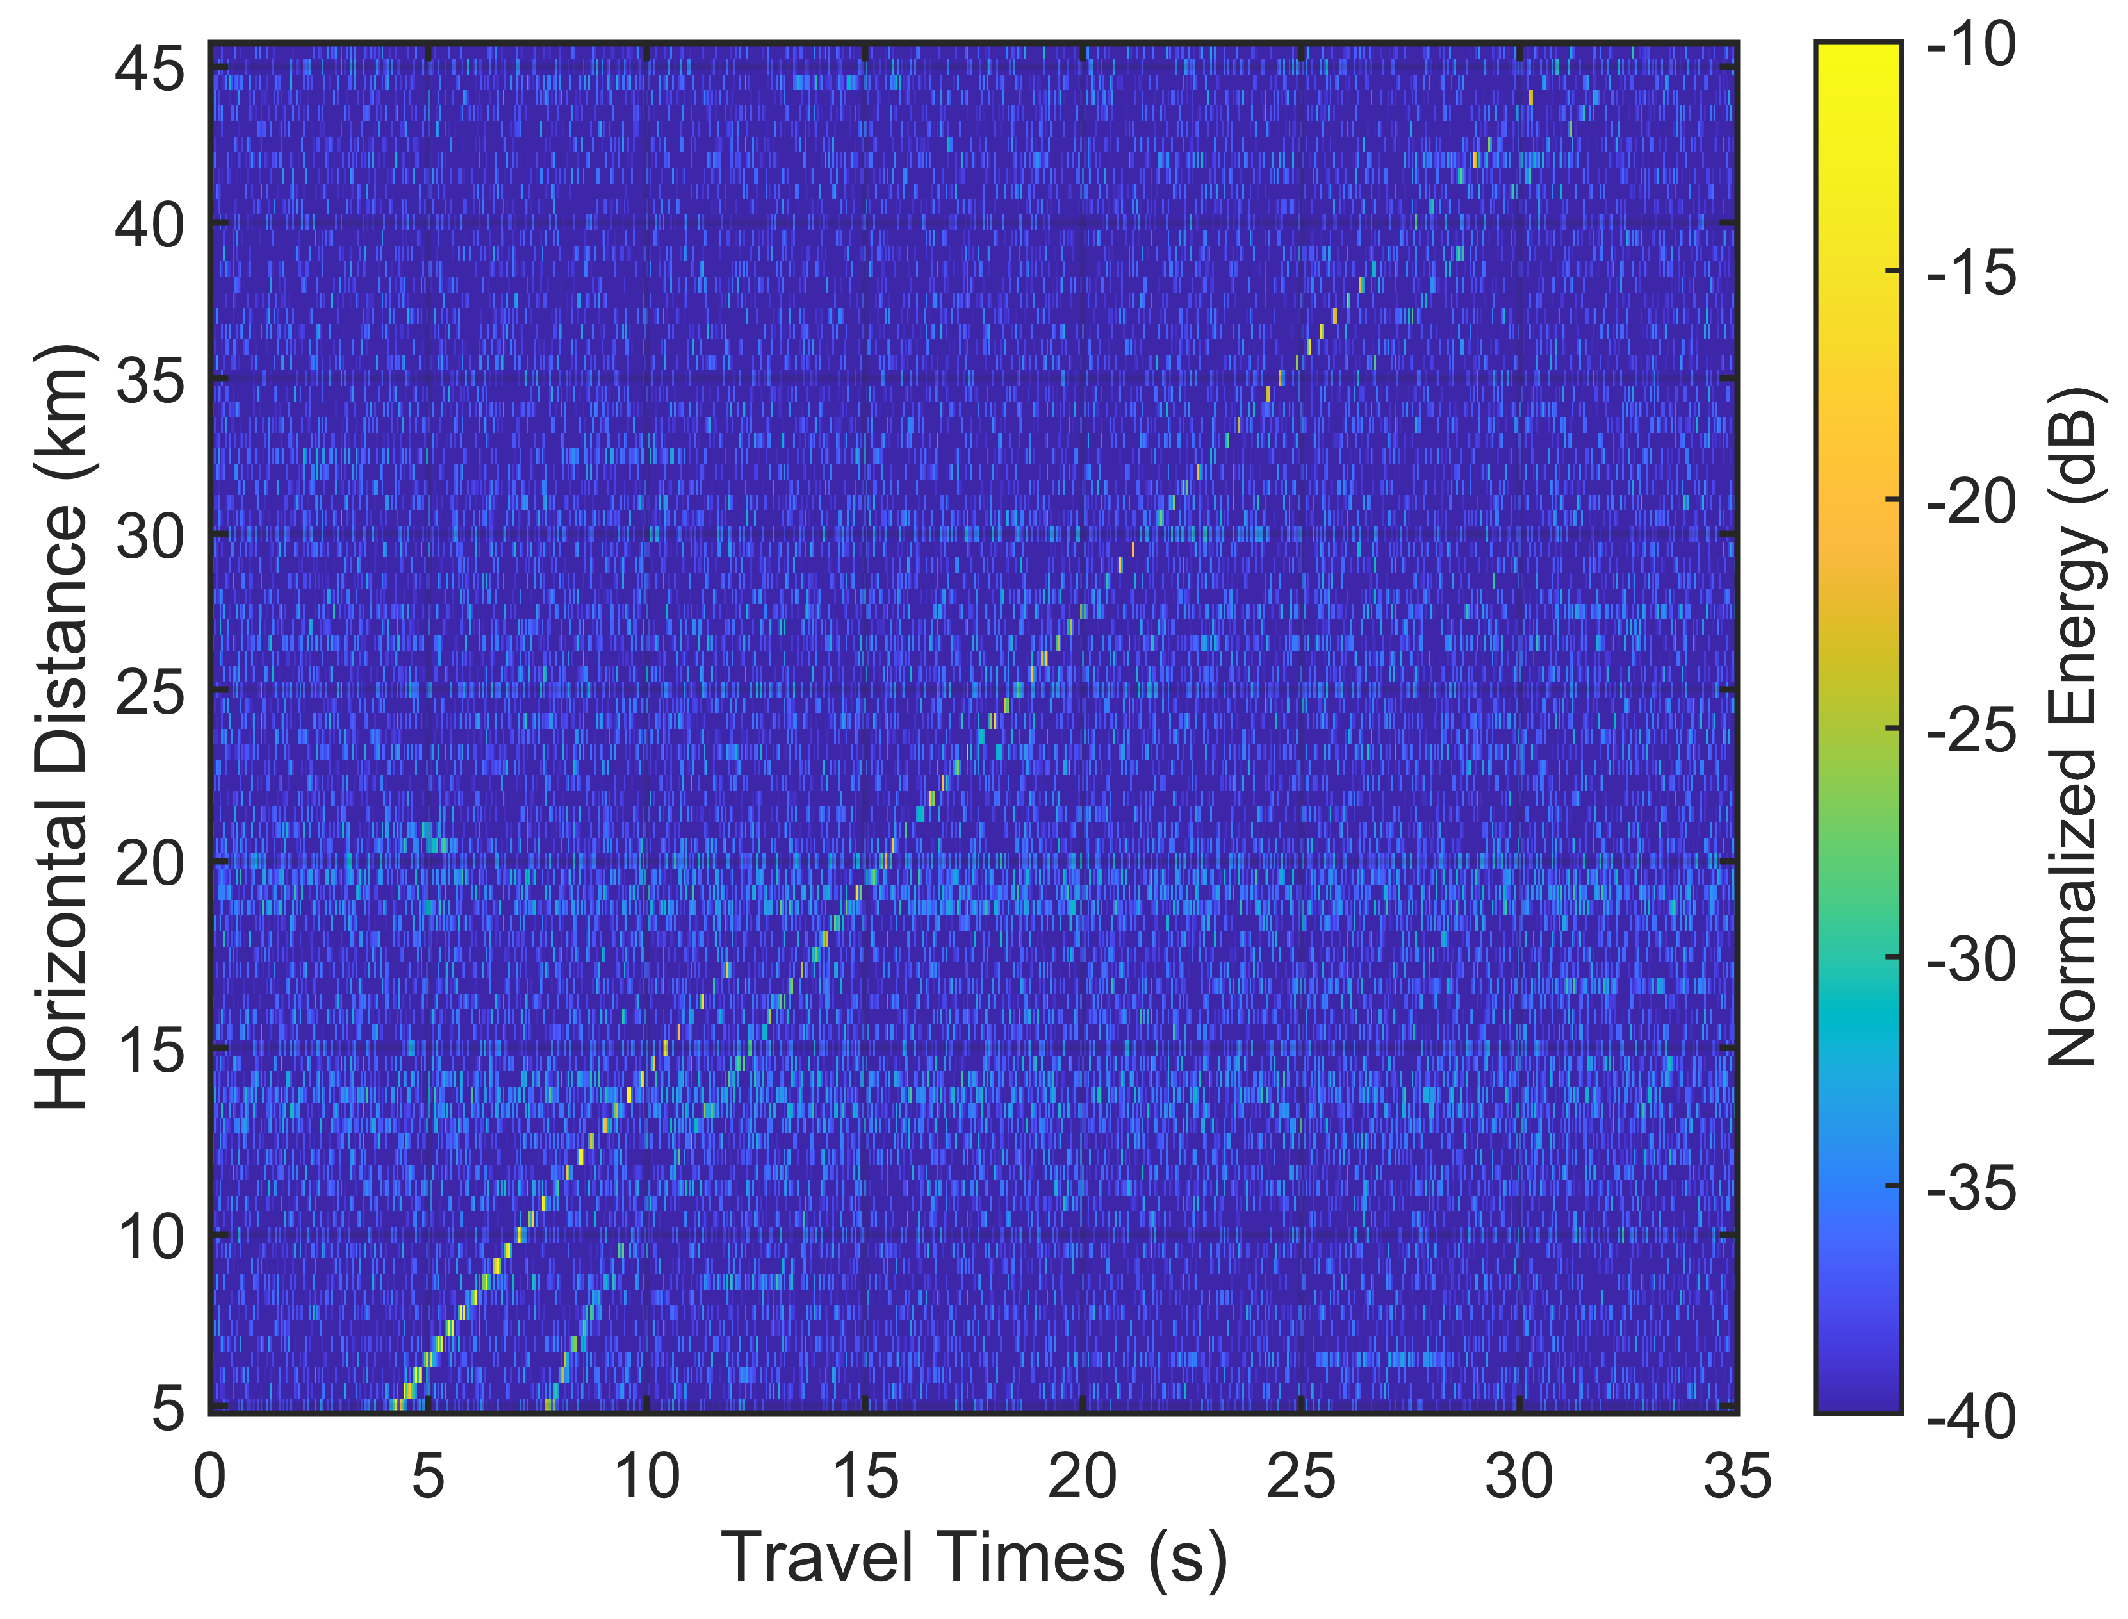
Taking the received signal at Beacon 1 as an example, the measured channel structure is shown in Figure 16. It can be observed that, at the same distance, the measured travel time is not necessarily unique, which is one of the characteristic features of long-range multipath propagation in the deep sea. Notably, around 17 km, the travel time corresponding to the direct path vanishes, while the measured travel times of the reflected paths remain continuous. The red dots indicate the earliest arrival time in each dataset.
The distance between the ship’s position, as measured by the Global Navigation Satellite System (GNSS), and the calibrated position of the USR is used as the ground truth to quantitatively evaluate the precision of the long-range distance measurement technology.
For each beacon, the earliest arrival time in each data frame is selected and used for distance estimation via the PESST model. The resulting ranging error as a function of horizontal distance is shown in Figure 17a. As observed from the figure, in the direct-path-dominated region (17 km), the ranging error remains small, with fluctuations within 10 m. However, in the reflected-path-dominated region (17–50 km), a significant jump in error occurs relative to the previous propagation region. The error increases substantially, exhibiting fluctuations on the order of hundreds of meters, with a maximum error reaching 137.9 m. Notably, the error trend is highly consistent with the bathymetric error model analysis. This highlights the necessity of compensating for topography-induced sound speed deviations to further improve measurement precision in the reflected-path region.
The acquisition of seafloor bathymetric error in this study is based on two approaches:
  • SRC: As shown in the channel structure figure, the reflected path persists and remains continuous even within the direct-path region. Taking Beacon 1 as an example, the ranging results in the multipath overlapping region are shown in Figure 17b. Within the range of 15–17 km, the direct-path ranging error is within 5 m, while the reflected-path ranging error exceeds 100 m. However, the reflected-path results remain consistent with those in regions where only reflected paths are present. This indicates that the high-precision ranging results from the direct path can be used to calculate the error between the true sound speed and the PESST-estimated sound speed within the 15–17 km region, thereby enabling inversion of the bathymetric error in this area. Finally, applying the TC-PESST method to long-range high-precision ranging allows for the construction of a more consistent and stable sound speed model within the multipath overlapping region.
  • MRC: The topography profile shows that most seafloor reflection points are located within the 12–33 km range from each beacon, which coincides with the boundary region between a seamount and a trench. Bathymetric errors in this region are relatively large, making the placement of reference points necessary. To verify the precision of the data used in this study, GPS ground-truth positions of a target trajectory point located 34 km from the array center are used as a reference. These positions are employed to invert and compensate for bathymetric errors, enabling high-precision long-range measurements.
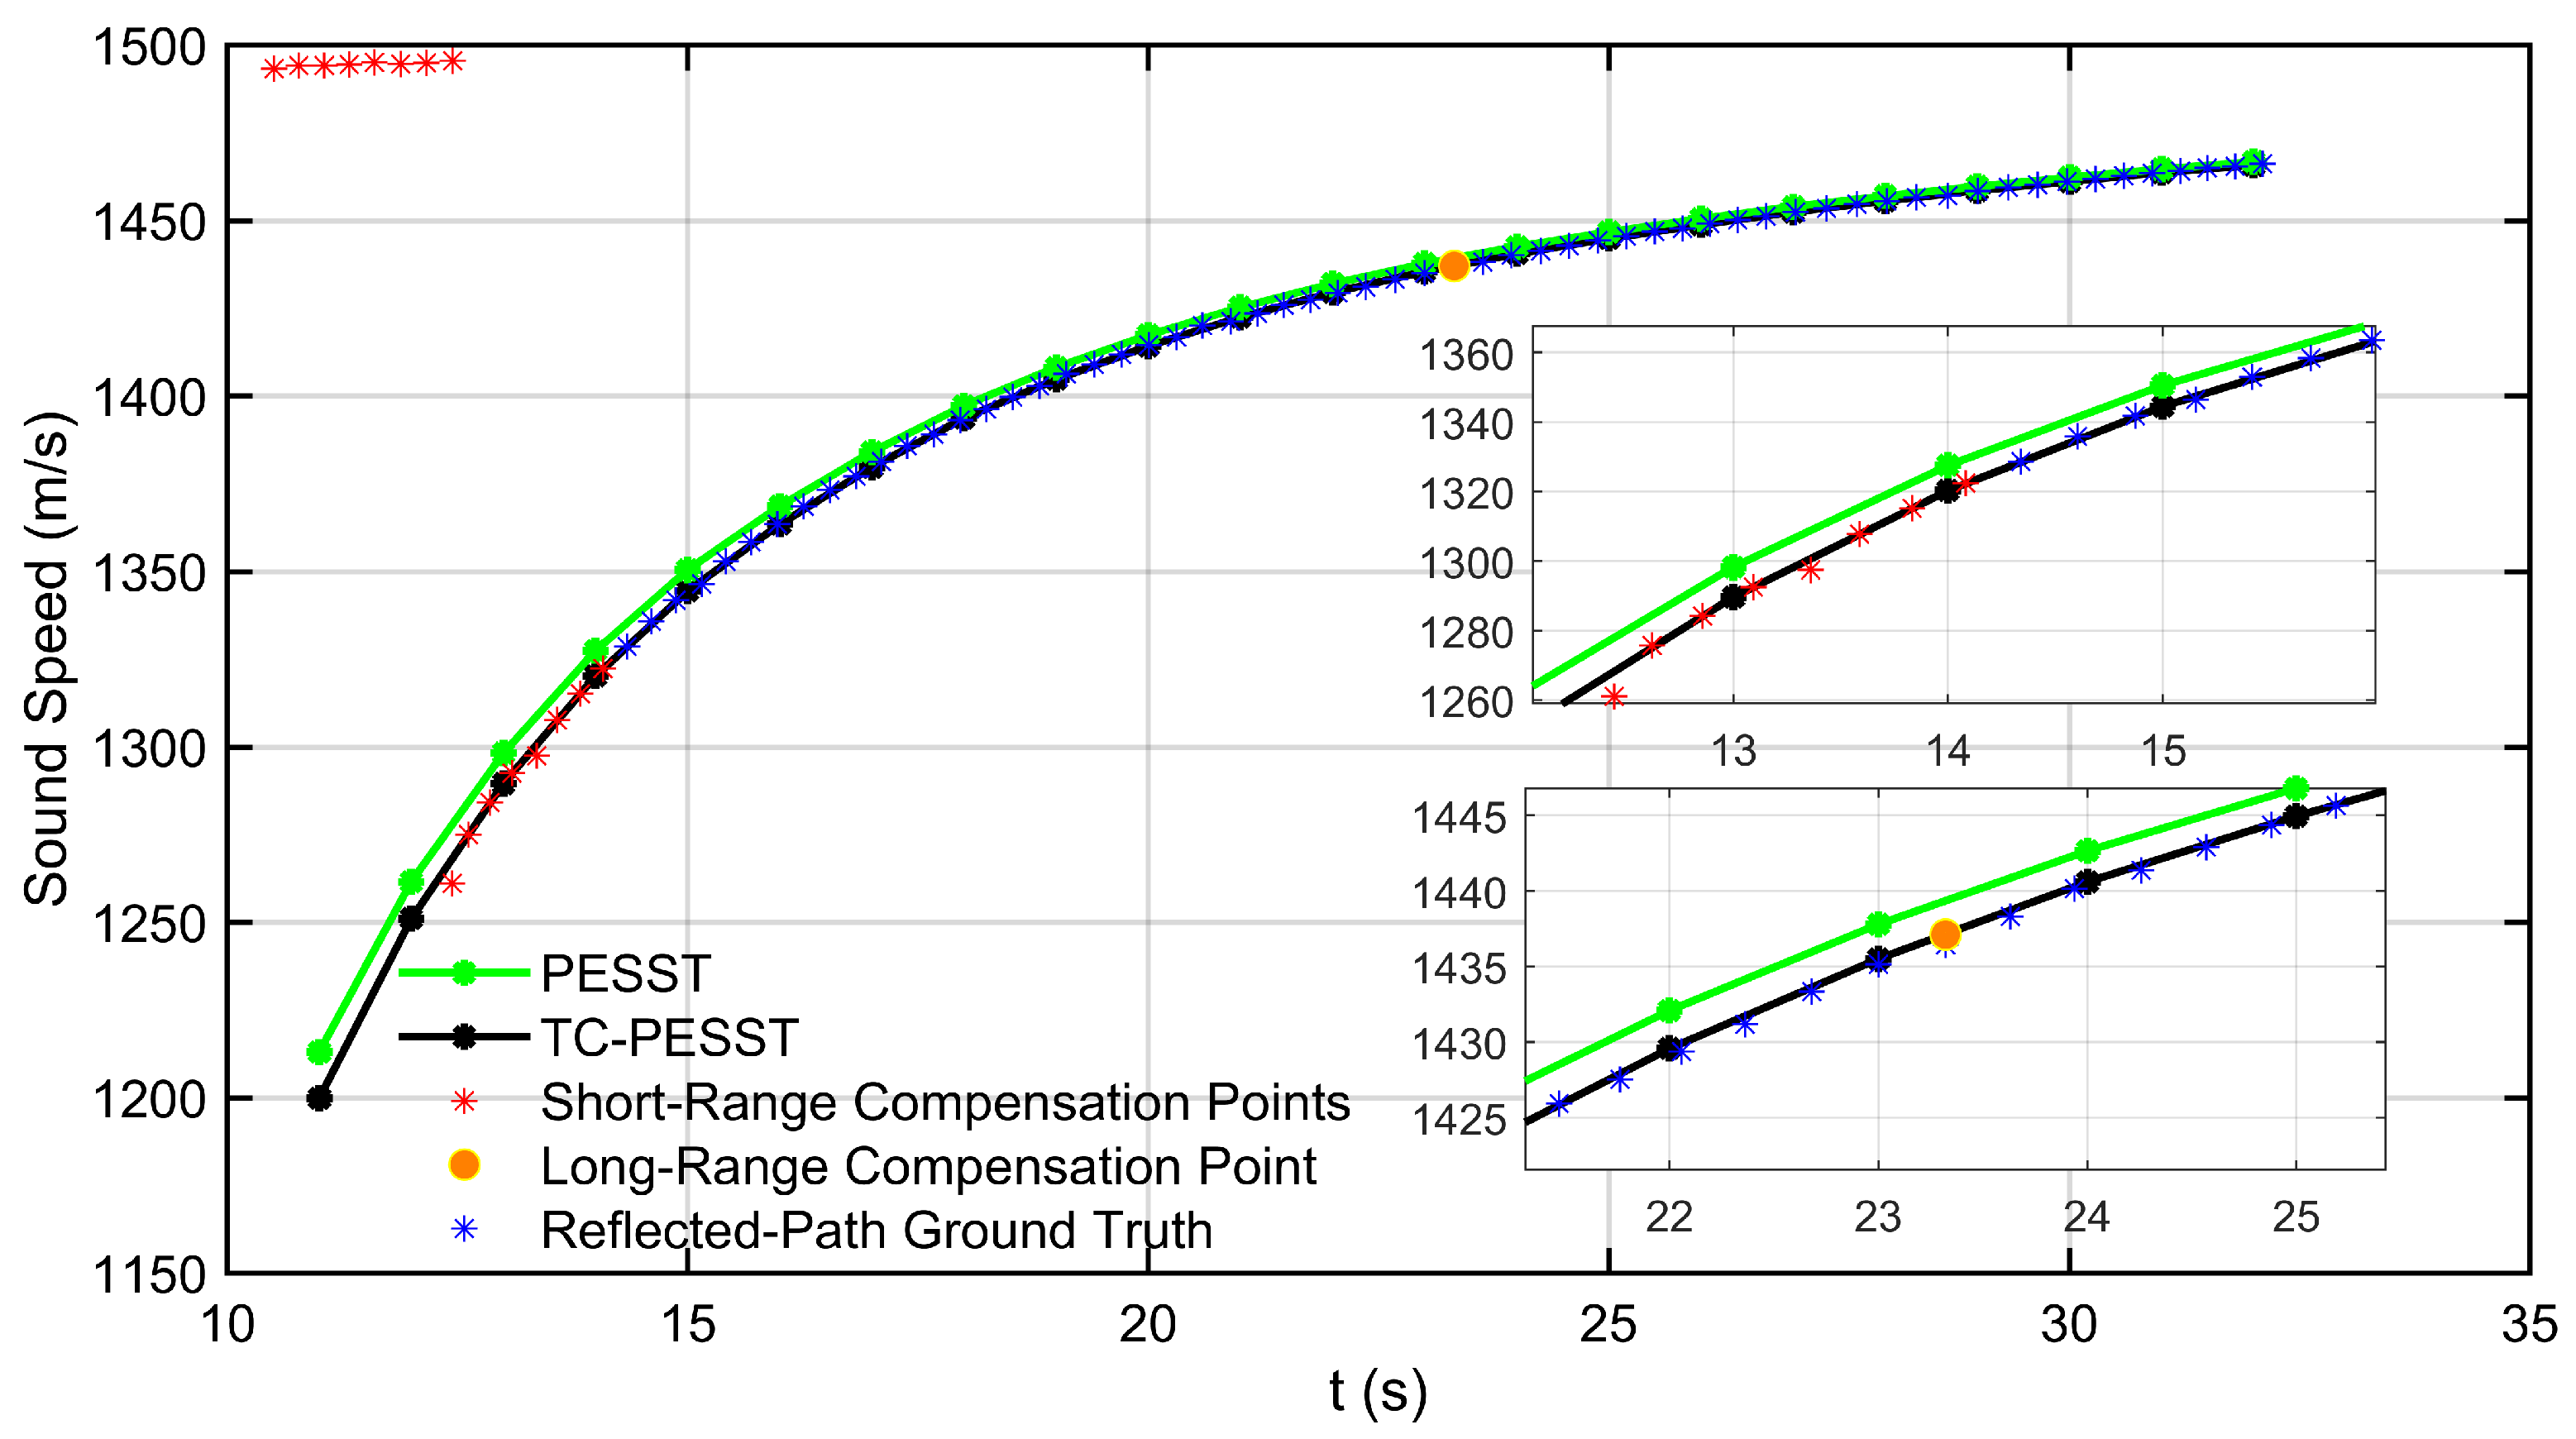
The compensated sound speed model is illustrated in Figure 18. By incorporating both short-range and long-range compensation points, the true sound speed values inferred from the true distances are brought into agreement with the TC-PESST estimates. As a result, the maximum sound speed error is reduced from 9.4 m/s to 0.5 m/s, indicating a significant improvement in ranging precision. Crucially, this MRC strategy functions as a piecewise local calibrator, allowing the system to adapt to the complex and arbitrary error profile of the experimental area without assuming a global error model.
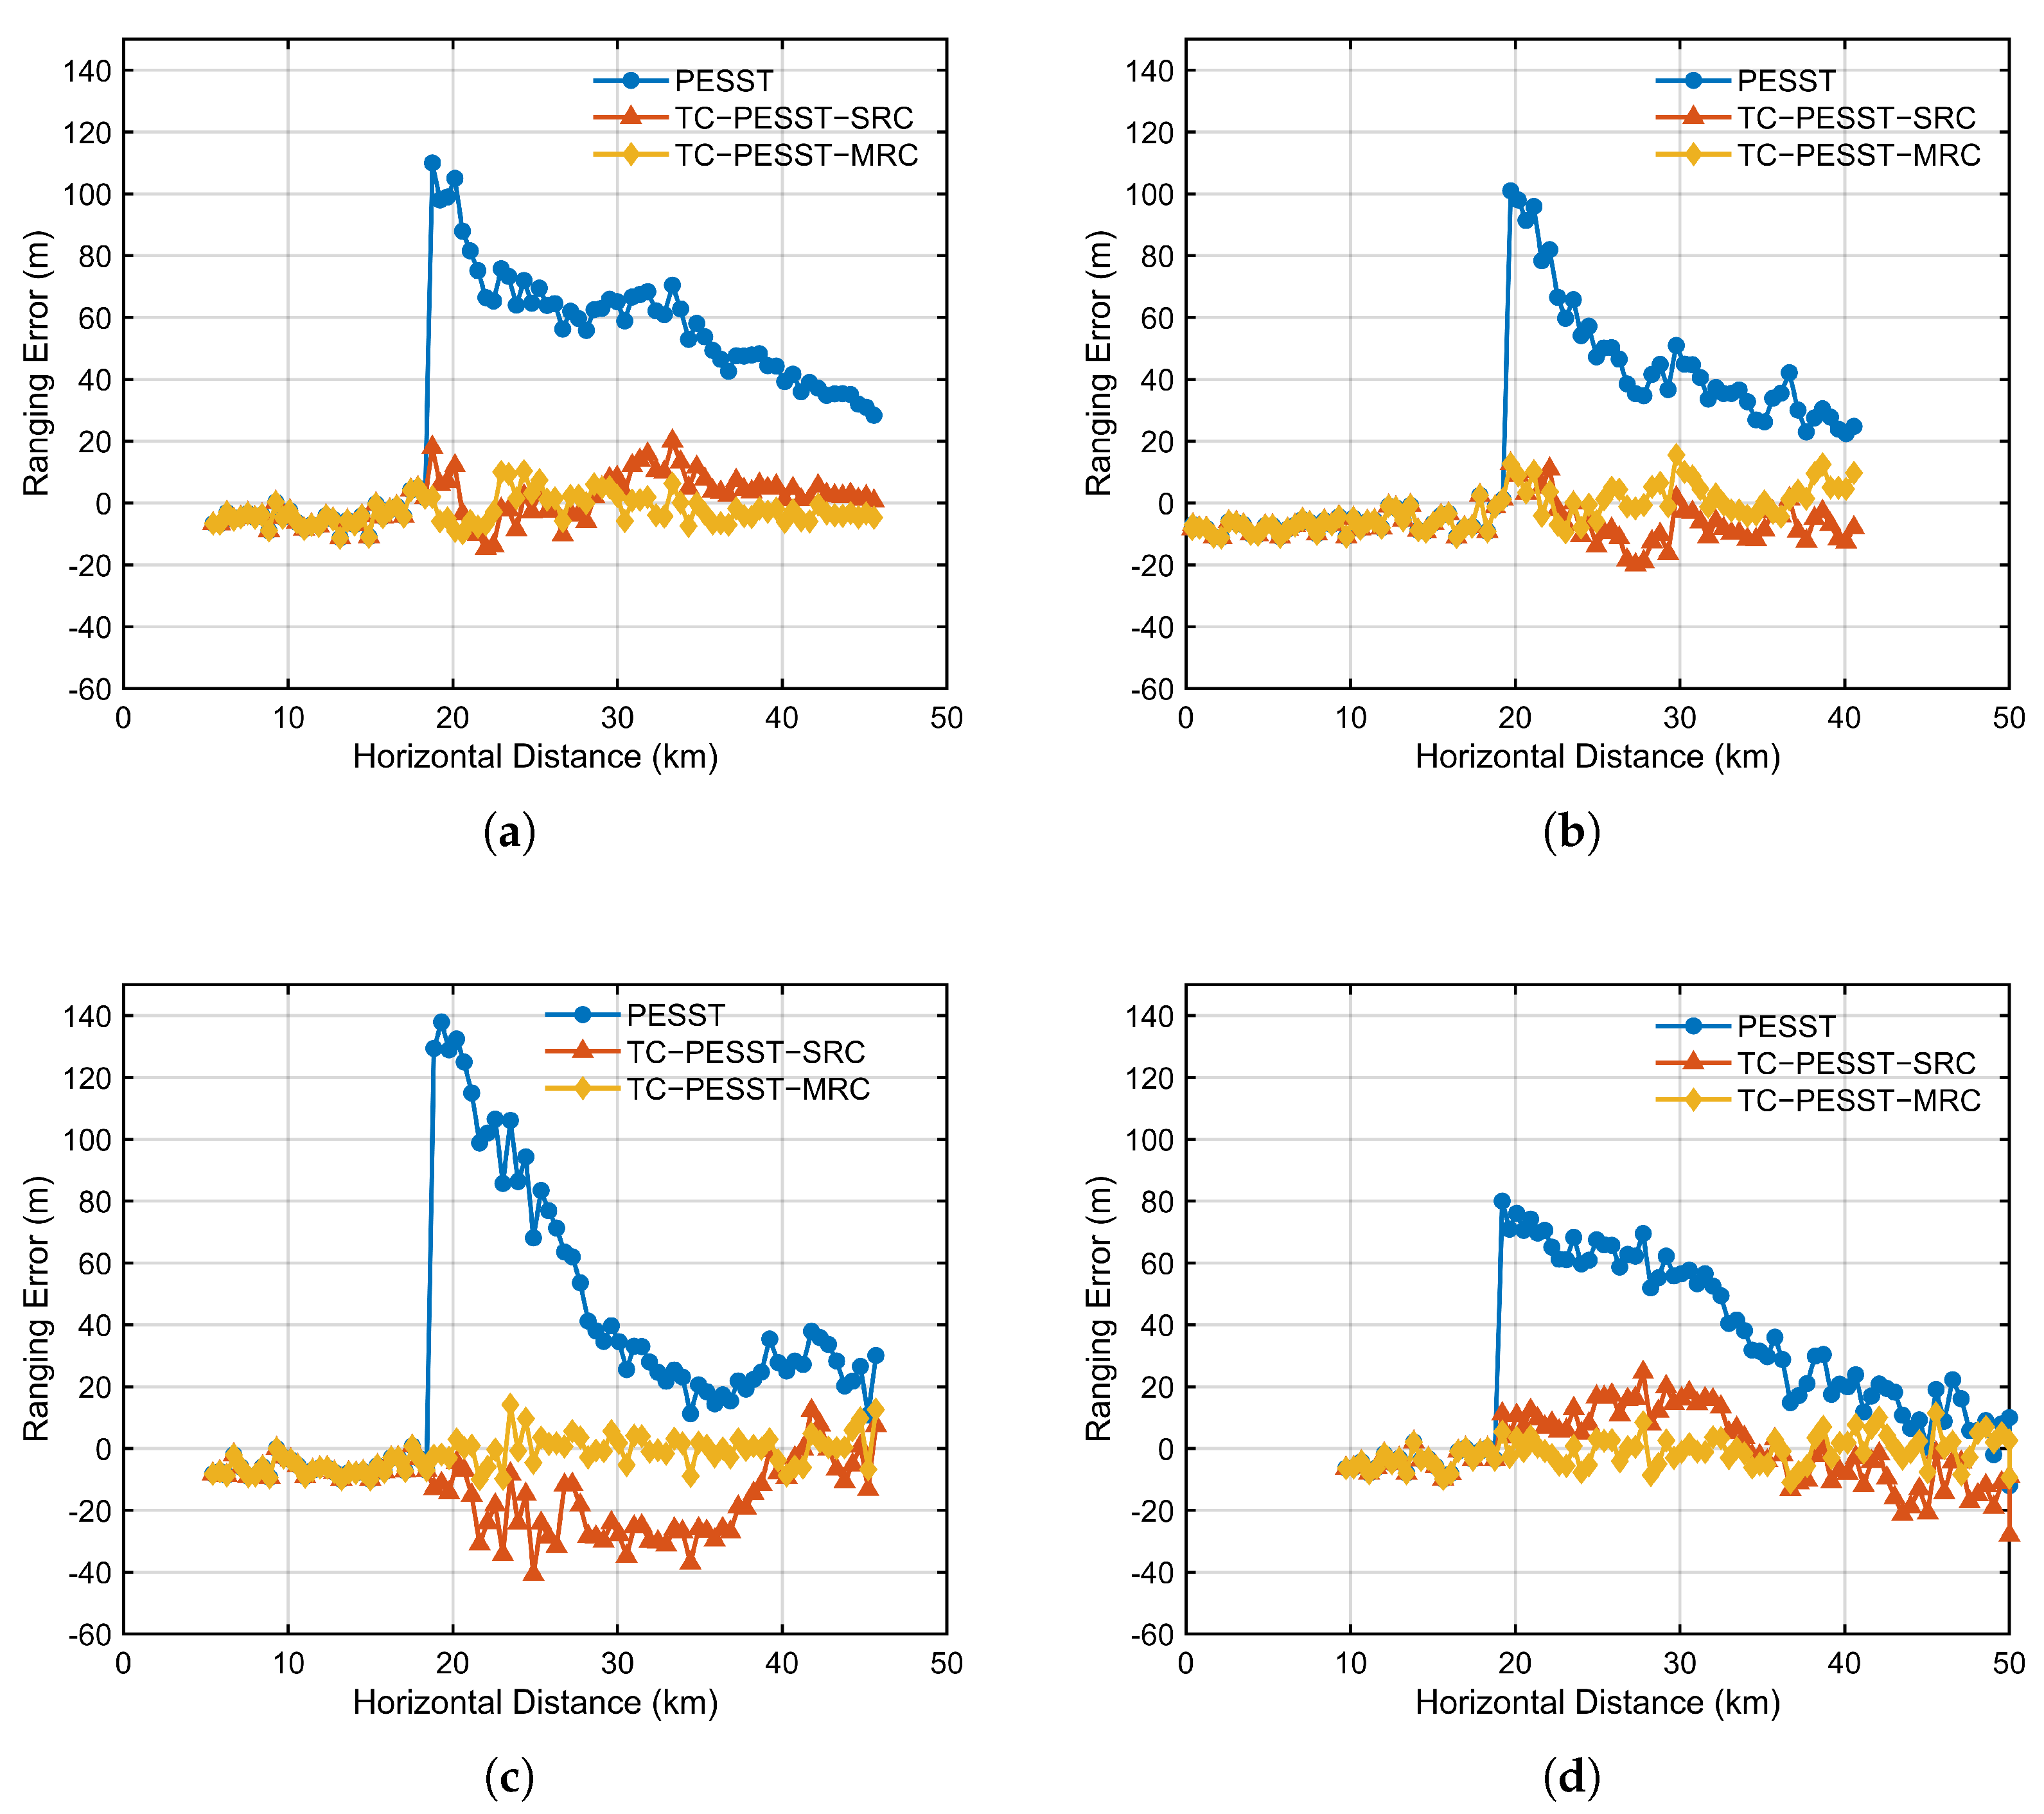
As shown in Figure 19, the proposed TC-PESST method effectively eliminates the step-like errors between different propagation paths in the ranging results. Within a distance of 50 km, the maximum ranging error is reduced from 137.9 m to 15.5 m, providing high-precision distance measurements for long-range positioning.
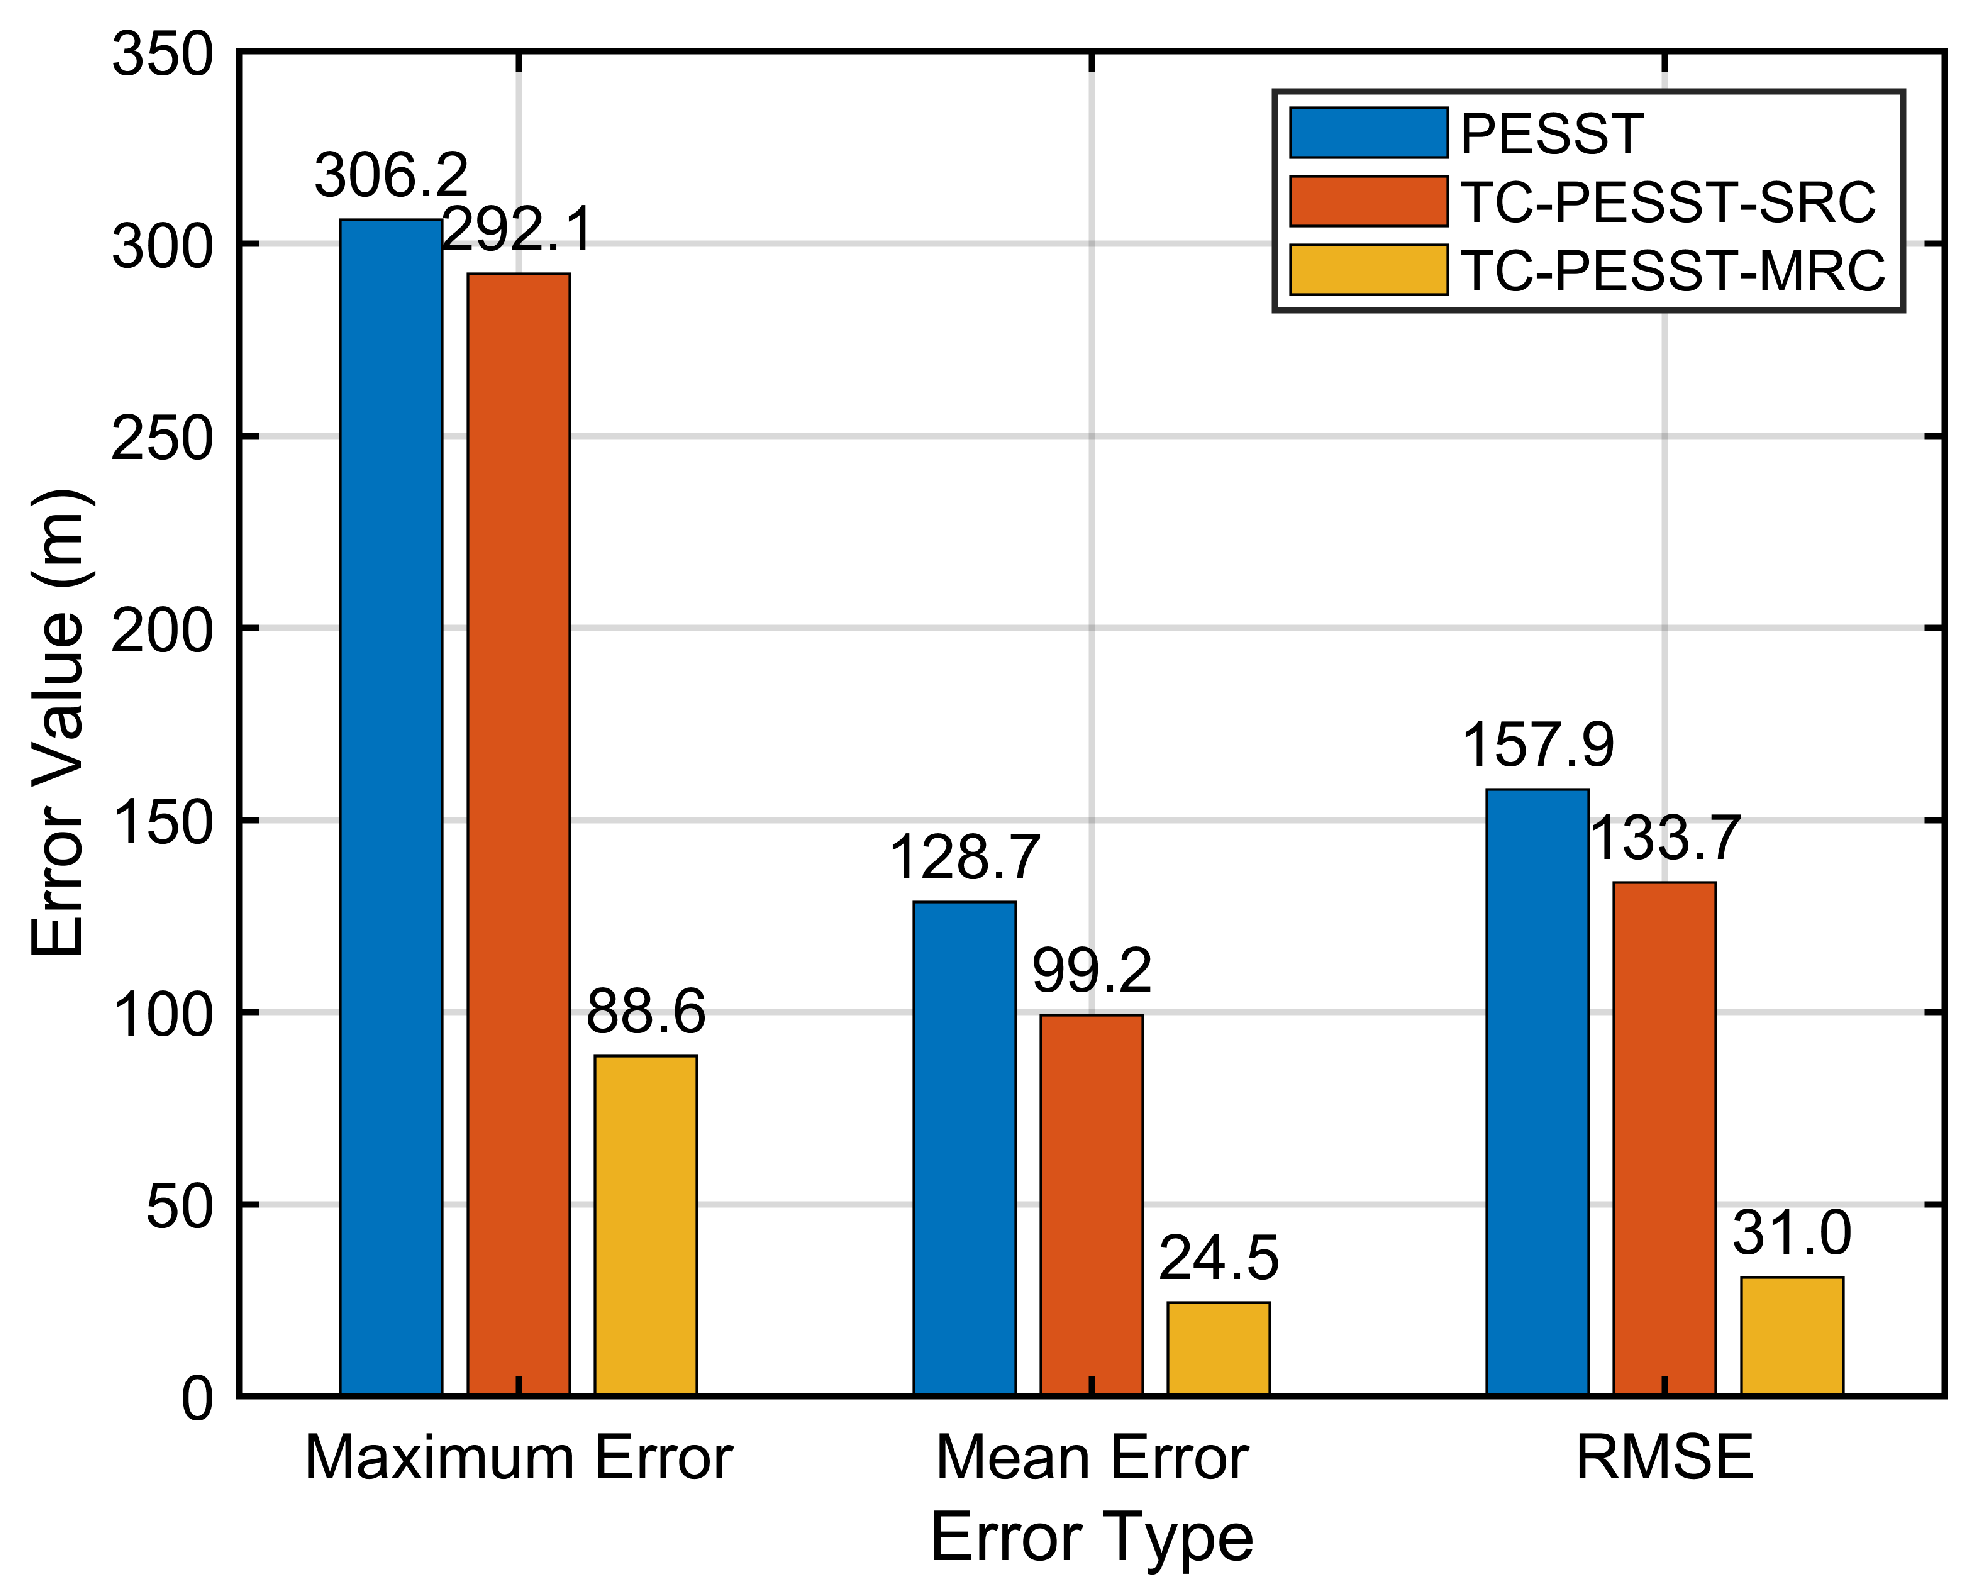
The corresponding positioning results are presented in Figure 20. The TC-PESST method demonstrates higher positioning precision, resulting in a more concentrated scatter distribution of relative positioning errors. Figure 21 presents the statistical analysis of the positioning results, showing that the RMSE decreases from 157.9 m to 133.7 m and 31.0 m, corresponding to improvements in positioning precision of 15.3% and 80.4%, respectively.

6. Conclusions

This study proposes a long-range deep-sea positioning technology that integrates multipath sound speed modeling with bathymetric error compensation. The method extends the range of applicable ray tracing and analyzes the distribution characteristics of ESS along multipath trajectories. A topography-compensated sound speed correction method is developed to quantify the impact of seafloor bathymetric errors on sound speed estimation and ranging precision. A topography sensitivity coefficient is derived and incorporated into the ranging model to ensure high positioning precision and reliability in complex underwater environments. The experimental results show that the proposed long-range positioning technology extends the effective measurement range from 17 km (direct-path region) to 50 km (reflected-path region). The maximum ranging error is reduced from 137.9 m to 15.5 m, and the RMSE decreases from 157.9 m to 31.0 m, representing an improvement in positioning precision of 80.4%. These results demonstrate the feasibility of achieving high-precision long-range positioning in deep-sea environments.
Future work could pursue more dynamic and adaptive models to further improve accuracy and robustness, as suggested by the recent trends in navigation and geomatics. One promising direction is the use of stochastic filtering techniques, such as a Kalman filter, where the equivalent bathymetric error could be estimated as a state variable in real time. Another powerful avenue is the application of machine learning. A trained neural network, for instance, could learn the complex nonlinear relationships between various acoustic measurements and the optimal ranging correction, potentially leading to a more adaptive and accurate positioning system for complex time-varying ocean environments.

Author Contributions

Conceptualization, W.M. and J.Z.; methodology, W.M. and J.Z.; software, W.M.; validation, W.M., J.Z. and K.T.; formal analysis, W.M. and K.T.; investigation, W.M.; resources, D.S., J.Z. and Y.H.; data curation, Y.H.; writing—original draft preparation, W.M.; writing—review and editing, J.Z. and Y.H.; visualization, W.M. and K.T.; supervision, D.S., J.Z. and Y.H.; project administration, Y.H.; funding acquisition, D.S. All authors have read and agreed to the published version of the manuscript.

Funding

This research was funded by the National Natural Science Foundation of China under Grant No. 42327901, National Key & Research Program No. 2024YFB3909704, and the Taishan Scholars Program.

Data Availability Statement

The data presented in this study are available on request from the corresponding author.

Conflicts of Interest

The authors declare no conflicts of interest.

Abbreviations

The following abbreviations are used in this manuscript:
AUVAutonomous Underwater Vehicle
CTDConductivity Temperature Depth
DTUTechnical University of Denmark
ESRError Suppression Ratio
ESSEffective Sound Speed
ESSPEquivalent Sound Speed Profile
ESSTEffective Sound Speed Table
ETOPOEarth Topography
GEBCOGeneral Bathymetric Chart of the Oceans
GNSSGlobal Navigation Satellite System
HFMHyperbolic Frequency Modulation
MRCMulti-Range Compensation
PESSTPartitioned Effective Sound Speed Table
RMSERoot Mean Square Error
SRCShort-Range Compensation
SSLSound Source Level
SSPSound Speed Profile
SVPSound Velocity Profiler
TC-PESSTTopography-Compensated Partitioned Effective Sound Speed Table
TOATime of Arrival
USRUnderwater Sound Recorder
WASSWeighted Average Sound Speed

References

  1. Kebkal, K.G.; Mashoshin, A. AUV acoustic positioning methods. Gyroscopy Navig. 2017, 8, 80–89. [Google Scholar] [CrossRef]
  2. Sun, D.; Li, Z.; Zheng, C.; Cheng, C. A calibration method of high-precision transducer acoustic phase center under outfield experiments. Appl. Acoust. 2023, 210, 109458. [Google Scholar] [CrossRef]
  3. Kaya, Y.B.; Ranjbar, M. A review on methods and approaches in underwater acoustics. Comput. Res. Prog. Appl. Sci. Eng. 2020, 6, 220–227. [Google Scholar]
  4. Zhang, J.; Han, Y.; Zheng, C.; Sun, D. Underwater target localization using long baseline positioning system. Appl. Acoust. 2016, 111, 129–134. [Google Scholar] [CrossRef]
  5. Sun, D.; Ding, J.; Zheng, C.; Huang, W. An underwater acoustic positioning algorithm for compact arrays with arbitrary configuration. IEEE J. Sel. Top. Signal Process. 2019, 13, 120–130. [Google Scholar] [CrossRef]
  6. Hadi, B.; Khosravi, A.; Sarhadi, P. Deep reinforcement learning for adaptive path planning and control of an autonomous underwater vehicle. Appl. Ocean. Res. 2022, 129, 103326. [Google Scholar] [CrossRef]
  7. Yuan, M.; Li, Y.; Li, Y.; Pang, S.; Zhang, J. A fast way of single-beacon localization for AUVs. Appl. Ocean Res. 2022, 119, 103037. [Google Scholar] [CrossRef]
  8. Xu, C.; Xu, C.; Wu, C.; Liu, J.; Qu, D.; Xu, F. Accurate two-step filtering for AUV navigation in large deep-sea environment. Appl. Ocean. Res. 2021, 115, 102821. [Google Scholar] [CrossRef]
  9. Mikhalevsky, P.N.; Sperry, B.J.; Woolfe, K.F.; Dzieciuch, M.A.; Worcester, P.F. Deep ocean long range underwater navigation. J. Acoust. Soc. Am. 2020, 147, 2365–2382. [Google Scholar] [CrossRef]
  10. Cai, W.; Zhang, M.; Yang, Q.; Wang, C.; Shi, J. Long-range UWB positioning-based automatic docking trajectory design for unmanned surface vehicle. IEEE Trans. Instrum. Meas. 2023, 72, 7503212. [Google Scholar] [CrossRef]
  11. Li, X.; Sun, D.; Cao, Z. Generation Mechanism of Acoustic Doppler Velocity Measurement Bias. IEEE J. Ocean. Eng. 2025, 50, 1–12. [Google Scholar] [CrossRef]
  12. Kinugasa, N.; Tadokoro, K.; Kato, T.; Terada, Y. Estimation of temporal and spatial variation of sound speed in ocean from GNSS-A measurements for observation using moored buoy. Prog. Earth Planet. Sci. 2020, 7, 21. [Google Scholar] [CrossRef]
  13. Almeida, R.; Melo, J.; Cruz, N. Characterization of measurement errors in a LBL positioning system. In Proceedings of the OCEANS 2016-Shanghai, Shanghai, China, 10–13 April 2016; IEEE: New York, NY, USA, 2016; pp. 1–6. [Google Scholar]
  14. Vázquez-Mejías, A.I.; Hernández-Romero, Á.; Vidal, J.; Otero, P. Proof of Concept and Accuracy of an LBL Underwater Positioning System. IEEE J. Ocean. Eng. 2025, 50, 1551–1556. [Google Scholar] [CrossRef]
  15. Li, X.; Wang, Y.; Qi, B.; Hao, Y. Long baseline acoustic localization based on track-before-detect in complex underwater environments. IEEE Trans. Geosci. Remote Sens. 2023, 61, 4205214. [Google Scholar] [CrossRef]
  16. Chen, H.; He, Z.; Wang, J.; Zhang, X.; Hou, B. A High-Precision Real-Time Distance Difference Localization Algorithm Based on Long Baseline Measurement. J. Mar. Sci. Eng. 2024, 12, 1724. [Google Scholar] [CrossRef]
  17. Sun, D.; Li, X.; Cao, Z.; Yong, J.; Zhang, D.; Zhuang, J. Acoustic robust velocity measurement algorithm based on variational Bayes adaptive Kalman filter. IEEE J. Ocean. Eng. 2020, 46, 183–194. [Google Scholar] [CrossRef]
  18. Yang, Y.; Liu, Y.; Sun, D.; Xu, T.; Xue, S.; Han, Y.; Zeng, A. Seafloor geodetic network establishment and key technologies. Sci. China Earth Sci. 2020, 63, 1188–1198. [Google Scholar] [CrossRef]
  19. Zhang, S.; Yang, Y.; Xu, T.; Qin, X.; Liu, Y. Long-range LBL underwater acoustic navigation considering Earth curvature and Doppler effect. Measurement 2025, 240, 115524. [Google Scholar] [CrossRef]
  20. Hale, F. Long-Range Sound Propagation in the Deep Ocean. J. Acoust. Soc. Am. 1961, 33, 456–464. [Google Scholar] [CrossRef]
  21. Masetti, G.; Kelley, J.G.; Johnson, P.; Beaudoin, J. A ray-tracing uncertainty estimation tool for ocean mapping. IEEE Access 2017, 6, 2136–2144. [Google Scholar] [CrossRef]
  22. Xu, W.; Guo, K.; Liu, Y.; Tian, Z.; Tang, Q.; Dong, Z.; Li, J. Refraction error correction of Airborne LiDAR Bathymetry data considering sea surface waves. Int. J. Appl. Earth Obs. Geoinf. 2021, 102, 102402. [Google Scholar] [CrossRef]
  23. Zhang, T.; Yan, L.; Han, G.; Peng, Y. Fast and accurate underwater acoustic horizontal ranging algorithm for an arbitrary sound-speed profile in the deep sea. IEEE Internet Things J. 2021, 9, 755–769. [Google Scholar] [CrossRef]
  24. Yu, M.; Cai, K.; Zheng, C.; Sun, D. Improvement of seafloor positioning through correction of sound speed profile temporal variation. IEEE/CAA J. Autom. Sin. 2022, 10, 1099–1101. [Google Scholar] [CrossRef]
  25. Yu, M.; Geng, H.; Liu, X. Underwater vehicle positioning method using sound speed error estimation in conjunction with a motion compensation model. Ocean Eng. 2025, 319, 120241. [Google Scholar] [CrossRef]
  26. Xin, M.; Yang, F.; Wang, F.; Shi, B.; Zhang, K.; Liu, H. A TOA/AOA underwater acoustic positioning system based on the equivalent sound speed. J. Navig. 2018, 71, 1431–1440. [Google Scholar] [CrossRef]
  27. Wang, J.J.; Lin, T.; Fu, J. Analysis of Effective Sound Velocity Spatial Characteristic of Typical MUNK Deep Sea Channel. In Proceedings of the 2018 IEEE 8th International Conference on Underwater System Technology: Theory and Applications (USYS), Wuhan, China, 1–3 December 2018; IEEE: New York, NY, USA, 2018; pp. 1–6. [Google Scholar]
  28. Sun, D.; Li, H.; Zheng, C.; Li, X. Sound velocity correction based on effective sound velocity for underwater acoustic positioning systems. Appl. Acoust. 2019, 151, 55–62. [Google Scholar] [CrossRef]
  29. Huang, J.; Yan, S. An improvement of long baseline system using particle swarm optimization to optimize effective sound speed. Mar. Geod. 2018, 41, 439–456. [Google Scholar] [CrossRef]
  30. Xing, Y.; Wang, J.; Hou, B.; He, Z.; Zhou, X. Underwater Long Baseline Positioning Based on B-Spline Surface for Fitting Effective Sound Speed Table. J. Mar. Sci. Eng. 2024, 12, 1429. [Google Scholar] [CrossRef]
  31. Fortuin, L. Survey of literature on reflection and scattering of sound waves at the sea surface. J. Acoust. Soc. Am. 1970, 47, 1209–1228. [Google Scholar] [CrossRef]
  32. Affatati, A.; Scaini, C.; Salon, S. Ocean sound propagation in a changing climate: Global sound speed changes and identification of acoustic hotspots. Earth’s Future 2022, 10, e2021EF002099. [Google Scholar] [CrossRef]
  33. Dunn, J.; Ridgway, K. Mapping ocean properties in regions of complex topography. Deep. Sea Res. Part I Oceanogr. Res. Pap. 2002, 49, 591–604. [Google Scholar] [CrossRef]
  34. Wölfl, A.C.; Snaith, H.; Amirebrahimi, S.; Devey, C.W.; Dorschel, B.; Ferrini, V.; Huvenne, V.A.; Jakobsson, M.; Jencks, J.; Johnston, G.; et al. Seafloor mapping—The challenge of a truly global ocean bathymetry. Front. Mar. Sci. 2019, 6, 283. [Google Scholar] [CrossRef]
  35. Hao, R.J.; Wan, X.Y.; Sui, X.H.; Jia, Y.J.; Wu, X. Research status and analysis of seafloor topography survey and model development. Rev. Geophys. Planet. Phys. 2022, 53, 172–186. [Google Scholar]
  36. Marks, K.; Smith, W.; Sandwell, D. Evolution of errors in the altimetric bathymetry model used by Google Earth and GEBCO. Mar. Geophys. Res. 2010, 31, 223–238. [Google Scholar] [CrossRef]
  37. Liu, Y.; Xu, T.; Wang, J.; Mu, D. Multibeam seafloor topography distortion correction based on SVP inversion. J. Mar. Sci. Technol. 2022, 27, 467–481. [Google Scholar] [CrossRef]
  38. Qi, C.; Su, D.; Yang, F.; Ma, Y.; Wang, X.; Yang, A. Analysis and correction in the airborne LiDAR bathymetric error caused by the effect of seafloor topography slope. Natl. Remote Sens. Bull. 2024, 26, 2642–2654. [Google Scholar] [CrossRef]
Figure 1. Schematic of the positioning model.
Jmse 13 01898 g001
Figure 2. Schematic diagram of ray tracing.
Jmse 13 01898 g002
Figure 3. Algorithm flowchart.
Jmse 13 01898 g003
Figure 4. Spatial distribution of ESS in deep-sea environments. (a) Measured SVP. (b) Source depth = 10 m. (c) Source depth = 1100 m. (d) Source depth = 3400 m.
Jmse 13 01898 g004
Figure 5. Illustration of sound ray at different horizontal distances.
Jmse 13 01898 g005
Figure 6. PESST for source depth of 3400 m and receiver depth of 10 m.
Jmse 13 01898 g006
Figure 7. Effects of typical bathymetric error models on long-range acoustic paths over a distance of 40 km. (a) Constant bias. (b) Linear error. (c) Periodic error.
Jmse 13 01898 g007
Figure 8. Effect of typical bathymetric error models on long-range distance measurement. (a) Constant bias. (b) Linear error. (c) Periodic error with a period of 10 km. (d) Periodic error with an amplitude of 100 m.
Jmse 13 01898 g008
Figure 9. Effect of typical bathymetric error models on long-range positioning. (a) Constant bias with an amplitude of 100 m. (b) Linear error with a gradient of 10 m/km. (c) Periodic error with a period of 10 km. (d) Periodic error with a period of 25 km.
Jmse 13 01898 g009
Figure 10. Results of ranging compensation under typical bathymetric error models. (a) Constant bias with an amplitude of 100 m. (b) Linear error with a gradient of 10 m/km. (c) Periodic error with a period of 10 km. (d) Periodic error with a period of 25 km.
Jmse 13 01898 g010
Figure 11. Compensation result statistics.
Jmse 13 01898 g011
Figure 12. Algorithm robustness simulation. (a) The 12 SSPs used for validation. (b) The corresponding performance metrics under the different SSPs.
Jmse 13 01898 g012
Figure 13. Experimental setup and instrumentation. (a) Acoustic source. (b) Seafloor beacon system.
Jmse 13 01898 g013
Figure 14. Schematic diagram of experimental scenario.
Jmse 13 01898 g014
Figure 15. The seafloor profile along the connecting line.
Jmse 13 01898 g015
Figure 16. Measured channel structure at Beacon 1.
Jmse 13 01898 g016
Figure 17. PESST-based distance measurement results. (a) Results for each of the four beacons. (b) Detailed results for Beacon 1.
Jmse 13 01898 g017
Figure 18. Comparison of sound speed models.
Jmse 13 01898 g018
Figure 19. Comparison of ranging results. (a) Beacon 1. (b) Beacon 2. (c) Beacon 3. (d) Beacon 4.
Jmse 13 01898 g019
Figure 20. Positioning results. (a) Comparison of estimated and ground-truth target trajectories. (b) Scatter plot of target relative positioning errors.
Jmse 13 01898 g020
Figure 21. Histogram of positioning error statistics.
Jmse 13 01898 g021
Disclaimer/Publisher’s Note: The statements, opinions and data contained in all publications are solely those of the individual author(s) and contributor(s) and not of MDPI and/or the editor(s). MDPI and/or the editor(s) disclaim responsibility for any injury to people or property resulting from any ideas, methods, instructions or products referred to in the content.