1. Introduction
Spiral wavefront beacons are an emerging underwater acoustic navigation technique [
1]. This method uses acoustic spiral wavefronts (ASWFs) to establish the relationship between the acoustic phase and the azimuth to the beacon. Specifically, the beacon emits two acoustic signals in a fixed sequence, with their wavefronts forming a linear spiral and a concentric circle in the x-y plane. Under these conditions, the phase difference between the two acoustic signals is linearly related to the azimuth of the receiver and is easily determined via a single hydrophone [
2,
3]. Due to the simple equipment requirements of the receivers, it is promising for small underwater platforms such as unmanned underwater vehicles (UUVs).
An ASWF can be characterized by a topological charge, which is the phase increment divided by 2π after completing a full circle around the sound source and returning to the starting position. The topological charges in the wavefronts utilized in spiral navigation are 0 for the reference wavefront and 1 for the spiral wavefront.
Various experiments have been performed to examine the method of spiral wavefront navigation. In [
2], several outgoing signal forms and processing techniques were compared. The root-mean-square (RMS) error was found to range from 7.2° to 12.8°. Two deterministic errors were discussed; namely, the phase error of the beacon and the radial velocity of the receiver. In [
3], underwater navigation experiments were carried out using a single spiral wavefront beacon with different ranges and beacon depths. The stochastic error was estimated to vary from 2.7° to 7.3° over the experiments.
With the development of the ASWF navigation technique, different types of ASWF sources have also been developed. Building on the basic model of physical-spiral and phased-spiral sources [
1], spiral wavefront transducers have been realized with 1–3 piezocomposite materials [
4], piezoceramic hollow cylinders [
5,
6], and cylinder shell with inner spring–mass structures [
7]. Among the ASWF sources, the working frequency range extends to 1–100 kHz.
As the aspect for ASWF navigation transfer from the phase data, high precision navigation always requires accurate phase transmission and reception. However, the phase error of the ASWF sources, particularly the insufficient linearity of the phase-azimuth relationship, appears to be ubiquitous [
2,
3,
4,
5,
6,
7,
8]. On the one hand, the systematic phase error of the source can be calibrated in advance and corrected within the receiver’s data processing procedure [
6]. On the other hand, the designs of low-phase-error ASWF sources can be further investigated [
7], and calibration methods that adjust the input signals have shown effectiveness [
8]. The issue of how to further minimize the phase errors of the ASWF sources remains a matter of significant concern.
This study proposes an underwater circular array that employs monopole-behaved transducers; specifically, the bender disk transducer, which emits low-phase-error spiral wavefronts and circular reference wavefronts for ASWF navigation. The array was parametrically designed and analyzed using the point source array model, considering both the amplitude and phase error responses. Subsequently, a prototype of the array was then fabricated and tested. Given that the phase directionality error of the array is crucial for navigation applications and is highly susceptible to manufacturing errors, a phase error compensation method based on the linear system assumption was examined through experiments with the prototype. The experimental results are presented and discussed.
2. Materials and Methods
2.1. Design of the Transmitting Array Structure
2.1.1. Structure and Drive Method
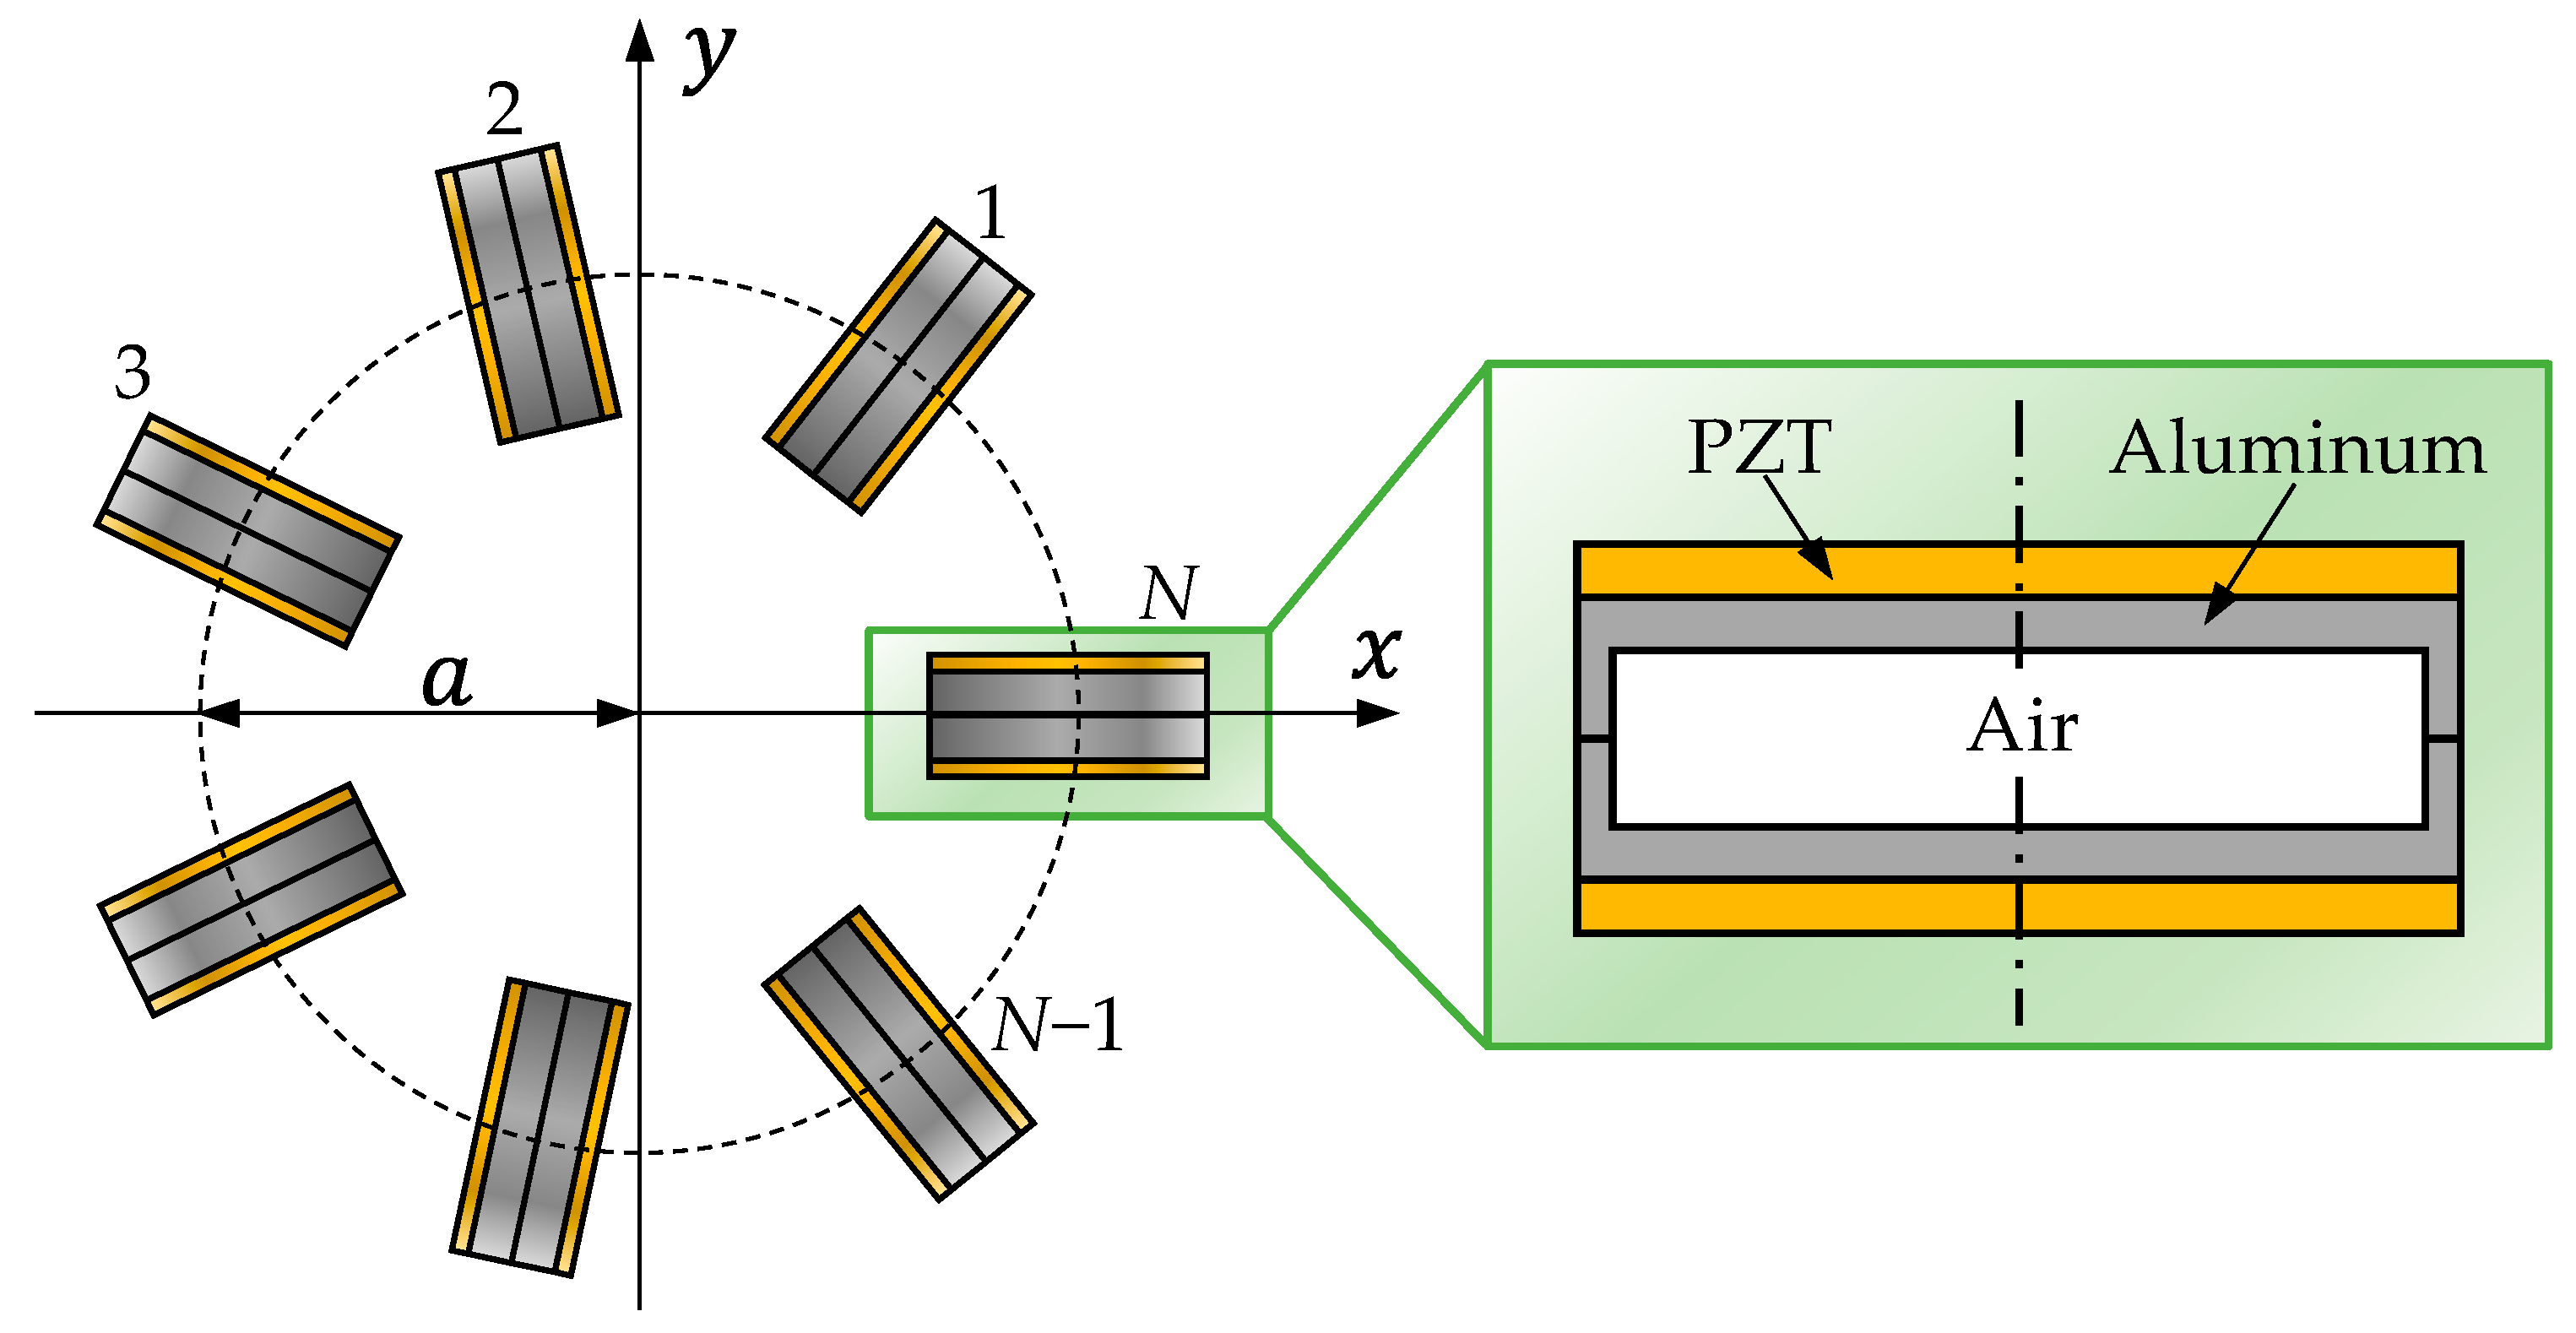
The transmitting array comprises
transducer elements uniformly distributed along a circle configuration in the x-y plane, as illustrated in
Figure 1. The array is designed to emit both acoustic spiral wavefronts and reference wavefronts using a single structure, aiming to minimize the phase error while maintaining high transmitting efficiency. Bender disk transducer was selected as the array element due to its compact size and favorable low-frequency characteristics, which offer design flexibility in terms of array scaling. By adjusting the driving phase bias, the array can sequentially generate both wavefront types, ensuring perfect concentricity and eliminating the need for additional correction in out-of-plane applications. The phase error-defined as the deviation between the actual phase-azimuth character profile and the ideal linear or constant behavior-represents a critical performance metric of the array, as it directly affects the accuracy of the azimuth estimation. This aspect is examined in detail in the subsequent sections of this article.
The transmitting array is actuated by an
-channel characterized by uniform frequency and amplitude across all channels, and a driving phase modulus
. The phase bias between adjacent channels—specifically, from channel
to channel
—is defined by the expression
, where
corresponds to the topological charge of the desired ASWF. When
, the array emits reference wavefronts with constant phase directionality; when
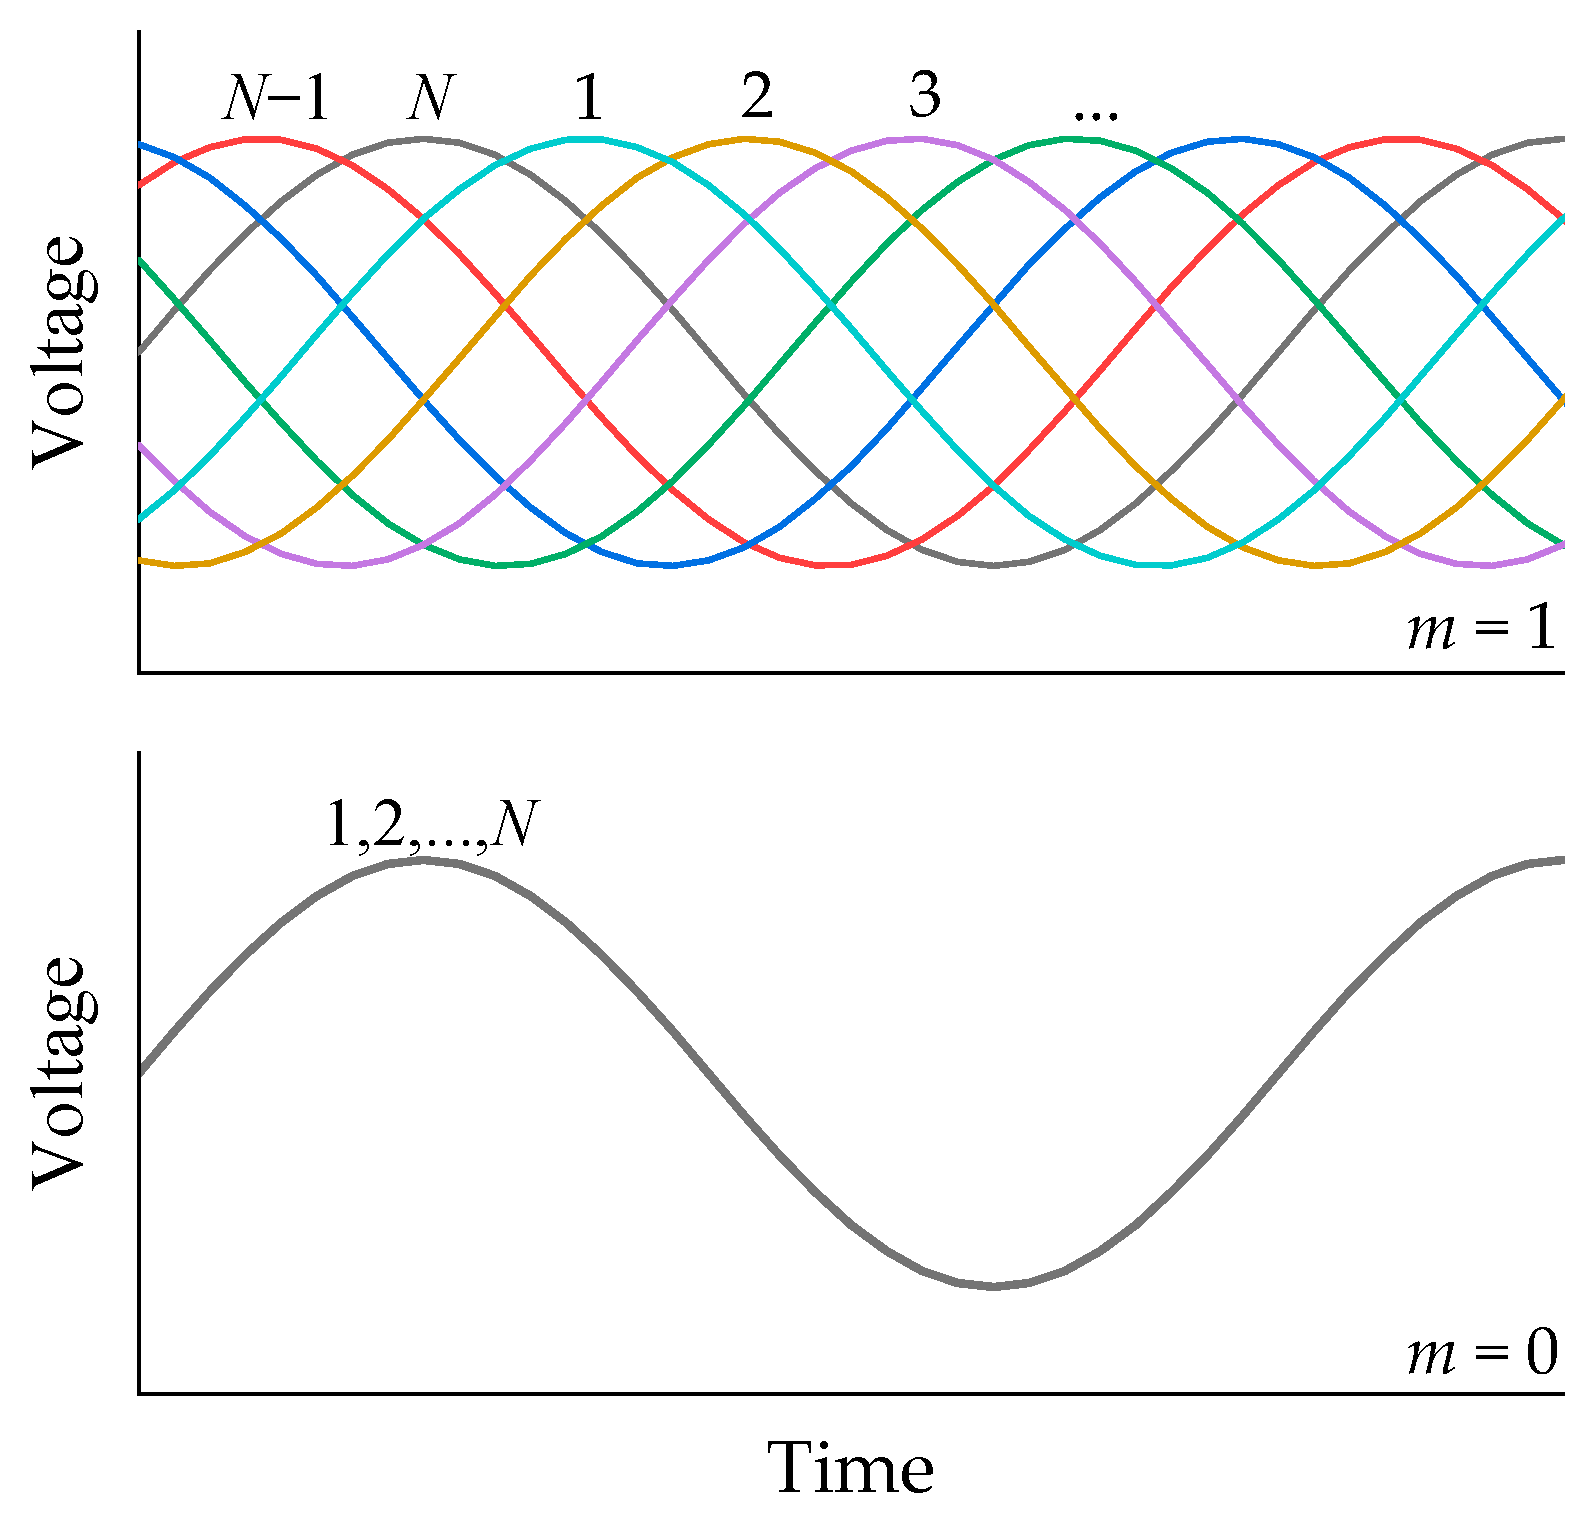
, it generates spiral wavefronts exhibiting a linear phase variation with azimuth at a 1:1 ratio. An example of the driving signal configuration is illustrated in
Figure 2.
2.1.2. Modeling Method Based on Point Source Approximation
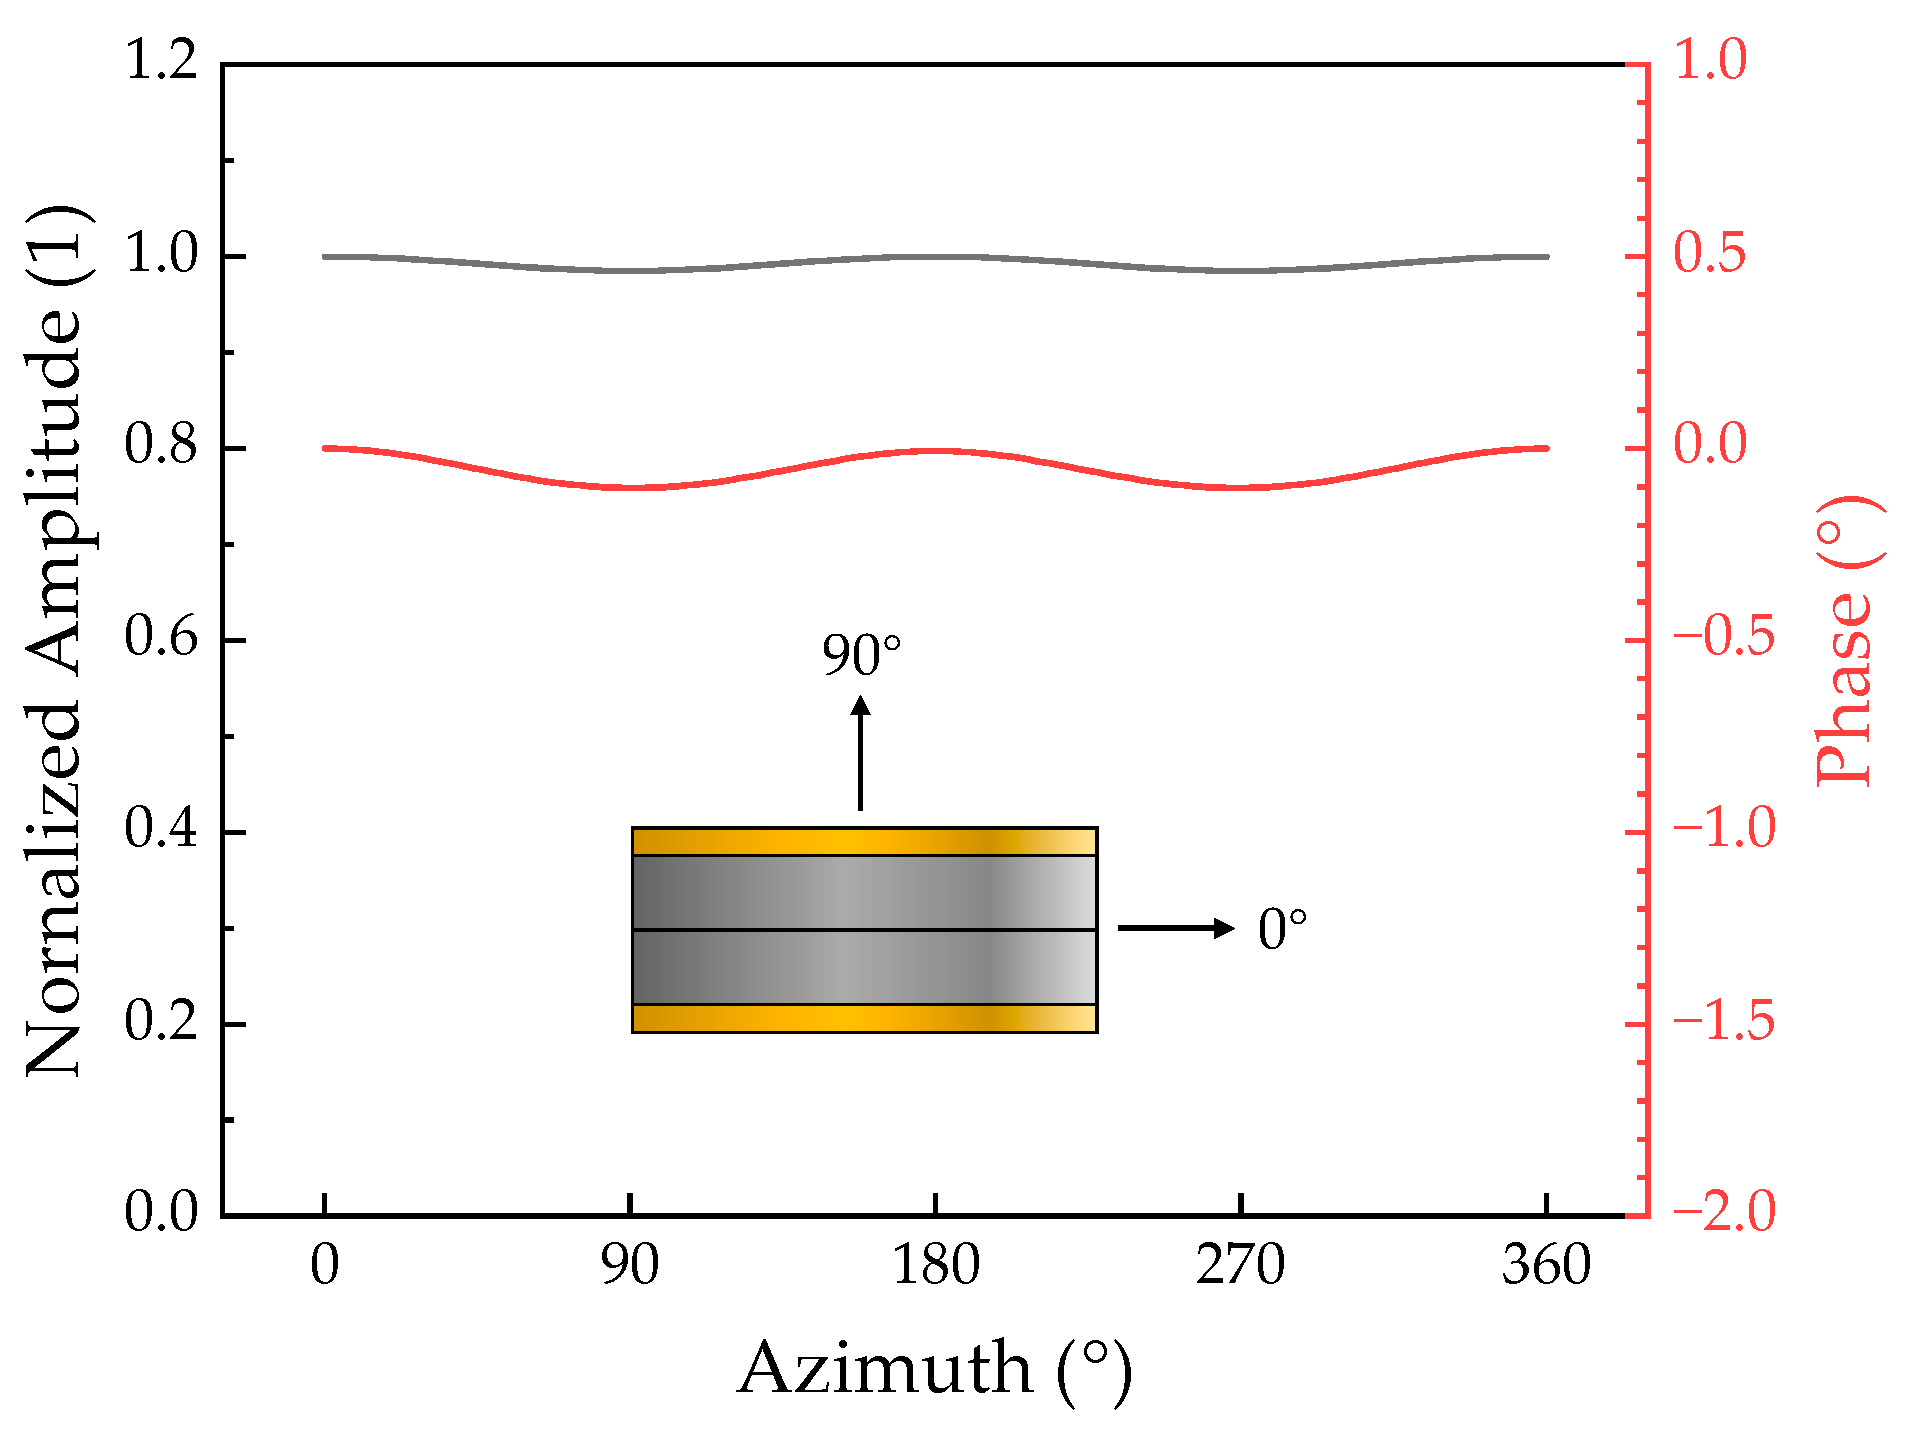
As bender disk transducer is a small-sized low-frequency transducer and shows a monopole directivity both for the amplitude and phase, as shown in
Figure 3; hence, it can be regarded as a point sound source in the preliminary analysis. Thus, based on point sound source approximation, the transmitting array was modeled using a simple circular array (SCA) model, which was established in our previous work [
7] and as shown in
Figure 4.
The SCA model describes a circular array with uniform spacing of both the geometry and initial phase. The model neglects the scattering effect and assumes that the array elements are omnidirectional with the same source strength. The SCA model facilitates an easy analysis of the amplitude response and phase error performance of the array.
2.1.3. Method of Analyzing the Effects of the Structure Parameters on the Performance
Using superposition theory, the far-field acoustic pressure of the emitted wave can be described in the form of an ASFW decomposition:
where
is related to the source strength of the array elements,
is the wave number,
is the topological charge,
is the set of integers, and
is a Bessel function of the first kind.
Thus, the amplitude response of the array, , is revealed directly by the Bessel function, and phase error can be further analyzed based on the idea of the signal-to-interference ratio (SIR).
The phase error, characterized by its root-mean-square (RMS) value of the phase error according to the azimuth, is a result of non-desired ASWFs interference with topological charges of
against the desired ASWF with
. Assuming
, the phase error can be defined by the SIR in a simple formation while neglecting the small amplitude deviation caused by the interference. The RMS phase directionality error,
is calculated in the form of Equation (2) [
7].
While the variable of Bessel functions is smaller than the minimum of the first stationary point according to the orders , the value of the function with smaller absolute order is always larger. So, the phase error is mainly determined using several terms with the smallest absolute orders and is calculated using nonzero terms with the first five smallest absolute orders in the design and analysis step.
The two main structure parameters of the transmitting array can now be summarized. One is the product of the wave number and array radius, ; the other is the number of array elements, .
2.1.4. Design Indicators and Optimization
We considered two principal design indicators to guide the optimization of the transmitting array. The first is the root-mean-square (RMS) value of the phase directionality error, which plays a crucial role in determining the precision of azimuth estimation for navigation applications. Lower phase error values generally correspond to higher azimuth estimation accuracy. The second indicator is the amplitude response of both wavefront types, which reflects the effective range of navigation service provided by the array. Maintaining sufficiently high amplitude levels for both spiral and reference wavefronts is essential to ensure reliable performance over extended distances. These indicators were deliberately selected based on the operational objectives of the transmitting array and the stringent requirements of high-accuracy azimuth estimation tasks.
The optimization process was designed to balance the selected performance indicators while accounting for practical constraints such as manufacturing feasibility and cost-effectiveness. Notably, although the number of the array elements exerts a proportional influence on the amplitude levels of both wavefronts, it has a significantly larger impact on the phase error. Therefore was excluded from the amplitude response design phase. Instead, the product of the wave number and array radius, , was optimized to ensure both wavefronts exhibit equal and sufficiently high amplitude levels. Subsequently, the value of was selected to achieve a sub-degree-level phase directionality error, thereby satisfying the accuracy requirements defined by the design indicator.
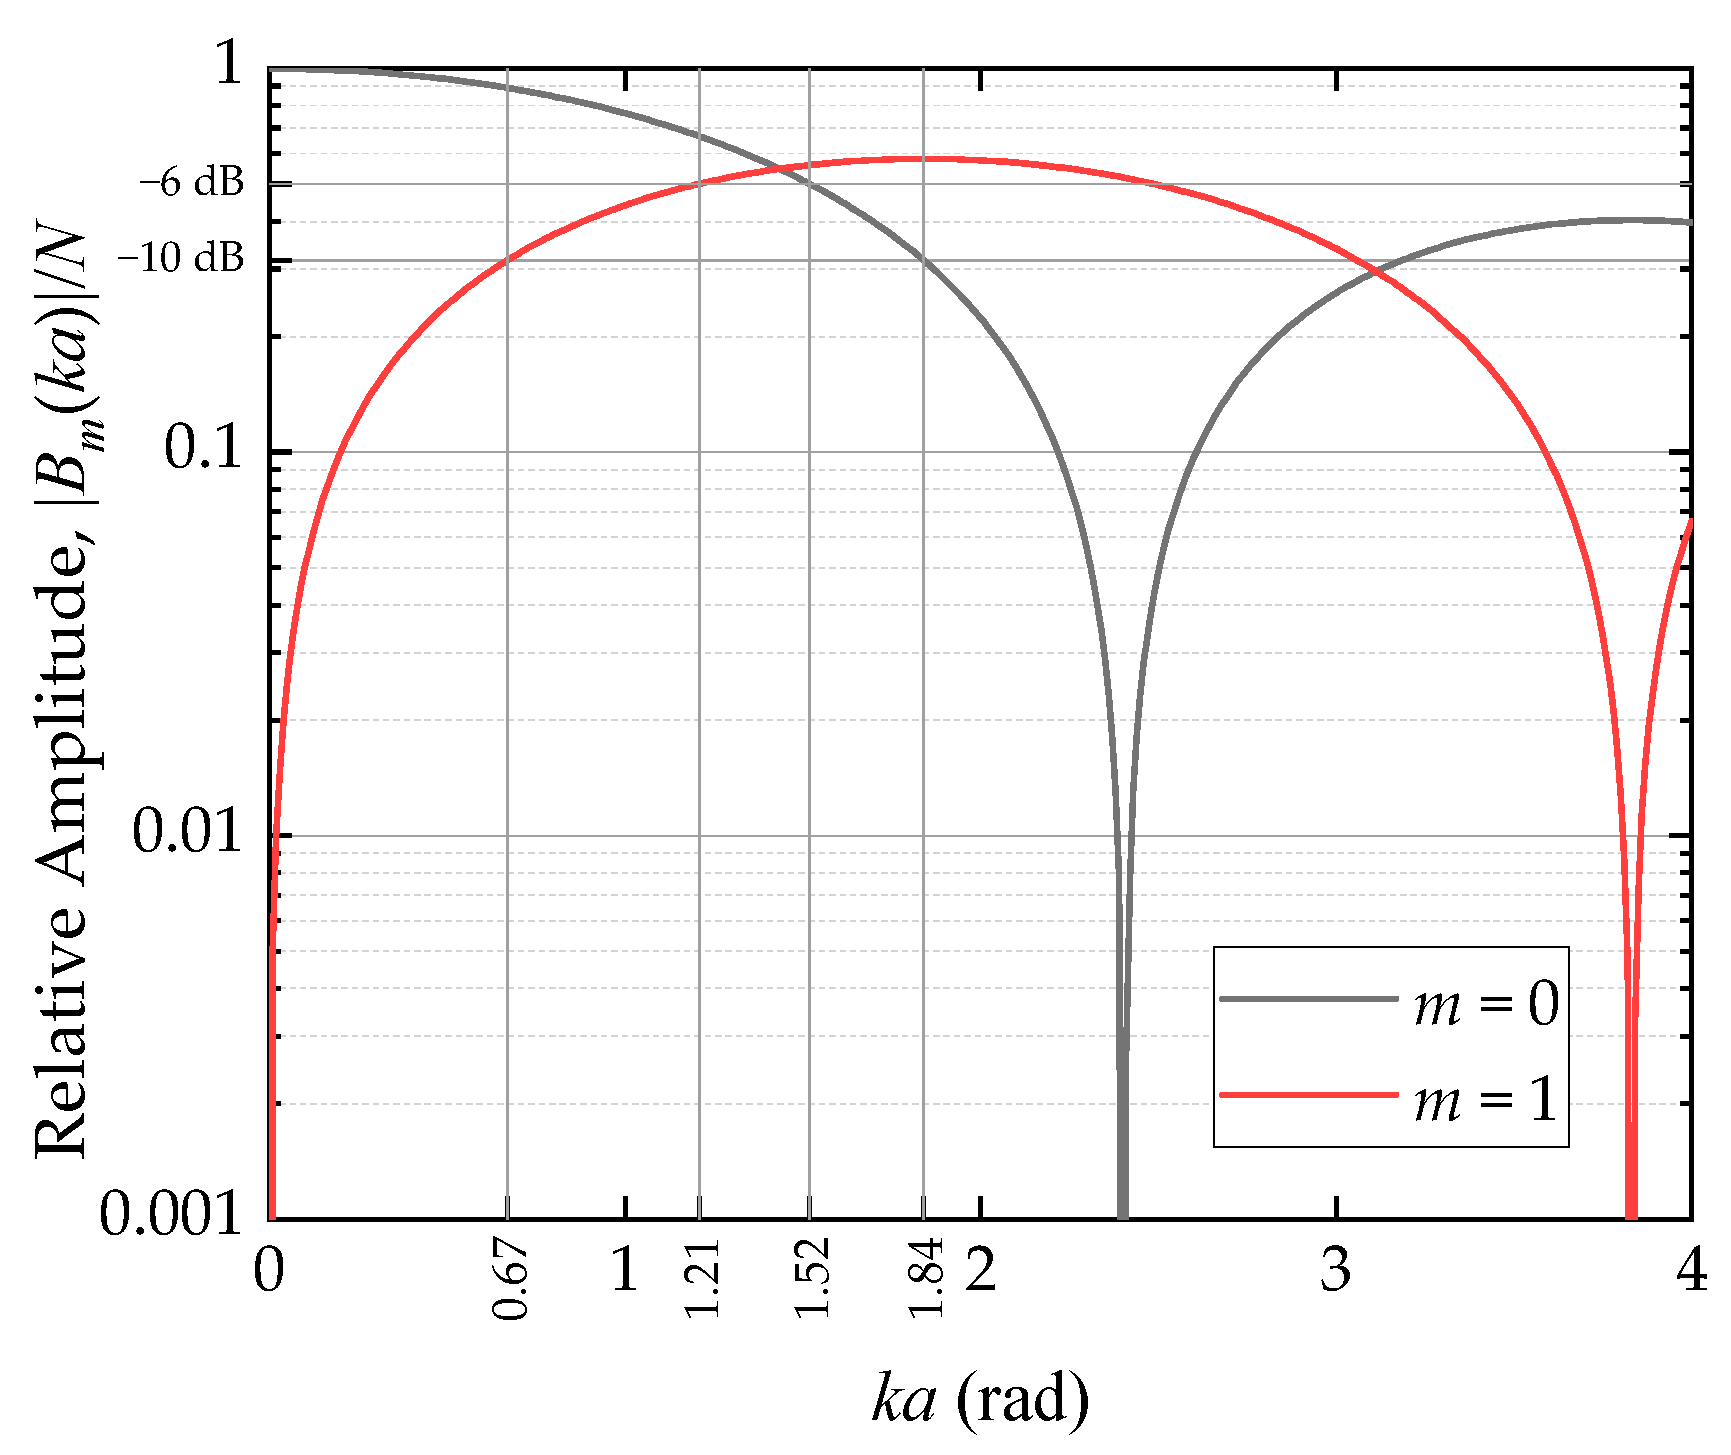
Figure 5 shows the amplitude responses of the spiral (
) and reference (
wavefronts according to Equation (1), which suggests the best solution for
around 1.43 rad. If the amplitudes of both wavefronts are required to be no less than −6 dB of their overall maximum values,
ranges from 1.21 to 1.52 rad. If the amplitude requirement is relaxed to no less than −10 dB, the range of
extends to 0.67–1.84 rad.
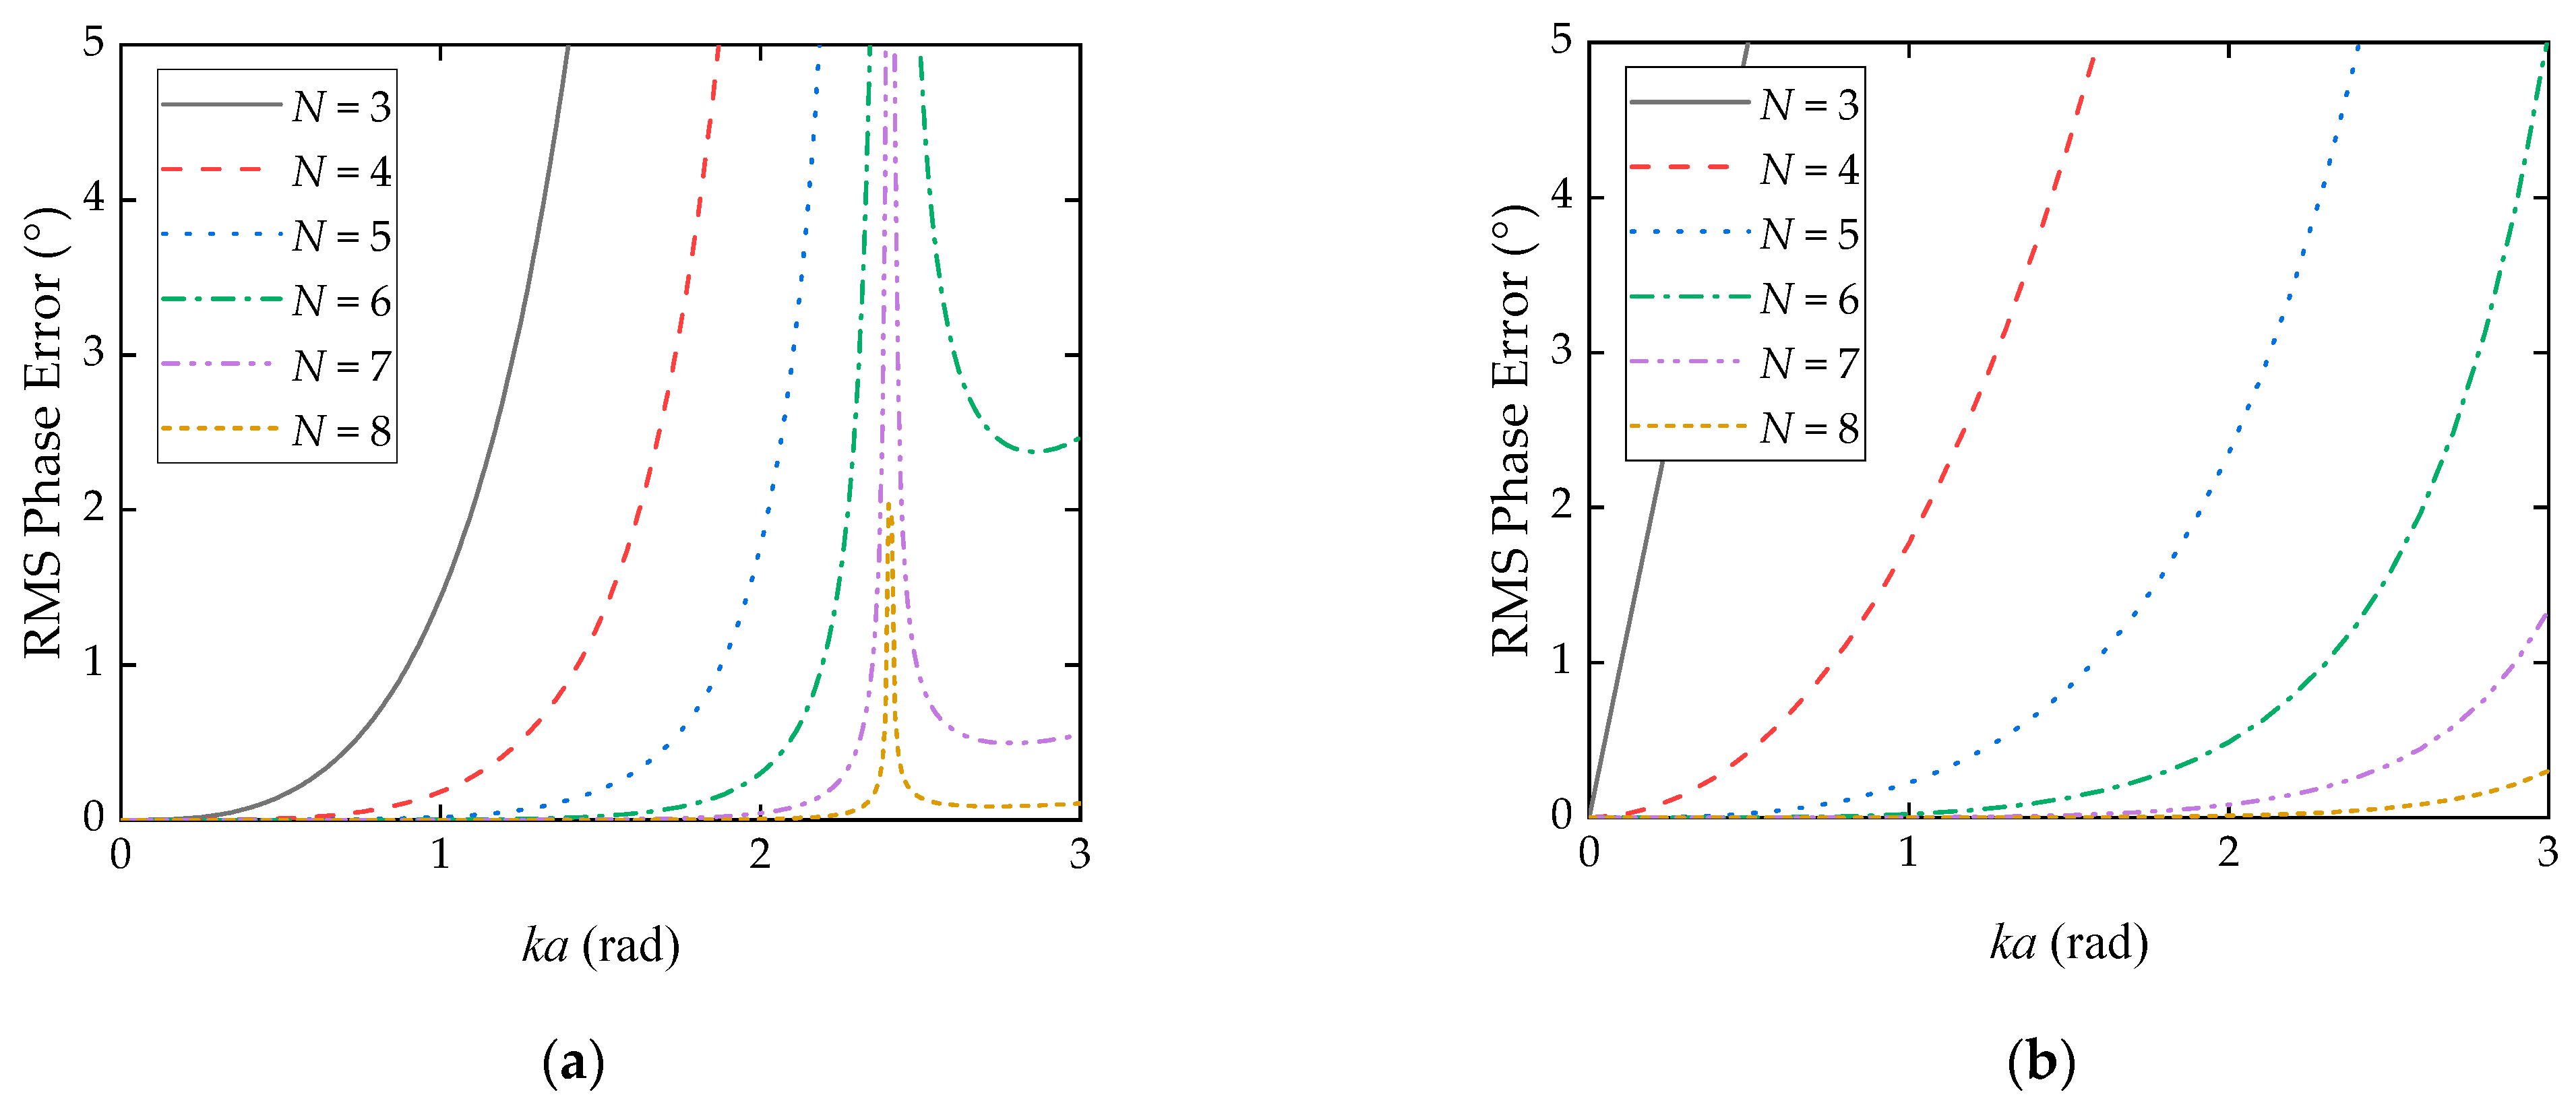
Figure 6 shows that the RMS value of the phase directionality errors,
, of the two wavefronts varies with
and
, according to Equation (2) and the truncation method in 2.1.3. Hence, the larger the value of
, the smaller the phase error of the array. According to the curves, if the RMS value of phase error remains below 1° at
= 0.67–1.84 rad, at least six elements should be employed in the array.
2.2. Phase Error Compensation Method
ASWF sources experience a significant degradation in phase accuracy between the designed and manufactured devices [
2,
3,
4,
5,
6,
7,
8], generally attributed to the susceptibility of phase-based performance to manufacturing errors in the sources, which can be mitigated by higher standards but cannot be fully eradicated. Therefore, a compensation method can enhance the performance.
The phase error compensation method is based on a liner input–output model of the transmitting array system, which begins at the electrical voltages input to the array elements and ends at the generated acoustic field, as shown in
Figure 7.
Although the actual system involves numerous phenomena and theories (e.g., piezoelectric effect, elastic vibration, acoustic radiation, and acoustic scattering), it is reasonable to assume that the model of the array is linear under small-signal conditions.
If the signal in the system is time-harmonic, the input to the array can be described using the voltage vector
, where
is the complex voltage applied to the array element with index
, which contains the amplitude and phase. The output acoustic field is described as the acoustic pressure vector
, where
is the complex acoustic pressure at the sampled point with index
and
. Therefore, the fabricated array system can be described as Equation (3a) using a system matrix
, which can be easily obtained via measurements in working condition with Equation (3b), by taking
different voltage vectors to form a full-rank test voltage matrix
.
Finally, the compensated voltage vector,
can be calculated using Equation (4) with the Moore–Penrose generalized inverse,
, where
is the target acoustic pressure vector sampled from an ideal acoustic field model.
The compensated voltage vector is the least-squares solution that minimizes when applied to the fabricated transmitting array.
In summary, the compensation process includes three steps:
Measurements of the matrix,
.
Calculation of complex voltage vector,
Application of the calculated amplitudes and phases to the array.
As the weights of the sampled acoustic pressure are equal in the compensation process, a uniform space sampling should be applied to the acoustic field.
2.3. Prototype Fabrication
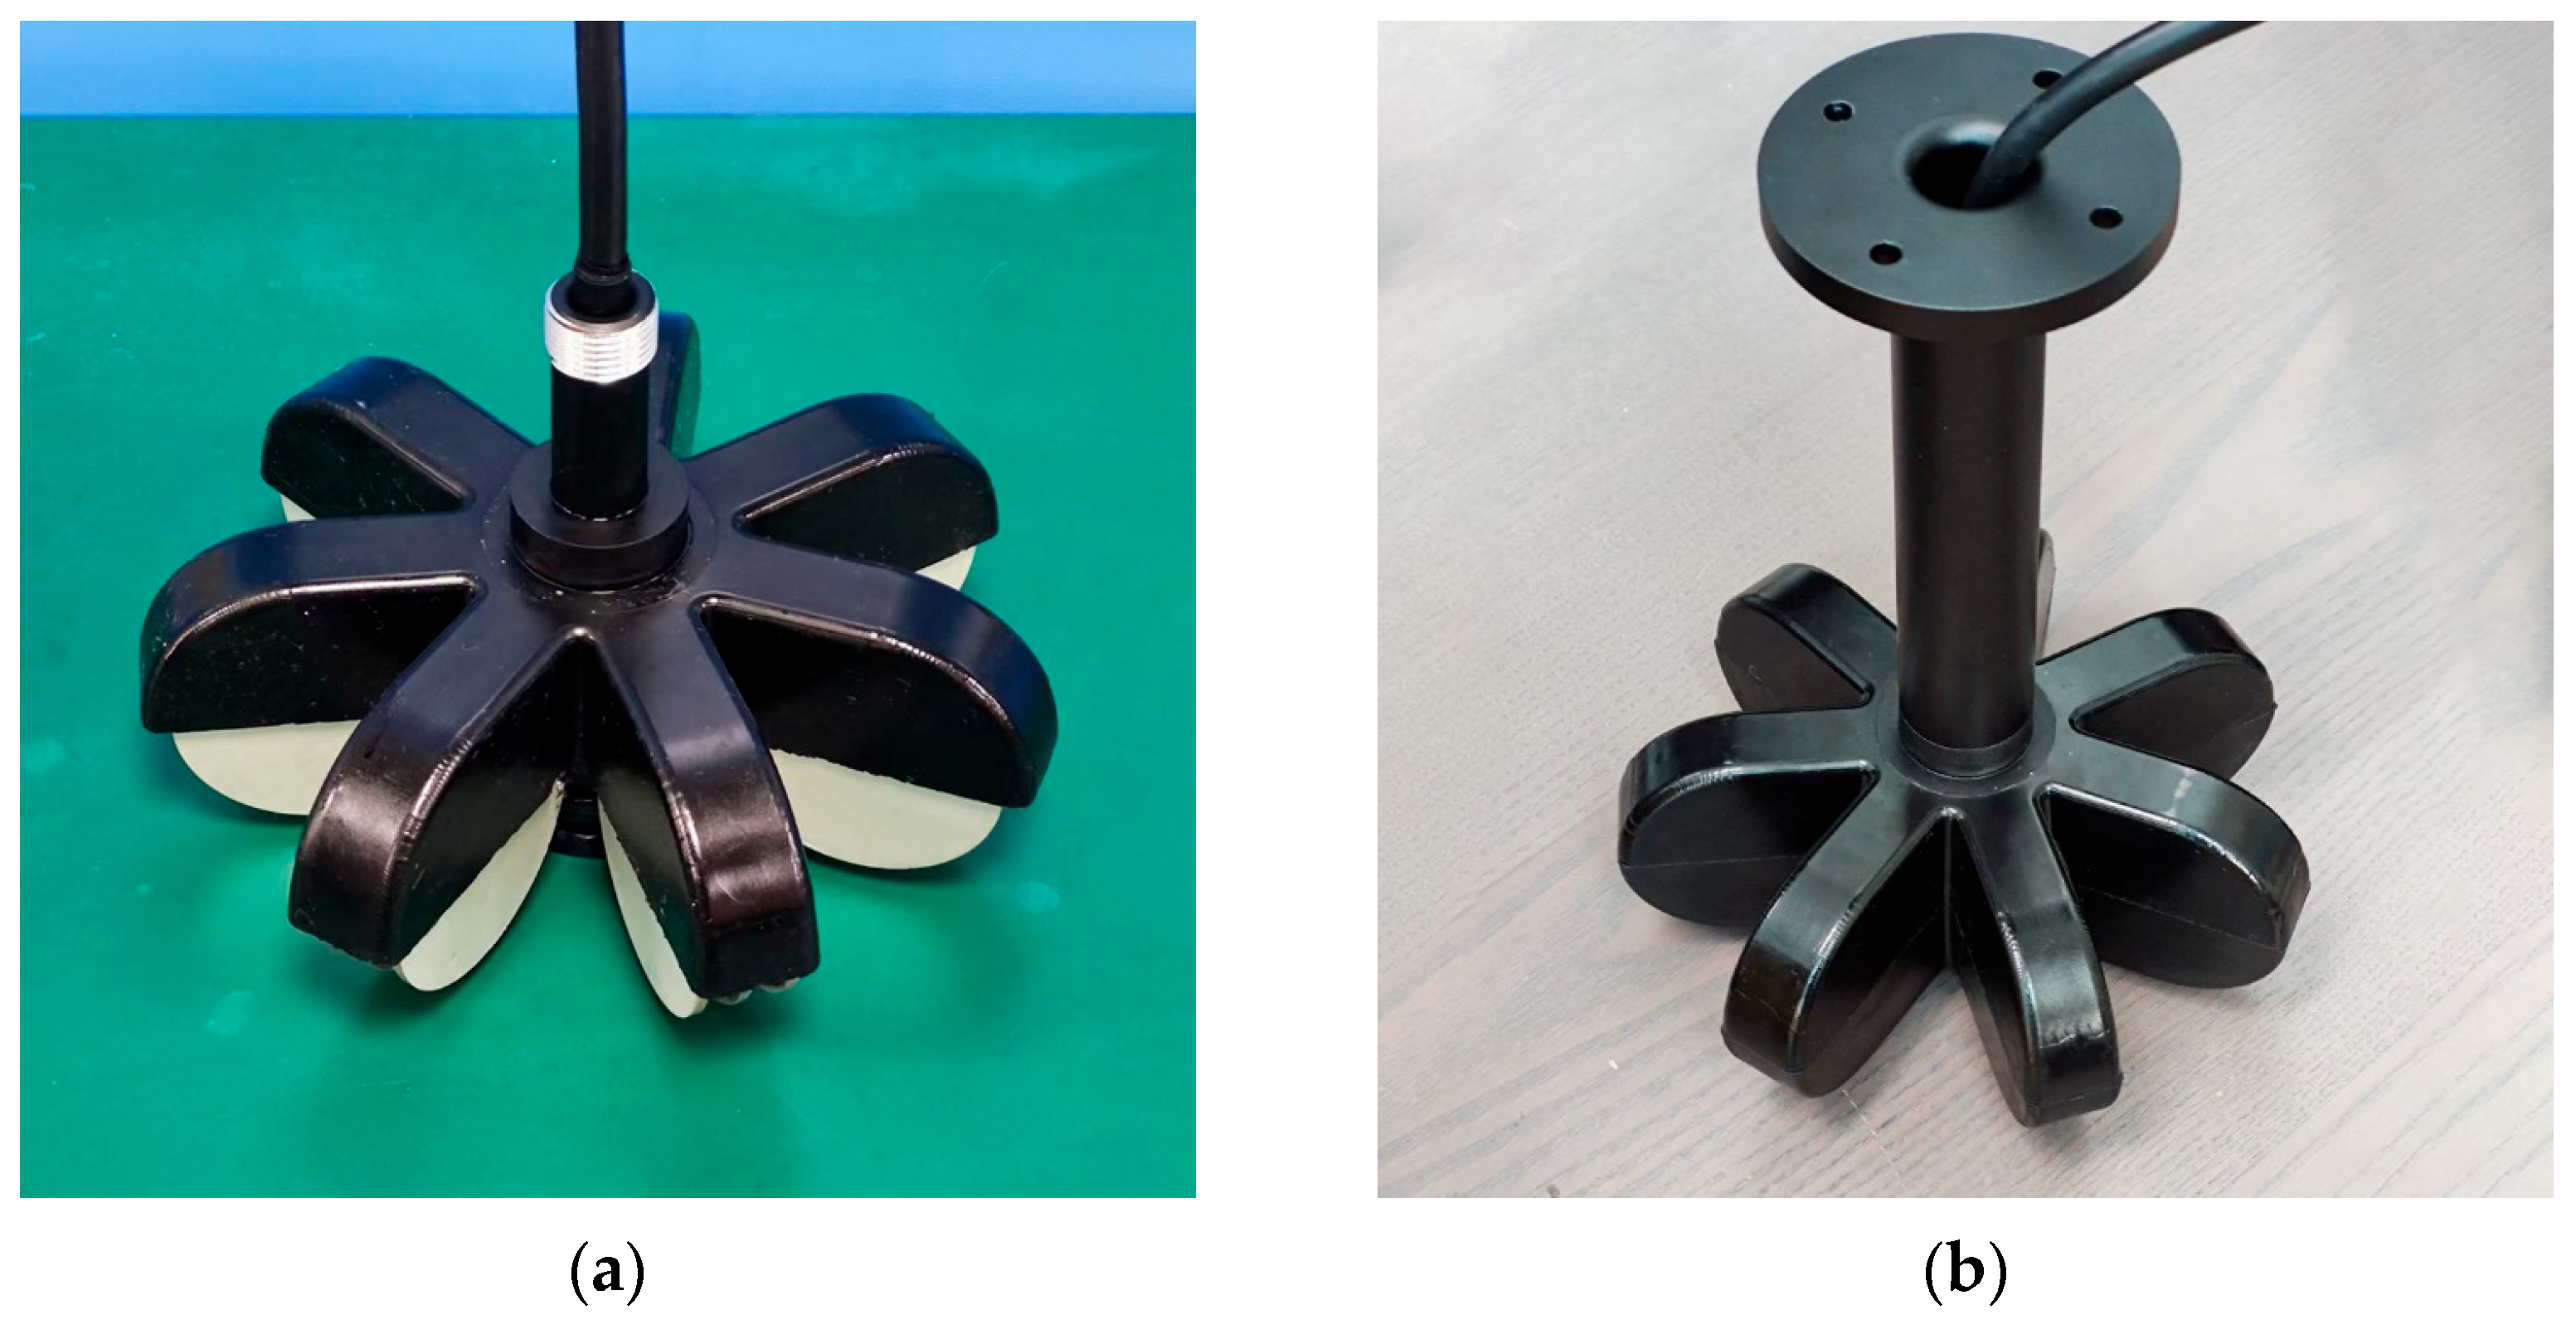
To validate the design of the transmitting array and the proposed error compensation method, a prototype was fabricated. The transmitting array prototype was designed to have seven bender disk elements arranged as radial spokes around a hollow array support in the center, as shown in
Figure 8. A gap was maintained between the elements and the array support. To allow for potential performance degradation due to factors neglected in the SCA model, the number of the elements was increased by one based on the above design. The bender disk element has a diameter of 50 mm, and the distance between the center of each element and the center of the array is also 50 mm, to make the
of the array aproximates the best solution, 1.43 rad. The minimum distance between the elements and array support is 5 mm.
The materials selected for the prototype included piezoelectric ceramics PZT-5 for the transducer elements and a lightweight metal alloy Aluminium-6061 for the elements and array support structure. Polyurethane was selected as the potting material due to its acoustic impedance being close to that of water.
The fabrication process began with the fabrication of the bender disk elements; the piezoelectric materials and metal disks were bonded using epoxy resin. Then, the electrodes of the transducer elements were soldered to a watertight cable, and the cable was routed through the hollow array support to avoid asymmetric scattering. The elements share the negative electrode but have individual positive electrodes. Finally, the array was potted into a whole piece by two steps of half potting using a customized mold.
2.4. Validation Experiment Setup
The Uniformity Assessment of the fabricated prototype elements was performed after the whole fabrication process via admittance curve measurement in air, using a HIOKI IM3570 impedance analyzer (HIOKI E.E. Corporation, Ueda, Nagano, Japan).
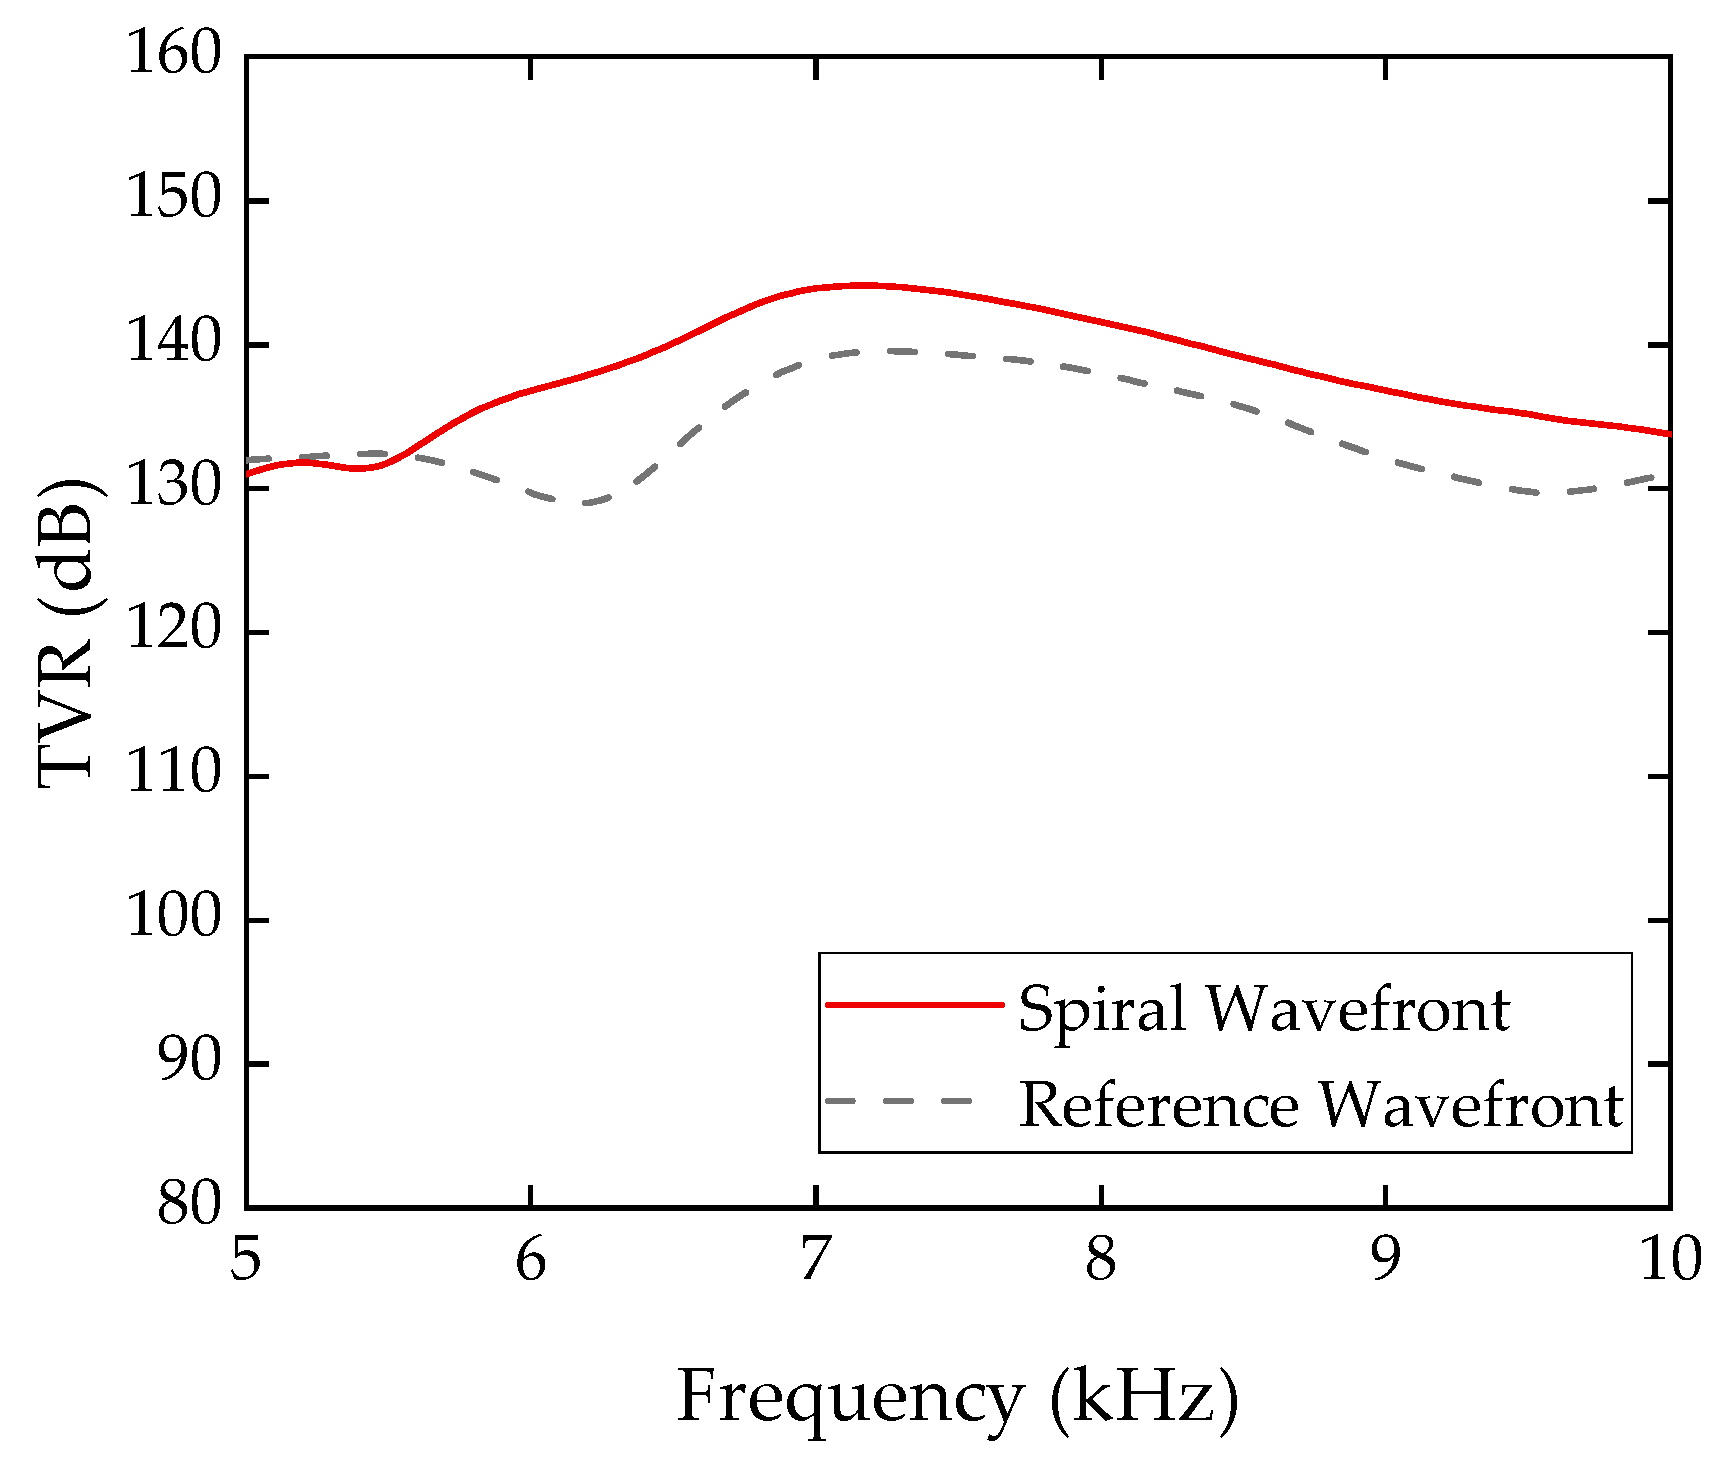
The acoustic tests and experiments of the fabricated transmitting array prototype were conducted in a 25 m × 15 m × 10 m anechoic water tank. The system consisted of a Sound Blaster X3 DAC (Creative Technology Ltd., Singapore, Singapore) to generate an eight-channel phased signal, a custom-built seven-channel TDA7293 amplifier (STMicroelectronics, Geneva, Switzerland), a B&K 8104 hydrophone (Brüel & Kjær, Naerum, Denmark), and a B&K 3053 data acquisition device (Brüel & Kjær, Naerum, Denmark). The distance between the hydrophone and the transmitting array was 1.8 m, with a depth of 5 m. The hydrophone sensitivity was calibrated at −208.0 dB (re 1 V/μPa). The background noise level was below 93 dB/√Hz from 5 to 10 kHz. Firstly, the transmitting voltage response (TVR) curve was tested, and the resonance frequency and
value were obtained. Then, phase and amplitude directionality test were conducted with three frequencies, i.e., the resonance frequency, one above, and one below. The rotator was set to have a 5° step for all the directionality tests. The signals were continuous wave (CW) pulses with a 2 ms pulse width. The phase and amplitude data were converted using a fast Fourier transform (FFT). Finally, a phase error compensation experiment was subsequently condected with a test voltage matrix,
5. Conclusions
To address the challenges associated with low-phase-error emission in both spiral and reference wavefronts, this study introduced a novel transmitting array alongside a tailored compensation method. The primary contributions are as follows: (1) the design of a transmitting array optimized for a minimal phase error in dual wavefront generation; and (2) the development of a modified compensation technique grounded in a linear electroacoustic model of transmitting arrays.
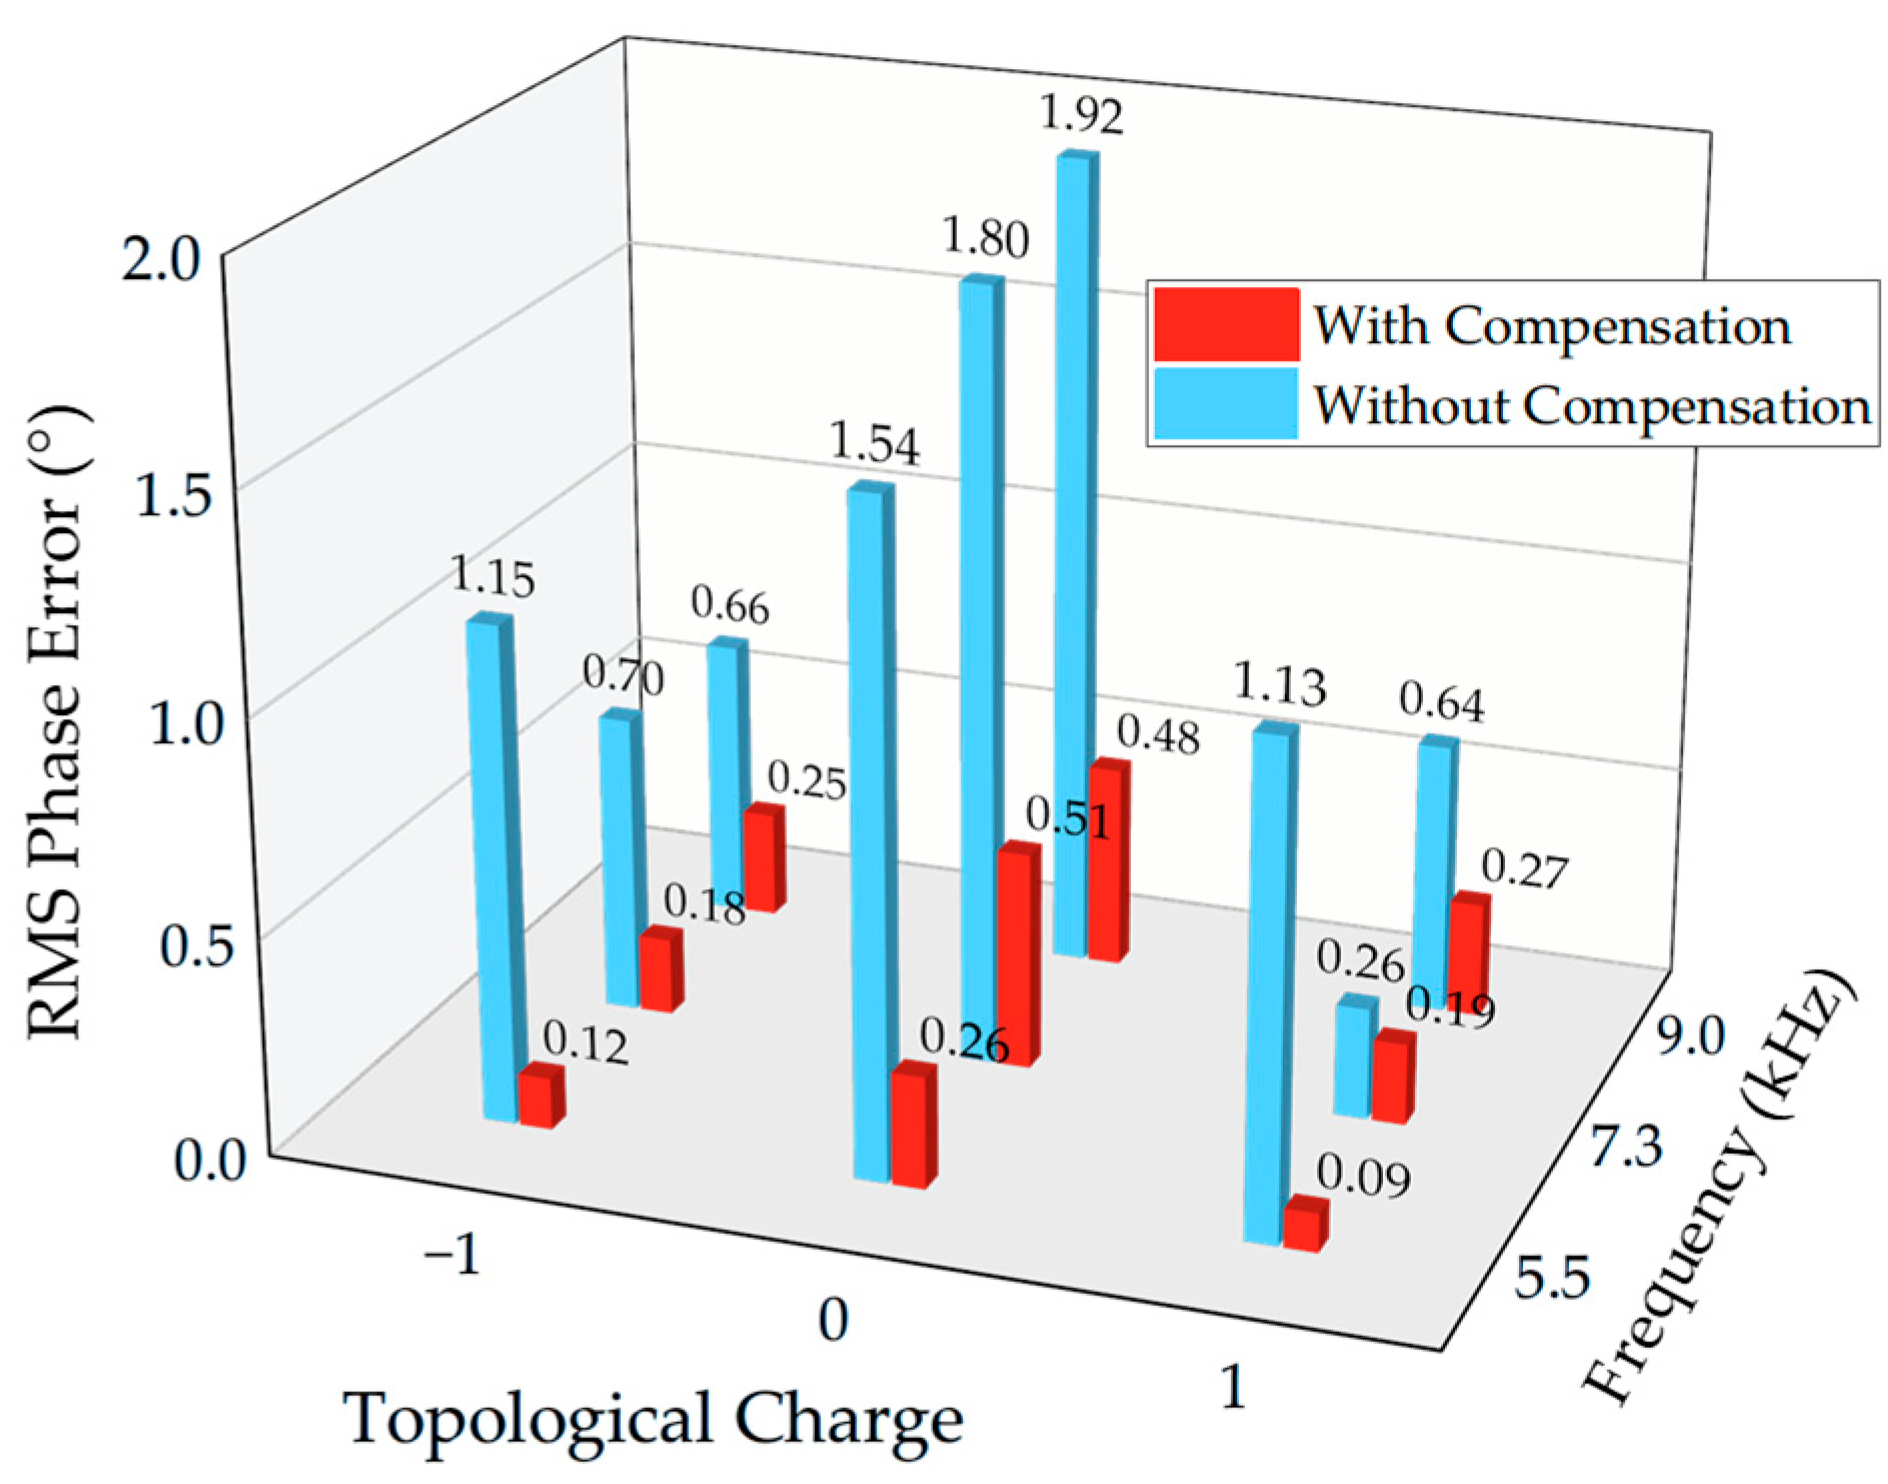
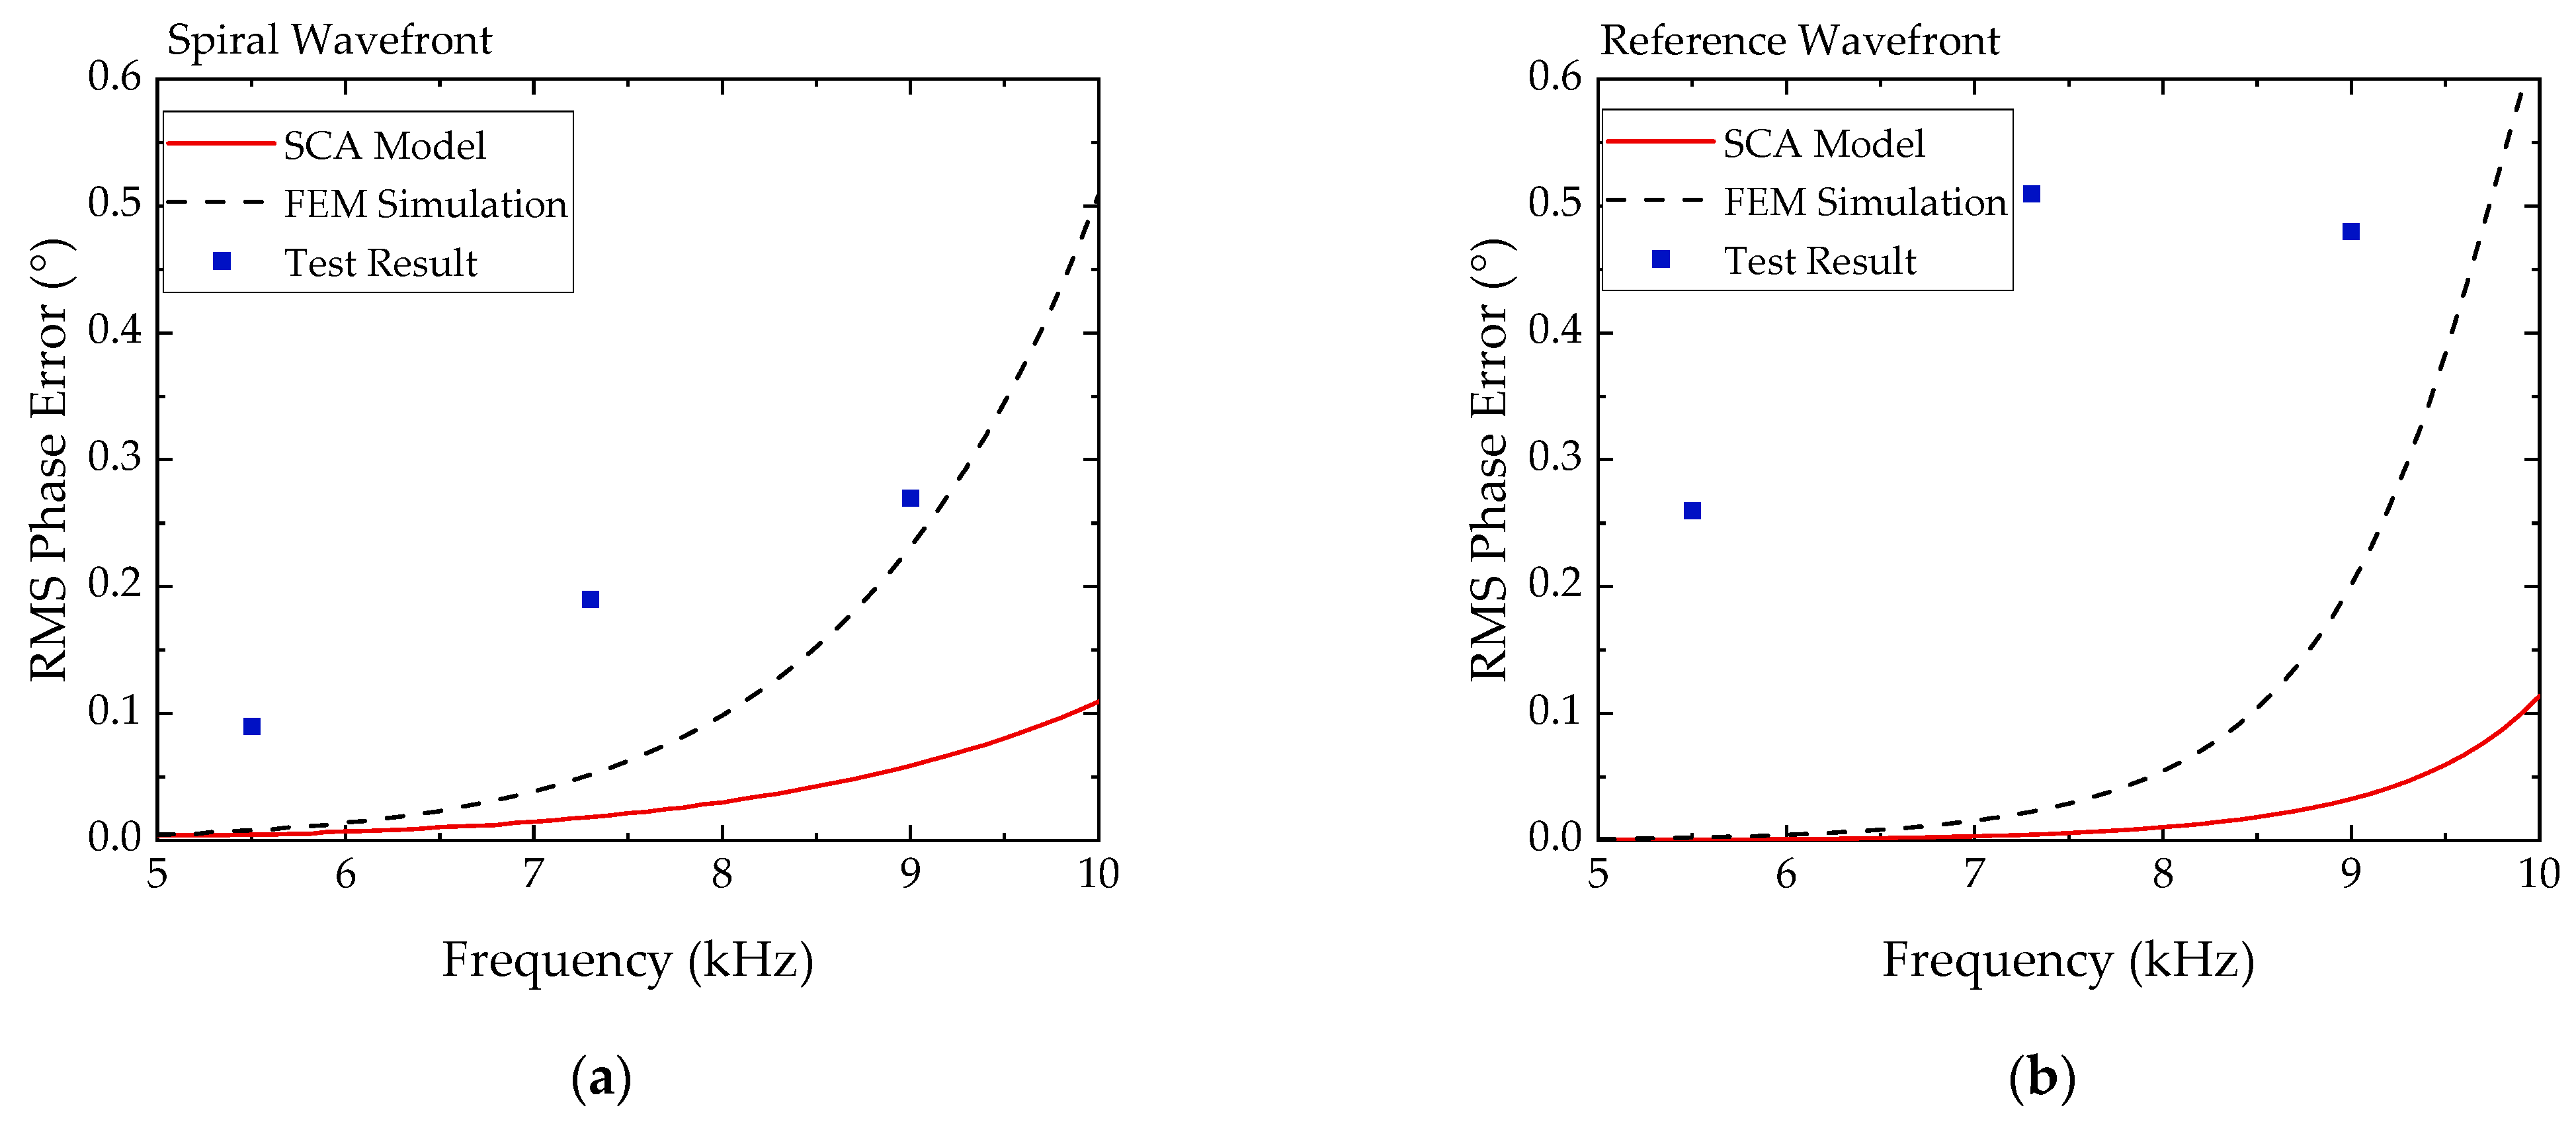
Experimental validation was conducted in a water tank experiment using an array prototype comprising seven bender disk transducers. The prototype, with dimensions of Φ156 mm × 56 mm at the outer edge of the transducers, was driven by a seven-channel signal. The test results confirmed the array’s capability to effectively emit both spiral and reference wavefronts in an underwater environment. At the resonance frequency of 7.3 kHz, the array achieved peak transmitting voltage response (TVR) values of 144.1 dB for spiral wavefronts and 139.5 dB for reference wavefronts. The compensation method demonstrated significant improvements in both amplitude uniformity and phase directionality accuracy across all the tested frequencies. Specifically, the compensated amplitude directivity variation remained below 0.3 dB, while the RMS phase error was reduced to a range of 0.09–0.51°.
