Abstract
The submarine topography in the canyon area of the Qiongdongnan Basin is complex, with severe risks of shallow gas hazards threatening marine engineering safety. To accurately characterize seabed morphology and assess shallow gas risks, this study employed multi-source data fusion technology, integrating 3D seismic data, shipborne multibeam bathymetry data, and high-precision AUV topographic data from key areas to construct a refined seabed terrain inversion model. For the first time, the spatial distribution characteristics of complex geomorphological features such as scarps, mounds, fissures, faults, and mass transport deposits (MTDs) were systematically delineated. Based on attribute analysis of 3D seismic data and geostatistical methods, the enrichment intensity of shallow gas was quantified, its distribution patterns were systematically identified, and risk level evaluations were conducted. The results indicate: (1) multi-source data fusion significantly improved the resolution and accuracy of terrain inversion, revealing intricate geomorphological details in deep-water regions; and (2) seismic attribute analysis effectively delineated shallow gas enrichment zones, clarifying their spatial distribution patterns and risk levels. This study provides critical technical support for deep-water drilling platform site selection, submarine pipeline route optimization, and engineering geohazard prevention, offering significant practical implications for ensuring the safety of deep-water energy development in the South China Sea.
1. Introduction
The Qiongdongnan Basin, with its unique geological structural background and hydrocarbon accumulation conditions, has become a key target area for oil and gas exploration and development in the western South China Sea [1,2,3]. As a critical structural unit in the western South China Sea, the Qiongdongnan Basin has undergone multiple phases of tectonic movement superposition, forming a complex geological framework dominated by fault systems with significant variations in sedimentary strata [4,5,6]. In recent years, as exploration and development accelerate into deepwater and ultra-deepwater areas, accurately characterizing seabed topography and precisely identifying shallow gas enrichment zones have become prerequisites for ensuring marine engineering safety and efficient development [7]. Therefore, achieving breakthroughs in terrain inversion accuracy through multi-source data fusion and accurately delineating shallow gas distribution patterns are key scientific challenges that urgently need to be addressed in the field of marine engineering geology.
Although significant progress has been made in the study of hydrocarbon accumulation mechanisms and deep structures in the Qiongdongnan Basin [8,9,10,11], research on fine-scale seabed topographic characterization and systematic risk assessment of shallow gas hazards remains insufficient. Previous studies have identified spatial correlations between shallow gas enrichment zones, fault trends, and paleochannels based on seismic reflection characteristics, but limitations in vertical resolution from traditional bathymetric data hinder the understanding of microscale topographic variations controlling gas migration pathways [12,13]. In recent years, shipborne multibeam bathymetry has enabled high-precision water depth data acquisition, yet beam angle effects in complex terrains create significant blind spots for steep slopes and fracture zones [14,15,16]. Against this backdrop, innovative applications of high-resolution topographic inversion techniques offer new solutions to overcome these bottlenecks [17,18,19]. Autonomous underwater vehicle (AUV)-mounted multibeam sonar systems can obtain high-resolution topographic data, which—when combined with sequence boundary extraction from 3D seismic data—enables multiscale terrain modeling from regional to localized key areas [20]. However, current research predominantly focuses on single-technique applications [21,22], lacking a systematic framework for collaborative inversion mechanisms integrating multi-source data (seismic, shipborne multibeam, AUV), thereby impeding comprehensive evaluation capabilities for complex seabed geological environments and hazard risks.
Facing these challenges, this study focuses on the canyon area of the Qiongdongnan Basin, aiming to address the critical issues of accurately characterizing complex submarine topography and understanding shallow gas hazard risks. By synergistically integrating 3D seismic data, shipborne multibeam bathymetric grids, and high-resolution AUV topographic point cloud data, the study significantly enhances the precision and completeness of seafloor terrain modeling, effectively overcoming the limitations of traditional single-data-source approaches. Building on this foundation, the research conducts an in-depth analysis of 3D seismic attributes to systematically identify the distribution patterns of shallow gas in the study area. The findings achieve refined representations of complex submarine geomorphological features (such as scarps, fissures, and MTDs) and reveal the controlling influence of high-resolution topographic elements on shallow gas distribution. This provides a solid scientific basis for the safe design of deepwater engineering projects and geohazard prevention in the Qiongdongnan Basin, while also offering research perspectives and technical pathways for a deeper understanding of complex submarine geological processes and their engineering implications in global continental margin basins.
2. Overview of the Study Area
The Qiongdongnan Basin is located at the western end of the northern continental margin rift zone of the South China Sea, adjacent to the Pearl River Mouth Basin [23,24]. It generally extends in a NE-SW direction, covering a total area of approximately 56,000 square kilometers (Figure 1). This region formed under the extensional rifting associated with the Eocene expansion of the South China Sea, undergoing three evolutionary stages: the Paleocene-Eocene rifting phase, the Oligocene-Miocene depression phase, and the Pliocene-Quaternary regional subsidence phase [25,26]. The basement primarily consists of pre-Paleogene metamorphic and igneous rocks, with the Neocene Lingshui Formation, Sanya Formation, and Meishan Formation serving as the main hydrocarbon reservoirs [27]. It is one of the most exploration-promising Cenozoic sedimentary basins along the passive continental margin of the northern South China Sea.
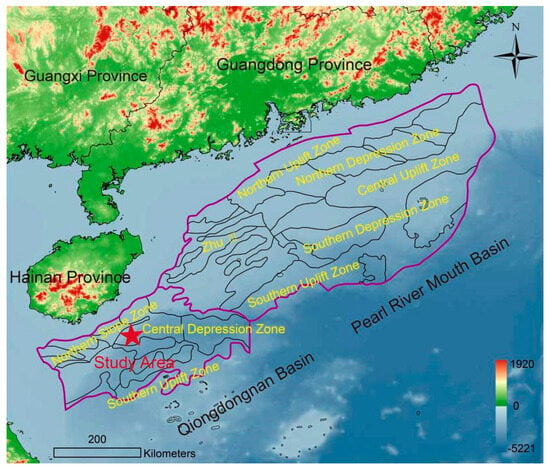
Figure 1.
Geographic Location Map of Qiongdongnan Basin.
The study area is located in the central depression zone of the Qiongdongnan Basin, with water depths ranging from 158 to 2014 m. The seabed topography in this region descends stepwise from northwest to southeast [28]. According to the classification of the northern South China Sea shelf-slope, its geomorphological units can be divided into the shelf area, slope area, and deep-water area (Figure 2). The seabed in both the shelf and deep-water areas is generally flat, with an overall slope of less than 10°. The slope area has water depths of 250–1500 m, with a maximum slope reaching 70°, and features extensive submarine canyon development. The western slope area is a collapse-type slope, with canyons at depths of 250–1000 m and cross-sections exhibiting a “U” shape. The eastern slope area is a channel-type slope, where canyons are distributed at depths of 250–1500 m, with “V”-shaped cross-sections and dense canyon channel development.
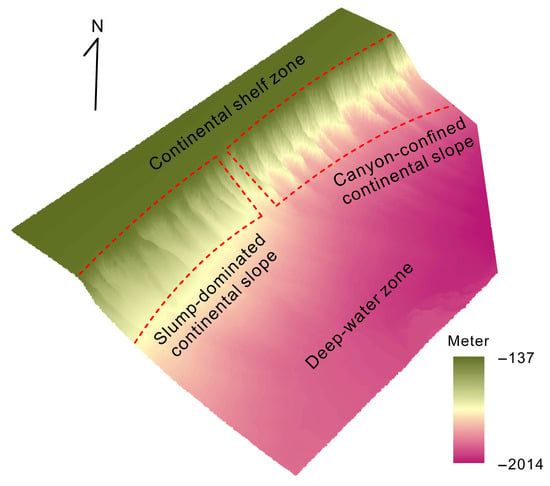
Figure 2.
Division of Geomorphological Units in the Study Area.
3. Data and Methods
3.1. Data Sources
Multi-source data were obtained through 3D seismic exploration, shipborne multibeam surveys, and autonomous underwater vehicle (AUV) investigations, with specific technical parameters listed in Table 1. The region-wide 3D seismic exploration data formed the research foundation, with the seismic source and streamer deployed at a depth of 10 m. By precisely recording the first-arrival travel times of seabed reflection interfaces, these data provided core support for regional topographic inversion and shallow stratigraphic structure analysis. The shipborne integrated survey data included full-coverage seabed topographic data with 10 m spatial resolution collected by the EM712 multibeam system. Simultaneously acquired TOPAS PS18 parametric sub-bottom profiler data revealed high-resolution shallow subsurface stratigraphic structures, while the multichannel sparker system provided mid-to-deep stratigraphic profiles. These three datasets collectively characterized seabed topographic details, shallow-to-deep stratigraphic contacts, and potential geological anomalies such as gas chimneys. For initially identified high-risk hazard target areas, autonomous underwater vehicles (AUVs) equipped with SeaBat T50-S multibeam systems and EdgeTech 2205 side-scan sonar/sub-bottom profiler combination systems were deployed. The former acquired ultra-high-precision microtopographic models with 1 m grid resolution, while the latter enabled high-resolution observation of microtopographic boundary identification and shallow gas occurrence states through side-scan image texture analysis and shallow profiling.

Table 1.
Classification and Technical Parameters of Multi-source Geophysical Data.
3.2. Analysis Methods
3.2.1. Seabed Topography Inversion
Seabed topography inversion is implemented based on global 3D seismic data. First, an automatic tracking algorithm is employed to precisely extract the one-way travel time (T) of the seabed reflection first arrival wave [29], and systematic delays caused by source and streamer depth are eliminated through specialized correction techniques [30] to ensure the accuracy of travel time data. Subsequently, time-depth conversion is performed using the seventh-order polynomial empirical formula (Formula (1)) proposed by Advocate & Hood (1993) [31]. Spatial interpolation is applied to the discrete water depth points obtained from inversion to construct a digital elevation model (DEM) with a 30 m grid spacing. By combining amplitude anomaly tracking technology and 3D seismic time slice analysis, key structural geomorphic features such as faults and scarps are systematically identified on the DEM. To rigorously validate inversion accuracy, shipborne multibeam measured topographic data and AUV topographic data from key areas are introduced for cross-comparison and error correction, significantly enhancing the accuracy of the topographic model.
In the equation, D represents water depth, in feet; T denotes one-way travel time, in seconds.
3.2.2. Multi-Source Data Fusion and Interpretation
For the shipborne EM712 multibeam data, sound velocity profile correction and tidal compensation processing were performed, eliminating the influence of marine environmental factors and generating a high-precision seabed topographic DEM with a 10 m grid. Professional software was employed to conduct three-dimensional visualization fusion and comparative analysis of seismic inversion DEM, multibeam DEM, and AUV topographic data. Through the integrated interpretation system, the spatial distribution characteristics of complex geomorphic units such as scarps, protrusions, fissures, faults, and mass transport deposit systems (MTDs) were identified and delineated. TOPAS PS18 sub-bottom profiler and multi-channel sparker data were analyzed to accurately determine stratigraphic contact relationships and identify hazard indicators such as gas chimneys and shallow gas reservoirs. For AUV data, SeaBat T50-S multibeam data were motion-compensated to generate a 1 m grid micro-topographic model. Combined with the texture features of EdgeTech 2205 side-scan sonar images, the spatial distribution information of seabed pockmark boundaries and fissure networks was precisely extracted. The instantaneous amplitude extraction technique of sub-bottom profiler data was used to detect acoustic transparent zones (ATZ, refer to strata or intervals in seismic acoustic profiles characterized by a lack of internal reflections, appearing blank or nearly blank), enabling precise localization of shallow gas occurrence positions and extents.
3.2.3. Identification of Shallow Gas Distribution and Risk Level Classification
Using 3D seismic attribute analysis as the core technical approach, parameters such as amplitude, phase, and frequency are extracted. By enhancing the discontinuity between seismic traces, the boundaries of gas reservoirs, fault distributions, and special sedimentary bodies are effectively delineated. Combined with 3D seismic time-slice technology, the structural morphology and spatial distribution of amplitude anomalies are visually displayed. Integrating seismic attribute anomalies, ATZ zones identified by shallow profiling, pockmark micro-seepage landforms(Describe small, crater-like depressions on the seafloor formed by the seepage of gases or fluids from underlying sediments.) detected by AUV, and fault networks revealed by multi-source data, a comprehensive identification system for shallow gas spatial distribution is constructed. Geostatistical methods are introduced to quantify the enrichment intensity and spatial aggregation characteristics of shallow gas. Based on key factors such as shallow gas enrichment intensity, gas-controlling fault density, and sedimentary environment stability, a multi-indicator overlay risk assessment model for shallow gas hazards is established, enabling quantitative zoning of risk levels and providing a scientific basis for engineering disaster prevention.
4. Terrain Inversion Analysis
Based on the comprehensive interpretation of 3D seismic data, shipborne multibeam bathymetric data, and AUV topographic data from key areas, the inversion analysis of seabed topography in the study area reveals complex geological structural features and potential hazard risks. Through synergistic analysis of multi-source data, the distribution characteristics of steep slopes, protrusions, fractures, faults, and mass transport deposit (MTD) systems were identified (Table 2). The spatial distribution patterns of these topographic elements are visually presented in the topographic inversion spatial distribution map (as shown in Figure 3).

Table 2.
Distribution Characteristics Table of Various Terrain Features.
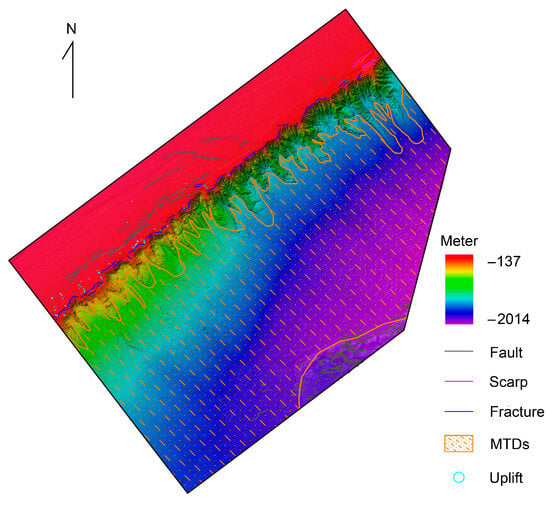
Figure 3.
Topographic inversion results of the study area.
4.1. Escarpments
Submarine escarpments refer to steep slope terrains parallel or similar in height to the slope orientation on the seafloor [32,33]. Within the study area, escarpments primarily develop at water depths of 200~250 m on the outer continental shelf, spatially concentrated in the eastern part of the study area, exhibiting an overall NE-SW trend. Morphological analysis indicates that these escarpments extend 8.5~9.0 km in length, commonly displaying step-like features with widths ranging from 400~900 m. They exhibit significant topographic relief, with maximum water depth spans reaching 15~40 m, corresponding to a maximum slope of approximately 8°. Seismic data reveal no obvious fault displacement in the underlying strata of the escarpments. However, potential sliding surface structures have been identified in some adjacent areas (Figure 4), suggesting potential landslide geological risks in this region.
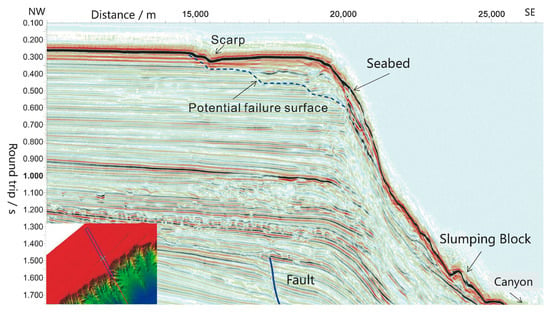
Figure 4.
Cross-sectional view of submarine escarpments from 3D seismic data.
4.2. Mounds
Mounds in the study area are primarily distributed in the western region, gradually disappearing toward the east. These mounds are concentrated in the upper edge zone of the shelf break at water depths of 200–250 m. Morphologically, they exhibit two main types of features: one consists of approximately circular, sporadically distributed mound-like bodies with diameters of 100–500 m and relative heights of 2–10 m; the other appears as linear distributions, extending in a direction roughly parallel to the shelf break, with lengths of 1.5–2.5 km, widths of 250–300 m, and heights of 10–15 m. AUV sub-bottom profiling data have identified shallowly buried hard strata beneath these mounds and confirmed that some mound surfaces are exposed areas of harder seabed. These mound zones serve as exit points for deep fluid conduit systems on the seabed, connecting to buried high-pressure plastic fluid sources.
The formation mechanism of seabed mounds is closely related to deep fluid migration, often developing near the slope breaks of progradational and slump-type continental slopes [34,35]. Three-dimensional seismic data reveal deep fluid migration channels beneath the mounds, providing direct evidence for their fluid origin (Figure 5). Additionally, the distribution areas of the mounds show a high spatial correlation with ancient buried landslide bodies near the shelf edge slope break, indicating that their formation is also controlled by historical landslide activities. The region’s high sedimentation rate causes the buried ancient landslide bodies to undergo differential settlement under regional tectonic activity and differential compaction(During sedimentation, the phenomenon where different degrees of compaction occur due to variations in sediment thickness or material composition), particularly around the landslide edges, forming weak zones in the overlying strata.
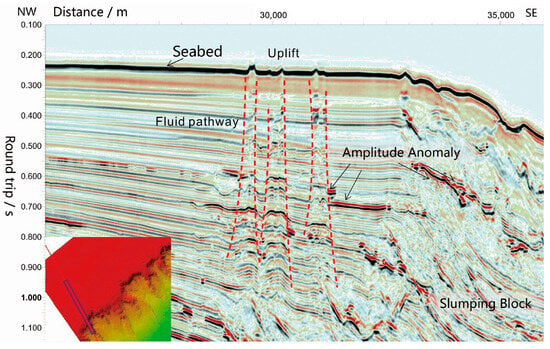
Figure 5.
Three-dimensional seismic profile of seabed mounds.
4.3. Fissures
In the vicinity of the shelf break zone, numerous curved submarine fissures have developed, characterized by distinct submarine scarps [36,37]. These fissures measure 2–6 km in length, 200–300 m in width, and span 20–40 m in water depth, with local maximum slopes reaching 26°. Based on analysis of stratigraphic profile data (Figure 6), such fissures are primarily distributed near the head of ancient landslide bodies and genetically belong to tensile fissures at landslide heads, formed by sediment under differential compaction. The presence of tensile fissures serves as an important indicator of potential slope instability; moreover, under continuous gravitational forces and external dynamic factors such as seismic loading, these fissures exhibit a tendency for further expansion.
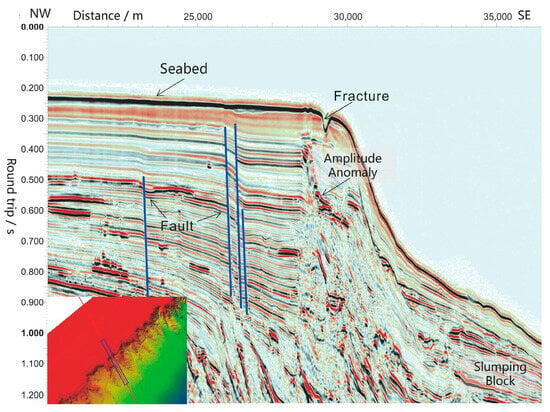
Figure 6.
Submarine fissure profile from 3D seismic data.
4.4. Faults
A significant number of normal faults have been identified along the continental shelf margin within the study area. Among them, one set strikes NE–SW, consistent with the orientation of the shelf break, and dips SE; another set, distributed in the eastern part of the study area, is arranged in an en echelon pattern with an approximate EW strike and overall eastward dip. Based on the top depth of the faults, they can be classified into four categories: seafloor-exposed, buried less than 100 m, buried between 100–200 m, and buried greater than 200 m. The faults in the study area belong to the Central Subbasin Fault Zone (CSFZ), a typical active fault zone in the northern South China Sea [38]. This fault zone is exposed on the seabed in the western part of the study area, forming discontinuous linear scarps with lengths of 3.5–5.5 km, widths of 200–300 m, maximum water depth spans of 10–25 m, and slopes reaching up to 9°, gradually transitioning to a concealed state eastward (Figure 7). Activity analysis indicates that some of the seabed-exposed faults remain active today. Such active faults in marine environments can trigger various natural hazards, including earthquakes, tsunamis, and volcanic activity [39,40,41]. Particularly in areas with steep seabed slopes, such as deep-water troughs and continental slope margins, direct displacement of active faults or triggered earthquakes can easily induce submarine landslides. Active faults pose significant threats to submarine pipeline routes, as surface ruptures, associated ground deformation, and differential settlement caused by them can severely damage engineering facilities crossing or adjacent to the faults [42,43].
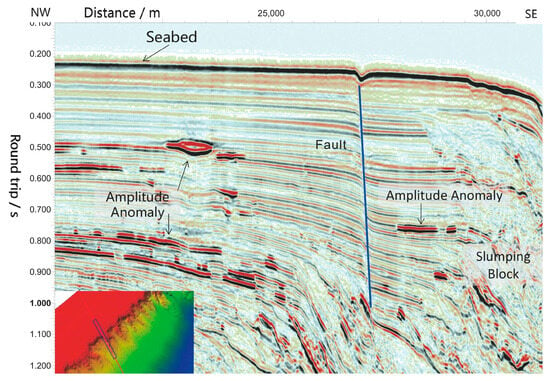
Figure 7.
Shallow fault profile from 3D seismic data.
In addition to the faults in the shelf area, a series of stratabound faults have developed in the deep-water region at depths of 1800–2000 m, often associated with the migration of plastic fluids. These faults primarily occur within the depth interval of 500–700 m below the seabed, with some extending up to 200 m below the seabed. They are characterized by relatively small scales, dense development along bedding planes, and overall control by a single stratigraphic unit (Figure 8). Their formation mechanism is typically related to gravitational instability within the strata, leading to lateral creep and extension under the compaction of overlying sediments [44].
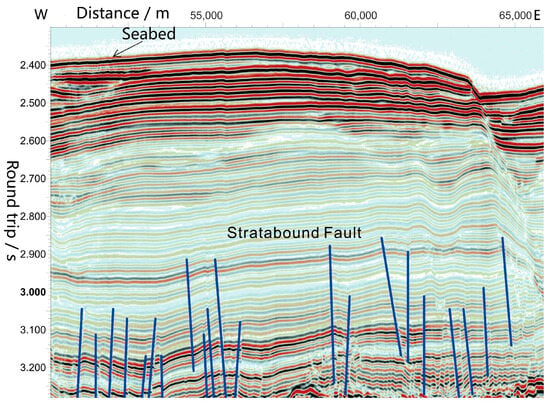
Figure 8.
Stratabound fault profile from 3D seismic data.
4.5. Mass Transport Deposits (MTDs)
Mass Transport Deposits (MTDs) are generally regarded as stratigraphic units formed through redeposition processes after initial sedimentation [45,46]. Given that large-scale MTDs primarily develop in deep-water environments, their formation processes are difficult to observe directly. Research on their formation mechanisms and developmental history often relies on post-event investigations, integrating acoustic and geological detection techniques, along with inferences from seabed morphology and sediment deformation theories. Overall, MTDs commonly exhibit weak amplitude, semi-transparent, and chaotic reflection characteristics on seismic profiles, while displaying strong amplitude responses on related seismic attribute slices. During their migration toward deep-water areas in the study region, the tensile forces acting on MTDs gradually weaken, while their leading edges continuously undergo thrust compression, forming wedge-shaped or hummocky toe structures. Compressional ridges develop in the upper strata and taper laterally. The edges of these hummocks show strong-amplitude, continuous reflections with clear boundaries, while their interiors predominantly feature weak-amplitude parallel reflections, chaotic reflections, or blank reflections. As shown in Figure 9, multiple phases of MTDs developed sequentially from bottom to top in the study area during historical periods. These appear as semi-transparent and chaotic reflections on seismic profiles, typically with well-defined basal shear surfaces. Thrust compressional structures are identifiable in the lower sections, while the tops often exhibit undulating reflections associated with compressional structures. Due to differences in developmental timing, later-stage MTDs frequently erode and modify earlier-formed units. AUV data reveal thin-layer MTDs on the seabed surface, as illustrated in Figure 10, with thicknesses of 2–5 m. Continuous sedimentary strata underlie MTDs in localized areas, while in other regions, these continuous strata are eroded by MTDs. Owing to variations in developmental timing, later-stage MTDs often erode and reshape earlier-formed units.
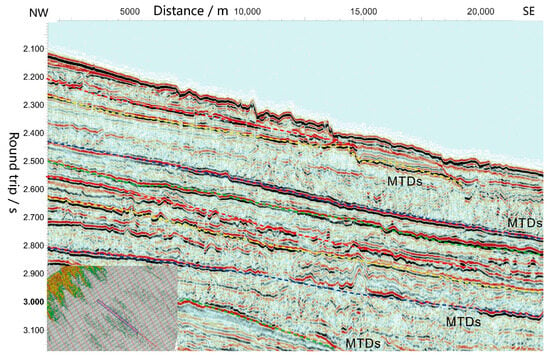
Figure 9.
Multi-phase MTDs on 3D seismic profiles.
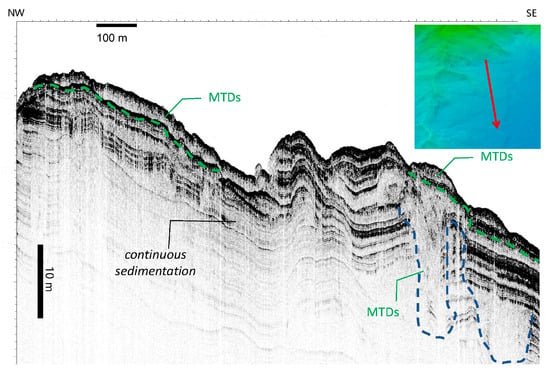
Figure 10.
MTDs on AUV sub-bottom profiler data.
5. Shallow Gas Risk Analysis
Based on 3D seismic attribute analysis, identification of acoustic transparent zones (ATZ) from shallow stratigraphic profiles (TOPAS PS18 & EdgeTech 2205), detection of pockmark microtopography via AUV side-scan sonar, and multi-source data fusion to construct fault networks, this study systematically characterizes the spatial enrichment patterns and risk levels of shallow gas within 0–500 m depth in the canyon area of the Qiongdongnan Basin. By employing geostatistical kriging interpolation to quantify enrichment intensity and integrating factors such as gas-controlling structure density, sedimentary environment stability, and seepage landform scale, a shallow gas risk assessment system was established for the study area. Five depth intervals below the seabed were delineated (Figure 11), revealing their enrichment patterns and spatial risk differentiation.As shown in Table 3, the key characteristics of different depth intervals are clearly compared.
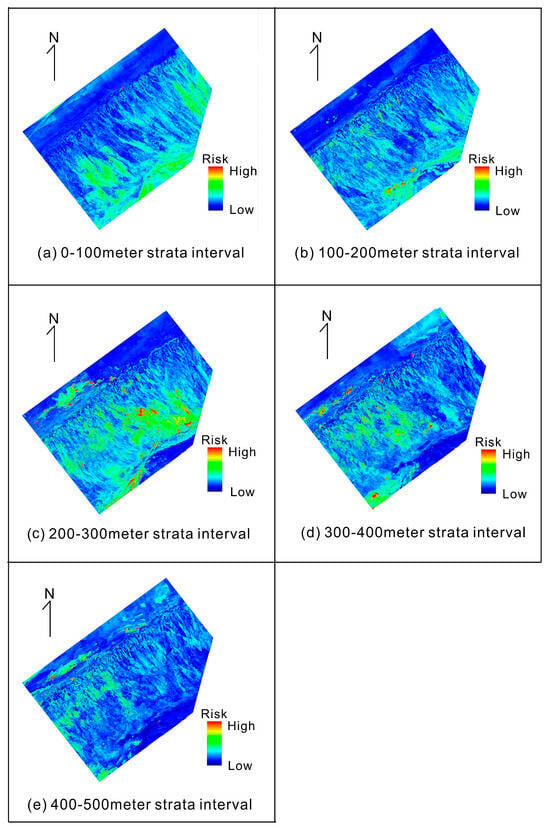
Figure 11.
Shallow Gas Risk Zonation Map.

Table 3.
Summary of Vertical Zonation Characteristics for Shallow Gas Risk in the Study Area.
5.1. Spatial Distribution Characteristics of Shallow Gas Risk by Depth Interval
5.1.1. 0–100 m Interval
The high-risk zones of shallow gas exhibit a “discrete spotty” distribution without forming continuous accumulation belts, sporadically concentrated in the central part of the slope break zone (Figure 11a). This distribution is primarily controlled by microtopographic features such as near-seabed steep scarps and fractures. At this depth, biogenic gas or early diagenetic gas mainly escapes vertically, constrained by the low compaction and weak sealing capacity of overlying strata, making large-scale accumulation difficult [47,48]. The risk level gradually transitions from medium-risk to low-risk zones along the main sediment supply direction, reflecting differential control by sediment supply rates and early depositional structures on initial gas sealing capacity. Low-risk zones dominate this interval with relatively good spatial continuity.
5.1.2. 100–200 m Interval
The extent of high-risk zones expands significantly, displaying “local enrichment” characteristics, primarily clustered in the southern deep-water canyon channel systems and mass transport deposit (MTDs) development areas (Figure 11b). Canyon channels provide pathways for lateral gas migration, while the complex lithologic structures, differential compaction, and sedimentary disturbances within MTDs promote deep gas release [49]. Low-risk areas still dominate in spatial proportion, though their continuity is fragmented—either dissected or surrounded by southern high-risk zones and erosional areas along landslide flanks.
5.1.3. 200–300 m Interval
As shown in Figure 11c, the high-risk zones reach their peak both in quantity and spatial continuity, forming a relatively continuous, nearly basin-wide high-risk belt in the central and southern regions. This belt’s spatial distribution closely aligns with the upward extension paths of deep-source gas faults and the main distribution areas of mass transport deposits (MTDs). The deep source rocks and pyrolytic gas supply are abundant, with the deep fault system serving as the primary vertical migration pathway [50]. The MTDs and channel-filling bodies exhibit excellent pore-fracture systems and differential compaction trap conditions [51]. Consequently, the tectonic-sedimentary coupling effect dominates large-scale gas accumulation and sealing. Low-risk zones are severely compressed, surviving only at the basin margins and localized tectonically sedimentarily stable areas.
5.1.4. 300–400 m Interval
The distribution pattern of shallow gas high-risk zones transitions from the concentrated, continuous distribution in the 200–300 m interval to a highly dispersed and widespread state, exhibiting coexisting patchy, banded, and stippled patterns (Figure 11d). This phenomenon results from well-developed gas chimney structures in this interval, densely interwoven fault networks, and widespread isolated small traps formed by intense differential compaction, leading to dispersed gas migration pathways. Low-risk zones in this interval display significant fragmentation characteristics, appearing as “islands” scattered across high positions at the basin margins and localized structural highs.
5.1.5. 400–500 m Interval
The number of high-risk zones sharply decreases, showing only a “sporadic” distribution pattern (Figure 11e). This is attributed to significantly enhanced formation homogenization, where intense compaction drastically reduces porosity and deteriorates permeability, thereby increasing gas migration resistance and making enrichment and sealing considerably more difficult. Consequently, the deep environment generally returns to a relatively stable state with low disturbance. Low-risk zones resume a continuous distribution pattern along the basin margins, disturbed only by sporadic high-risk patches formed by leakage at the termini of deep-seated faults or isolated turbidite sand body traps.
5.2. Vertical Distribution Patterns of Shallow Gas Hazards
The shallow gas hazards in the study area exhibit vertical zonation, fundamentally controlled by the depth-dependent evolution of the “gas source supply migration pathway” system. The shallow hazard zone (0–200 m) is dominated by microtopography and early sedimentation, with high-risk areas displaying discrete patchy distributions. The gas sources are primarily biogenic gas and early diagenetic gas, with migration modes dominated by vertical escape and short-range lateral migration. Microtopographic features like steep slopes are the key controlling factors, while faults have weaker influence. The mid-deep core hazard zone (200–400 m) is strongly controlled by tectonic-sedimentary coupling, with the 200–300 m interval reaching peak hazard intensity and continuity. Gas sources are diversified, with significant contributions from deep thermogenic gas, where deep fault systems serve as main vertical migration pathways. Internal heterogeneity within MTDs and channel sand bodies provides superior storage spaces, while differential compaction and tectonic stress synergistically enhance local sealing, forming the core disaster interval. The deep hazard attenuation zone (>400 m) sees suppressed gas enrichment due to strong compaction and formation homogenization, where sharply reduced porosity and permeability lead to drastically increased migration resistance. Only fault termini or isolated lithologic lenses maintain sporadic high-risk spots, with the overall system reverting to a stable state with low gas reservoir disturbance.
6. Discussion
6.1. Resolution Gradient Comparison of Terrain Inversion Technologies
In marine geological surveys, the precise characterization of seabed microtopography is crucial, with its accuracy directly controlled by the vertical and horizontal resolution of detection data. Due to significant differences in acquisition platforms, acoustic frequencies, and operational distances among 3D seismic exploration, shipborne multibeam bathymetric systems, and AUV terrain detection, there exists a gradient effect in their capabilities to depict water depth resolution and terrain details, thereby affecting the identification accuracy of microtopographic features [52,53]. As shown in Figure 12 and Table 4, noticeable discrepancies exist in water depth and slope values at the same location when surveyed by different detection methods. Therefore, improving the identification accuracy of seabed microtopography urgently requires the integration of multi-source detection data to overcome the gradient effect.
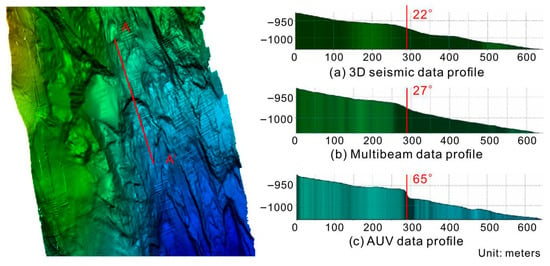
Figure 12.
Comparison Diagram of AA’ Section.

Table 4.
Comparison of Multiple Data Results for AA Section.
Although 3D seismic data can penetrate subsurface strata to reveal structural frameworks and the boundaries of large-scale mass transport deposits (MTDs), their horizontal resolution is also constrained by trace spacing, severely limiting their ability to depict microtopography on the seabed surface. Shipborne multibeam systems operate at higher frequencies, significantly enhancing vertical resolution. These systems can effectively identify topographic features such as submarine landslide scarps but remain insensitive to surface textures. The sampling density and signal-to-noise ratio for microtopography are further compromised by the shipborne platform’s speed limitations and altitude above the seabed, which are constrained by sea conditions. AUV-mounted near-bottom high-resolution multibeam/sidescan systems, by flying close to the seabed, enable detailed characterization of terrain and microtopography.
6.2. Shallow Gas Risk Discrimination Using Seismic Attributes
Three-dimensional digital seismic data can only identify shallow gas and reflection amplitudes that exceed the minimum detectable size threshold. Shallow gas layers or gas clusters below this threshold, as well as dispersed geological features, cannot be detected using 3D digital seismic data. To study the geological reflection anomalies associated with shallow gas, seismic workstation processing and interpretation software modules were employed. These modules extracted parameters such as the maximum negative amplitude, maximum positive amplitude, and root mean square (RMS) amplitude for each seismic trace, enabling amplitude analysis of the study area data. The amplitude extraction method used a background threshold approximately five times the average amplitude of the surrounding area. Amplitudes exceeding this threshold were evaluated as potential anomalies caused by shallow gas. The spatial extent and distribution of amplitude anomalies were mapped using the seismic workstation and manually verified.
In 3D seismic data volumes, the seafloor produces a high-impedance acoustic response, manifesting as a positive-polarity, positive-amplitude peak reflection interface. Potential shallow gas accumulation zones within the strata generate low-impedance acoustic responses, appearing as strong negative-polarity amplitude anomalies. The identification of shallow gas integrates one or more seismic wave attributes, such as strong amplitude, abrupt phase changes, polarity reversals, velocity reduction, acoustic diffraction, attenuation, and masking of underlying stratum reflections. However, not all amplitude anomalies are related to shallow gas. Gas hydrates, shallow water, conventional lithological variations, organic deposits, masking of stratum reflections, localized lithological changes, and tuning effects from adjacent target reflections can also produce strong amplitude anomalies. Therefore, only reflection anomalies exhibiting strong amplitude, low impedance, and at least several of the aforementioned characteristics are interpreted as potential shallow gas accumulation zones.
7. Conclusions
This study focuses on the key issues of precise characterization of complex submarine topography and risk assessment of shallow gas hazards in the canyon area of the Qiongdongnan Basin, conducting systematic research based on multi-source data fusion technology. The findings are summarized as follows:
- (1)
- By systematically integrating 3D seismic data, shipborne multibeam bathymetric data, and AUV high-precision topographic data, this study constructed a multi-source data fusion inversion model, significantly improving the resolution and accuracy of the submarine topographic model. This approach overcomes the limitations of traditional single-data-source characterization of complex submarine topography, achieving the first systematic revelation of the spatial distribution characteristics of microtopographic features (such as steep slopes, protrusions, fissures, faults, and MTDs) in the canyon area of the Qiongdongnan Basin.
- (2)
- The research findings clearly delineate the distribution patterns of gravity-flow-derived landforms such as mass transport deposits (MTDs), indicating active deep-water sedimentary dynamics and tectonic activity in this region. The precise identification of such geomorphic units holds significant scientific value for understanding the geological evolution, sediment transport mechanisms, and seabed stability assessment in the deep-water area of the northern South China Sea continental margin.
- (3)
- By employing seismic attribute analysis and geostatistical methods, this study achieved spatial quantification and risk classification of shallow gas enrichment intensity. The research reveals that shallow gas distribution exhibits notable vertical zonation and spatial heterogeneity, with enrichment zones being jointly controlled by deep gas source supply and dominant migration pathways (such as faults and fracture systems), reflecting the dynamic geological processes of gas generation, migration, and accumulation.
- (4)
- The research findings of this paper indicate that the risk pattern of shallow gas is not randomly distributed but is jointly constrained by deep hydrocarbon systems and shallow geological structures. Faults and fracture systems, serving as preferential migration pathways for fluids, along with the connectivity to deep gas sources, collectively determine the dispersion and accumulation behavior of shallow gas. This understanding holds theoretical significance for studying fluid escape mechanisms in deepwater regions.
- (5)
- The research outcomes of this paper can support platform site selection, optimization of submarine pipeline routes, and geological hazard prevention and control, providing critical geological safety support for deepwater energy development in the South China Sea. This has significant practical implications for ensuring the safety of deepwater energy development in the region.
Author Contributions
Conceptualization, H.T. and Y.L.; methodology, B.H.; data analysis, H.T. and Q.J.; writing—original draft preparation, H.T. and H.Z.; writing—review and editing, X.L.; project administration, B.H. and X.L.; funding acquisition, X.L. All authors have read and agreed to the published version of the manuscript.
Funding
This work was supported by the National Key Research and Development Program of China (No. 2024YFF0506803), the Shandong Provincial Natural Science Foundation (ZR2025QA02), the Fundamental Research Funds for the Central Universities (202441003), and the Shandong Province National-Level Leading Talent Supporting Project (2022GJJLJRC-15).
Data Availability Statement
The data are available on request due to restrictions from the data provider.
Acknowledgments
The authors extend their sincere thanks to the editors and reviewers for their careful reading and fruitful suggestions.
Conflicts of Interest
Author Bigui Huang and Hanqiong Zuo are employed by the company CNOOC Research Institute Co. Ltd. The remaining authors declare that the research was conducted in the absence of any commercial or financial relationships that could be construed as a potential con-flict of interest.
References
- Gong, C.; Wang, D.; Zhang, Q.; Yang, H.; Li, Z.; Zhao, Z.; Guo, S. Characteristics of coal-measure source rock and gas accumulation belts in marine-continental transitional facies fault basins: A case study of the Oligocene deposits in the Qiongdongnan Basin located in the northern region of the South China Sea. Energy Explor. Exploit. 2019, 37, 1752–1778. [Google Scholar] [CrossRef]
- Zhang, W.; Liang, J.; Yang, X.; Su, P.; Wan, Z. The formation mechanism of mud diapirs and gas chimneys and their relationship with natural gas hydrates: Insights from the deep-water area of Qiongdongnan Basin, northern South China Sea. Int. Geol. Rev. 2020, 62, 789–810. [Google Scholar] [CrossRef]
- Xu, Y.; Li, X.; Fan, C.; Tan, J.; Liu, K.; Liu, Y.; Wu, J. The axial channel provenance system and natural gas accumulation of the Upper Miocene Huangliu Formation in Qiongdongnan Basin, South China Sea. Pet. Explor. Dev. 2016, 43, 570–578. [Google Scholar] [CrossRef]
- Liu, J.; Sun, Z.; Wang, Z.; Sun, Z.; Zhao, Z.; Wang, Z.; Zhang, J. Tectonic differences between eastern and western sub-basins of the Qiongdongnan Basin and their dynamics. Mar. Geophys. Res. 2015, 36, 61–79. [Google Scholar] [CrossRef]
- He, B.; Zheng, M. Structural characteristics and formation dynamics: A review of the main sedimentary basins in the continent of China. Acta Geogr. Sin. 2016, 90, 1156–1194. [Google Scholar]
- Zhao, Z.; Sun, Z.; Sun, L.; Wang, Z.; Sun, Z. Cenozoic tectonic subsidence in the Qiongdongnan basin, northern South China Sea. Basin Res. 2018, 30, 269–288. [Google Scholar] [CrossRef]
- Liu, X.; Jeng, D.-S.; Moon, V.; Stoesser, T.; Zhang, L. Preface to the special issue on “Marine Engineering Geology in Developing Ocean Resources and Energy”. Eng. Geol. 2025, 354, 108206. [Google Scholar] [CrossRef]
- He, D.; Jia, C.; Zhao, W.; Xu, F.; Luo, X.; Liu, W.; Zheng, N. Research progress and key issues of ultra-deep oil and gas exploration in China. Pet. Explor. Dev. 2023, 50, 1333–1344. [Google Scholar] [CrossRef]
- Wu, K.; Xie, X.; Pei, J.; Ren, J.; You, L.; Quan, Y. Deep architecture of hyperextended marginal basin and implications for hydrocarbon exploration: A case study of Qiongdongnan Basin. Oil Gas Geol. 2023, 44, 651–661. [Google Scholar]
- Zhang, J.; Yan, D.; Pei, J.; Luo, W.; Liu, E.; Song, P.; Lin, X. Shallow gas accumulation mechanism in the Qiongdongnan Basin, South China Sea. Mar. Pet. Geol. 2025, 177, 107389. [Google Scholar] [CrossRef]
- Yang, G.; Yin, H.; Gan, J.; Wang, W.; Zhu, J.; Jia, D.; Xu, W. Structural segmentation in the Qiongdongnan Basin, South China Sea: Insights from analogue models and implications for hydrocarbon exploration. AAPG Bull. 2024, 108, 907–941. [Google Scholar] [CrossRef]
- Qiu, N.; Wang, Z.; Xie, H.; Sun, Z.; Wang, Z.; Sun, Z.; Zhou, D. Geophysical investigations of crust-scale structural model of the Qiongdongnan Basin, Northern South China Sea. Mar. Geophys. Res. 2013, 34, 259–279. [Google Scholar] [CrossRef]
- Liu, K.; Cheng, P.; Tian, H.; Song, P.; Hu, W. Development model of shallow lithologic traps and natural gas accumulation mechanisms in marine deep-water areas: A case study in the Qiongdongnan basin, south China sea. Mar. Pet. Geol. 2023, 151, 106211. [Google Scholar] [CrossRef]
- Chen, M.; Takahashi, S.; Takamasu, K. Multi-beam angle sensor for flatness measurement of mirror using circumferential scan technology. Int. J. Precis. Eng. Manuf. 2016, 17, 1093–1099. [Google Scholar] [CrossRef]
- Li, H.; Li, C.; Gao, H.; Wu, S.; Fang, G. Study of moving targets tracking methods for a multi-beam tracking system in terahertz band. IEEE Sens. J. 2021, 21, 6520–6529. [Google Scholar] [CrossRef]
- Misiuk, B.; Brown, C.J. Multiple imputation of multibeam angular response data for high resolution full coverage seabed mapping. Mar. Geophys. Res. 2022, 43, 7. [Google Scholar] [CrossRef]
- Li, Z.; Peng, Z.; Zhang, Z.; Chu, Y.; Xu, C.; Yao, S.; Ma, J. Exploring modern bathymetry: A comprehensive review of data acquisition devices, model accuracy, and interpolation techniques for enhanced underwater mapping. Front. Mar. Sci. 2023, 10, 1178845. [Google Scholar] [CrossRef]
- Fan, D.; Li, S.; Meng, S.; Lin, Y.; Xing, Z.; Zhang, C.; Qu, Z. Applying iterative method to solving high-order terms of seafloor topography. Mar. Geod. 2020, 43, 63–85. [Google Scholar] [CrossRef]
- Ge, B.; Guo, J.; Kong, Q.; Zhu, C.; Huang, L.; Sun, H.; Liu, X. Seafloor topography inversion from multi-source marine gravity data using multi-channel convolutional neural network. Eng. Appl. Artif. Intell. 2025, 139, 109567. [Google Scholar] [CrossRef]
- Orange, D.L.; Teas, P.A.; Decker, J.; Gharib, J. Use of multibeam bathymetry and backscatter to improve seabed geochemical surveys—Part 1: Historical review, technical description, and best practices. Interpretation 2023, 11, T215–T247. [Google Scholar] [CrossRef]
- Liu, Y.; Li, S.; Zou, Z.; Sun, Y. Techniques and methods for seafloor topography mapping: Past, present, and future. Intell. Mar. Technol. Syst. 2025, 3, 1–15. [Google Scholar] [CrossRef]
- Xu, G.; Hefner, B.T.; Jackson, D.R.; Ivakin, A.N.; Wendelboe, G. A Physics-Based Inversion of Multibeam Sonar Data for Seafloor Characterization. IEEE J. Ocean. Eng. 2024, in press. [Google Scholar] [CrossRef]
- Hu, B.; Wang, L.; Yan, W.; Liu, S.; Cai, D.; Zhang, G.; Sun, B. The tectonic evolution of the Qiongdongnan Basin in the northern margin of the South China Sea. J. Asian Earth Sci. 2013, 77, 163–182. [Google Scholar] [CrossRef]
- Song, Y.; Zhao, C.Y.; Zhang, G.C.; Song, H.B.; Shan, J.N.; Chen, L. Tectonic-Thermal Modeling for Qiongdongnan Basin and Pearl River Mouth Basin in the Northern South China Sea. Chin. J. Geophys. 2011, 54, 942–955. [Google Scholar]
- Meng, M.; Liang, J.; Kuang, Z.; Ren, J.; He, Y.; Deng, W.; Gong, Y. Distribution characteristics of quaternary channel systems and their controlling factors in the Qiongdongnan Basin, South China Sea. Front. Earth Sci. 2022, 10, 902517. [Google Scholar] [CrossRef]
- Gong, C.; Wang, Y.; Zhu, W.; Li, W.; Xu, Q.; Zhang, J. The Central Submarine Canyon in the Qiongdongnan Basin, northwestern South China Sea: Architecture, sequence stratigraphy, and depositional processes. Mar. Pet. Geol. 2011, 28, 1690–1702. [Google Scholar] [CrossRef]
- Liu, K.; Cheng, P.; Fan, C.W.; Song, P.; Huang, Q.T. Evolutions of sedimentary facies and palaeoenvironment and their controls on the development of source rocks in continental margin basins: A case study from the Qiongdongnan Basin, South China Sea. Pet. Sci. 2023, 20, 2648–2663. [Google Scholar] [CrossRef]
- Xu, C.; You, Y. North slope transition zone of Songnan-Baodao sag in Qiongdongnan Basin and its control on medium and large gas fields, South China Sea. Pet. Explor. Dev. 2022, 49, 1229–1242. [Google Scholar] [CrossRef]
- Liu, L.; Liao, Z.; Chen, C.; Chen, J.; Niu, J.; Jia, Y.; Liu, T. A seabed real-time sensing system for in-situ long-term multi-parameter observation applications. Sensors 2019, 19, 1255. [Google Scholar] [CrossRef]
- Hill, D.; Combee, C.; Bacon, J. Over/under acquisition and data processing: The next quantum leap in seismic technology? First Break 2006, 24, 81–92. [Google Scholar] [CrossRef]
- Advocate, D.M.; Hood, K.C. An empirical time-depth model for calculating water depth, northwest Gulf of Mexico. Geo-Mar. Lett. 1993, 13, 207–211. [Google Scholar] [CrossRef]
- Dorokhov, D.V.; Lugovoy, N.N.; Dorokhova, E.V.; Budanov, L.M.; Dudkov, I.Y. Morphology and origin of the palaeo cliff area in the Sambia Peninsula nearshore (SE Baltic Sea). Quat. Int. 2022, 630, 17–33. [Google Scholar] [CrossRef]
- Khan, H.A. Numerical Analysis of Erosive Sea Cliff-A Case Study. Ph.D. Thesis, Politecnico di Torino, Torino, Italy, 2025. [Google Scholar]
- Ercilla, G.; Vázquez, J.T.; Alonso, B.; Bárcenas, P.; Casas, D.; d’Acremont, E.; Gorini, C. Seafloor morphology and processes in the Alboran Sea. In Alboran Sea-Ecosystems and Marine Resources; Springer International Publishing: Cham, Switzerland, 2021; pp. 157–205. [Google Scholar]
- Grobbelaar, M. A Comparison Between Diamictites at the Witteberg-Dwyka Contact in Southern South Africa. Master’s Thesis, Stellenbosch University, Stellenbosch, South Africa, 2015. [Google Scholar]
- Nomikou, P.; Papanikolaou, D.; Dietrich, V.J. Geodynamics and volcanism in the Kos-Yali-Nisyros volcanic field. In Nisyros Volcano: The Kos-Yali-Nisyros Volcanic Field; Dietrich, V.J., Lagios, E., Eds.; Springer: Cham, Switzerland, 2018; pp. 13–55. [Google Scholar]
- Walsh, P.T.; Atkinson, K.; Boulter, M.C.; Shakesby, R.A. The Oligocene and Miocene outliers of west Cornwall and their bearing on the geomorphological evolution of Oldland Britain. Philos. Trans. R. Soc. Lond. Ser. A 1987, 322, 211–245. [Google Scholar] [CrossRef]
- Zeng, F.; Wang, D.; Li, Z.; Wang, W.; Dai, X.; Sun, Y.; Zhang, P. The discovery of an active fault in the Qiongdongnan Basin of the northern South China Sea. Mar. Pet. Geol. 2024, 163, 106777. [Google Scholar] [CrossRef]
- Harbitz, C.B.; Løvholt, F.; Bungum, H. Submarine landslide tsunamis: How extreme and how likely? Nat. Hazards 2014, 72, 1341–1374. [Google Scholar] [CrossRef]
- Haridhi, H.A.; Huang, B.S.; Wen, K.L.; Mirza, A.; Rizal, S.; Purnawan, S.; Phung, V.B. Tsunami scenario triggered by a submarine landslide offshore of northern Sumatra Island and its hazard assessment. Nat. Hazards Earth Syst. Sci. 2023, 23, 507–523. [Google Scholar] [CrossRef]
- Gogou, M.; Mavroulis, S.; Evelpidou, N.; Lekkas, E. Earthquakes and Tsunamis: Natural hazards over the Aegean Archipelago. Tectonophysics 2022, 825, 229502. [Google Scholar]
- Ko, Y.Y.; Tsai, C.C.; Hwang, J.H.; Hwang, Y.W.; Ge, L.; Chu, M.C. Failure of engineering structures and associated geotechnical problems during the 2022 ML 6.8 Chihshang earthquake, Taiwan. Nat. Hazards 2023, 118, 55–94. [Google Scholar] [CrossRef]
- Yan, G.; Gao, B.; Shen, Y.; Zheng, Q.; Fan, K.; Huang, H. Shaking table test on seismic performances of newly designed joints for mountain tunnels crossing faults. Adv. Struct. Eng. 2020, 23, 248–262. [Google Scholar] [CrossRef]
- Liu, S.; Yang, K.; Zhang, T.; Tang, C. Rib spalling 3D model for soft coal seam faces with large mining height in protective seam mining: Theoretical and numerical analyses. Geofluids 2020, 2020, 8828844. [Google Scholar] [CrossRef]
- Racey, A.; Ridd, M.F. Petroleum geology of the Rakhine region, Myanmar. In Geology of Myanmar; The Geological Society of London, Ed.; The Geological Society of London: London, UK, 2015; Volume 45, pp. 93–108. [Google Scholar]
- Cukur, D.; Kim, S.P.; Kong, G.S.; Bahk, J.J.; Horozal, S.; Um, I.K.; Kim, J.K. Geophysical evidence and inferred triggering factors of submarine landslides on the western continental margin of the Ulleung Basin, East Sea. Geo-Mar. Lett. 2016, 36, 425–444. [Google Scholar] [CrossRef]
- Lin, C.M.; Li, Y.L.; Zhuo, H.C.; Shurr, G.W.; Ridgley, J.L.; Zhang, Z.P.; Xue, T. Features and sealing mechanism of shallow biogenic gas in incised valley fills (the Qiantang River, eastern China): A case study. Mar. Pet. Geol. 2010, 27, 909–922. [Google Scholar] [CrossRef]
- Cartwright, J.; Santamarina, C. Seismic characteristics of fluid escape pipes in sedimentary basins: Implications for pipe genesis. Mar. Pet. Geol. 2015, 65, 126–140. [Google Scholar] [CrossRef]
- Liu, L.; Chu, F.; Wu, N.; Zhang, L.; Li, X.; Li, H.; Wang, X. Gas sources, migration, and accumulation systems: The shallow subsurface and near-seafloor gas hydrate deposits. Energies 2022, 15, 6921. [Google Scholar] [CrossRef]
- Ren, Z.; Cui, J.; Qi, K.; Yang, G.; Chen, Z.; Yang, P.; Wang, K. Control effects of temperature and thermal evolution history of deep and ultra-deep layers on hydrocarbon phase state and hydrocarbon generation history. Nat. Gas Ind. B 2020, 7, 453–461. [Google Scholar] [CrossRef]
- Li, W.; Alves, T.M.; Wu, S.; Völker, D.; Zhao, F.; Mi, L.; Kopf, A. Recurrent slope failure and submarine channel incision as key factors controlling reservoir potential in the South China Sea (Qiongdongnan Basin, South Hainan Island). Mar. Pet. Geol. 2015, 64, 17–30. [Google Scholar] [CrossRef]
- Correa, T.B.; Eberli, G.P.; Grasmueck, M.; Reed, J.K.; Correa, A.M. Genesis and morphology of cold-water coral ridges in a unidirectional current regime. Mar. Geol. 2012, 326, 14–27. [Google Scholar] [CrossRef]
- Agarwala, N. Using robotics to achieve ocean sustainability during the exploration phase of deep seabed mining. Mar. Technol. Soc. J. 2023, 57, 130–150. [Google Scholar] [CrossRef]
Disclaimer/Publisher’s Note: The statements, opinions and data contained in all publications are solely those of the individual author(s) and contributor(s) and not of MDPI and/or the editor(s). MDPI and/or the editor(s) disclaim responsibility for any injury to people or property resulting from any ideas, methods, instructions or products referred to in the content. |
© 2025 by the authors. Licensee MDPI, Basel, Switzerland. This article is an open access article distributed under the terms and conditions of the Creative Commons Attribution (CC BY) license (https://creativecommons.org/licenses/by/4.0/).