Article

A Numerical Study on the Seakeeping Performance and Ride Comfort of a Small MonoHull Vessel With and Without Hydrofoil in Regular Head Seas

Korea Marine Equipment Research Institute, Busan 49111, Republic of Korea
*
Author to whom correspondence should be addressed.
J. Mar. Sci. Eng. 2025, 13(10), 1895; https://doi.org/10.3390/jmse13101895
Submission received: 29 August 2025 / Revised: 28 September 2025 / Accepted: 29 September 2025 / Published: 2 October 2025
(This article belongs to the Section Ocean Engineering)

Abstract

This study numerically investigates the effect of hydrofoil installation on the motion responses and ride comfort of a 20 m monohull vessel operating at 10 knots in regular waves. Linear seakeeping analysis (Maxsurf Motions) and nonlinear computational fluid dynamics (CFD) simulations (STAR-CCM+) are performed to compute response-amplitude operators (RAOs); for the bare hull, the two methods agree within 5%, confirming methodological reliability. The CFD results show that hydrofoils reduce heave and pitch amplitudes by approximately 16% on average. Motion Sickness Incidence (MSI) analysis indicates negligible seasickness under Gentle Breeze conditions, even during prolonged exposure; under Moderate conditions, no seasickness is predicted within 30 min across all encounter frequencies. Although linear analysis cannot directly estimate MSI for hydrofoil-fitted cases, the observed reductions in RAOs imply improved ride comfort. Overall, these findings demonstrate that hydrofoils can enhance motion stability and passenger comfort in small, low-speed vessels, providing quantitative evidence to support design applications.

1. Introduction

1.1. Background and Motivation

With the growing demand for climate-change mitigation and energy transition in the maritime sector, there is increasing interest in ship designs that concurrently deliver fuel efficiency and reduced environmental impact across ship design and operations. Small vessels such as fishing boats, coastal ferries, and recreational craft are widely employed, yet they remain vulnerable to wave conditions, with comparatively higher risks of passenger fatigue and motion-induced seasickness. To address these issues, hydrofoils have garnered renewed attention as structural appendages capable of improving low-speed performance and attenuating wave-induced motions.
A hydrofoil is mounted beneath the hull; as the vessel advances, it generates lift that partially unloads the hull, reduces wetted surface area, lowers resistance, and enhances seakeeping stability. Although hydrofoils have been extensively applied to high-speed craft and unmanned platforms with demonstrated effectiveness, their use on small monohull vessels operating at low speeds (≤14 knots) remains limited, and systematic quantitative analyses of their effects on wave-induced motion responses are scarce. Moreover, conventional linear seakeeping tools commonly used at the early design stage cannot adequately account for the hydrodynamic influence of submerged appendages such as hydrofoils and inherently fail to capture the nonlinear free-surface–structure interactions they induce. Accordingly, the use of Navier–Stokes-based computational fluid dynamics (CFD), which can resolve complex free-surface–structure interactions, is indispensable.
Against this background, the present study numerically evaluates, via direct comparison, the wave-induced motion responses of a small monohull vessel with and without hydrofoils to assess ride-comfort implications and the design feasibility of hydrofoil application. By combining linear analysis (Maxsurf Motions V8i, [1]) with nonlinear CFD (STAR-CCM+ Ver. 19.06, [2]), the study establishes methodological reliability and links quantitative response-amplitude operators (RAOs) to passenger Motion Sickness Incidence (MSI), thereby providing practical, design-oriented insights.
In summary, this paper presents (i) verification of linear seakeeping analysis against CFD for the bare-hull condition, (ii) comparative assessment of motion responses with and without hydrofoils, and (iii) evaluation of ride comfort through MSI analysis. These findings contribute to clarifying the feasibility and engineering implications of applying hydrofoils to small low-speed monohull vessels.

1.2. Research Gap and Novelty

Research on improving ship performance using hydrofoils has been pursued for several decades, primarily targeting high-speed passenger ships, fast ferries, and military surface craft, with emphasis on reducing frictional resistance, stability during foil-borne operation, and hydrodynamic performance underway.
At sufficiently high speeds, hydrofoils lift the hull above the free surface and drastically reduce frictional resistance; consequently, numerous numerical and experimental studies have examined lift characteristics as a function of flow velocity, variations in lift-to-drag ratio with foil geometry, and dynamic behavior in the vicinity of resonance.
Building on this background, recent studies on passenger comfort for high-speed craft have focused on quantifying motion- and acceleration-reduction using ride-control systems (RCS) within standardized frameworks (e.g., ISO standard) and on extending the analysis to human-factor models such as the SVH-conflict (e.g., a model explaining motion sickness as a conflict between sensed and expected vertical/horizontal accelerations). Representative studies are as follows: Lau et al. [3] analyzed sea-trial data of a wave-piercing catamaran (HSV-2 Swift, Incat 061) and reported that, under bow-quartering seas, an active RCS consisting of a T-foil and stern tabs reduced MSI by approximately 21%, with the T-foil contributing more than stern tabs alone. Lau et al. [4] proposed and validated the Forcing Function Method (FFM) as an efficient CFD implementation approach for RCS, demonstrating predictive performance consistent with model tests in regular waves, including a reduction of up to 50% in peak pitch RAO. Javanmard et al. [5] conducted RCS experiments on a wave-piercing catamaran in irregular seas and reported a reduction of more than 40% in peak pitch responses, thereby quantifying comfort improvements achieved by feedback-controlled RCS.
Complementing these RCS-focused investigations, foundational hydrodynamic studies have also quantified reductions in delivered power and motions due to hydrofoils on conventional hulls. Bowker et al. [6] conducted self-propelled model tests of a container ship fitted with a bow hydrofoil and reported an approximately 50% reduction in delivered power in regular waves, together with reductions in motions in irregular waves. In addition, Sun et al. [7] demonstrated via model tests that a bow-mounted T-foil effectively reduces vertical motions (heave and pitch) at high Froude numbers (Fr ≈ 0.5–1) and elucidated the mechanical role of RCS components in providing lift forces and restoring moments in response to wave excitations.
Beyond high-speed craft and active RCS implementations, numerous CFD studies have investigated hydrofoil-assisted performance. Moreira et al. [8] analyzed resistance and lift efficiency for a dual flapping-foil system, whereas Li et al. [9] found that a bow hydrofoil reduces wave-induced motions and improves propulsive efficiency. Wang et al. [10] evaluated the energy-harvesting performance of a pitching foil, and Yasukawa et al. [11] reported improved motion performance for a catamaran fitted with a biomimetic hinged hydrofoil.
The influence of foil placement on motion-response characteristics has also been clarified: Xu et al. [12] experimentally confirmed that active flapping foils contribute to stabilization and thrust enhancement in deep-water head seas, while Zhang et al. [13] showed that long-arm bow and stern foils can reduce pitch motions. Based on numerical simulations of the DTMB 5415 hull, Mei et al. [14] demonstrated that a hinged foil can achieve higher propulsive efficiency than a fixed foil depending on pitching stiffness.
More recently, attention has shifted toward low-speed hull forms and practical applicability. Kuang et al. [15] conducted time-domain CFD simulations for the S175 container-ship model and showed that oscillating hydrofoils can reduce pitch and heave responses by up to 29% and 20%, respectively. Niklas et al. [16], using CFD and towing-tank experiments with a retractable bow hydrofoil retrofitted to aging ships, reported reductions of 33% in heave, 28% in pitch, and 25% in added resistance in waves under λ/LWL = 1.2; they also proposed operational on/off criteria across sea states, enhancing practical applicability. Fitriadhy et al. [17] numerically quantified motion-reduction as a function of stern-foil angle and Froude number; heave was minimized at a stern-foil angle of 7.5°, with a trade-off observed in pitch. These results collectively link hydrofoil-induced motion reductions to potential gains in passenger ride comfort.
In line with these developments, the evaluation criteria and procedures have been organized around the frequency-weighted r.m.s. acceleration and the two-hour exposure-based MSI defined in ISO 2631-1 [18]. The IMO 2000 HSC Code [19] further provides an operational and safety framework specialized for high-speed craft. Karimkhani et al. [20] (2025) reviewed active and passive control surfaces for high-speed planing boats and examined MSI as a key passenger-comfort indicator, showing its close correlation with heave and pitch accelerations. They also analyzed exposure differences between passengers on deck and those near the center of gravity, explaining location-dependent sensitivity, and reported that control surfaces such as trim tabs, interceptors, T-foils, and fin stabilizers contribute to MSI reduction and enhanced passenger comfort. Finally, Khalid et al. [21] proposed the SVH-conflict (subjective vertical–horizontal conflict) model and validated it through 68 field trials on 10 vessels. The results demonstrated that, in addition to vertical accelerations, multiaxial accelerations, including horizontal components, play a significant role in explaining motion-sickness variability, thereby supporting the need to consider horizontal accelerations when assessing passenger comfort for high-speed craft.
Collectively, these studies—which estimate MSI from strip theory-based RAOs and vertical accelerations—support the validity of predicting motion sickness via linear analysis, thereby motivating the Maxsurf-based approach adopted in the present study.
Previous studies have largely focused on the lift characteristics of hydrofoils, resistance reduction during foil-borne operation, and maintaining stability at high speeds. However, as environmental regulations tighten and the demand for fuel efficiency grows, there is increasing interest in applying hydrofoils to small monohull vessels operating at relatively low speeds (≈10 knots). Despite this shift, integrated analyses that link wave-induced hull motion responses to passenger ride comfort remain scarce. Moreover, much of the literature emphasizes CFD modeling of hull–foil configurations, with limited systematic cross-verification against linear seakeeping tools commonly used in early-stage design (e.g., Maxsurf Motions). In particular, studies that quantify hydrofoil effects on wave-induced RAOs via CFD and directly compare them with linear-analysis results are rare.
Accordingly, the present study distinguishes itself from previous research in the following aspects, aiming to quantitatively assess the practical applicability of hydrofoils and their effect on improving ride comfort:
  • Cross-compare heave and pitch RAOs from linear seakeeping (Maxsurf Motions) and nonlinear CFD to verify consistency.
  • Quantify hydrofoil effects by comparing heave and pitch RAOs of the bare hull and the hydrofoil-fitted hull.
  • Derive vertical-acceleration frequency responses at passenger locations under operating conditions and exposure durations for MSI assessment.
This multi-layered approach has both academic and practical significance, as it provides a basis for assessing the applicability of hydrofoils at the early design stage, establishing criteria for selecting analysis tools, and offering engineering guidelines for ensuring passenger ride comfort.

1.3. Research Objective

The primary objective of this study is to numerically evaluate how hydrofoil installation affects wave-induced motions and ride comfort of a small monohull vessel. For this purpose, under identical hull geometry and operating conditions, the pitch and heave motion responses of the vessel are quantitatively compared between the bare-hull and hydrofoil-fitted conditions, and based on these results, RAOs and MSI are evaluated. Specifically, for the condition without hydrofoils, RAOs and MSI are calculated using the conventional linear seakeeping analysis method with Maxsurf Motions, and CFD simulations with STAR-CCM+ are performed under the same conditions to ensure reliability of the analysis. Subsequently, since direct analysis with Maxsurf is not feasible for the hydrofoil-fitted condition, nonlinear CFD simulations are conducted to compute the ship motions in waves, and RAOs are derived through post-processing, enabling a comparative evaluation of the effects of hydrofoil installation.

2. Numerical Methodology

2.1. Vessel Description and Hydrofoil Configuration

The subject vessel for the numerical analysis in this study is a small monohull ship with a design operating speed of approximately 10 knots, assuming typical application conditions for coastal leisure activities. The vessel has a relatively simple and stable geometry, with an overall length of approximately 20.0 m, a beam of about 5.0 m, and a draft of 1.13 m. These principal dimensions were used as reference geometry for linear analysis and CFD mesh generation. As shown in Figure 1, the hull form was designed with a relatively gentle bow and slender stern shape to account for low-speed operation. For ensuring reliability in motion analysis, the hull geometry was defined in a three-dimensional CAD model and subsequently converted into the formats required by each analysis tool.
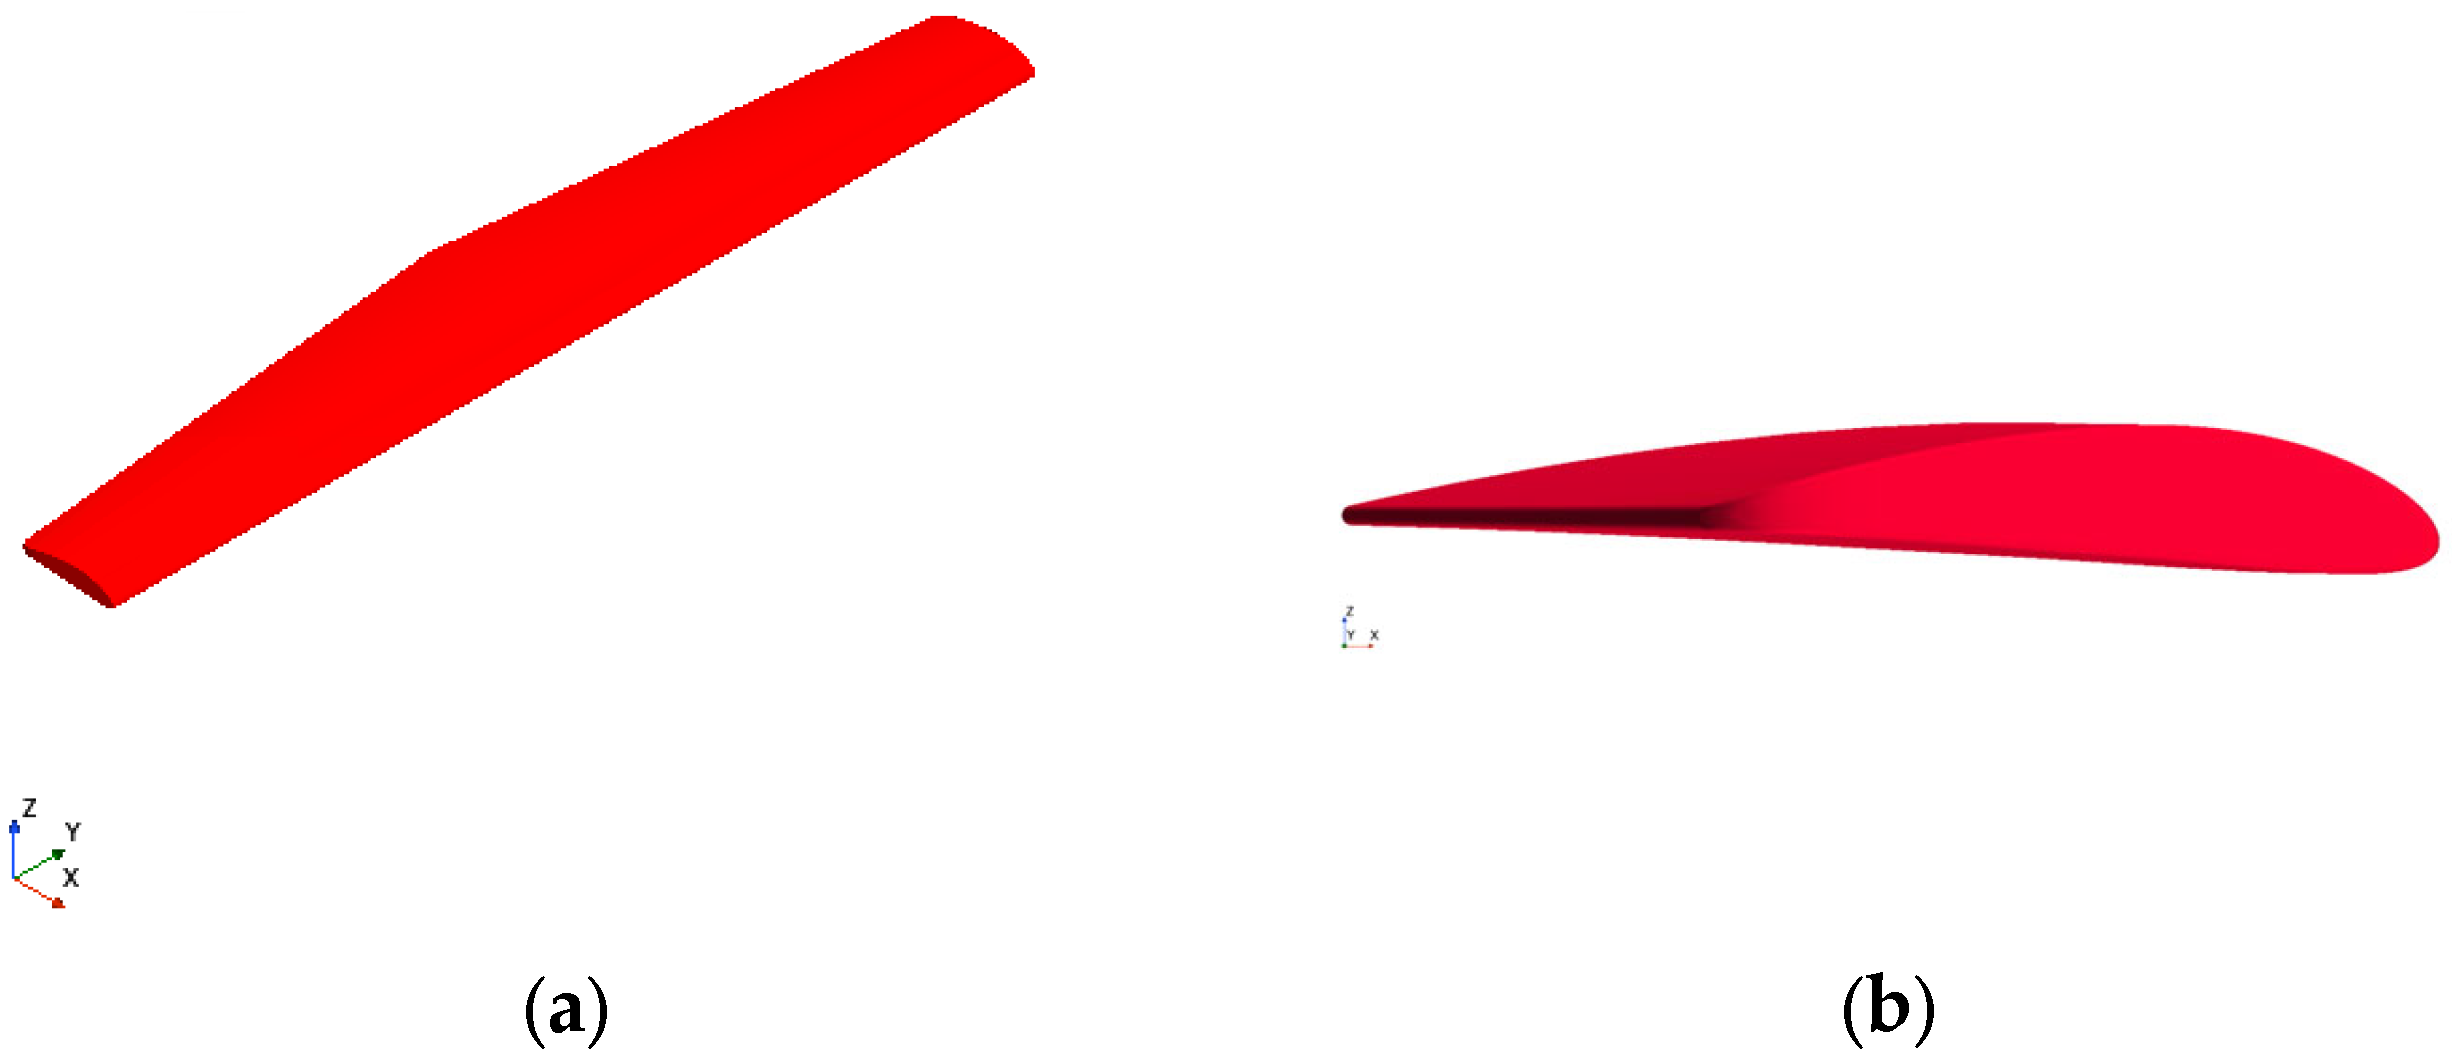
As shown in Figure 2, the hydrofoil is configured as an aft-mounted single foil, consisting of a horizontal foil installed beneath the stern transom. The foil geometry is based on a symmetric NACA 0012 profile, and its principal specifications are summarized in Table 1.
The primary purpose of the foil is to attenuate pitch and heave amplitudes by generating lift forces acting on the hull during wave encounters. Unlike hydrofoils intended for steady foil-borne operation at high speeds, the foil considered in this study is a passive, stern-mounted device set at zero mean angle of attack; it does not generate steady lift to sustain foil-borne operation but produces unsteady, encounter-induced lift that attenuates heave and pitch at low speeds. For the condition without hydrofoils, the same hull form was used, but the foil geometry was completely removed and regarded as the reference configuration for comparison. This approach enabled a quantitative comparison of the pure motion performance differences between the with-foil and without-foil conditions.

2.2. Linear Seakeeping Analysis Using Maxsurf Motions

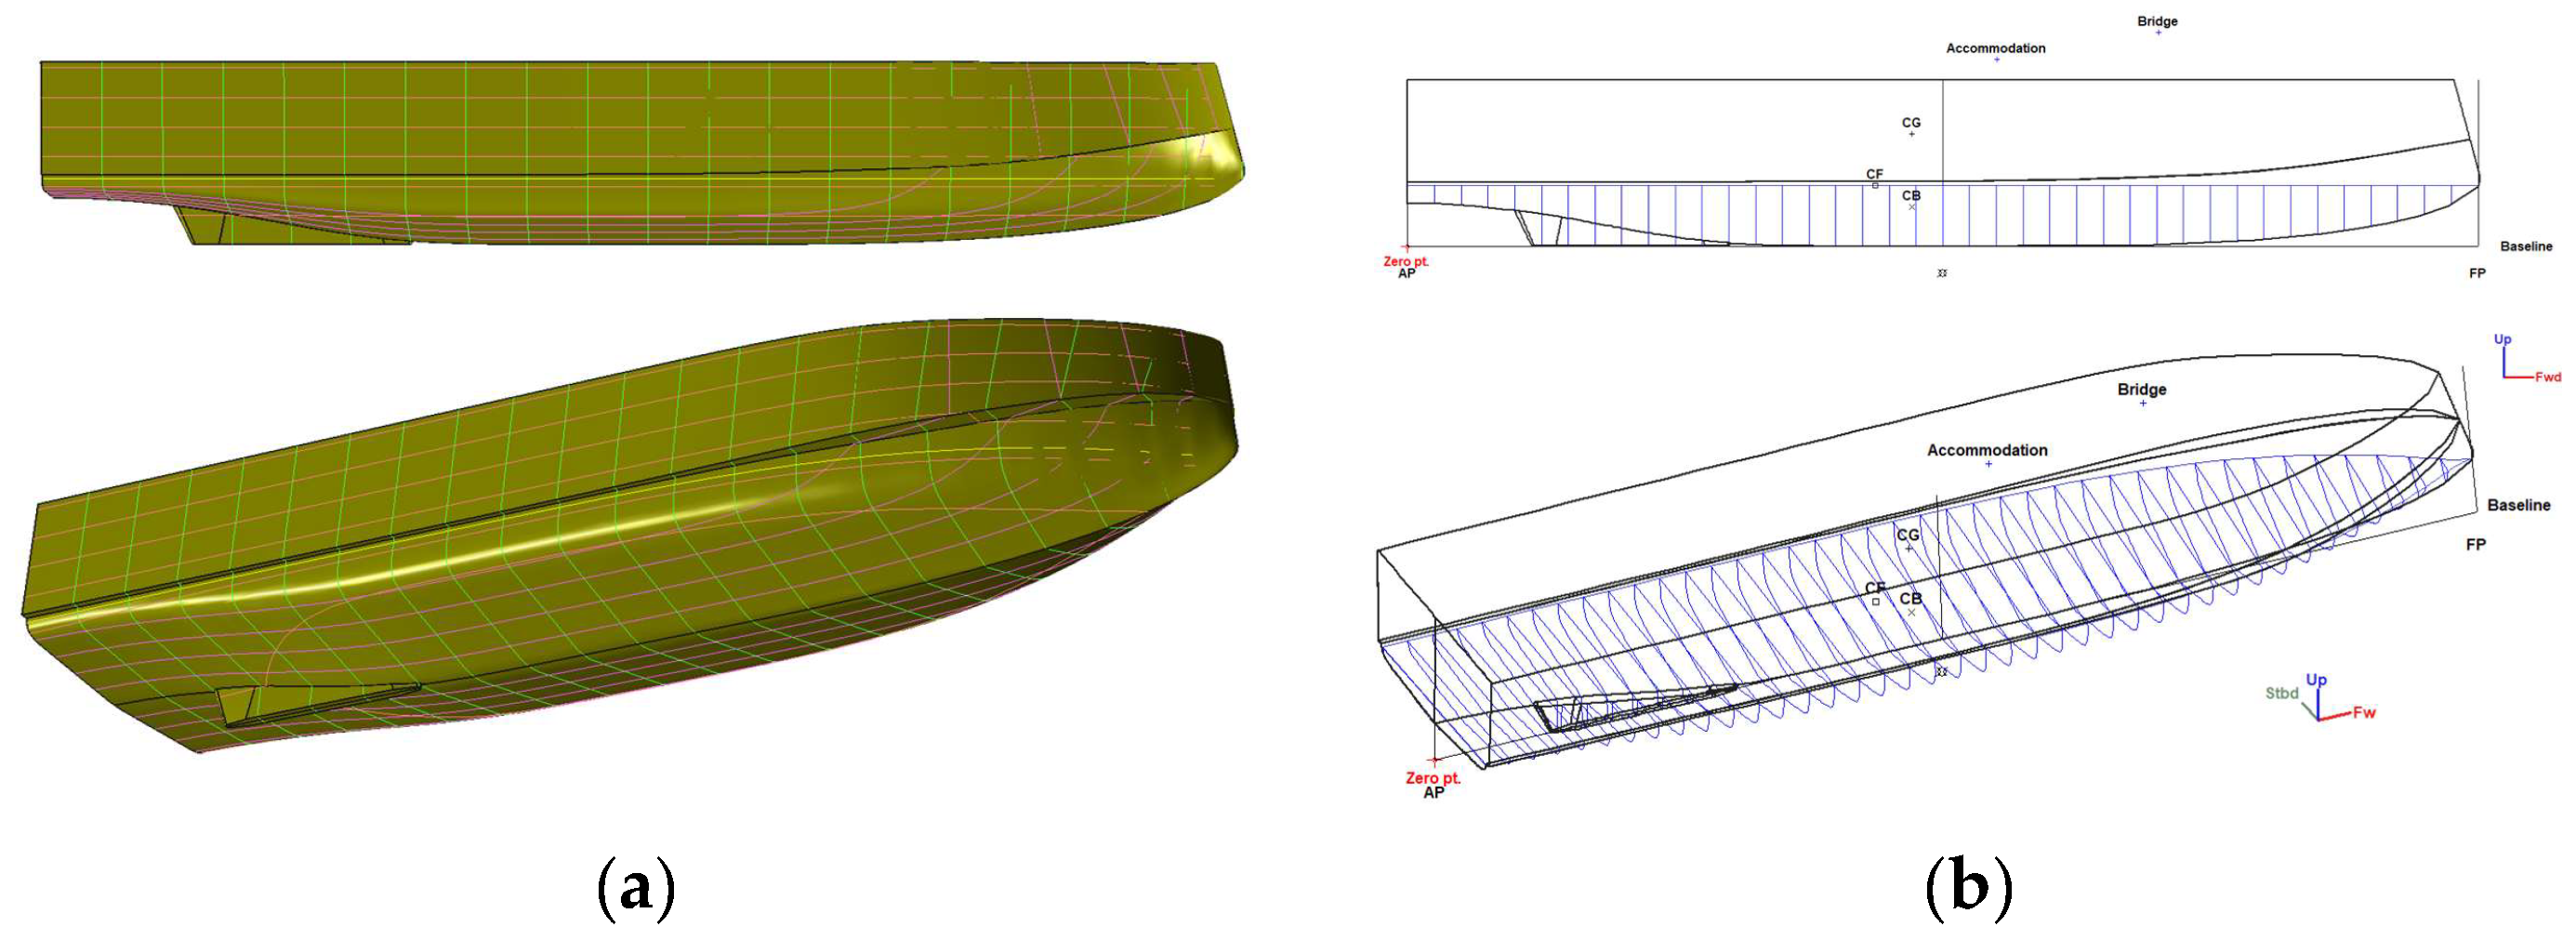
In this study, the commercial seakeeping analysis tool Maxsurf Motions Advanced was employed to perform linear motion response analysis for the small monohull vessel without hydrofoils. Maxsurf Motions Advanced is based on linear potential-flow theory in the frequency domain and computes RAOs for specified sea states. It is widely used internationally as a linear analysis-based tool for preliminary design and comparative evaluation. For the analysis with Maxsurf, the hull surface of the target vessel was first created in Rhino ver.8 [22], a commercial computer-aided design (CAD) software widely employed in naval architecture and industrial design for surface modeling, and then converted into the modeling format required by Maxsurf to ensure the accuracy of the effective body surface. Subsequently, as illustrated in Figure 3, the vessel’s displacement, center of gravity, and radii of gyration were defined using Maxsurf Modeler and Maxsurf Motions. The physical properties and initial conditions for the seakeeping analysis were then established as summarized in Table 2.
Maxsurf Motions Advanced analyzes the six degrees of freedom (6-DOF) motions of the vessel in the frequency domain, and in this study, only the head-sea condition was considered. For the purpose of analyzing linear response characteristics in regular waves, the wave conditions listed in Table 3 were applied.

2.3. Nonlinear CFD-Based Seakeeping Analysis

Linear motion analysis has advantages in computational efficiency and intuitive interpretation; however, it cannot accurately capture the nonlinear flow characteristics of underwater appendages such as hydrofoils, nor their complex interactions with the free surface. In particular, local vortices and turbulence boundary layer variations generated by hydrofoils cannot be quantitatively estimated using linear theory, making nonlinear CFD approaches indispensable for accurate analysis.
Accordingly, in this study, the commercial CFD platform STAR-CCM+ was employed to compare and analyze the seakeeping characteristics of the hull with and without hydrofoils. STAR-CCM+ provides integrated capabilities for free-surface analysis, moving mesh simulation, and 6-DOF motion calculations, offering a suitable computational environment for multiphase flow and time-dependent motion response simulations.
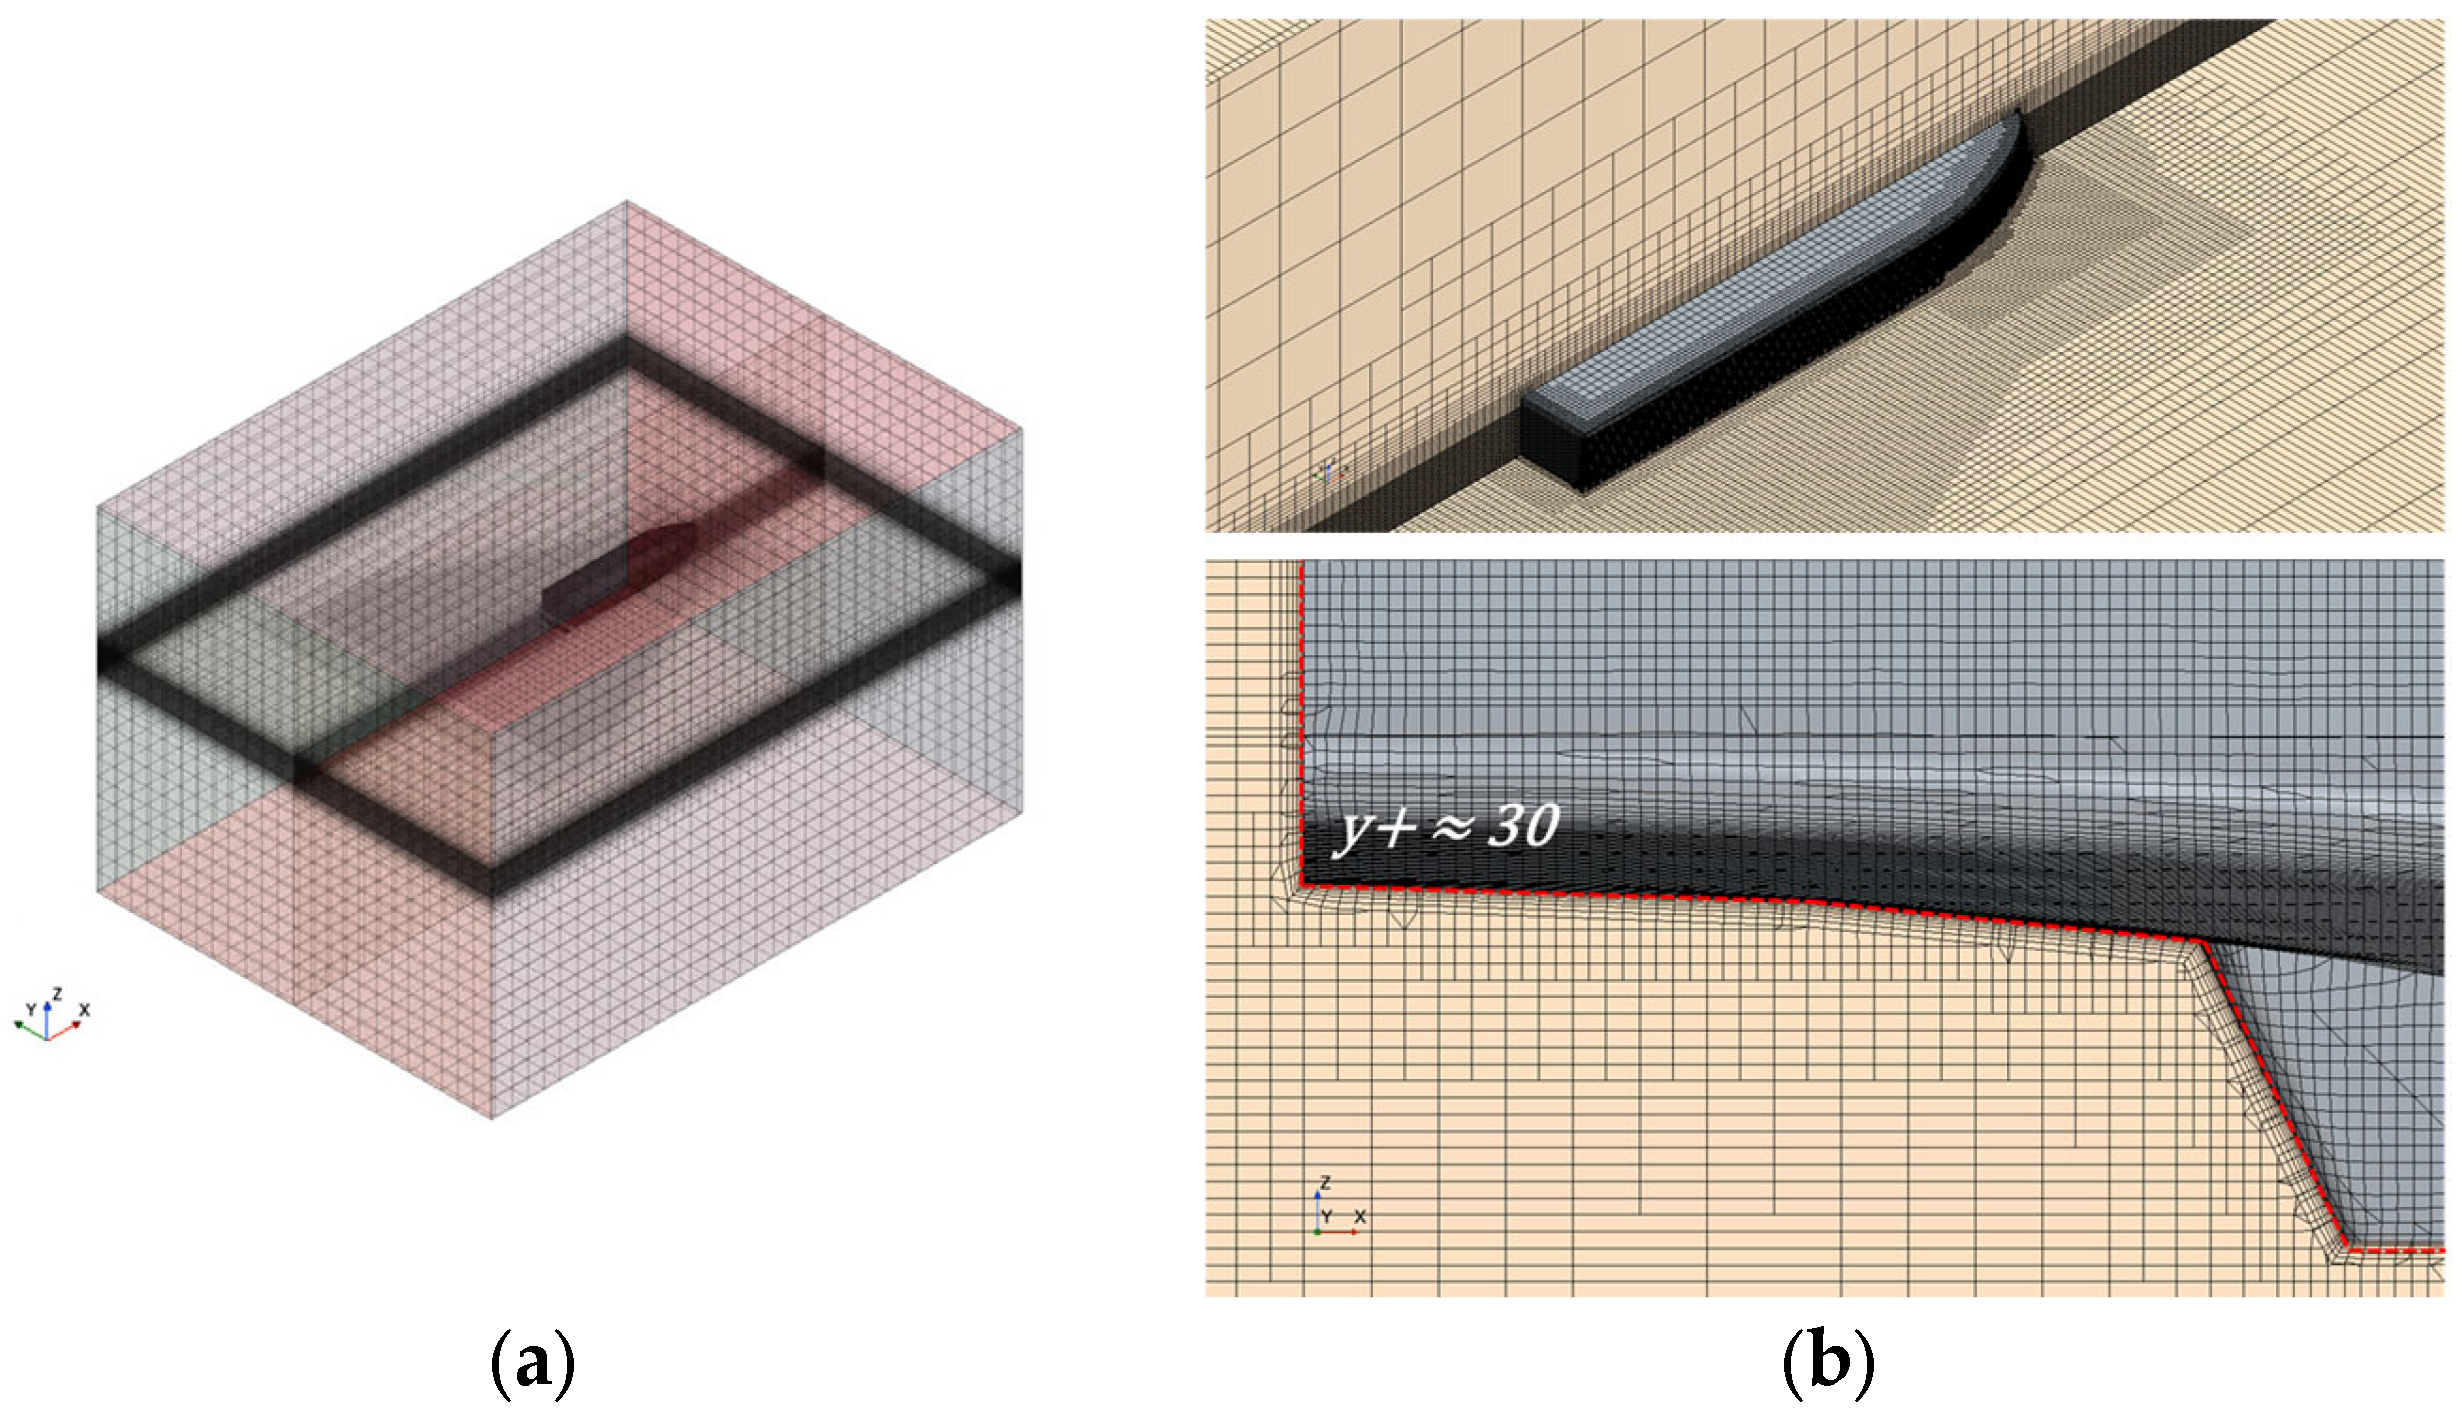
CFD simulations were conducted for two configurations: the bare hull without hydrofoils and the hull fitted with hydrofoils. To enable quantitative comparison, identical numerical conditions were applied to both cases. The computational domain was defined as illustrated in Figure 4, and the associated boundary conditions are summarized in Table 4. The domain extended 2 L upstream, 4 L downstream, 1.5 L laterally on each side (3 L in total), and 2.5 L above the free surface, ensuring sufficient clearance to minimize boundary and free-surface effects on the results. A velocity inlet condition was applied at the inlet, top, and bottom boundaries, while a pressure outlet condition was imposed at the stern and lateral outlet boundaries. The side boundaries were treated with symmetry conditions to improve computational efficiency. To ensure accuracy in predicting ship motions and flow fields under wave conditions, a trimmer-based grid was applied throughout the entire domain, as shown in Figure 5, with local mesh refinement around the hydrofoil to enhance grid quality. The total cell count was approximately six million, with six layers of boundary-layer elements placed near the hull surface to account for shear stress effects. Near-wall turbulence was modeled using the High y+ wall treatment (wall-function approach), with a target y+ of approximately 30 over the wetted surfaces.
As summarized in Table 5, the numerical simulations were conducted under implicit unsteady second-order conditions in a three-dimensional framework, with a time-step of 0.02 s applied to accurately capture the temporal variations in ship motion responses and flow characteristics, and 20 inner iterations per time-step were performed. A pressure-based segregated solver was employed to ensure computational efficiency, and the Reynolds-Averaged Navier–Stokes (RANS) model was adopted to simulate the mean flow field under wave conditions, using the Reynolds Stress Turbulence model with High y+ wall treatment (wall-function approach; Wall Distance enabled). The free surface was modeled using a regular wave formulation based on the Volume of Fluid (VOF) method, with VOF Waves enabled and multiphase interaction activated; gravity was set to 9.81 m·s−2. The total simulation time was set to 60 s to ensure that stable periodic responses could be obtained. Both the time-step and the total simulation duration were determined through preliminary assessments, considering the wave periods and convergence characteristics.
In addition, a mesh independence study was conducted using seven mesh levels ranging from 1.0 M to 15.0 M cells. The RAO (Pitch) values gradually decreased from 0.7277 rad/m to 0.4406 rad/m as the mesh was refined, indicating a clear convergence trend. Beyond approximately 6.0 M cells (Case 5), the variation in RAO became less than 0.01, suggesting that further mesh refinement had a negligible influence on the results. This confirms that the solution sufficiently converged, and considering both computational efficiency and accuracy, a mesh size of about 6.0 M cells was determined to be the optimal resolution for the present simulations. The details of the mesh convergence test conditions and results are summarized in Table 6, and the corresponding convergence trend is illustrated in Figure 6.
As presented in Table 7, numerical simulations were conducted under head-wave conditions (wave heading = 180°) for various wave heights and encounter frequencies. The wave heights were set across ten conditions, ranging from 0.27 m to 1.45 m, resulting in encounter frequencies varying from approximately 1.0 rad/s to 9.2 rad/s. The forward speed was fixed at V = 10.0 knots, enabling like-for-like comparison of motion responses across wave conditions. Simulations were carried out for both the bare-hull condition (without foil) and the hydrofoil-fitted condition (with foil), and by comparing the two configurations under identical wave height–frequency combinations, the motion reduction effects of the hydrofoil were quantitatively analyzed.
RAO is a key indicator for quantitatively evaluating a vessel’s motion characteristics in waves, expressed as a function of the ship’s motion response at a given frequency. In this study, RAOs for heave and pitch were derived from linear frequency-domain analysis (Maxsurf Motions) and nonlinear time-domain CFD (STAR-CCM+), by post-processing the CFD time series to obtain RAO curves, and the relative motion attenuation effects with and without hydrofoils were compared. Maxsurf Motions performs linear motion response analysis in the frequency domain, directly calculating heave and pitch amplitude responses for each frequency condition. Accordingly, RAOs are automatically derived based on the following Equations (1) and (2): where ω is the wave angular frequency [rad/s]; ζ3(ω) is the heave displacement amplitude of the vessel at frequency ω [m]; θ(ω) is the pitch angular amplitude of the vessel at frequency ω [rad]; and ηa is the incident wave amplitude [m].
R A O h e a v e ω = ζ 3 ( ω ) η a ,
R A O p i t c h ω = θ ( ω ) η a ,
The results from Maxsurf provide motion amplitudes with respect to the vessel’s center of gravity, and the frequency response results are post-processed into tables and graphs, which are then used as a reference line for quantitative comparison with CFD results. Meanwhile, STAR-CCM+ produces nonlinear time-domain response data, which require post-processing to be transformed into frequency-domain RAOs. In this study, RAO graphs were generated from the time-series response data using the equation employed in Maxsurf. The analysis results from Maxsurf and STAR-CCM+ were normalized with respect to identical wave frequencies and amplitudes to enable direct comparison. In this study, particular attention was given to heave and pitch RAOs in order to evaluate the motion response characteristics between the hydrofoil-fitted and bare-hull conditions.

2.4. Estimation of Motion Sickness Incidence

The evaluation of a ship’s seakeeping performance in waves should not be limited to the quantification of motion response amplitudes but must also account for passenger-perceived comfort and the likelihood of seasickness during actual operations, thereby providing more practical design criteria. Accordingly, in this study, MSI—an index representing the percentage of passengers expected to experience seasickness during exposure—was estimated based on the ship motion RAOs. MSI represents the percentage of passengers predicted to suffer from seasickness after a certain exposure duration at a given frequency condition. Internationally, ISO 2631-1 [18] and the experimental formula of O’Hanlan et al. [23] are among the most widely used standards. O’Hanlan et al. [23] reported that MSI exhibits a cumulative characteristic. Each ship motion induced by waves contributes to the increase in MSI, and as wave height increases, motion amplitudes grow accordingly, resulting in higher MSI values. For an individual wave characterized by a given height and encounter frequency, the MSI contribution of that wave can be quantitatively calculated. Given a ship’s speed and heading conditions, a curve representing the relationship between wave height and encounter frequency can be derived, while the wave energy distribution across frequencies can be determined using the wave power spectrum. Based on this distribution, the total MSI can be obtained by summing the MSI contributions of all individual waves.

3. Verification

Ensuring the numerical reliability of CFD simulations is a key factor in guaranteeing the physical validity of the results, and this is typically achieved through grid independence studies, time-step sensitivity analysis, or comparison with experimental data. However, since experimental data were not available in this study, an indirect verification procedure was adopted by comparing RAO results from Maxsurf linear analysis with those obtained from CFD. This approach evaluates the accuracy of CFD results not by the sensitivity to grid size or time-step, but by the consistency of responses with a physically meaningful reference analysis.
For verification of the CFD results, RAOs from Maxsurf under the bare-hull condition (without hydrofoils) were used as the reference baseline and directly compared with the heave and pitch RAOs obtained from STAR-CCM+. This comparison was carried out in the following three aspects:
  • Comparison of peak response locations across key frequency ranges
  • Quantitative error analysis of RAO amplitudes
  • Evaluation of average and maximum error rates across the entire frequency range
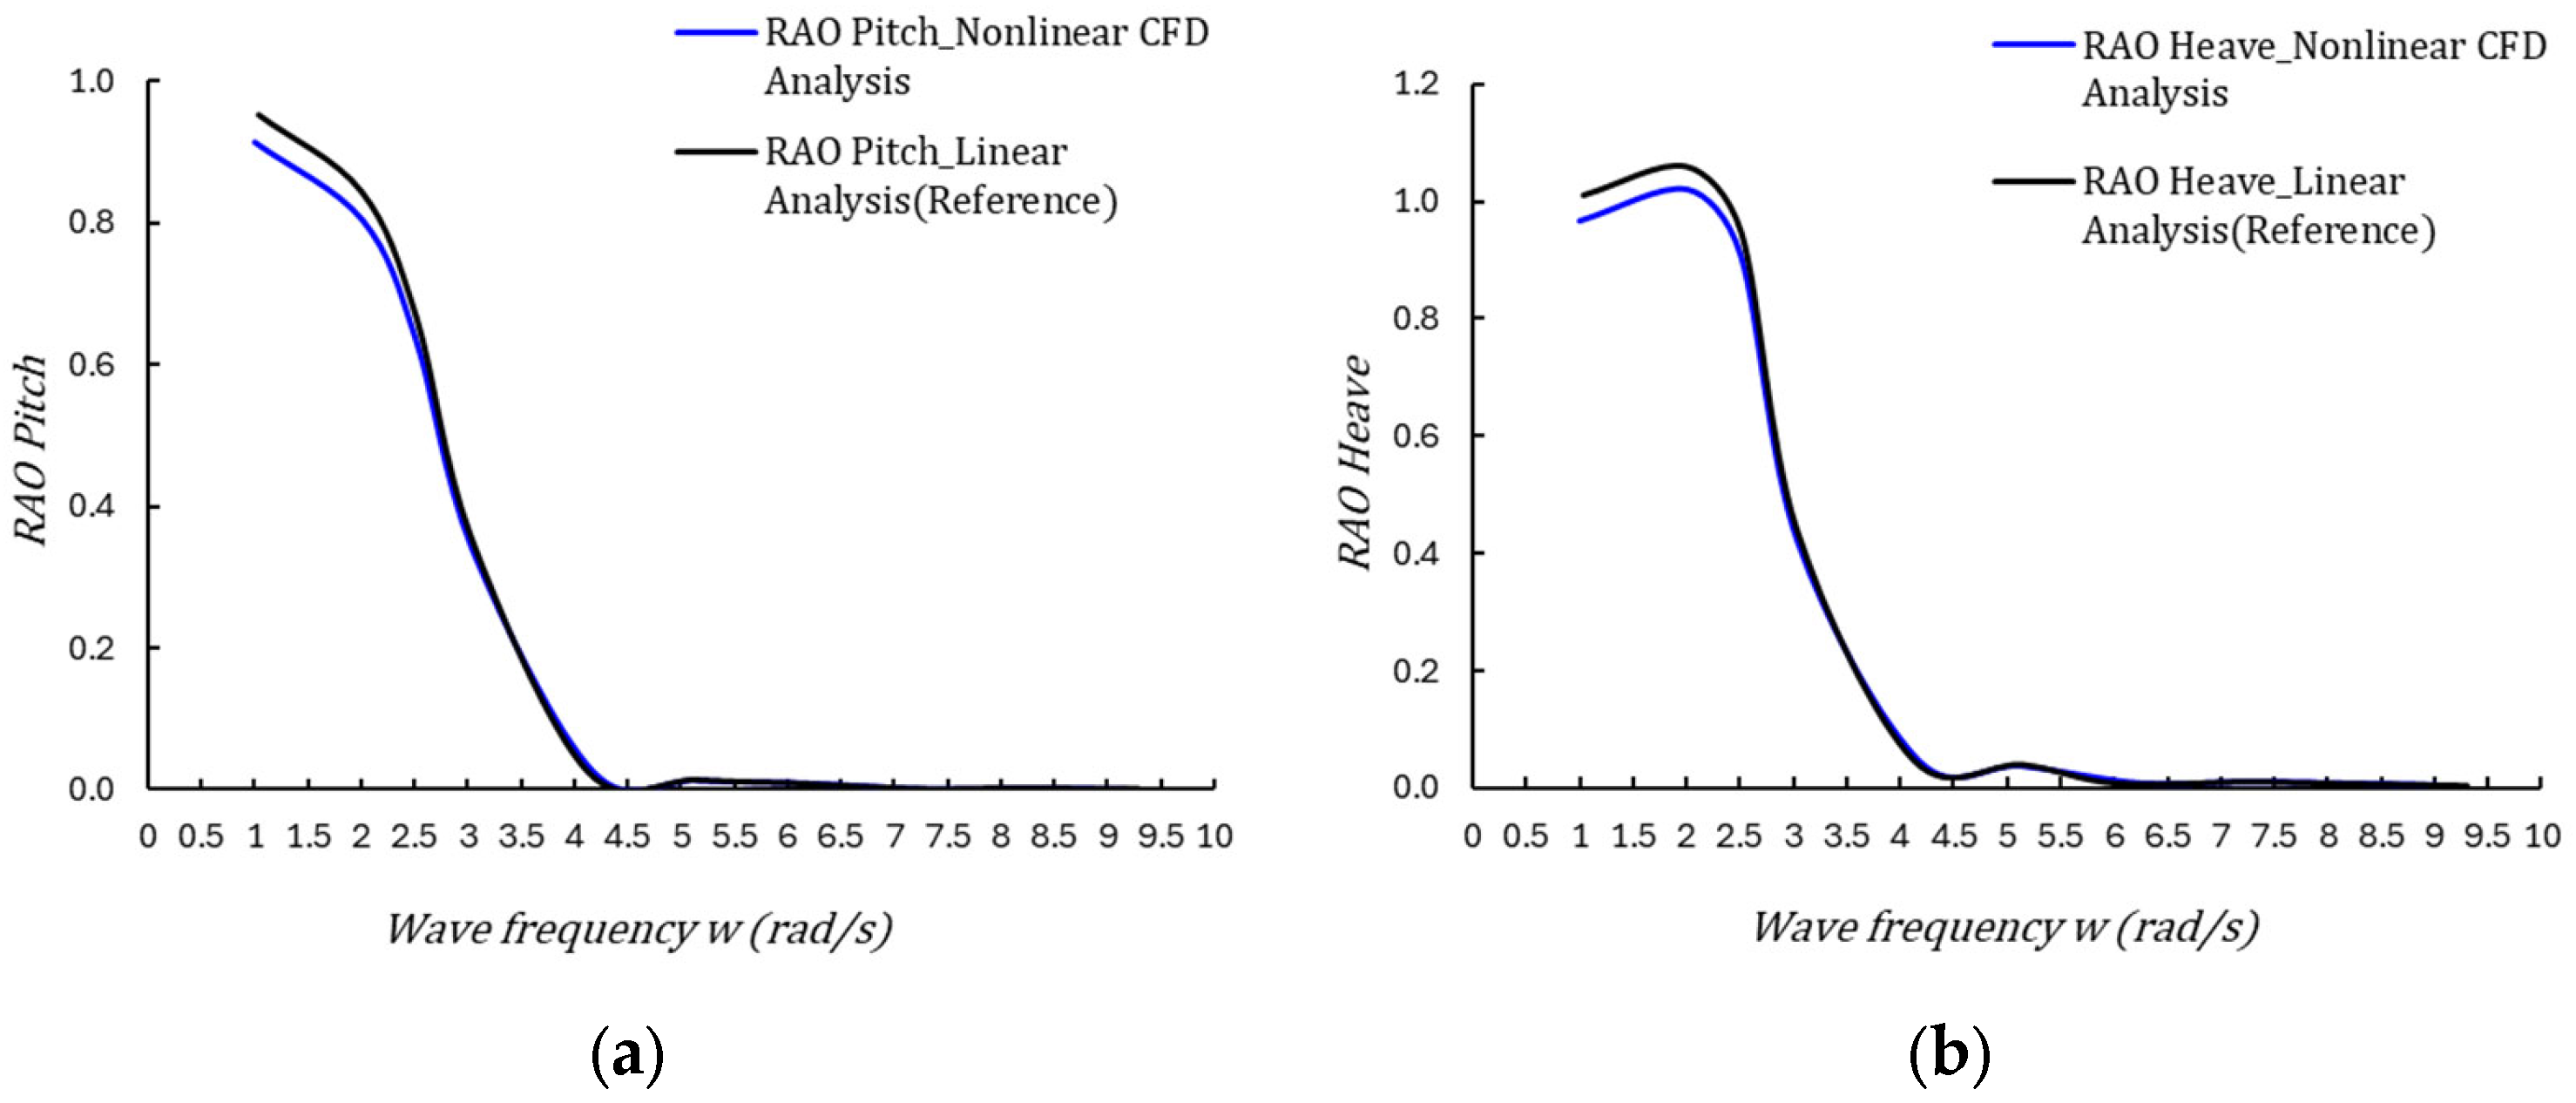
As shown in Figure 7, comparison of the RAO results from the two analyses revealed the following tendencies:
  • Heave RAO
Overall, both analysis methods showed peak heave RAO values in the high-frequency region (around 2.0 rad/s), and the locations of the peaks were similar. In the CFD results, amplitudes approximately 2% higher than those from linear analysis were observed at certain frequencies, which can be attributed to the CFD method more accurately capturing nonlinear added mass and radiation damping effects.
  • Pitch RAO
For pitch response, the peak RAO frequency was found in the mid-frequency range (around 1.0 rad/s), and both methods consistently exhibited attenuation trends in the high-frequency region (above 2.0 rad/s). The RAO error analysis showed that the average error rates across the entire frequency range were approximately 5.0% for heave and 4.7% for pitch, which is considered to result from the complexity of nonlinear simulations and differences in numerical smoothing techniques. However, within the main frequency regions where maximum RAOs occur (response peak zones), the errors remained within ±5%, indicating that the consistency between the two analyses is statistically acceptable.

4. Results and Discussion

4.1. Seakeeping RAO Comparison: With vs. Without Hydrofoil

In this section, numerical analyses were conducted for the same monohull vessel with and without hydrofoils, focusing on the comparison and analysis of RAOs. All simulations were performed using CFD based on STAR-CCM+ ver. 19.06, with identical grid settings, motion models, and wave conditions applied to both cases, in order to quantitatively evaluate the influence of hydrofoil installation on the motion response characteristics of the vessel. For the comparison of heave and pitch RAOs, the following Equation (3) was used to calculate the reduction rate of the heave RAO, thereby quantitatively analyzing the relative attenuation effects of hydrofoil installation.
Δ R A O % = R A O w i t h   f o i l R A O w i t h o u t   f o i l R A O w i t h o u t   f o i l × 100 %
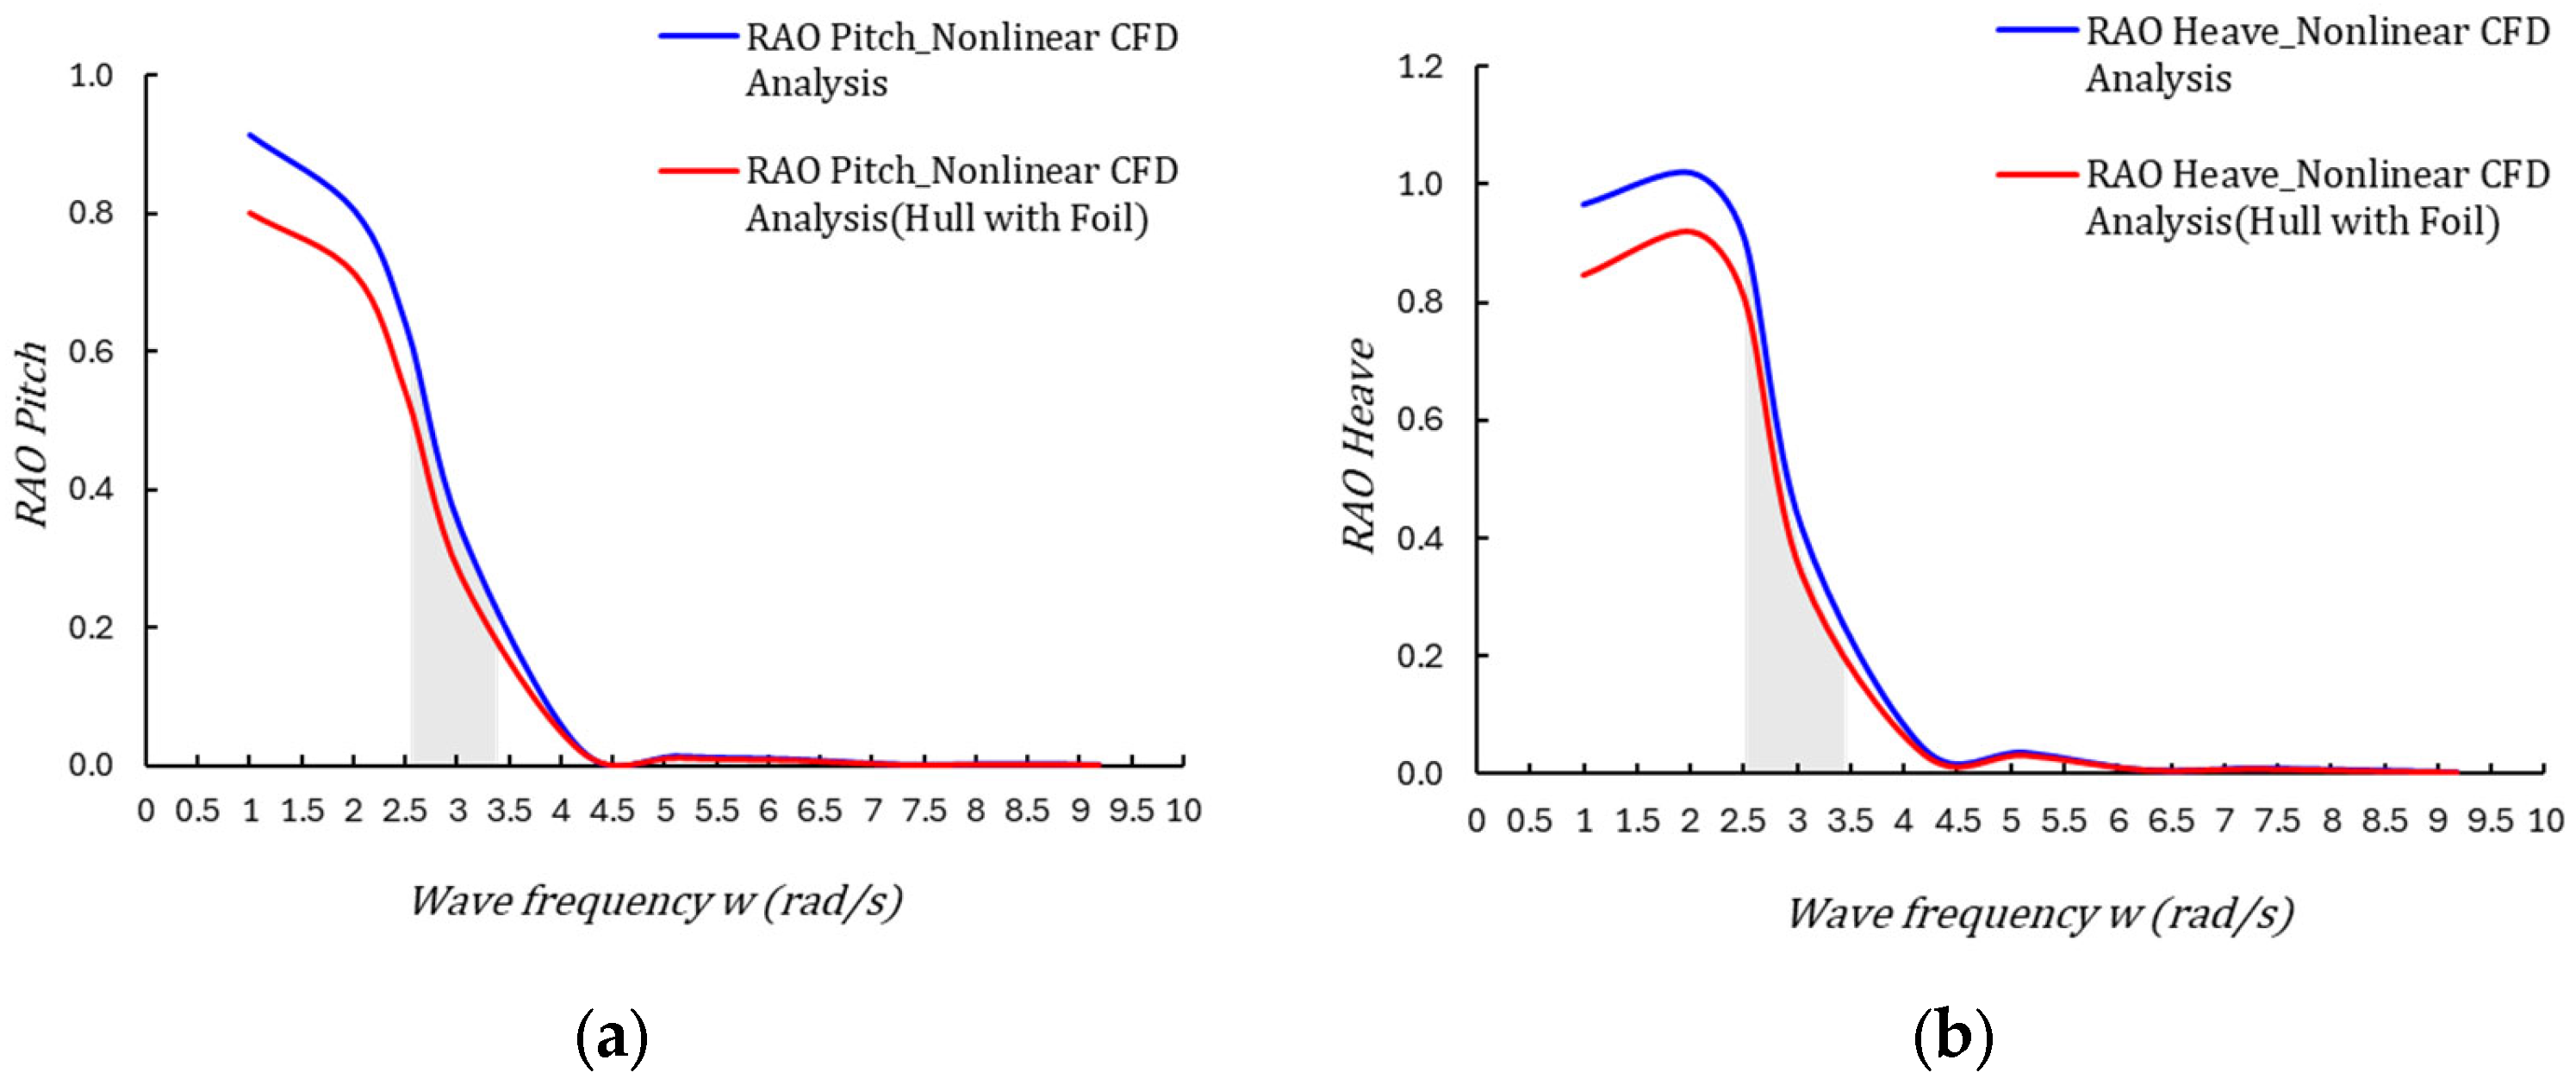
The heave RAO represents the vertical motion amplitude of the vessel normalized by the wave amplitude, and it is generally directly associated with the vessel’s buoyancy stability. The characteristics of the heave RAO with and without hydrofoils are shown in Figure 8a.
  • The peak frequency of the maximum response amplitude appeared in the range of approximately 1.5–2.5 rad/s under both with-foil and without-foil conditions, indicating that the fundamental hull characteristics were preserved.
  • With hydrofoils installed, the maximum RAO values decreased by an average of 16.7%, with the most significant attenuation observed in the mid–high-frequency range (1.0–1.5 rad/s).
  • In the high-frequency region (>4 rad/s), the difference between the two conditions was relatively small, since shorter wave periods caused rapid decay of vessel motions, with radiation damping effects becoming dominant.
These results suggest that the hydrofoil generates vertically induced lift, acting as additional support against the free surface and effectively controlling heave responses induced by waves.
The pitch RAO, as shown in Figure 8b, represents the longitudinal rotational motion response of the vessel and has significant implications for ride comfort and maneuvering stability. The analysis results are summarized as follows:
  • With hydrofoil installation, the maximum pitch RAO amplitudes decreased by approximately 16.1% on average, with attenuation effects appearing more pronounced than in heave motions.
  • In particular, near the peak response frequency (around 1.0 rad/s), the amplitude decreased from 0.9 deg/m (without foil) to 0.7 deg/m (with foil), representing a perceptibly significant reduction.
  • In the high-frequency region (>4 rad/s), the difference between the two cases diminished sharply, which can be attributed to the vessel’s reduced wave-following capability at higher frequencies, thereby limiting the effect of the foil.
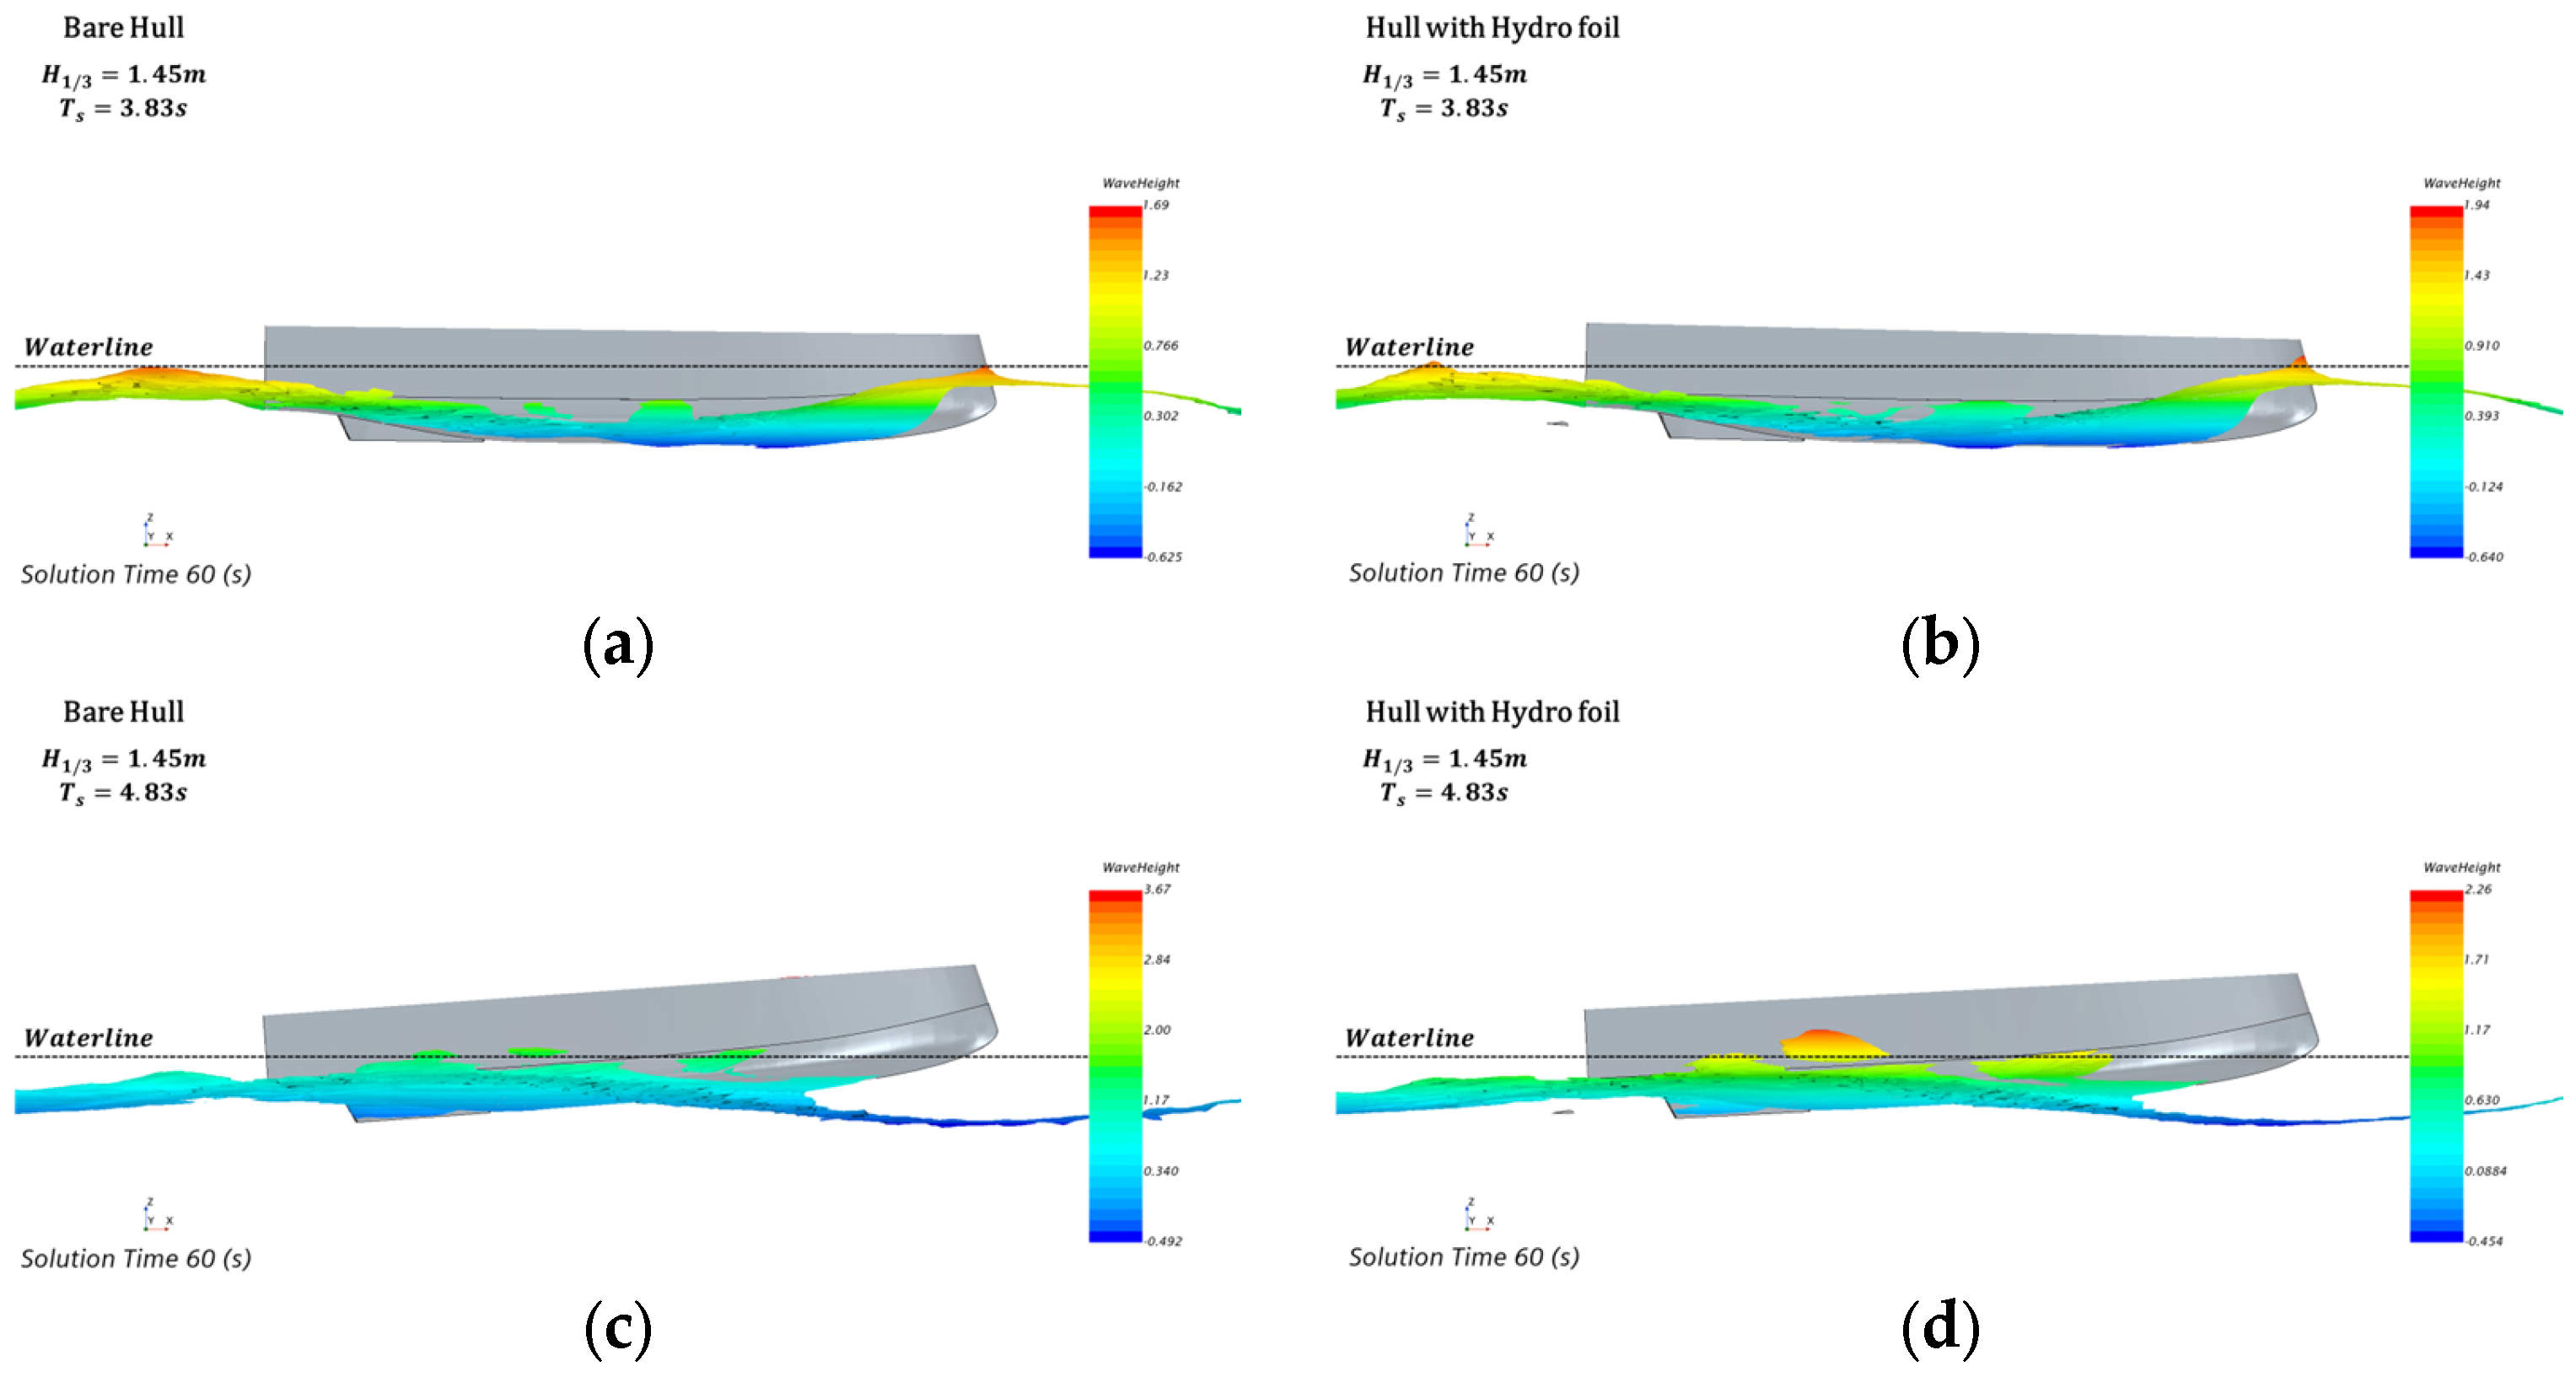
These variations in pitch response indicate that the hydrofoil functions as a dynamic resistance point beneath the stern, reducing the rotational moment induced by waves. In practice, this vessel typically operates in Sea State 2–3 (H1/3 = 1.45 m). Under the present operating speed (V = 10 knots), the corresponding dominant encounter angular frequencies fell in the range of 2.5–3.5 rad/s for the examined cases. Within this range, the flow fields around the stern were compared between the with-foil and without-foil conditions.
Figure 9 presents a comparison of the flow fields around the hull with and without a stern-mounted hydrofoil under SEA STATE 2–3 conditions, corresponding to a wave frequency range of 2.5–3.5 rad/s. These conditions correspond to a significant wave height of H1/3 = 1.45 m, with wave periods of Ts = 3.83 s and Ts = 4.83 s. In both cases, the installation of the hydrofoil resulted in noticeable changes in the flow structures and pressure distributions at the stern. To facilitate a clearer comparison between the bare hull and the hydrofoil-installed hull, reference waterlines have been added to the figure. In particular, under the Ts = 3.83 s condition, hydrofoil installation led to a slight reduction in stern wave amplitude and a tendency for the wake separation region to transform into a more orderly flow. In contrast, under the Ts = 4.83 s condition, the differences became more pronounced, which can be interpreted as the lift generated by the hydrofoil enhancing the damping of stern motions. Furthermore, the vessel’s pitch angle also showed a decreasing trend when the hydrofoil was installed, supporting its role as an auxiliary device that effectively suppresses bow–stern oscillations in waves.
The RAO comparison analysis revealed that the installation of hydrofoils significantly reduced the vessel’s motion amplitudes in waves overall, with particularly pronounced damping effects in the mid-to-high frequency range. This finding provides the following engineering implications:
The reduction in motion responses directly translates into improved ride comfort and potential reductions in fuel consumption, thereby contributing to practical improvements in operational performance. RAO-based quantitative indicators serve as the foundation for subsequent MSI analysis and provide essential baseline data for predicting the impact of hydrofoil application on actual passenger experience. These results demonstrate that hydrofoils can exert significant hydrodynamic effects even under low-speed operating conditions (around 10 knots), thereby providing a technical basis for extending their application beyond high-speed craft to include low-speed coastal vessels and small passenger ships.

4.2. MSI Comparison Under Various Wave Frequencies

In this section, MSI was calculated for the bare monohull condition based on linear motion analysis results from Maxsurf Motions, while for the hydrofoil-fitted condition, the potential improvement in ride comfort was indirectly inferred from the attenuation characteristics of RAOs and time-series responses. The MSI estimation employed the empirical model derived from the experimental formula of O’Hanlan et al. [20], which is also adopted as the standard in Maxsurf Motions. As illustrated in Figure 10, the vertical motion responses at the bridge and accommodation locations were extracted from the RAOs across different frequencies, and based on these, the vertical acceleration amplitudes were calculated to estimate MSI.
The calculated MSI results are presented in the graph of Figure 11, which indicates that the vertical acceleration amplitudes at dominant wave response frequencies fall within the human sensitivity range, suggesting a significant likelihood of seasickness occurrence even at a wave height of 1.45 m.
First, under the Gentle Breeze condition (Wind = 10 knots, H1/3 = 0.565 m), it was found that passengers did not experience seasickness at either the bridge or accommodation, even after exposure of up to 6 h across the entire encounter frequency range. In the encounter frequency range of 2.5–2.8 rad/s, vertical acceleration was found to be the highest, and seasickness incidence increased when exposure exceeded 7 h. Under the Moderate condition (Wind = 16 knots, H1/3 = 1.446 m), passengers at neither the bridge nor accommodation were predicted to experience seasickness, even with exposure of up to 30 min across the entire encounter frequency range. In the encounter frequency range of 2.0–3.0 rad/s, vertical acceleration was the highest, and seasickness incidence increased when exposure exceeded 40 min.
At encounter frequencies above 3.0 rad/s, seasickness incidence was found to increase when exposure reached at least 2 h. Overall, MSI remains low in major passenger and crew activity spaces such as the accommodation and the bridge, even during long-term voyages. Therefore, the vessel analyzed in this study can be generally evaluated as possessing excellent operational stability.
For the hydrofoil-fitted condition, it was not possible to directly estimate MSI since linear analysis-based programs could not be applied. However, the reduction in MSI can be indirectly assessed through the following procedure. First, the power spectral density of vertical acceleration is defined as Equation (4).
S a f = H a f 2 S n f
where Sa(f) denotes the power spectral density (PSD) of the vertical acceleration response at the vessel’s location, Ha(f) is the response amplitude operator (RAO) that characterizes the vessel’s acceleration response per unit wave amplitude at frequency f, and Sn(f) represents the wave spectrum (incident wave PSD). A reduction in RAO by a factor of α leads to a proportional reduction in PSD by α2. Consequently, the Motion Sickness Dose Value (MSDVz) becomes the following Equation (5):
M S D V z = T S a , w f d f a
and the Motion Sickness Incidence (MSI), defined as Equation (6), where Km is the human response coefficient (empirical constant, approximately K m = 1 / 3 ) defined in ISO 2631-1 [18], Which is used together with the motion sickness dose value (MSDVz) expressed in m/s1.5.
M S I = K m · M S D V z
is also reduced linearly with α. For the present case, α = 0.84 (i.e., a 16% reduction), yielding the following Equation (7):
M S I = 0.84 × M S I
which indicates that MSI decreases exactly by 16%. This provides a clear theoretical basis for linking RAO reduction to MSI improvement. This result highlights the feasibility of hydrofoils as a structural means to enhance passenger ride comfort, serving as indirect quantitative evidence of their practical benefit.
Therefore, MSI is expected to be significantly improved even under hydrofoil-fitted conditions, which can be interpreted as indirect quantitative evidence supporting the feasibility of hydrofoils as a structural means to enhance passenger ride comfort.

5. Conclusions

5.1. Summary of Findings

This study conducted a numerical assessment of the wave-induced motion responses and ride comfort of a small monohull vessel operating at a design speed of approximately 10 knots, focusing on the effects of hydrofoil installation. By employing both the linear seakeeping analysis tool Maxsurf Motions and the nonlinear CFD solver STAR-CCM+, the complementary strengths of each method were utilized, enabling consistent comparative analysis of motion performance.
For the bare-hull condition without hydrofoils, both Maxsurf and CFD analyses were performed, and comparison of RAO responses between the two methods confirmed consistency within an average error rate of 5%. This validated the numerical reliability of the CFD-based results, which were then used to quantitatively analyze motion characteristics under hydrofoil-fitted conditions. The key findings of this study are summarized as follows:
  • With hydrofoil installation, the amplitudes of heave and pitch responses in the frequency domain (RAO analysis) were reduced by approximately 16%.
  • For the bare-hull condition, MSI estimated using the linear analysis program showed that under Gentle Breeze conditions, seasickness incidence remained low even with long exposure times (up to 6 h), while under Moderate conditions, passengers at both the bridge and accommodation did not experience seasickness even after exposure of up to 30 min across the entire encounter frequency range.
  • These results indicate that, except for certain frequency bands, seasickness incidence remains low in primary passenger and crew spaces such as accommodation and the bridge, even during long-term voyages. Thus, the vessel analyzed in this study can be generally evaluated as having excellent operational stability.
  • Although direct MSI estimation was not feasible for the hydrofoil-fitted condition using the linear analysis program, the quantitative reduction in motion amplitudes reasonably suggests a significant decrease in MSI.
  • This study numerically demonstrated that hydrofoils can serve as an effective structural means of improving motion stability and enhancing ride comfort not only for high-speed vessels but also for small coastal vessels operating at low speeds.
These findings can serve as quantitative criteria when considering the application of hydrofoils in future small vessel design, particularly providing a technical basis for design optimization in ship types where passenger comfort is critical, such as marine tourism vessels and coastal ferries.

5.2. Engineering Implications

This study numerically confirmed that the application of hydrofoils to small monohull vessels operating at low speeds can effectively attenuate wave-induced motion responses. These findings provide the following engineering implications from the perspectives of ship design and operation.
First, hydrofoils are not merely structures intended for high-speed foil-borne operation but can also serve as effective passive damping devices for enhancing motion stability in low-speed vessels. In particular, the simultaneous suppression of heave and pitch motions suggests that the foil not only provides vertical support but also offers resistance against longitudinal rotational motions. This indicates a multifunctional damping mechanism beyond simple lift generation and highlights the potential for structural placement and shape optimization in future designs.
Second, this study demonstrated the complementary use of Maxsurf Motions and STAR-CCM+, establishing consistency between the two approaches. This validates the role of CFD in supplementing the limitations of linear analysis tools during the early design stage. In particular, the consistency between MSI results derived from Maxsurf and motion attenuation trends observed in CFD indicates that motion sickness predictions based on linear analysis can be structurally supported by CFD outcomes.
Third, the findings of this study provide a technical decision-making basis for considering the adoption of hydrofoils at the early design stage of vessels where passenger comfort is critical, such as small coastal ferries, tourist ships, and leisure boats. For hull designers, hydrofoil attachment can be utilized as a means of simultaneously enhancing ride comfort and operational performance without requiring modifications to propulsion systems.
In conclusion, by quantitatively presenting the new applicability of hydrofoils, this study is expected to contribute to the development of practical and applicable design strategies for optimizing both operational safety and passenger comfort in low-speed small vessels.

5.3. Limitations

Despite these contributions, the present study has certain limitations. The results were obtained solely through numerical simulations without direct experimental validation, nor comparative assessments against potential flow code results, and thus should be interpreted within the scope of the applied CFD methodology. Furthermore, the analysis was limited to head-sea conditions and a specific forward speed, which restricts the generalization of the findings. In addition, the Motion Sickness Incidence (MSI) was directly computed only for the bare-hull condition, while for the hydrofoil-fitted hull, it was indirectly estimated, introducing a certain asymmetry in the comparison. Future research will focus on experimental campaigns as well as comparative analyses between CFD and potential flow codes, and extended numerical analyses under broader wave conditions and operating speeds, aiming to further substantiate and generalize the present results.

Author Contributions

J.K., W.O. and W.K. contributed equally to this paper. W.K. designed the research scheme, J.K. and W.O. conducted the CFD computation, W.O. analyzed the data, and J.K. wrote the paper. All authors have read and agreed to the published version of the manuscript.

Funding

This research was supported by Korea Institute of Marine Science &Technology Promotion (KIMST), funded by the Ministry of Oceans and Fisheries, Republic of Korea (20220037).

Data Availability Statement

The original contributions presented in this study are included in the article. Further inquiries can be directed to the corresponding author(s).

Conflicts of Interest

The authors declare no conflict of interest.

References

  1. Maxsurf Motions V8i. Available online: https://www.bentley.com/software/maxsurf (accessed on 23 September 2025).
  2. STAR-CCM+, Version 19.06. Available online: https://plm.sw.siemens.com/en-US/simcenter/fluids-thermal-simulation/star-ccm/ (accessed on 23 September 2025).
  3. Lau, C.-Y.; Ali-Lavroff, J.; Holloway, D.S.; Shabani, B.; Mehr, J.A.; Thomas, G. Influence of an active T-foil on motions and passenger comfort of a large high-speed wave-piercing catamaran based on sea trials. J. Mar. Sci. Technol. 2022, 27, 856–872. [Google Scholar] [CrossRef]
  4. Lau, C.-Y.; Ali-Lavroff, J.; Dashtimanesh, A.; Holloway, D.S.; Mehr, J.A. High-speed catamaran response with ride control system in regular waves by Forcing Function Method in CFD. Ocean Eng. 2024, 297, 117111. [Google Scholar] [CrossRef]
  5. Javanmard, E.; Mehr, J.A.; Ali-Lavroff, J.; Holloway, D.S.; Davis, M.R. An experimental investigation of the effect of ride control systems on the motions response of high-speed catamarans in irregular waves. Ocean Eng. 2023, 281, 114899. [Google Scholar] [CrossRef]
  6. Bowker, J.A.; Townsend, N.C. Evaluation of bow foils on ship delivered power in waves using model tests. Appl. Ocean Res. 2022, 123, 103148. [Google Scholar] [CrossRef]
  7. Sun, Y.; Zhang, D.; Wang, Y.; Zong, Z.; Wu, Z. Model experimental study on a T-foil control method with anti-vertical motion optimization of the mono hull. J. Mar. Sci. Eng. 2023, 11, 1551. [Google Scholar] [CrossRef]
  8. Moreira, D.; Mathias, N.; Morais, T. Dual flapping foil system for propulsion and harnessing wave energy: A 2D parametric study for unaligned foil configurations. Ocean Eng. 2020, 217, 107875. [Google Scholar] [CrossRef]
  9. Li, F.; Yu, P.; Wang, Q.; Li, G.; Wu, X. Numerical analysis of the effect of flexibility on the propulsive performance of a heaving hydrofoil undergoing sinusoidal and non-sinusoidal motions. Pol. Marit. Res. 2021, 28, 4–19. [Google Scholar] [CrossRef]
  10. Wang, W.Q.; Li, W.; Yan, Y.; Zhang, J. Parametric study on the propulsion and energy harvesting performance of a pitching foil hanging under a wave glider. Renew. Energy 2022, 184, 830–844. [Google Scholar] [CrossRef]
  11. Yasukawa, H.; Ishikawa, T. Improvement of propulsive performance of a catamaran in waves by a biologically inspired hydrofoil. In Proceedings of the 11th Symposium on High-Performance Marine Vehicles, Zevenwacht, South Africa, 11–13 September 2017. [Google Scholar]
  12. Xu, G.D.; Duan, W.Y.; Zhou, B.Z. Propulsion of an active flapping foil in heading waves of deep water. Eng. Anal. Bound. Elem. 2017, 84, 63–76. [Google Scholar] [CrossRef]
  13. Zhang, Y.; Xu, L.; Zhou, Y. A wave foil with passive angle of attack adjustment for wave energy extraction for ships. Ocean Eng. 2022, 260, 110627. [Google Scholar] [CrossRef]
  14. Mei, L.; Yan, W.; Zhou, J.; Shi, W. Thrust Enhancement of DTMB 5415 with Elastic Flapping Foil in Regular Head Waves. J. Mar. Sci. Eng. 2023, 11, 632. [Google Scholar] [CrossRef]
  15. Kuang, W.; Wang, D.; Hu, Z. Seakeeping Performance Analysis of a Ship with Hydrofoils in Regular Waves. SSRN Preprint 2024. Available online: https://papers.ssrn.com/sol3/papers.cfm?abstract_id=475324 (accessed on 20 September 2025).
  16. Niklas, K.; Pruszko, H. The retrofitting of ships by applying retractable bow hydrofoils: A case study. J. Ocean Eng. Mar. Energy 2023, 9, 767–788. [Google Scholar] [CrossRef]
  17. Fitriadhy, A.; Adam, N.A.; Zikry, M.S. Computational Analysis on Heave and Pitch Motions Performance of a Hydrofoil Ship. JMEST 2021, 1, 156. [Google Scholar] [CrossRef]
  18. ISO 2631-1:1997; Mechanical Vibration and Shock—Evaluation of Human Exposure to Whole-Body Vibration—Part 1: General Requirements. ISO: Geneva, Switzerland, 1997.
  19. International Maritime Organization (IMO). International Code of Safety for High-Speed Craft, 2000 (2000 HSC Code); International Maritime Organization: London, UK, 2008. [Google Scholar]
  20. Karimkhani, M.; Ghassemi, H.; He, G. Review on the active and passive control systems for the planing boats. Am. J. Civ. Eng. Archit. 2025, 13, 62–72. [Google Scholar] [CrossRef]
  21. Khalid, H.; Turan, O.; Bos, J.E.; Incecik, A. Application of the subjective vertical–horizontal conflict physiological motion sickness model to the field trials of contemporary vessels. Ocean Eng. 2011, 38, 22–33. [Google Scholar] [CrossRef]
  22. Rhino ver.8, Robert McNeel & Associates, Seattle, WA, USA. Available online: https://www.rhino3d.com (accessed on 24 September 2025).
  23. O’Hanlan, J.F.; McCawley, M.E. Motion sickness incidence as a function of the frequency and acceleration of vertical sinusoidal motion. Aerosp. Med. 1974, 45, 366–369. [Google Scholar]
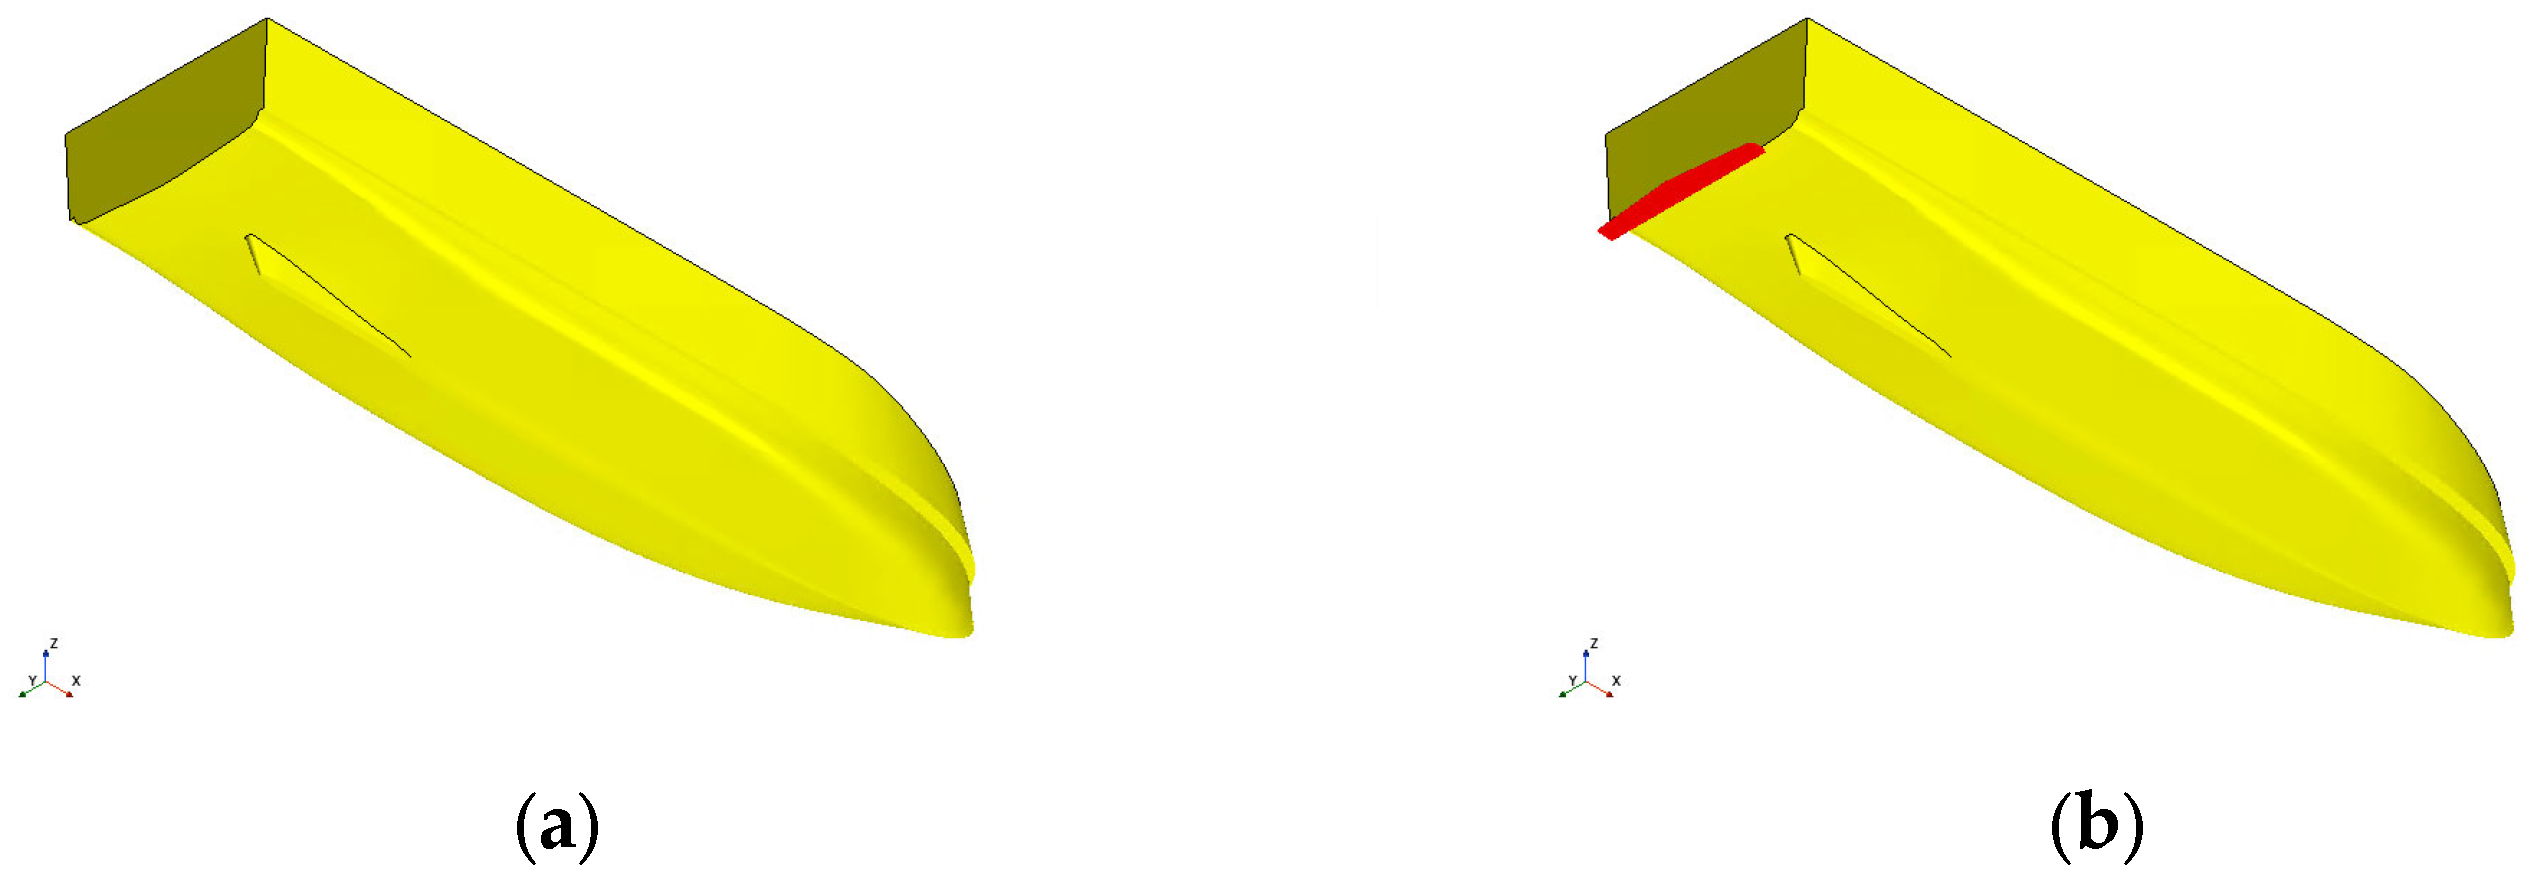
Figure 1. Three-dimensional view of the vessel model: (a) bare hull, (b) hull fitted with a stern foil.
Jmse 13 01895 g001
Figure 2. Model of Hydrofoil: (a) perspective view of the Foil, (b) side view of the Foil.
Jmse 13 01895 g002
Figure 3. Preprocessing of the case study vessel in Maxsurf for numerical analysis: (a) hull surface modeling in Maxsurf Modeler, (b) hydrostatic and seakeeping model setup in Maxsurf Motions.
Jmse 13 01895 g003
Figure 4. Illustrations of computational mesh.
Jmse 13 01895 g004
Figure 5. Computational mesh: (a) overall grid, (b) near-foil refinement.
Jmse 13 01895 g005
Figure 6. Grid convergence tests.
Jmse 13 01895 g006
Figure 7. Comparison of Heave and Pitch RAO from Linear and CFD-Based Nonlinear Analysis (Bare Hull): (a) Pitch RAO, (b) Heave RAO.
Jmse 13 01895 g007
Figure 8. Comparison of ship motion RAO with and without hydrofoil: (a) Heave RAO comparison (Bare hull vs. with hydrofoil), (b) Pitch RAO comparison (Bare hull vs. with hydrofoil).
Jmse 13 01895 g008
Figure 9. Comparison of ship wave patterns under different wave conditions: (a) Bare hull (H1/3 = 1.45 m, Ts = 3.83 s), (b) Hull with hydrofoil (H1/3 = 1.45 m, Ts = 3.83 s), (c) Bare hull (H1/3 = 1.45 m, Ts = 4.83 s), (d) Hull with hydrofoil (H1/3 = 1.45 m, Ts = 4.83 s).
Jmse 13 01895 g009
Figure 10. Numerical Ship Model and Reference Points for MSI Analysis.
Jmse 13 01895 g010
Figure 11. Frequency Response of Vertical Acceleration by Passenger Location under Ship Operating Conditions and Exposure Duration.
Jmse 13 01895 g011
Table 1. Main data of the hydrofoil.
NameValueUnit
ProfileNACA 0012-
Chord0.15m
Span (tip to root)1.00m
Attack angle0.00°
Submergence depth0.30m
Table 2. Principal particulars of the case study vessel.
DimensionValueUnit
Length overall, LOA20.00m
Breadth, B5.00m
Draft, D1.13m
Displacement, 57.00ton
Design speed, V10.00knots
Longitudinal Center of Gravity, LCG8.83m
Vertical Center of Gravity, VCG2.10m
Radius of gyration in pitch, kyy/L25%
Table 3. Seakeeping analysis conditions.
ItemValueUnit
Design speed, V10.00knots
Encounter angle180.00°
Encounter Frequency1.00~9.20rad/s
Wave Height0.14–0.62m
Wave typeRegular wave -
Table 4. CFD domain setup for wave simulations.
BoundaryCondition Setting
Inlet, Top, BottomVelocity inlet
OutletPressure outlet
SideSymmetry
Table 5. Numerical simulation settings.
ItemValueUnit
DimensionalityThree-Dimensional
Governing equationsReynolds-Averaged Navier–Stokes (RANS)
Flow type/SolverSegregated flow (pressure-based)
Temporal scheme (order)Implicit unsteady (second-order)
Time-step Δt0.02s
Inner iterations per time-step20
Turbulence modelReynolds Stress Tublence
High y+ Wall Treatment
(Wall Distance enabled)
Free-surface methodVolume of Fluid (VOF) with VOF Waves
Gravity9.81m·s−2
Multiphase interactionEnabled
Solution time (total)60s
DimensionalityThree-Dimensional
Table 6. Mesh convergence test conditions and results.
CaseBase Size (m)Mesh Cells (Million, M)RAO
10.1501.00.728
20.2122.00.568
30.3003.00.501
40.4244.50.471
50.6006.00.452
60.8499.00.443
71.20015.00.441
Table 7. Test conditions for the hull model in head seas.
ParameterValueUnit
Wave Heading180°
Wave Height0.27–1.45m
Encounter Frequency1.00~9.20rad/s
Ship speed10.00knots
Hydrofoil configurationWith hydrofoil/Without hydrofoil -
Disclaimer/Publisher’s Note: The statements, opinions and data contained in all publications are solely those of the individual author(s) and contributor(s) and not of MDPI and/or the editor(s). MDPI and/or the editor(s) disclaim responsibility for any injury to people or property resulting from any ideas, methods, instructions or products referred to in the content.