1. Introduction
The pile-anchor foundation is a critical component ensuring the stability and reliability of floating wind turbines. In practical engineering applications, the elevation of the anchor chain connection point serves as a key design parameter, significantly influencing the structural response and stability of the foundation. Variations in the connection point location directly affect the loading point elevation, which in turn induces substantial changes in the ultimate bearing capacity and soil failure mechanisms of the pile-anchor foundations. Similarly, differing loading angles profoundly impact both the ultimate bearing capacity and foundation failure modes. For fixed-bottom wind turbine foundations, pile design conventionally considers horizontal, vertical, and moment loads applied at the pile head for bearing capacity analysis [
1,
2,
3,
4]. In contrast, floating wind turbine applications lack established design precedents for pile-anchor foundations, with current practices primarily drawing from successful implementations in offshore oil and gas platform anchor systems. The anchor chains and the anchor piles are usually connected at a certain depth below the top of the pile, which makes the force characteristics of the pile-anchor foundations quite different from those of the traditional pile top loading force characteristics [
5,
6,
7,
8,
9]. Consequently, investigating the bearing behavior of model pile foundations under inclined loading—considering varying pullout angles, loading point elevations, and sand conditions (both dry and saturated)—holds significant engineering importance, and we use a self-developed servo electric cylinder loading device to conduct research on them. After extensive research, we have found that the bearing characteristics of rigid pile-anchor foundations are largely similar to those of the widely studied suction anchor foundations, and the research has become relatively mature. Therefore, this paper focuses on flexible pile-anchor foundations.
Uplift resistance plays a critical role in the bearing behavior of pile foundations, prompting extensive research by scholars [
10,
11,
12,
13,
14]. Moayedi et al. [
15] performed finite element modeling (FEM) to evaluate soil particle movement within a glass box during pile uplift displacement. Their results demonstrate that increasing the number of wings does not invariably enhance pile uplift resistance. Regarding pile groups, Nasr et al. [
16], Faizi et al. [
17], and Galvis-Castro et al. [
18] performed theoretical and experimental studies on single piles and pile groups embedded in sand, investigating the influence of parameters such as pile cross-sectional shape, pile diameter, sand relative density, embedment ratio, and spacing-to-diameter ratio on uplift capacity. Building upon this foundation, Emirler et al. [
19] examined the failure mechanisms of pile groups and pile-soil-pile interactions under varying pile cross-sectional shapes, embedment ratios, and spacing-to-diameter ratios.
However, neglecting the horizontal load component poses significant safety risks to foundations, making laboratory model tests investigating pile bearing behavior and failure modes under inclined loading a well-established research focus [
20,
21,
22]. Wang et al. [
23] conducted model tests on rock-socketed piles under combined axial-inclined loading, revealing that uplift resistance under inclined loading is significantly lower than under vertical loading, with load–displacement curves exhibiting brittle failure. During inclined tensile loading, soil adjacent to the loaded side remains compressed while the opposite side experiences tension. At ultimate limit state, failure consistently initiates in the soil zone on the loaded side, manifesting as a fan-shaped failure surface at ground level that expands with increasing loading angle, though ultimate bearing capacity decreases [
24]. To better predict soil deformation around piles, Li et al. [
25,
26,
27] proposed an energy-based variational method for large-diameter deep foundations (caissons or monopiles) under lateral loading. Huang et al. [
28], Santiago et al. [
29], and Fu et al. [
30] analyzed pile response under inclined loading through centrifuge modeling, while Singh et al. [
31], Johnson et al. [
32], and Ran et al. [
33] performed numerical analyses of bearing characteristics under such conditions. The aforementioned research mainly focuses on the influence characteristics of the horizontal component on pile-soil interaction and the failure modes when oblique loading is applied at the pile top. It provides research accumulation and references for understanding the pile-soil interaction and deformation characteristics under cable-stayed loads. However, whether this research conclusion is applicable when the loading point is located at a certain depth of the pile shaft is not only open to debate but also of great significance.
In the aforementioned studies, loading was applied at the pile head. However, for anchor piles, anchor chains are always connected along the pile shaft to provide enhanced tensile resistance. Ramadan et al. [
34] employed centrifuge testing to investigate the mechanical behavior of offshore anchor piles under anchor forces in dense saturated sand. Gui et al. [
35] conducted laboratory tests to examine the effects of loading angle, pile diameter, embedment depth, and pile type on the tensile bearing behavior of anchor piles in clay. Luo et al. [
36] performed a series of centrifuge model tests on anchor piles under inclined pullout loading, revealing that failure consistently initiates in the loaded-side soil zone at ultimate limit state, manifesting as a fan-shaped failure surface at ground level. As the loading angle increases, horizontal translation of the pile and soil deformation become more pronounced, while tensile bearing capacity improves.
Although the above research has conducted a relatively in-depth discussion on the influence of different loading angles, burial depths, pile diameters and other factors on anchor piles, there are relatively few explorations on the influence of different loading point positions and different sand and soil conditions. Therefore, it is of great significance to study the influence of different loading point positions and different loading angles on the bearing characteristics of flexible pile-anchor foundations in dry and saturated sand. The research results of Sheikhtaheri et al. [
37] and Al-Khazaali [
38] show that the bearing characteristics of a single pile in saturated sand are the lowest, indicating that the bearing characteristics of the pile decrease with the increase in saturation, which is consistent with the law found in this paper.
Unlike conventional jack or weight loading methods, this study employs a self-developed servo-controlled loading system to investigate the effects of inclined loading angles, loading depths, and sand conditions on the bearing performance of pile-anchor foundations. For the pile-anchor foundations with floating wind turbines as the background, unlike the traditional pile foundation which is loaded at the top of the pile, this study sets up four anchor points at the pile body position for inclined tension loading, simulating the loading characteristics of the pile-anchor foundations in sandy soil under the inclined tension of the anchor chain, and revealing the force mode and failure mechanism at different anchor points. Analyze the differences in the bearing characteristics of single-pile models under different sandy soil conditions.
3. Analysis of Bearing Characteristics of Pile-Anchor Foundations
3.1. Inclined Loading Test on Single-Pile Model
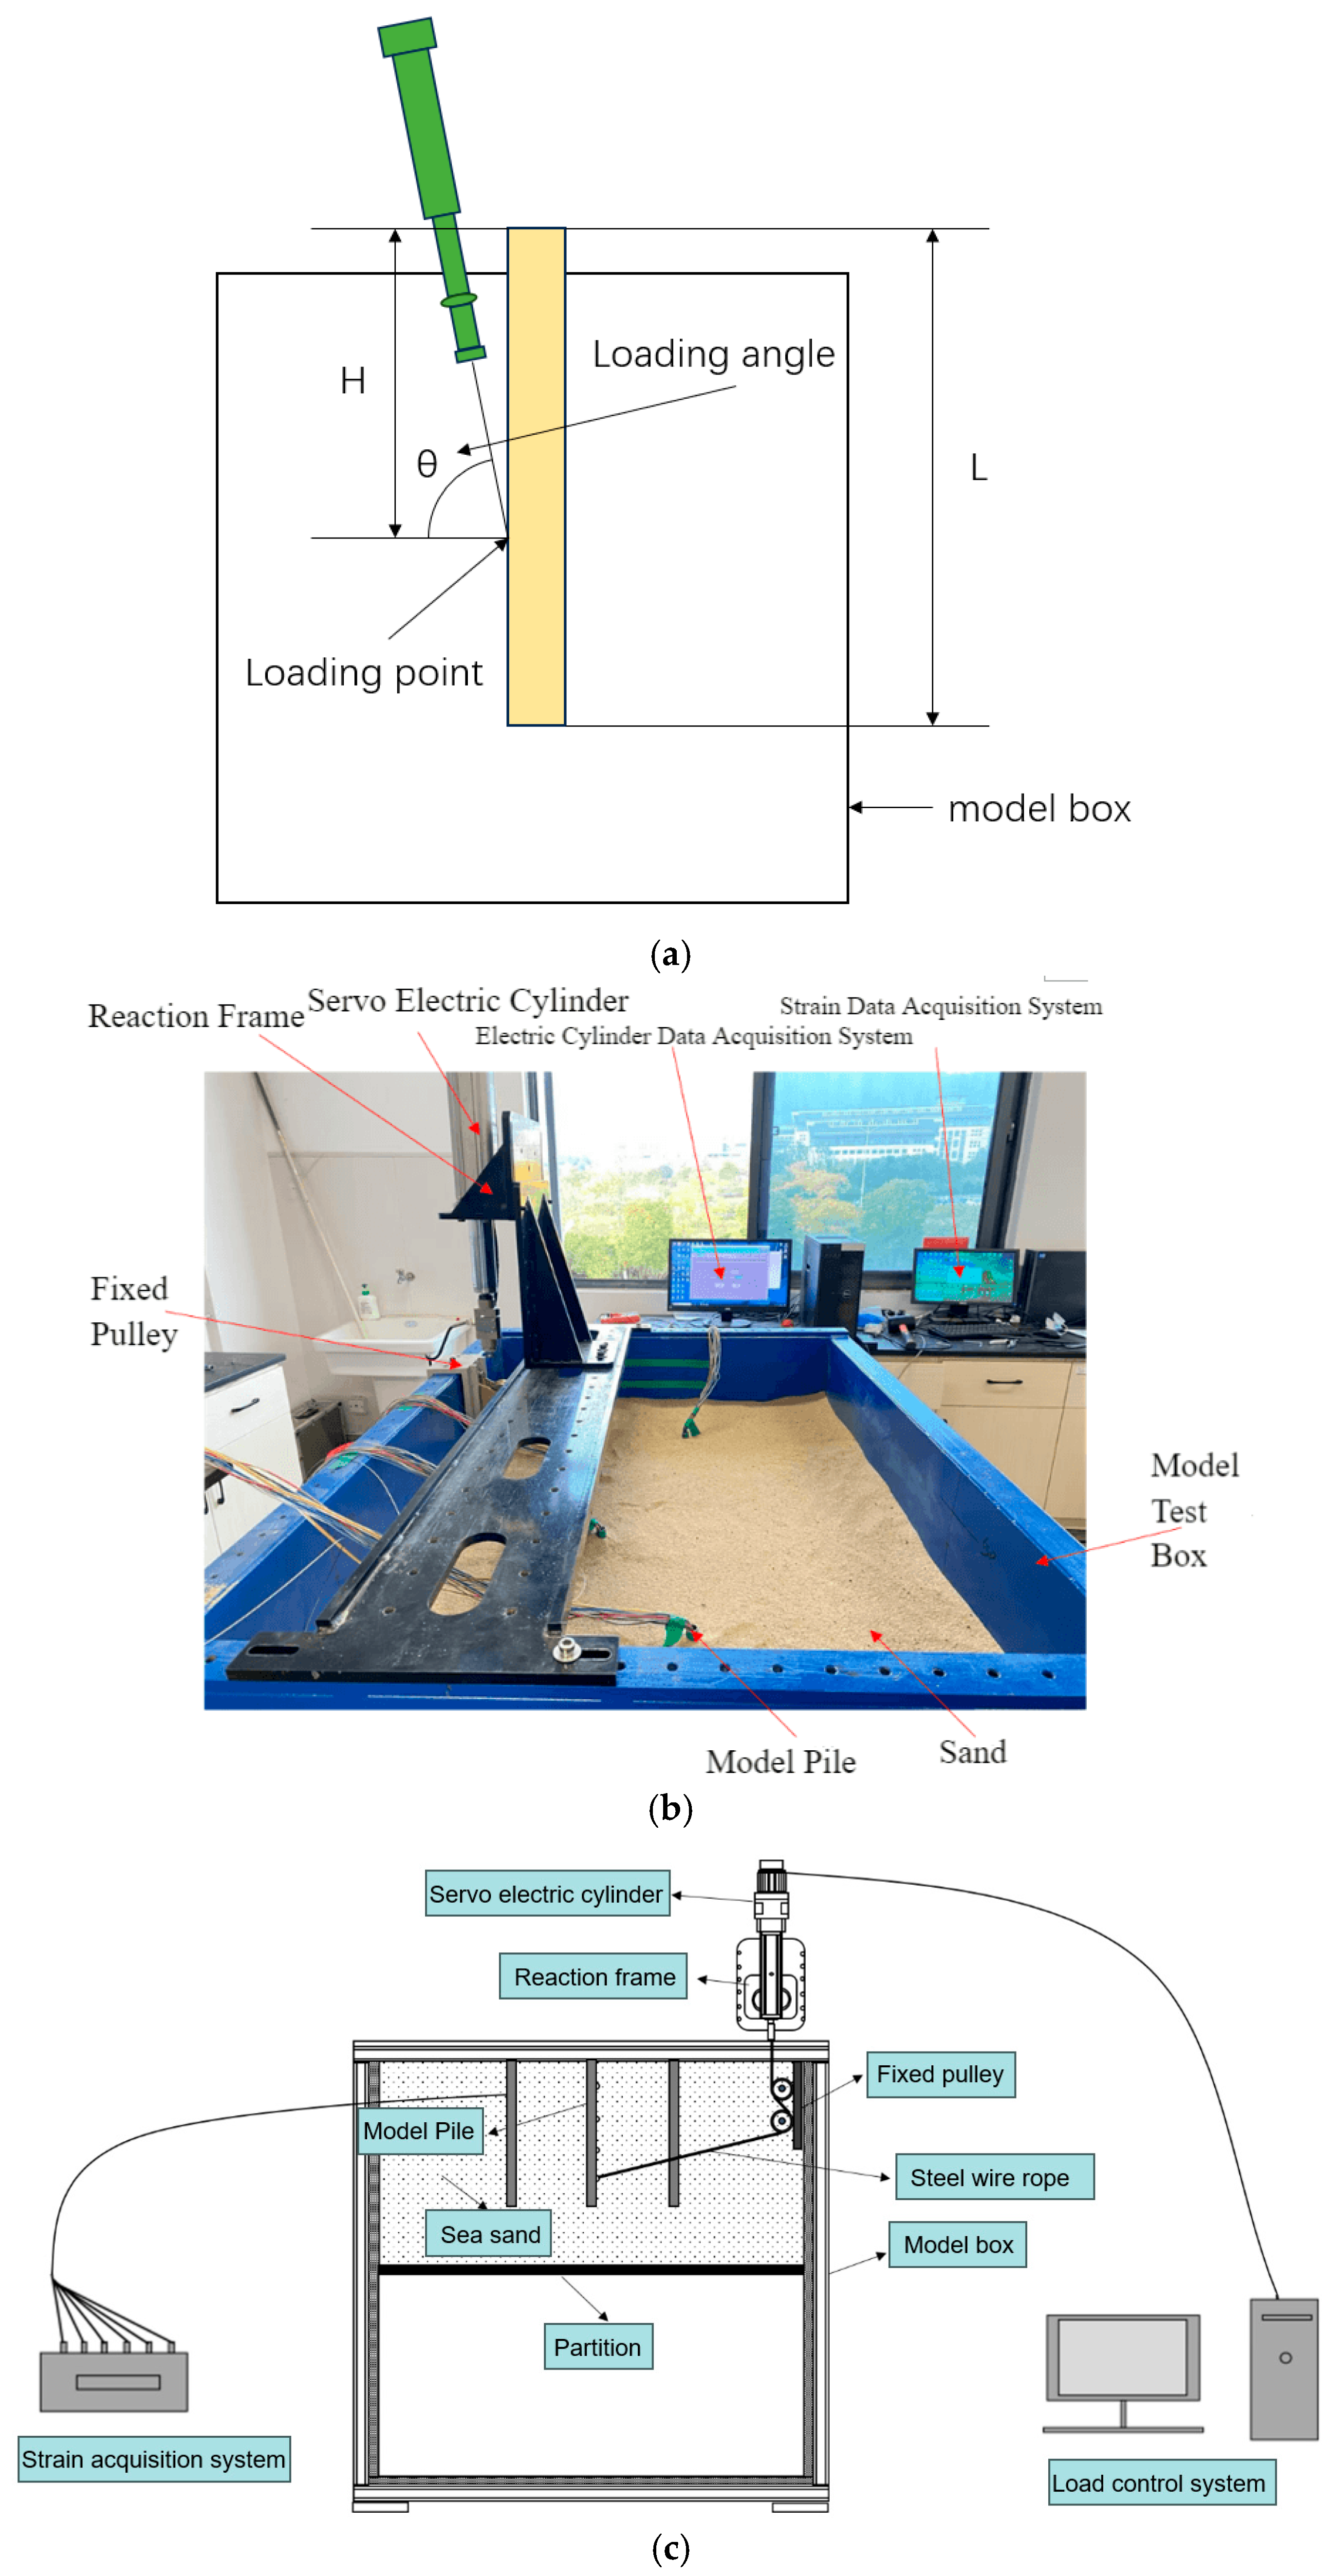
The inclined tensile loading tests for pile-anchor foundations focused on loading angles and depths as primary variables, with model tests configured at three angles (θ = 30°, 45°, and 60°, defined as the inclination between the steel wire rope and the horizontal plane of the sand foundation) and four loading depths per angle (H = 0.22L, 0.41L, 0.59L, and 0.78L). Given the complexity of shaft-loaded pile experiments and scarce reference data, multiple identical aluminum tube model piles (diameter D = 1.2 cm, length L = 32 cm, wall thickness t = 0.06 cm) were fabricated for batch testing across these parametric combinations.
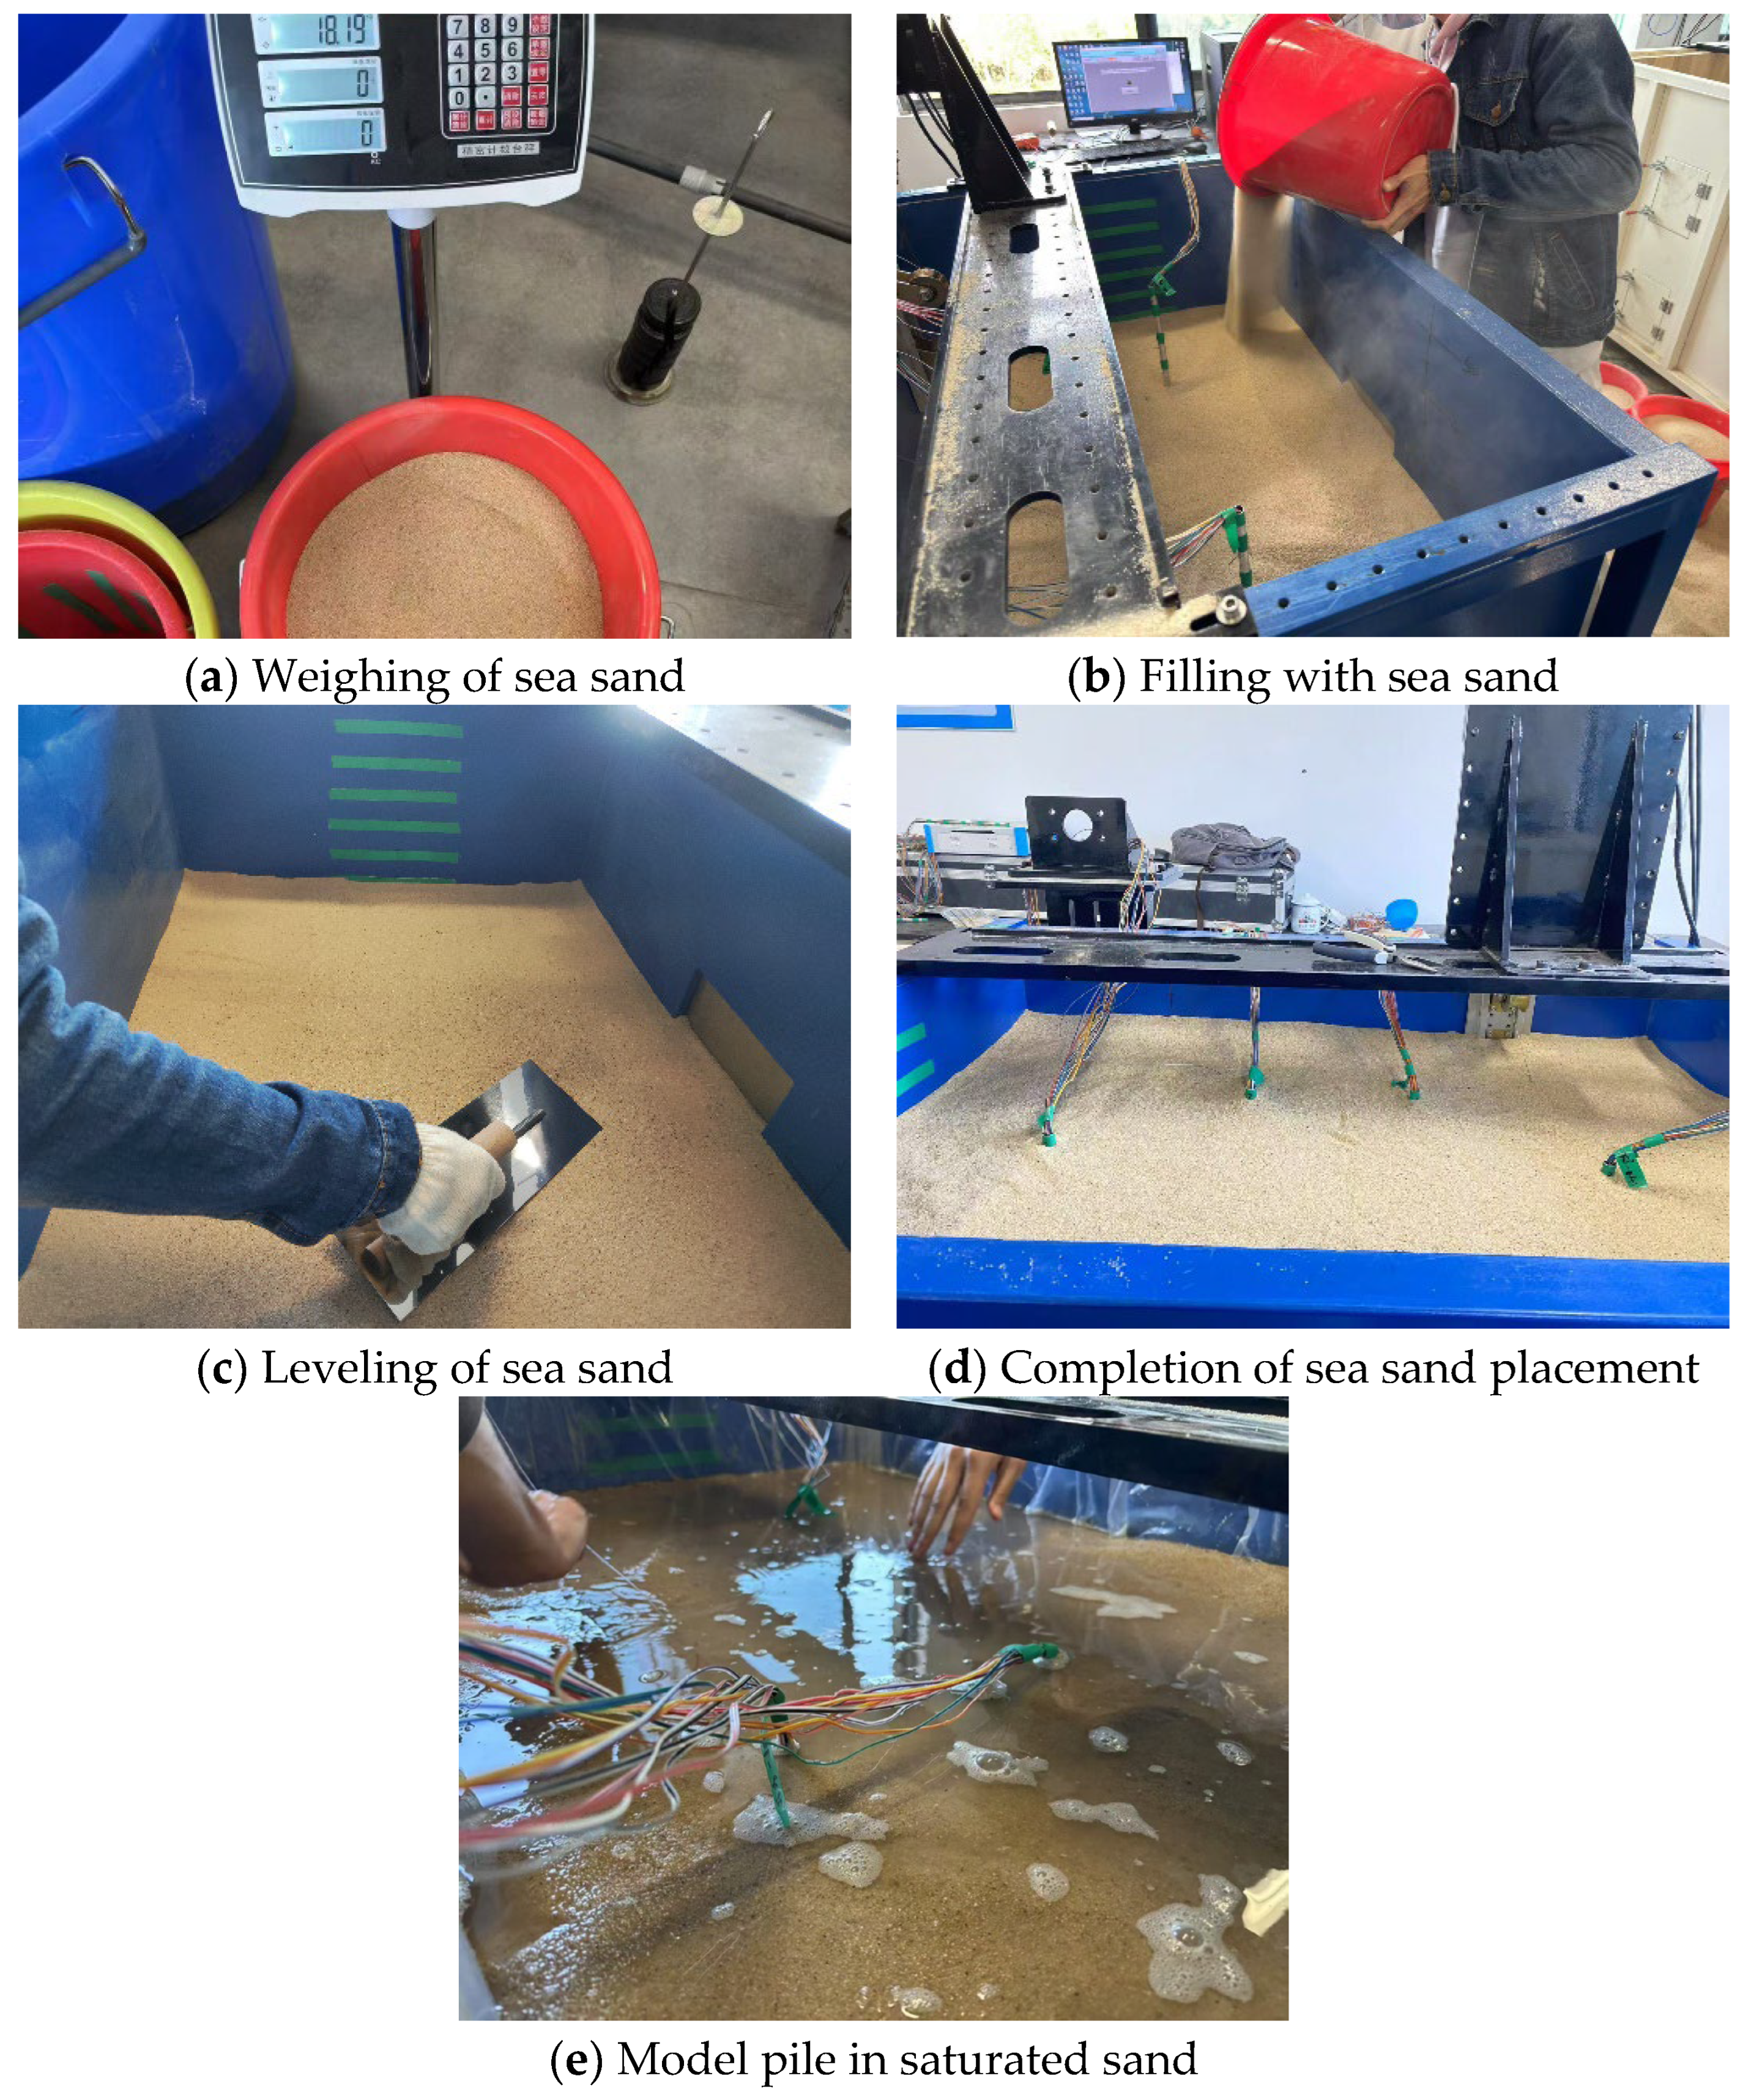
To ensure the consistency of the soil layer, batch inclined tensile loading tests were conducted on model piles, guaranteeing equal volume and mass for each soil layer according to the layered filling method. Inclined tensile loading tests on single-pile models under dry sand conditions were carried out in three batches. The first batch featured a loading angle of 30°, with four model piles loaded at different depths: H = 0.22L, H = 0.41L, H = 0.59L, and H = 0.78L. The steel wire rope was tensioned via fixed pulleys, and its angle was measured using an electronic inclinometer. The planar position of the model pile relative to the marine sand foundation soil was continuously adjusted until the angle reached approximately 30°. The actuator was then adjusted to 90° and positioned directly above the fixed pulley. The steel wire rope was connected to the actuator connector and clamped securely with aluminum sleeves. Finally, marine sand was placed using the layered filling method. After curing, the pile body strain gauge sensors were connected to the strain acquisition instrument. The instrument was used to conduct resistance testing on the strain gauges. After confirming no errors, the strain acquisition system and actuator loading system were debugged and prepared. Loading and data acquisition commenced after debugging completion. The second and third batches featured loading angles of 45° and 60°, respectively, with the steel wire rope directly connected and tensioned to the servo actuator. The loading angle was measured using the electronic inclinometer, and the planar positions of the model pile, reaction frame backplate, and transverse plate were continuously adjusted to satisfy the requirements for angular loading and boundary conditions. Finally, similarly, marine sand was placed using the layered filling method. After curing, the pile body strain gauge sensors were connected to the strain acquisition instrument. The instrument was used to conduct resistance testing on the strain gauges. After confirming no errors, the strain acquisition system and actuator loading system were debugged and prepared. Loading and data acquisition commenced after debugging completion.
For saturated sand condition tests on single-pile models, three piles at different angles were tested simultaneously in one batch. The first pile was loaded at 30°: the steel wire rope was tensioned via fixed pulleys for load direction change, with its angle measured by an electronic inclinometer. The planar position of the pile relative to the marine sand foundation soil was continuously adjusted until reaching around 30°, thus finalizing its position. The second and third piles were loaded at 45° and 60°, respectively, requiring continuous adjustments to the positions of the piles, reaction frame backplates, and transverse plates to achieve target angles. After positioning all piles, layered placement of marine sand commenced. Post-placement curing was followed by uniform water injection along the container walls using a water pipe. Watering ceased when all air bubbles were expelled from the sand and the water level exceeded the sand surface elevation, after which the system cured for 24 h. Finally, pile strain gauges were connected to the acquisition instrument, resistance was verified, the strain acquisition and actuator systems were synchronized, and loading with data collection proceeded post-calibration.
For single-pile model testing under saturated sand conditions, three piles at different loading angles were completed simultaneously in one batch. The first model pile was loaded at 30°: the steel wire rope was redirected via fixed pulleys and tensioned, with its angle measured using an electronic inclinometer. The planar position of the pile relative to the marine sand foundation soil was continuously adjusted until reaching ≈30°, thus finalizing its position. The second and third piles were loaded at 45° and 60°, respectively, requiring continuous adjustments to the positions of the model piles, reaction frame backplates, and transverse plates to achieve the target loading angles. After positioning all piles, layered placement of marine sand was performed. Following placement, the system underwent curing, after which uniform water injection was applied along the container walls via water pipe until all air bubbles were expelled from the sand and the water level exceeded the sand surface elevation. Watering was then ceased for a 24 h equilibration period. Finally, pile strain gauges were connected to the strain acquisition instrument, resistance was verified, the strain acquisition system and actuator loading system were debugged and synchronized, and loading with data collection commenced post-calibration.
The load–displacement curves, representing the resultant forces and displacements at the loading points, were recorded in real-time by the servo actuator acquisition system. The internal force distribution within the model piles was obtained through real-time strain measurements at designated pile locations via the strain acquisition system. The detailed experimental workflow is illustrated in
Figure 5 and
Figure 6 below.
3.2. Load–Displacement Curve of Pile-Anchor Foundations
3.2.1. Load–Displacement Curve of Pile-Anchor Foundations in Dry Sand Condition
The pile-anchor foundations had an embedment depth of 32 cm, with loading angles of 30°, 45°, and 60°, and loading depths at
H = 0.22
L,
H = 0.41
L,
H = 0.59
L, and
H = 0.78
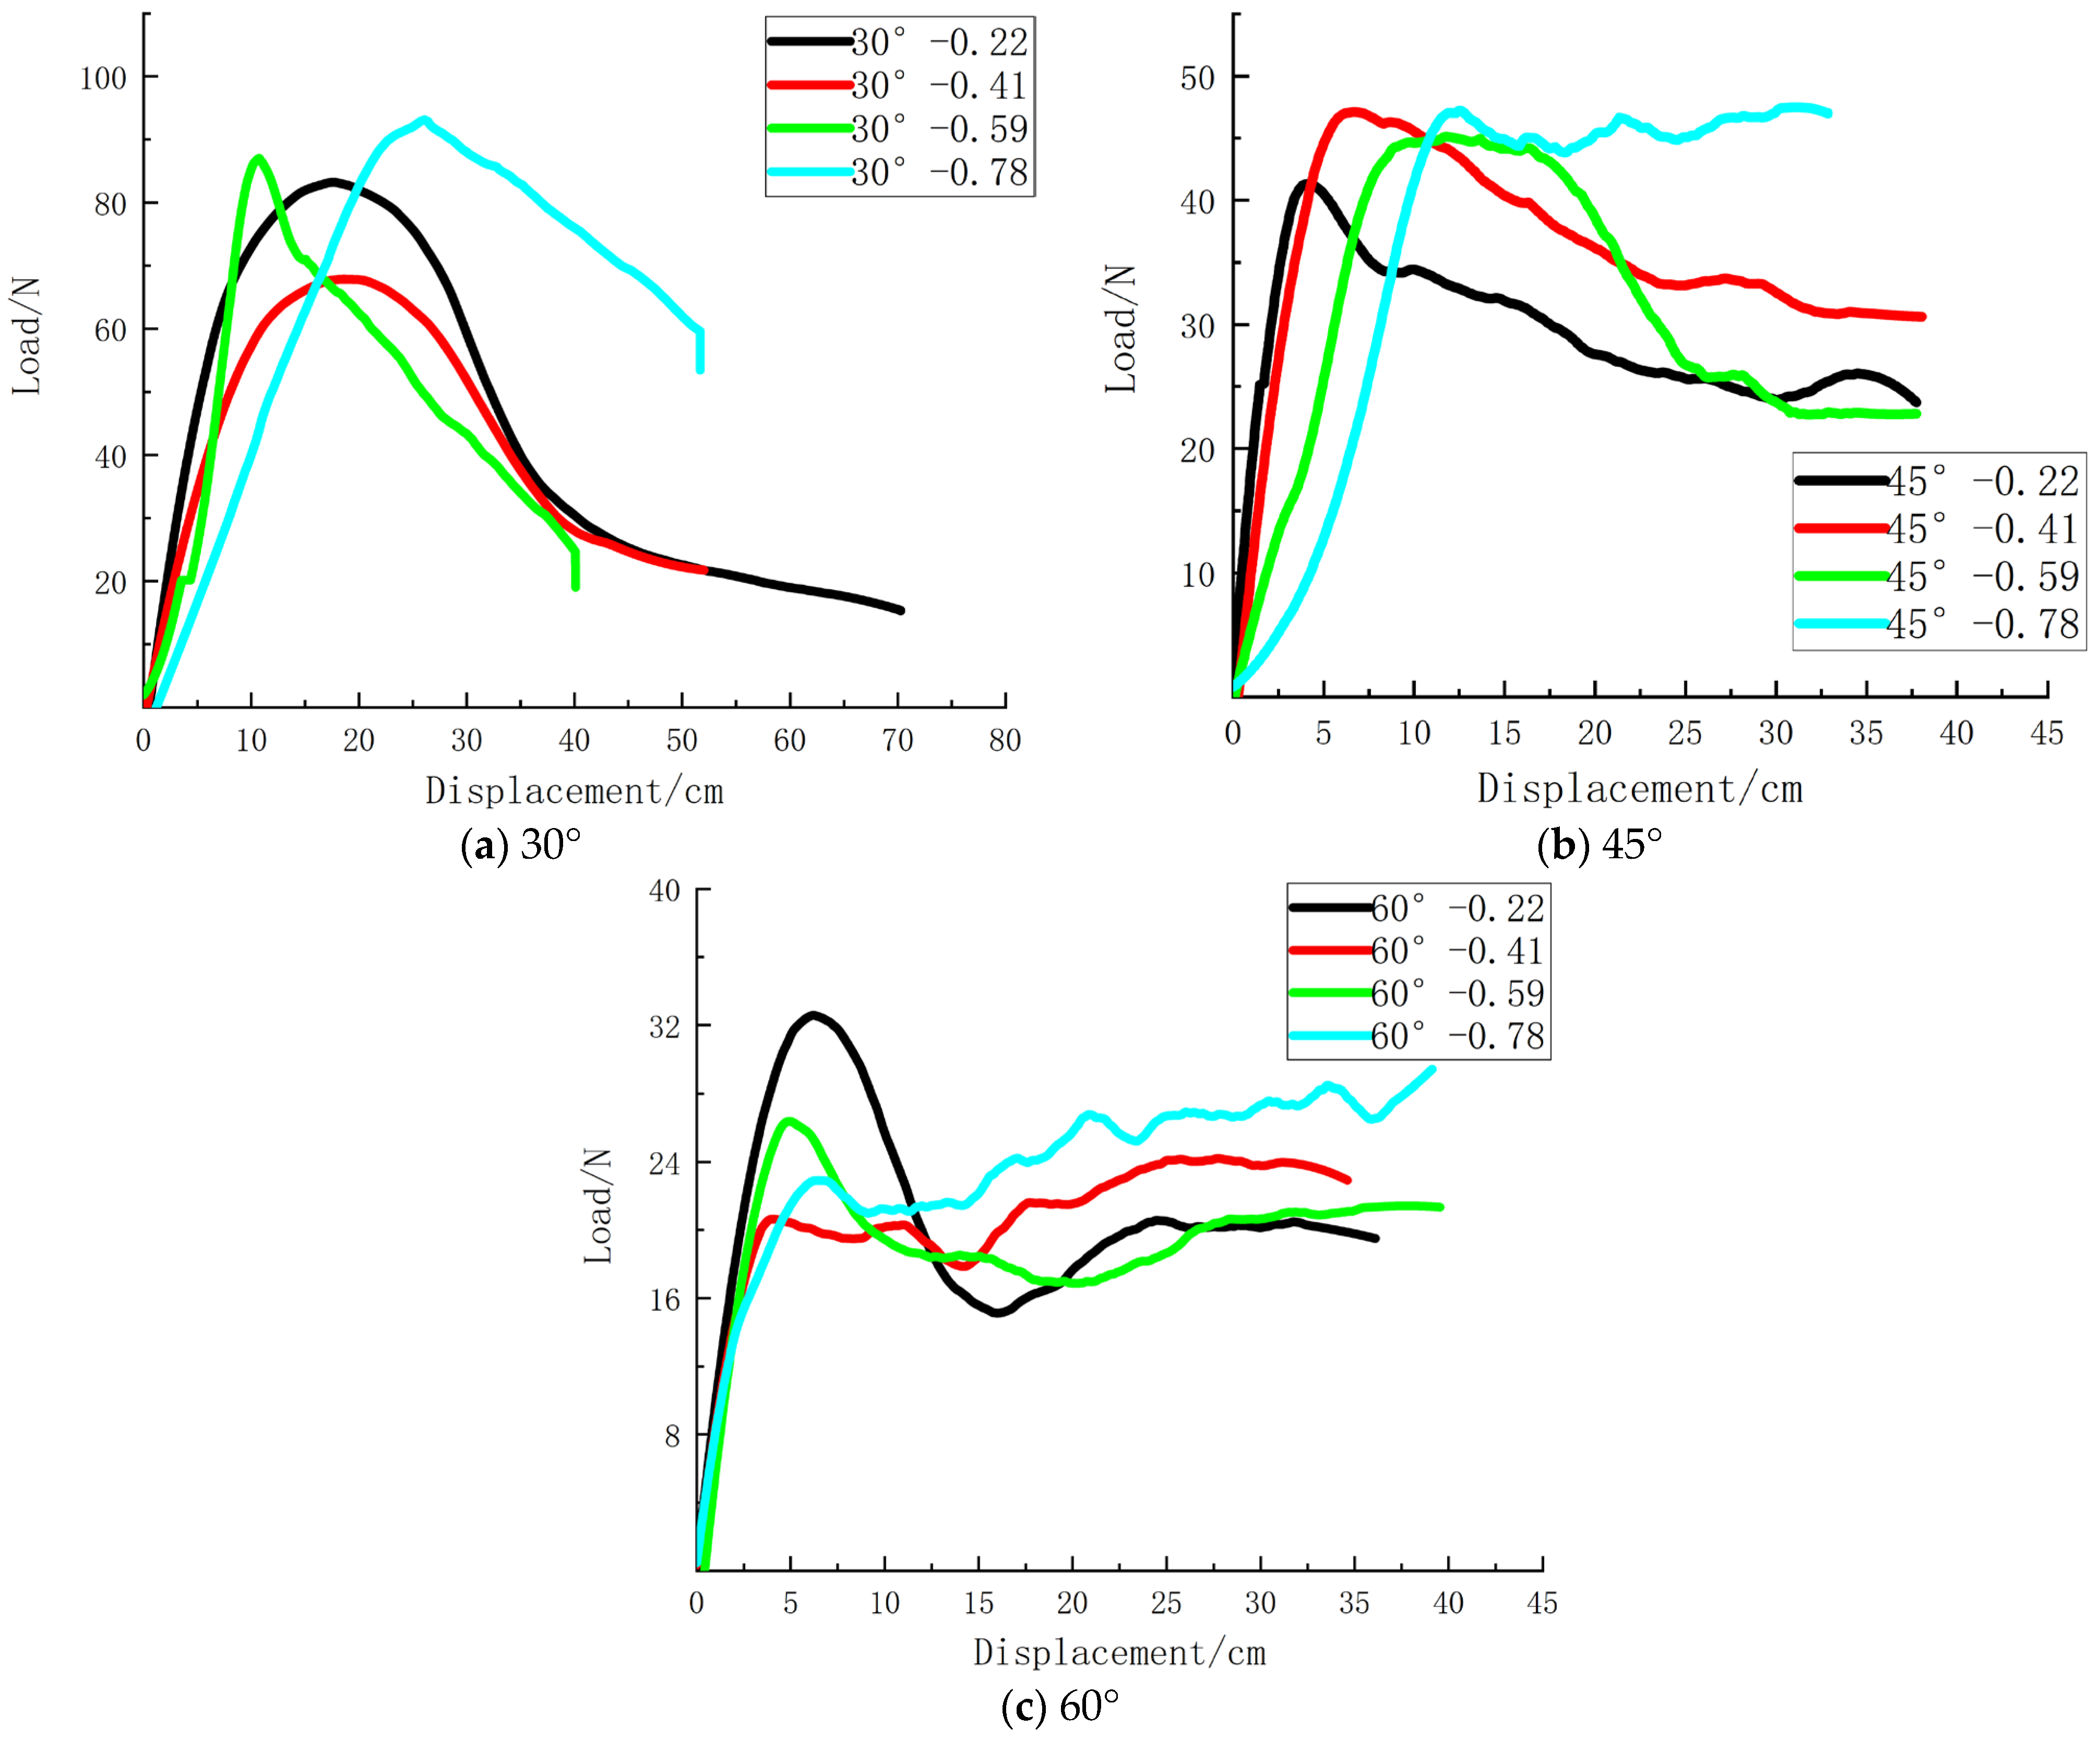
L. Displacement-controlled loading was applied to the model piles by setting an initial minimal actuator displacement to reserve retraction margin for capturing the complete failure process. During loading, the load values were measured by a load cell at the servo actuator connection while displacements at the pile loading point were equated to actuator displacement due to kinematic consistency. The resulting load–displacement curves for model piles in dry sand are presented in
Figure 7 below.
Analysis of the load–displacement curves in
Figure 7 across varying loading depths and angles reveals the following behavioral patterns:
(1) From
Figure 7 as a whole, it can be observed that when the model piles undergo cable-stayed loading at the pile shaft position in the marine sand foundation, as the loading depth continues to increase, the slope of the load–displacement curve gradually decreases. All model piles reach the peak bearing capacity within a certain period of time, followed by a decline segment, and after the decline segment, the curve gradually tends to stabilize. The phenomenon may be attributed to the fact that the marine sand foundation is relatively loose, causing the model piles to exhibit a certain amount of rotation during the loading process. The end of this rotation corresponds to the residual strength in the latter stage of the bearing capacity, which is a distinct characteristic that distinguishes this loading method from traditional jack or weight loading.
Qpeak and
Qres of the model pile are shown in
Table 3.
(2) It is not difficult to see from
Figure 7 that when the loading angle is 30°, the ultimate bearing capacity of all model piles is relatively high. As the angle increases, the ultimate bearing capacity of the pile foundation decreases to a certain extent. This may be attributed to the fact that during the final stage of this test, the failure mode of the pile foundation was consistently pullout failure, which is controlled by vertical loads. However, the pullout failure also varies with the increase in loading depth. Specifically, the smaller the loading depth, the greater the rotation amount of the model pile and the larger the inclination angle at the top of the pile foundation. In the first half of the loading process, the ultimate bearing capacity of the pile foundation is mainly governed by horizontal loads; in the second half, it is gradually dominated by vertical loads. Therefore, the peak bearing capacity in the first half shows a significant difference due to varying angles, while the difference in residual strength in the second half is not significant. By comparing the three figures above, respectively, it can be seen that in the second half after reaching the ultimate bearing capacity, as the angle increases, the slope of the load–displacement curve also increases. This is because the model piles with a low angle encounter greater soil resistance when pulled out and destroyed, but for large angles, the soil resistance can be said to be very small.
(3) Analysis of
Figure 7 reveals distinct bearing capacity characteristics across loading angles: Under smaller loading angles, ultimate capacity is higher when loaded deeper along the pile shaft, likely due to denser soil providing greater soil resistance at lower depths. Conversely, mid-shaft loading induces disturbance-induced loosening of surrounding soil, reducing capacity. At moderate angles, overall capacity stabilizes moderately, with deeper loading points exhibiting higher capacities and shallower points showing lower values, accompanied by significantly different residual strengths. For larger angles, the system demonstrates reduced global capacity with a unique ductile-like response: load–displacement curves initially peak, then decline before rising again to stabilize at ultimate capacity—indicating progressive soil reconsolidation and pile realignment mechanisms.
3.2.2. Load–Displacement Curve of Pile-Anchor Foundations in Saturated Sand Condition
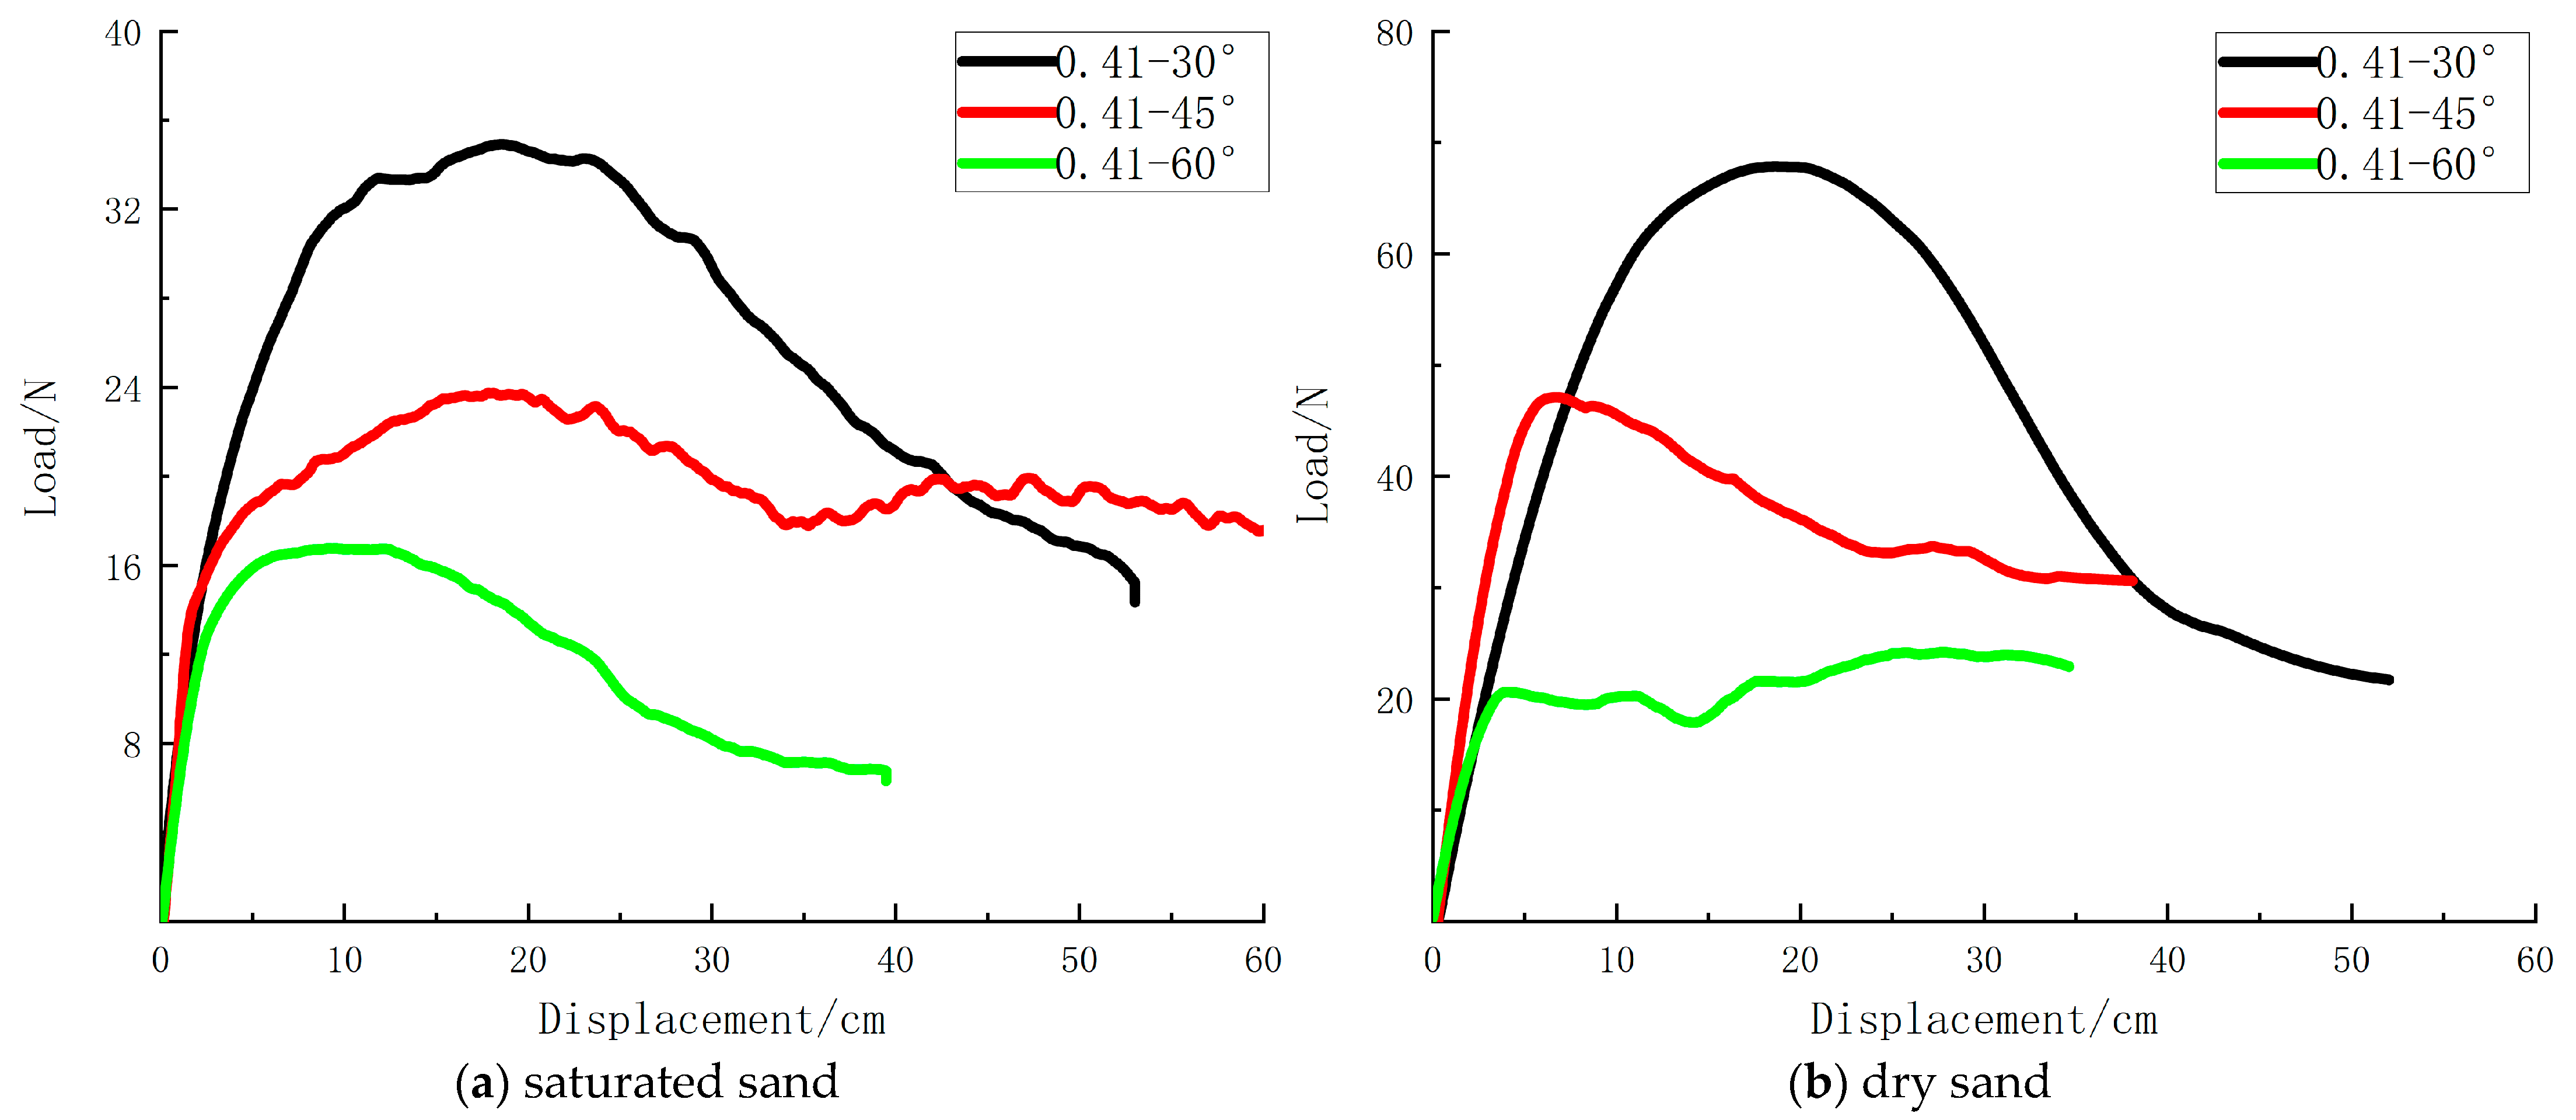
In saturated sand conditions, inclined tensile loading tests were conducted at loading depth H = 0.41L with angles of 30°, 45°, and 60°. Identical loading protocols and data processing methods as those in dry sand were employed. The resulting load–displacement curves for saturated sand are presented below, alongside a comparative analysis with corresponding dry sand curves.
By comparing the load–displacement curves of saturated sand and dry sand, the following rules can be found:
(1) Looking at
Figure 8 as a whole, the variation law of the bearing characteristics under saturated sand conditions is consistent with that under dry sand conditions, that is: the ultimate bearing capacity of the model pile in the inclined anchor-tension direction gradually decreases with the increase in the loading angle. Meanwhile, both first increase the bearing capacity to the peak as the anchor-tension displacement increases, and then decrease to a stable stage of bearing capacity reduction. However, compared with dry sand, it is found that the ultimate bearing capacity of pile-anchor foundations under saturated sand conditions is lower. This is because the effective specific gravity of sand soil decreases under saturated conditions, resulting in a reduction in the stiffness of pile-soil interaction resistance and ultimate resistance. The maximum bearing capacity
Qpeak of the model pile under saturated sand and dry sand conditions is shown in
Table 4 below. It can be seen from the table that the maximum bearing capacity of the model pile under saturated sand conditions is approximately only half of that under dry sand conditions, but this influence gradually weakens as the loading angle increases.
(2) It can be seen from 8a that under the condition of saturated sand, when the loading depth H = 0.41L and the loading angle is 30°, the bearing capacity is relatively high, with a peak bearing capacity of 35.7 N, and then rapidly drops to 15.7 N through a sliding section. When the loading angle is 45°, the bearing capacity decreases somewhat. The peak bearing capacity is 23.8 N. After a downward section, it gradually decreases to 18.7 N and then gradually rises to 20.5 N to reach stability. When the loading angle is 60°, the bearing capacity is relatively low, with a peak bearing capacity of 17.1 N, and then gradually decreases to 7.86 N after a downward section. This is because under the same loading depth conditions, the load components decomposed in the vertical and horizontal directions of the inclined anchor tension load vary with the Angle. When the inclined tension Angle is small, the vertical component load is smaller, while the horizontal bearing capacity of the model pile is higher, thus showing a stronger inclined anchor tension bearing capacity. When the diagonal tension Angle is large, the vertical component load is also significant. However, the pullout bearing capacity of the model pile is limited. Therefore, there may be pullout failure leading to overall diagonal anchor tension failure and showing a relatively low bearing performance.
3.3. Processing of Pile Bending Moment Results
3.3.1. Bending Moment Distribution Patterns at Various Loading Depths
By establishing the constitutive equation of material mechanics and coupling the strain difference with the geometric parameters of the cross-section and the elastic modulus, the bending moment value at a specific position of the pile body is derived:
To study the influence law of the loading point depth at the same loading angle, the bending moment at the maximum peak bearing capacity in
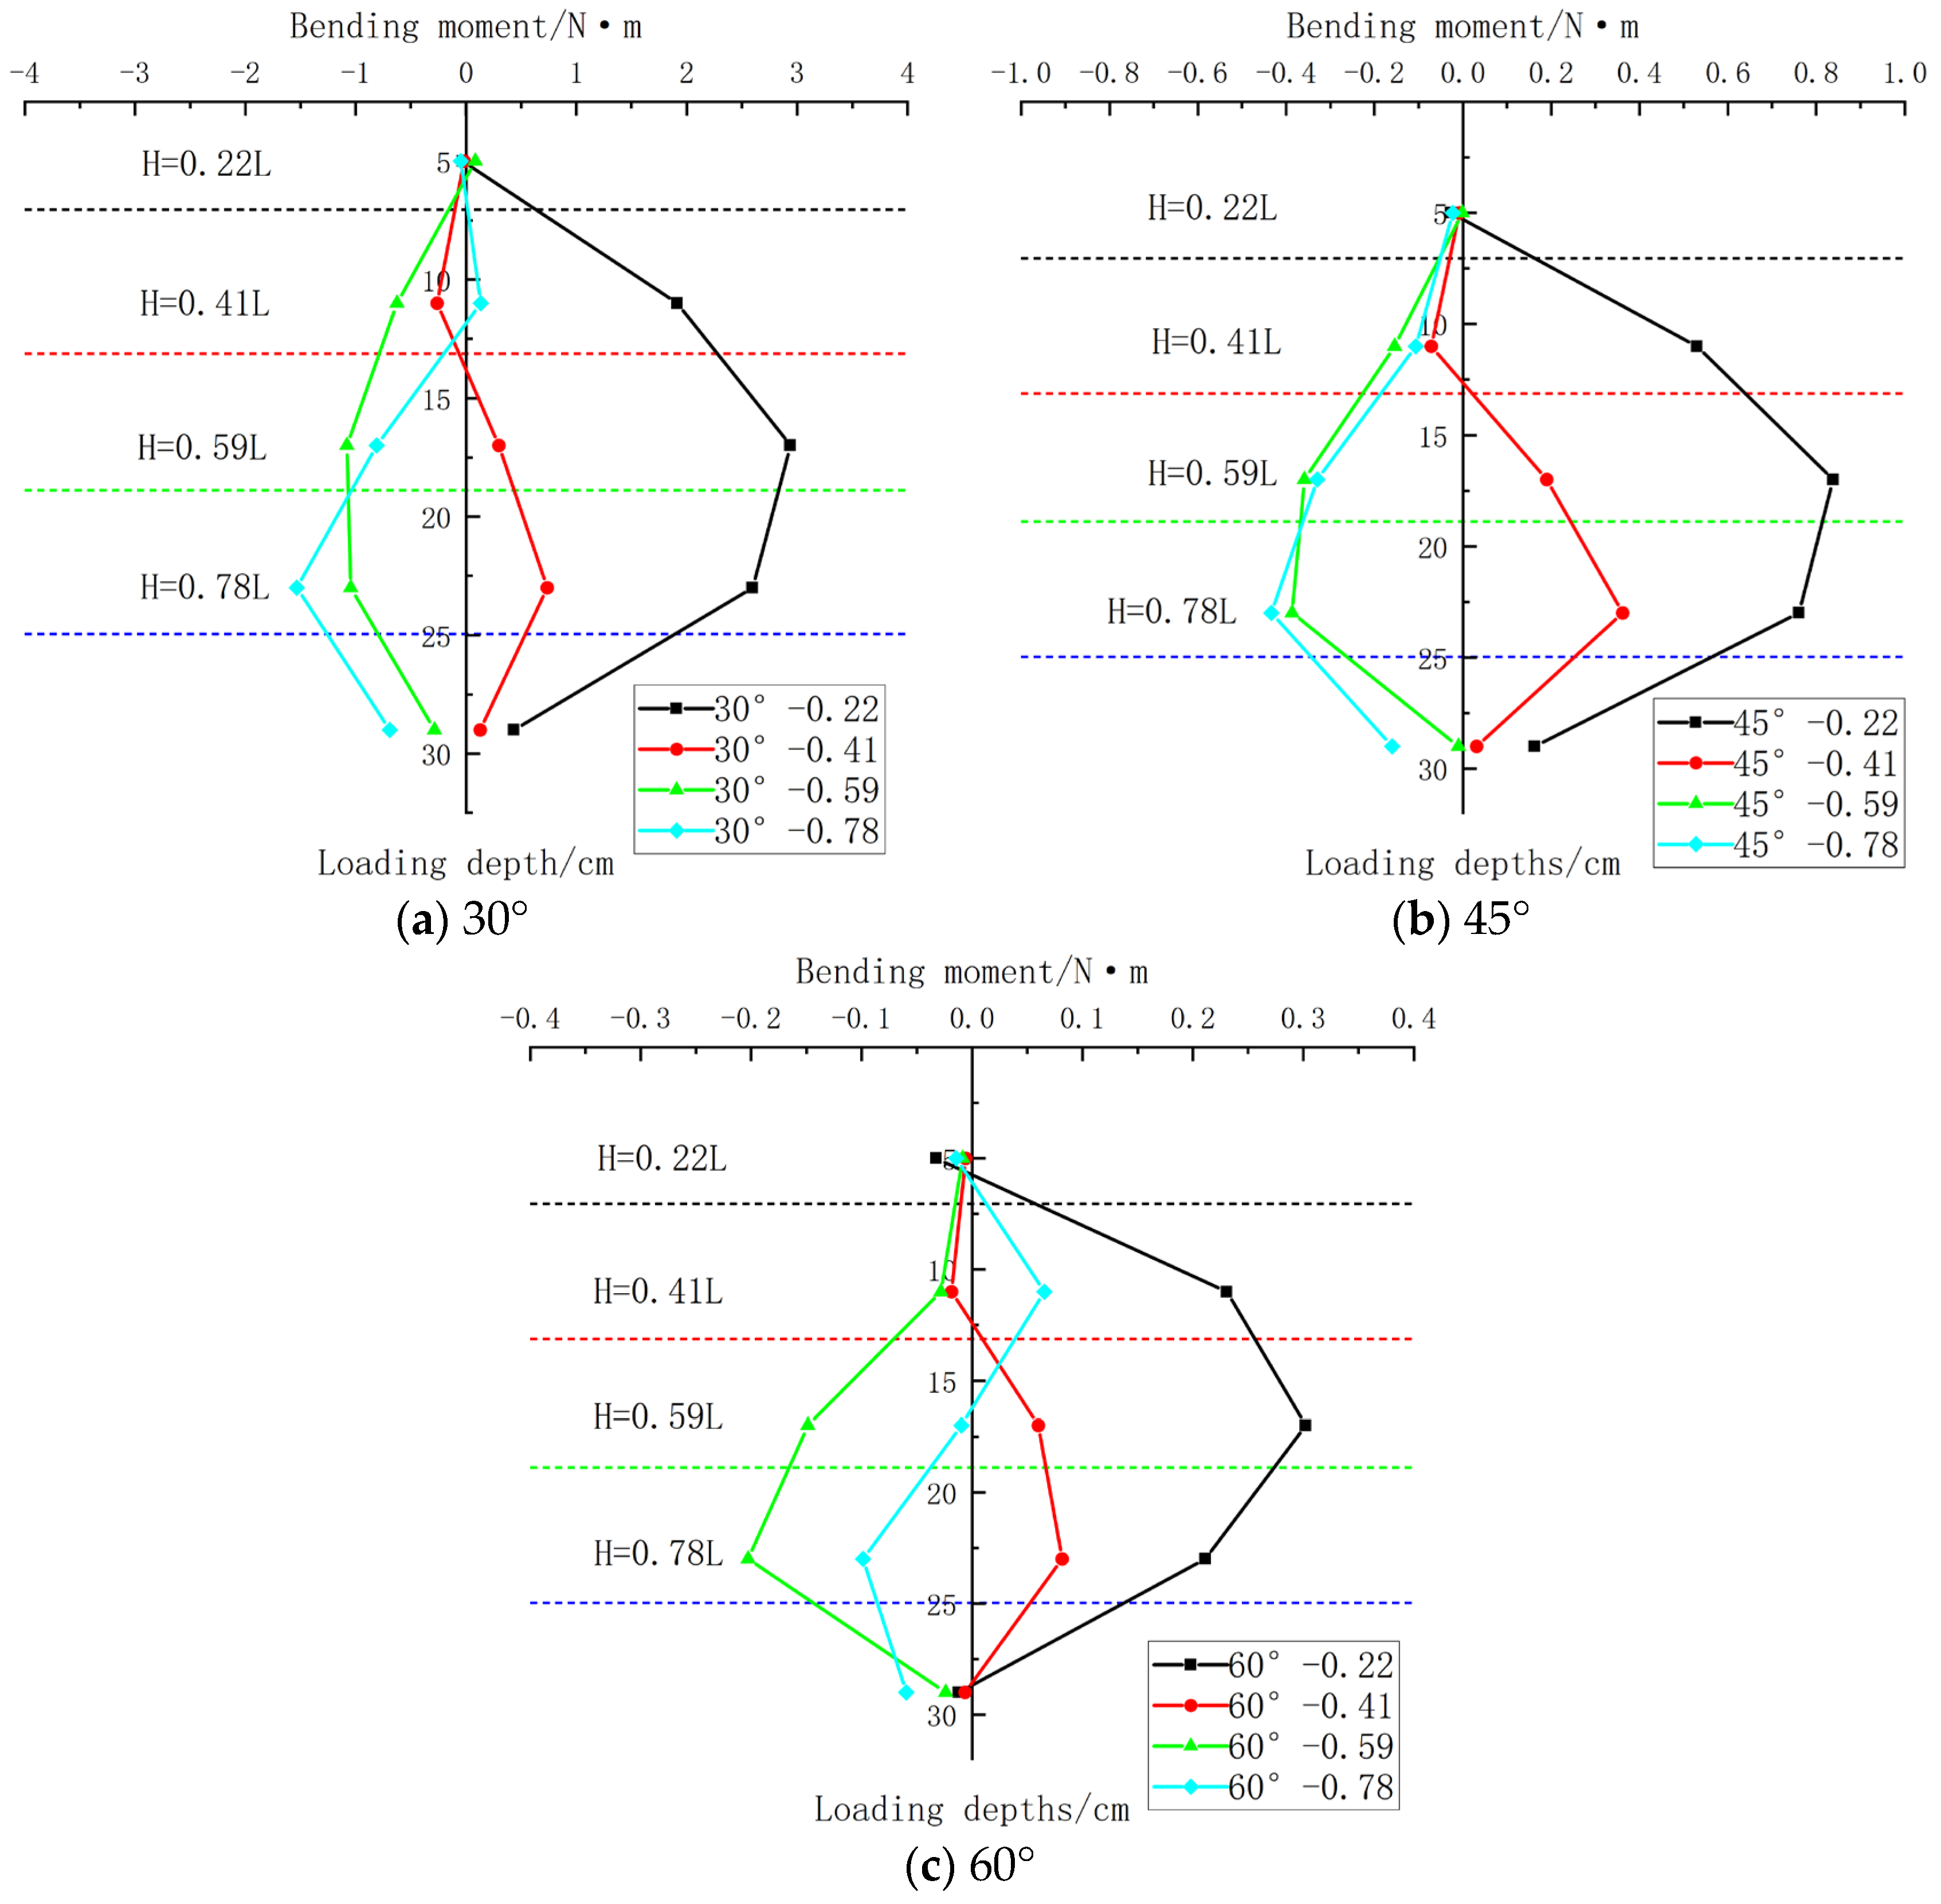
Figure 7 was selected for comparison. The initial data results were processed by applying the above Formula (1) to obtain the bending moment data. The relationship curves of the bending moment with the depth of the pile foundation at different loading depths were plotted as shown in
Figure 9.
As illustrated in
Figure 9, under the same inclined tension loading angle, the bending moment distribution pattern along the pile shaft varies significantly with the depth of the loading point. In contrast, when the loading point depth is fixed, the moment distribution patterns at different inclined tension loading angles are essentially similar, though the magnitude of the bending moment differs.
The variation in the bending moment distribution law is primarily driven by changes in the loading point depth. This is because the anchor tension load applies horizontal forces to both the upper pile segment (above the loading point) and the lower pile segment (below the loading point), thereby inducing corresponding bending moment responses. The specific differences are as follows:
(1) When the loading point is relatively shallow, the soil resistance acting on the upper pile segment is weaker, leading to a smaller negative bending moment. Meanwhile, the lower pile segment is buried deeper, resulting in a larger positive bending moment.
(2) As the loading point depth increases, the length of the upper pile segment extends, subjecting it to greater soil resistance and thus generating a larger negative bending moment. Conversely, the shortened length of the lower pile segment leads to a relatively smaller positive bending moment.
As the loading point moves from the pile top to the pile end, the bending moment distribution pattern along the pile shaft evolves gradually. Notably, the absolute value of the bending moment under deep loading conditions is smaller than that under shallow loading. This phenomenon is attributed to the superior resistance performance of deep foundation soil, which provides stronger lateral restraint compared to shallow soil.
3.3.2. Bending Moment Distribution Pattern Under Different Loading Angles
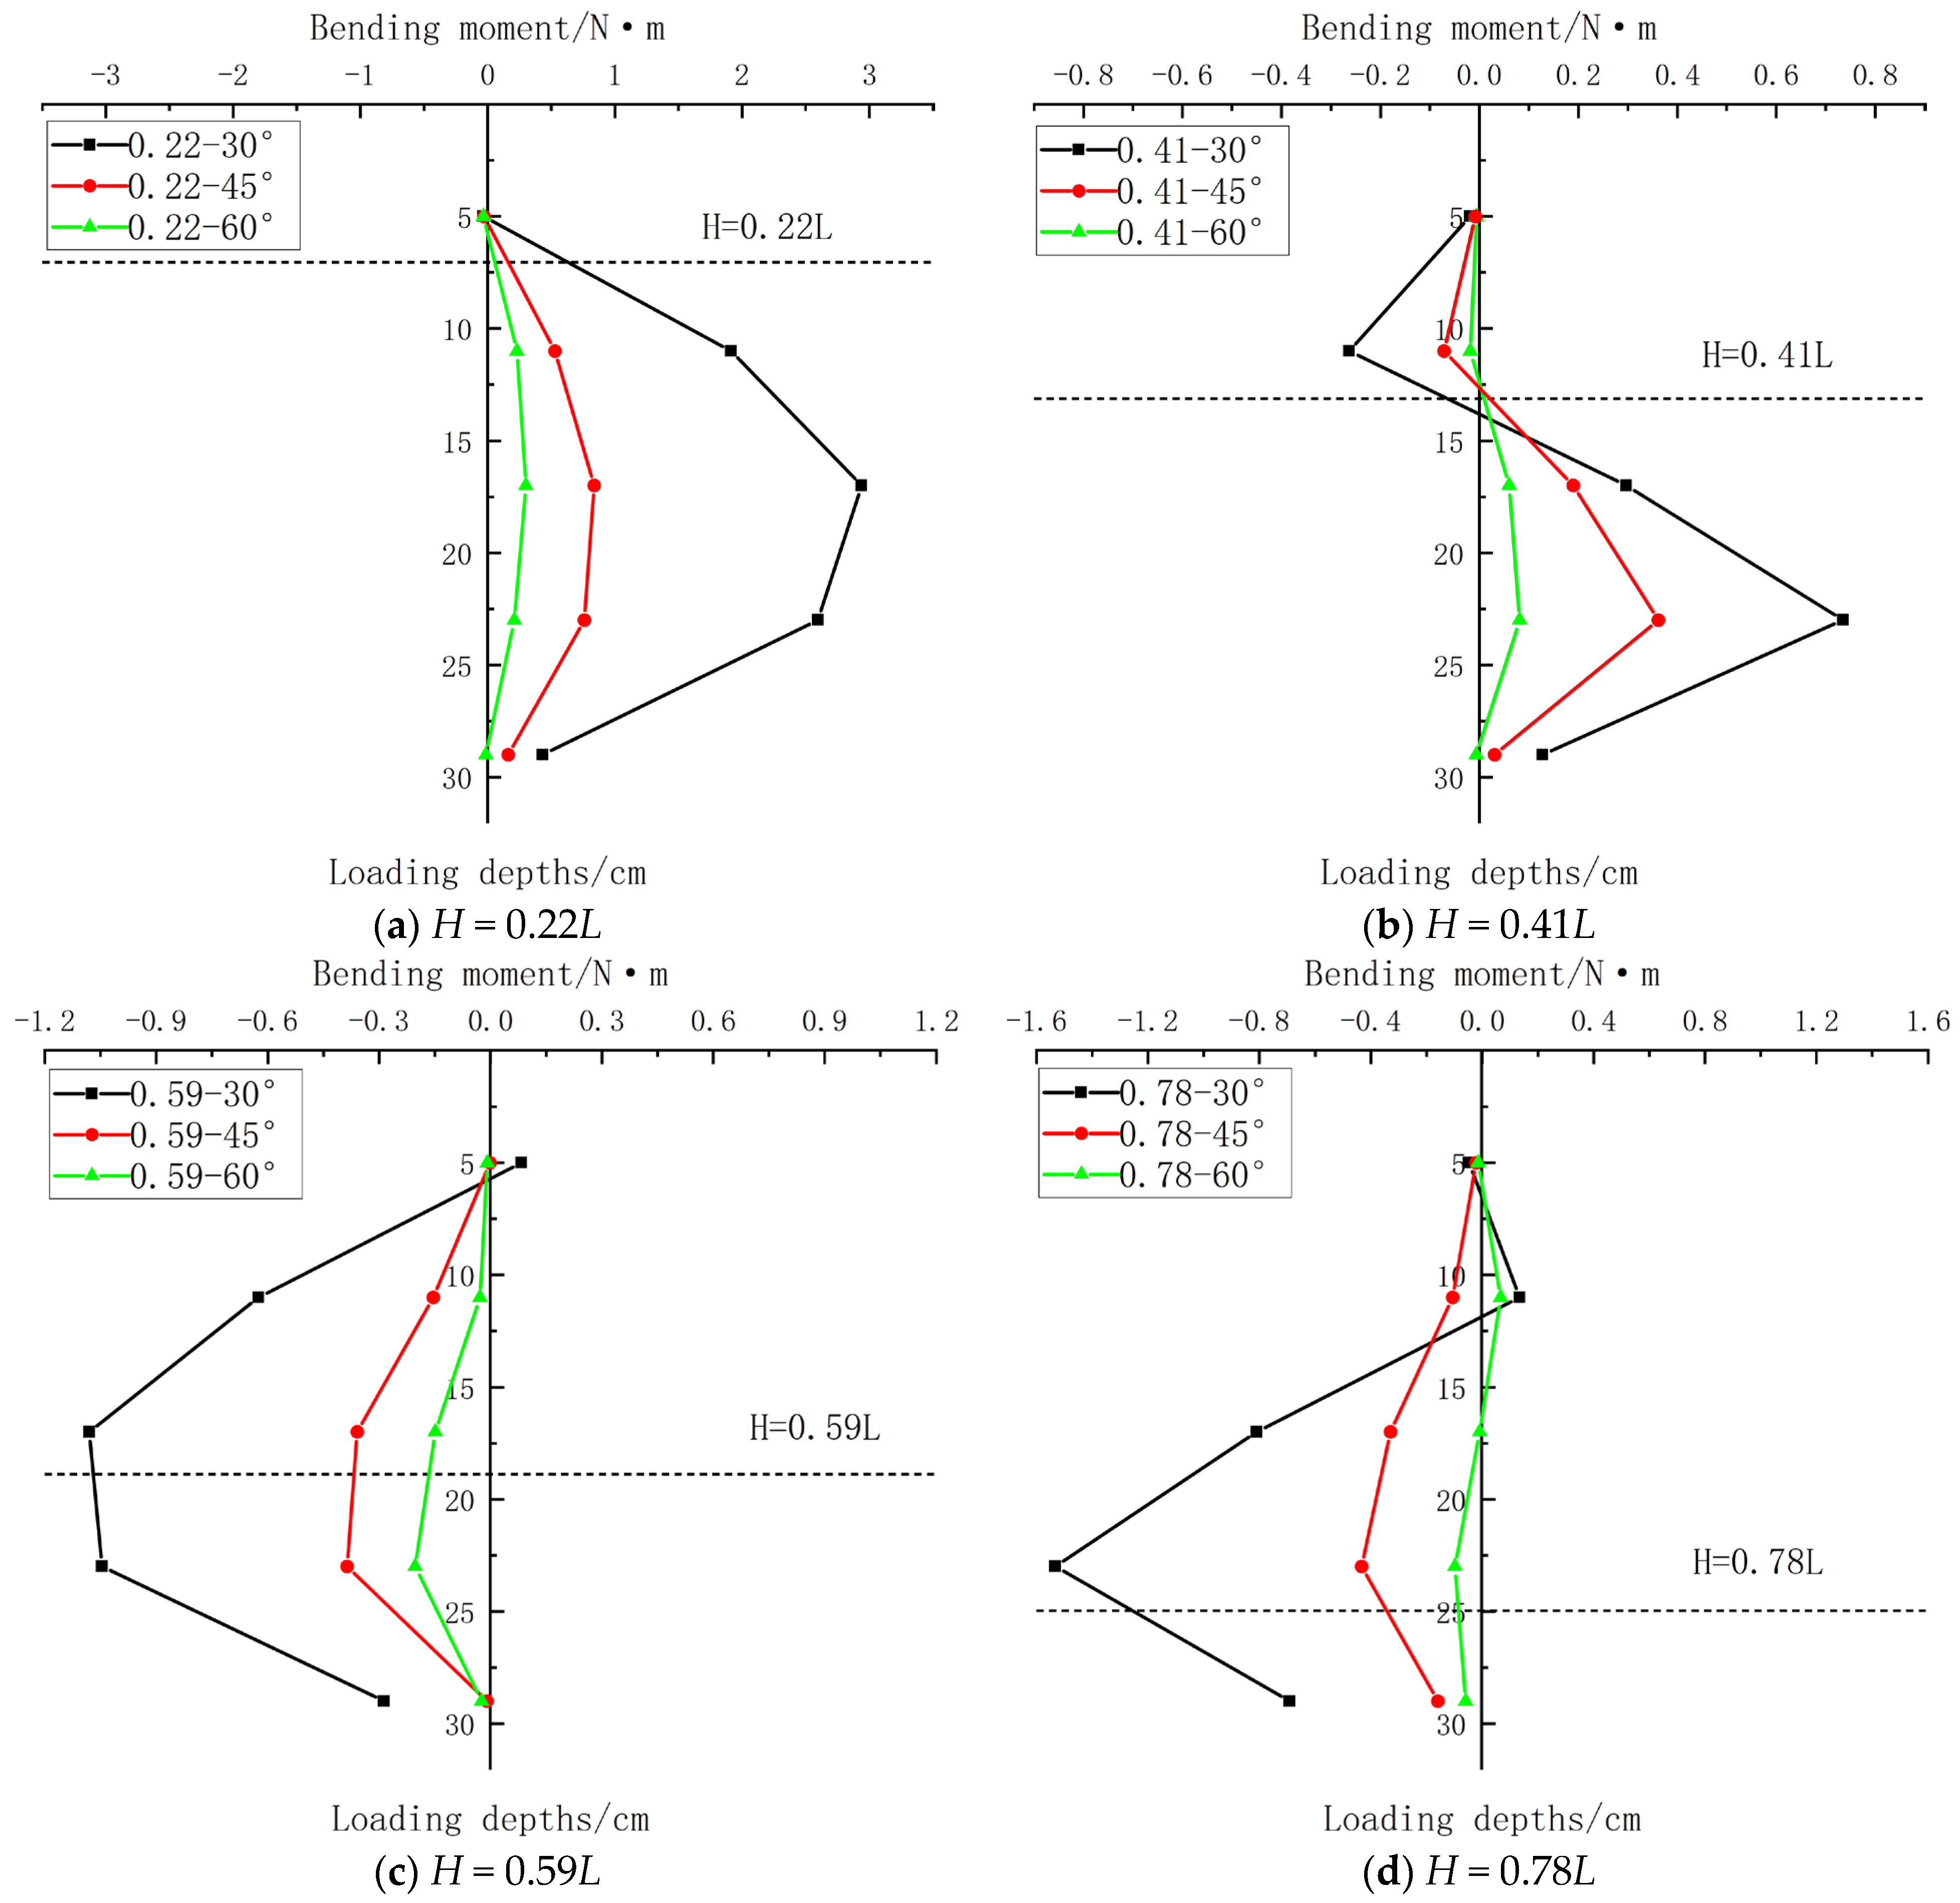
Based on the aforementioned bending moment processing results, the relationship curves between the bending moment and pile depth under different loading angles were further plotted, as shown in
Figure 10.
(1) It can be seen from
Figure 10 that the variation patterns of the bending moment at the same loading depth but different loading angles are generally similar. As the angle increases, the bending moment overall exhibits a decreasing trend, which also conforms to the deformation behavior of piles under inclined loading. When the loading angle is relatively small, the horizontal load component primarily dominates, resulting in larger bending moment values in the pile. As the loading angle increases, the vertical load component gradually becomes dominant, and the horizontal load component on the pile body decreases, leading to a significant reduction in the bending moment value.
(2) It can be seen from
Figure 10a that when loaded at
H = 0.22
L, the trend of bending moment change is basically consistent, only that as the angle increases, its horizontal load component gradually decreases causing the bending moment value to also decrease; from
Figure 10b, it can be seen that when loaded at
H = 0.41
L, a distinct abrupt change occurs near the loading point, and the bending moment distribution trends above and below the loading point are opposite. The maximum absolute bending moment occurred at a depth of 23 cm, which is only because strain gauges were not installed at pile body positions shallower than 5 cm burial depth, resulting in no bending moment results being extracted; from
Figure 10c, it can be seen that when loaded at
H = 0.59
L, the bending moment variation trends under different angles are basically consistent, and as the angle increases, the absolute value of the bending moment gradually decreases; from
Figure 10d, it can be seen that the bending moment distribution characteristics when the loading point depth is at 0.78
L are approximately a “mirror-image” relationship along the vertical axis compared to the case when the loading point depth is
H = 0.41
L, except that the magnitude of the former’s bending moment is smaller.
3.3.3. Processing Results of Pile Bending Moment Under Saturated Sand Condition
Under saturated sand conditions, inclined loading tests at angles of 30°, 45°, and 60° were conducted at a loading depth of
H = 0.41
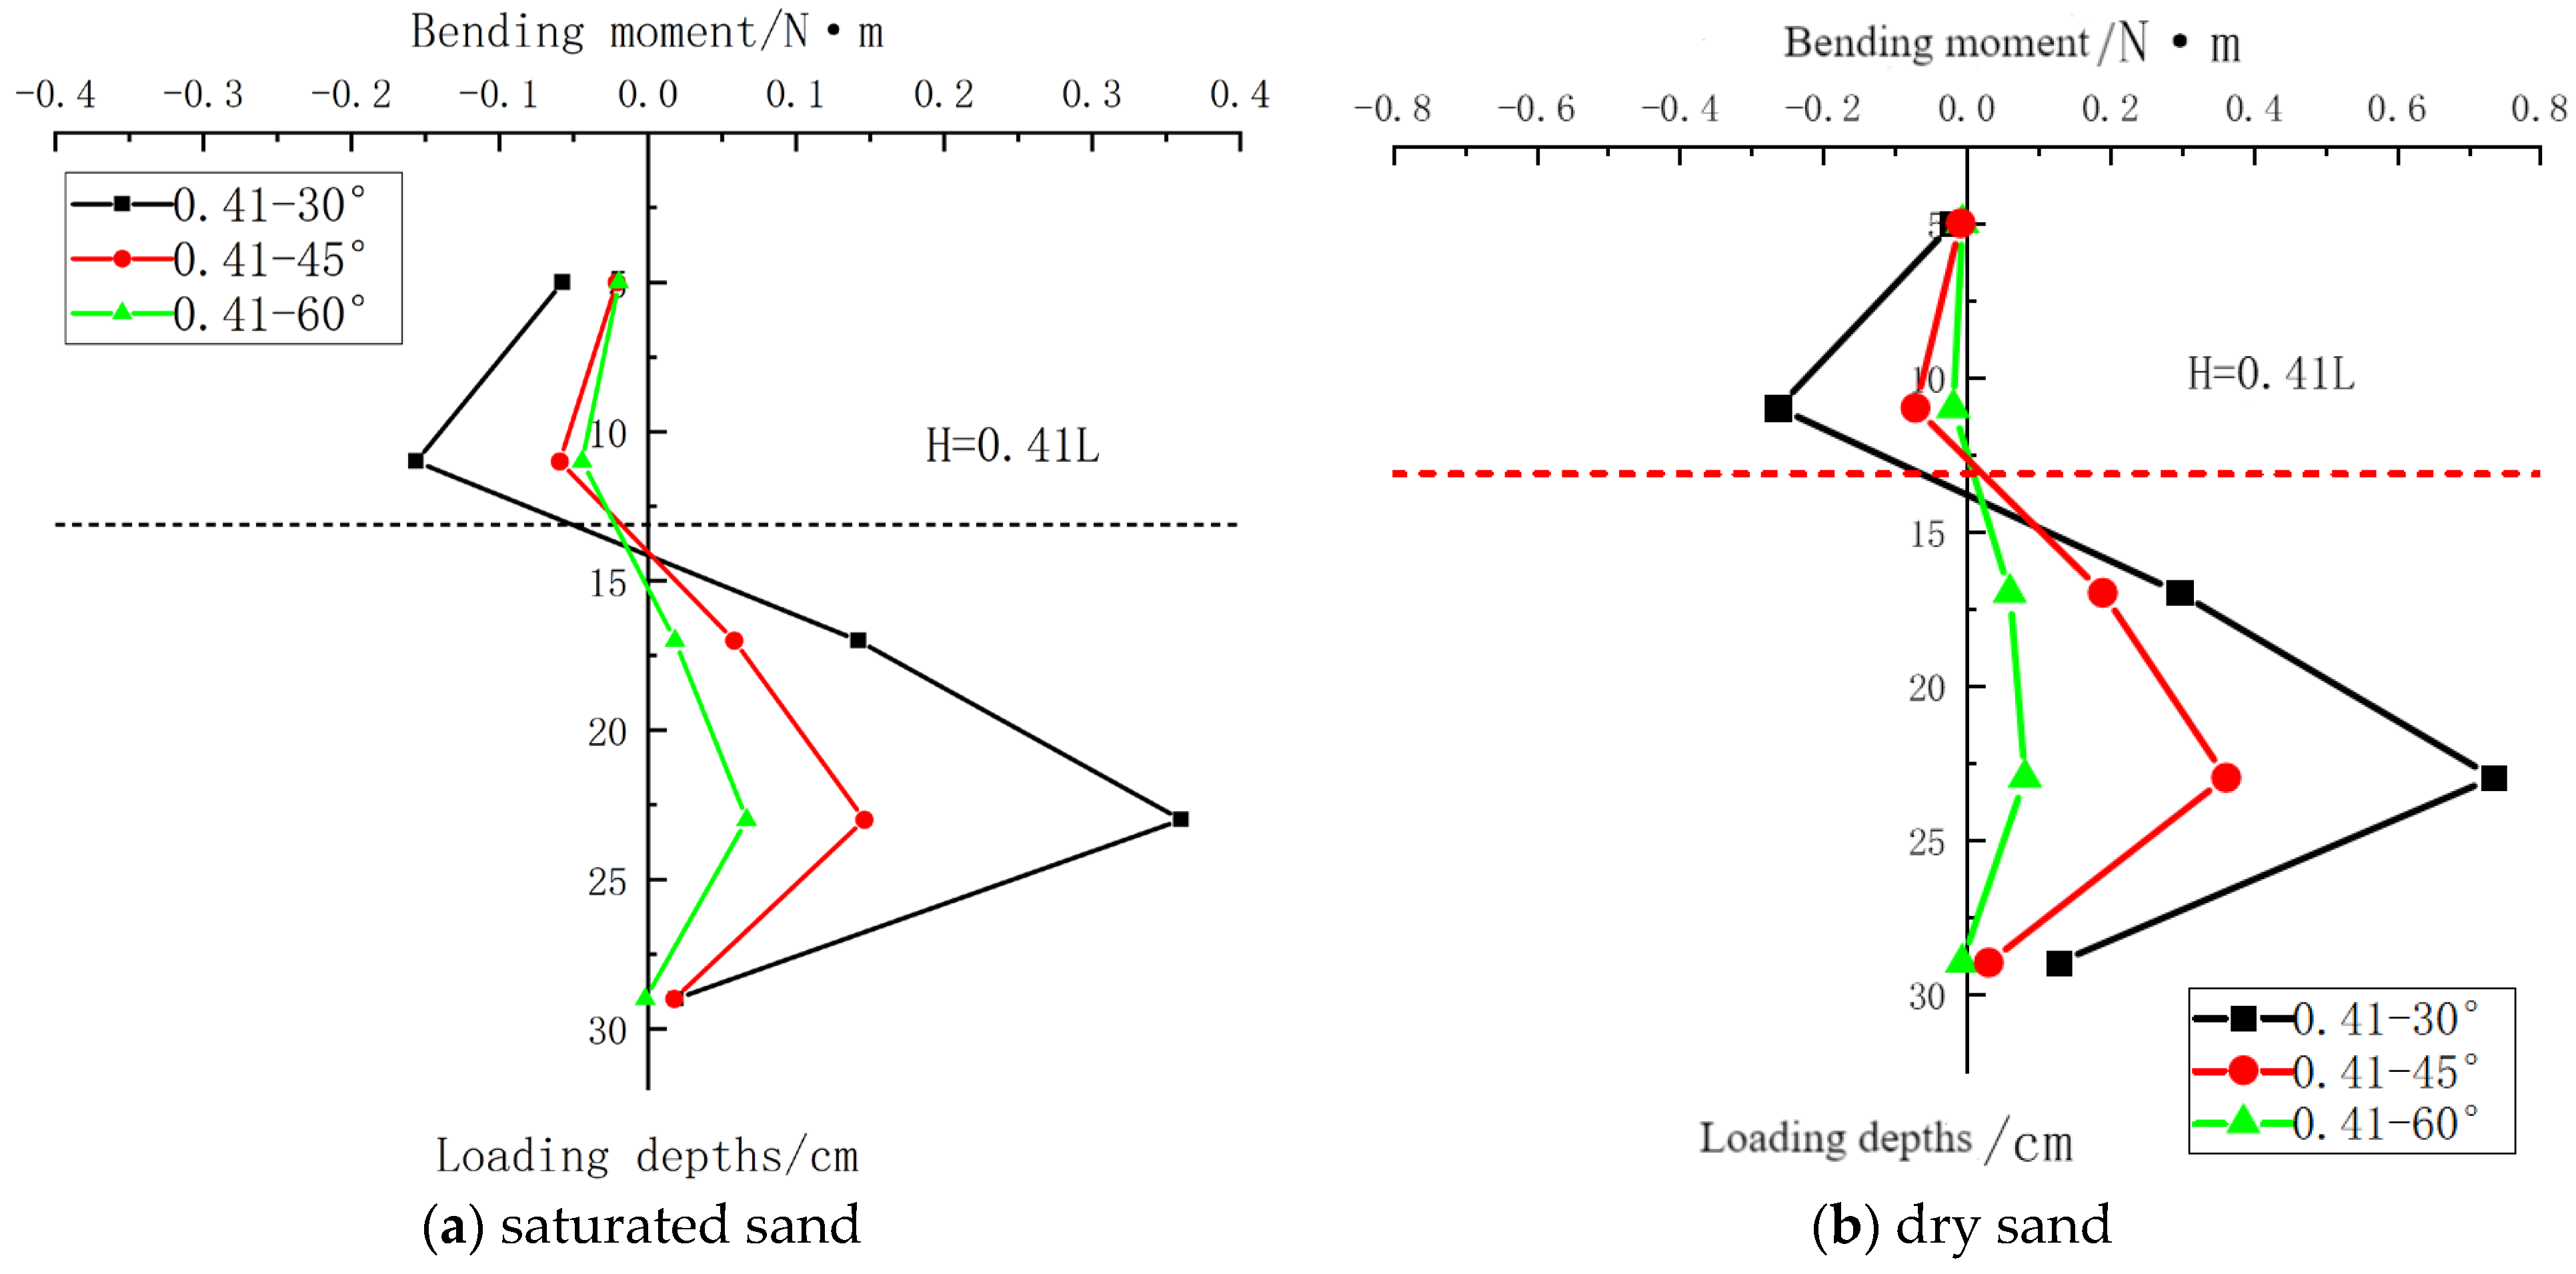
L. The loading method and data processing approach were identical to those used in dry sand. The variation in pile bending moment with burial depth under saturated sand conditions is shown in
Figure 11 below, with a comparative analysis against the results obtained under dry sand conditions.
According to the comparison in
Figure 11, for the same loading depth (
H = 0.41
L), the bending moment distribution characteristics of the pile-anchor foundations in saturated sand under different loading angles (30°, 45°, and 60°) are entirely consistent with those in dry sand. The pile bending moment gradually decreases as the loading angle increases. This occurs because the bending moment is primarily generated by the horizontal load component acting on the pile. As the angle increases, the horizontal load component progressively diminishes.
Additionally, under identical conditions, the bending moment values of the model pile in saturated sand are approximately half of those observed in dry sand. This reduction is attributed to the lower subgrade reaction of saturated sand compared to dry sand.
3.4. Processing Results of Pile Shear Force
3.4.1. Shear Force Distribution Pattern Under Different Loading Depths
Normally, the pile shear force distribution can be obtained based on the pile bending moment distribution using a specific formula. However, this assumes the bending moment distribution is continuous. In this study, an internal force discontinuity exists at the anchor loading point, meaning the upper and lower segments of the model pile experience different force patterns at the loading point interface. Therefore, following the “Research on Horizontal Test Pile Data Processing Method Based on Akima Interpolation Theory” proposed by Zhu Mingxing et al. [
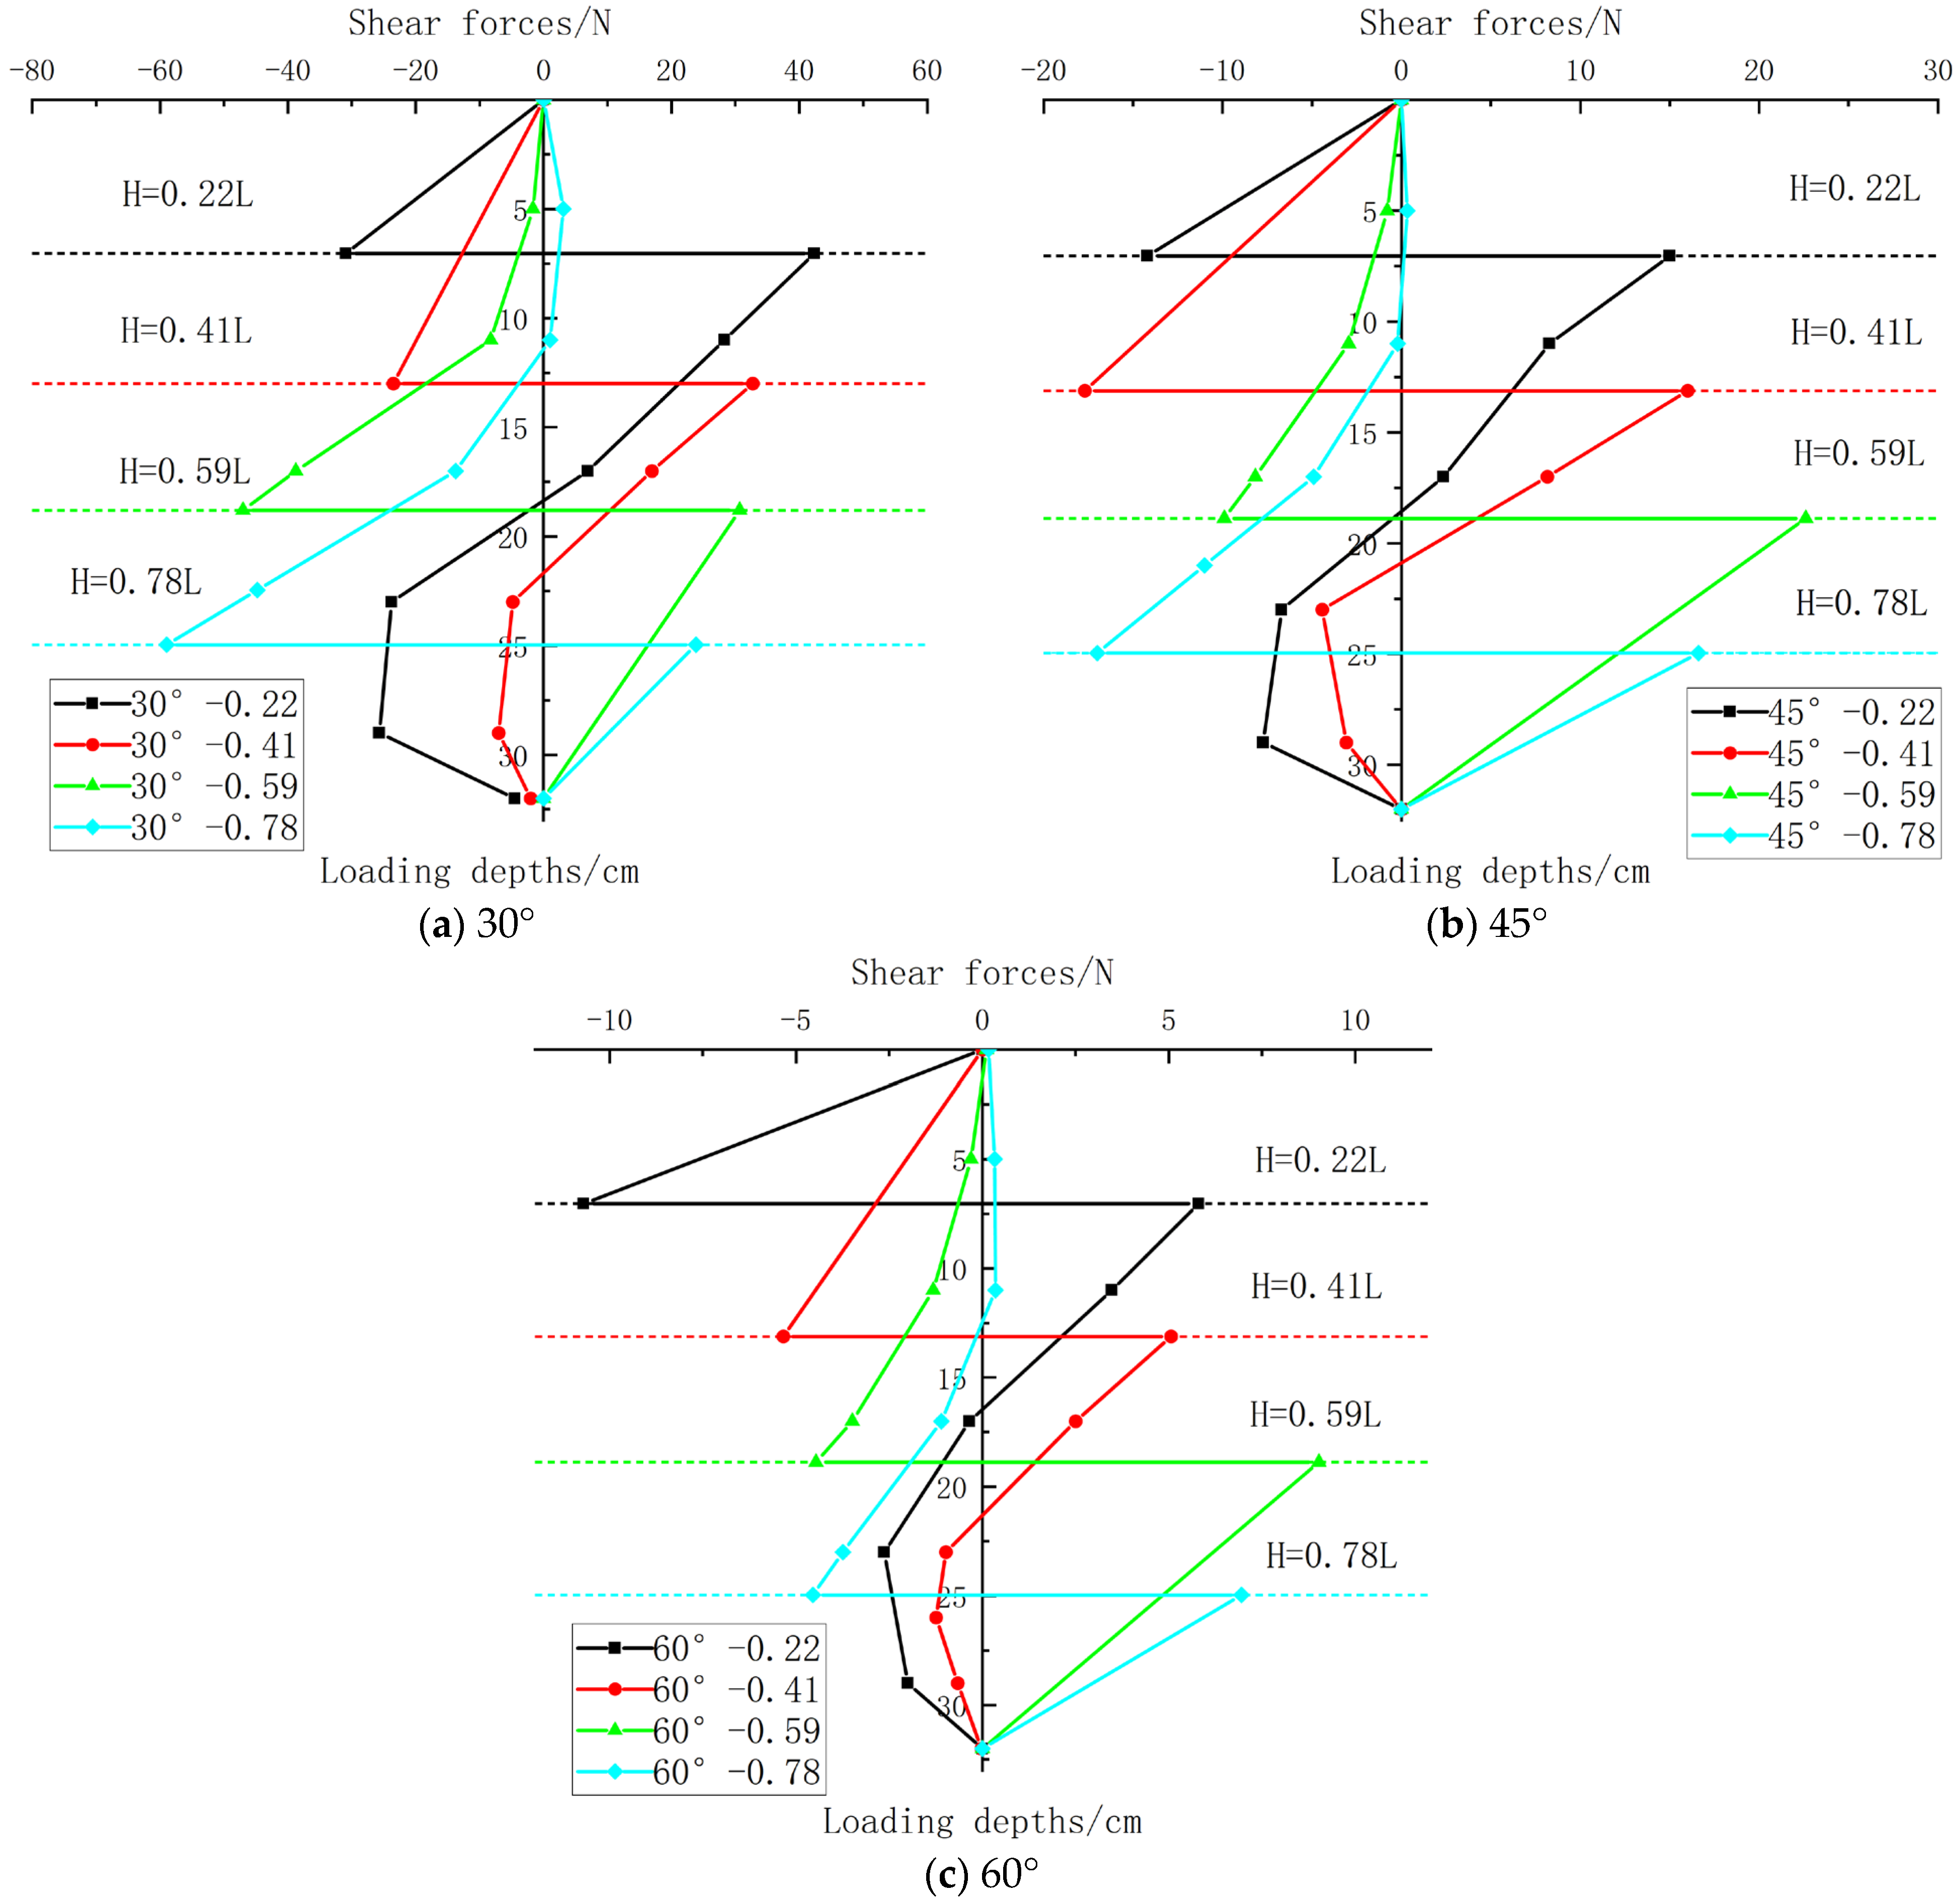
39], this paper employs a new pile shear force calculation method to derive the pile shear force distribution pattern, as shown in
Figure 12 below.
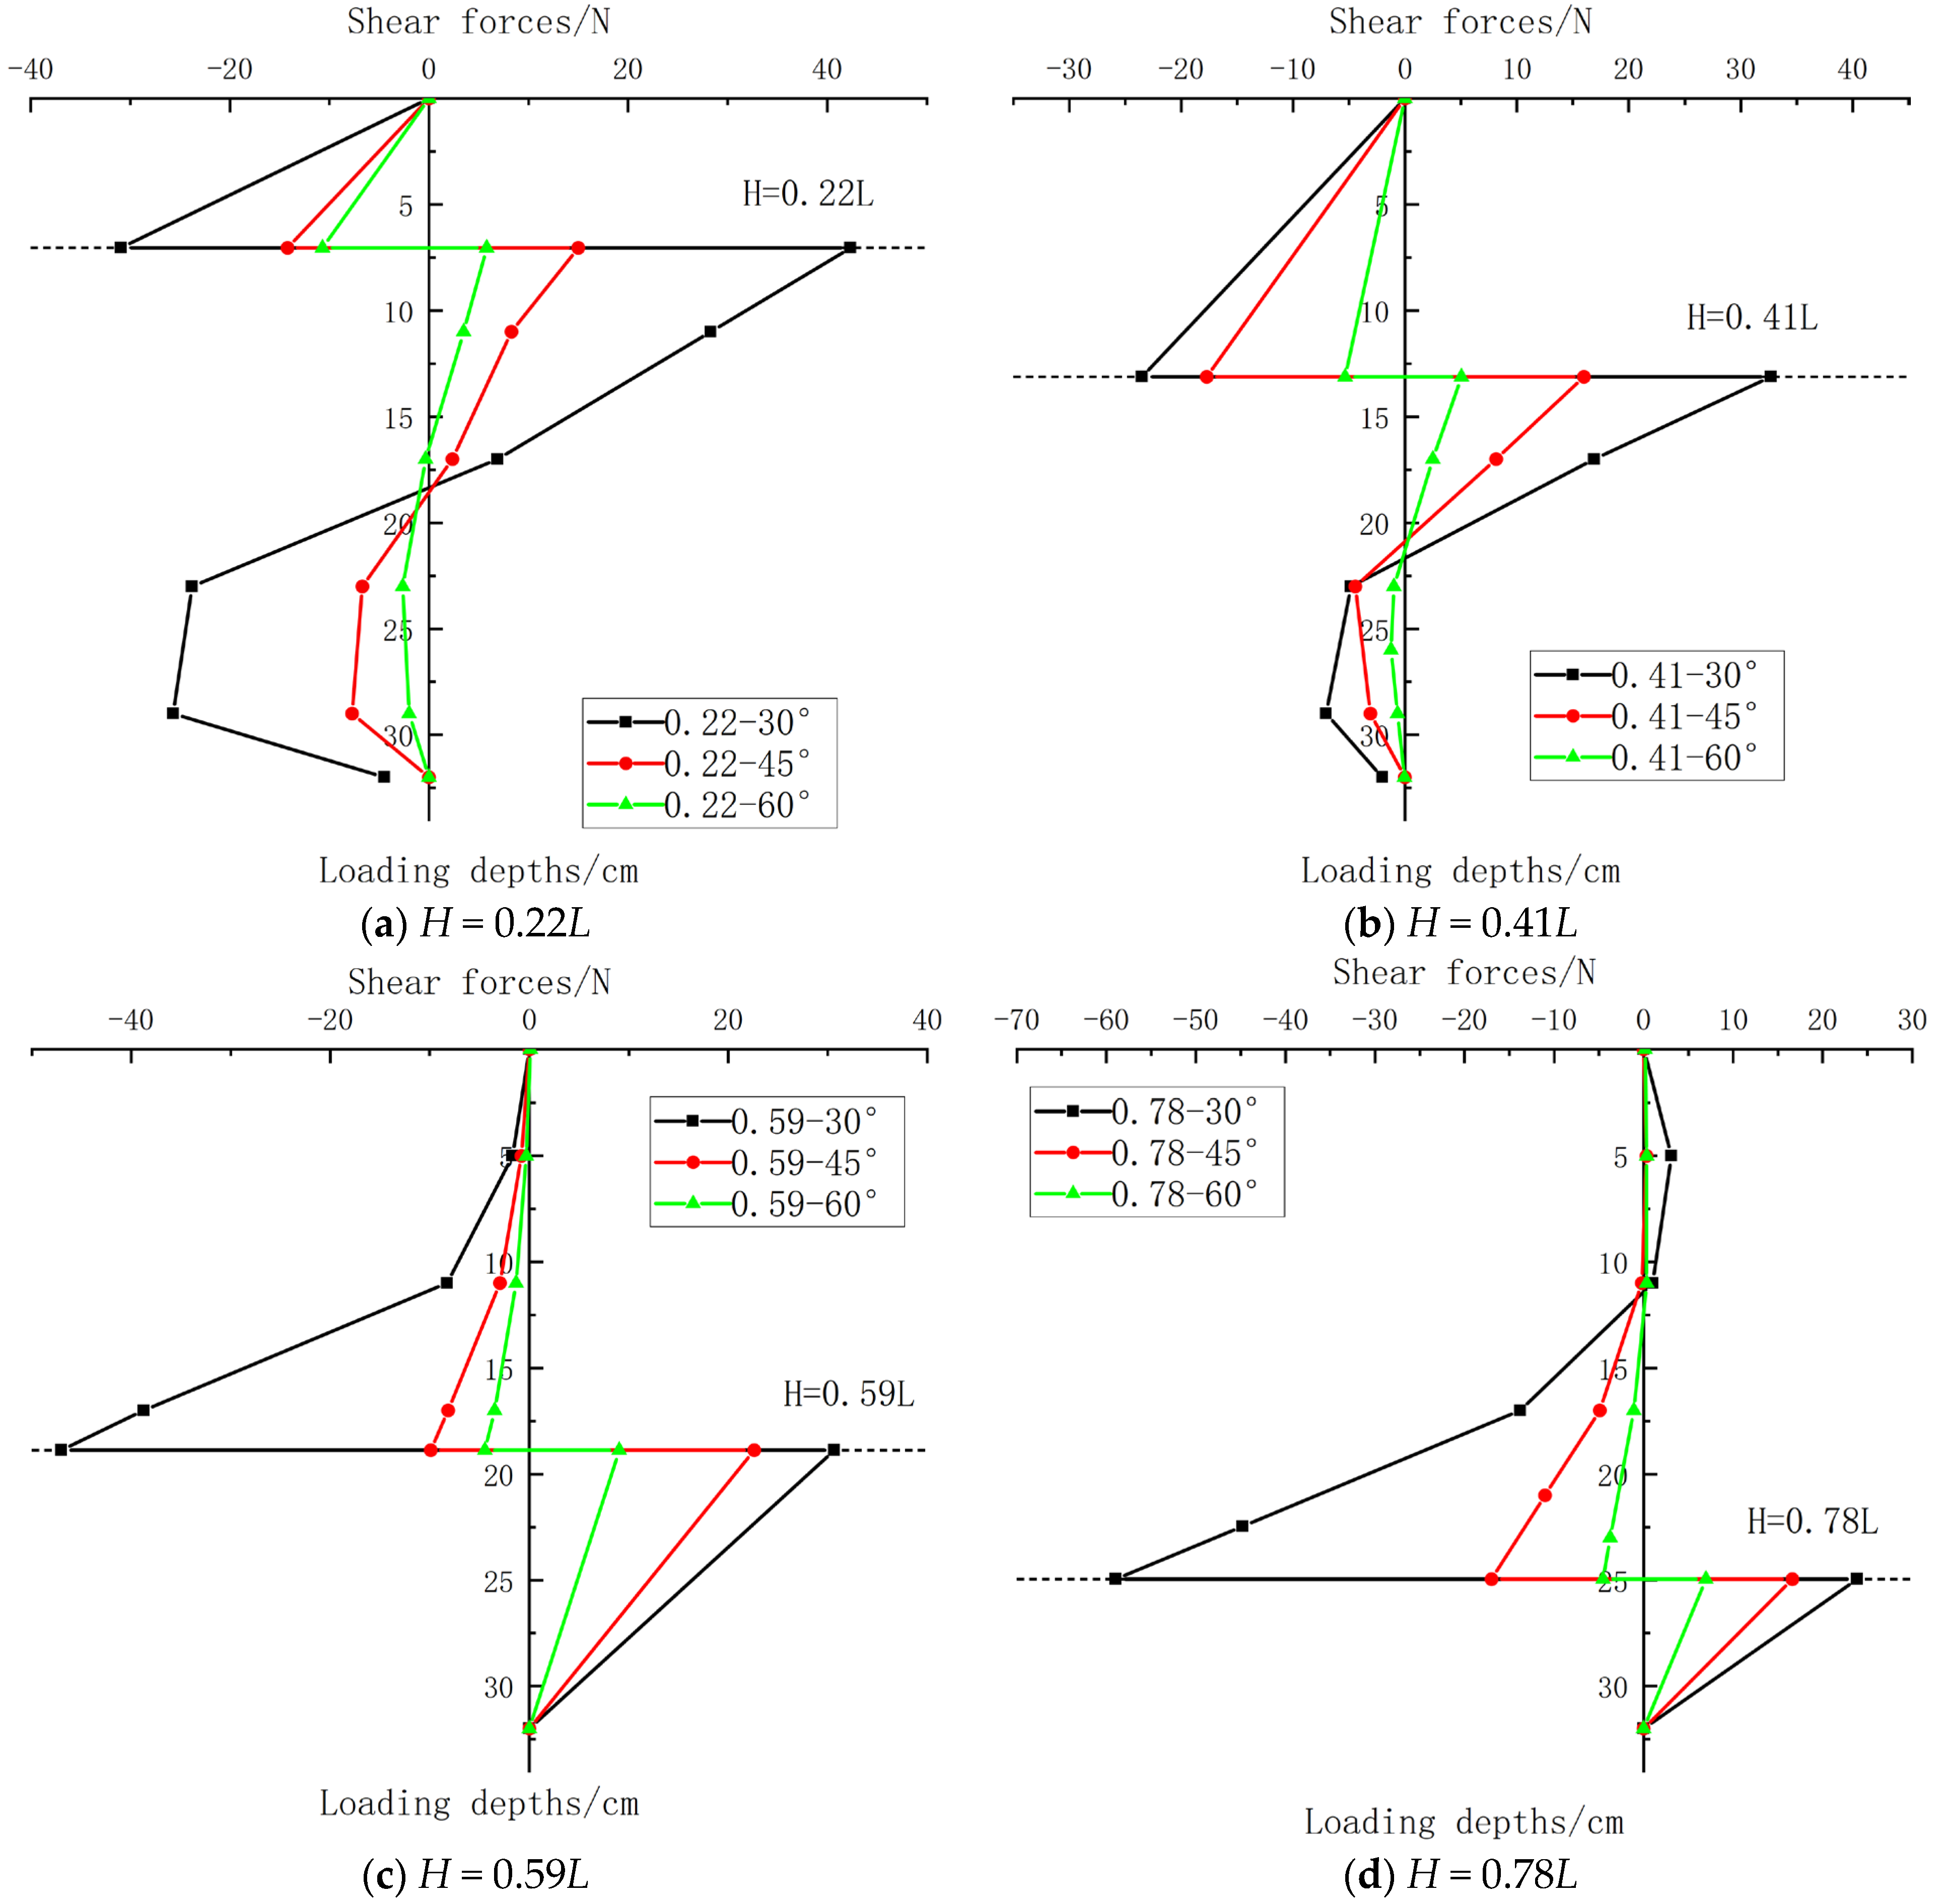
According to
Figure 12, the characteristics of the pile shear force distribution pattern are very distinct, namely an internal force discontinuity occurs at the loading point interface. For the upper pile segment, the shear force at its tip (the loading point) is maximum and negative. It gradually decreases towards the pile top, reaching zero at the top. For the lower pile segment, the shear force at its top (the loading point) is maximum and positive. It generally attenuates with increasing depth, reaching zero at the pile tip (32 cm depth).
(1) Shear Force Distribution Pattern at 30° Loading Angle
① At loading depth H = 0.22L (=7.04 cm), the maximum negative shear force in the upper segment is −30.93 N at the loading point interface depth. The shear force in the lower segment, starting from 42.36 N at the interface, attenuates with depth. Due to the considerable length of the lower segment, a reverse shear force develops during attenuation with increasing depth, with a maximum negative shear force of −25.7 N at 29 cm depth, finally attenuating to zero at the pile tip.
② At loading depth H = 0.41L (=13.12 cm), the variation pattern is basically consistent with that at H = 0.22L (=7.04 cm), except the magnitudes of the former are smaller than the latter. The maximum negative shear force in the upper segment is −23.49 N at the interface. The lower segment shear force, starting from 32.71 N at the interface, attenuates with depth. Reverse shear force occurs, with a maximum negative value of −7.0 N at 29 cm depth, finally reaching zero at the tip.
③ At loading depth H = 0.59L (=18.88 cm), the entire upper segment exhibits negative shear force distribution, with a maximum of −47 N at the interface. The entire lower segment exhibits positive shear force distribution, with a maximum of 30.7 N at the interface.
④ At loading depth H = 0.78L (=24.96 cm), the situation is basically consistent with that at H = 0.22L (=7.04 cm), but exhibits an “inverted” pattern: The maximum negative shear force in the upper segment is −58.96 N at the interface, gradually attenuating as depth decreases. Positive shear force appears in shallow layers. This is attributed to the longer upper segment length, exhibiting shear distribution characteristics similar to those of semi-rigid or flexible piles. The maximum positive shear force in the lower segment is 23.84 N at the interface.
When the loading angles are 45° and 60°, the shear force distribution law is basically consistent with that at a loading angle of 30°; the only difference is that the overall magnitude of the shear force decreases as the loading angle increases. It can be seen that the shear force decreases gradually with the increase in the loading angle.
3.4.2. Shear Force Distribution Pattern Under Different Loading Angles
Based on the pile shear force distribution results presented in
Section 3.4.1, the distribution patterns of shear force with pile depth under different loading angles are obtained, as shown in
Figure 13.
The shear force-depth distribution curves of the pile under different loading angles consistently exhibit similar trends when loads are applied at H = 0.22L, H = 0.41L, H = 0.59L, and H = 0.78L. The shear force at the pile head is zero, and it gradually increases in the negative direction with increasing embedment depth. The growth rate of negative shear force is more pronounced at smaller loading angles, which results from the reduced horizontal component of oblique tensile forces as the inclination angle increases, causing the bearing capacity control of the model pile to gradually shift to vertical capacity control. At a certain elevation above the loading point, the shear force reaches its negative peak value. At the loading point elevation, the shear force abruptly transitions to positive values and attains its maximum positive value, representing the critical section of maximum shear force in the pile shaft, with the magnitude decreasing as the loading angle increases. Below this point, the shear force rapidly diminishes with increasing depth.
3.4.3. Processing Results of Pile Shear Force Under Saturated Sand Condition
Under saturated sand conditions, inclined loading tests at angles of 30°, 45°, and 60° were conducted at a loading depth of
H = 0.41
L. The loading method and data processing approach were identical to those used in dry sand. The variation in pile shear force with burial depth under saturated sand conditions is shown in
Figure 14 below, with a comparative analysis against the results obtained under dry sand conditions.
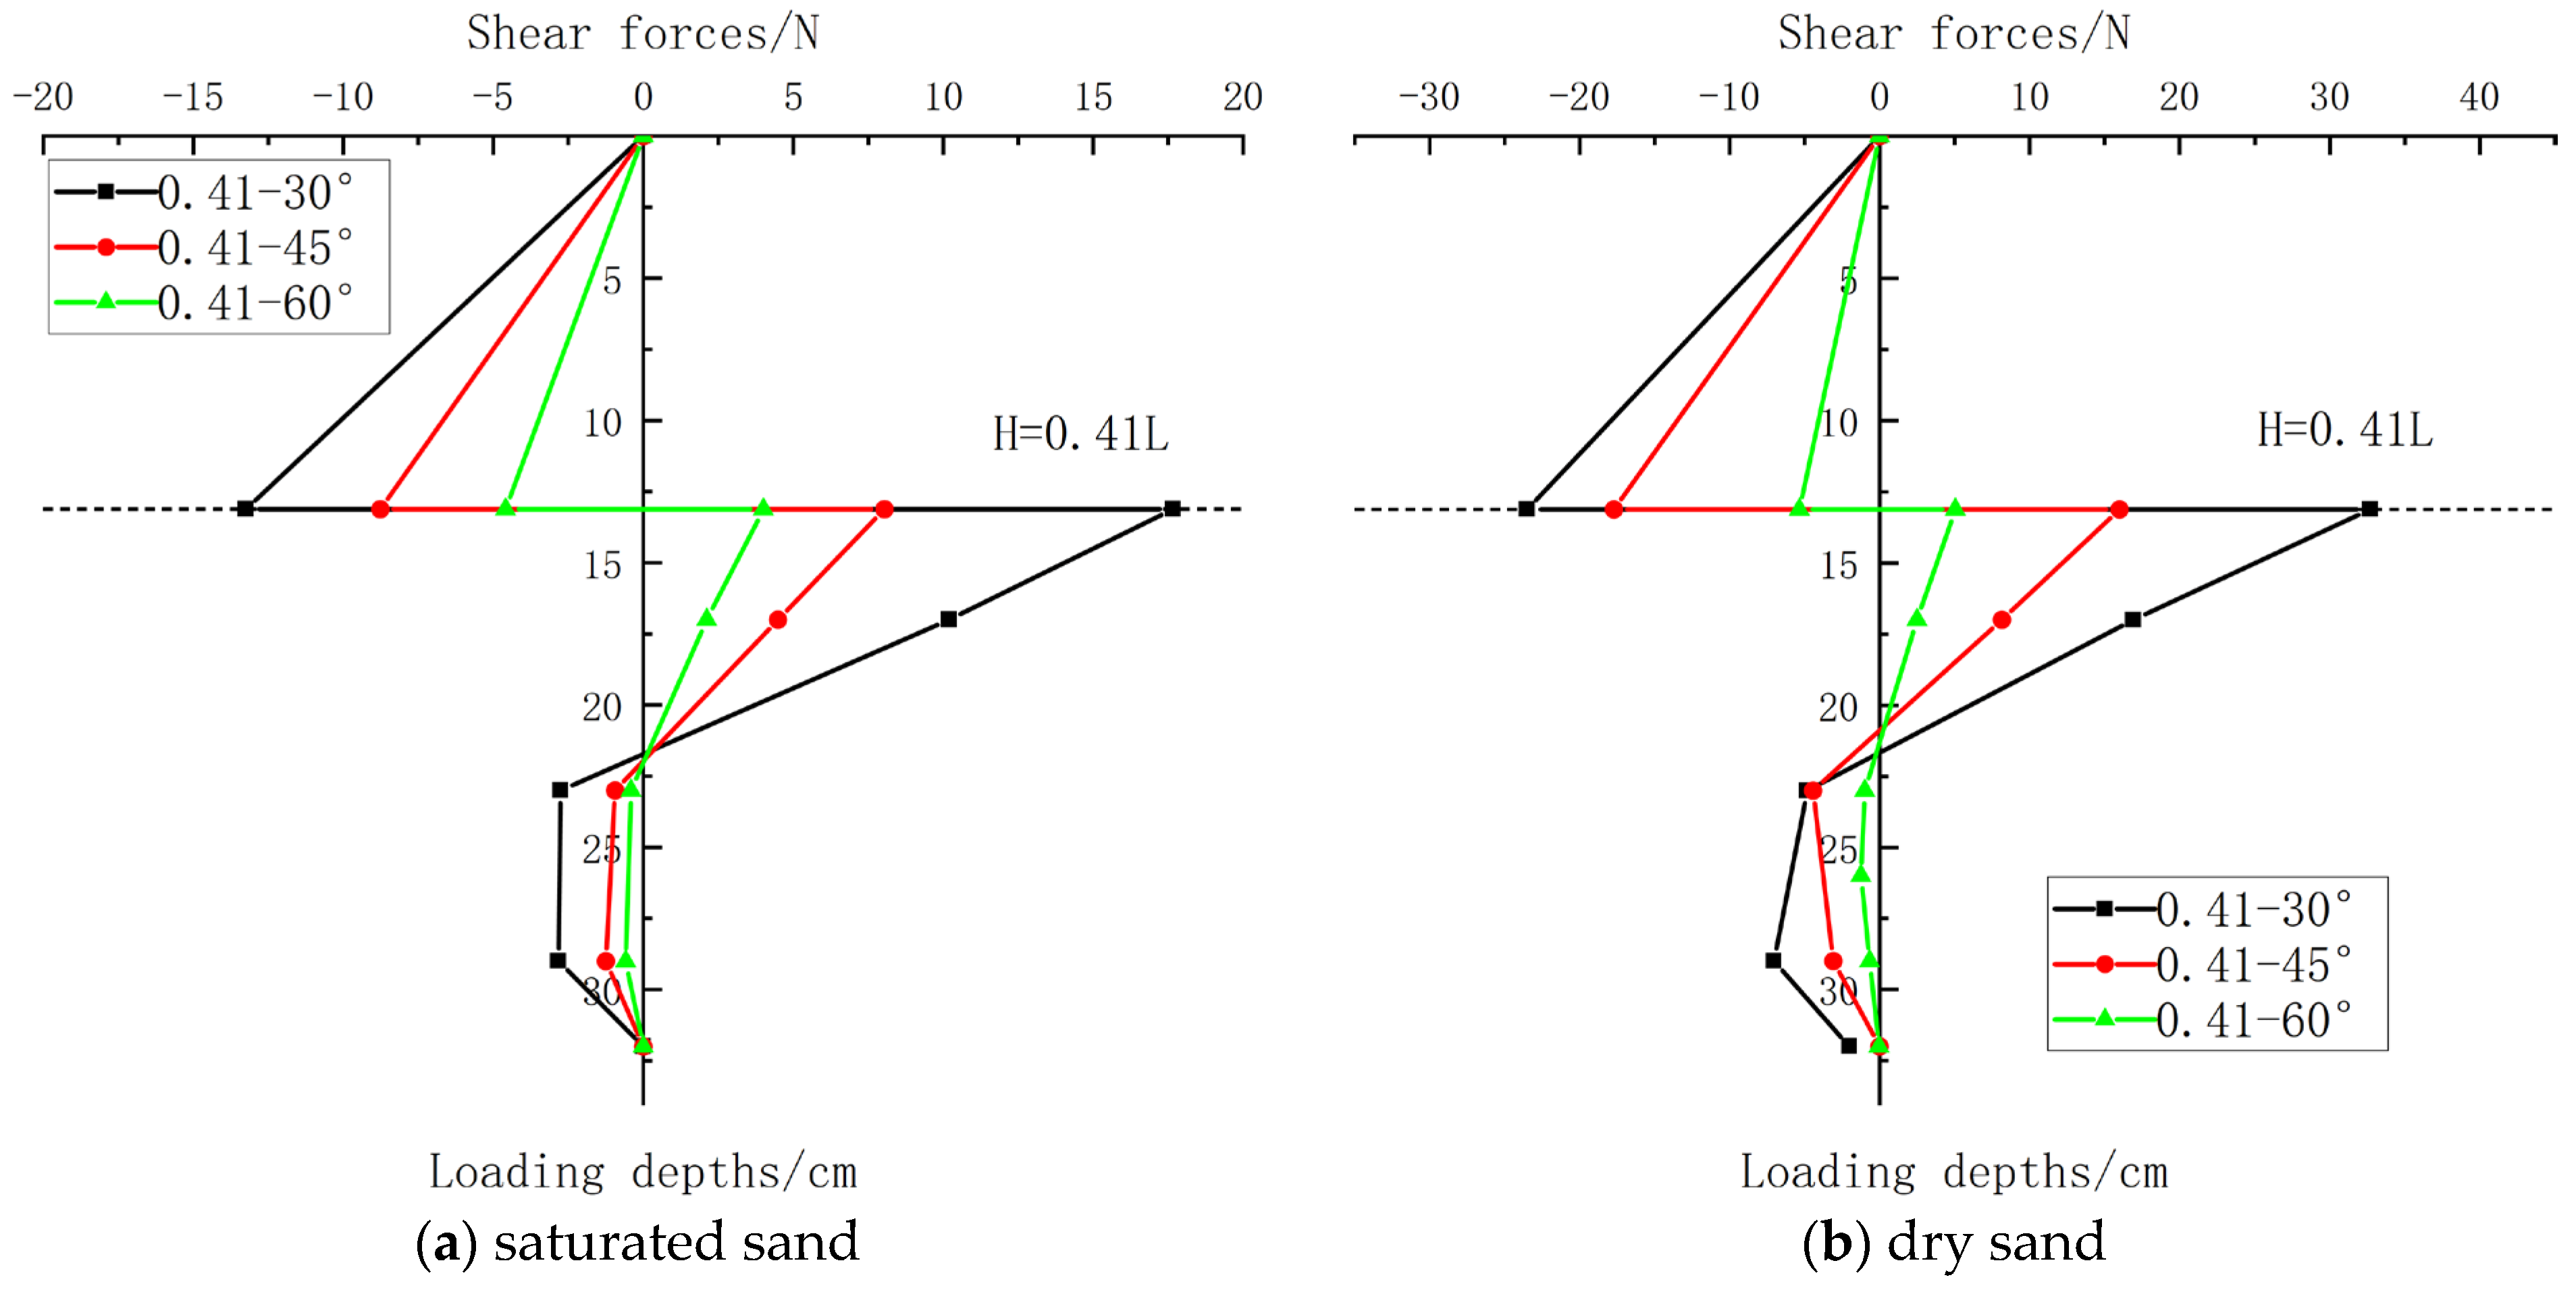
From
Figure 14, it can be observed that the variation patterns of pile shear force under different soil conditions are fundamentally consistent. However, a comparison of the numerical values reveals that the pile shear force under saturated sand conditions is approximately half of that under dry sand conditions. This consistency aligns with the behavior observed for the pile bending moment, which is attributed to the lower subgrade reaction of saturated sand compared to dry sand.
3.5. Processing Results of Pile Axial Force
3.5.1. Axial Force Distribution Pattern Under Different Loading Depths
Based on the constitutive relationship in material mechanics, the relationship between stress and strain at the monitored cross-sections of the pile can be expressed as:
Then, the axial force
N at the cross-section where the strain gauge is attached on the pile shaft is:
Based on the calibration data of the test pile, a mathematical correlation model between axial strain and pile axial force was established using strain measurements from each cross-section. For axial force calculation, the measured strain values are substituted into Equation (2) to solve the stress distribution at each section. Subsequently, the sectional axial force distribution is solved using Equation (3).
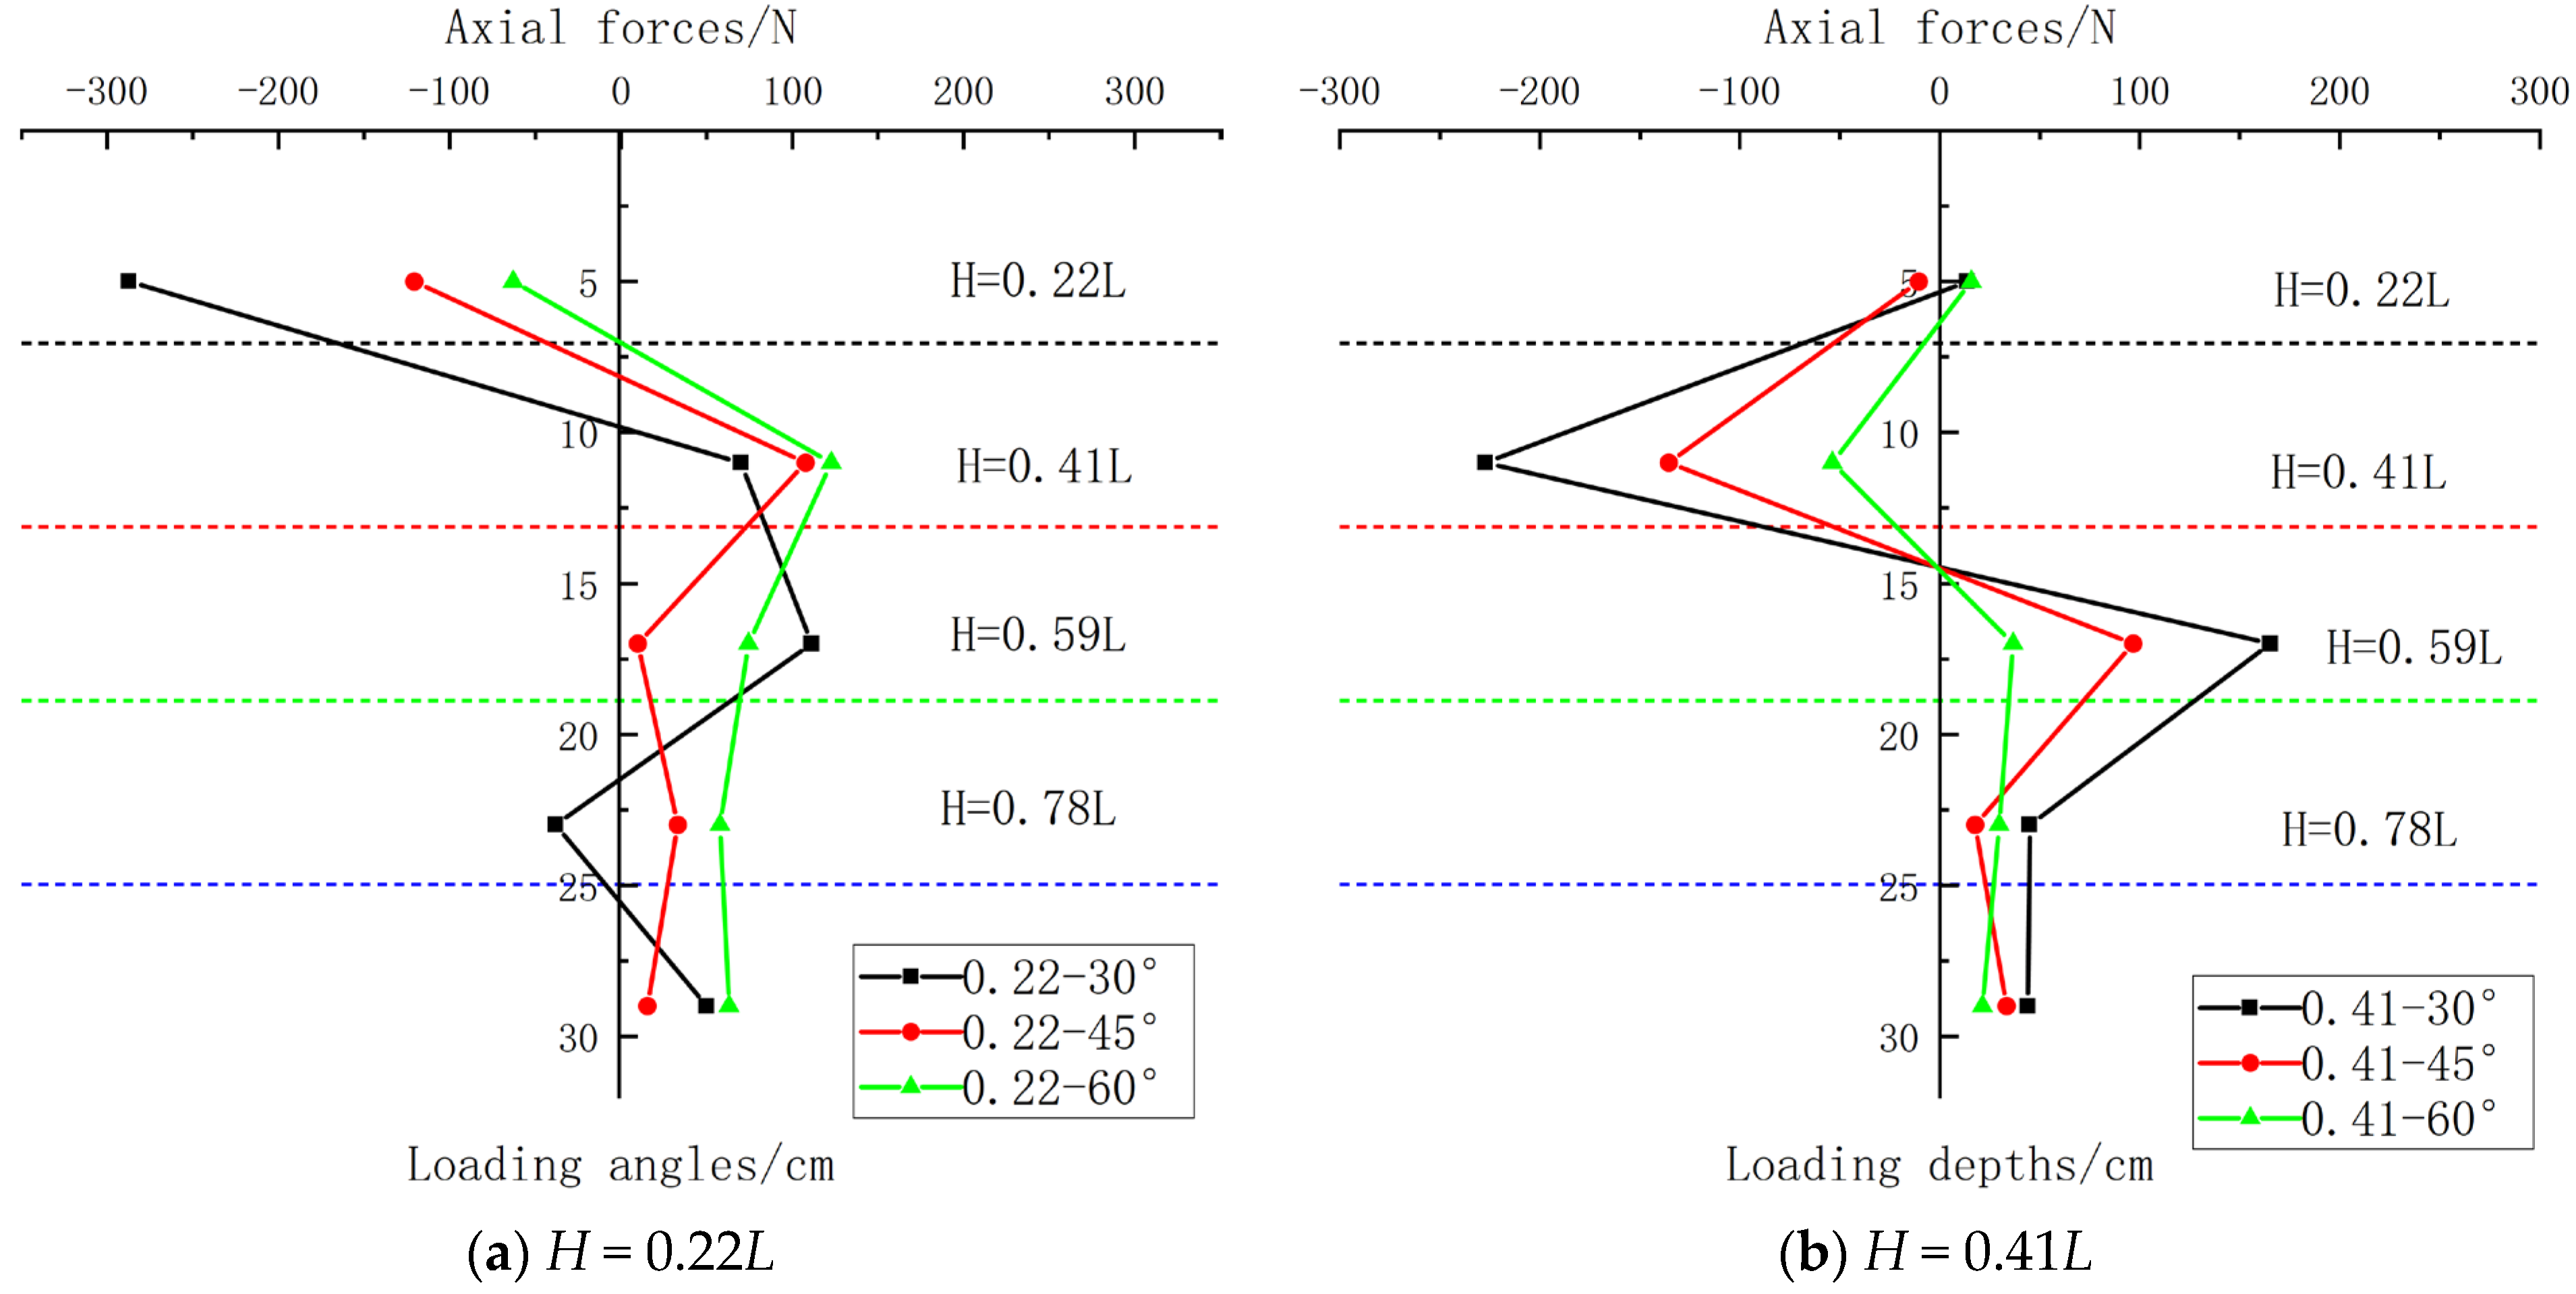
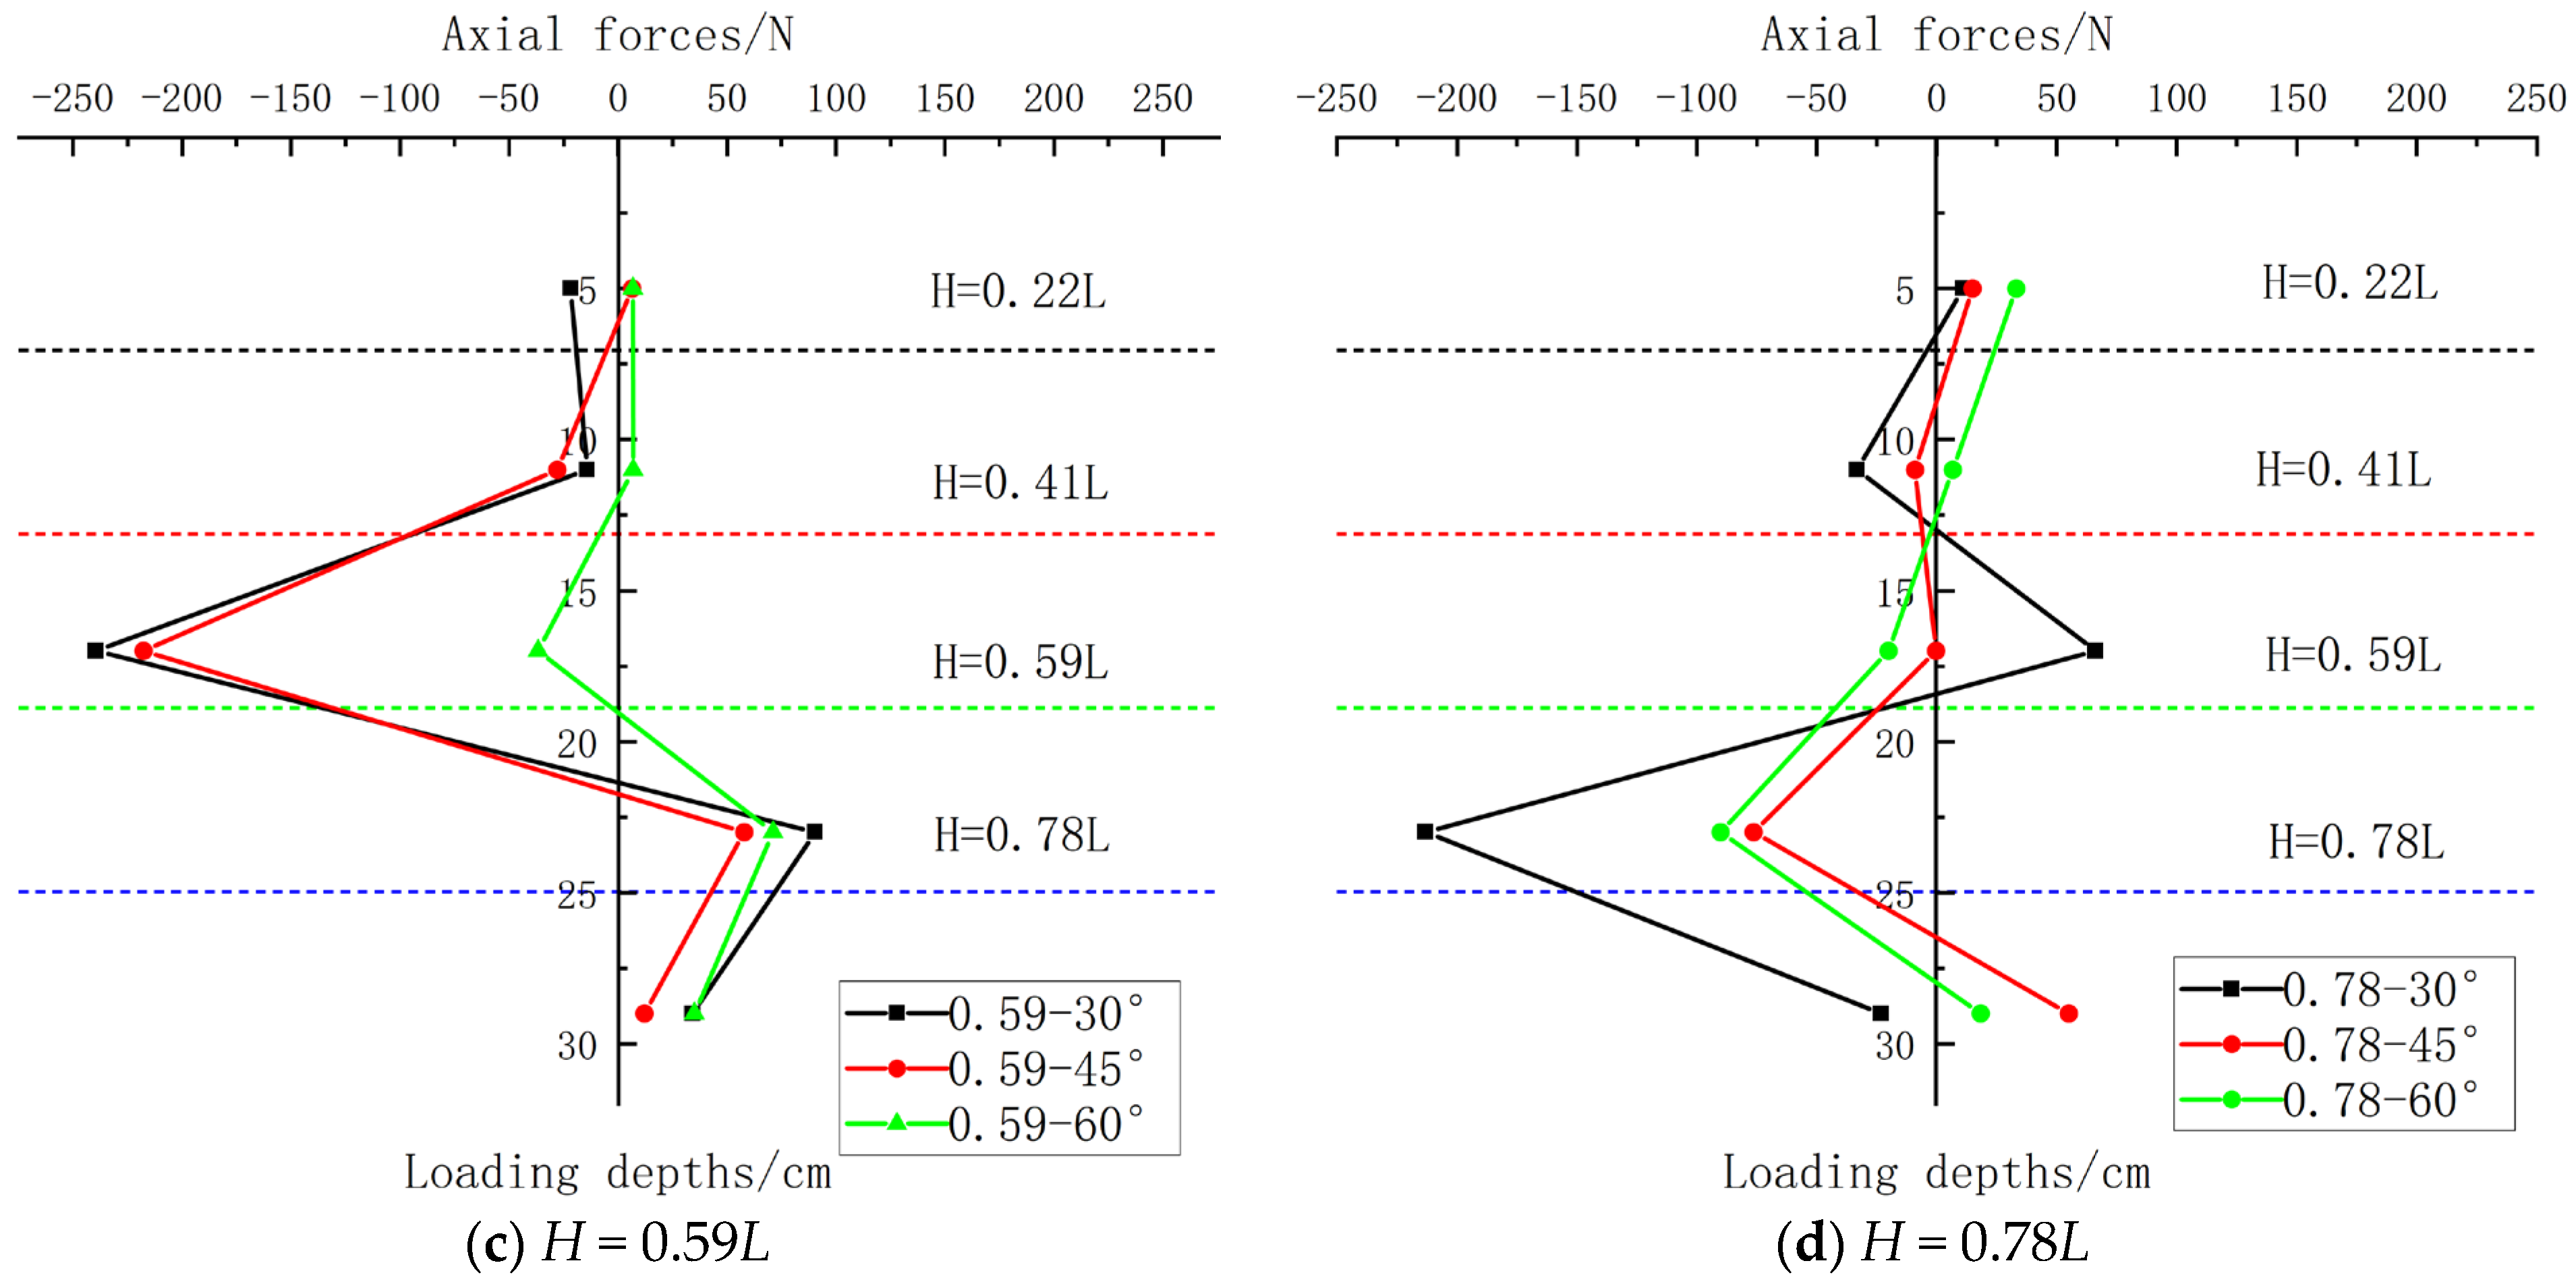
Figure 15 and
Figure 16 show comparative characteristic curves of the axial force distribution under different loading depths for the test pile with a burial depth of 32 cm.
Analysis and comparison of the variation patterns of shear force with depth in the model pile under different loading depths at loading angles of 30°, 45°, and 60° are as follows:
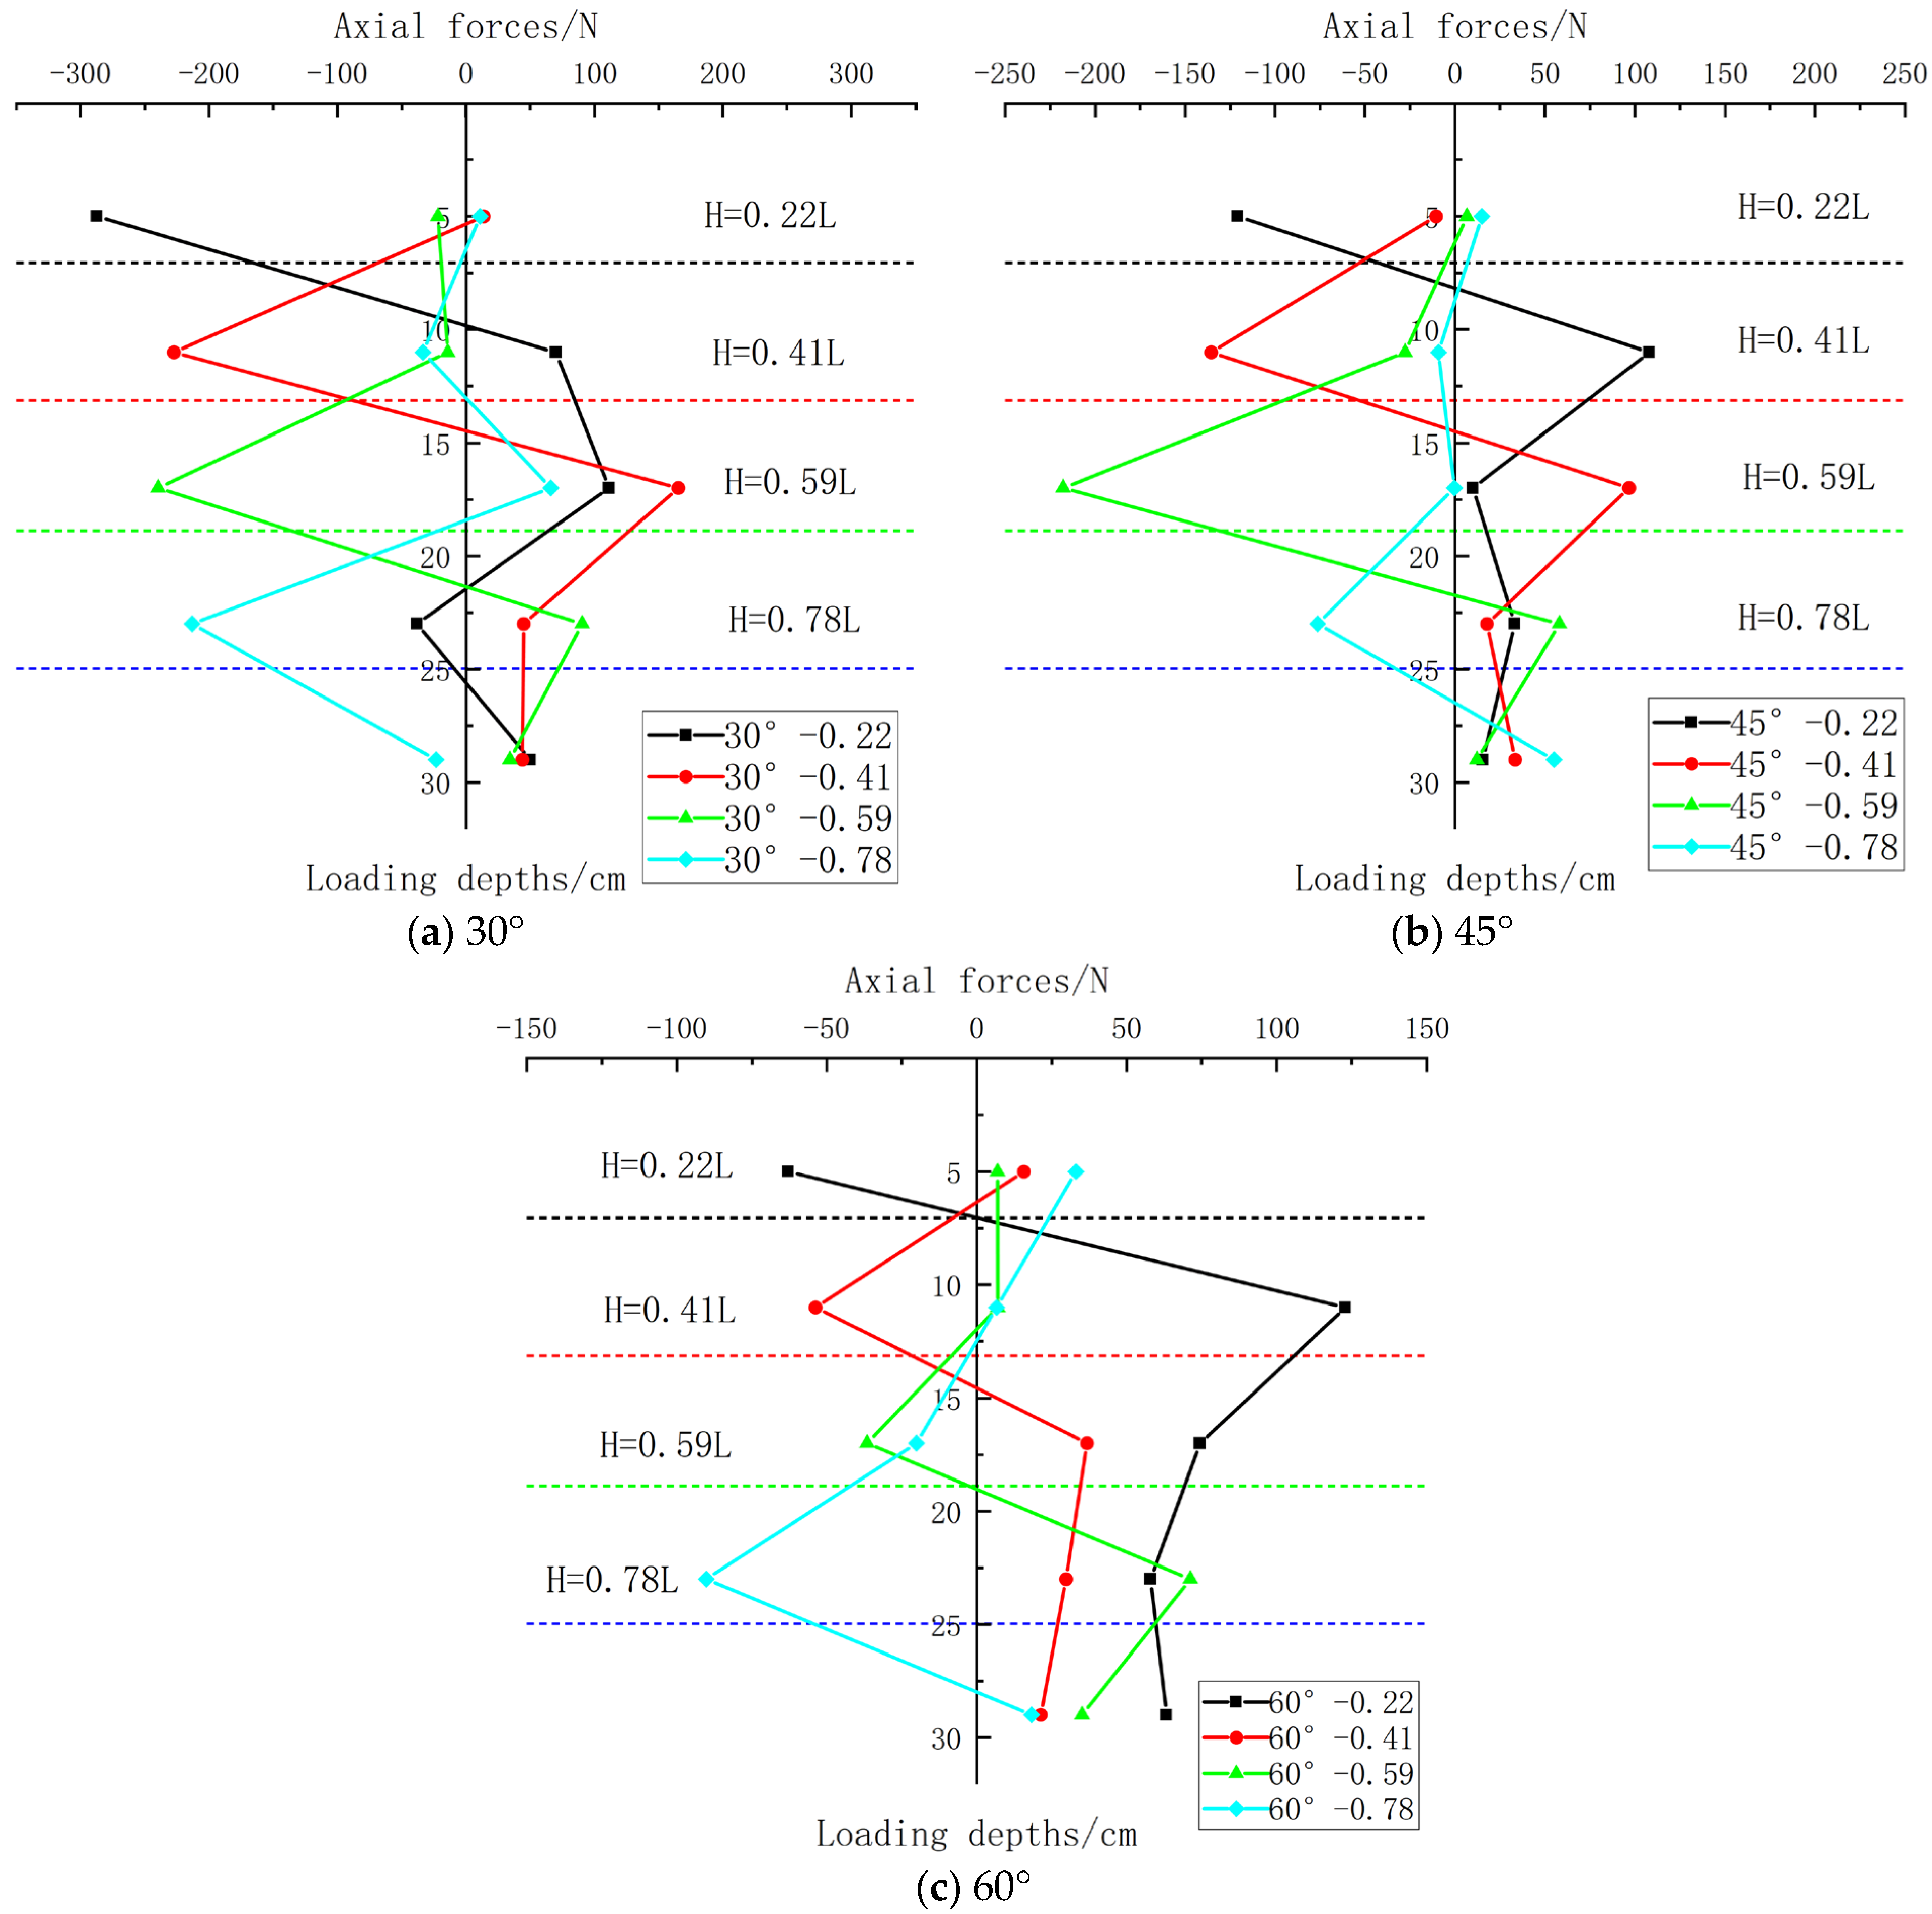
(1) Overall observation of
Figure 15 reveals that the axial force variation patterns under different loading depths are fundamentally consistent. A zero-crossing consistently occurs at the loading point, indicating compression in the pile above the loading point and tension below it.
(2) The maximum negative axial forces and maximum positive axial forces in
Figure 15 are given in
Table 5a–c.
(3) For loading at the same angle but different depths, the axial force distribution along the pile depth follows a consistent pattern: an abrupt change occurs near the loading point, with the upper segment under compression and the lower segment under tension. The non-zero initial axial force observed at H = 0.22L is likely due to the loading point’s upper location, limited strain gauge coverage, and insufficient data acquisition in shallow zones.
3.5.2. Axial Force Distribution Pattern Under Different Loading Angles
At loading depths of
H = 0.22
L,
H = 0.41
L,
H = 0.59
L, and
H = 0.78
L, the analysis and comparison of the variation patterns of shear force with depth in the model pile under different loading angles are shown in
Figure 16 below:
Figure 16.
Comparison of axial forces under different loading angles.
Figure 16.
Comparison of axial forces under different loading angles.
(1) Overall observation of
Figure 16 reveals that during inclined loading on the model pile shaft, the axial force distribution along the depth exhibits a distinct pattern, consistently presenting a “lightning-bolt” shape: one segment is positive (indicating compression in the pile) and the other negative (indicating tension). At
H = 0.22
L and
H = 0.78
L, incomplete data coverage due to insufficient strain gauge groups results in gaps in the axial force distribution plots. The actual distribution should resemble
Figure 16b.
(2) Observation indicates that as the loading angle increases, the pile axial force progressively decreases. This corresponds to the reduction in the pile’s ultimate bearing capacity as the horizontal load component diminishes.
3.5.3. Processing Results of Pile Axial Force Under Saturated Sand Condition
Under saturated sand conditions, inclined loading tests at angles of 30°, 45°, and 60° were conducted at a loading depth of
H = 0.41
L. The loading method and data processing approach were identical to those used in dry sand. The variation in pile axial force with burial depth under saturated sand conditions is shown in
Figure 17 below, with a comparative analysis against the results obtained under dry sand conditions.
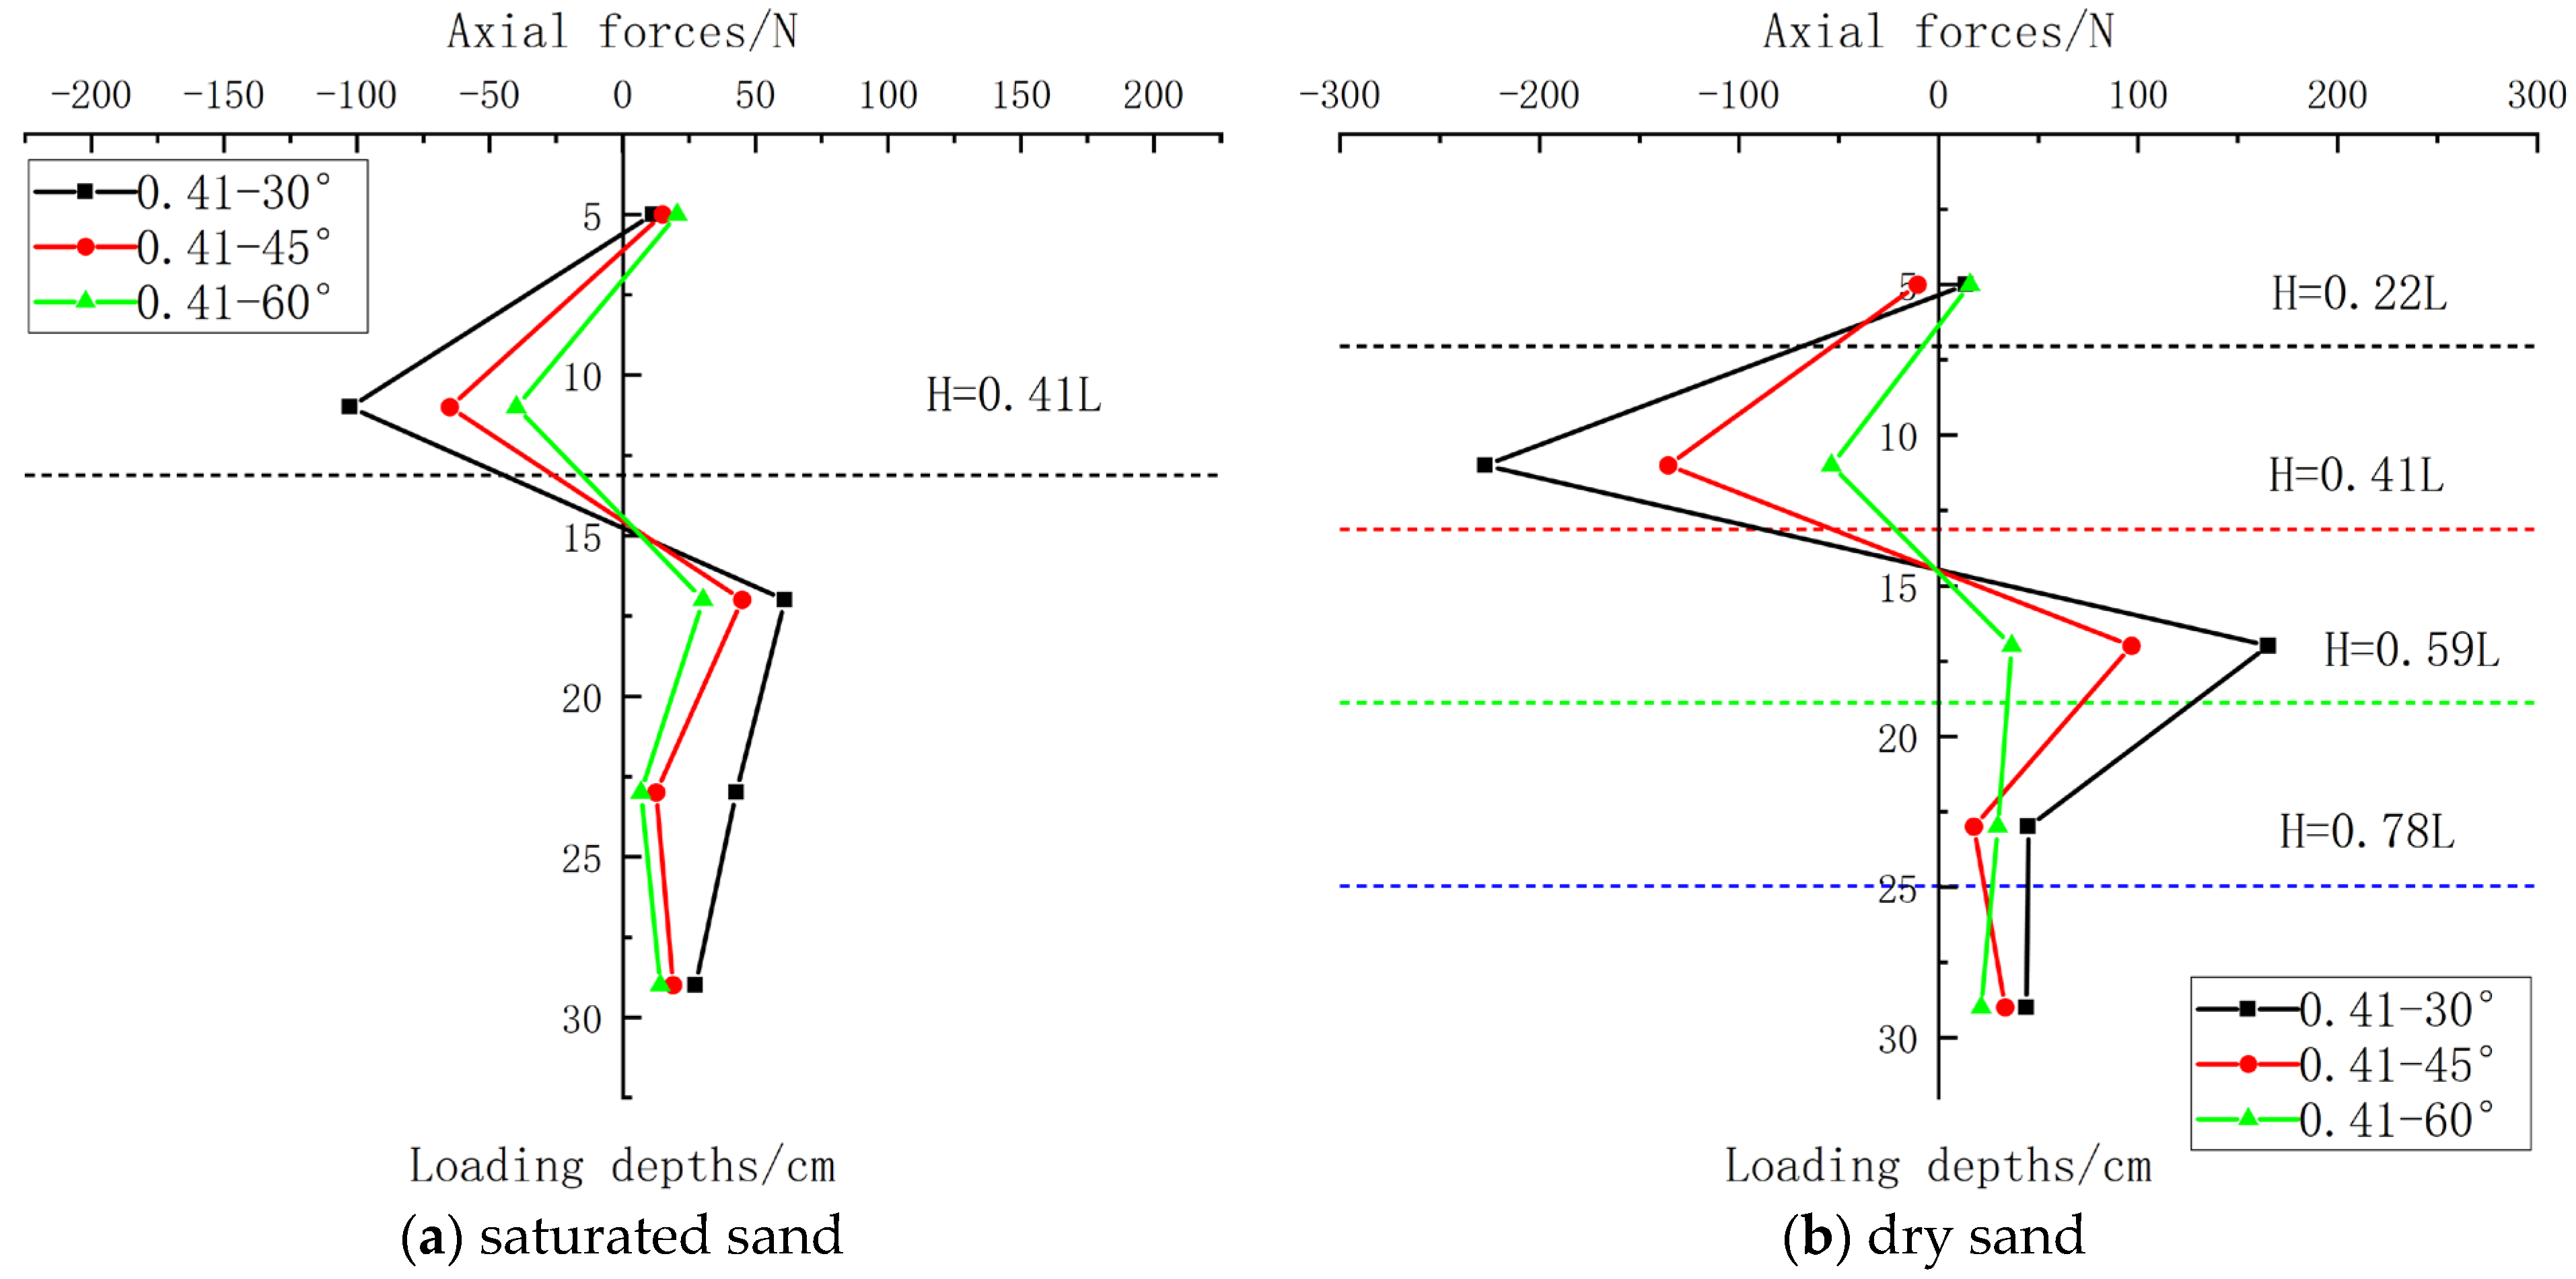
From
Figure 17, it can be observed that the axial force distribution patterns under different soil conditions are fundamentally consistent. As burial depth increases, the axial force initially rises to a maximum negative value, gradually approaches zero near the loading point, then increases to a maximum positive value before gradually decreasing. The pile axial force progressively diminishes as the loading angle increases. The axial force in saturated sand is approximately half of that observed in dry sand.
4. Conclusions
Based on experimental research on the bearing characteristics of single piles under inclined loading, considering factors such as loading angle, loading depth, and soil conditions, this study analyzed the load–displacement curves of model piles and the distribution patterns of bending moment, shear force, and axial force. The conclusions are as follows:
(1) Analysis of the load–displacement curves reveals that as displacement increases, the load on the model pile initially rises to a peak before decreasing and gradually stabilizing. This behavior may result from pile rotation within the soil during servo-cylinder displacement loading, altering the force mechanism. Rotation ceases when vertical load dominates, leading to post-peak load stabilization. Overall, the ultimate pullout capacity is highest at H = 0.78L.
(2) Loading angle significantly influences pile bearing performance. As the angle increases, vertical load gradually dominates, inducing vertical pullout failure. The bearing capacity decreases by ~63% when the angle increases from 30° to 60°.
(3) Increasing loading depth reduces bearing capacity when loading at the pile mid-depth, likely due to loosening of the soft marine sand around the pile, reducing surrounding soil resistance.
(4) At identical loading depths, bending moment distributions under different angles exhibit similar patterns but differ in magnitude. Variations primarily stem from loading depth changes: inclined loading generates horizontal forces on the upper segment (above the loading point) and lower segment (below), producing corresponding bending responses.
(5) Under insufficient experimental bending moment data, the shear force calculation method based on Akima Interpolation Theory effectively overcomes data limitations, accurately deriving shear distributions in upper/lower pile segments. Shear force trends align with bending moments regarding depth/angle effects. Axial force consistently shows abrupt changes near the loading point, confirming compression above and tension below.
(6) Under different sand conditions, the bearing capacity in saturated sand is about 50% of that in dry sand. Internal force distributions remain consistent but exhibit reduced magnitudes.
In the practical application of anchor piles, a low cable-stayed angle means that a longer anchor chain is required, which increases costs. However, the foundation bearing performance of a high cable-stayed angle is not as good as that of a low angle. Therefore, this paper provides certain references for the trade-off in designing the cable-stayed angle of anchor piles. This study provides a relatively comprehensive analysis for the research on flexible pile-anchor foundations under the conditions of saturated sand and dry sand, considering the influences of different loading points and different loading angles. However, the current research does not take into account the foundation bearing characteristics of flexible piles under cyclic loads, and these factors will be the key focus areas of future research.
