Ship Air Emission and Their Air Quality Impacts in the Panama Canal Area: An Integrated AIS-Based Estimation During Hotelling Mode in Anchorage Zone
Abstract
1. Introduction
1.1. Maritime Emissions and Global Context
1.2. AIS-Based Methodologies: Current State and Limitations
1.3. Panama Canal as a Case Study
1.4. Research Objectives and Contributions
2. Materials and Methods
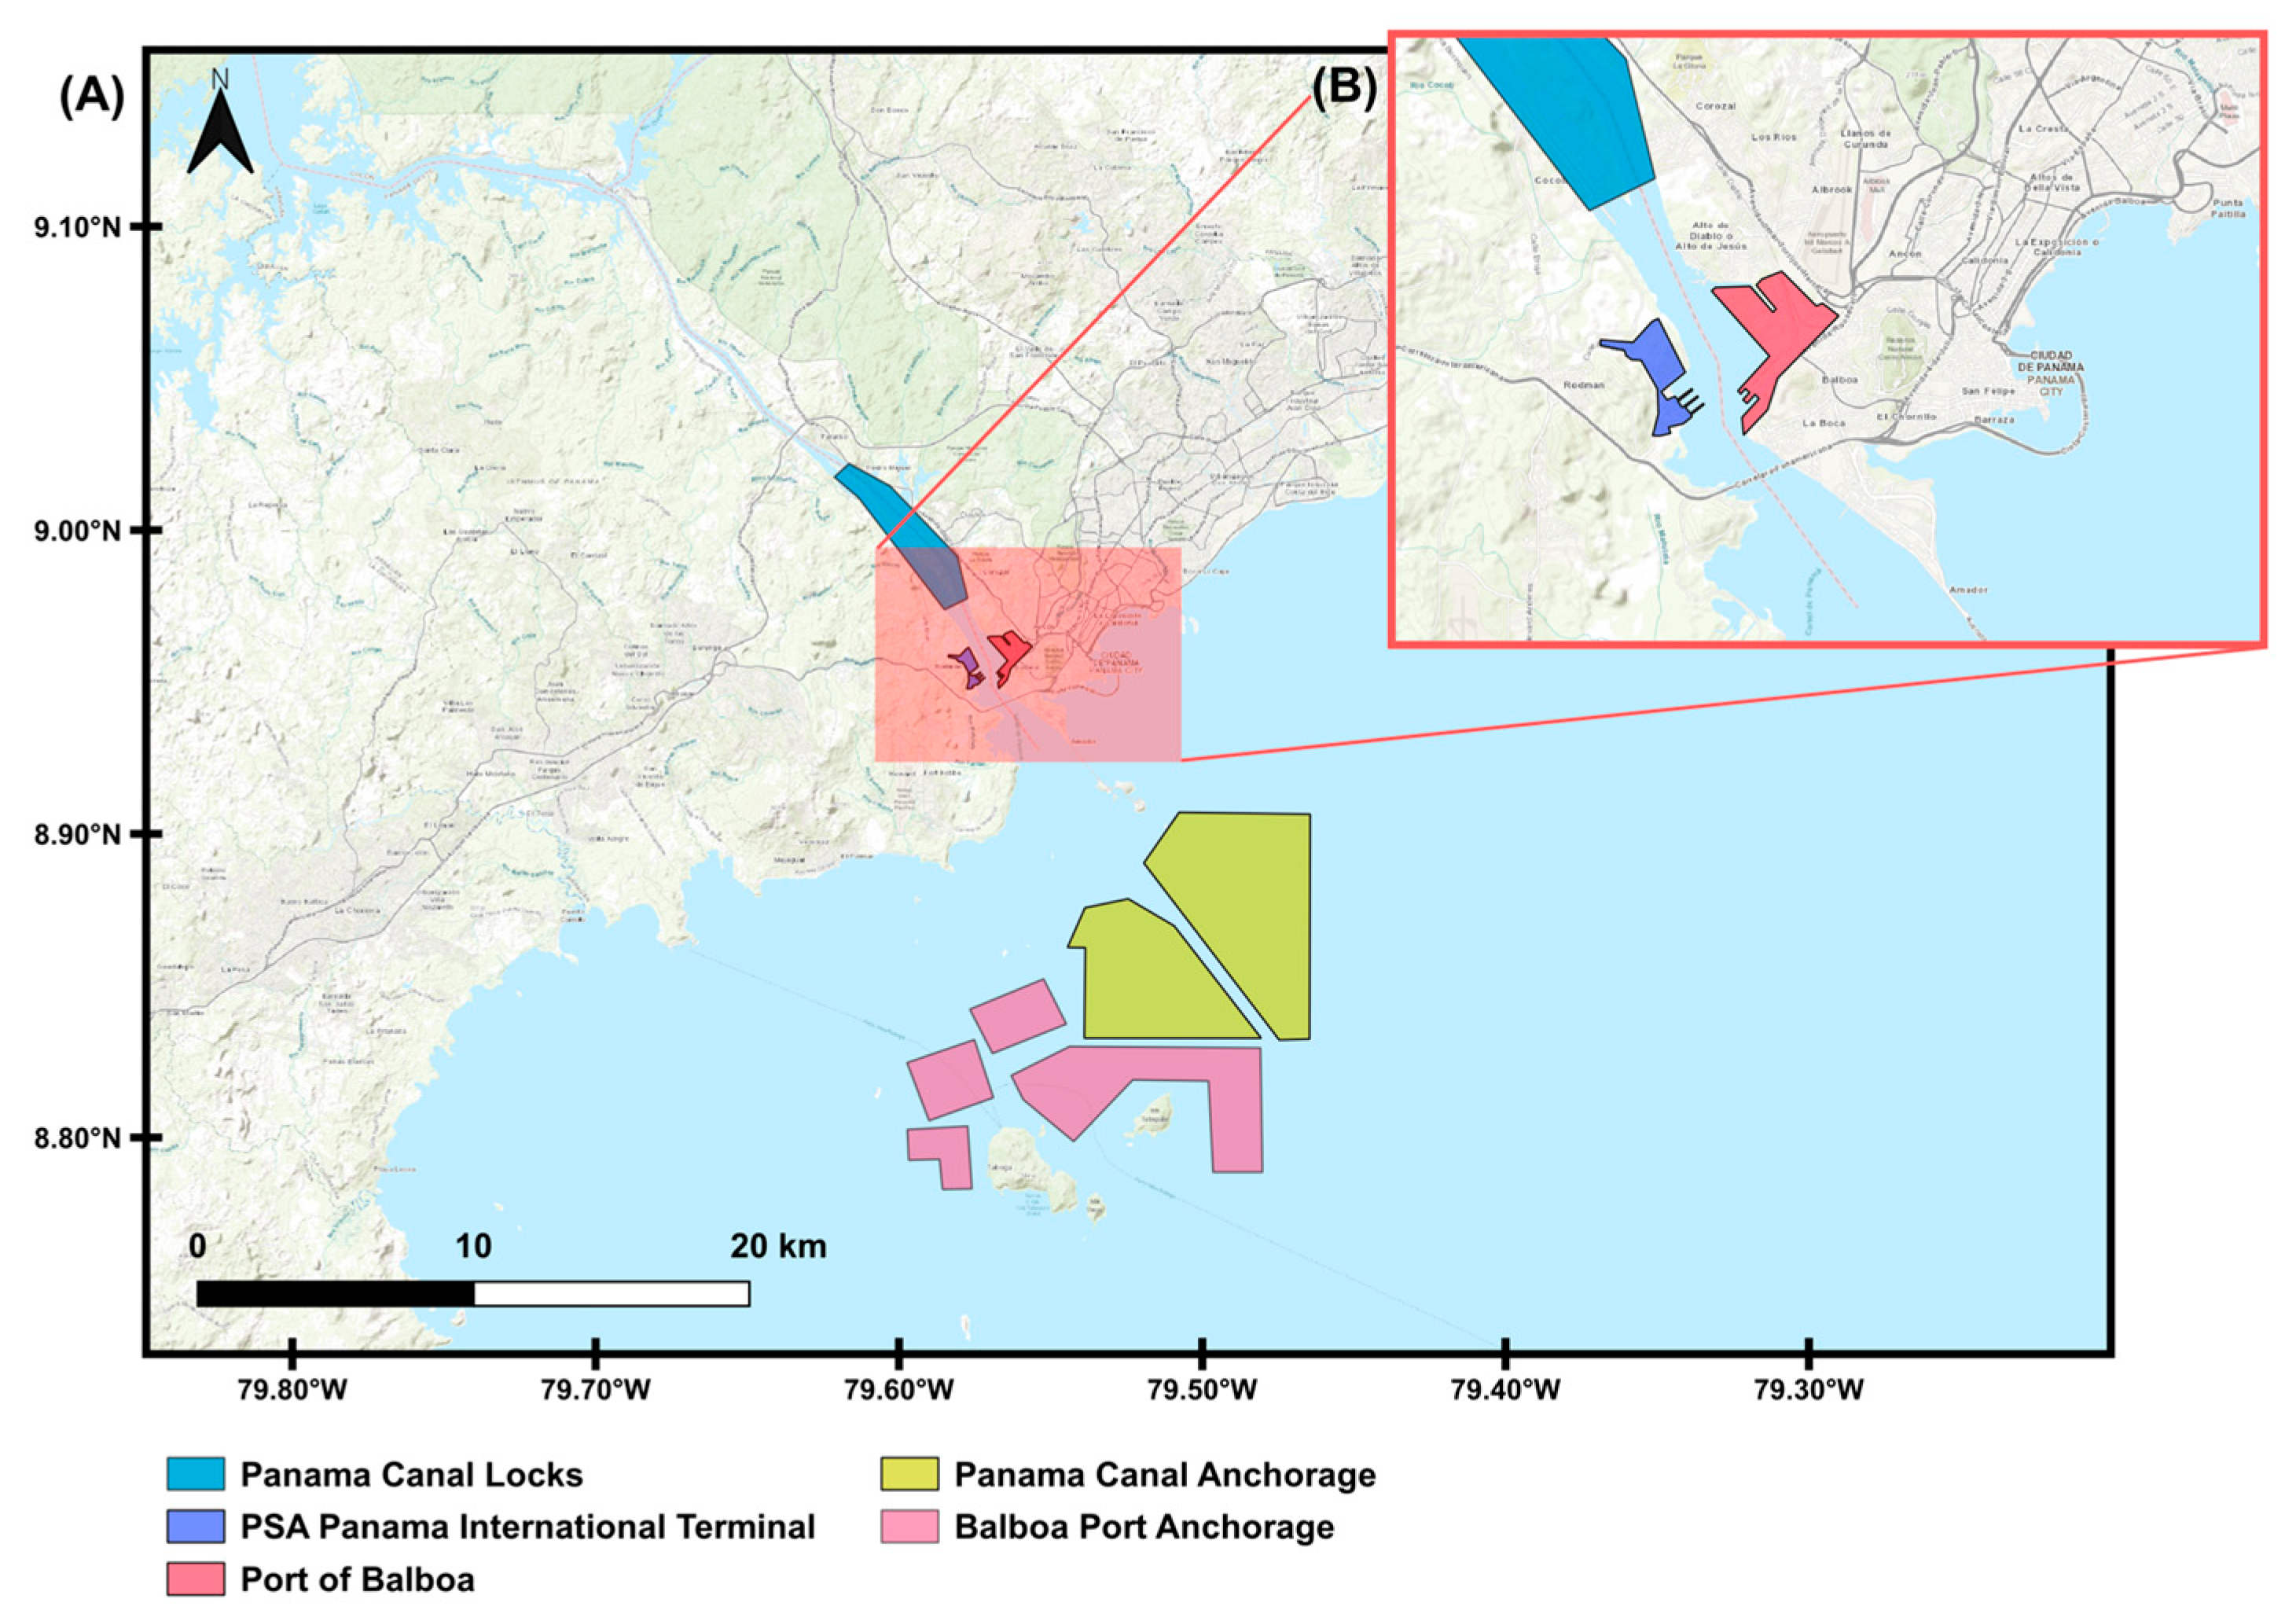
2.1. Study Domain
2.2. Automatic Identification System Data and Processing
2.3. AIS-Based Approach for Vessel Waiting Time Estimation in Panama
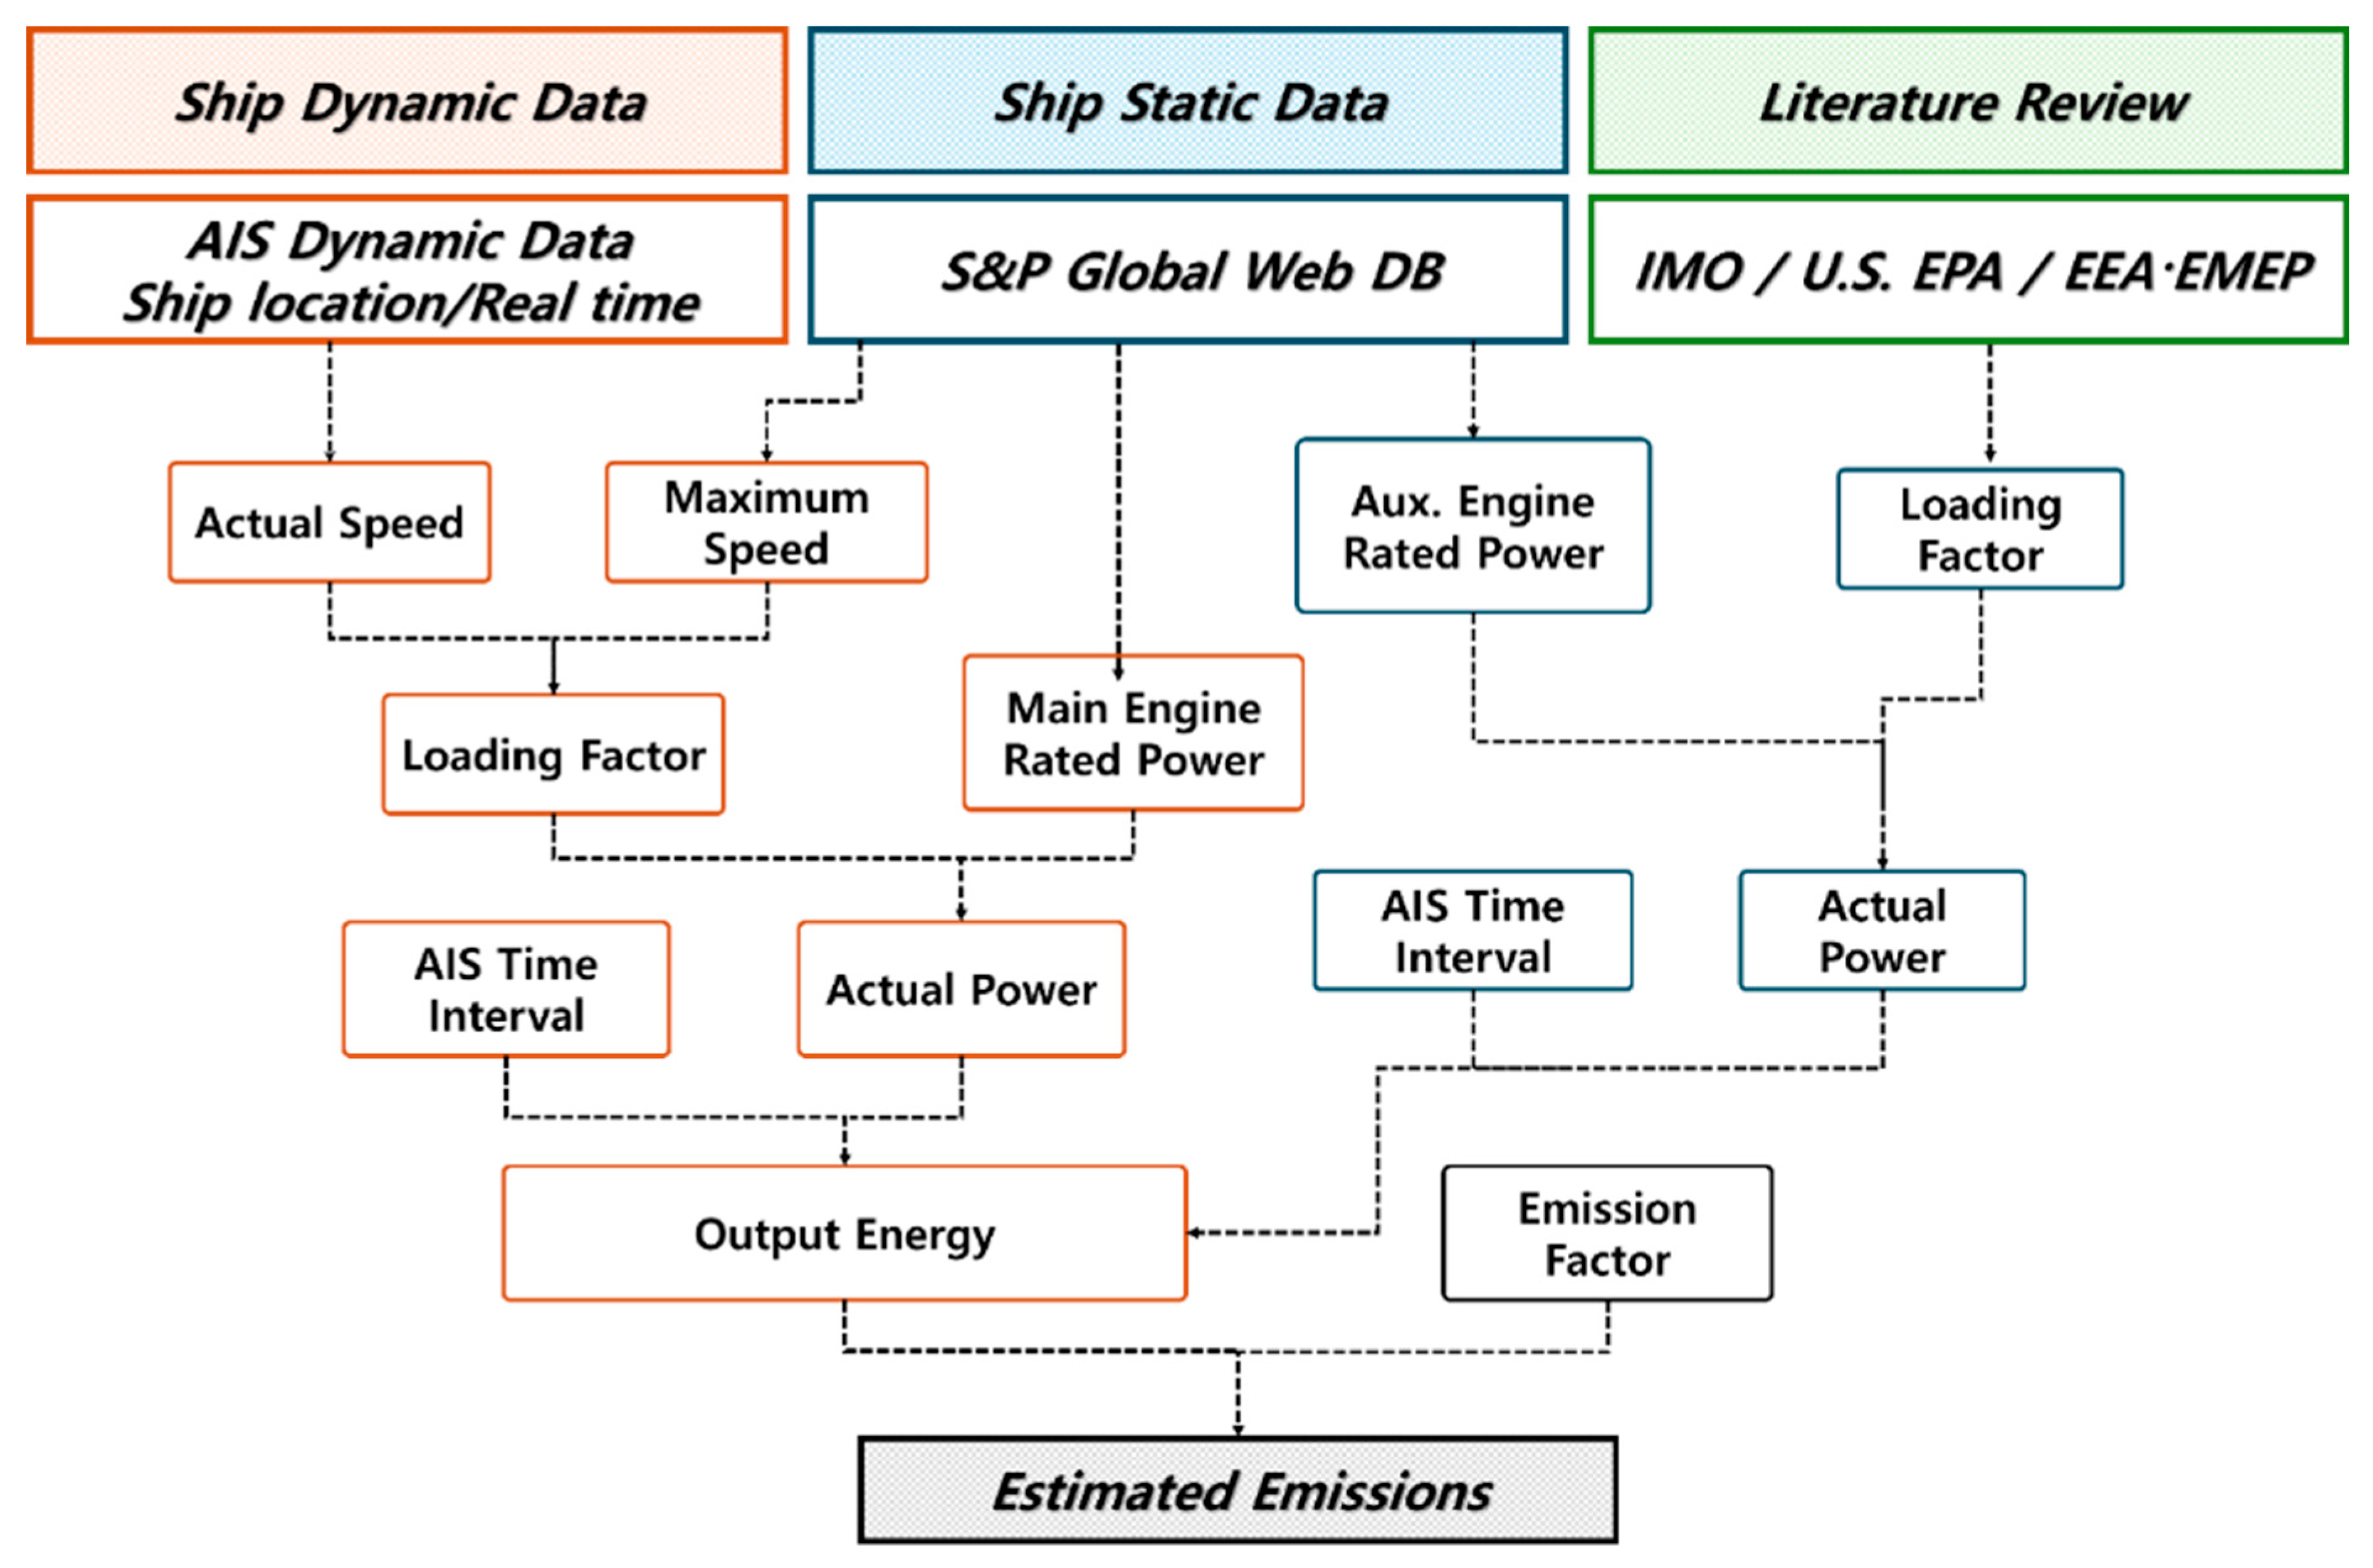
2.4. AIS-Based Ship Emission Estimation
- Main engine (ME) load and emissions
- Parameters:
- Auxiliary engine (AE) load and emissions
- Parameters:
- Aggregation
| Engine Type/Mode | Fuel Type | SFC (g/kWh) | Loading Factor (LF) |
|---|---|---|---|
| Main engine (2-stroke, slow-speed) | HFO | 185–195 | |
| Main engine (4-stroke, medium-speed) | HFO/MDO | 200–210 | |
| Auxiliary engine— Anchorage (hotelling) | MDO/MGO | 215–225 | 0.20–0.40 [IMO, EMEP/EEA] |
| Auxiliary engine— Maneuvering | MDO/MGO | 215–225 | 0.50 [EMEP/EEA] |
| Auxiliary engine— Cruising | MDO/MGO | 215–225 | 0.80 [EMEP/EEA] |
| Pollutant | EF (g/kWh) Main Engine | EF (g/kWh) Auxiliary Engine | EF (g/kg Fuel) |
|---|---|---|---|
| NOx | 2.6–17.0 | 2.0–13.8 | |
| PM10 | |||
| PM2.5 | |||
| SO2 | |||
| CO2 | 3.206 | ||
2.5. Atmospheric Dispersion Modeling
2.5.1. Meteorology Analysis
- (i)
- sea–land breeze (SLB)
- (ii)
- ensemble-like (EL; the canonical year-round pattern)
- (iii)
- southerly wind (SW).
- Parameters:
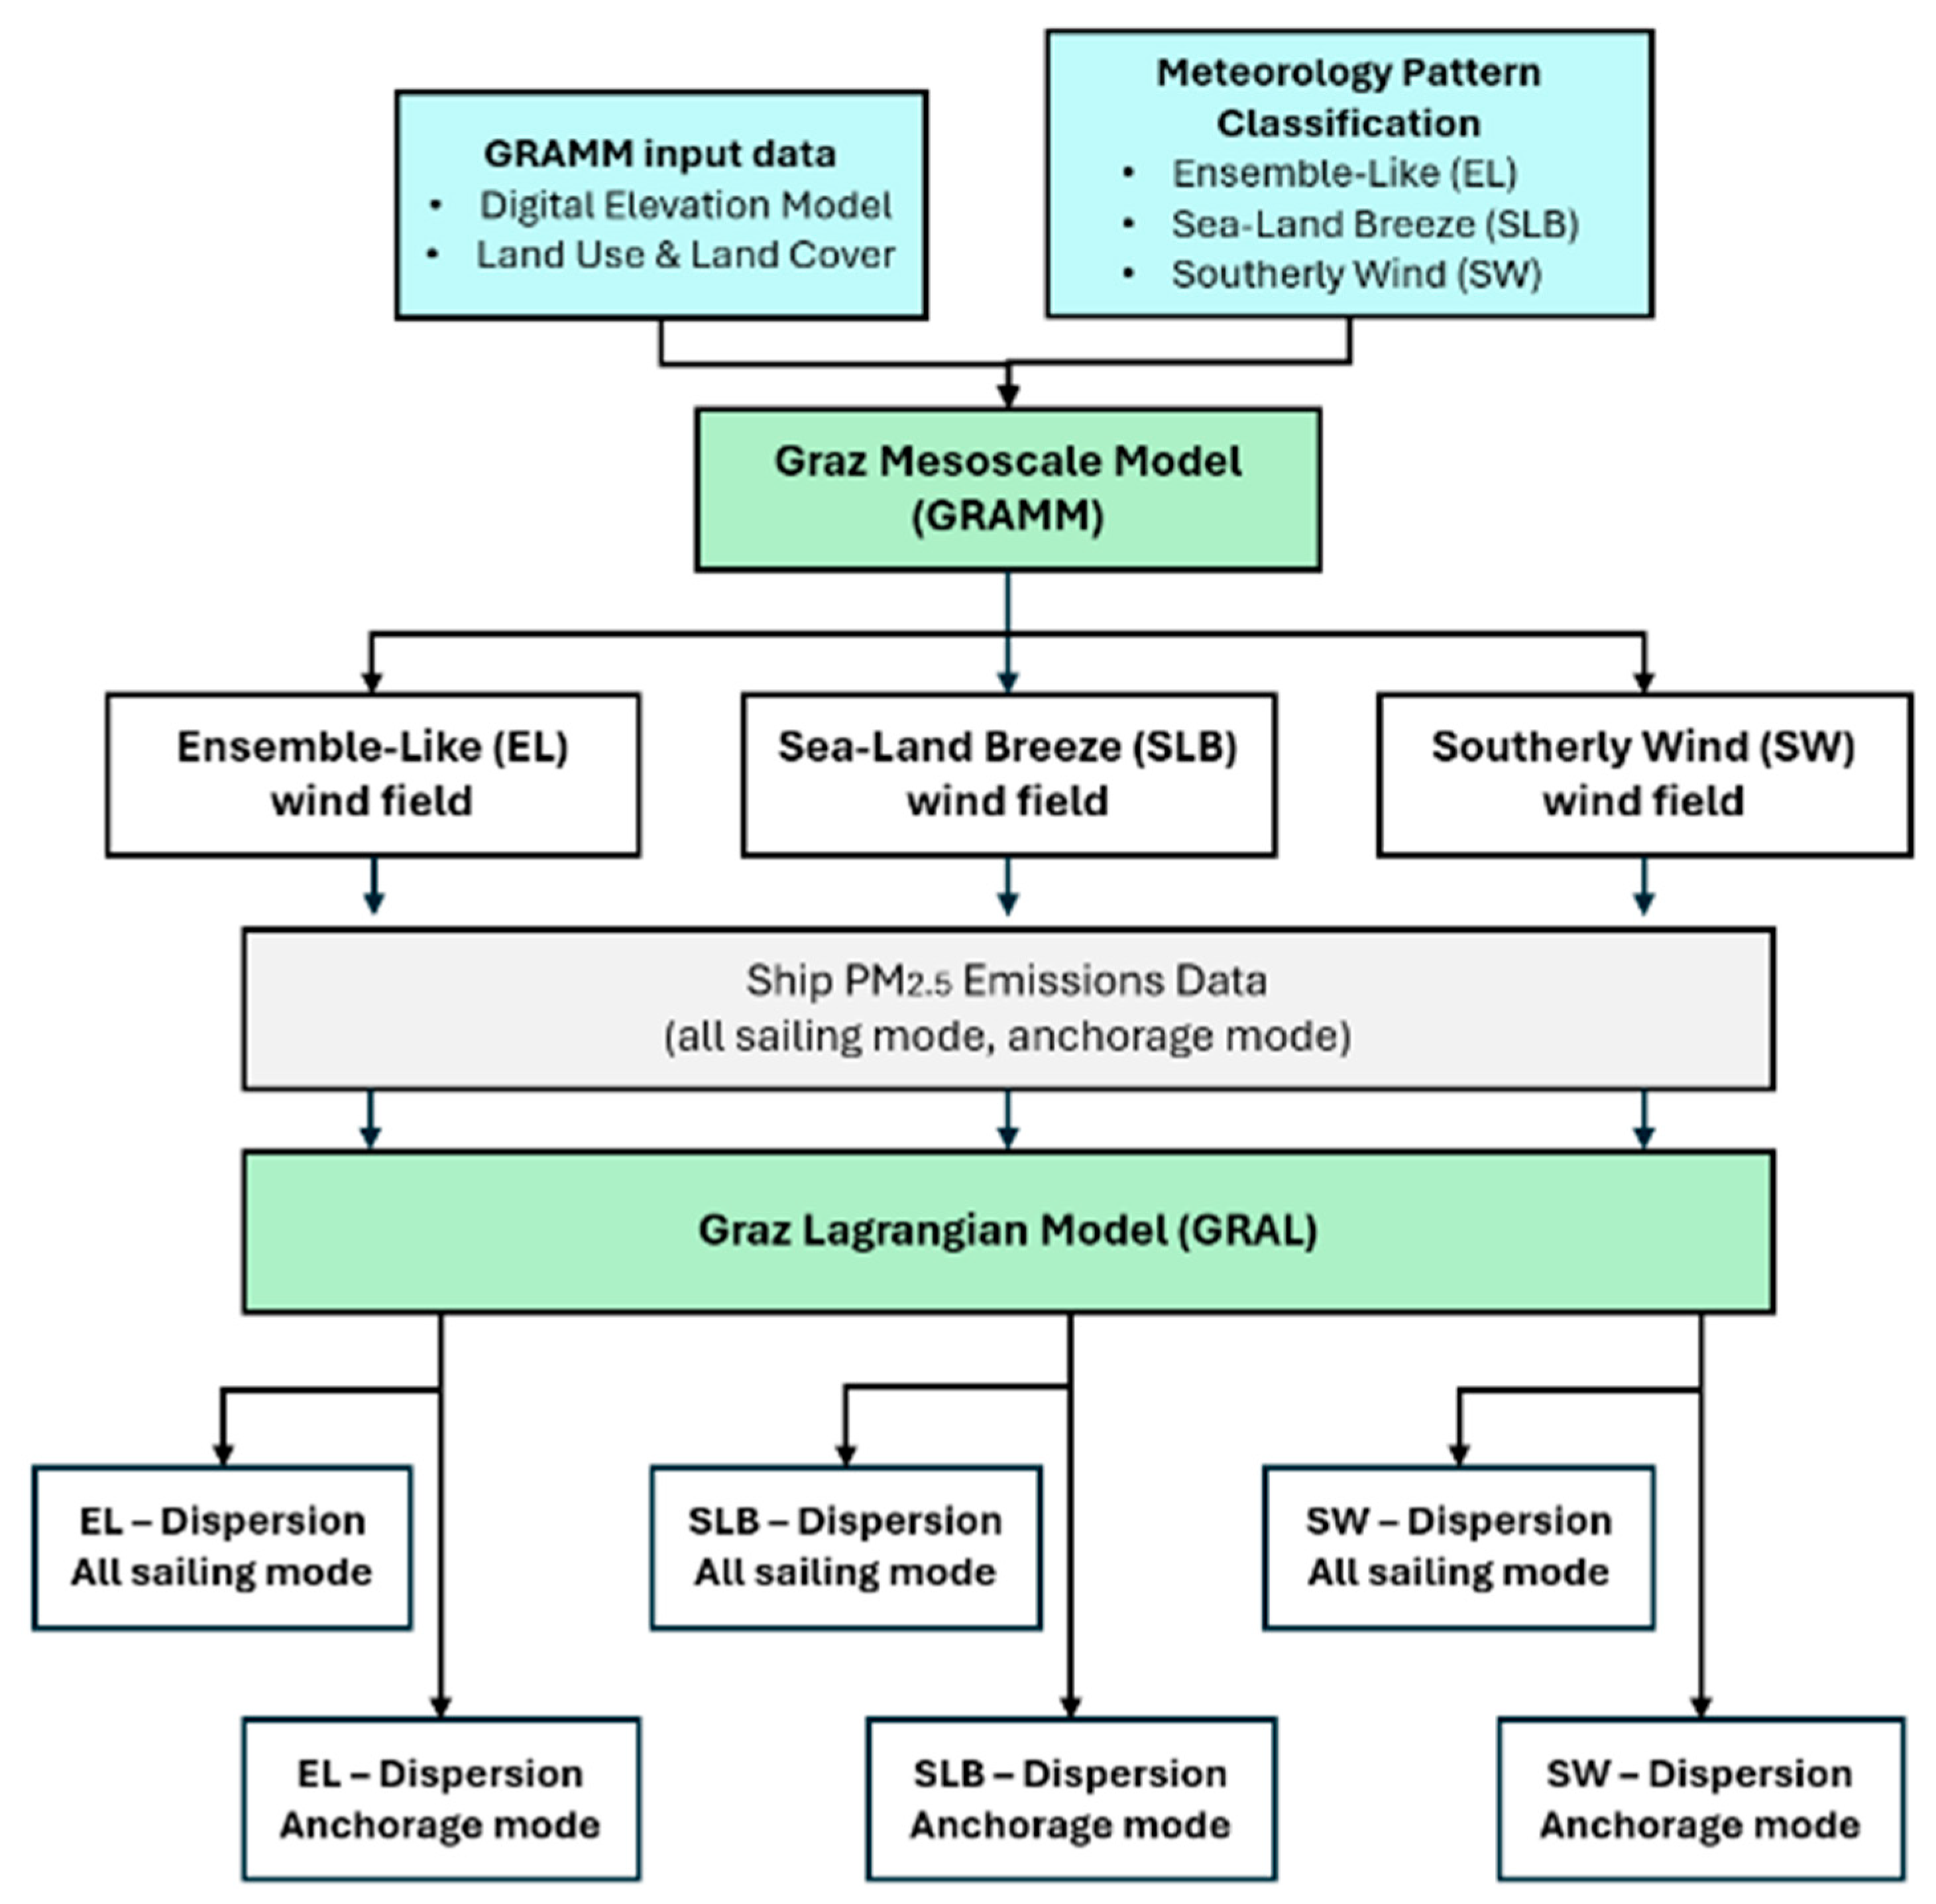
2.5.2. Air Dispersion Modeling
3. Results
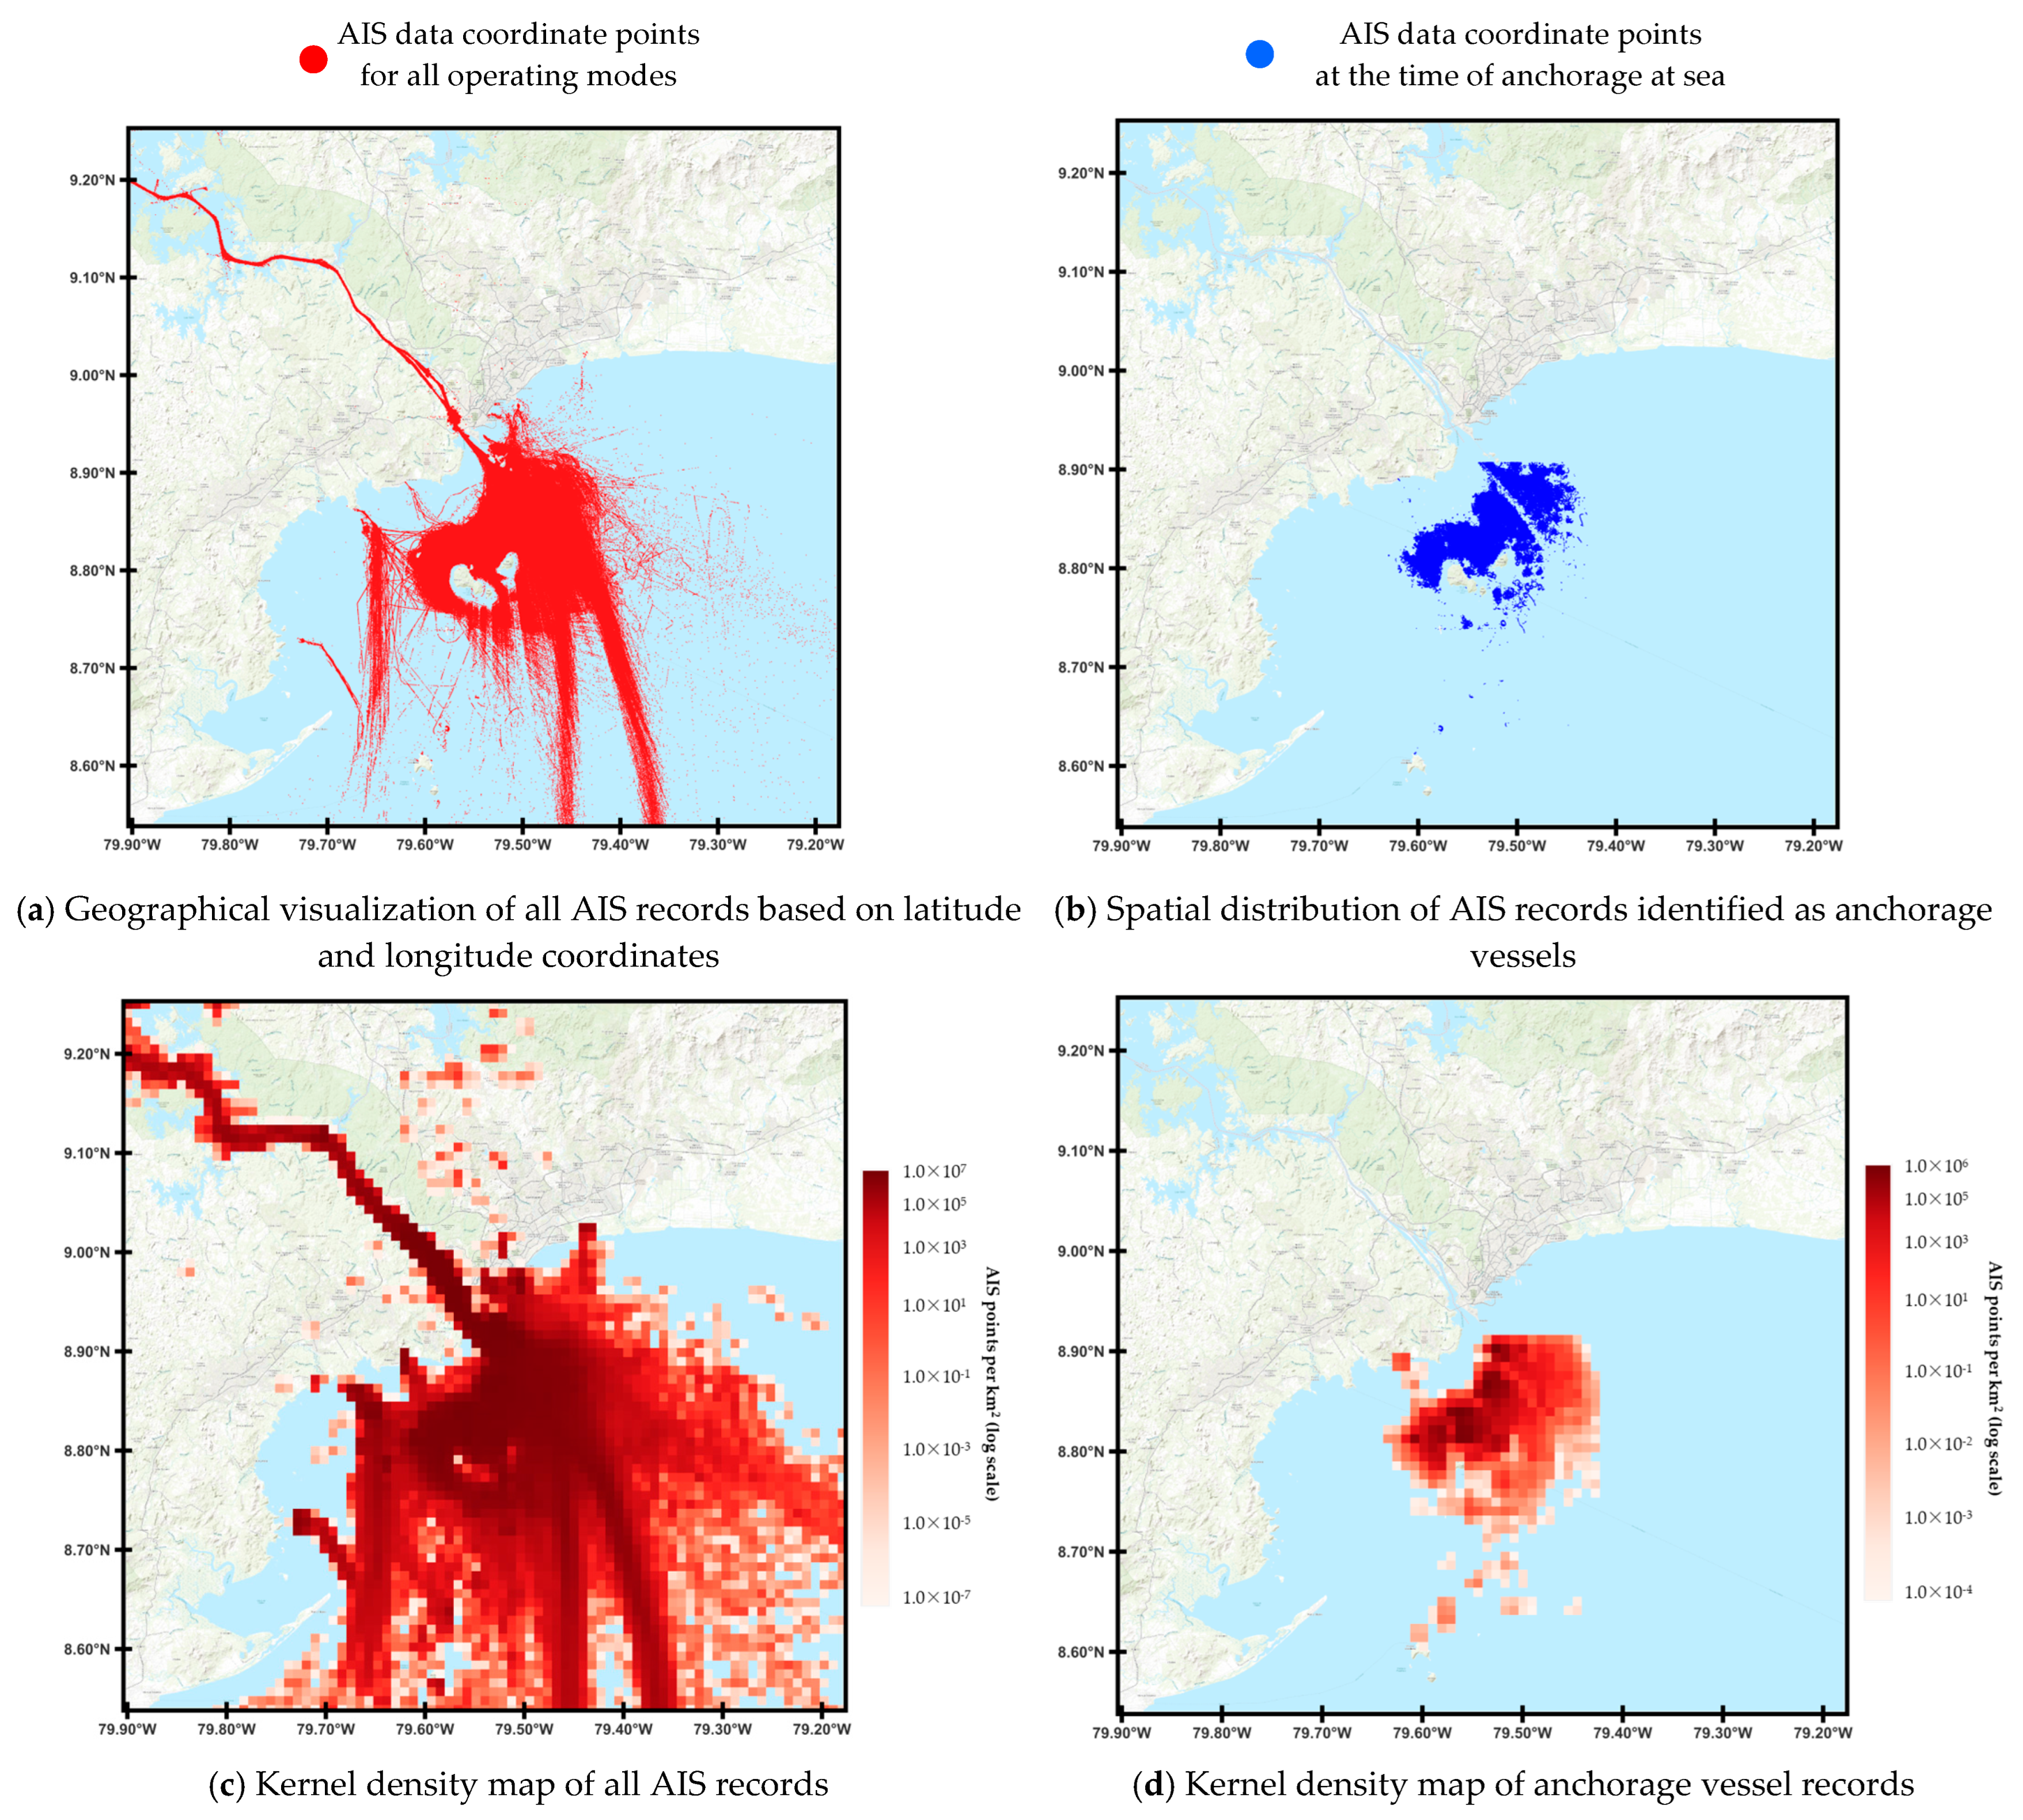
3.1. AIS Data Collection and Processing
3.2. Vessel Waiting Time Analysis in Panama
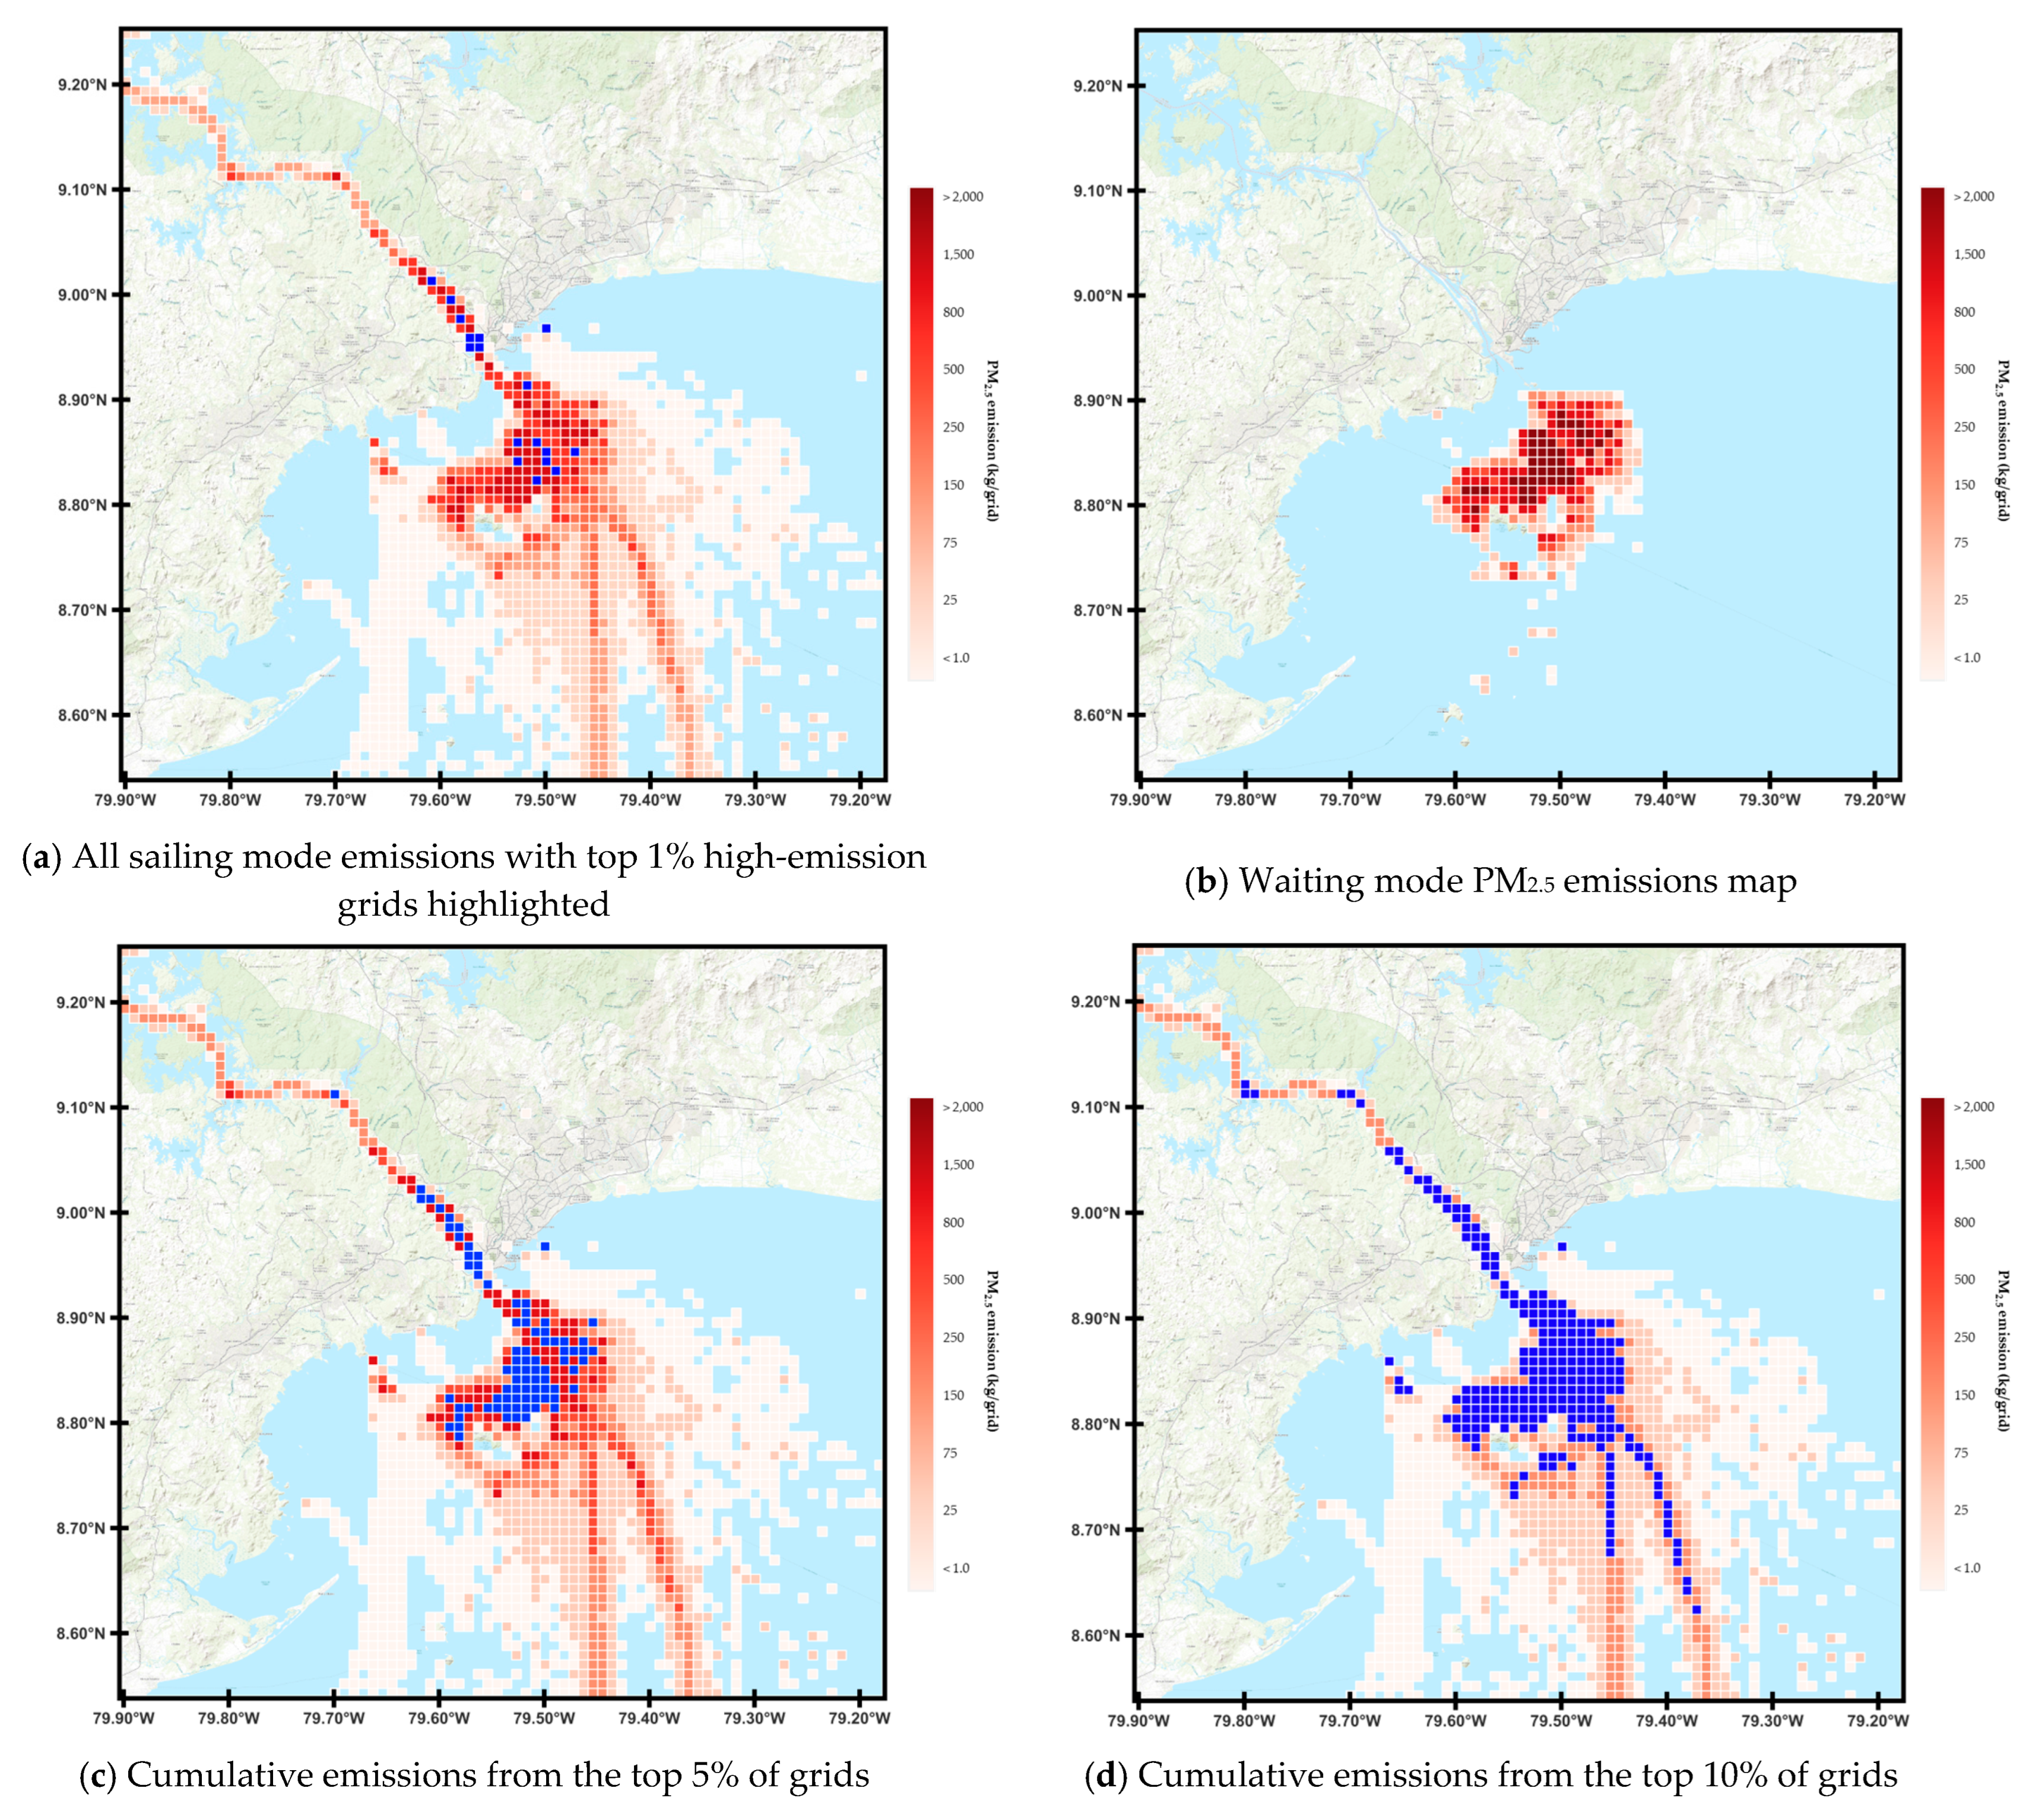
3.3. AIS-Based Ship Emission in Panama
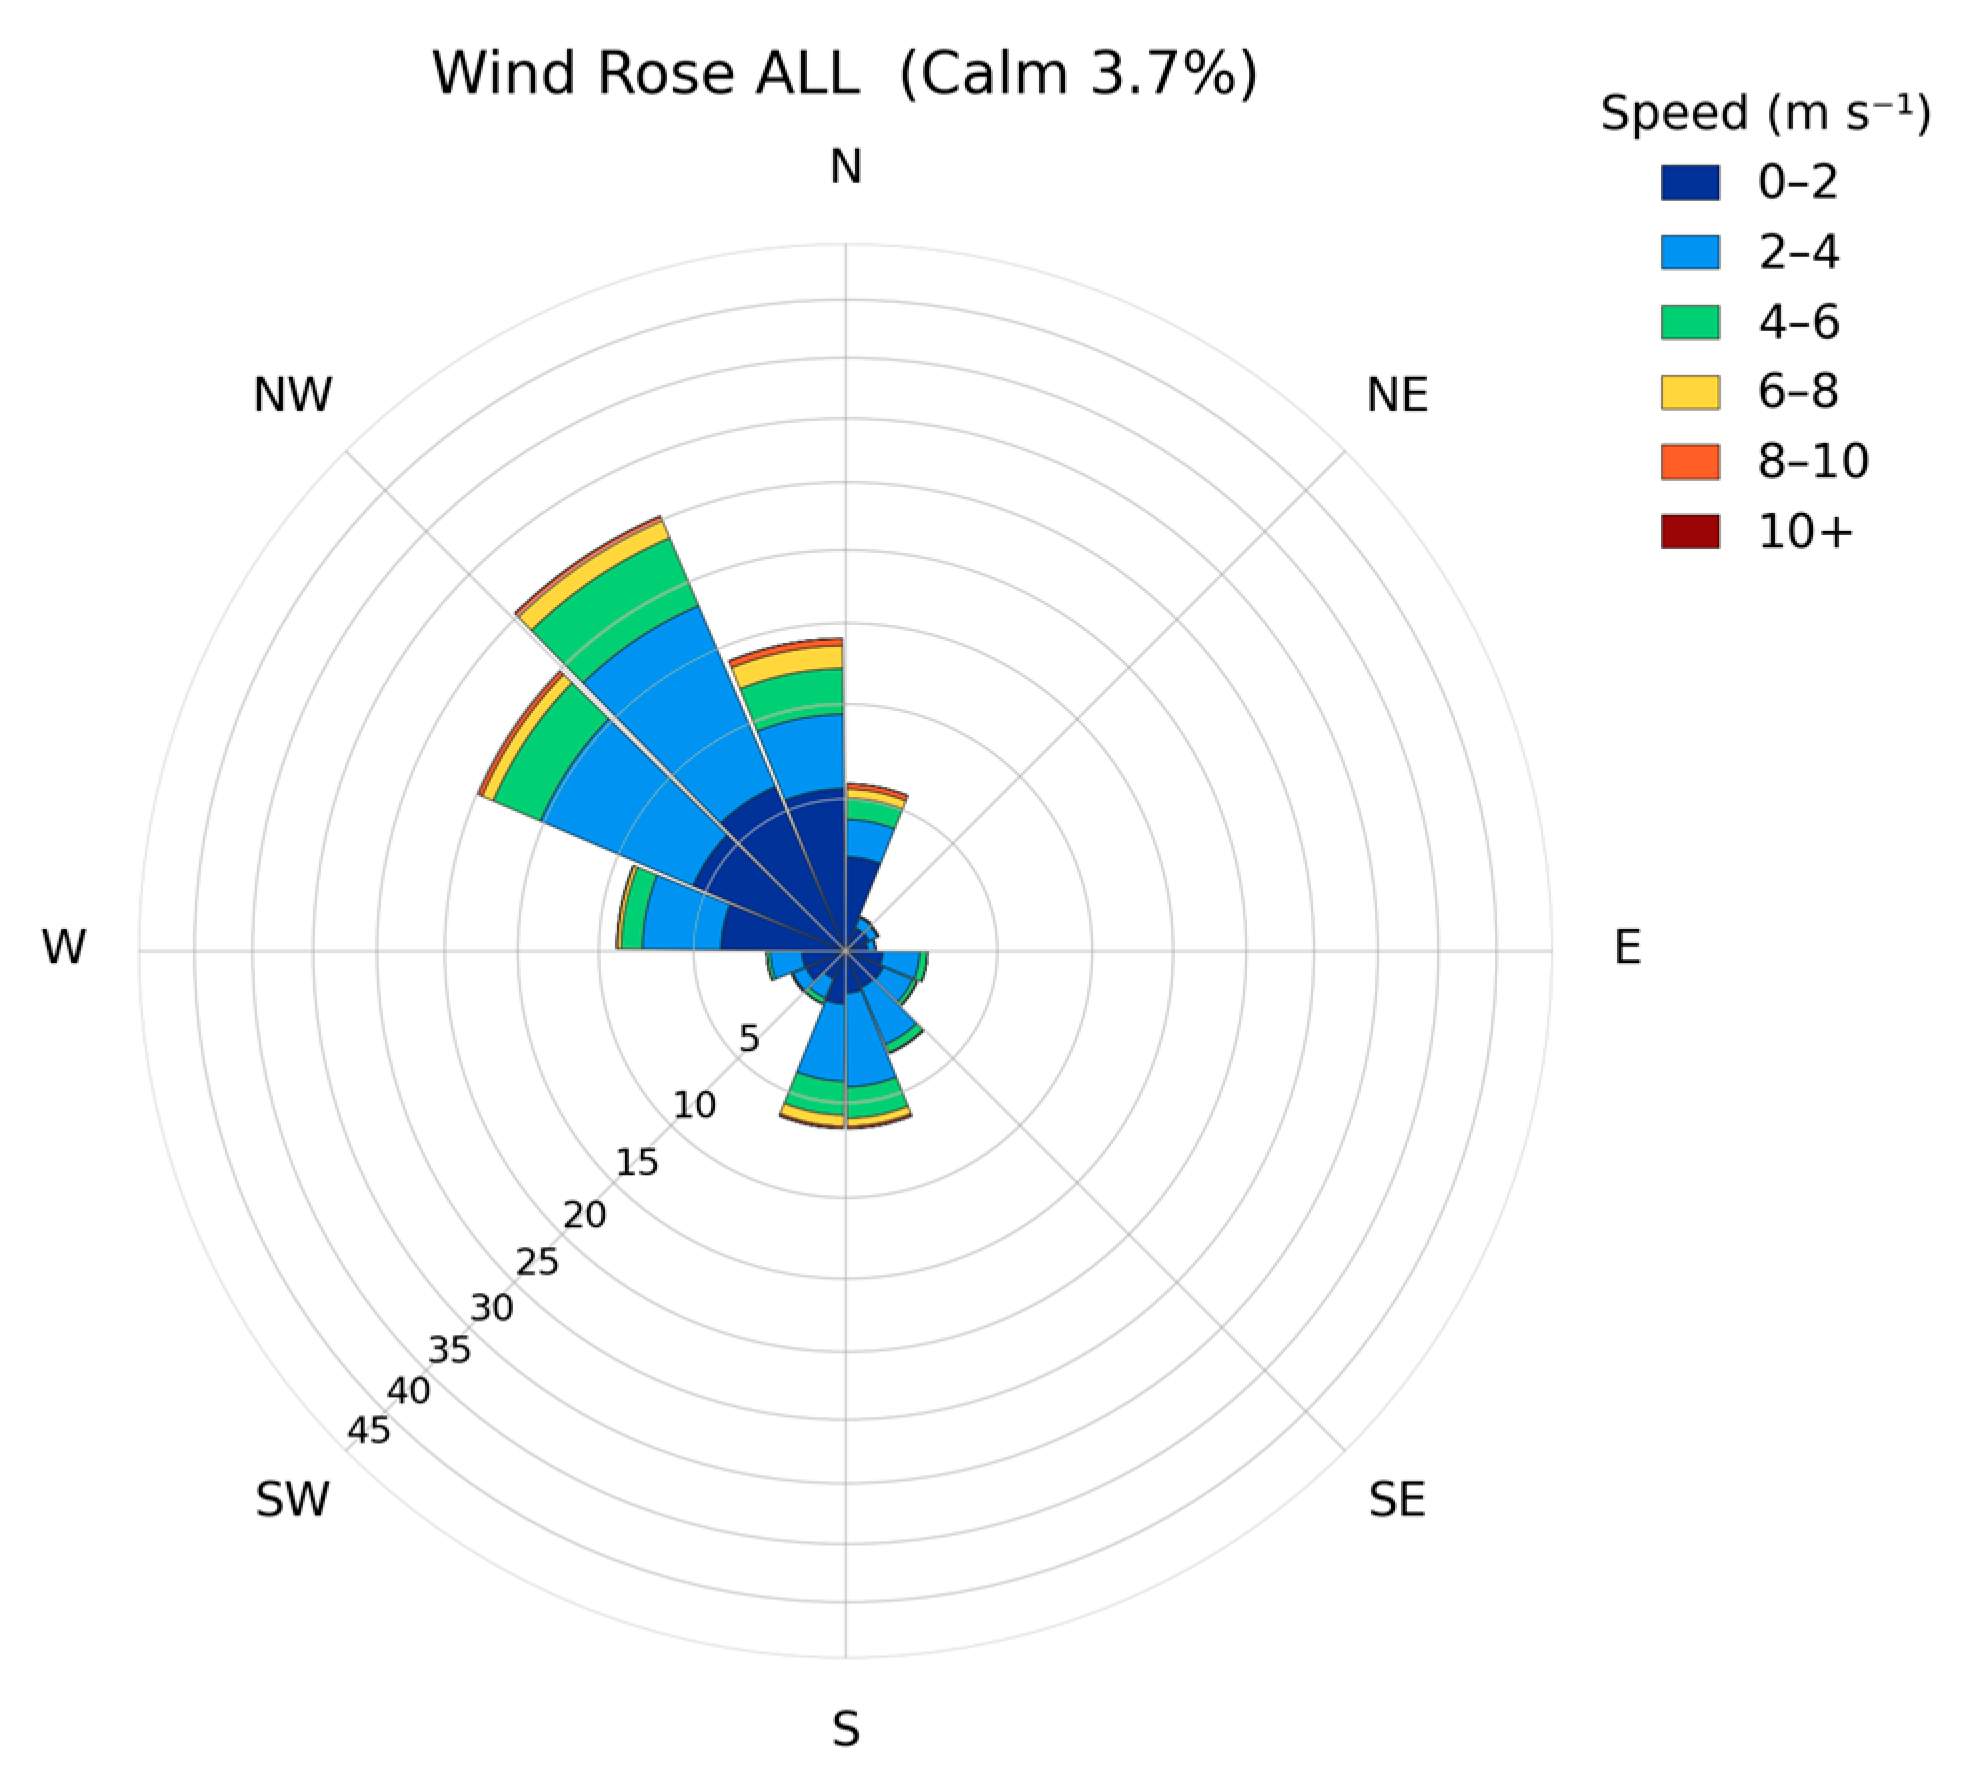
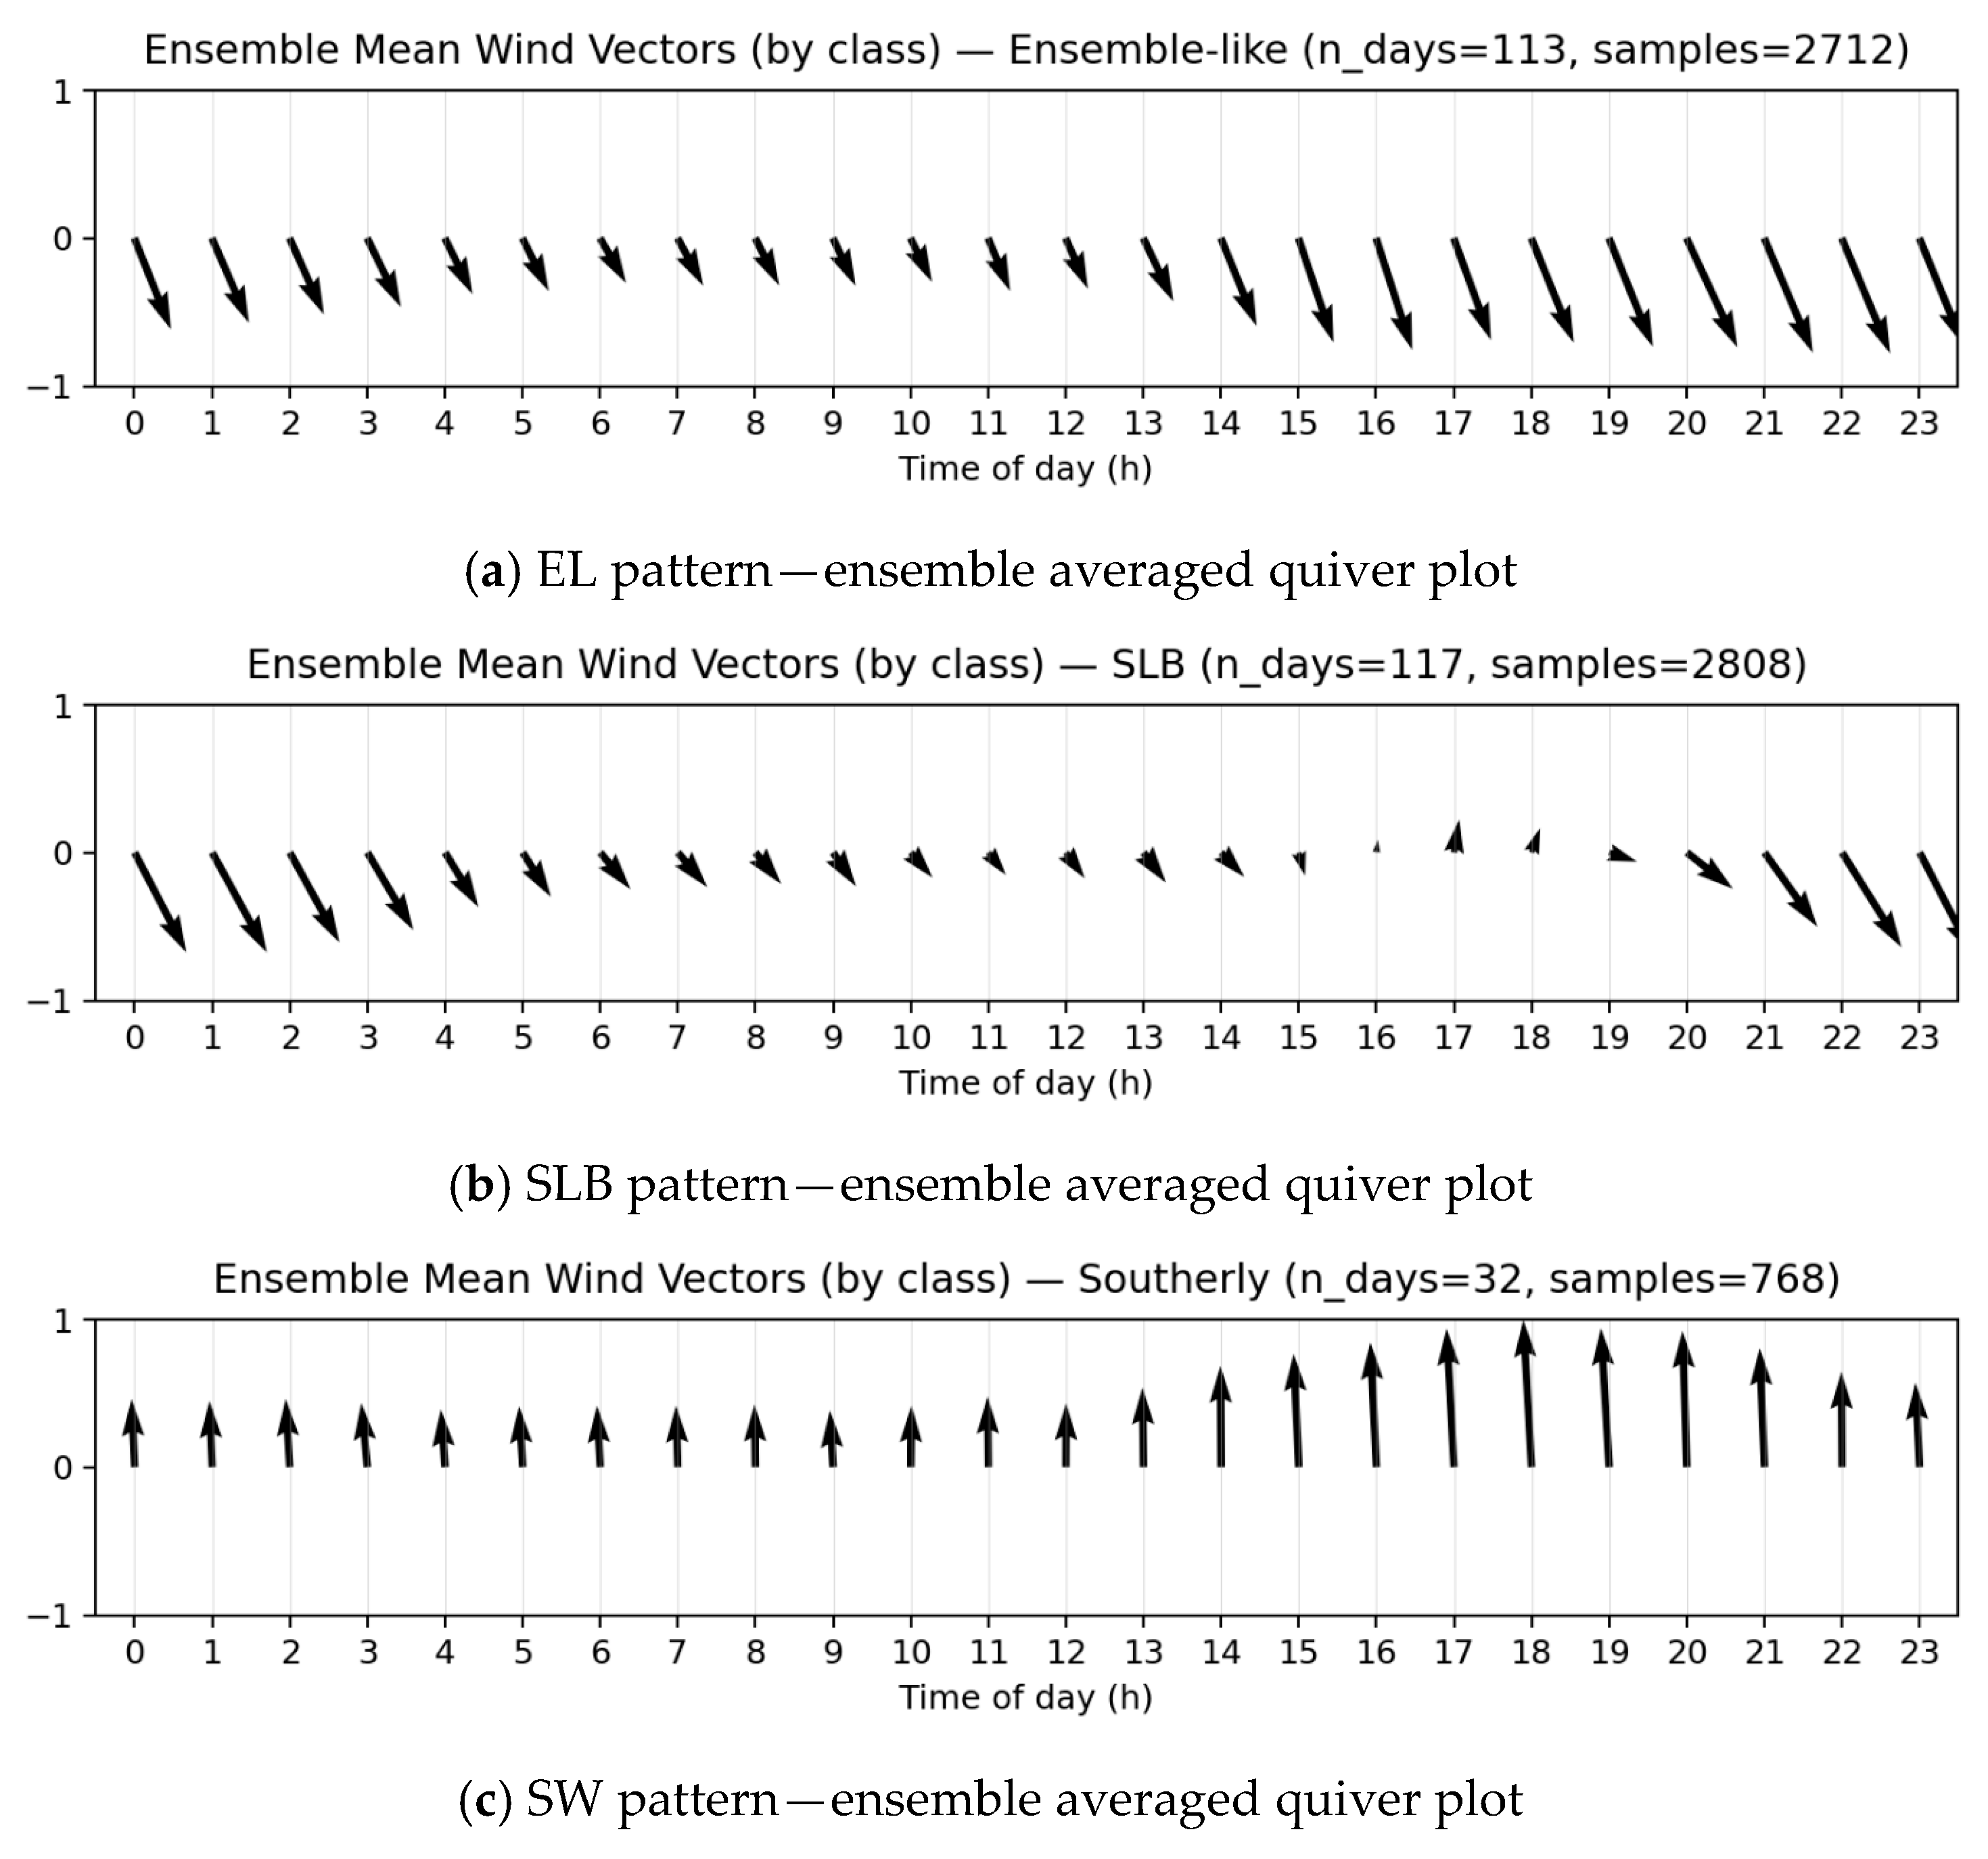
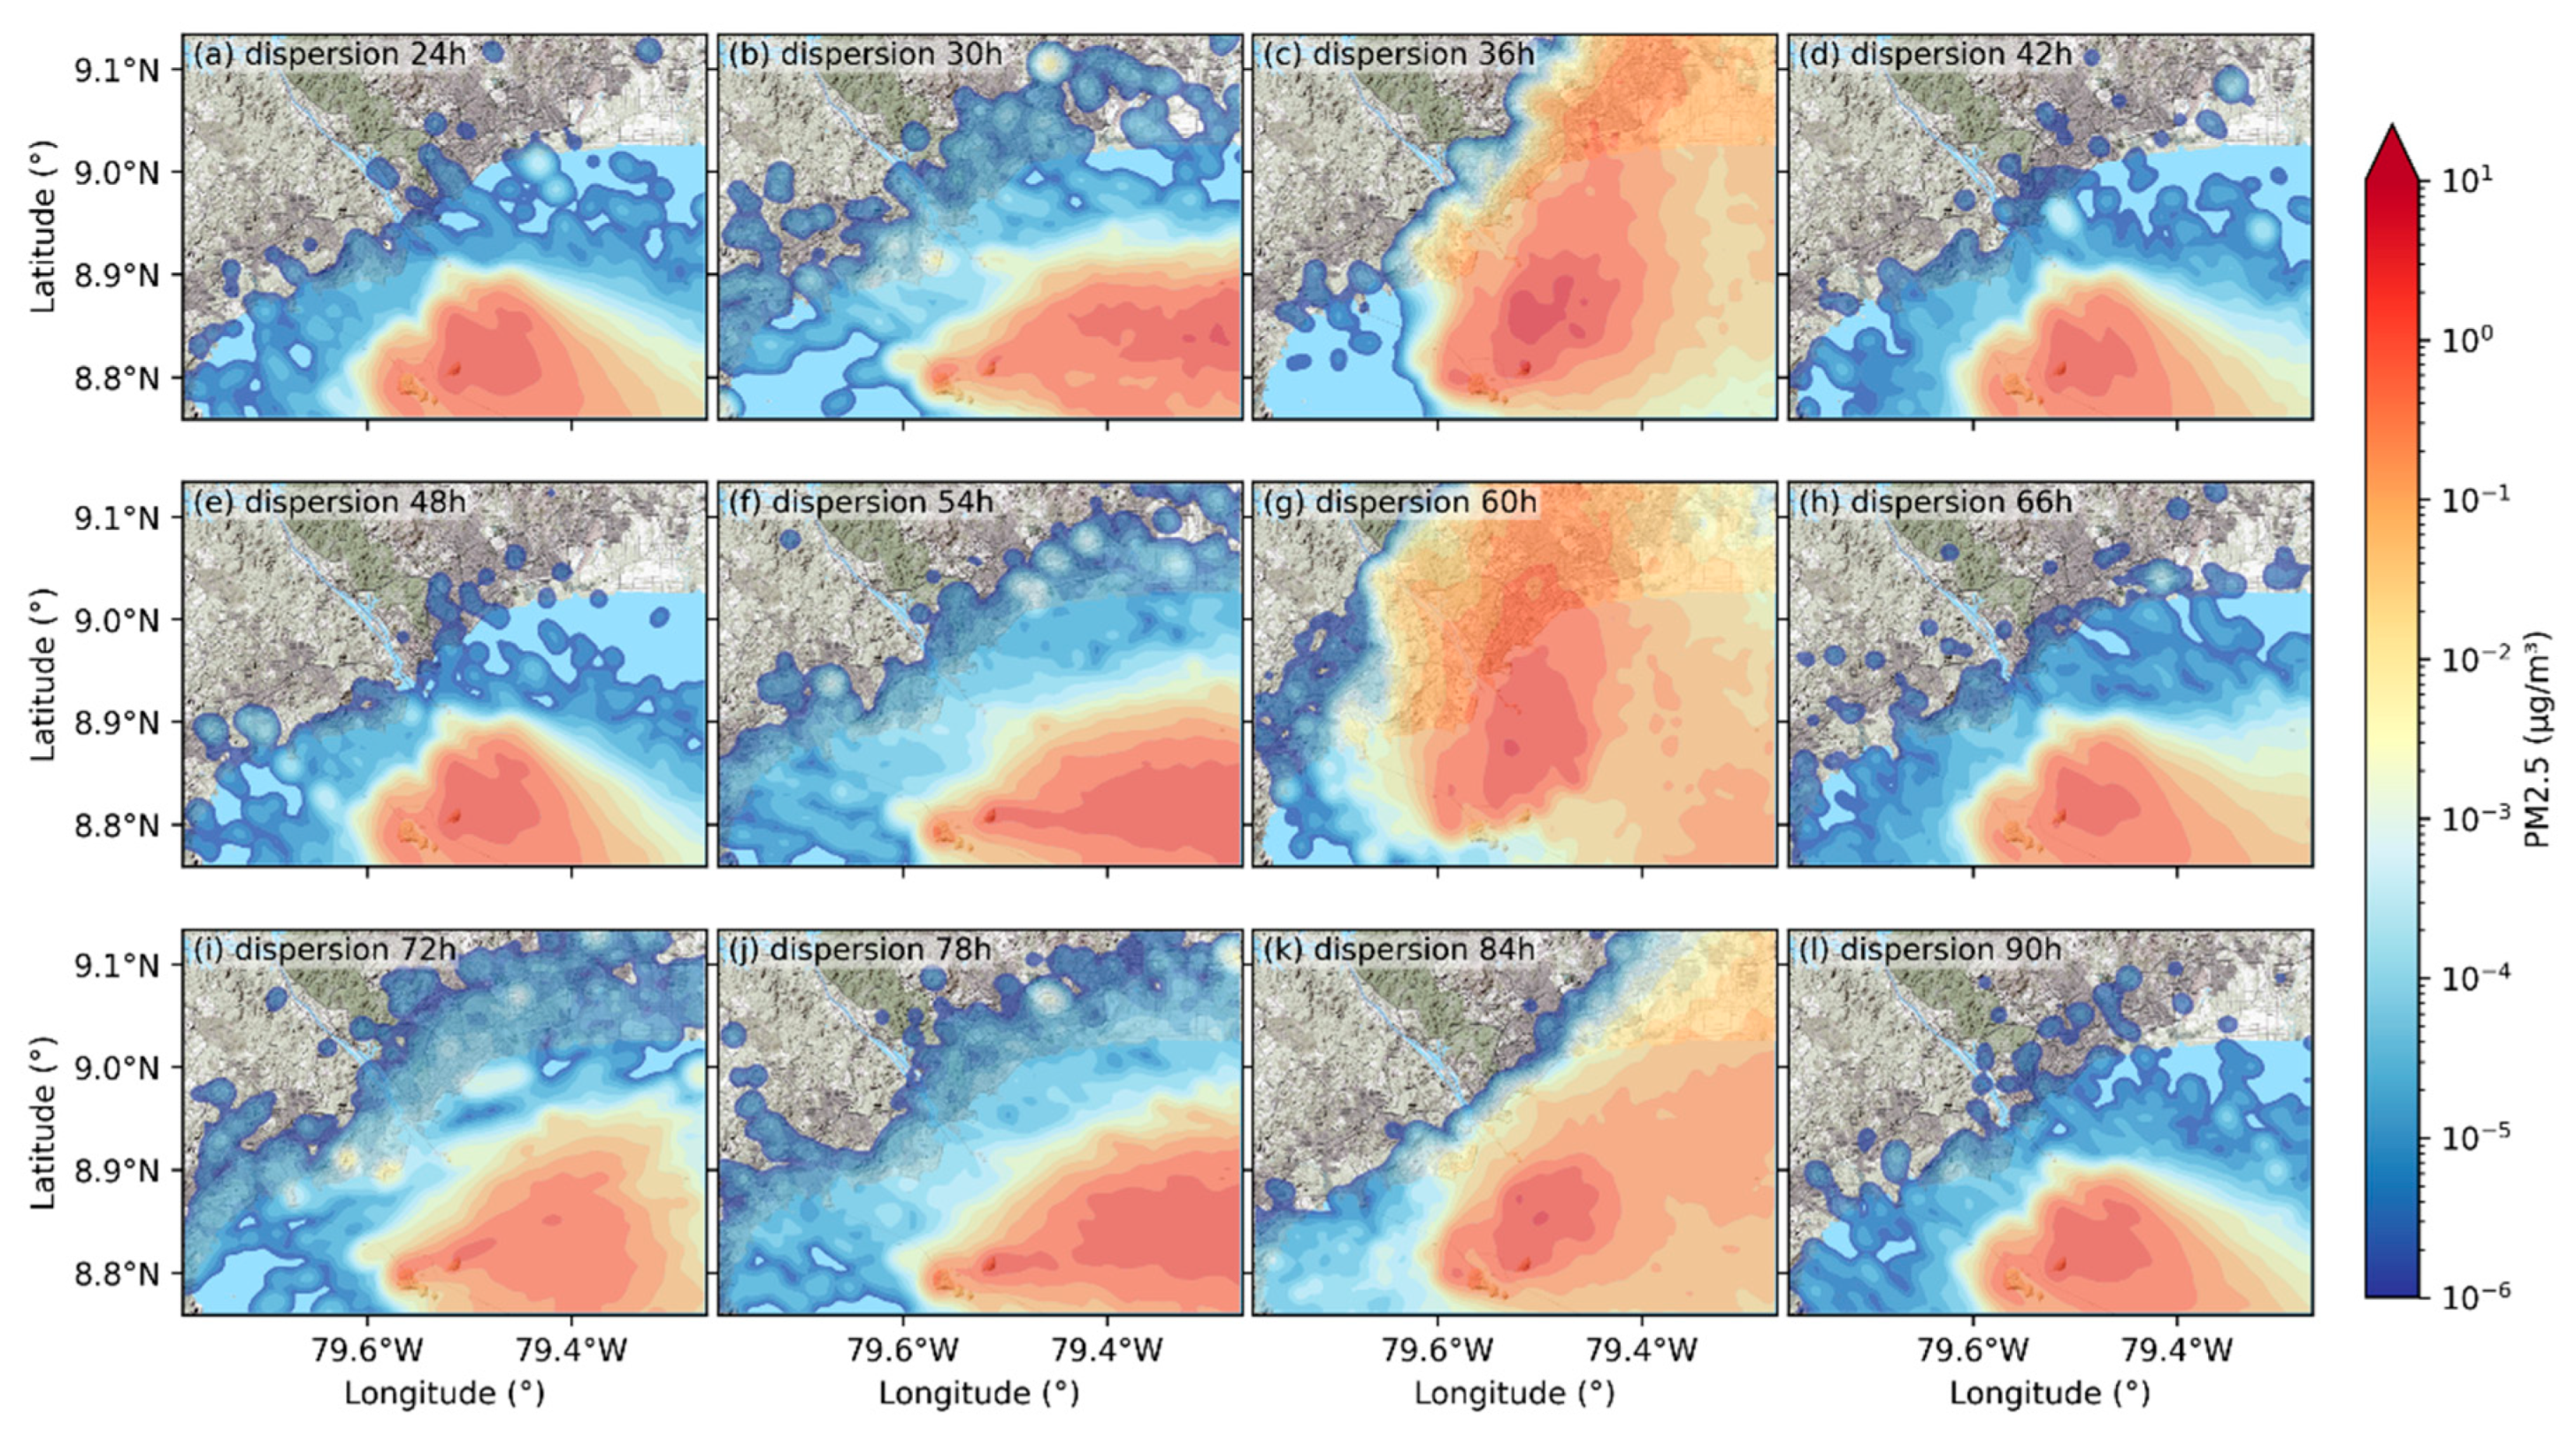
3.4. Analysis of Meteorological Characteristics and Dispersion Modeling
4. Discussion
5. Conclusions
Author Contributions
Funding
Data Availability Statement
Acknowledgments
Conflicts of Interest
Abbreviations
| AE | Auxiliary Engine |
| AIS | Automatic Identification System |
| AMP | Alternative Maritime Power |
| CO | Carbon Monoxide |
| ECA | Emission Control Area |
| EF | Emission Factor |
| EPA (U.S. EPA) | United States Environmental Protection Agency |
| FSC | Fraction of Sulfur in fuel that is Converted to direct sulfate PM |
| GHG/GHGs | Greenhouse Gas/Greenhouse Gases |
| GT | Gross Tonnage |
| IMO | International Maritime Organization |
| LF | Load Factor |
| ME | Main Engine |
| MEPC | Marine Environment Protection Committee (IMO) |
| MWR | Molecular Weight Ratio |
| NOx | Nitrogen Oxides |
| OGV(s) | Ocean-Going Vessel(s) |
| PAH(s) | Polycyclic Aromatic Hydrocarbon(s) |
| PAQman© | Portal Air Quality Management system |
| PM | Particulate Matter |
| PM10 | Particulate Matter ≤ 10 μm |
| PM2.5 | Particulate Matter ≤ 2.5 μm |
| S | Sulfur (fuel sulfur content, % m/m) |
| SFC | Specific Fuel Consumption |
| SO2 | Sulfur Dioxide |
| TSP | Total Suspended Particles |
| UNCTAD | United Nations Conference on Trade and Development |
| VOCs | Volatile Organic Compounds |
References
- IMO. Shipping: Indispensable to the World; International Maritime Organization: London, UK, 2015. [Google Scholar]
- UNCTAD. Review of Maritime Transport 2023; United Nations Conference on Trade and Development: Geneva, Switzerland, 2023.
- Eyring, V.; Köhler, H.W.; van Aardenne, J.; Lauer, A. Emissions from international shipping: The last 50 years. J. Geophys. Res. 2005, 110, D17182. [Google Scholar] [CrossRef]
- Corbett, J.J.; Koehler, H.W. Updated emissions from ocean shipping. J. Geophys. Res. 2003, 108, 4650. [Google Scholar] [CrossRef]
- Endresen, Ø.; Sørgård, E.; Sundet, J.K.; Dalsøren, S.B.; Isaksen, I.S.A.; Berglen, T.F.; Gravir, G. Emission from international sea transportation and environmental impact. J. Geophys. Res. 2003, 108, 4560. [Google Scholar] [CrossRef]
- Viana, M.; Hammingh, P.; Colette, A.; Querol, X.; Degraeuwe, B.; de Vlieger, I.; van Aardenne, J. Impact of maritime transport emissions on coastal air quality in Europe. Atmos. Environ. 2014, 90, 96–105. [Google Scholar] [CrossRef]
- Lv, Z.; Liu, H.; Ying, Q.; Fu, M.; Meng, Z.; Wang, Y.; Wei, W.; Gong, H.; He, K. Impacts of shipping emissions on PM2.5 pollution in China. Atmos. Chem. Phys. 2018, 18, 15811–15824. [Google Scholar] [CrossRef]
- Duan, Y.; Wang, M.; Shen, Y.; Yi, M.; Fu, Q.; Chen, J.; Xiu, G. Influence of Ship Emissions on PM2.5 in Shanghai: From COVID-19 to Omicron Lockdown Episodes. Atmos. Environ. 2023, 315, 120112. [Google Scholar] [CrossRef]
- Pope, C.A.; Dockery, D.W. Health effects of fine particulate air pollution: Lines that connect. J. Air Waste Manag. Assoc. 2006, 56, 709–742. [Google Scholar] [CrossRef]
- Burnett, R.; Chen, H.; Szyszkowicz, M.; Fann, N.; Hubbell, B.; Pope, C.A.; Apte, J.S.; Brauer, M.; Cohen, A.; Weichenthal, S.; et al. Global estimates of mortality associated with long-term exposure to outdoor fine particulate matter. Proc. Natl. Acad. Sci. USA 2018, 115, 9592–9597. [Google Scholar] [CrossRef]
- Lehtoranta, K.; Aakko-saksa, P.; Murtonen, T.; Vesala, H.; Ntziachristos, L.; Rönkkö, T.; Karjalainen, P.; Kuittinen, N.; Timonen, H. Particulate Mass and Nonvolatile Particle Number Emissions from Marine Engines Using Low-Sulfur Fuels, Natural Gas, or Scrubbers. Environ. Sci. Technol. 2019, 53, 3315–3322. [Google Scholar] [CrossRef]
- Seppälä, S.D.; Kuula, J.; Hyvärinen, A.-P.; Saarikoski, S.; Rönkkö, T.; Keskinen, J.; Jalkanen, J.-P.; Timonen, H. Effects of marine fuel sulfur restrictions on particle number concentrations and size distributions in ship plumes in the Baltic Sea. Atmos. Chem. Phys. 2021, 21, 3215–3234. [Google Scholar] [CrossRef]
- Miola, A.; Ciuffo, B. Estimating air emissions from ships: Meta-analysis of modelling approaches and available data sources. Atmos. Environ. 2011, 45, 2242–2251. [Google Scholar] [CrossRef]
- Wang, C.; Corbett, J.J.; Firestone, J. Improving spatial representation of global ship emissions inventories. Environ. Sci. Technol. 2007, 42, 193–199. [Google Scholar] [CrossRef]
- Aulinger, A.; Matthias, V.; Zeretzke, M.; Bieser, J.; Quante, M.; Backes, A. The impact of shipping emissions on air pollution in the greater North Sea region—Part 1: Emissions. Atmos. Chem. Phys. 2016, 16, 739–758. [Google Scholar] [CrossRef]
- Jalkanen, J.P.; Brink, A.; Kalli, J.; Pettersson, H.; Kukkonen, J.; Stipa, T. A modelling system for the exhaust emissions of marine traffic and its application in the Baltic Sea area. Atmos. Chem. Phys. 2009, 9, 9209–9223. [Google Scholar] [CrossRef]
- Jalkanen, J.P.; Johansson, L.; Kukkonen, J. A Comprehensive Inventory of the Ship Traffic Exhaust Emissions in the Baltic Sea from 2006 to 2009. AMBIO 2014, 43, 311–324. [Google Scholar] [CrossRef] [PubMed]
- ITU-R. Recommendation ITU-R M.1371-5: Technical Characteristics for an Automatic Identification System Using Time Division Multiple Access in the VHF Maritime Mobile Frequency Band. Available online: https://www.itu.int/rec/R-REC-M.1371 (accessed on 15 September 2025).
- Goldsworthy, L.; Goldsworthy, B. Modelling of ship engine exhaust emissions in ports and extensive coastal waters based on terrestrial AIS data. Environ. Model. Softw. 2015, 63, 45–60. [Google Scholar] [CrossRef]
- Fu, M.; Liu, H.; Jin, X.; He, K. National- to Port-Level Inventories of Shipping Emissions in China. Environ. Res. Lett. 2017, 12, 114024. [Google Scholar] [CrossRef]
- Chen, D.; Zhao, Y.; Nelson, P.; Li, Y.; Wang, X.; Zhou, Y.; Lang, J.; Guo, X. Estimating Ship Emissions Based on AIS Data for Port of Tianjin, China. Atmos. Environ. 2016, 145, 10–18. [Google Scholar] [CrossRef]
- Yang, L.; Zhang, Q.; Zhang, Y.; Lv, Z.; Wang, Y.; Wu, L.; Feng, X.; Mao, H. An AIS-Based Emission Inventory and the Impact on Air Quality in Tianjin Port Based on Localized Emission Factors. Sci. Total Environ. 2021, 783, 146869. [Google Scholar] [CrossRef] [PubMed]
- Kuzu, S.L.; Bilgili, L.; Kılıç, A. Estimation and Dispersion Analysis of Shipping Emissions in Bandirma Port, Turkey. Environ. Dev. Sustain. 2021, 23, 10288–10308. [Google Scholar] [CrossRef]
- Badeke, R.; Matthias, V.; Grawe, D. Parameterizing the Vertical Downward Dispersion of Ship Exhaust Gas in the Near Field. Atmos. Chem. Phys. 2021, 21, 5935–5951. [Google Scholar] [CrossRef]
- Pan, K.; Lim, M.Q.; Kraft, M.; Mastorakos, E. Development of a Moving Point Source Model for Shipping Emission Dispersion Modeling in EPISODE–CityChem v1.3. Geosci. Model Dev. 2021, 14, 4509–4534. [Google Scholar] [CrossRef]
- Tseng, Y.-L.; Cheng, W.-H.; Yuan, C.-S.; Lo, K.-C.; Lin, C.; Lee, C.-W.; Bagtasa, G. Impacts of Ship Emissions and Sea–Land Breeze on Urban Air Quality Using Chemical Characterization, Source Contribution and Dispersion Model Simulation of PM2.5 at an Asian Seaport. Environ. Pollut. 2024, 347, 123663. [Google Scholar] [CrossRef]
- Augustin, P.; Billet, S.; Crumeyrolle, S.; Deboudt, K.; Dieudonné, E.; Flament, P.; Fourmentin, M.; Guilbaud, S.; Hanoune, B.; Landkocz, Y.; et al. Impact of Sea Breeze Dynamics on Atmospheric Pollutants and Their Toxicity in Industrial and Urban Coastal Environments. Remote Sens. 2020, 12, 648. [Google Scholar] [CrossRef]
- Akakura, Y. Analysis of Offshore Waiting at World Container Terminals and Estimation of CO2 Emissions from Waiting Ships. Asian Transp. Stud. 2023, 9, 100111. [Google Scholar] [CrossRef]
- Instituto Nacional de Estadística y Censo. XII Censo 2023: Distrito de Panamá/San Miguelito; INEC: Panama City, Panama, 2023.
- Contini, D.; Merico, E. Recent Advances in Studying Air Quality and Health Effects from Shipping Emissions. Atmosphere 2021, 12, 92. [Google Scholar] [CrossRef]
- Asprilla-González, J.; González-Olivardía, F.; Cortez-Huerta, M.; Echeverría, R.S.; García, G.F.; Durán, R.E.A. Temporal estimation of air emissions due to maritime activities in the main ports of Panama. Reg. Stud. Mar. Sci. 2025, 86, 104222. [Google Scholar] [CrossRef]
- Pérez, R.A.; Ortiz, R.J.C.; Bejarano, A.L.F.; Otero, D.L.; Restrepo, L.J.C.; Franco, H.A. Sea breeze in the Colombian Caribbean coast. Atmósfera 2018, 31, 389–406. [Google Scholar] [CrossRef]
- Ishizaki, N.; Takayabu, I.; Sasaki, H.; Nakagawa, S.; Kimura, F. Factors Contributing to Morning Rain in the Upper Río Chagres Basin, Panamá. Frontiers in Earth Science 2023, 11, 1105013. [Google Scholar] [CrossRef]
- Peel, M.C.; Finlayson, B.L.; McMahon, T.A. Updated world map of the Köppen-Geiger climate classification. Hydrol. Earth Syst. Sci. 2007, 11, 1633–1644. [Google Scholar] [CrossRef]
- Muñoz, E.; Busalacchi, A.J.; Nigam, S.; Ruiz-Barradas, A. Winter and Summer Structure of the Caribbean Low-Level Jet. J. Clim. 2008, 21, 1260–1276. [Google Scholar] [CrossRef]
- Ordóñez-Zúñiga, S.; Correa-Ramirez, M.; Ricaurte-Villota, C.; Bastidas-Salamanca, M. The Panama Low Level Jet: Extension, annual cycle and modes of variation. Lat. Am. J. Aquat. Res. 2021, 49, 750–762. [Google Scholar] [CrossRef]
- Xie, S.P.; Xu, H.; Kessler, W.; Nonaka, M. Air–Sea Interaction over the Eastern Pacific Warm Pool: Gap Winds, Thermocline Dome, and Atmospheric Convection. J. Clim. 2005, 18, 5–20. [Google Scholar] [CrossRef]
- Chelton, D.B.; Freilich, M.H.; Esbensen, S.K. Satellite Observations of the Wind Jets off the Pacific Coast of Central America. Part I: Case Studies and Statistical Characteristics. Mon. Weather Rev. 2000, 128, 1993–2018. [Google Scholar] [CrossRef]
- Cheng, F.Y.; Georgakakos, K.P. Statistical analysis of observed and simulated hourly surface wind in the vicinity of the Panama Canal. Int. J. Climatol. 2011, 31, 770–782. [Google Scholar] [CrossRef]
- Sofiev, M.; Winebrake, J.J.; Johansson, L.; Carr, E.W.; Prank, M.; Soares, J.; Vira, J.; Kouznetsov, R.; Jalkanen, J.-P.; Corbett, J.J. Cleaner fuels for ships provide public health benefits with climate tradeoffs. Nat. Commun. 2018, 9, 406. [Google Scholar] [CrossRef]
- Harati-Mokhtari, A.; Wall, A.; Brooks, P.; Wang, J. Automatic Identification System (AIS): Data reliability and human error implications. J. Navig. 2007, 60, 373–389. [Google Scholar] [CrossRef]
- International Maritime Organization. Guidelines for the Onboard Operational Use of Shipborne Automatic Identification Systems (AIS); Resolution A.917(22); IMO: London, UK, 2002. [Google Scholar]
- Silveira, P.A.M.; Teixeira, A.P.; Guedes Soares, C. Use of AIS Data to Characterise Marine Traffic Patterns and Ship Collision Risk off the Coast of Portugal. J. Navig. 2013, 66, 879–898. [Google Scholar] [CrossRef]
- International Maritime Organization. Automatic Identification Systems (AIS) Transponders. 2025. Available online: https://www.imo.org/en/OurWork/Safety/Pages/AIS.aspx (accessed on 15 September 2025).
- Iphar, C.; Le Berre, I.; Foulquier, E.; Napoli, A. Port Call Extraction from Vessel Location Data for Characterising Harbour Traffic. Ocean Engi. 2024, 293, 116771. [Google Scholar] [CrossRef]
- Yi, W.; Wang, X.; He, T.; Liu, H.; Luo, Z.; Lv, Z.; He, K. The high-resolution global shipping emission inventory by the Shipping Emission Inventory Model (SEIM). Earth Syst. Sci. Data 2025, 17, 277–292. [Google Scholar] [CrossRef]
- EEA. EMEP/EEA Air Pollutant Emission Inventory Guidebook 2019–1.A.3.d Navigation (Shipping); European Environment Agency: Copenhagen, Denmark, 2019.
- Yang, D.; Wu, L.; Wang, S.; Jia, H.; Li, K.X. How Big Data Enriches Maritime Research—A Critical Review of Automatic Identification System (AIS) Data Applications. Transp. Rev. 2019, 39, 755–773. [Google Scholar] [CrossRef]
- Ma, J.; Zhou, Y.; Zhu, Z. Identification and Analysis of Ship Waiting Behavior Outside the Port Based on AIS Data. Sci. Rep. 2023, 13, 11267. [Google Scholar] [CrossRef]
- Iphar, C.; Le Berre, I.; Sahuquet, M.; Napoli, A.; Foulquier, E. Port calls and vessel trajectory dataset in the Caribbean with accurate port quays survey. Data Brief 2024, 55, 110617. [Google Scholar] [CrossRef] [PubMed]
- Pallotta, G.; Vespe, M.; Bryan, K. Vessel pattern knowledge discovery from AIS data: A framework for anomaly detection and route prediction. Entropy 2013, 15, 2218–2245. [Google Scholar] [CrossRef]
- Lee, Y. Study on the Applicability of AIS-Based Ship Air Emission Inventory Methodology. Master’s Thesis, Incheon National University, Incheon, Republic of Korea, 2021. [Google Scholar]
- Johansson, L.; Jalkanen, J.P.; Kukkonen, J. Global assessment of shipping emissions in 2015 on a high spatial and temporal resolution. Atmos. Environ. 2017, 167, 403–415. [Google Scholar] [CrossRef]
- Winnes, H.; Moldanová, J.; Anderson, M.; Fridell, E. On-Board Measurements of Particle Emissions from Marine Engines Using Fuels with Different Sulphur Content. Proc. Inst. Mech. Eng. Part M J. Eng. Marit. Environ. 2014, 230, 45–54. [Google Scholar] [CrossRef]
- Cooper, D. Exhaust emissions from ships at berth. Atmos. Environ. 2003, 37, 3817–3830. [Google Scholar] [CrossRef]
- IMO. Fourth IMO Greenhouse Gas Study 2020; International Maritime Organization: London, UK, 2020. [Google Scholar]
- EMEP/EEA. EMEP/EEA Air Pollutant Emission Inventory Guidebook 2023; European Environment Agency: Luxembourg, 2023.
- U.S. EPA. Port Emissions Inventory Guidance: Methodologies for Estimating Port-Related and Goods Movement Mobile Source Emissions; U.S. Environmental Protection Agency: Washington, DC, USA, 2022.
- NOAA National Centers for Environmental Information (NCEI). Integrated Surface Database (ISD): Global Surface Hourly. Available online: https://www.ncei.noaa.gov/products/land-based-station/integrated-surface-database (accessed on 25 August 2025).
- Kim, J.W.; Kang, S.L. Identification of sea/land breeze circulation using a band-pass filter and the ensemble approach. J. Korean Data Inf. Sci. Soc. 2020, 31, 591–610. [Google Scholar] [CrossRef]
- Abbasi, M.T.; Alesheikh, A.A.; Jafari, A.; Lotfata, A. Spatial and temporal patterns of urban air pollution in Tehran with a focus on PM2.5 and associated pollutants. Sci. Rep. 2024, 14, 25150. [Google Scholar] [CrossRef]
- Iglesias, F.; Kastner, W. Analysis of Similarity Measures in Times Series Clustering for the Discovery of Building Energy Patterns. Energies 2013, 6, 579–597. [Google Scholar] [CrossRef]
- Sun, G.; Jiang, C.; Cheng, P.; Liu, Y.; Wang, X.; Fu, Y.; He, Y. Short-term wind power forecasts by a synthetical similar time series data mining method. Renew. Energy 2018, 115, 575–584. [Google Scholar] [CrossRef]
- Wang, B.; Geddes, J.A.; Adams, T.J.; Lind, E.S.; McDonald, B.C.; He, J.; Harkins, C.; Li, D.; Pfister, G.G. Implications of sea breezes on air quality monitoring in a coastal urban environment: Evidence from high resolution modeling of NO2 and O3. J. Geophys. Res. Atmos. 2023, 128, e2022JD037860. [Google Scholar] [CrossRef]
- Öttl, D.; Kuntner, M.; Hofstadler, R. GRAL Manual: GRAL Graphical User Interface 24.11; Graz University of Technology: Graz, Austria, 2025. [Google Scholar]
- Romanov, A.A.; Gusev, B.A.; Leonenko, E.V.; Tamarovskaya, A.N.; Vasiliev, A.S.; Zaytcev, N.E.; Philippov, I.K. Graz Lagrangian Model (GRAL) for Pollutants Tracking and Estimating Sources Partial Contributions to Atmospheric Pollution in Highly Urbanized Areas. Atmosphere 2020, 11, 1375. [Google Scholar] [CrossRef]
- Romanov, A.A.; Oettl, D.; Gusev, B.A.; Tamarovskaya, A.N.; Lopez-Cepero, J.M.; Leonenko, E.V.; Vasiliev, A.S.; Krikunov, E.E.; Chato-Astrain, J.; Romanov, A.P.; et al. Environmental efficiency of the fossil fuels to electricity transition in Eastern Siberia cities. Atmos. Pollut. Res. 2023, 14, 101672. [Google Scholar] [CrossRef]
- May, M.; Wald, S.; Suter, I.; Brunner, D.; Vardag, S. Evaluation of the GRAMM/GRAL model for high-resolution wind fields in Heidelberg, Germany. Atmos. Res. 2024, 300, 107207. [Google Scholar] [CrossRef]
- Berchet, A.; Zink, K.; Öttl, D.; Brunner, J.; Emmenegger, L.; Brunner, D. Evaluation of high-resolution GRAMM–GRAL (v15.12/v14.8) NOx simulations over the city of Zürich, Switzerland. Geosci. Model Dev. 2017, 10, 3441–3459. [Google Scholar] [CrossRef]
- Nunes, R.A.O.; Alvim-Ferraz, M.C.M.; Martins, F.G.; Sousa, S.I.V. Local mortality and costs from ship-related emissions in three major Portuguese ports. Urban Clim. 2024, 53, 101780. [Google Scholar] [CrossRef]
- U.S. Geological Survey. USGS EROS Archive—Digital Elevation—Shuttle Radar Topography Mission (SRTM) 1 Arc-Second Global. Available online: https://www.usgs.gov/centers/eros/science/usgs-eros-archive-digital-elevation-shuttle-radar-topography-mission-srtm-1 (accessed on 10 August 2025).
- Sistema Nacional De Información Ambiental. Cobertura Boscosa y Uso del Suelo, año 2021 (1:25,000). Available online: https://sinia.gob.pa/datos-abiertos-y-geoservicios/ (accessed on 15 August 2025).
- Ventikos, N.P.; Sotiralis, P.; Annetis, M.; Koimtzoglou, M.A.; Keratsa, L. Defining the Power and Energy Demands from Ships at Anchorage for Offshore Power Supply Solutions. Energies 2025, 18, 1766. [Google Scholar] [CrossRef]
- Parsmo, R. Benchmark for Reduction of Anchoring Vessels’ Emissions; Chalmers University of Technology: Gothenburg, Sweden, 2021. [Google Scholar]
- Crosman, E.T.; Horel, J.D. Sea and Lake Breezes: A Review of Numerical Studies. Bound.-Layer Meteorol. 2010, 137, 1–29. [Google Scholar] [CrossRef]
- Miller, S.T.K.; Keim, B.D.; Talbot, R.W.; Mao, H. Sea breeze: Structure, forecasting, and impacts. Rev. Geophys. 2003, 41, 1011. [Google Scholar] [CrossRef]
- Geddes, J.A.; Wang, B.; Li, D. Ozone and Nitrogen Dioxide Pollution in a Coastal Urban Environment: The Role of Sea Breezes, and Implications of Their Representation for Remote Sensing of Local Air Quality. J. Geophys. Res. Atmos. 2021, 126, e2021JD035314. [Google Scholar] [CrossRef]
- Shang, F.; Chen, D.; Guo, X.; Lang, J.; Zhou, Y.; Li, Y.; Fu, X. Impact of Sea Breeze Circulation on the Transport of Ship Emissions in Tangshan Port, China. Atmosphere 2019, 10, 723. [Google Scholar] [CrossRef]
- Atmospheric Dispersion Modelling Liaison Committee. Reviewing Issues Associated with Modelling Atmospheric Dispersion in Changing Meteorological Conditions, Source Term Estimation and Event Reconstruction: A Survey; ADMLC-R6; ADMLC: London, UK, 2011.
- Clappier, A.; Martilli, A.; Grossi, P.; Thunis, P.; Pasi, F.; Krueger, B.; Calpini, B.; Graziani, G.; van den Bergh, H. Effect of Sea Breeze on Air Pollution in the Greater Athens Area. Part I: Numerical Simulations and Field Observations. J. Appl. Meteorol. 2000, 39, 546–562. [Google Scholar] [CrossRef]
- Tang, L.; Ramacher, M.O.P.; Moldanová, J.; Matthias, V.; Karl, M.; Johansson, L.; Jalkanen, J.P.; Yaramenka, K.; Aulinger, A.; Gustafsson, M. The impact of ship emissions on air quality and human health in the Gothenburg area—Part 1: 2012 emissions. Atmos. Chem. Phys. 2020, 20, 7509–7530. [Google Scholar] [CrossRef]
- Winnes, H.; Styhre, L.; Fridell, E. Reducing GHG emissions from ships in port areas. Res. Transp. Bus. Manag. 2015, 17, 73–82. [Google Scholar] [CrossRef]
- Vukić, L.; Lai, K.-H. Acute Port Congestion and Emissions Exceedances as an Impact of COVID-19 Outcome: The Case of San Pedro Bay Ports. J. Shipp. Trd. 2022, 7, 25. [Google Scholar] [CrossRef]
- Tichavska, M.; Tovar, B. Port-city exhaust emission model: An application to cruise and ferry operations in Las Palmas Port. Transp. Res. Part A Policy Pract. 2015, 78, 347–360. [Google Scholar] [CrossRef]
- Ng, S.K.W.; Loh, C.; Lin, C.; Booth, V.; Chan, J.W.M.; Yip, A.C.K.; Li, Y.; Lau, A.K.H. Policy change driven by an AIS-assisted marine emission inventory in Hong Kong and the Pearl River Delta. Atmos. Environ. 2013, 76, 102–112. [Google Scholar] [CrossRef]
- Rauca, L.; Popa, C.; Atodiresei, D.; Nedelcu, A. Port Performance and Its Influence on Vessel Operating Costs and Emissions. Logistics 2025, 9, 122. [Google Scholar] [CrossRef]
- Jalkanen, J.-P.; Johansson, L.; Kukkonen, J. A comprehensive inventory of ship traffic exhaust emissions in the European sea areas in 2011. Atmos. Chem. Phys. 2016, 16, 71–84. [Google Scholar] [CrossRef]
- WHO. WHO Global Air Quality Guidelines: Particulate Matter (PM2.5 and PM10), Ozone, Nitrogen Dioxide, Sulfur Dioxide and Carbon Monoxide; World Health Organization: Geneva, Switzerland, 2021.
- Toscano, D. The Impact of Shipping on Air Quality in the Port Cities of the Mediterranean Area: A Review. Atmosphere 2023, 14, 1180. [Google Scholar] [CrossRef]
- IMO. IMO 2020—Cleaner Shipping for Cleaner Air; International Maritime Organization: London, UK, 2020. [Google Scholar]
- Zhou, Y.; Fu, J.S.; Zhuang, G.; Levy, J.I. Risk-Based Prioritization among Air Pollution Control Strategies in the Yangtze River Delta, China. Environ. Health Perspect. 2010, 118, 1204–1210. [Google Scholar] [CrossRef] [PubMed]
- Starcrest Consulting Group. Port of Los Angeles Air Emissions Inventory—2016; Port of Los Angeles: San Pedro, CA, USA, 2017. [Google Scholar]
- Chen, X.; Yang, J. Analysis of the Uncertainty of the AIS-Based Bottom-Up Approach for Estimating Ship Emissions. Mar. Pollut. Bull. 2024, 199, 115968. [Google Scholar] [CrossRef] [PubMed]
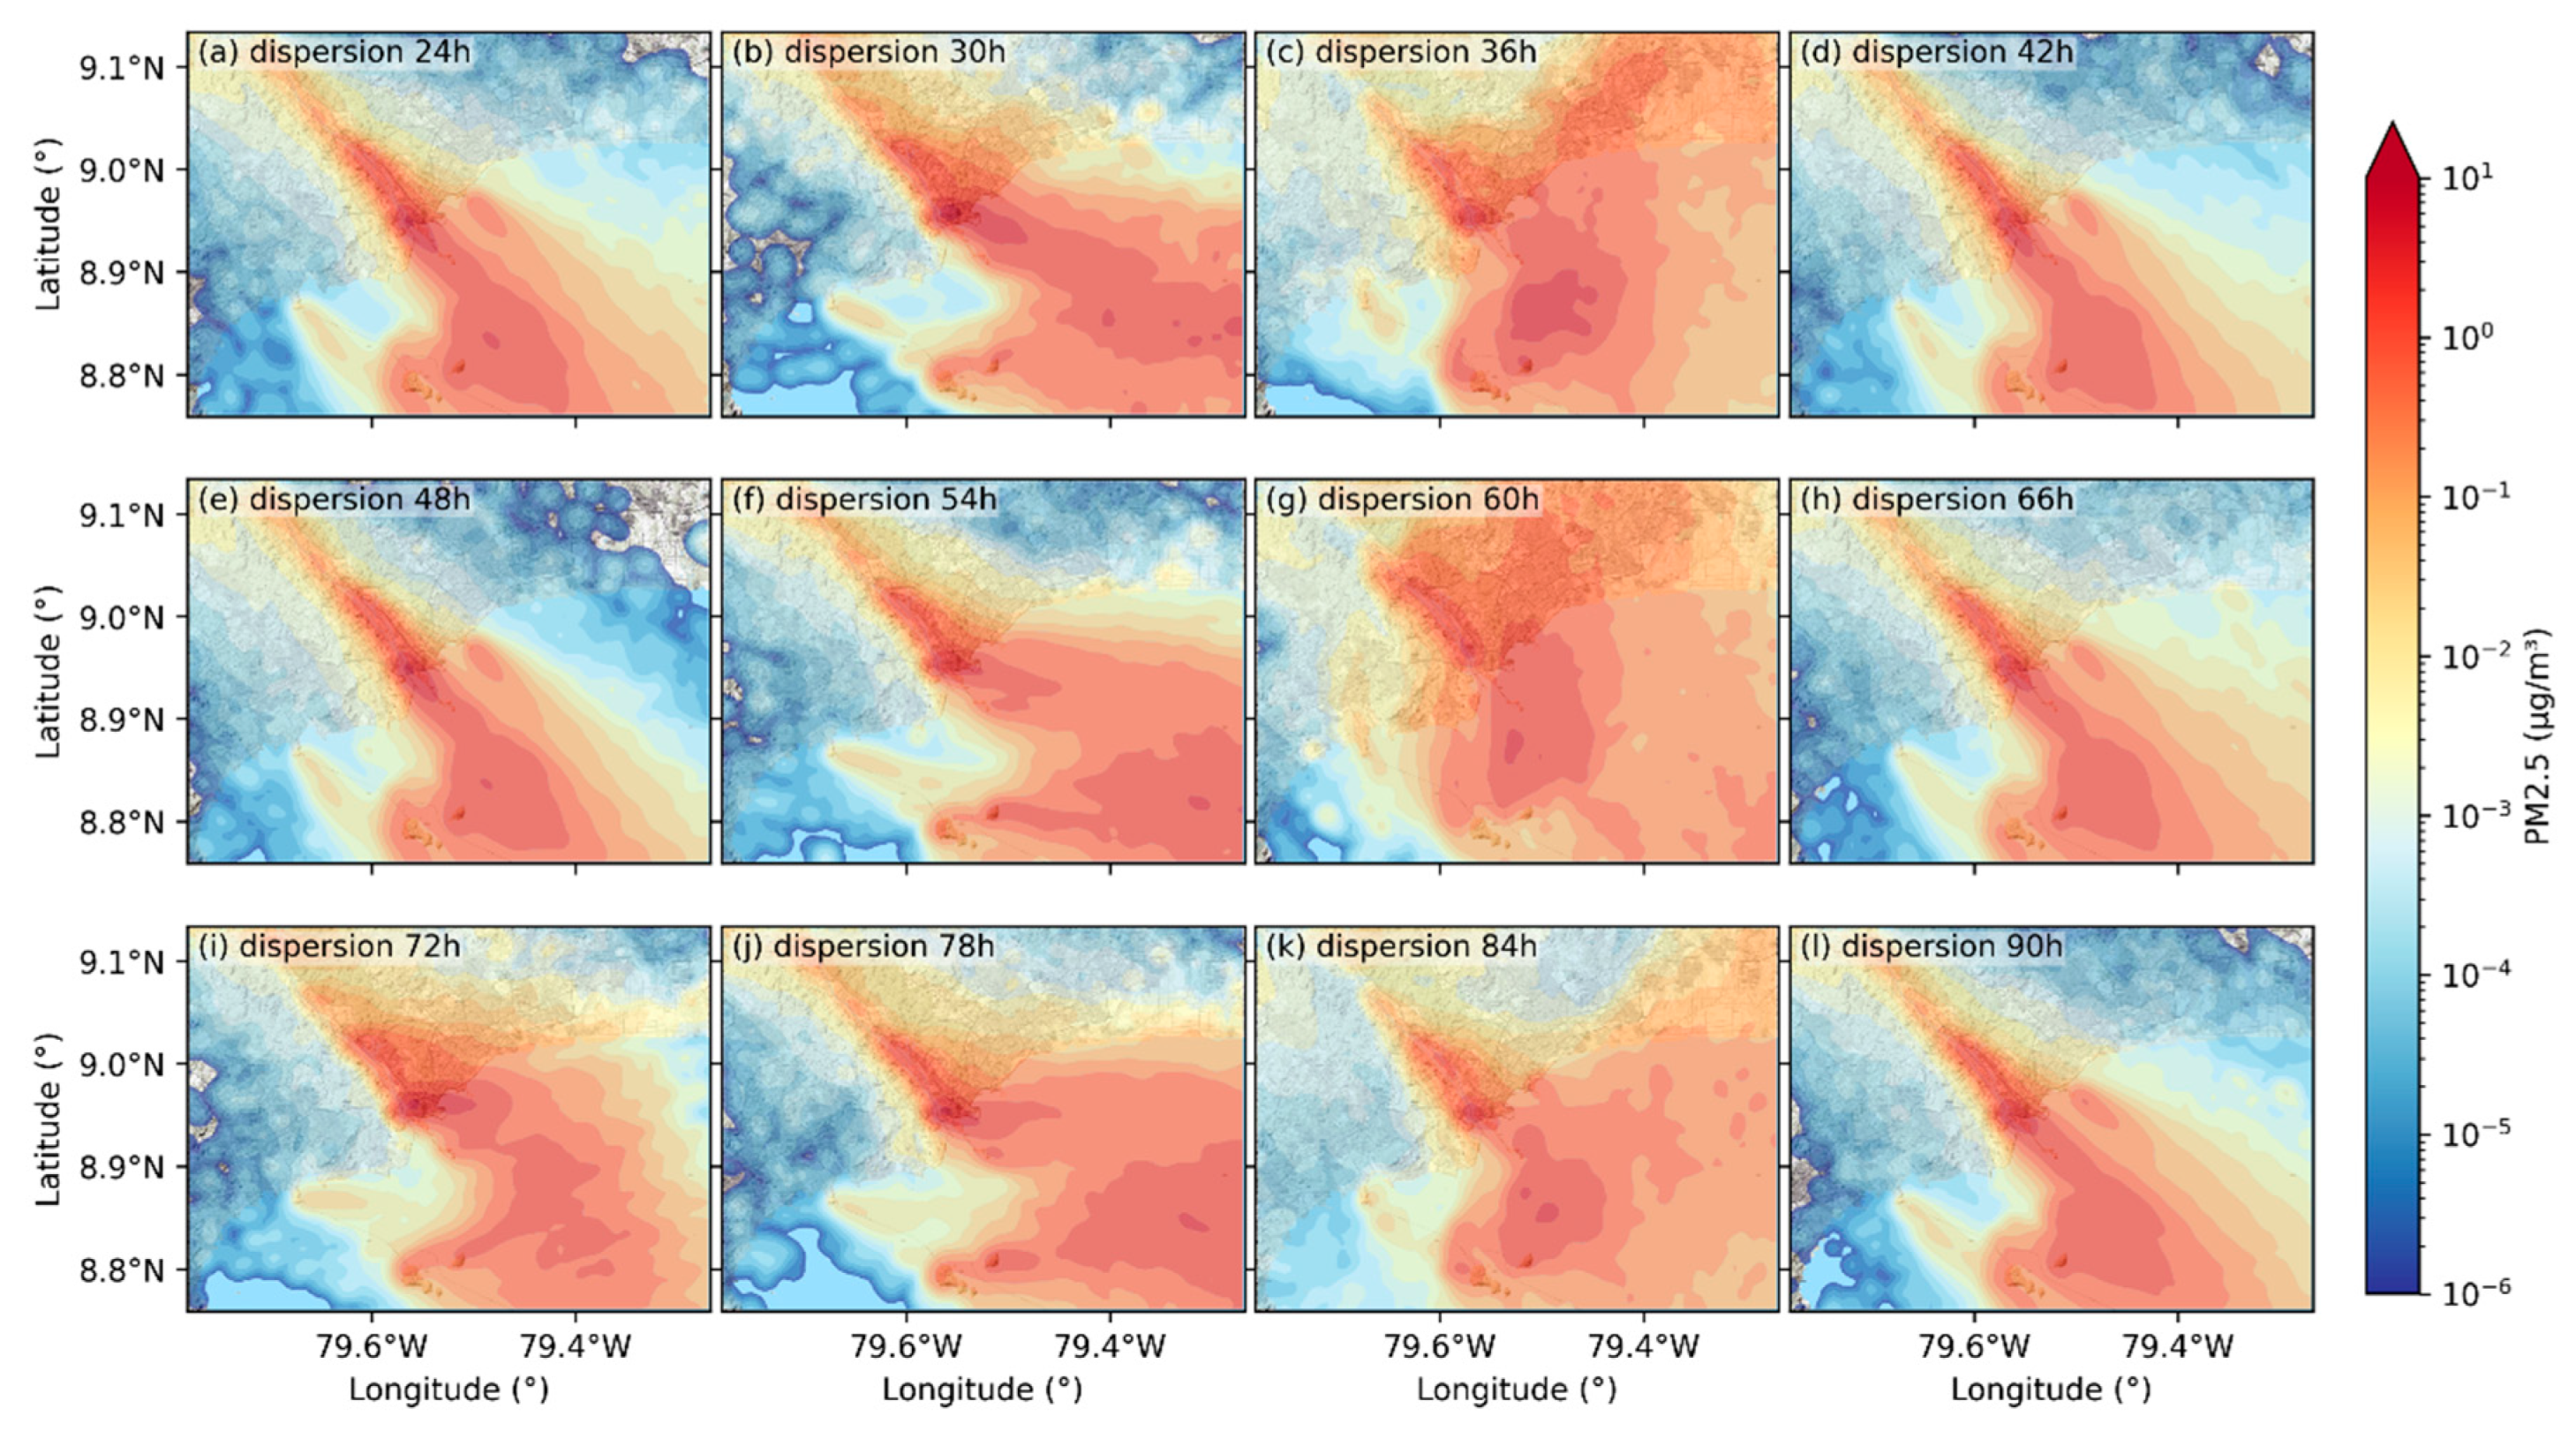
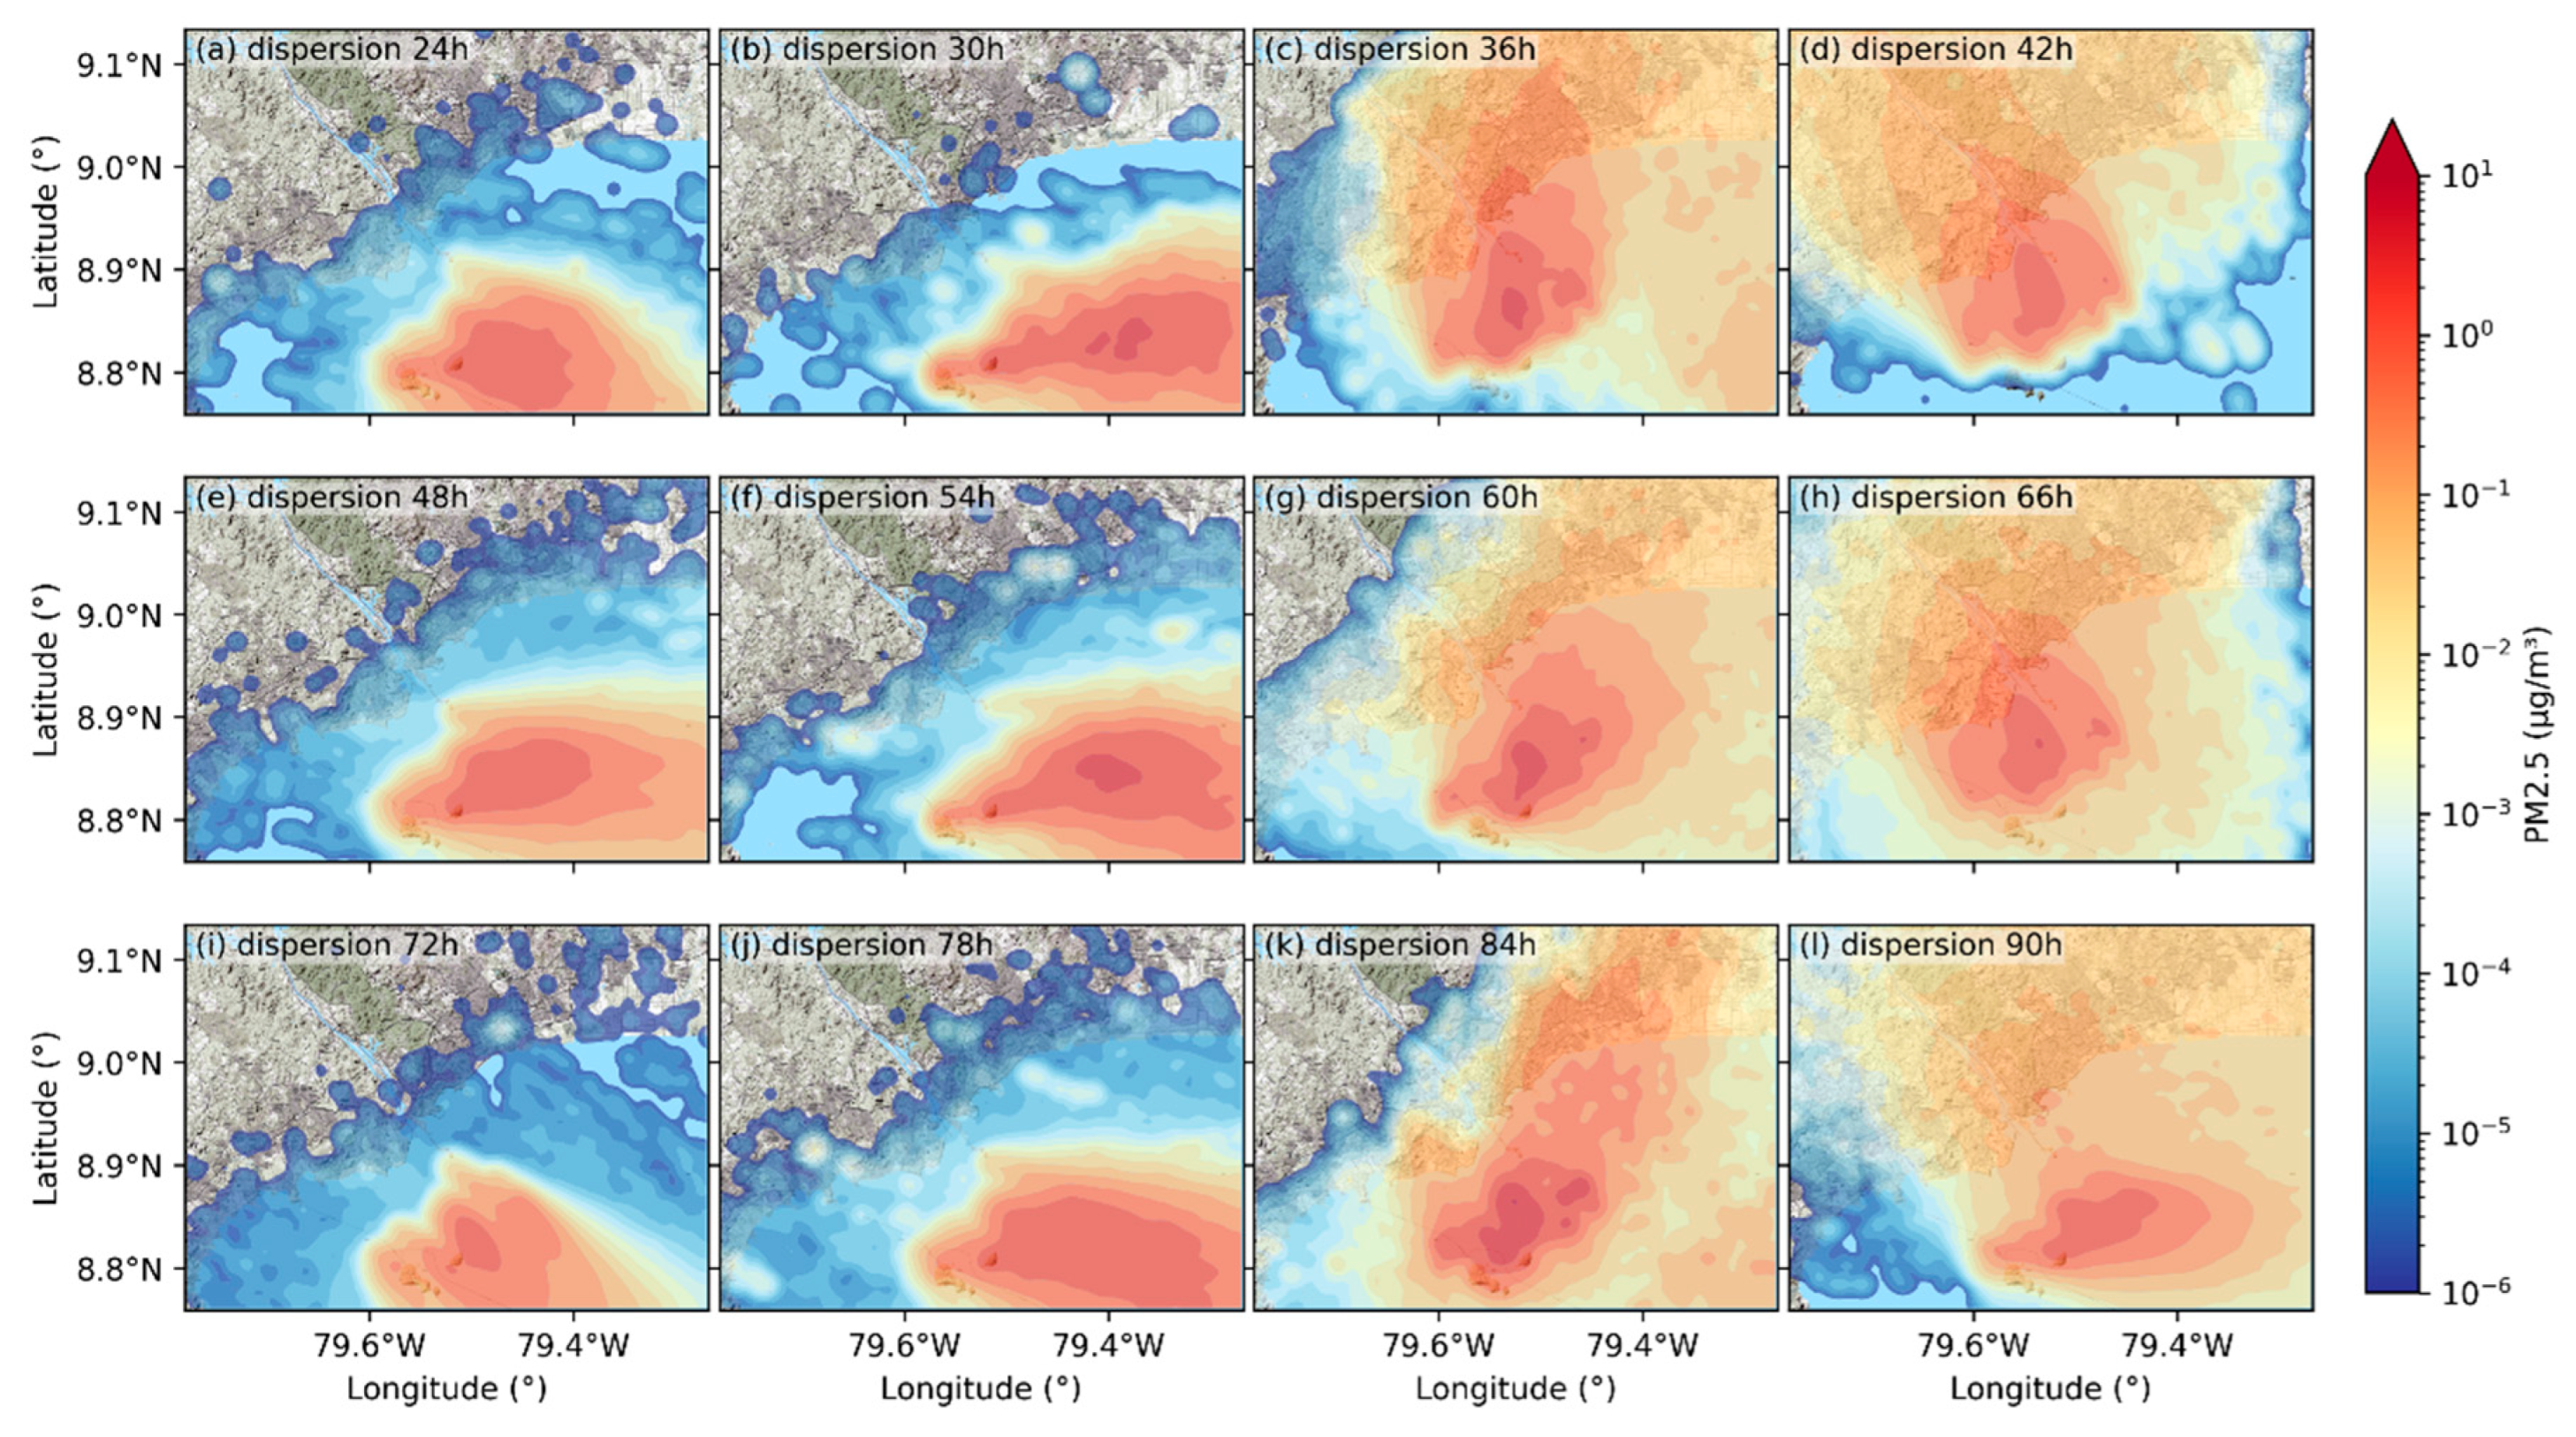
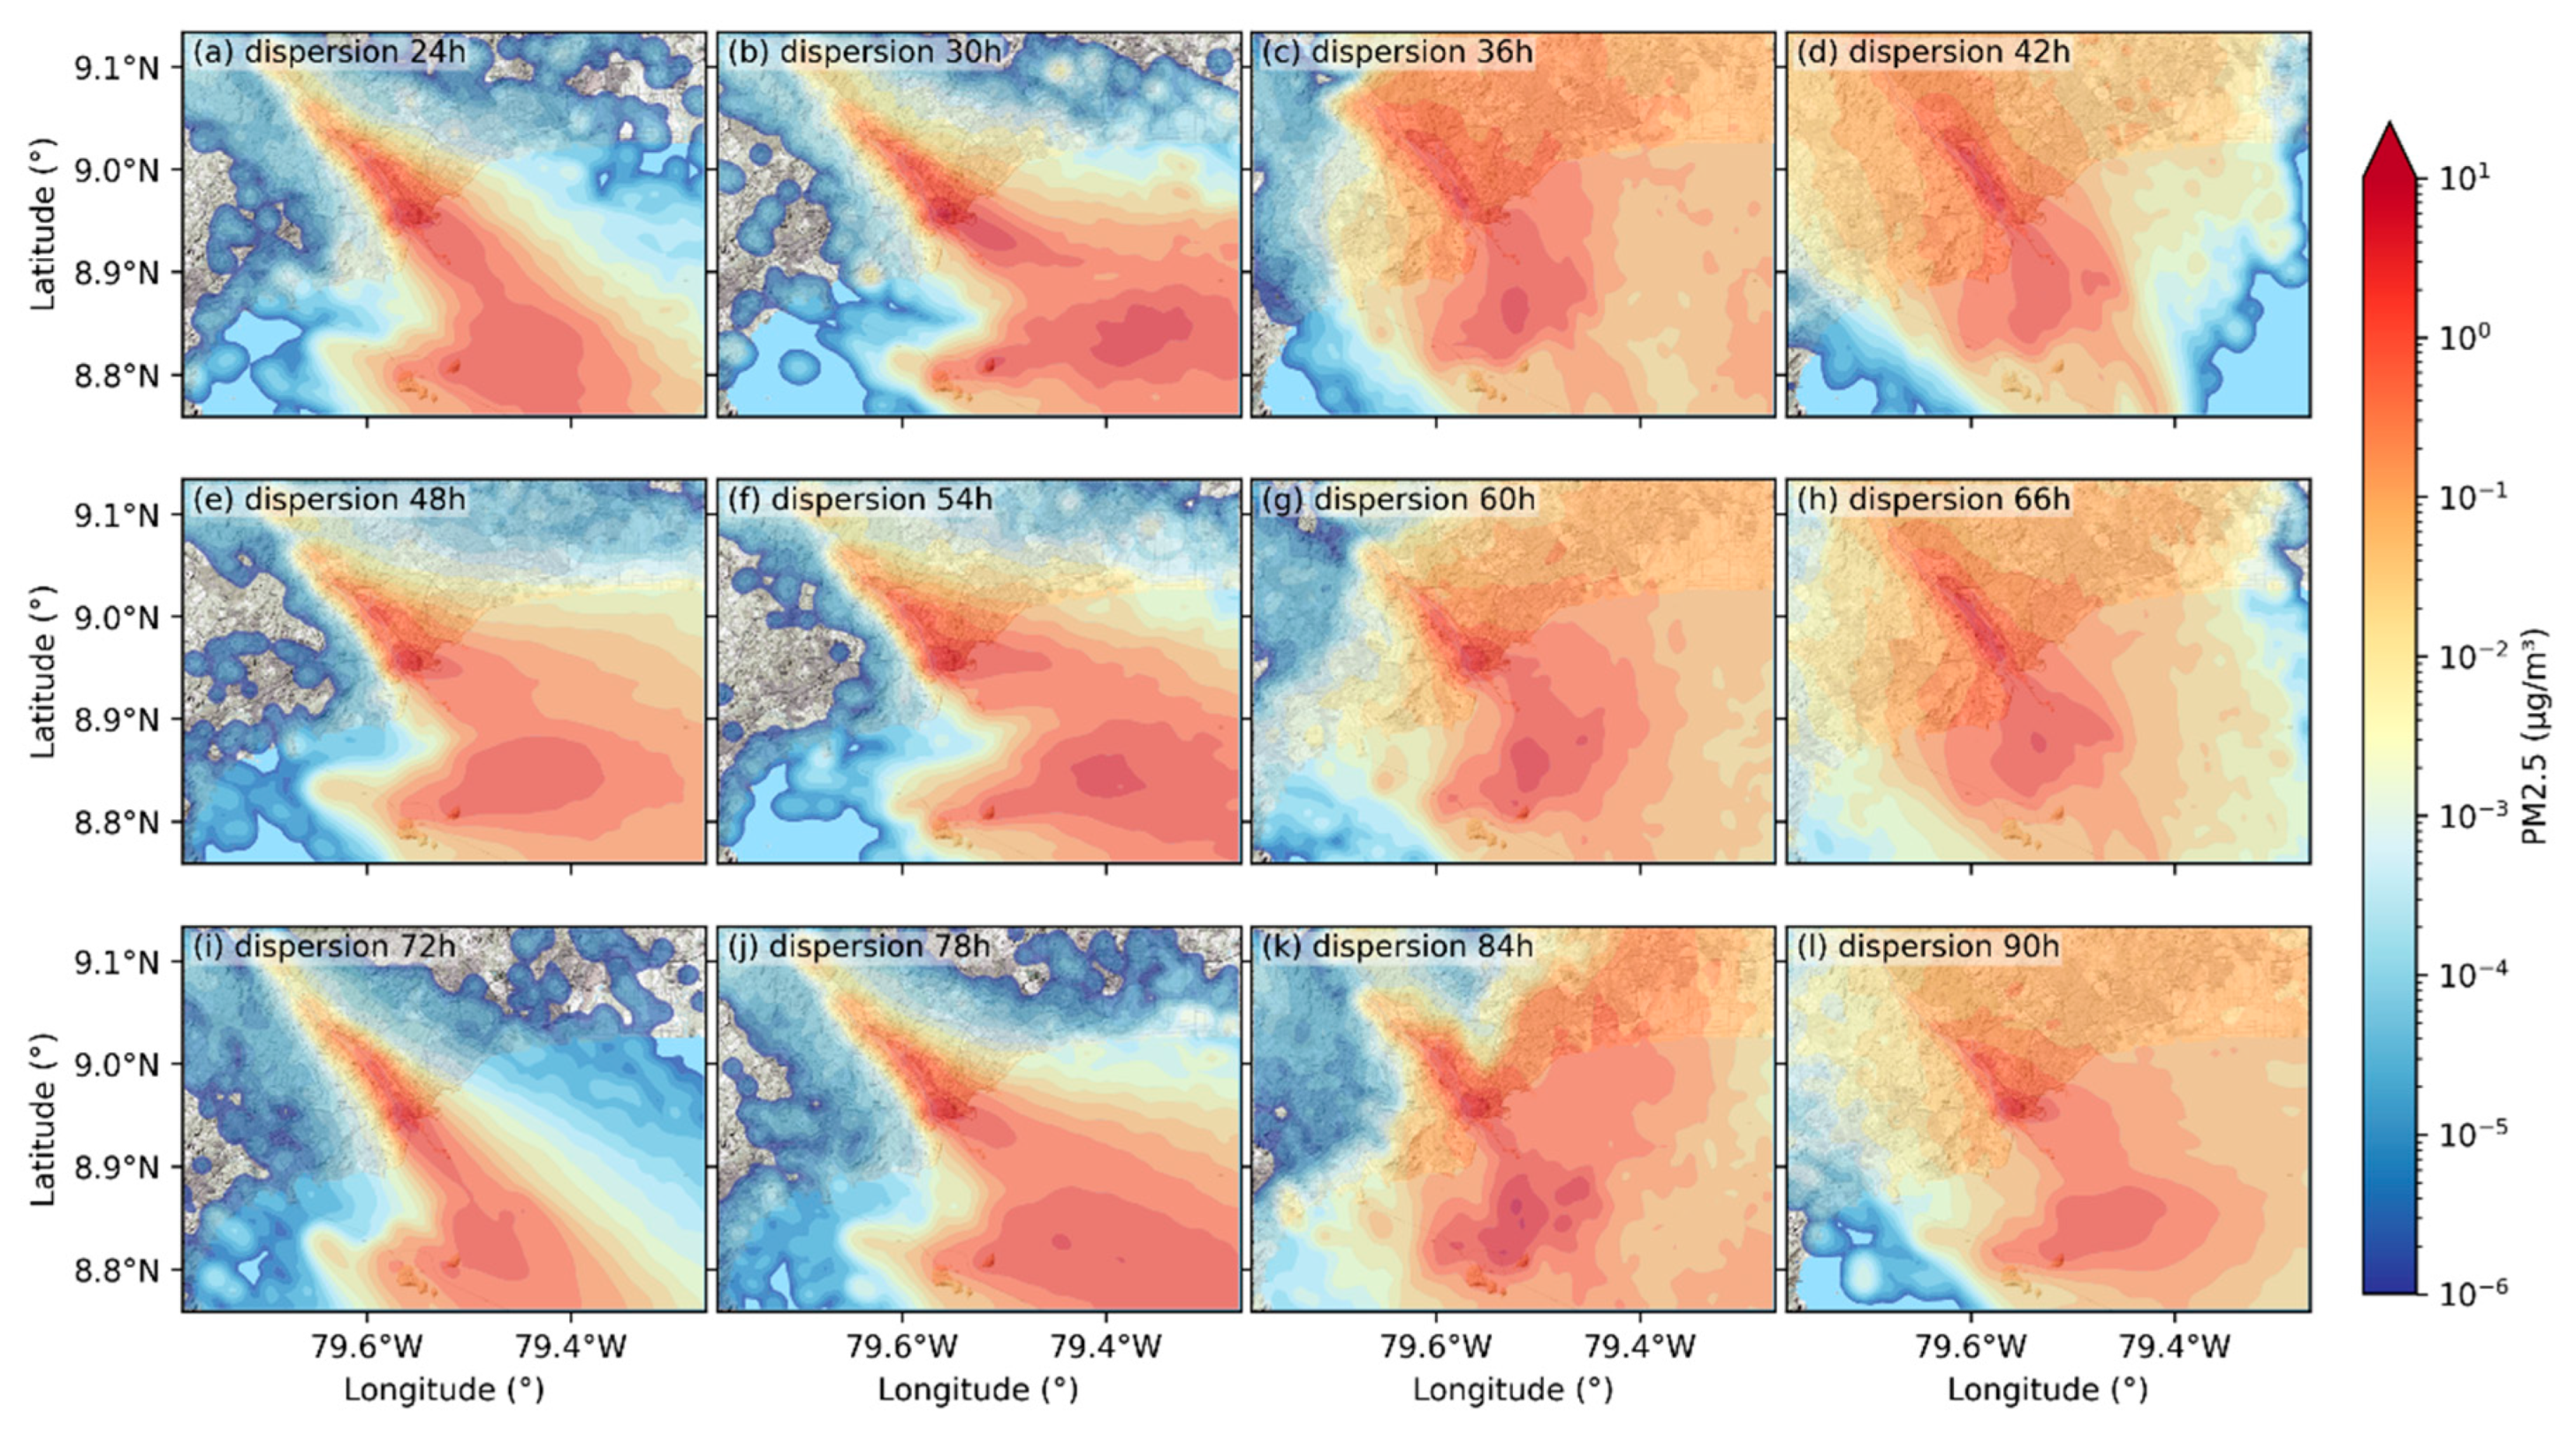
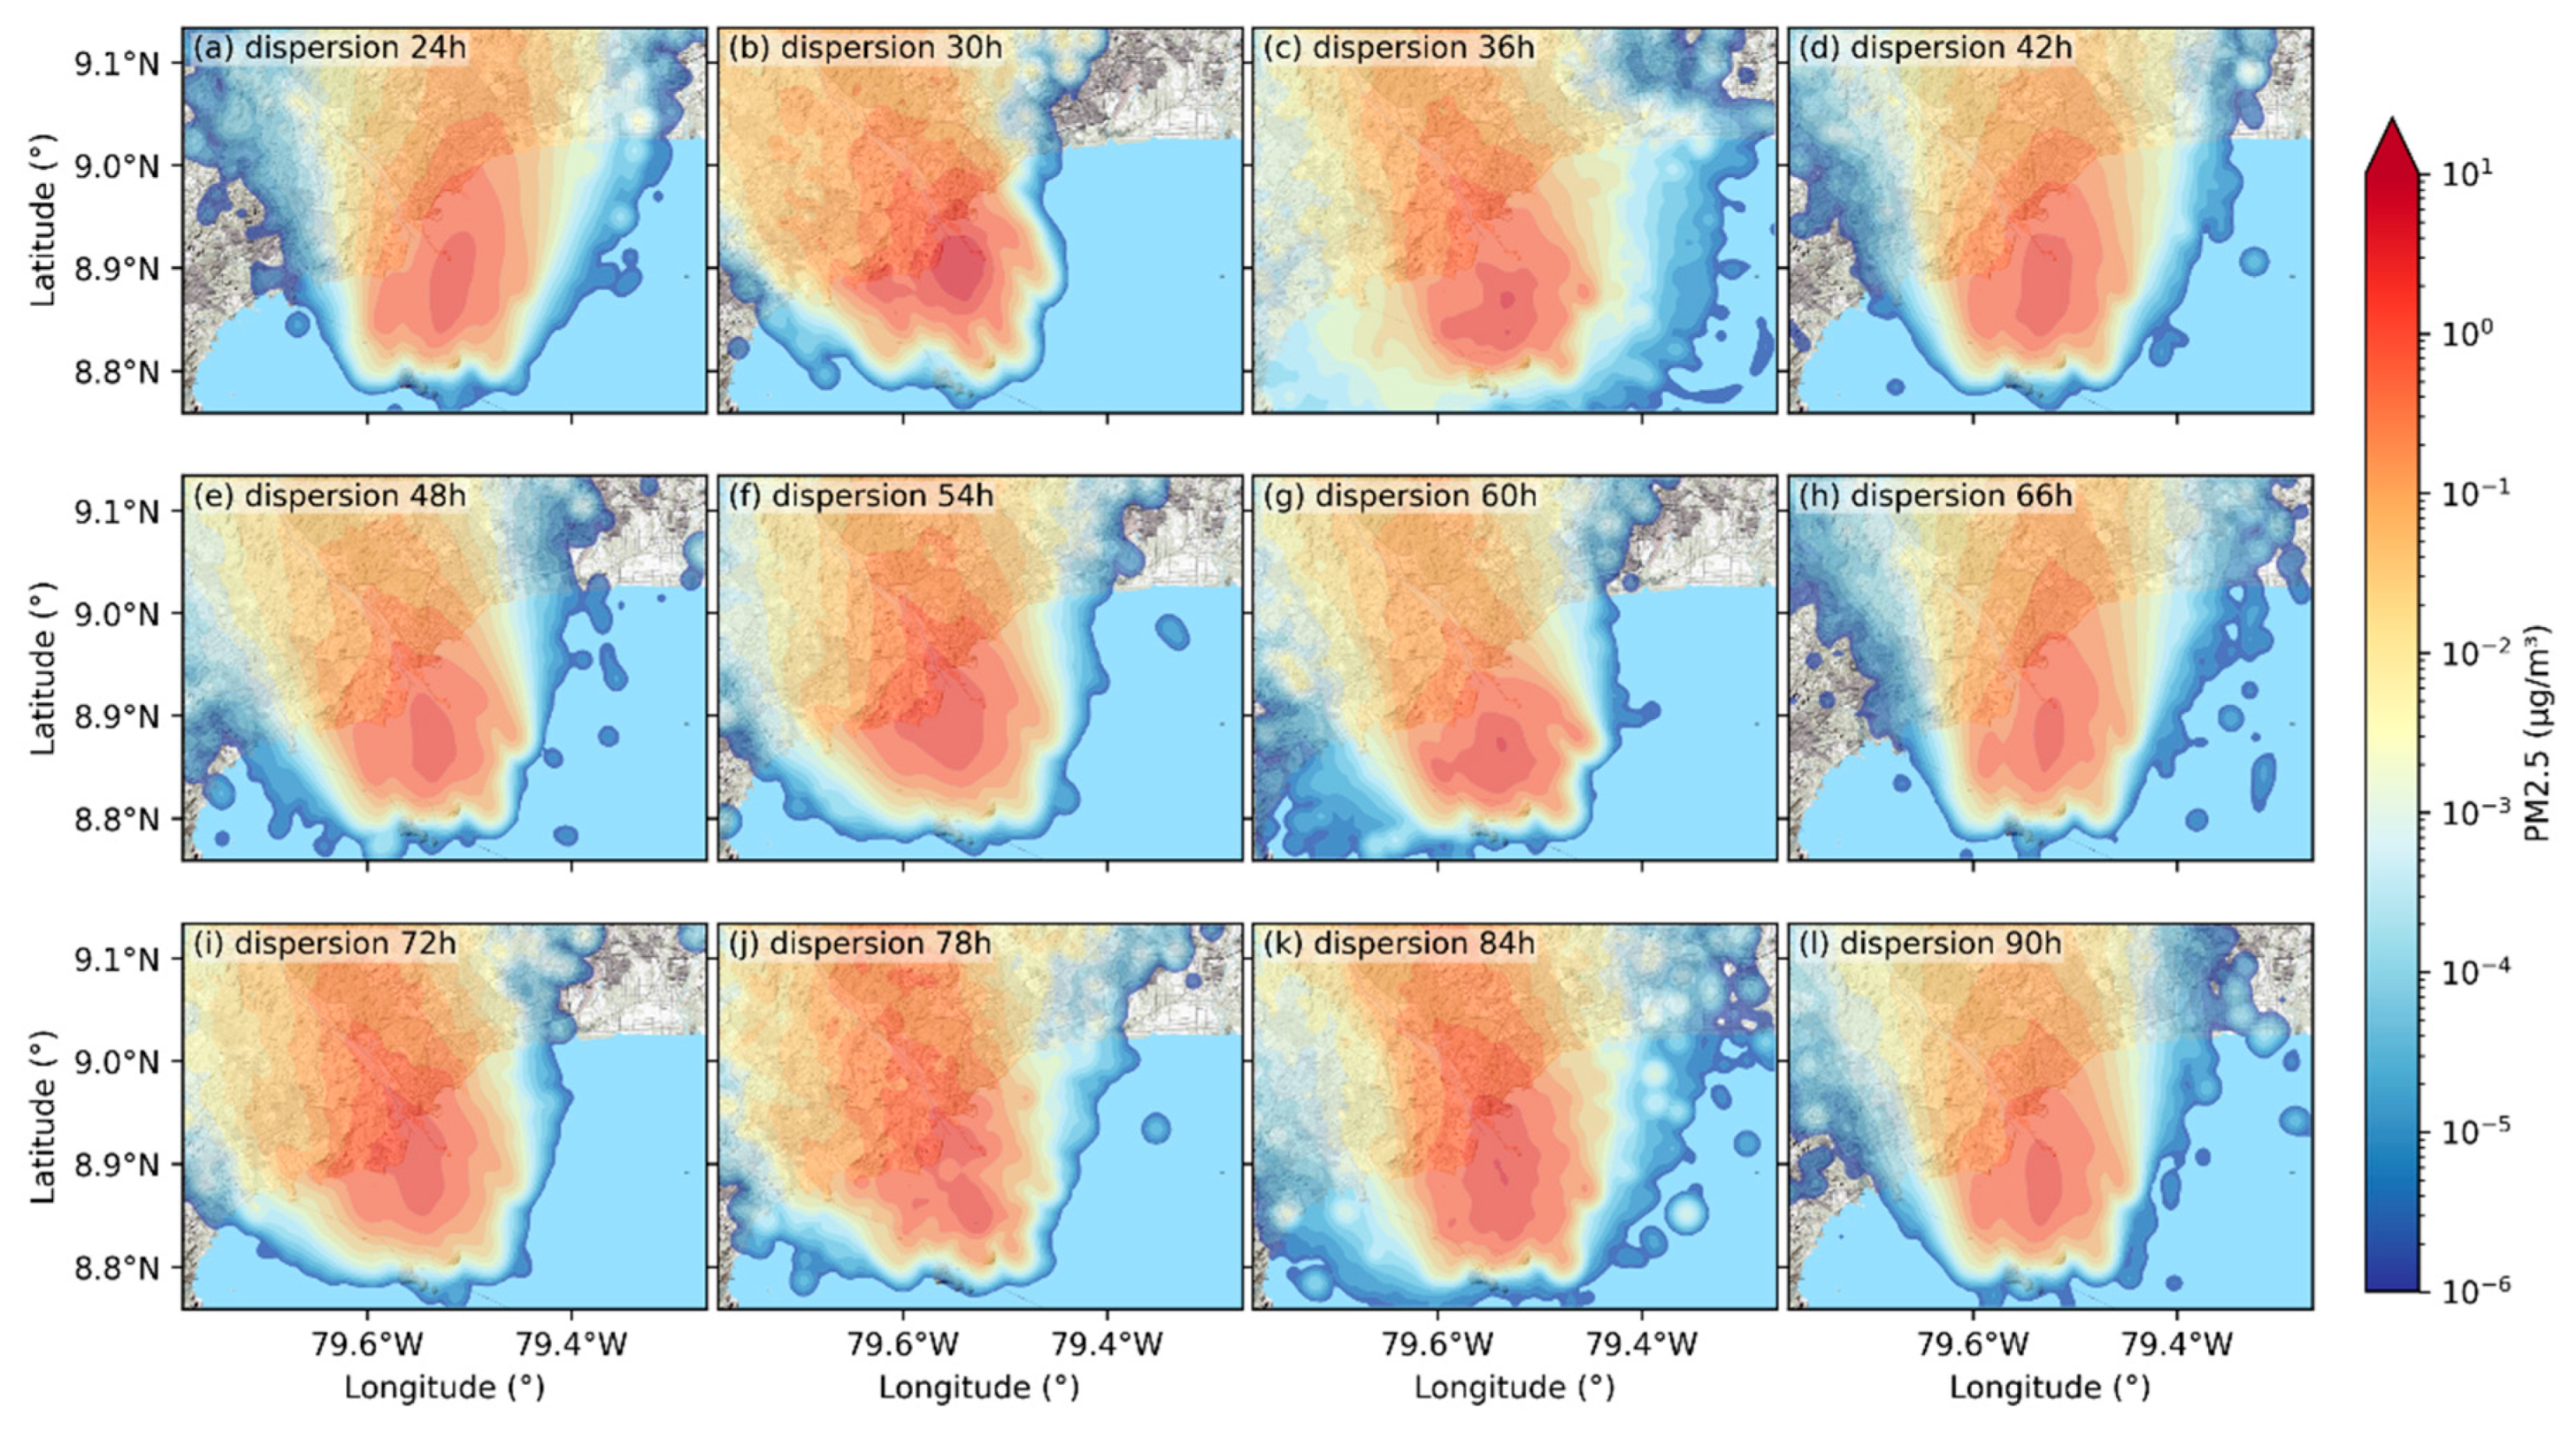
| Duration Class (h) | Share of Events (%) | Share of Waiting Time (%) |
|---|---|---|
| 0–6 | 46.7 | 5.6 |
| 6–24 | 33.6 | 24.9 |
| 24–48 | 12.5 | 22.7 |
| 48–72 | 4.5 | 18.5 |
| >120 | 2.7 | 28.3 |
| Indicator | Value (h) | Share of Total Waiting Time (%) |
|---|---|---|
| Mean | 15.01 | – |
| Median | 4.94 | – |
| 90th percentile | 38.48 | 54.85 |
| 95th percentile | 60.92 | 39.01 |
| 99th percentile | 142.52 | 15.81 |
| Ship Type Group | Total_Wait_Hours | Avg_Episode_Hours |
|---|---|---|
| Bulk Carrier | 54,685 | 35.40 |
| Chemical Tanker | 74,394 | 29.01 |
| Container Ship | 44,507 | 11.80 |
| Cruise | 1.76 | 1.76 |
| Dredging | 5537 | 17.41 |
| Fishing | 7448 | 20.64 |
| General Cargo | 15,875 | 21.07 |
| Liquified Gas Tanker | 39,854 | 22.24 |
| Oil Tanker | 122,632 | 19.18 |
| Other | 10,409 | 17.49 |
| Other Tanker | 14,238 | 29.49 |
| Passenger | 507 | 6.03 |
| Refrigerated | 8283 | 16.63 |
| RoRo | 12,218 | 50.49 |
| Tugs | 15,274 | 23.05 |
| Yacht | 4289 | 22.70 |
| Pollutant | All Sailing Emissions (kg) | Waiting Emissions (kg) | Waiting Contribution (%) |
|---|---|---|---|
| CO2 | 1.39 × 10⁹ | 4.97 × 10⁸ | 36 |
| NOx | 2.05 × 10⁷ | 7.01 × 10⁶ | 34 |
| SO2 | 4.25 × 10⁶ | 1.52 × 10⁶ | 36 |
| PM10 | 6.56 × 10⁵ | 2.32 × 10⁵ | 35 |
| PM2.5 | 6.03 × 10⁵ | 2.14 × 10⁵ | 35 |
| Point Name | Mean Conc. (All Sail.) | Mean Conc. (Anch.) | Contribution of Anch. (Mean) |
|---|---|---|---|
| Port of Balboa Office (8.960° N, 79.561° W) | 4.72 | 0.01 | 0.2% |
| Panama Convention Center (8.938° N, 79.548° W) | 1.04 | 0.04 | 3.8% |
| Panama City Hall (8.971° N, 79.535° W) | 0.33 | 0.04 | 12.1% |
| Multiplaza Panama (8.986° N, 79.511° W) | 0.27 | 0.08 | 29.6% |
| Embassy of the United States (8.999° N, 79.562° W) | 0.33 | 0.01 | 3.0% |
| San Fernando Hospital Clinic (9.004° N, 79.517° W) | 0.12 | 0.03 | 25.0% |
| Point Name | Max Conc. (All Sail.) | Max Conc. (Anch.) | Contribution of Anch. (Max) |
|---|---|---|---|
| Port of Balboa Office (8.960° N, 79.561° W) | 10.7 | 0.29 | 2.7% |
| Panama Convention Center (8.938° N, 79.548° W) | 2.99 | 0.82 | 27.4% |
| Panama City Hall (8.971° N, 79.535° W) | 1.37 | 0.86 | 62.8% |
| Multiplaza Panama (8.986° N, 79.511° W) | 3.61 | 2.34 | 64.8% |
| Embassy of the United States (8.999° N, 79.562° W) | 2.59 | 0.13 | 5.0% |
| San Fernando Hospital Clinic (9.004° N, 79.517° W) | 1.1 | 0.76 | 69.1% |
| Point Name | Mean Conc. (All Sail.) | Mean Conc. (Anch.) | Contribution of Anch. (Mean) |
|---|---|---|---|
| Port of Balboa Office (8.960° N, 79.561° W) | 6.84 | 0.11 | 1.6% |
| Panama Convention Center (8.938° N, 79.548° W) | 1.78 | 0.21 | 11.8% |
| Panama City Hall (8.971° N, 79.535° W) | 0.71 | 0.14 | 19.7% |
| Multiplaza Panama (8.986° N, 79.511° W) | 0.32 | 0.11 | 34.4% |
| Embassy of the United States (8.999° N, 79.562° W) | 0.49 | 0.05 | 10.2% |
| San Fernando Hospital Clinic (9.004° N, 79.517° W) | 0.22 | 0.07 | 31.8% |
| Point Name | Max Conc. (All Sail.) | Max Conc. (Anch.) | Contribution of Anch. (Max) |
|---|---|---|---|
| Port of Balboa Office (8.960° N, 79.561° W) | 22.03 | 0.63 | 2.9% |
| Panama Convention Center (8.938° N, 79.548° W) | 5.52 | 1.36 | 24.6% |
| Panama City Hall (8.971° N, 79.535° W) | 3.09 | 0.79 | 25.6% |
| Multiplaza Panama (8.986° N, 79.511° W) | 1.54 | 0.68 | 44.2% |
| Embassy of the United States (8.999° N, 79.562° W) | 3.65 | 0.48 | 13.2% |
| San Fernando Hospital Clinic (9.004° N, 79.517° W) | 0.92 | 0.47 | 51.1% |
| Point Name | Mean Conc. (All Sail.) | Mean Conc. (Anch.) | Contribution of Anch. (Mean) |
|---|---|---|---|
| Port of Balboa Office (8.960° N, 79.561° W) | 2.38 | 0.55 | 23.1% |
| Panama Convention Center (8.938° N, 79.548° W) | 2.47 | 0.98 | 39.7% |
| Panama City Hall (8.971° N, 79.535° W) | 1.05 | 0.51 | 48.6% |
| Multiplaza Panama (8.986° N, 79.511° W) | 0.7 | 0.27 | 38.6% |
| Embassy of the United States (8.999° N, 79.562° W) | 0.89 | 0.26 | 29.2% |
| San Fernando Hospital Clinic (9.004° N, 79.517° W) | 0.44 | 0.2 | 45.5% |
| Point Name | Max Conc. (All Sail.) | Max Conc. (Anch.) | Contribution of Anch. (Max) |
|---|---|---|---|
| Port of Balboa Office (8.960° N, 79.561° W) | 14.92 | 2.77 | 18.6% |
| Panama Convention Center (8.938° N, 79.548° W) | 9.83 | 4.02 | 40.9% |
| Panama City Hall (8.971° N, 79.535° W) | 3.74 | 1.9 | 50.8% |
| Multiplaza Panama (8.986° N, 79.511° W) | 1.88 | 0.91 | 48.4% |
| Embassy of the United States (8.999° N, 79.562° W) | 2.3 | 0.91 | 39.6% |
| San Fernando Hospital Clinic (9.004° N, 79.517° W) | 1.43 | 0.54 | 37.8% |
Disclaimer/Publisher’s Note: The statements, opinions and data contained in all publications are solely those of the individual author(s) and contributor(s) and not of MDPI and/or the editor(s). MDPI and/or the editor(s) disclaim responsibility for any injury to people or property resulting from any ideas, methods, instructions or products referred to in the content. |
© 2025 by the authors. Licensee MDPI, Basel, Switzerland. This article is an open access article distributed under the terms and conditions of the Creative Commons Attribution (CC BY) license (https://creativecommons.org/licenses/by/4.0/).
Share and Cite
Lee, Y.; Park, Y.; Kim, G.; Yoo, J.; Pinzon-Acosta, C.; Gonzalez-Olivardia, F.; Cruz, E.; Lee, H. Ship Air Emission and Their Air Quality Impacts in the Panama Canal Area: An Integrated AIS-Based Estimation During Hotelling Mode in Anchorage Zone. J. Mar. Sci. Eng. 2025, 13, 1888. https://doi.org/10.3390/jmse13101888
Lee Y, Park Y, Kim G, Yoo J, Pinzon-Acosta C, Gonzalez-Olivardia F, Cruz E, Lee H. Ship Air Emission and Their Air Quality Impacts in the Panama Canal Area: An Integrated AIS-Based Estimation During Hotelling Mode in Anchorage Zone. Journal of Marine Science and Engineering. 2025; 13(10):1888. https://doi.org/10.3390/jmse13101888
Chicago/Turabian StyleLee, Yongchan, Youngil Park, Gaeul Kim, Jiye Yoo, Cesar Pinzon-Acosta, Franchesca Gonzalez-Olivardia, Edmanuel Cruz, and Heekwan Lee. 2025. "Ship Air Emission and Their Air Quality Impacts in the Panama Canal Area: An Integrated AIS-Based Estimation During Hotelling Mode in Anchorage Zone" Journal of Marine Science and Engineering 13, no. 10: 1888. https://doi.org/10.3390/jmse13101888
APA StyleLee, Y., Park, Y., Kim, G., Yoo, J., Pinzon-Acosta, C., Gonzalez-Olivardia, F., Cruz, E., & Lee, H. (2025). Ship Air Emission and Their Air Quality Impacts in the Panama Canal Area: An Integrated AIS-Based Estimation During Hotelling Mode in Anchorage Zone. Journal of Marine Science and Engineering, 13(10), 1888. https://doi.org/10.3390/jmse13101888


