1. Introduction
Aquaculture can meet the growing human demand for fish protein. Currently, the traditional open aquaculture model imposes a high environmental load and is exposed to the risk of parasitic and viral infections [
1]. In contrast, closed aquaculture systems, by isolating external water, not only decrease the risk of viral and parasitic infections [
2,
3] but also control water quality and dissolved oxygen levels, significantly increasing fish density and growth rate [
4,
5]. Closed aquaculture systems can be used for sustainable aquaculture in offshore sheltered seas and inland deep-water lakes, expanding aquaculture production by increasing aquaculture densities and making full use of aquaculture space [
6,
7].
Closed aquaculture platforms require water exchange via recirculating water systems, with recirculation energy costs critically impact operational economics. Considering that a sufficiently deep sidewall can better isolate parasites [
8], a closed fish cage can be opened at the bottom to reduce the recirculating water supply by some natural exchanges with the external water. These semi-closed fish cages with rigid sidewalls combine the advantages of closed fish cages with traditional open fish cages. Research on the aforementioned novel aquaculture equipment remains limited, and its practical application is still in the exploratory stage.
Extensive research on the hydrodynamic performance has been conducted on floating liquid-carrying platforms [
9,
10]. Since the structural mass of the closed fish cage is much smaller than that of the inner water, its hydrodynamic performance is somewhat special compared with conventional floating liquid-carrying platforms. In terms of experimental study on the hydrodynamic performance of a cylindrical rigid closed fish cage, Kristiansen et al. [
11] and Gabl et al. [
12] comparatively analyzed the hydrodynamic response of fish cages under different tank filling conditions: solids versus ballast water. Building on Kristiansen’s experiment [
11], Shen et al. [
13,
14] investigated the sloshing and its effect on the global motion response and mean drift force. The cylindrical fish cages in the above study had a smaller waterline surface area and reserve buoyancy. Wiegerink et al. [
15,
16] investigated the motion and sloshing response of a cylindrical closed aquaculture platform with a larger rectangular cross-section buoyancy tank on the outside of the aquaculture tank and designed a sloshing suppression structure. In terms of numerical study of the hydrodynamic response of a cylindrical closed aquaculture platform, Tan et al. [
17] developed a coupled time-domain model integrating inner sloshing with global motion. The sloshing response of the liquid tank and the motion of the fish cage are solved by multimodal theory and Cummins theory, respectively. Su et al. [
18] developed a coupled numerical model of a closed fish cage under wave action by employing FhSim program, and numerical calculations in the frequency and time domains were carried out and compared with the model test.
Semi-closed aquaculture platforms have a moonpool inside, which is mostly used on floating structures such as drilling ships [
19,
20] and oscillating water column (OWC) devices [
21]. Molin et al. [
22] proposed theoretical piston/sloshing period formulations for infinite and finite water depths, and Han et al. [
23] and Zhang et al. [
24] evaluated the sloshing phenomenon inside fixed thin-walled cylindrical structure. Moreau et al. [
25] investigated the motion and sloshing characteristics of a cylindrical floating body with a circular moonpool and analyzed the effect of damping plates inside the moonpool on the hydrodynamic response. Shen et al. [
8] studied the motion response, internal sloshing, external upwelling, and mooring loads of a closed aquaculture platform versus a semi-closed (open-bottom) aquaculture platform by experiment and contrasted the hydrodynamic responses. Compared to drilling vessels/platforms, cylindrical aquaculture platforms have a much larger moonpool-to-waterplane area ratio, and research on the hydrodynamic issues of such special floating structures remains insufficient.
In general, the hydrodynamic issues arising from the specific structure of floating platforms with large-diameter liquid tanks and moon pools require dedicated research. In this study, new closed and semi-closed aquaculture platforms with large-scale waterline surfaces were developed, and their hydrodynamic performance was systematically analyzed by combining physical model tests and computational fluid dynamics (CFD) methods. The model test specifications and a comprehensive CFD methodology for closed/semi-closed cylindrical cages were established, covering numerical simulations of free decay in calm water and wave-coupled motion. Then, the natural motion periods, fluid sloshing mechanisms within the cabin, and external wave-upwelling characteristics of both cage types were quantitatively analyzed under regular and irregular wave conditions in typical operational sea states. Finally, the variation patterns of cage motion performance and their dominant mechanisms under actual sea conditions were revealed, providing theoretical support for optimizing deep-sea aquaculture equipment design.
2. Model Test Setup
Model tests were conducted at Jiangsu University of Science and Technology, comprising two distinct phases:
Regular wave tests: carried out in the towing tank, with dimensions of 100.0 m (length) × 6.0 m (width) × 2.0 m (water depth);
Irregular wave tests: performed in the harbor engineering basin, with dimensions of 38.0 m (length) × 15.0 m (width) × 0.9 m (water depth).
2.1. Aquaculture Platform Description
The rigid aquaculture platform is made up of two parts: a cylindrical aquaculture tank (AT) and a buoyancy tank (BT). The aquaculture tank is a rigid thin-walled structure, while the buoyancy tank is an annular structure with a rectangular cross-section. The buoyancy tank provides buoyancy for the aquaculture platform, and its interior space can be arranged with functional tanks (e.g., feed tanks, pump tanks, water treatment tanks, etc.), and the upper part of the BT can be used for personnel operations and as a leisure and recreation platform. The outer diameters of the aquaculture tank and the buoyancy tank are 39.2 m and 48.0 m, respectively, and both the aquaculture tank and the buoyancy tank have inner diameters of 38.9 m. The aquaculture platform has a draft of 21 m and is designed to have an aquaculture volume of 25,000 m
3. The structural configuration and dimensional schematic of the closed and semi-closed aquaculture platforms are shown in
Figure 1. The bottom of the semi-closed platform uses fishing net to isolate the aquaculture tank from the external environment.
Considering the wave-generation limits, spatial constraints of wave basin, and prototype cage dimensions, the scaling ratio (
) was set to 1:40. According to the geometrically and Froude similar law, the conversion relations for the main physical quantities are shown in
Table 1, where
η is the density ratio between freshwater and seawater. The subscripts s and m denote the full scale and model scale, respectively. The prototype and model scale, mass, and inertia parameters of the closed and semi-closed aquaculture platforms are listed in
Table 2.
2.2. Sloshing Modes
The hydrodynamics of the aquaculture platform may be significantly impacted by higher-order sloshing modes [
13,
26]. To ensure that the regular waves cover the higher-order sloshing modes as much as possible, the natural period of the sloshing of the aquaculture platform is first estimated. The natural frequency of liquid tank sloshing can be determined as
where
is the root of the first type of Bessel equation
, i.e.,
k0,1Rt = 3:832;
k0,2Rt = 7:016, etc.
denotes radius of the liquid tank, and
represents tank depth.
In semi-closed configurations featuring a circular moonpool, the internal wave surface elevation can be categorized into piston and sloshing modes. Sloshing mode natural frequencies for the circular moonpool are
where
represents the root of the first type of Bessel equation
;
are the coefficients [
20]. The symmetric (
m = 0) and asymmetric (
m = 1) sloshing mode natural periods of the closed and semi-closed aquaculture platforms were calculated as listed in
Table 3.
2.3. Model Manufacture
The aquaculture platform model’s principal framework was constructed from acrylic and polycarbonate plates, and the model fabrication scheme and photographs are shown in
Figure 2. The sidewalls of the AT are made of 2 polycarbonate plates with a thickness of 3.6 mm, and the splices are clamped with aluminum plates. The bottom plate of the aquaculture tank is made of a 3 mm acrylic plate and installed with a cross-shaped keel to enhance its strength. In addition, to provide additional buoyancy for the bottom plate, EVA (Ethylene vinyl acetate copolymer) plates with a thickness of 1 cm were affixed to the lower part of the bottom plate. The aquaculture tank is embedded inside the buoyancy tank and is fastened by screws.
The buoyancy tank (blue part of
Figure 2b) is opened at the upper part, and its inner and outer rings are made of standard acrylic tubes with a thickness of 10 mm, with bulkheads (orange part of
Figure 2b) between them. The upper part of the outside of the buoyancy tank was heightened with 2 mm thick PVC (Polyvinyl chloride) plates to increase the freeboard to 17.5 cm to avoid water ingress into the buoyancy tank.
Eight suction and inlet pipes are installed in the model, with lengths of 25 cm and 40 cm and external diameters of 22 mm and 20 mm, respectively. The black part in
Figure 2d shows the pumps and controllers, which do not work in the tests of this paper.
2.4. Instrument and Mooring Arrangement
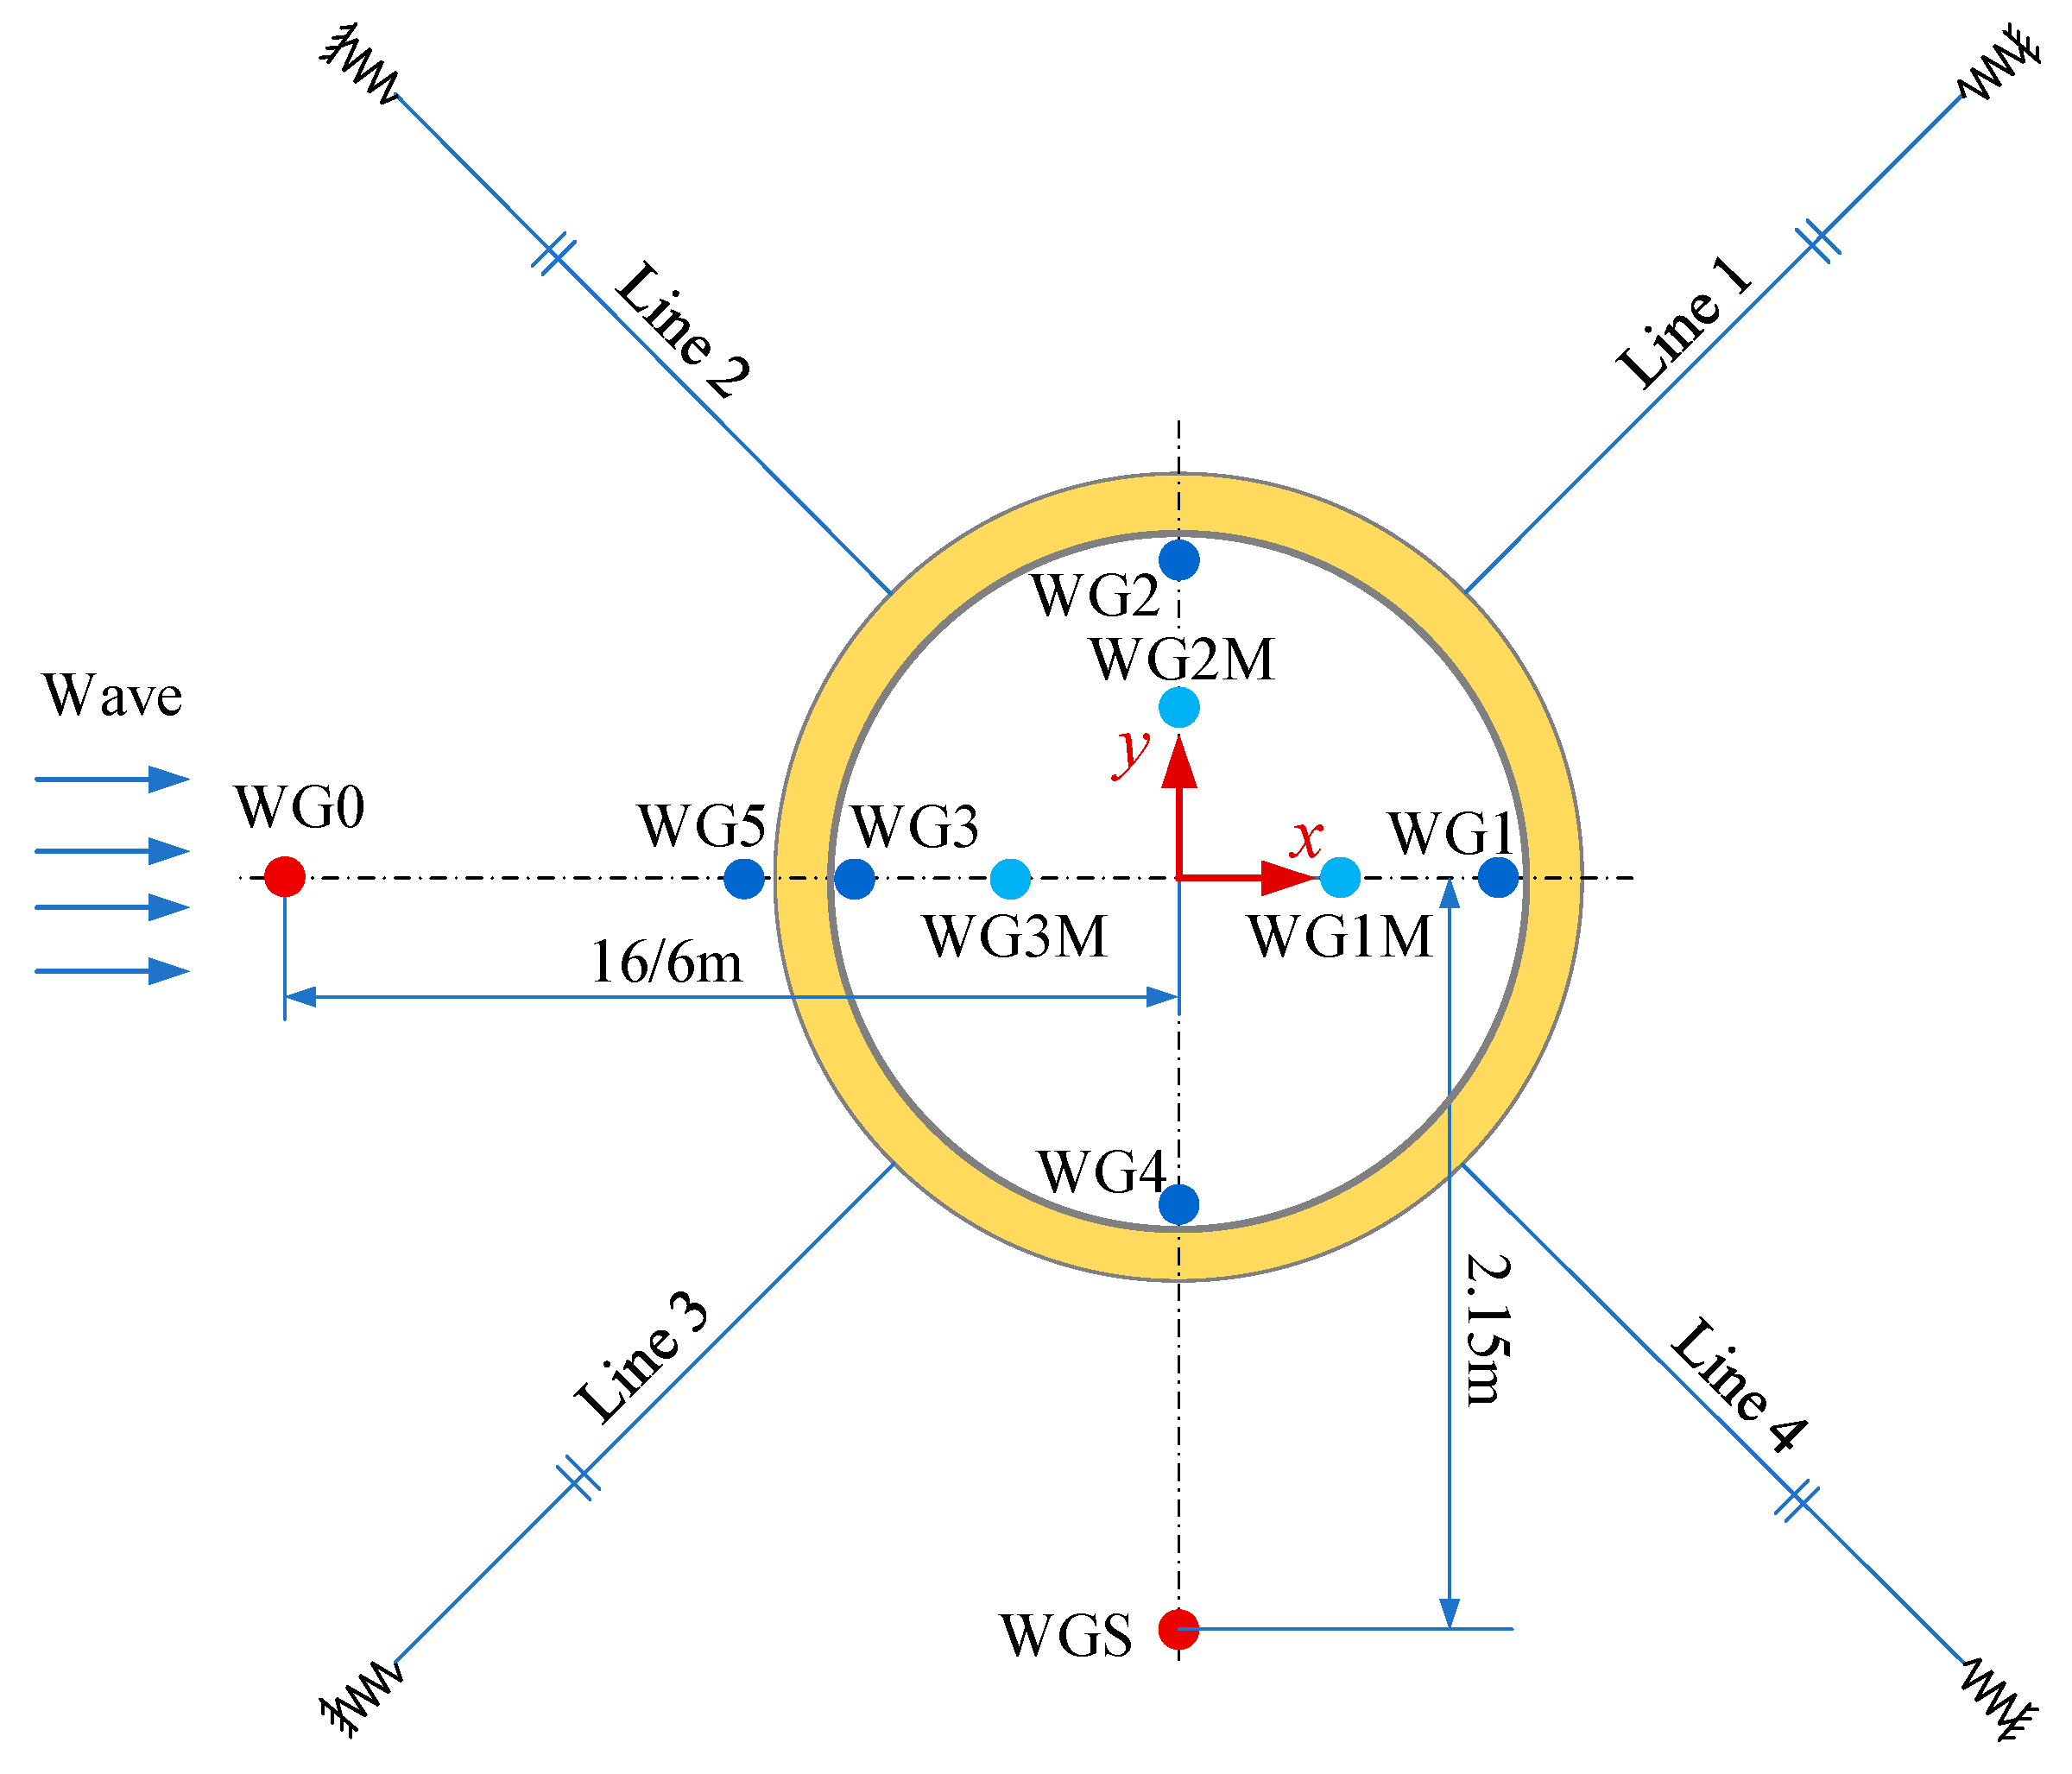
Inclination sensors and optical motion measuring instruments were employed to measure motion responses in regular and irregular wave tests, respectively. Capacitance wave gauges are used to measure wave elevation inside and outside of wave tanks and aquaculture platforms.
Table 4 compiles the primary instrument parameters and sampling rates applied. The wave gauges, inclinometers, and reflective spheres for optical measurements are mounted on a cross-shaped bracket on the top of the model.
Four wave gauges (No. WG1-WG4) were installed in the interior of the aquaculture tank, and one wave gauge (No. WG5) was installed in the exterior to measure the wave run-up on the wave-facing side. The capacitance wires of the wave gauges were positioned 1.0 cm apart from the tank’s interior wall and the outside buoyancy tank. Three wave gauges (No. WG1M-WG3M) are installed in the middle of the aquaculture tank at a distance of 1/4
Di from the center of the tank. To monitor the incident wave quality and wave diffraction near the model, wave gauges, numbered WG0 and WGS, were placed in front of and to the side of the aquaculture platform, respectively. The distance of WG0 from the aquaculture platform center was 16 m for the regular wave tests and 6 m for the irregular wave tests.
Figure 3 shows the arrangement of the wave gauges. WG0 and WGS are fixed to the towing tank, and the other WGs are installed on the aquaculture platform, moving with the model.
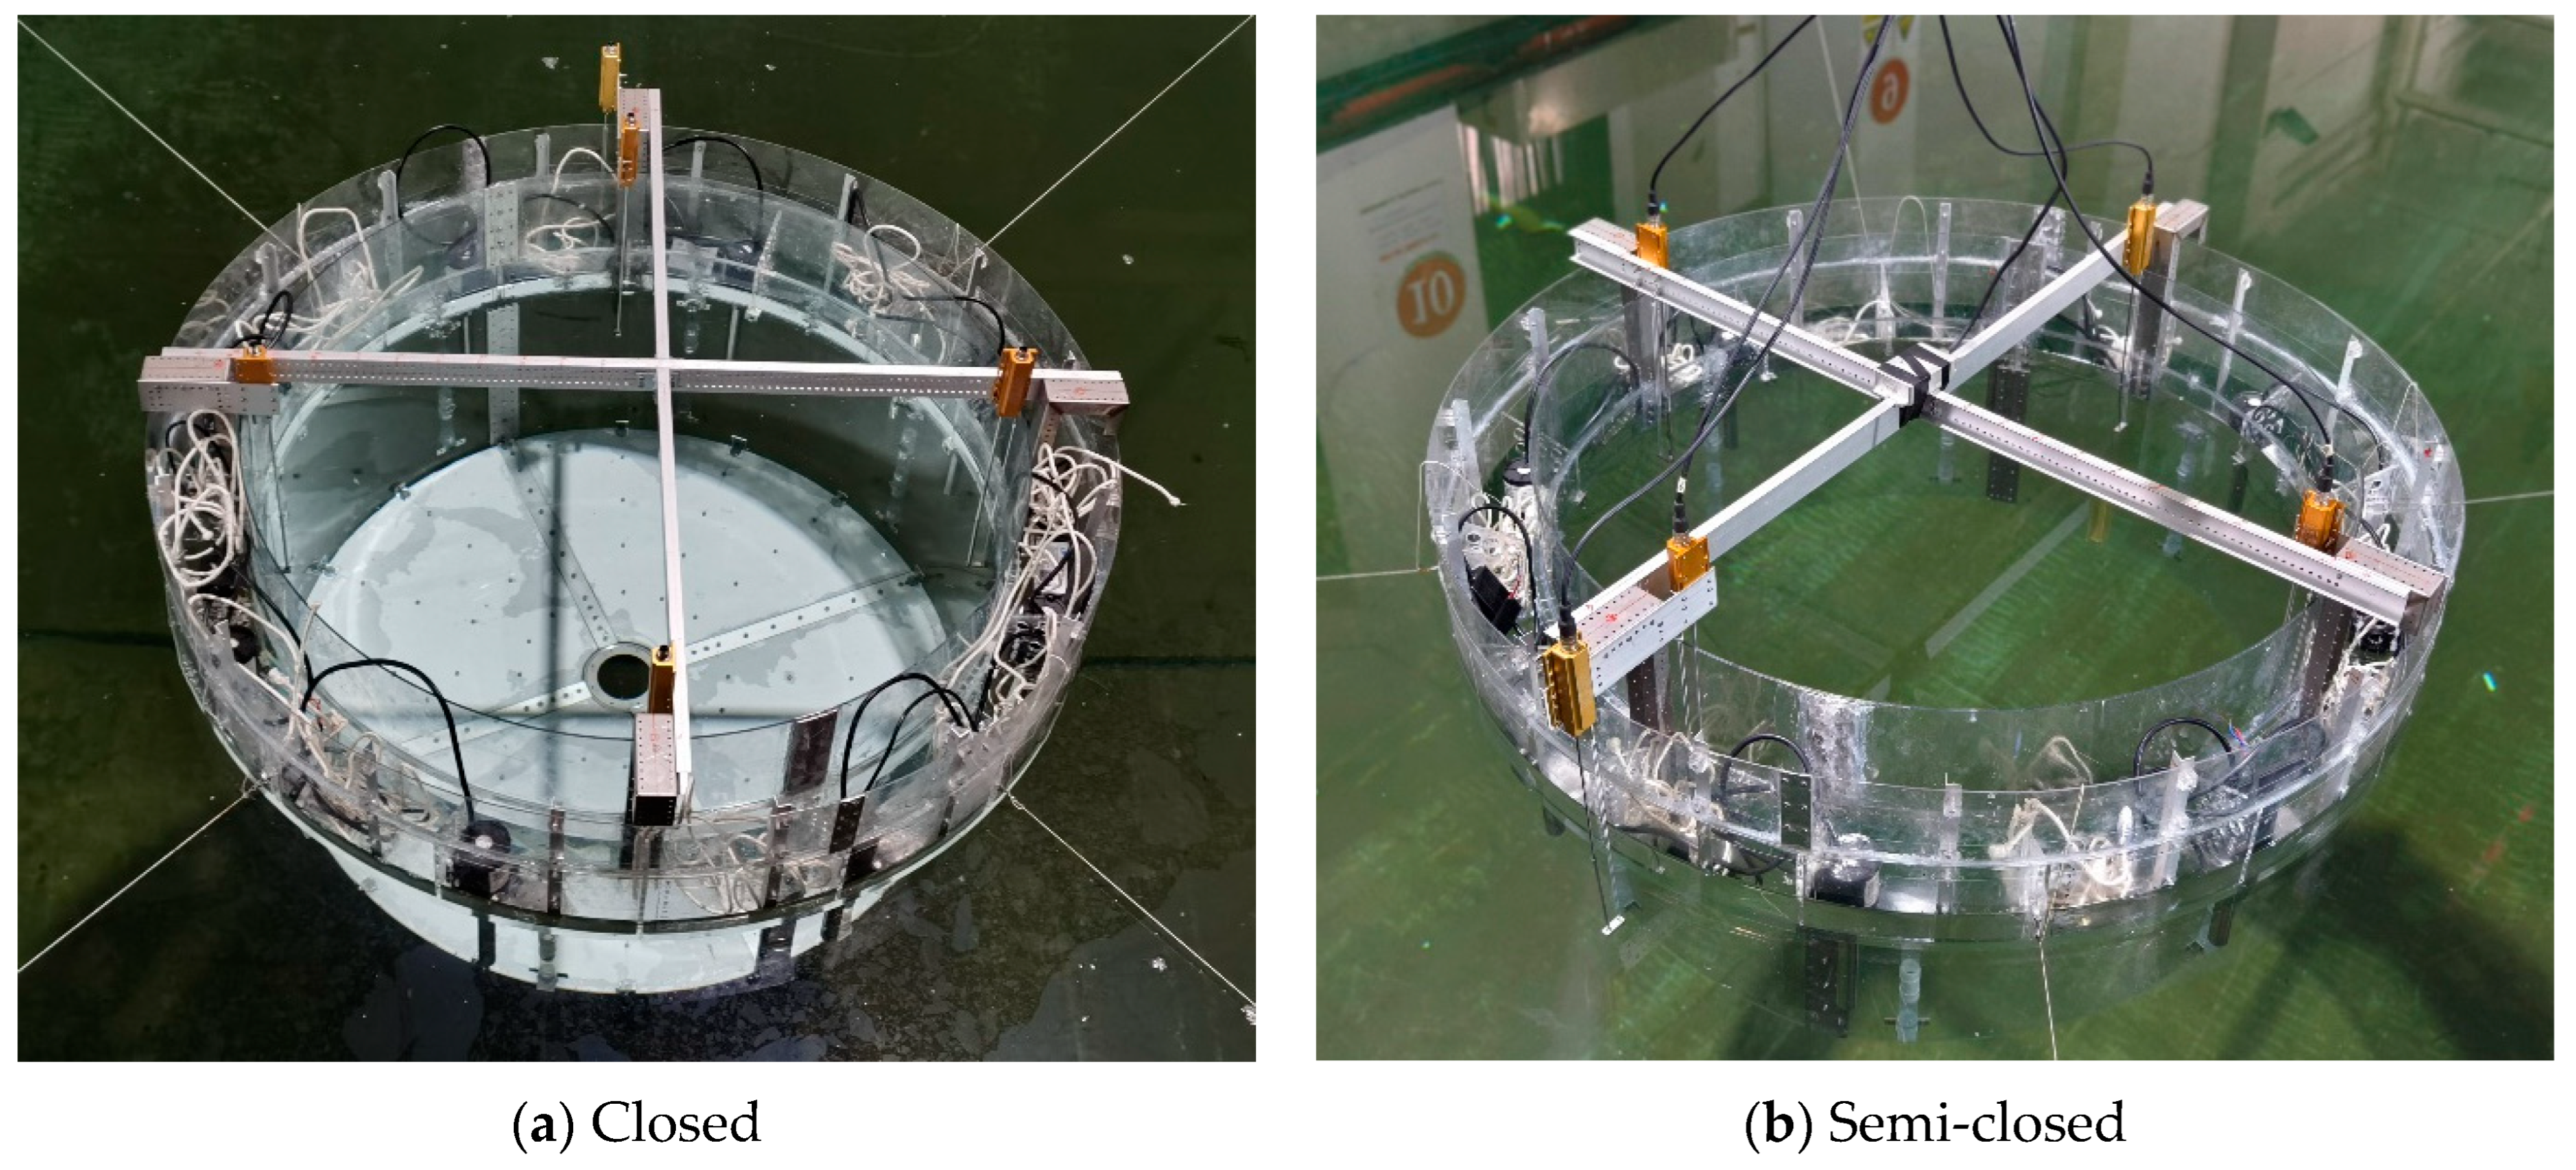
Four horizontal soft springs with stiffnesses of 25 N/m (closed) and 10 N/m (semi-closed) restrained the aquaculture platform models, accounting for their mass and added-mass discrepancies. Both aquaculture platform models are shown in
Figure 4.
2.5. Wave Conditions
According to the ITTC recommendation for the seakeeping test procedure, the uniform wave steepness or wave height can be selected for the regular wave test, and the same wave height was used for the test in this test. Three wave heights were used in the model test, i.e.,
Hm1 = 0.025 m,
Hm2 = 0.04 m, and
Hm3 = 0.06 m, according to the capacity of the wavemaker. The towing tank uses a hydraulically driven single wave-making panel, which has a weak high-frequency wave-making capability, so the minimum wavelength in the test was chosen to be 0.8 m. The wavelength to aquaculture tank diameter ratio (
λ/
Dt) was 0.8–6.0, the wavelength to buoyancy tank diameter ratio (
λ/
Db) was 0.67–5.0, and the wave period at the full scale was 4.5 s–10.7 s.
Table 5 lists the regular wave conditions adopted in the tests.
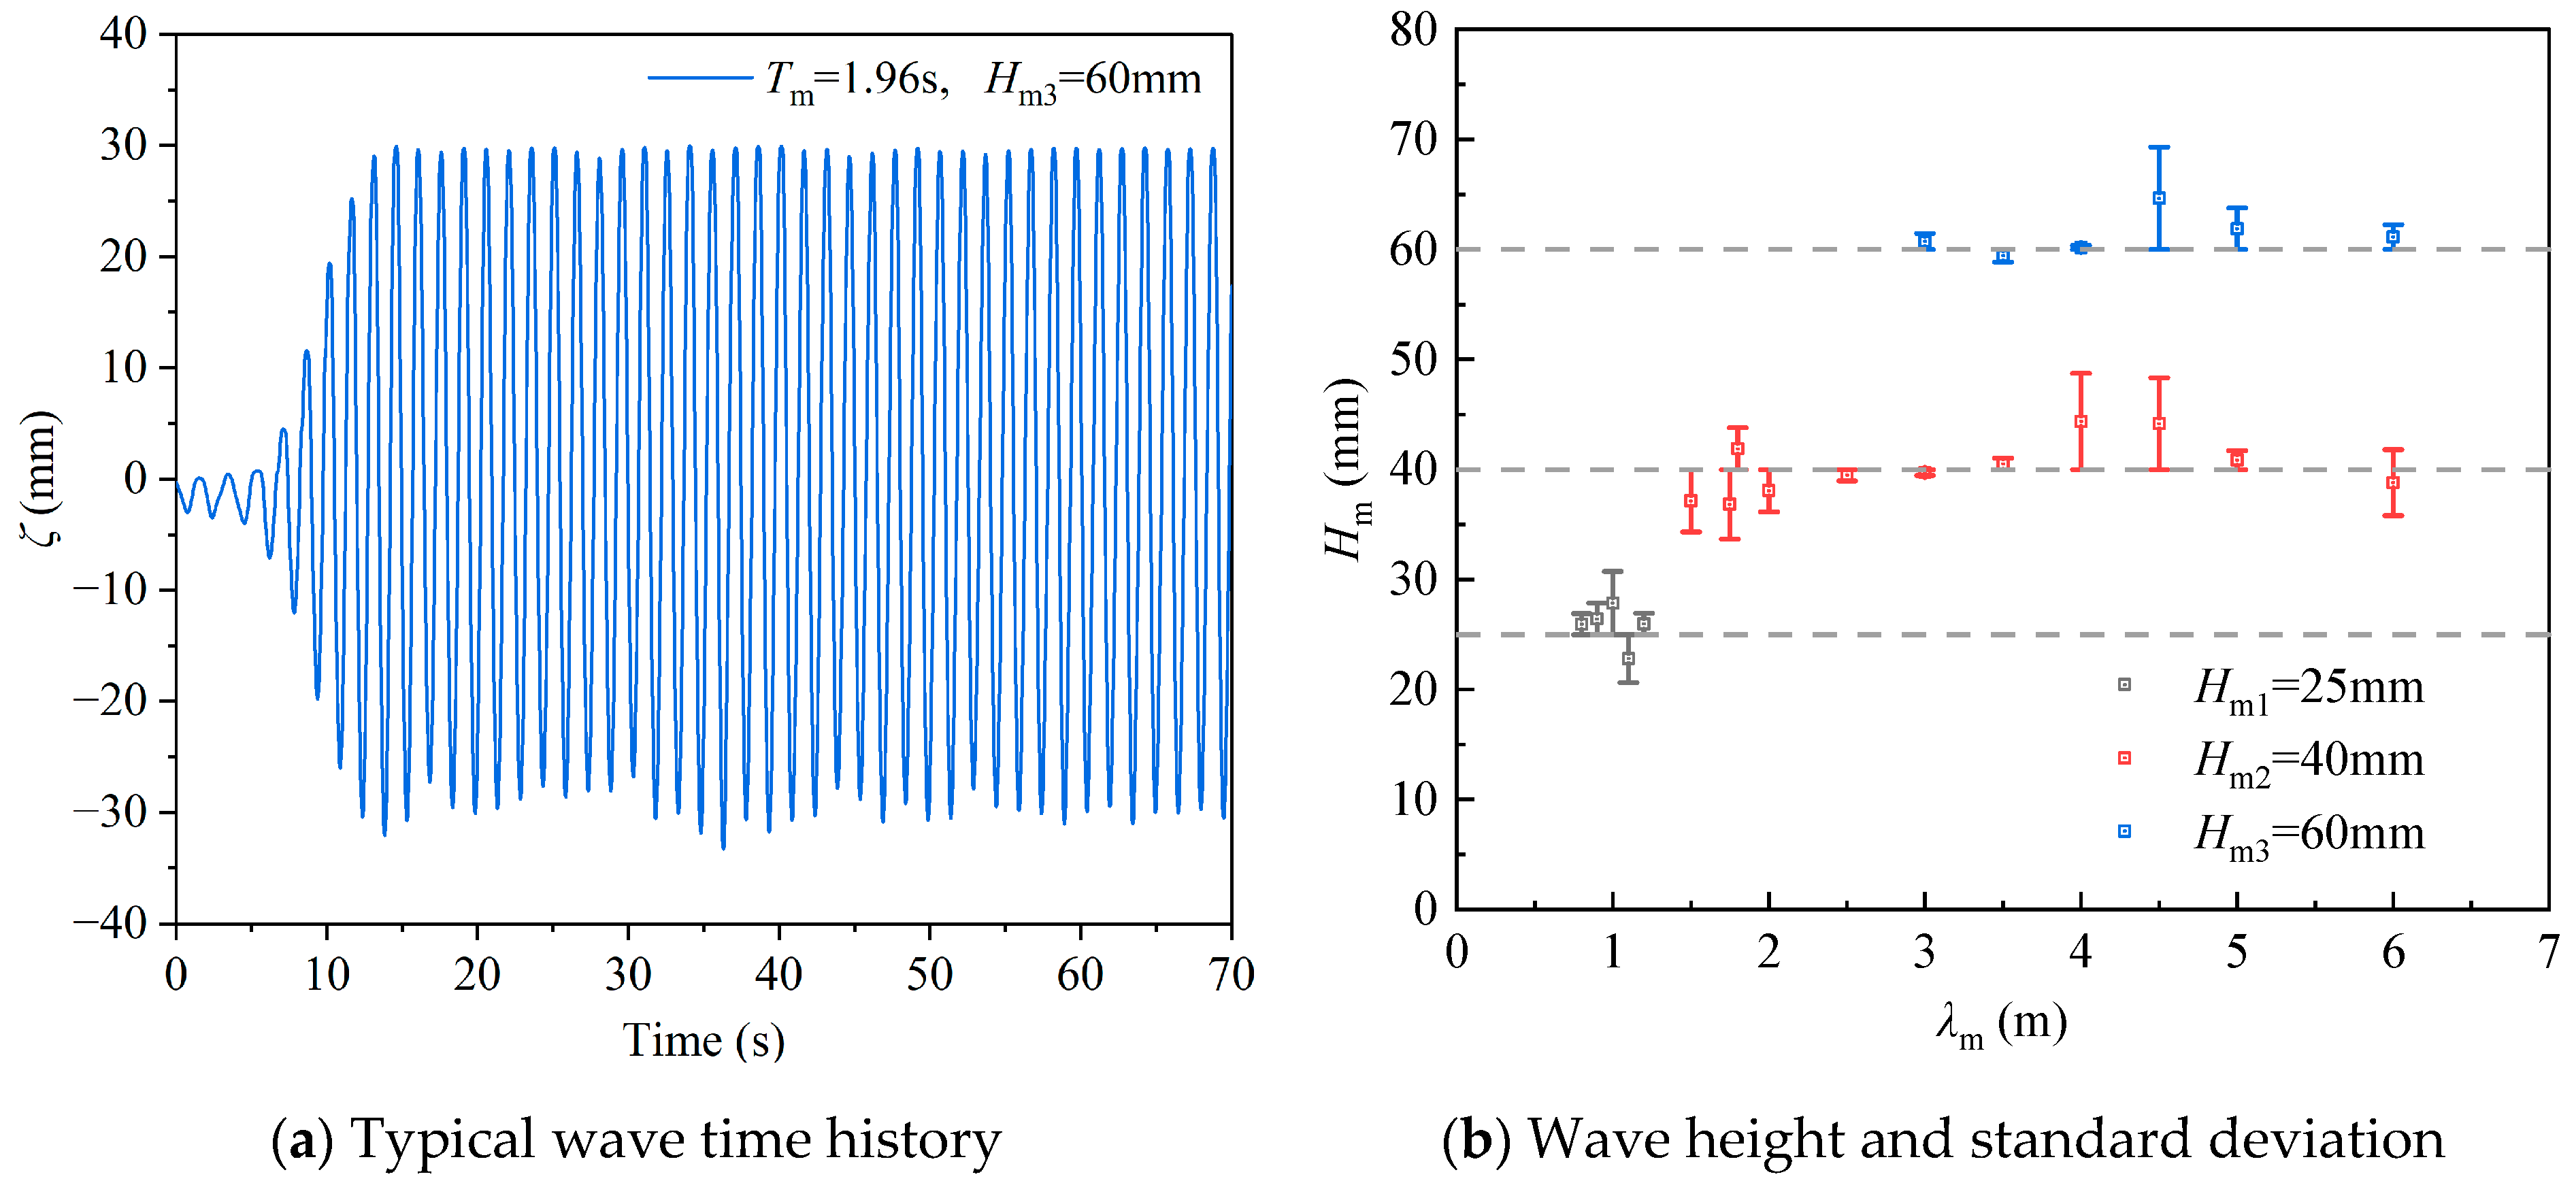
Before the model test, the wave-making quality of the towing tank was measured and calibrated, with the wave gauge positioned at the cage center. The maximum error in the wave period was 1.9%, and the average and maximum relative errors in wave height were 4.5% and 11.4%. At higher wave frequencies, the relative error in wave height is larger.
Figure 5 shows typical regular wave time history, and the average wave height and standard deviation estimated.
The Norwegian standard for Marine Fish Farms (NS 9415) [
26] classifies offshore farm environments according to wave and current conditions, as shown in
Table 6. Specifically, significant wave height (
Hs) ranging from 2.0 m to 3.0 m are defined as highly exposed areas.
Since the aquaculture platform is mainly operated in offshore sheltered sea areas or inland deep-water lakes and reservoirs, the
Hs in the experiment was chosen as 2.5 m. Furthermore, additional model tests were conducted for a milder sea state (
Hs = 2.0 m). JONSWAP spectrum was adopted for wave generation, with the spectral peak period and shape factor (
) were calculated according to Equation (3) and Equation (4), respectively. The parameters of irregular waves are listed in
Table 7.
The irregular waves are calibrated, and the errors in Hs are 0.60% and 0.64%, and the errors of the spectral peak period are 1.52% and 3.05% for the two irregular sea states, respectively.
3. Numerical Modeling
In this paper, the Star-CCM+ software (Version: 20.04.007-R8) based on the finite volume method (FVM) is used to investigate the motion and sloshing characteristics of the rigid aquaculture platform in free decay and under the action of regular waves. Numerical calculations employ the inviscid model. The simulation results are compared with model test results. Additionally, this approach allows for the acquisition of heave motion that was unrecorded during the regular wave model tests.
3.1. Numerical Wave Tank
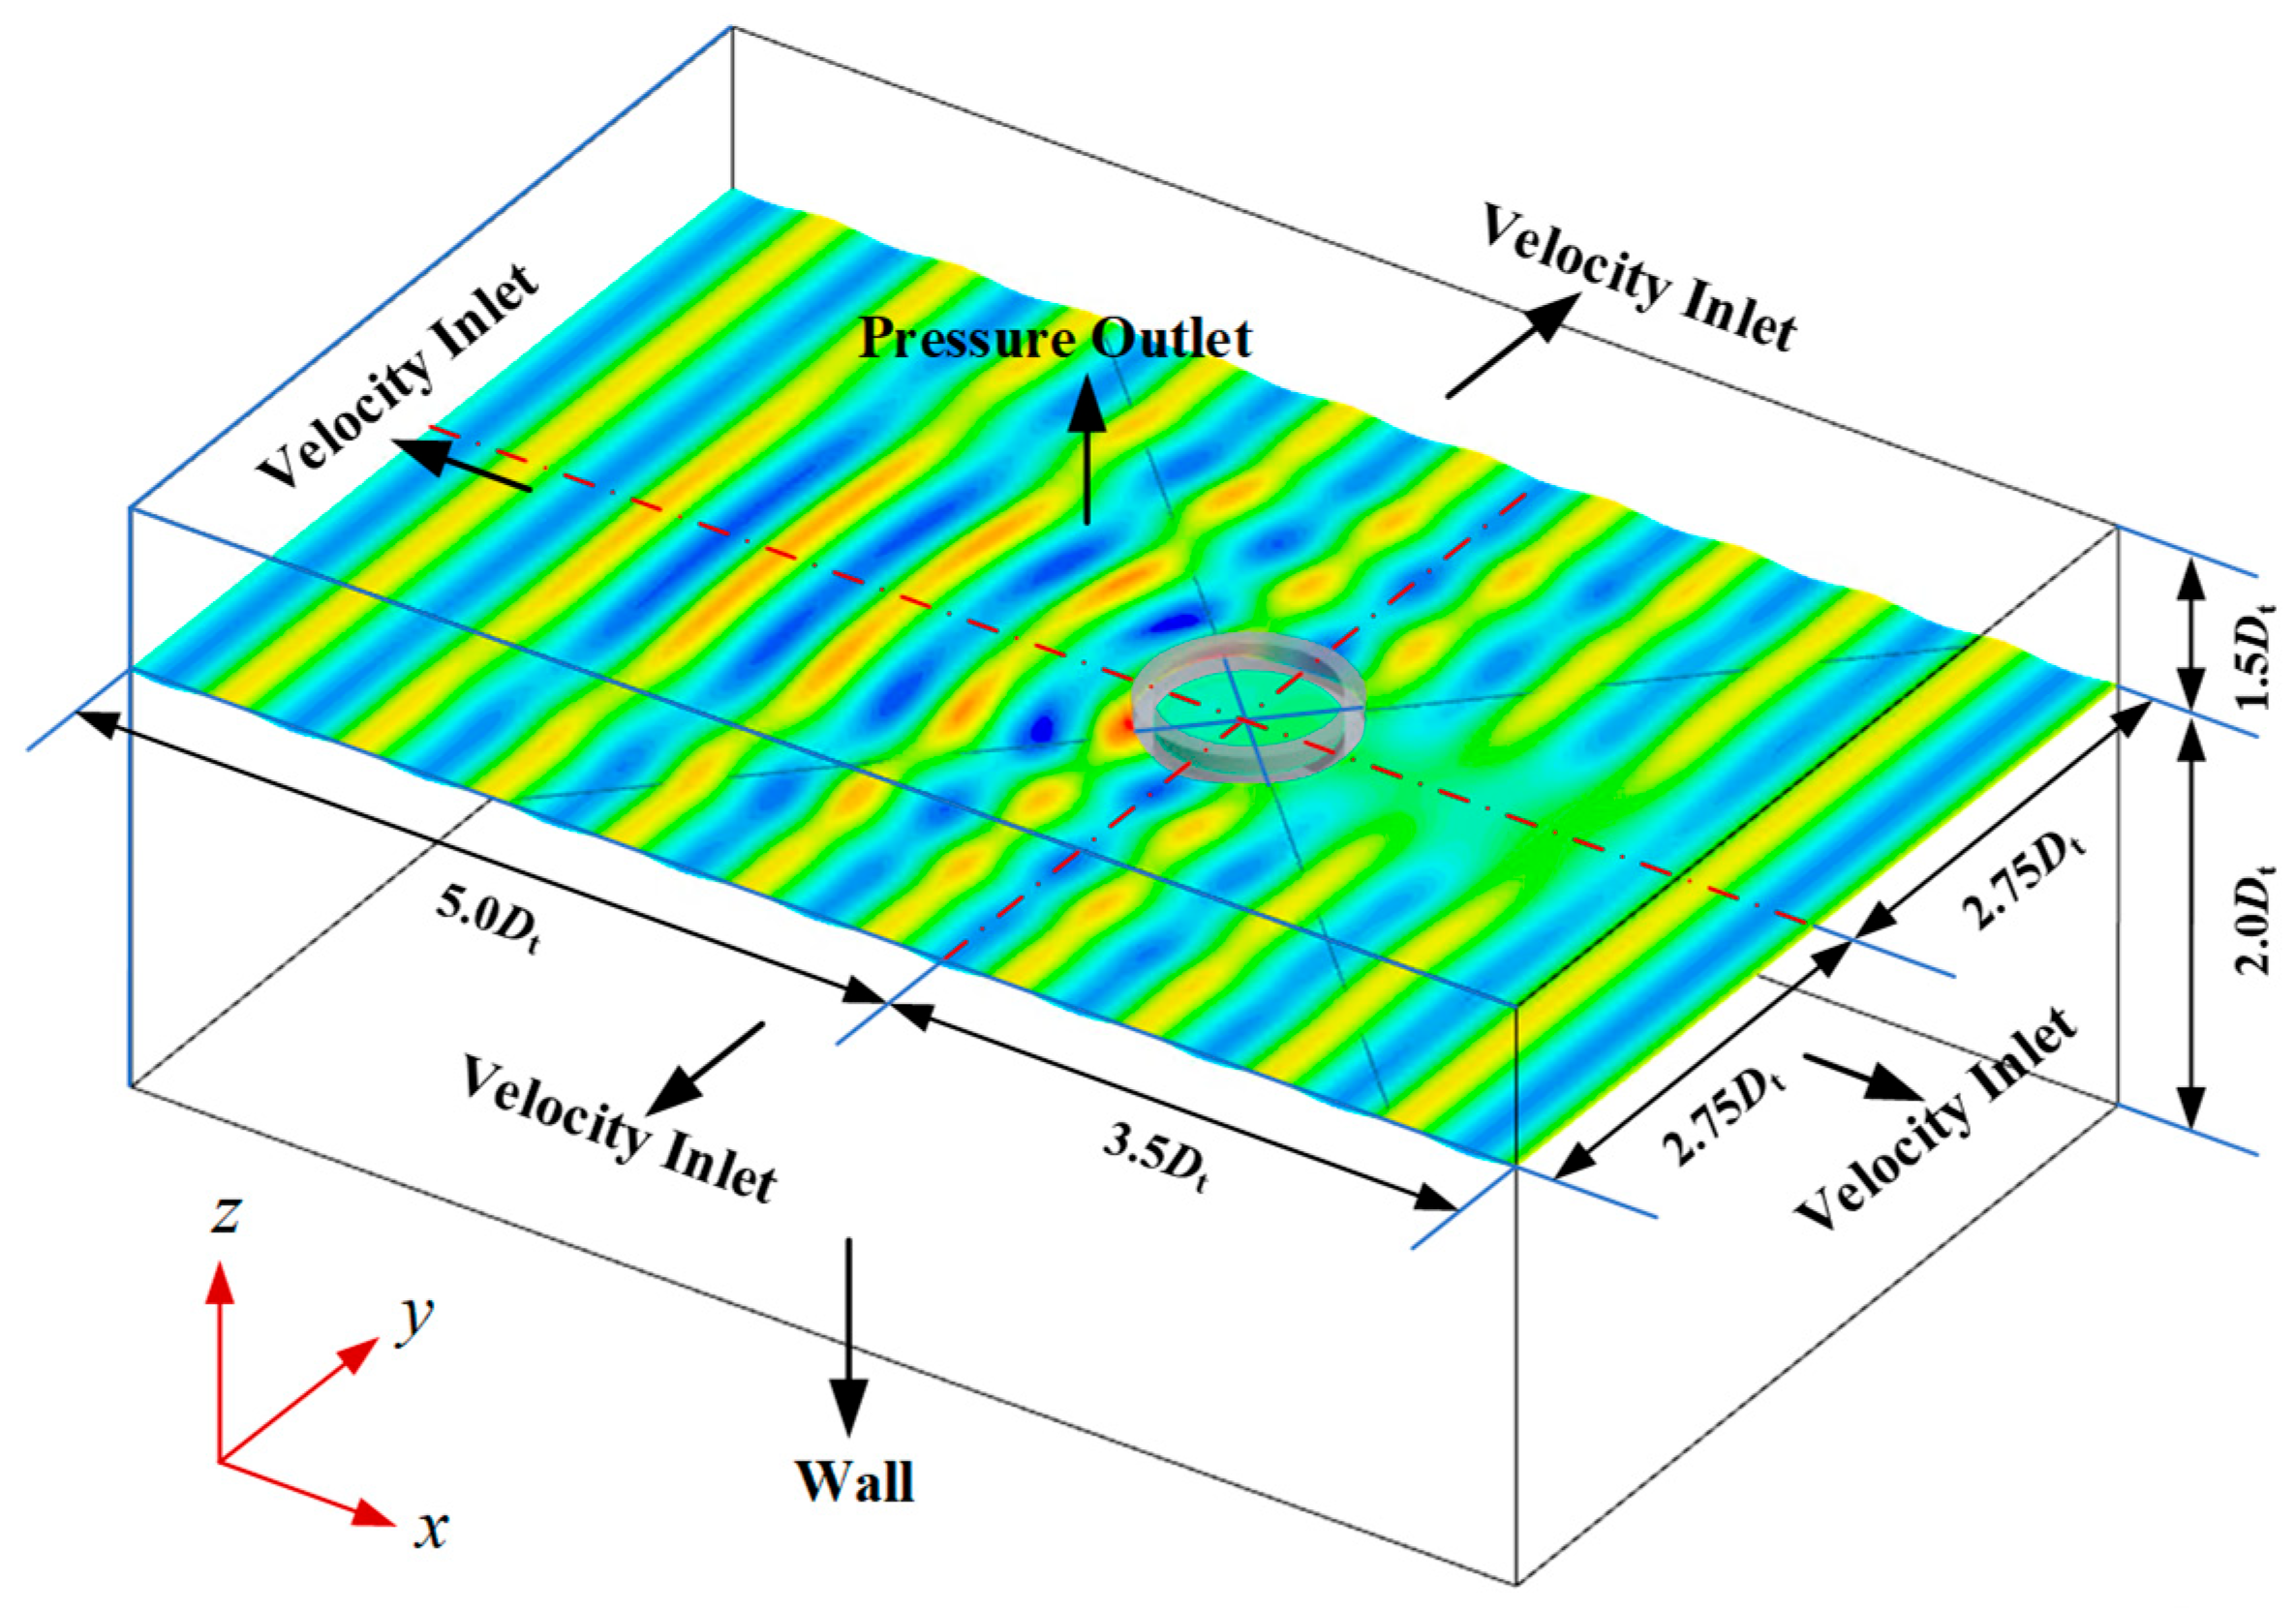
The numerical simulation employs the same scale ratio as the model test; the numerical wave tank dimensions are 8.5
Dt (length) × 5.5
Dt (width) × 3.5
Dt (height), with 1.5
Dt above the calm wave level, see
Figure 6. The lengths of the front and rear regions of the model are 5
Dt and 3.5
Dt, respectively. Pressure outlet is adopted at the top boundary of the numerical wave tank, and velocity inlet is adopted at other boundaries, the specific boundary conditions at each boundary are listed in
Table 8. The Eulerian overlap method (EOM) was used for wave dissipation around the wave tank, with a dissipation zone length of 2.0
Dt at the inlet and exit and 1.0
Dt on both sides of the tank. Note that all side boundaries should be set as pressure outlets. For all velocity inlet boundaries, the velocity is specified as a wave velocity distribution.
Aquaculture platforms were constrained by 4 horizontal springs with zero mass and a length of 3.75 m. The spring stiffnesses used for the closed and semi-closed aquaculture platform were the same as those used in the model tests.
In the numerical simulation, the same wave height, i.e., Hm = 0.04 m, is used for regular waves with different wave periods. The grid of the numerical tank is refined along the z-direction in the free surface region, with grid size of 1/16 Hm for the wave height range and 1/8 Hm and 1/4 Hm for the 3 Hm and 7 Hm ranges, respectively. This grid-scale transition can capture the exponential attenuation pattern of wave kinetic energy along the z-direction, which, together with a suitable time step, can better minimize the wave attenuation during a long-term simulation. The free surface regions in the interior and exterior of the aquaculture platform are refined along the z-direction to accurately capture the wave run-up phenomenon.
Overset mesh technique is used to simulate the motion of the aquaculture platforms, with grid refinement applied to the overlap region within the fixed background grid. The grid profile near the aquaculture platform is shown in
Figure 7.
The degrees of freedom released during numerical simulations affects the motion response of the floating structure [
27,
28,
29,
30], in this study, all motions are released to be consistent with model tests. Time steps
dt are selected as recommended by the Star-CCM+ User Guide [
31]:
where
T and
n are wave period and number of grids per wavelength. The calculation time step is adjusted according to the wave period and grid size, and the actual calculation time step is from 0.003 s to 0.006 s, which is about 1/300 of the wave period. For the free decay simulation, the time step is set to about 1/400 of the corresponding natural period of the motion.
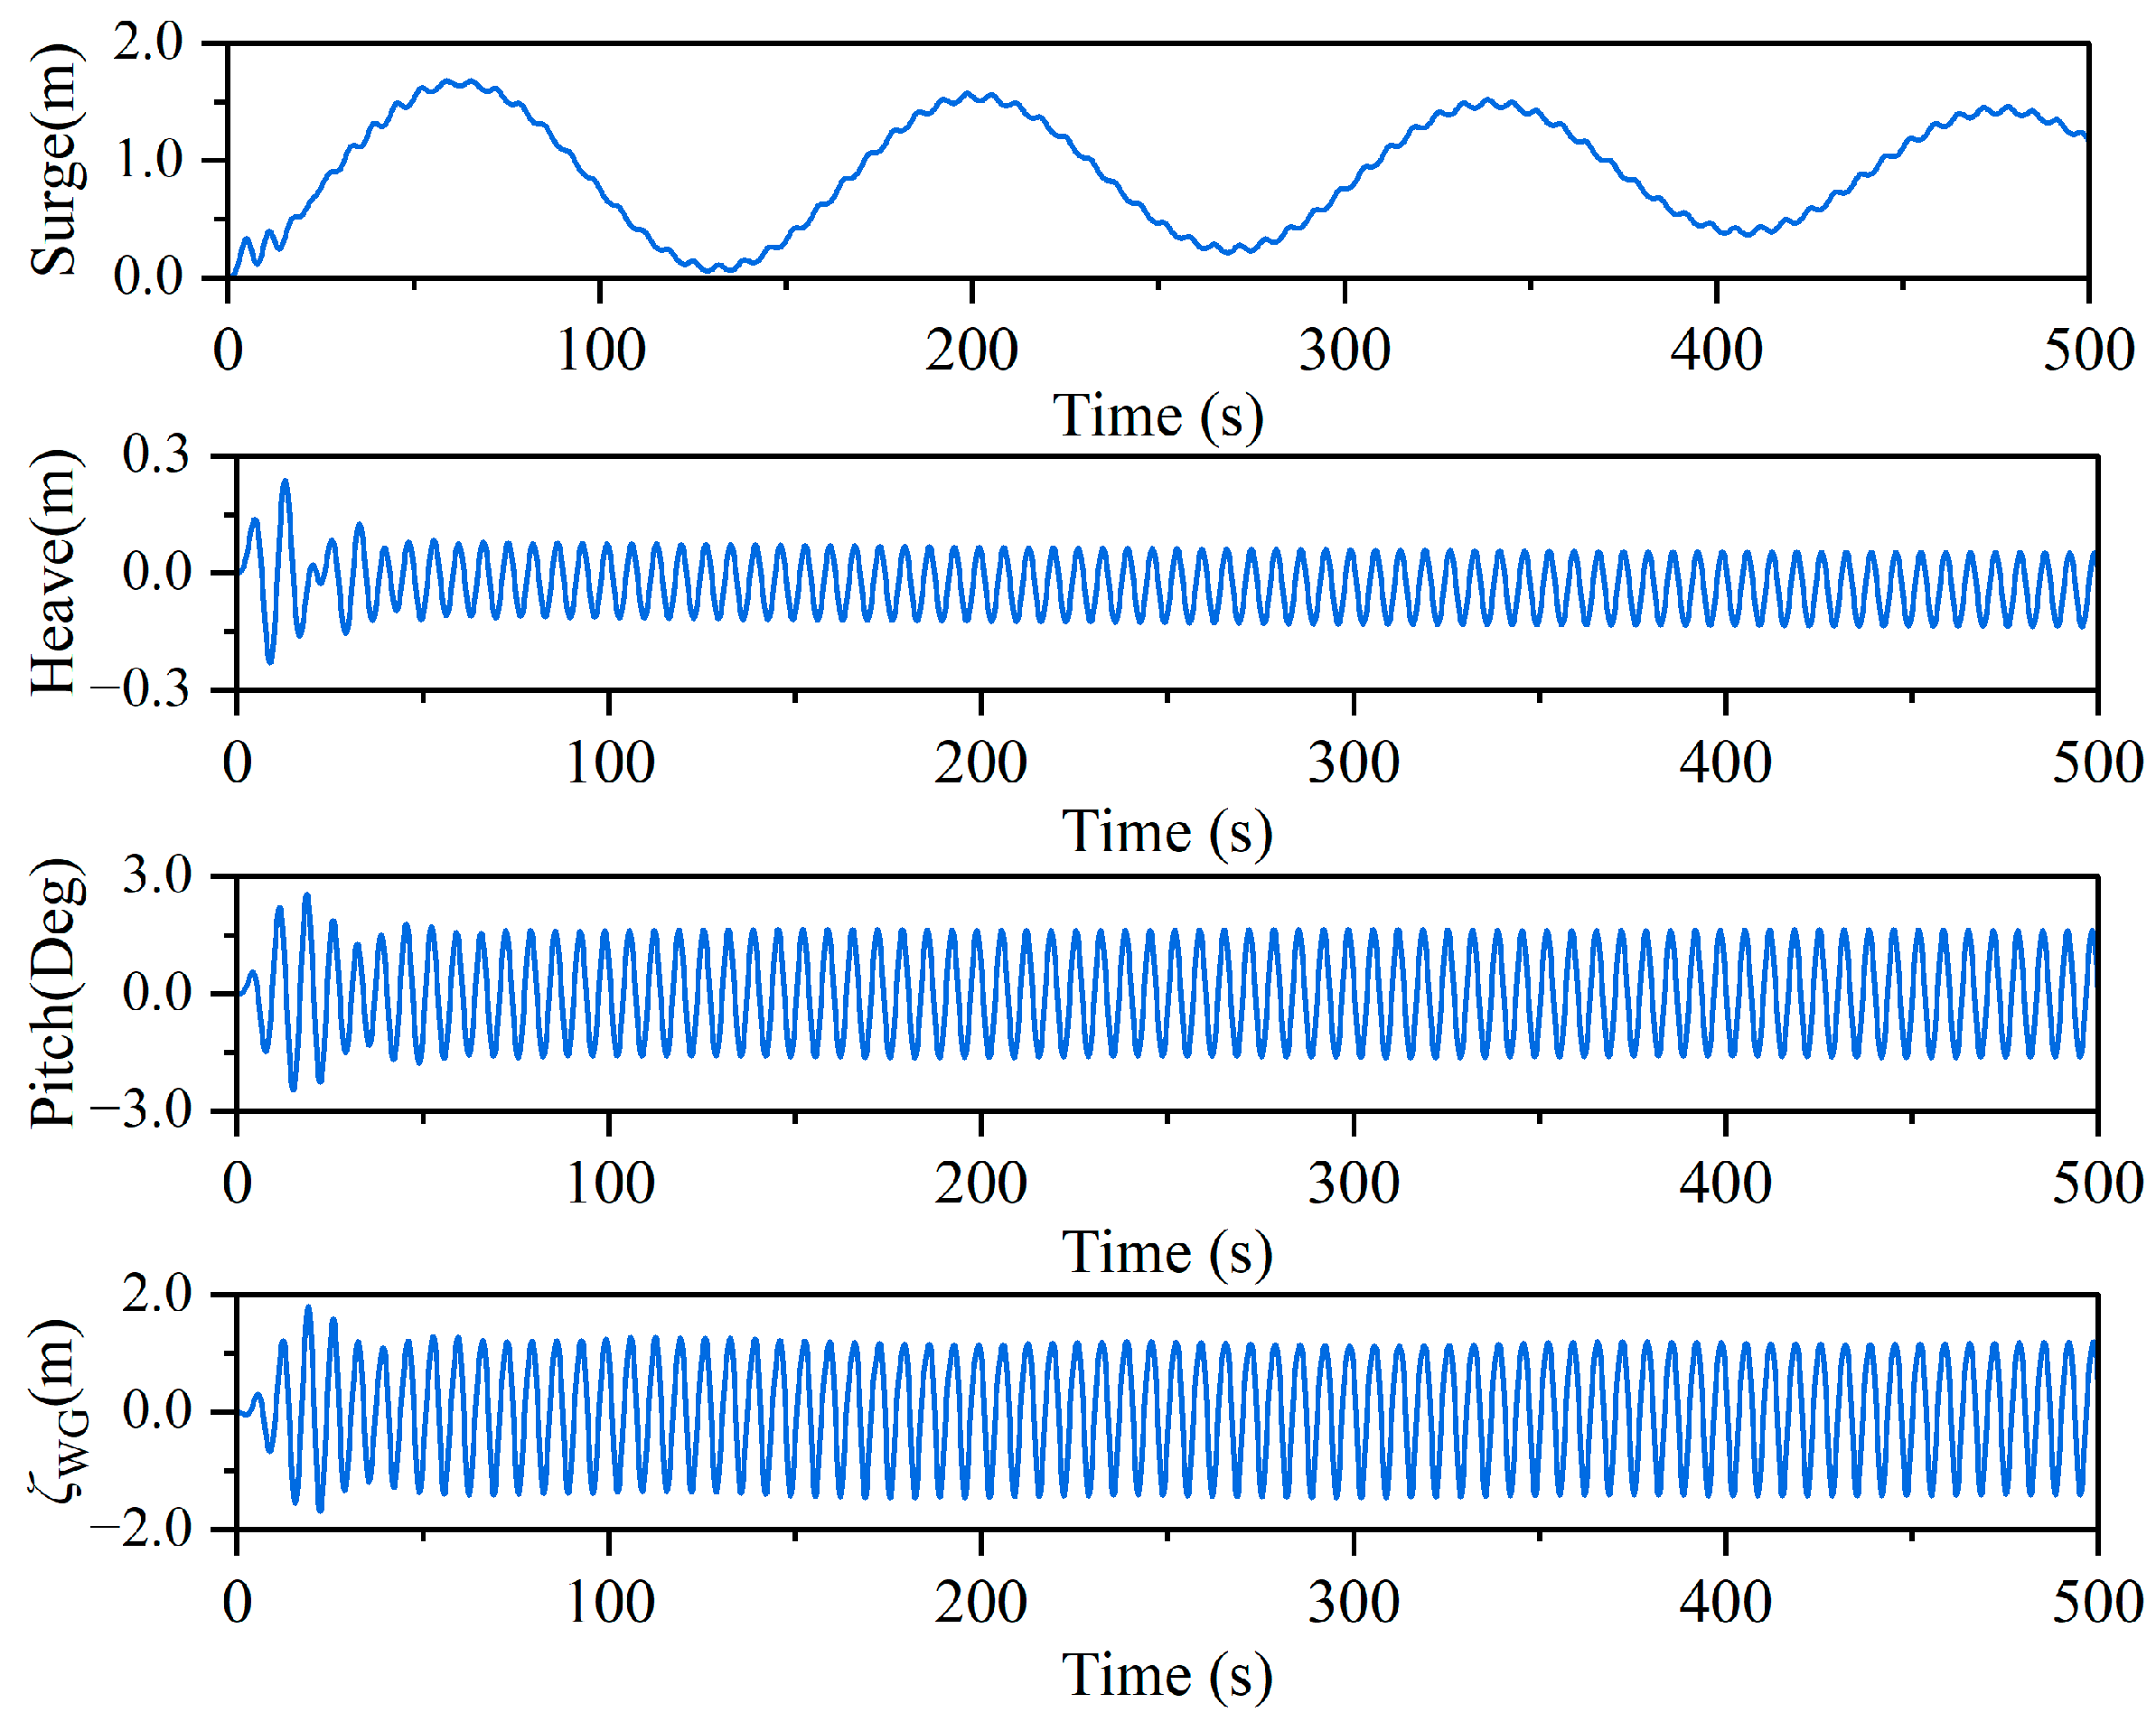
Based on the above numerical modeling, the motion and sloshing response under waves can be obtained from the numerical tank. For example, the closed aquaculture platform’s typical motion and sloshing response (
ζWG) at WG1 are shown in
Figure 8.
3.2. Convergence Analysis
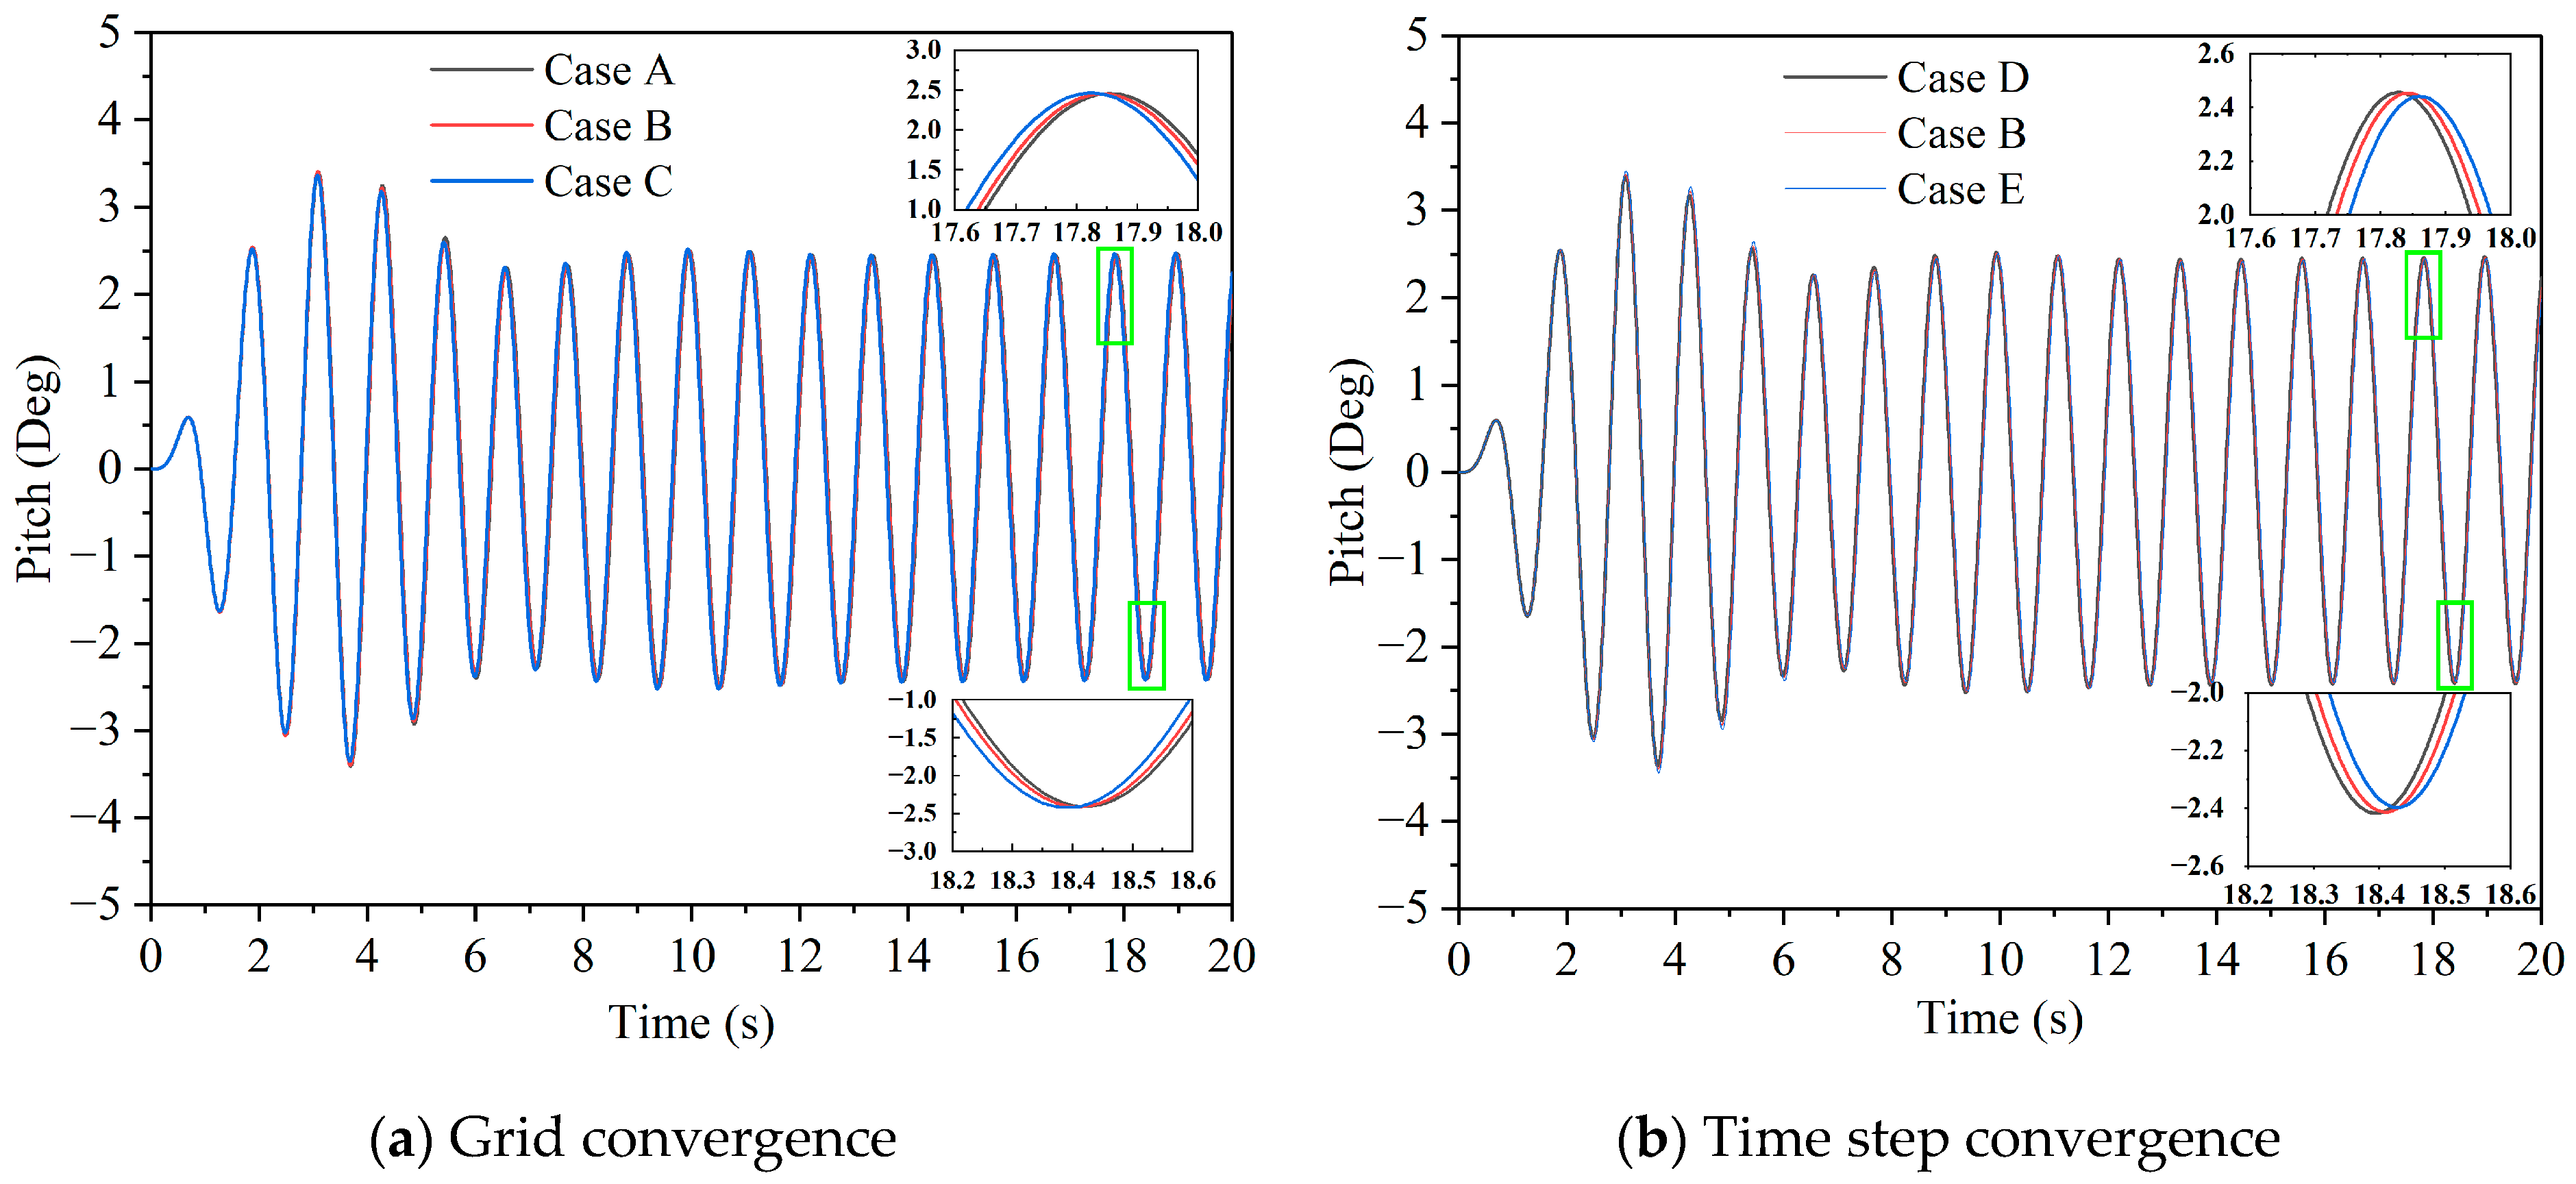
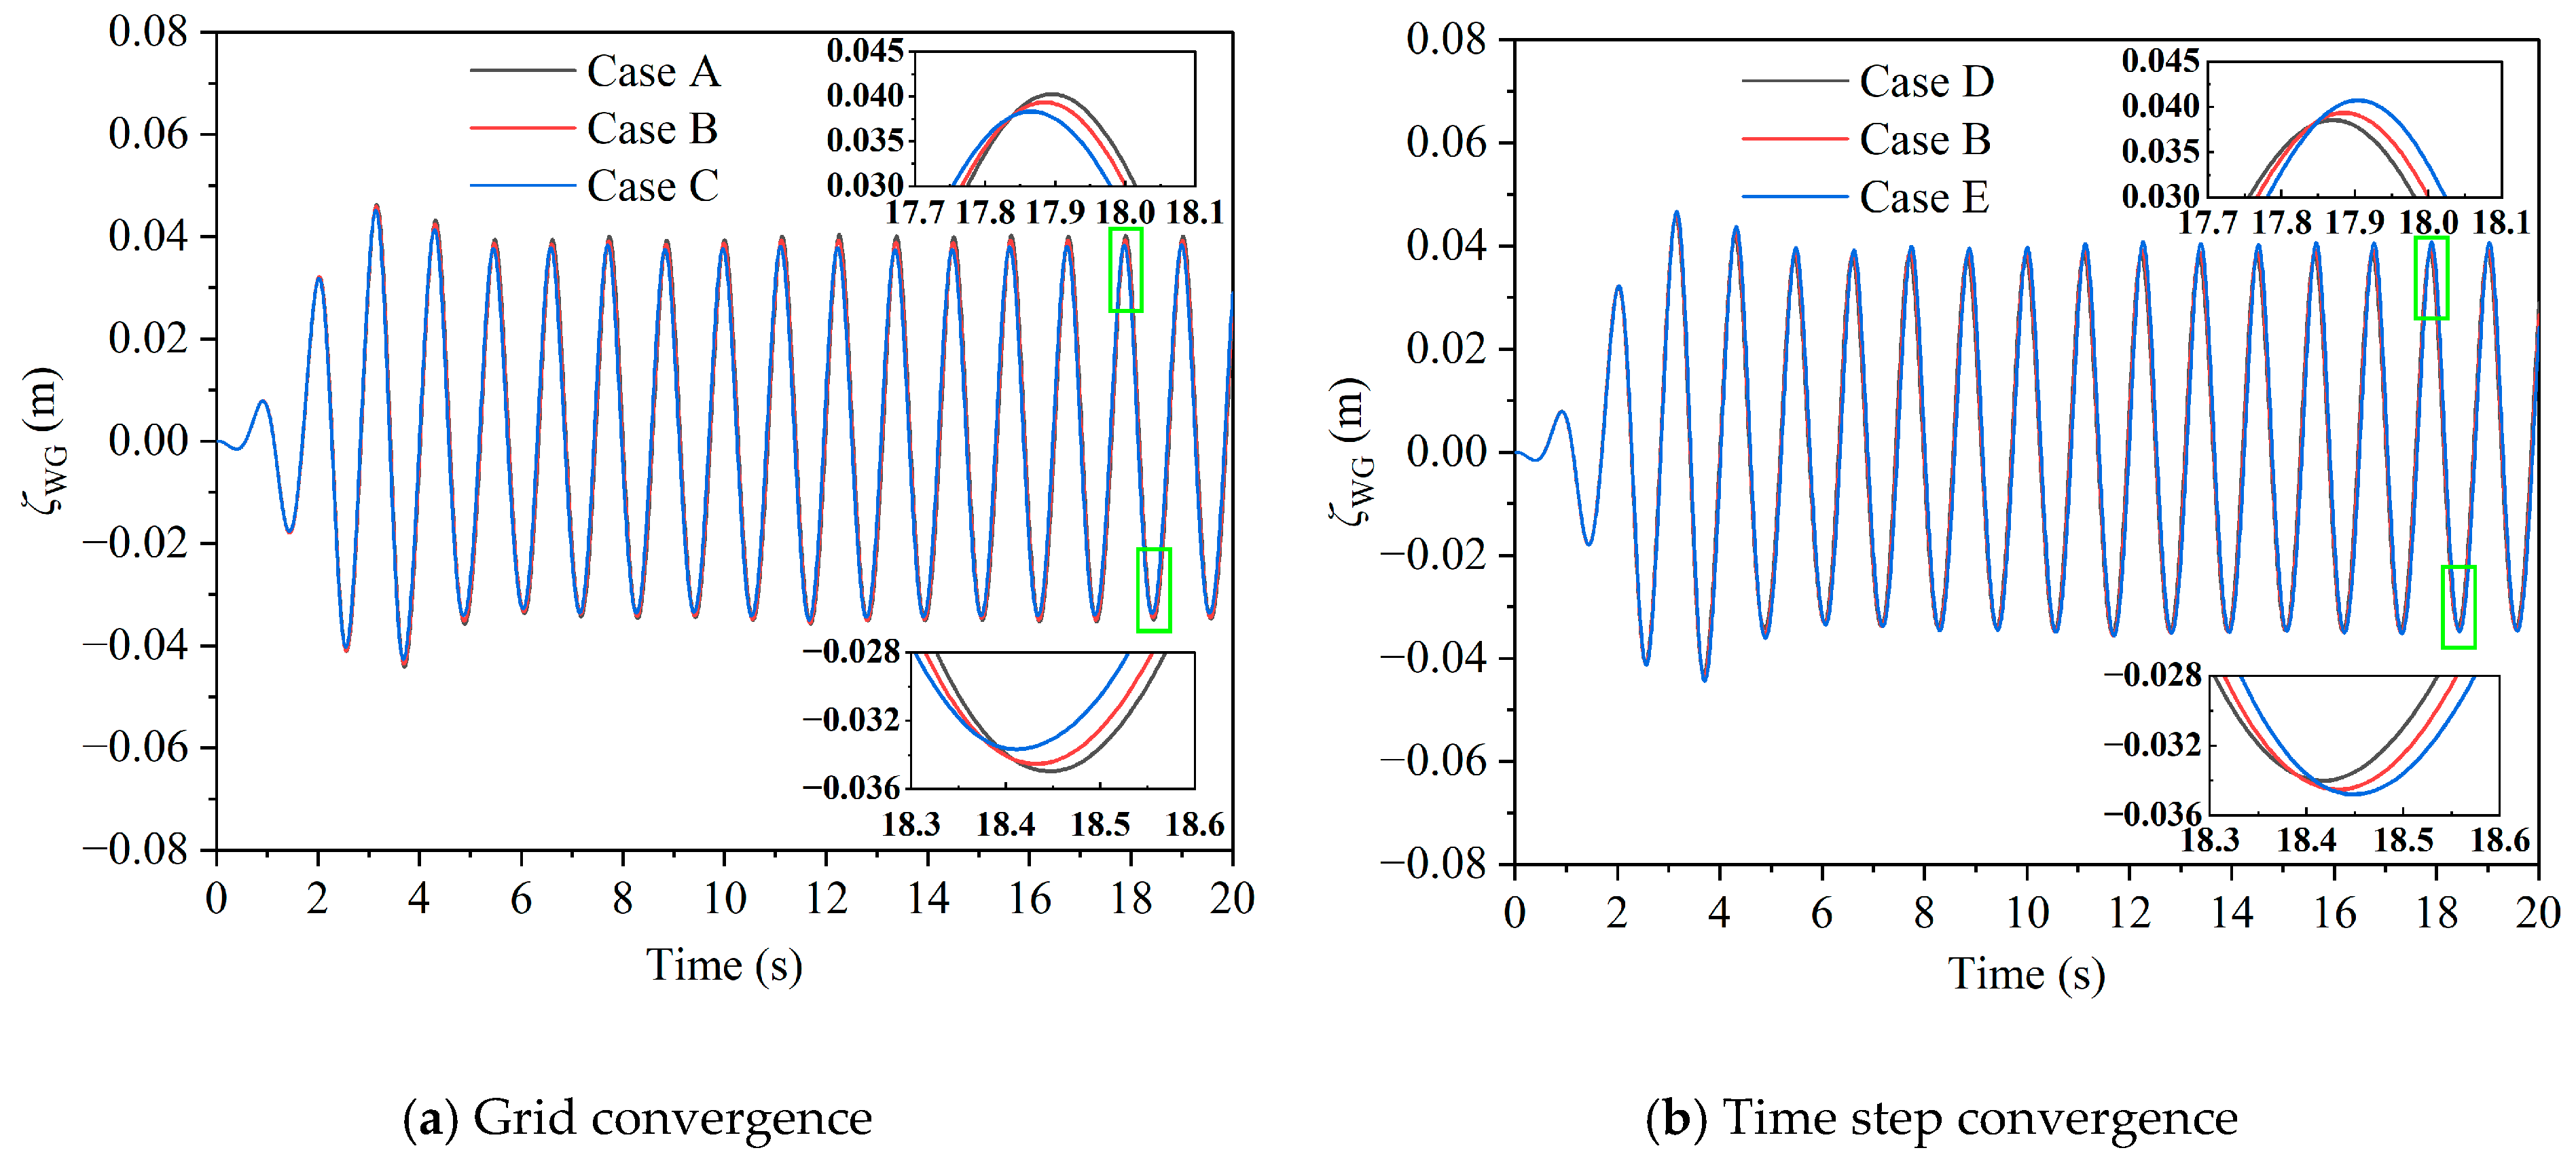
To verify the convergence of the grid and time step used in numerical calculations, a convergence analysis was conducted for the pitch motion and the sloshing response at WG3, and a wavelength equal to 2
Dt is selected as a representative example. Following the ITTC recommendations [
32], the scaling factors for both grid size and time step are chosen as
. The grid size and time step convergence calculation conditions are listed in
Table 9. The time histories of the pitch motion and sloshing response at the model scale are shown in
Figure 9 and
Figure 10.
According to
Table 9, the grid and time-step convergence factors for pitch motion are calculated as 0.13 and 0.23, respectively, while those for sloshing response are 0.73 and 0.78. With all convergence factors smaller than 1, both the temporal discretization and spatial mesh configuration exhibit monotonic convergence characteristics [
32].
4. Experimental and Numerical Results
In this section, the natural period and damping ratio of heave and pitch motions of two rigid aquaculture platforms are first analyzed (
Section 4.1), then the piston mode natural period of semi-closed aquaculture platform are calculated (
Section 4.2). Finally, the motion and sloshing responses of the two aquaculture platforms are analyzed under regular waves (
Section 4.3) and typical operational sea states (
Section 4.4).
4.1. Free Decay
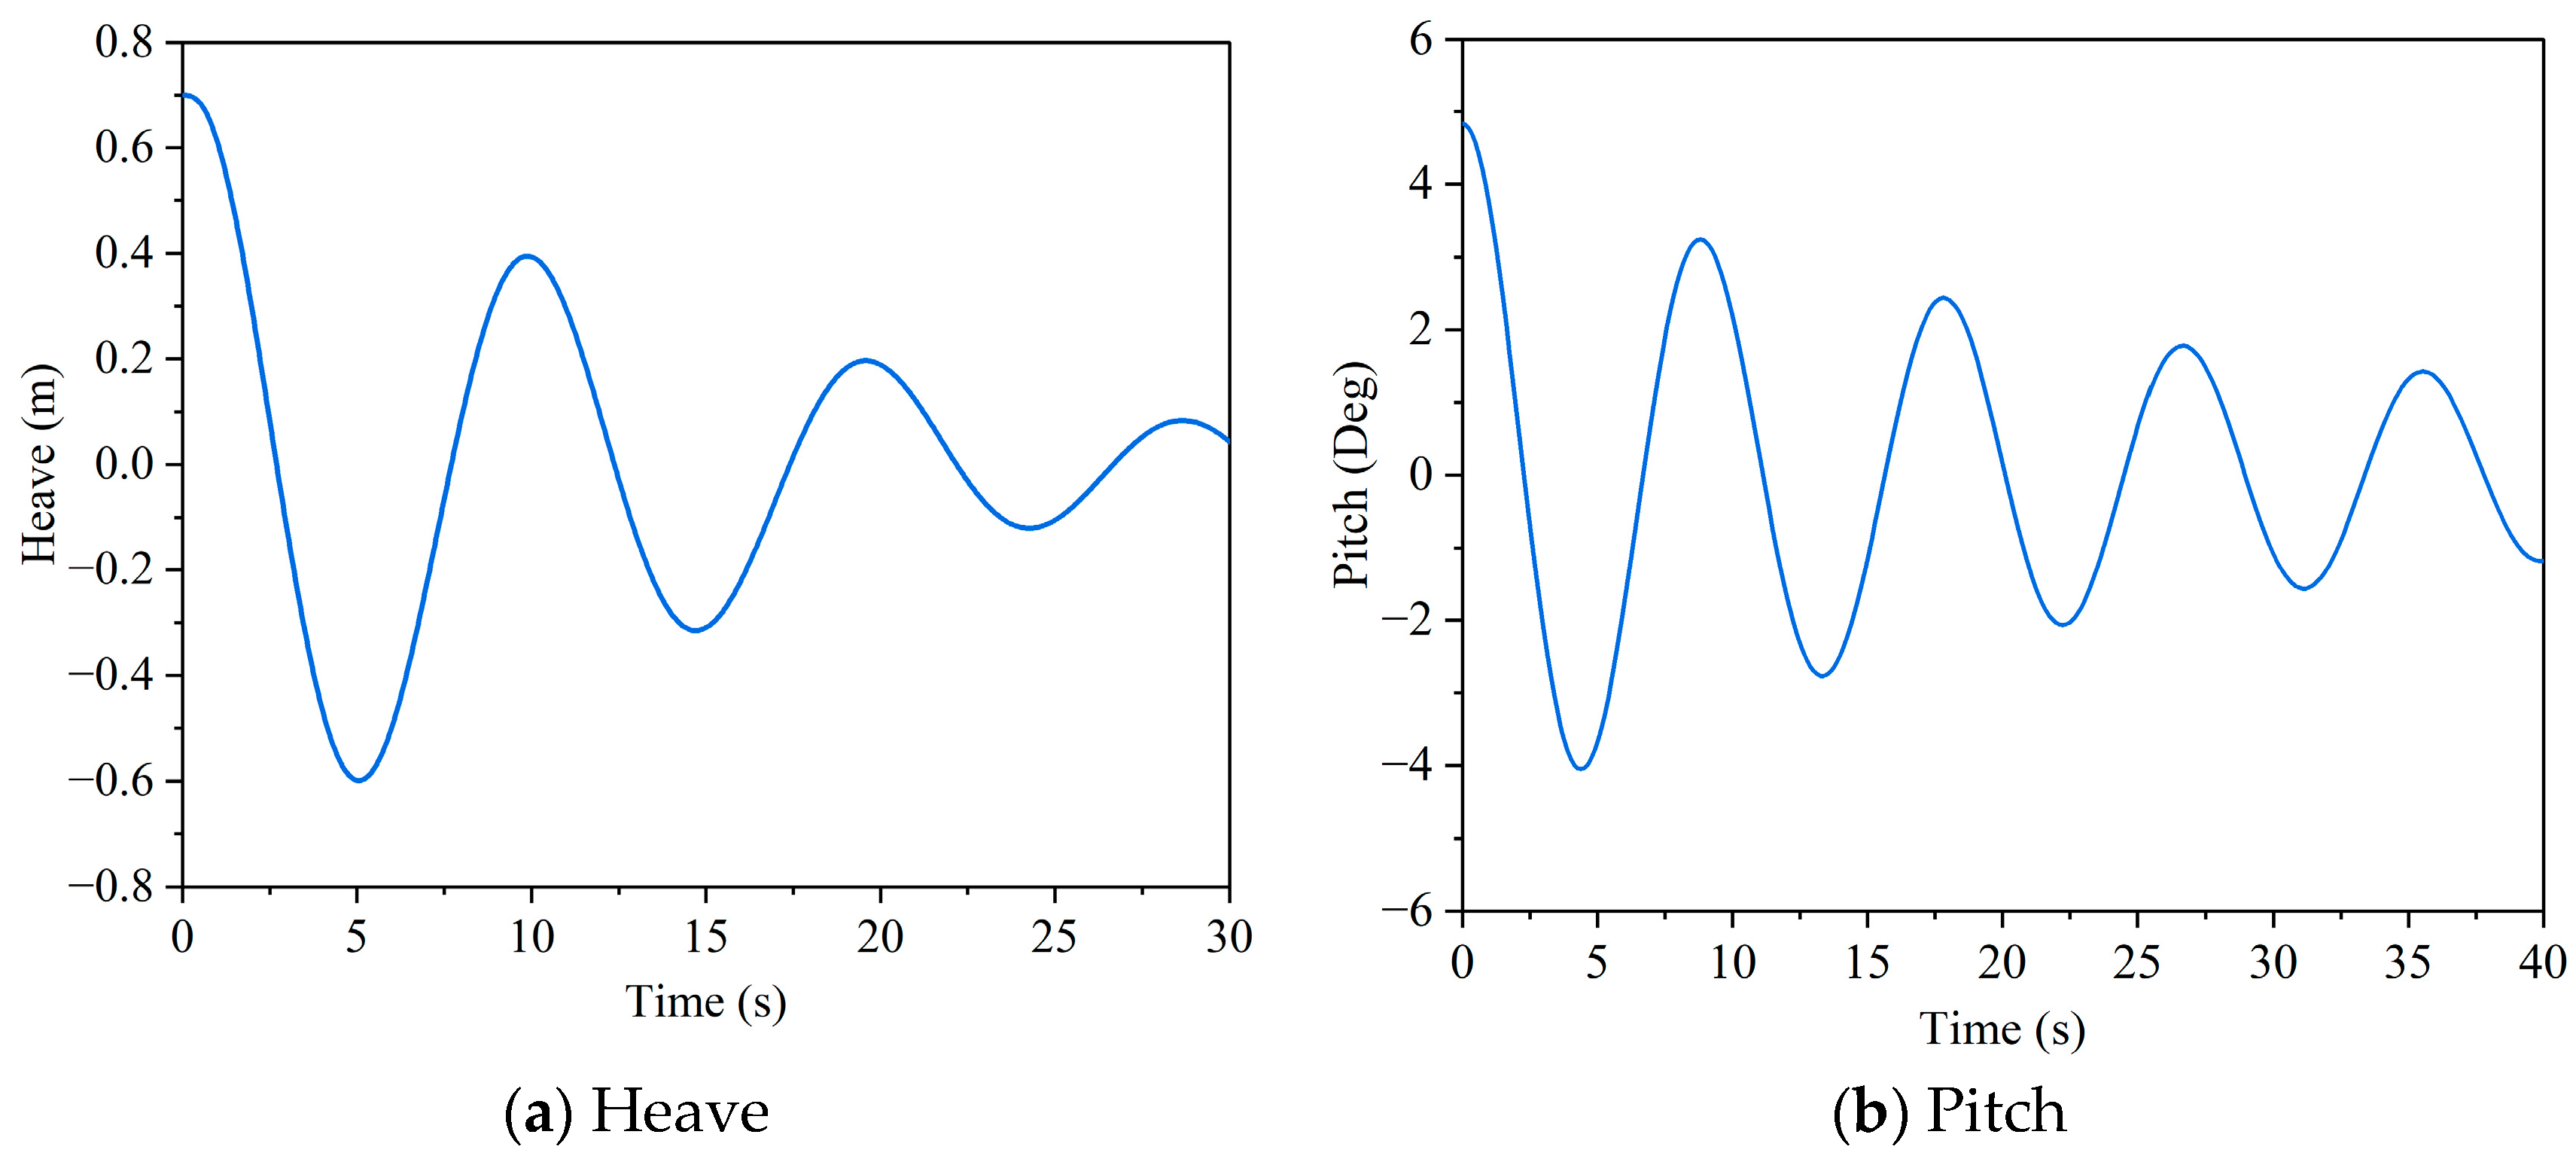
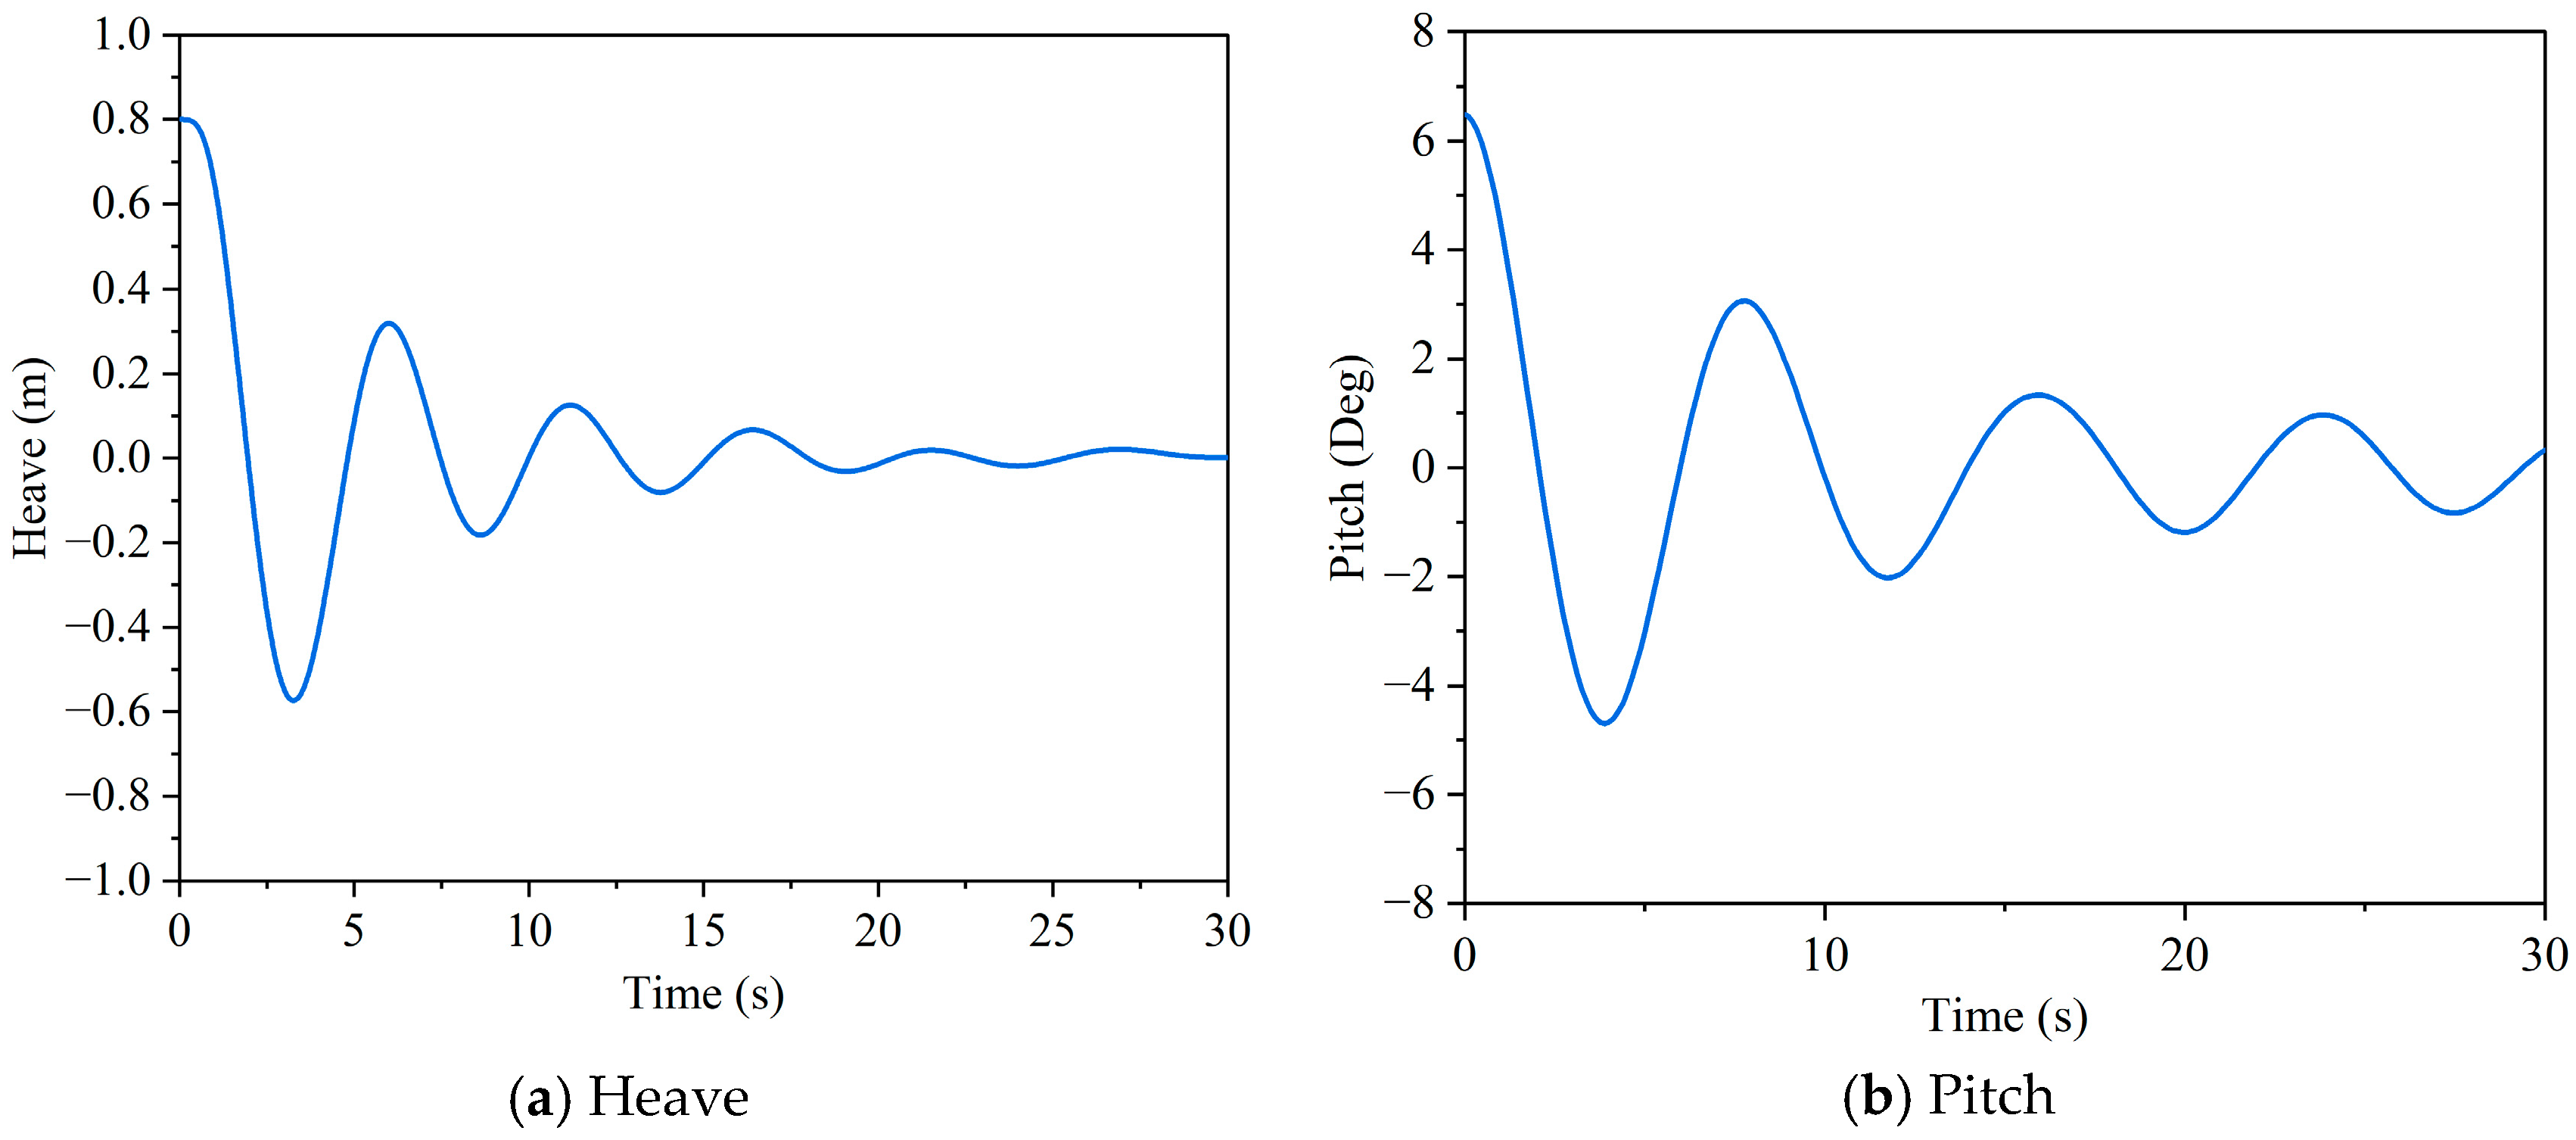
CFD simulations and physical model tests, respectively, quantified free-decay responses for heave and pitch motions of both cage types. The 1st decay cycle was excluded during data processing to avoid the vortex memory effect. The free decay curves of heave and pitch motions for aquaculture platforms are shown in
Figure 11 and
Figure 12. In the model test, an initial displacement was artificially applied to the platform, which was then rapidly released. Motion measuring instrument was used to measure the platform’s movement throughout the entire process.
Capture the time intervals of the peak (or trough) values of the decay curve by a Matlab code, and take their average as the natural period of the motion.
Table 10 compiles the natural periods and damping ratios for closed vs. semi-closed aquaculture platforms. Both the heave and pitch motions’ natural period of the closed model was bigger than that of the semi-closed aquaculture platform. Heave damping ratios were comparable between cage types, whereas closed-cage pitch damping dropped 59% below semi-closed values.
4.2. Piston Mode of Semi-Closed Aquaculture Platform
Given the unique characteristics of the moonpool structure in this study, the natural period of piston-mode motion within the moonpool was calculated using Computational Fluid Dynamics (CFD). The numerical model remained consistent with
Section 3.1, except the velocity inlet boundaries on all sides were replaced with pressure outlet boundaries to simulate far-field flow conditions, while a damping wave absorption method was applied to suppress wave reflection. During the simulation, the aquaculture platform structure was fixed, and the initial water level inside the moonpool was set higher than the external calm water surface. The natural period of piston-mode motion was derived by analyzing the fluctuation characteristics of the water surface inside the moonpool. The time step was set to 0.003 s, approximately 1/600 of the natural period of piston-mode motion.
The initial water surface profiles inside and outside the semi-closed aquaculture platform are shown in
Figure 13, and the time history curve of the water surface elevation inside the moonpool is presented in
Figure 14. The calculated natural period of piston-mode motion in the moonpool was 11.32 s.
4.3. Regular Wave Response
4.3.1. Motion Response
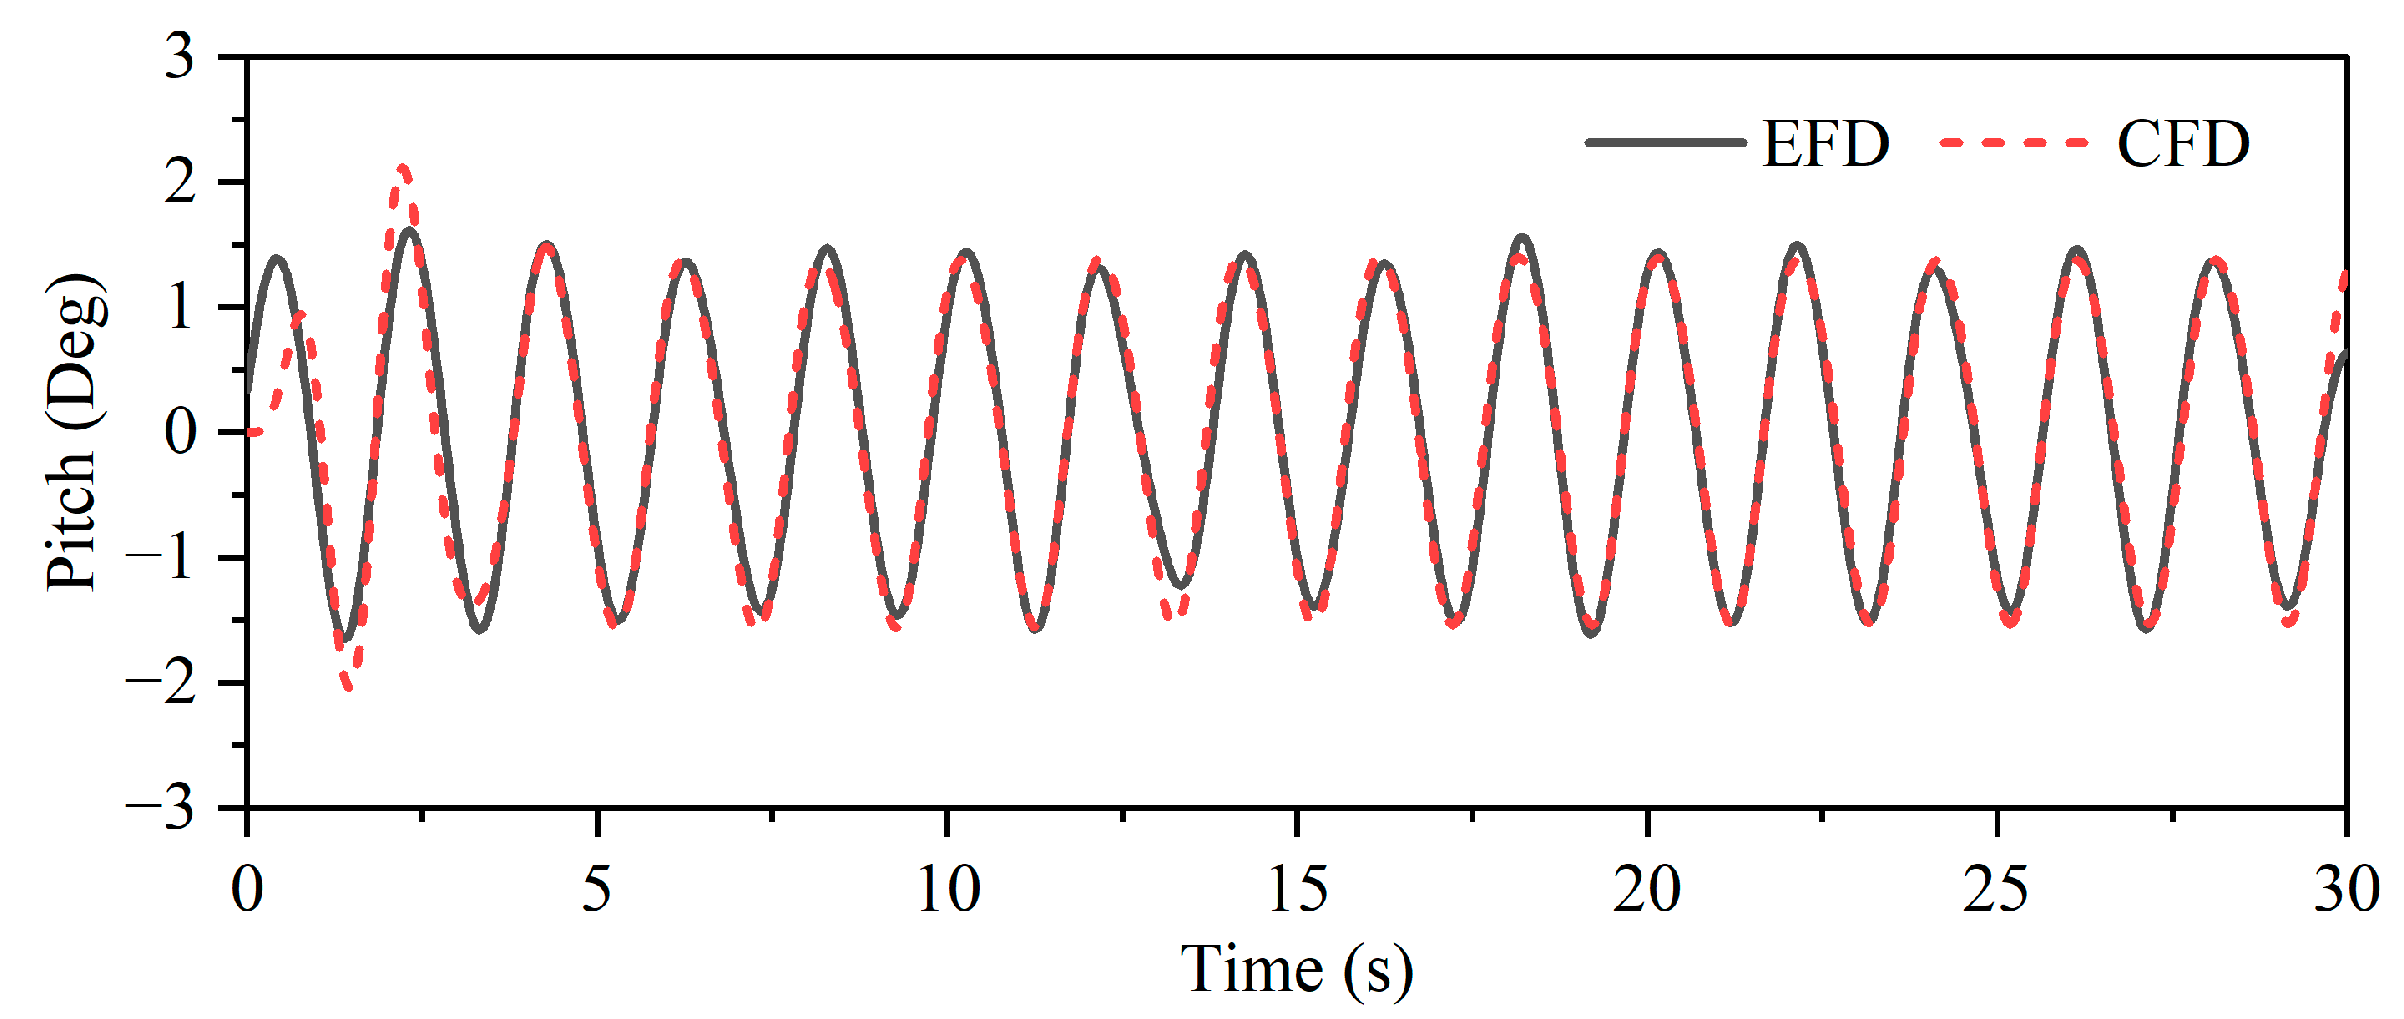
Figure 15 contrasts CFD-derived and experimental pitch-response time histories under typical wave conditions (
Tm = 1.96 s,
λ = 6
Dt,
Hm2 = 0.04 m) for the closed aquaculture platform. It can be seen that the pitch motion response in the CFD calculation results is relatively stable, while the model test results exhibit certain fluctuations due to the quality of generated waves.
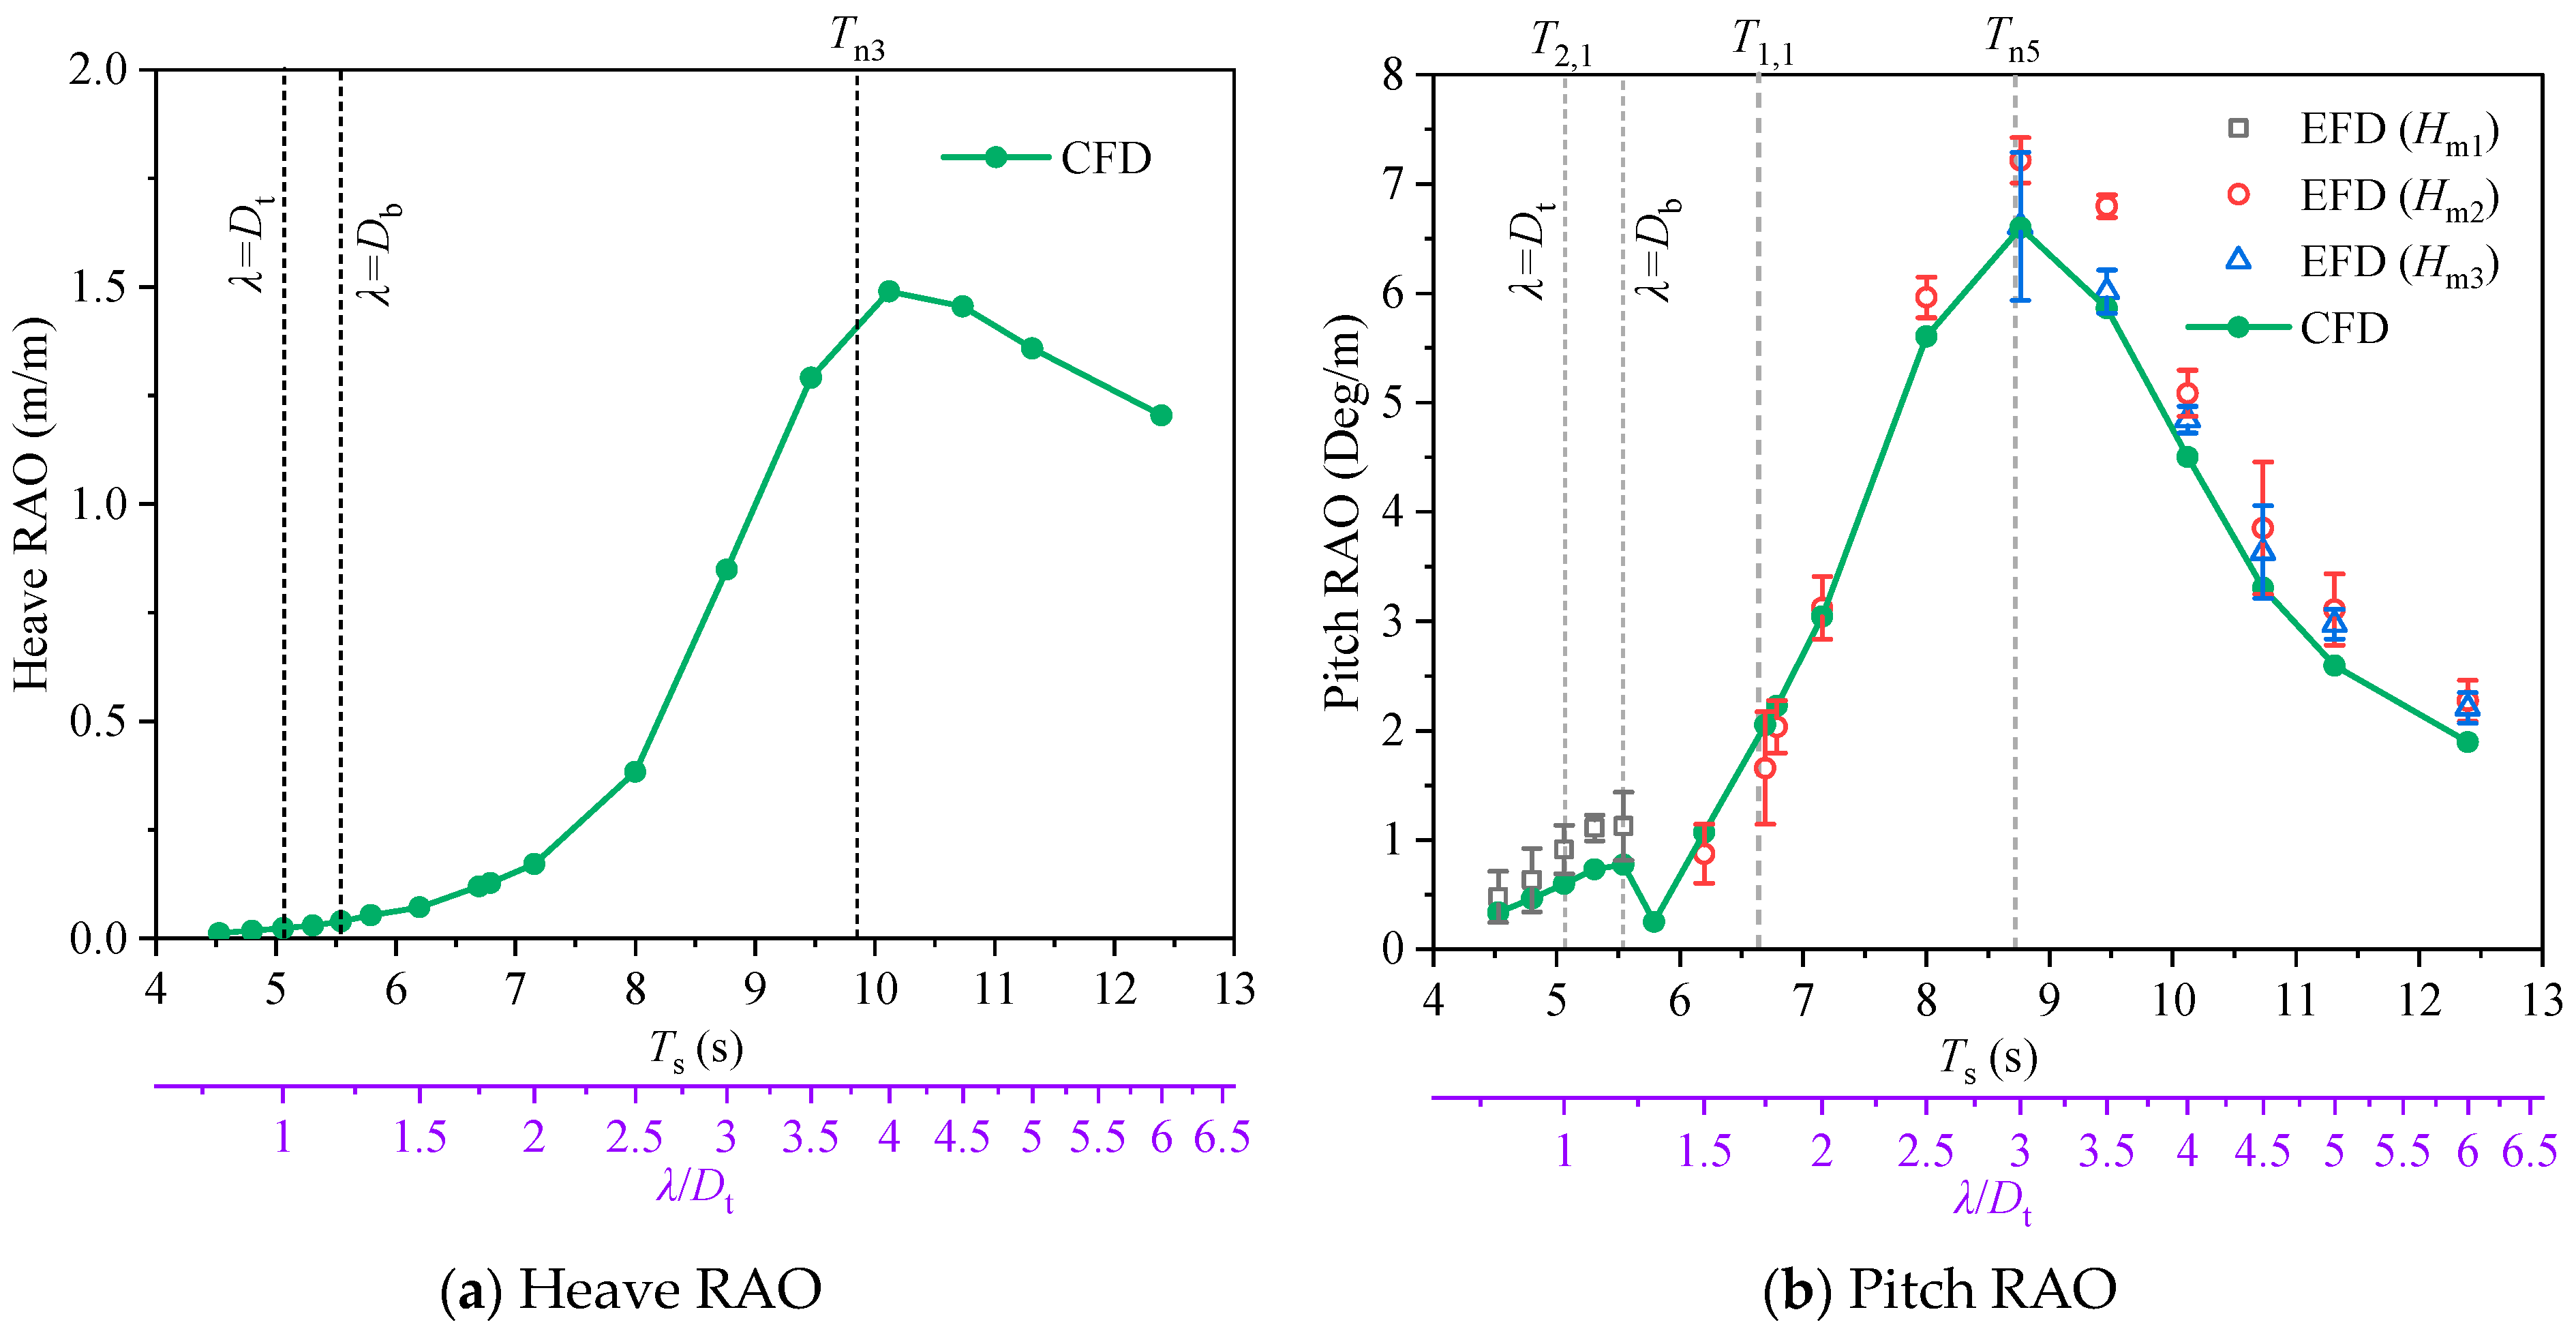
Stable-response segments were extracted to compute closed-cage RAOs, with heave/pitch amplitude responses mapped in
Figure 16. Peak heave RAO occurred at wave periods approaching the closed cage’s natural period (
Tn3). The pitch motion RAOs obtained by CFD and the model test agreed well overall, and the numerical calculation results were smaller than the model test when the wave period was larger than
Tn5. Due to the wave-generator limitations at short wavelengths (
λ <
Db), the amplitude of the pitch motion obtained from the model test is larger than that of the CFD method when the wave period is small, and the test results show larger fluctuations.
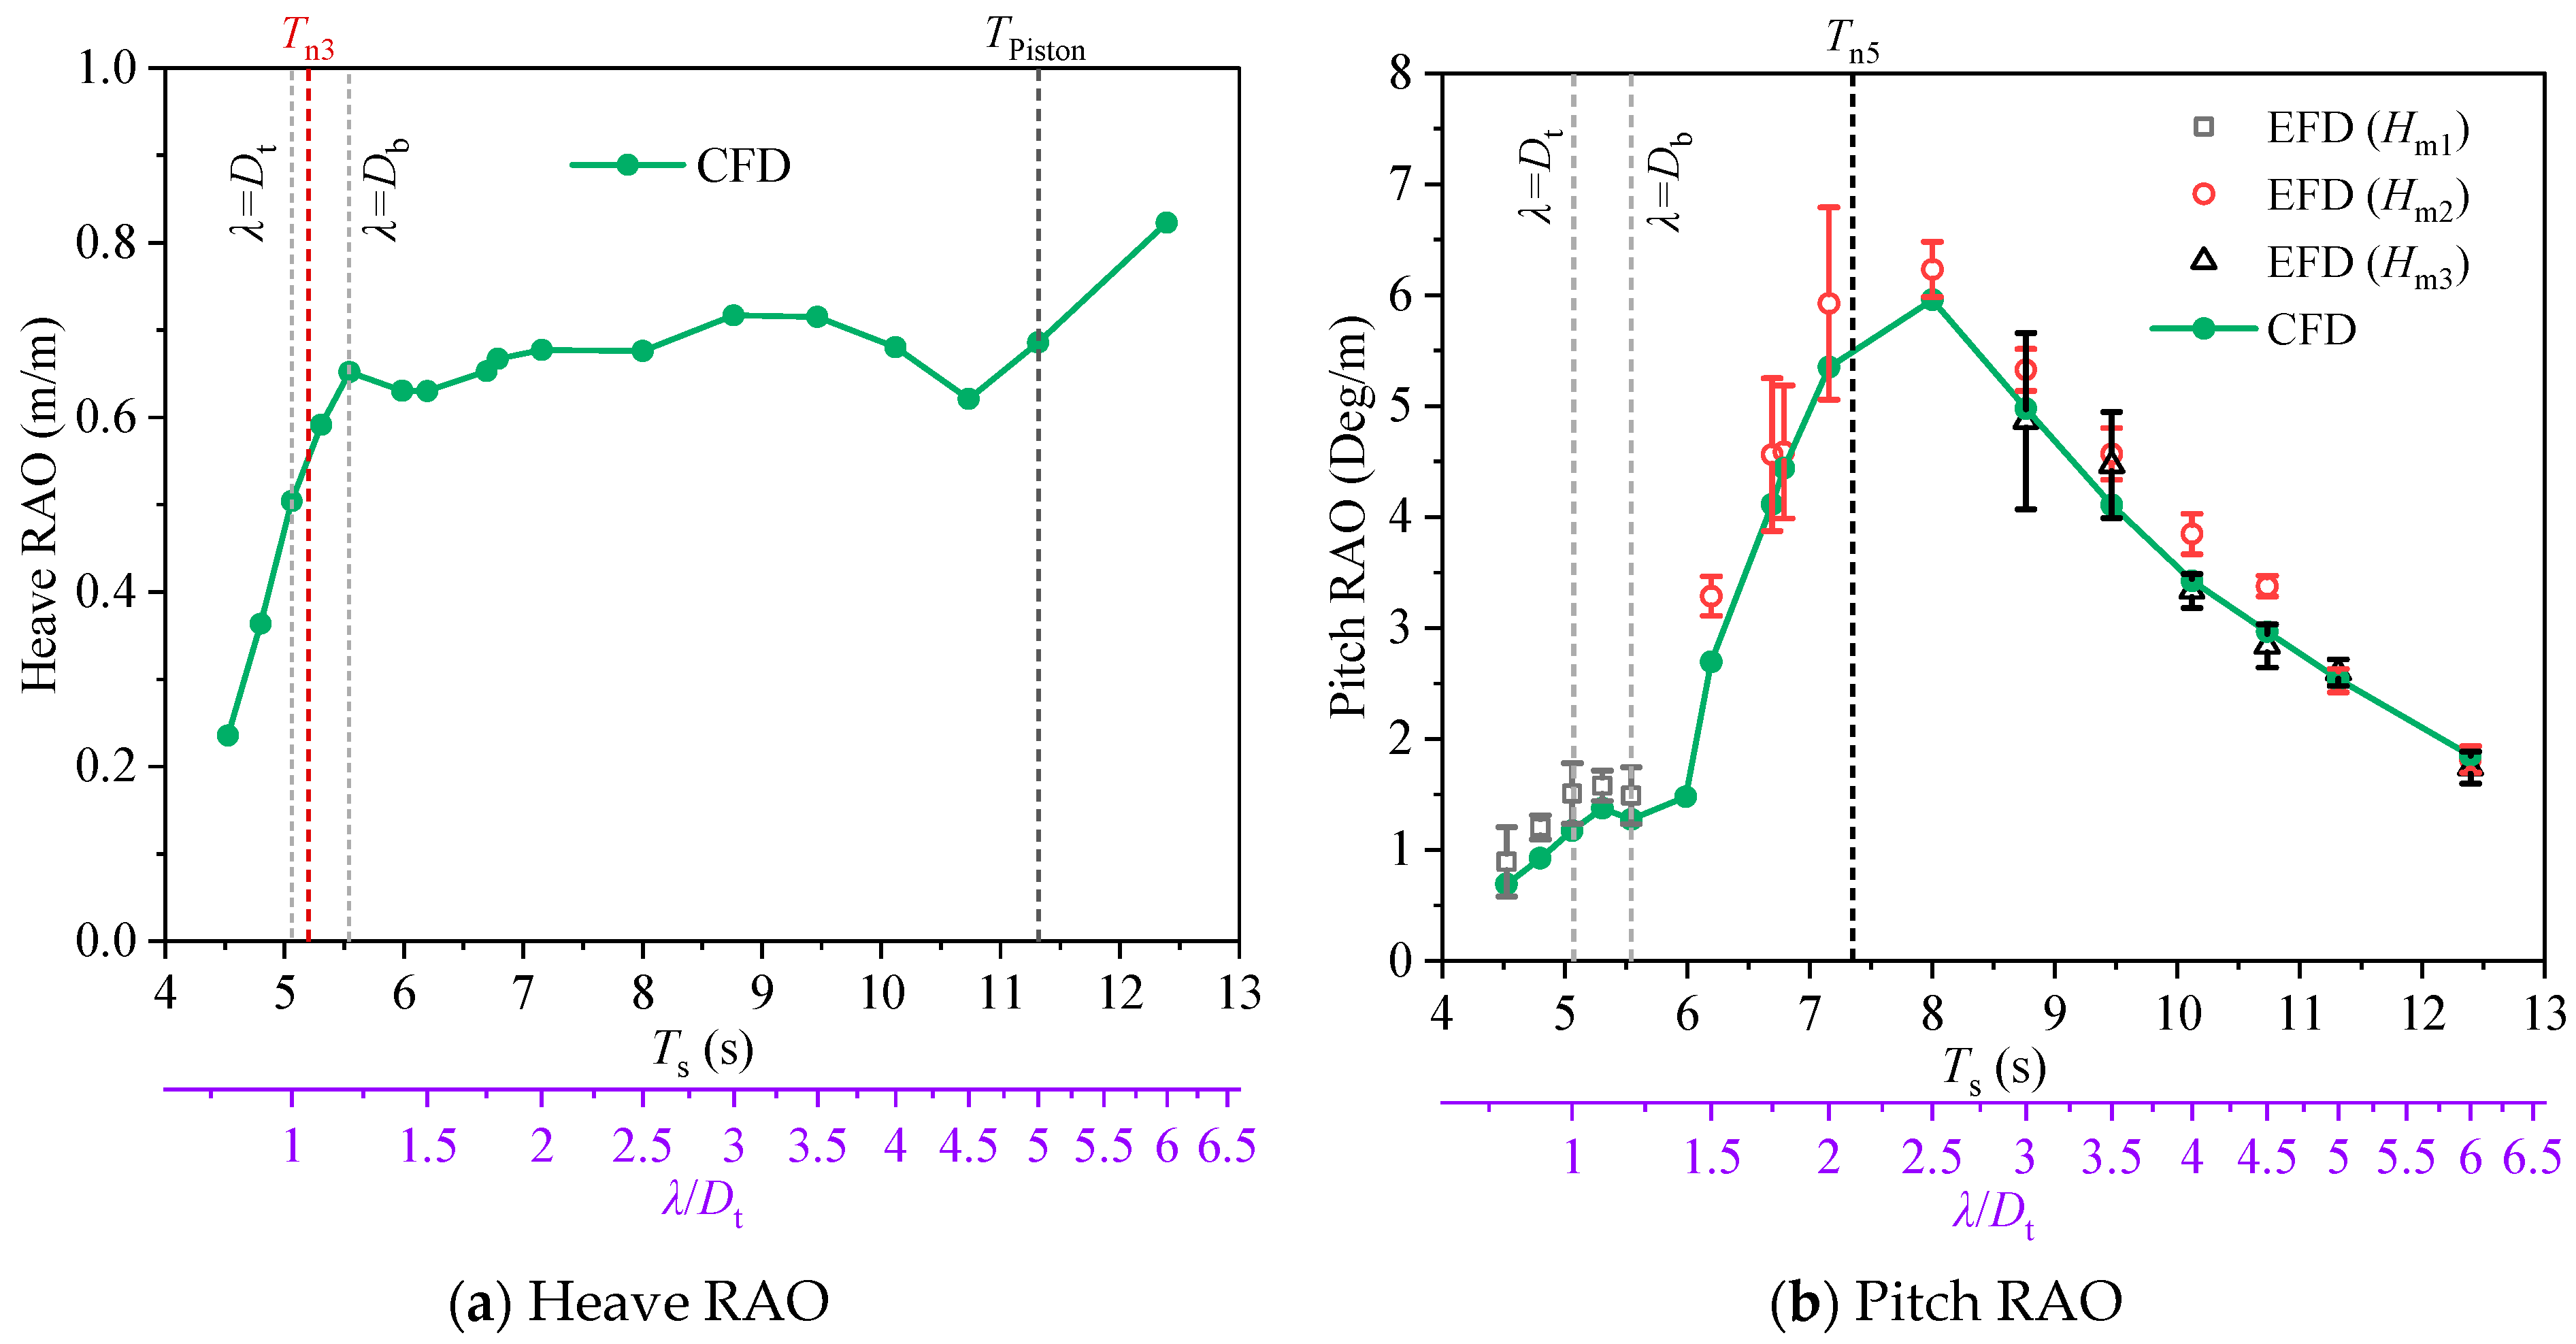
The heave and pitch motion response RAOs of the semi-closed aquaculture platform are shown in
Figure 17. It can be seen that at a wavelength of 0.8
Dt–1
Db, the semi-closed aquaculture platform’s heave RAO increases with the wavelength; in the wavelength range of 1
Db–4
Dt, the heave RAO varies slightly. The heave RAO decreases as the wavelength approaches 4.5
Dt. At small wavelengths, the pitch motion RAO obtained from the model test is larger than that from CFD calculations. Similar to the closed aquaculture platform, the semi-closed aquaculture platform’s pitch RAO appears to be maximal when the wave period is close to the natural period.
Structural divergence induced significant heave-RAO discrepancies: the closed aquaculture platform heave RAO is smaller than that of the open-bottom cage when Ts ≤ 8.0 s. The pitch motion RAOs of both aquaculture platforms have localized peaks at wavelengths close to the diameter of the buoyancy tank and maxima at wave periods close to their pitch natural period.
4.3.2. Wave Elevation Characteristics
By band-pass filtering, the wave frequency components of wave surface elevation (
ζWG) are retained. The wave surface elevation for the inside (WG3) and outer wave-facing side (WG5) of the closed aquaculture platform are shown in
Figure 18. Longitudinal sloshing demonstrated pronounced symmetry across the closed-cage structure. Since the wave amplitudes recorded at the rear (WG3) and front (WG1) wave gauges are equivalent, WG3 is selected as the representative dataset for analysis. WG3 sloshing has resonance near pitch natural period (
Tn5), and peaks at
λ =
Db. WG5 wave elevation are governed by dual mechanisms: wave diffraction dominance at short periods versus radiation caused by aquaculture platform motion. The larger wave elevation caused by the diffraction effect of short-period waves, reaches its maximum when the wave period approaches the natural period of the pitching motion.
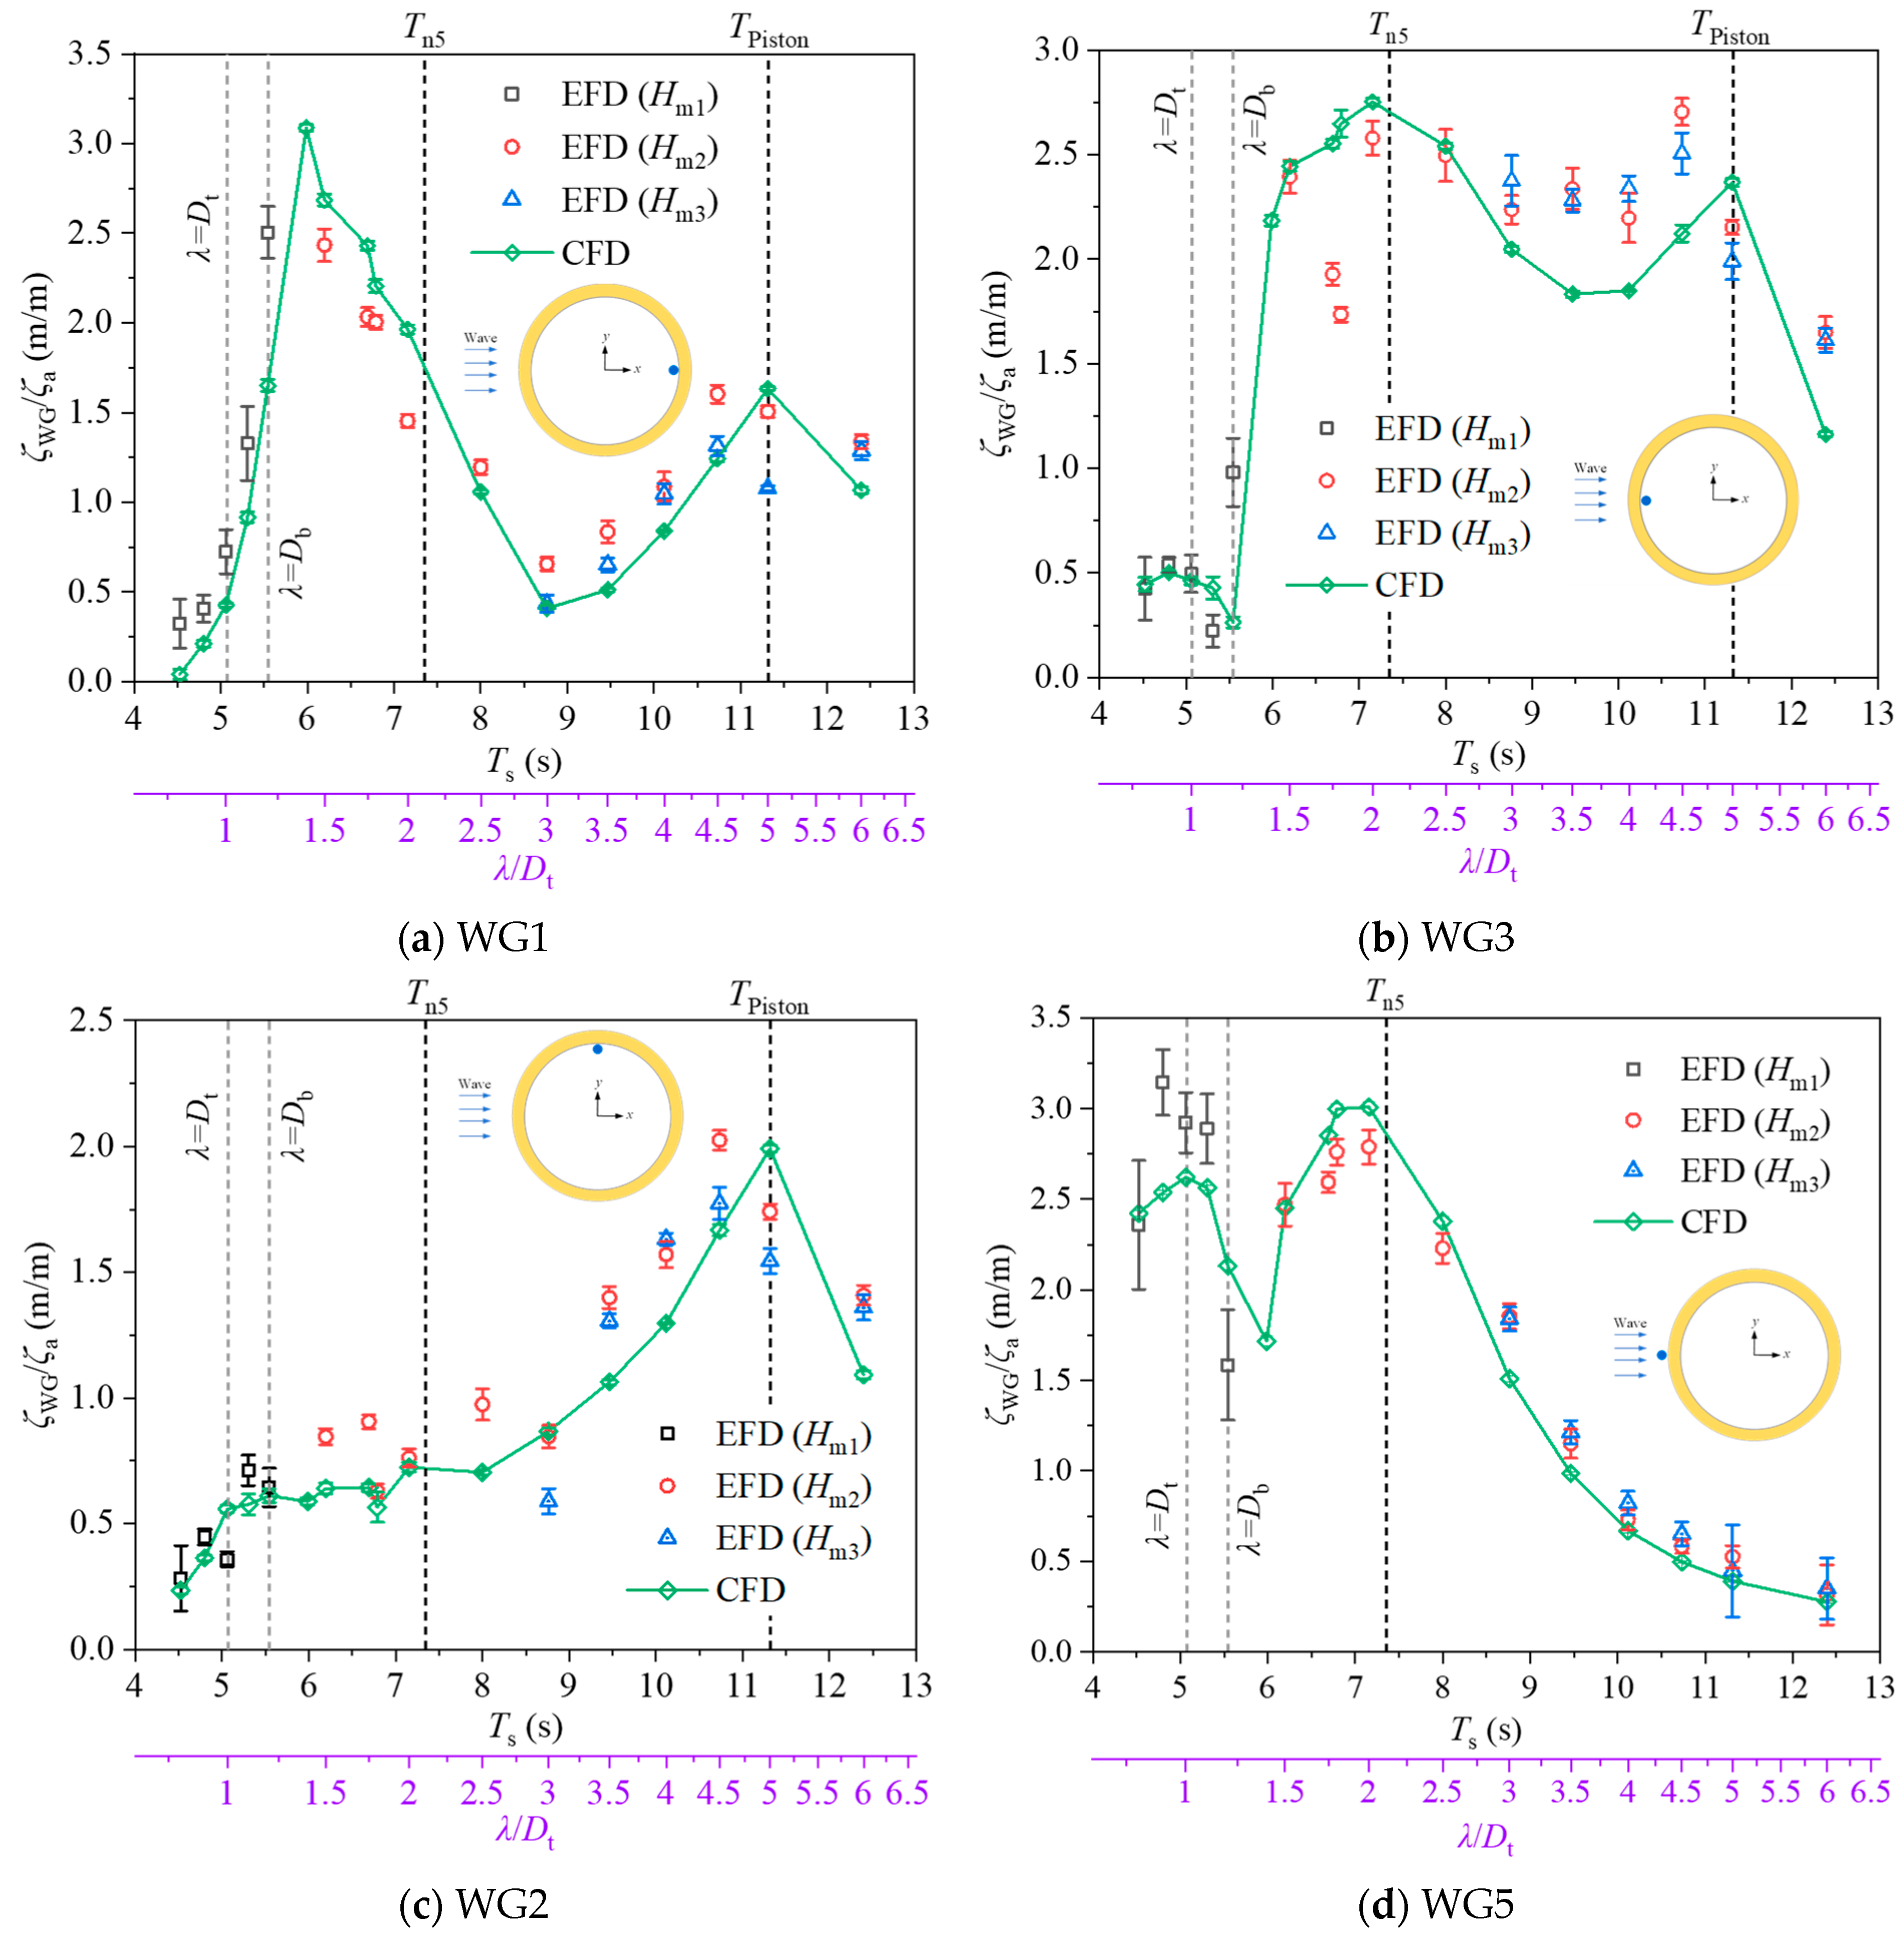
The wave surface elevation for the front (WG1), rear (WG3), side (WG2), and outer wave-facing side (WG5) of the semi-closed aquaculture platform are shown in
Figure 19. The wave surface elevation response at different locations varies greatly with wave period. The wave surface elevation response on the interior forward of the aquaculture tank appeared to be maximal when
; the interior rear side appeared to be maximal when
and
; the interior side appeared to be maximal when
; and the external side facing the wave appeared to be maximal when
and
.
4.4. Irregular Wave Response
Irregular wave studies were carried out by model test, with a total wave duration of 3 h (full-scale) and a single wave generation time of 5 min. A total of 6 tests were conducted, each using a different random seed number.
4.4.1. Motion Response
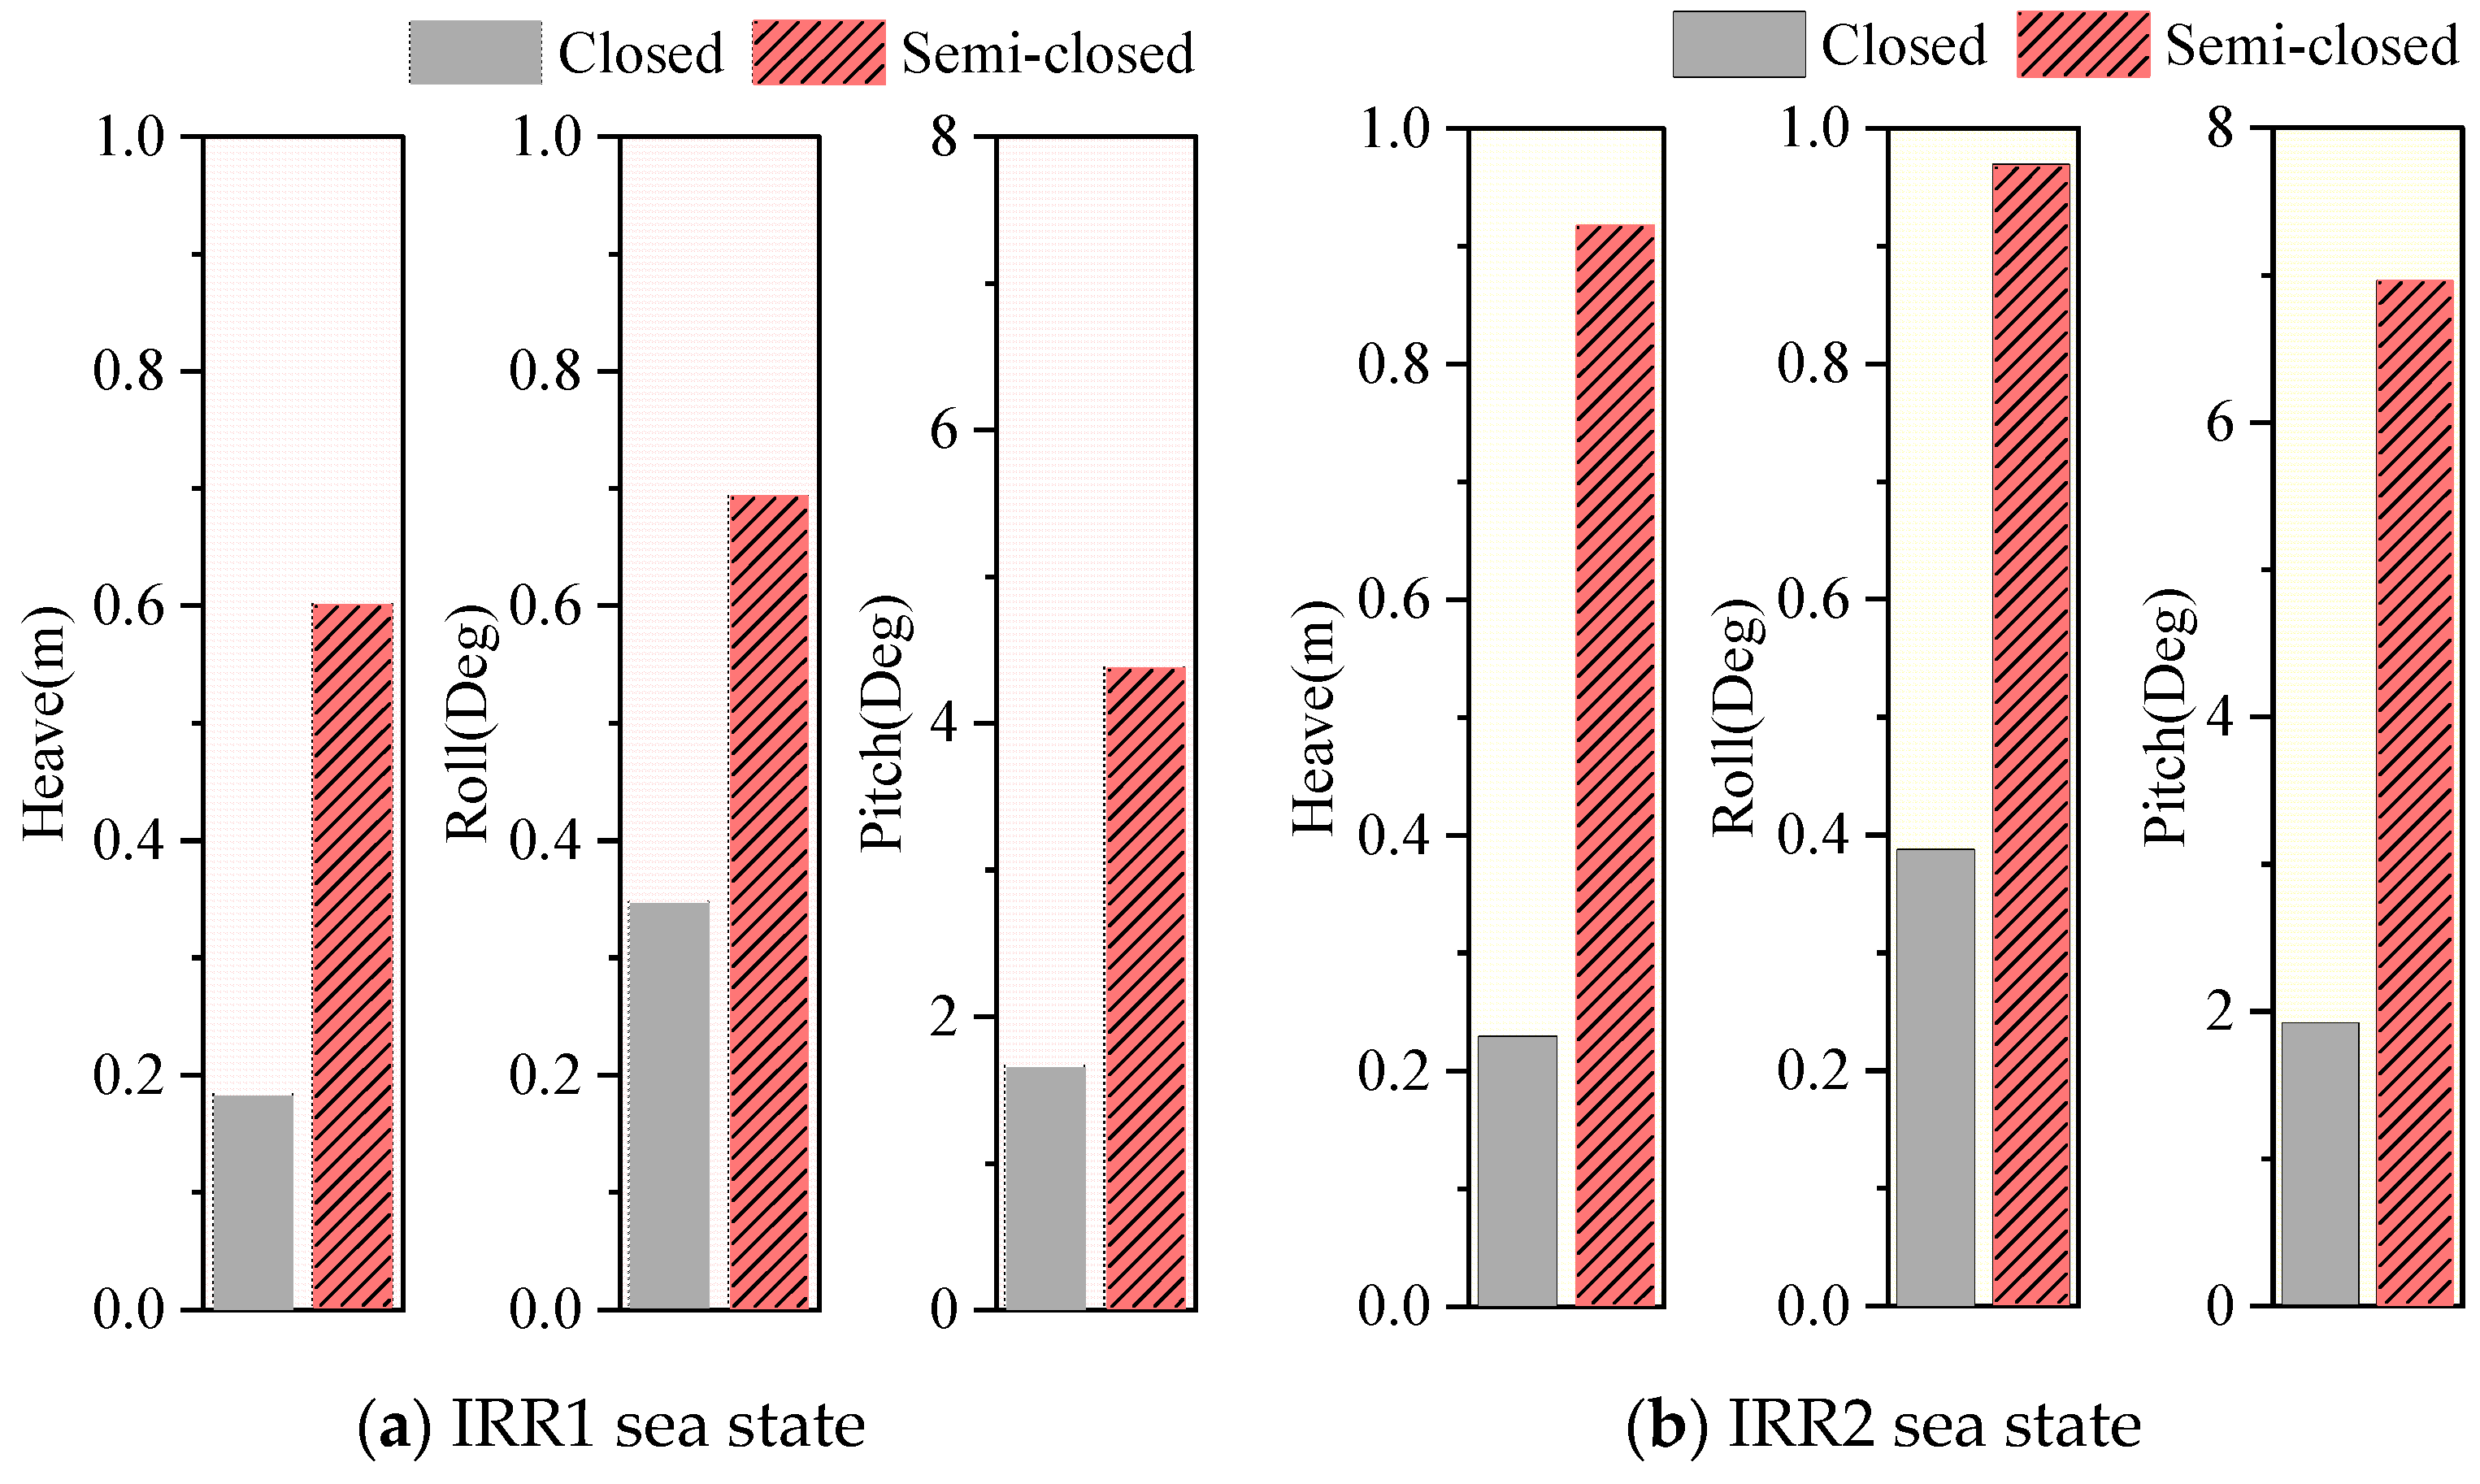
The maximum heave, roll, and pitch motion responses of closed and semi-closed aquaculture platforms in two irregular sea states are shown in
Figure 20. Under the two target sea states, the closed aquaculture platform’s motions are smaller than those of the semi-closed aquaculture platform. Because of the wave reflection effect of the basin wall, the aquaculture platform has a certain roll motion, and the roll motion amplitude is smaller than 1/5 of the pitch motion.
4.4.2. Wave Elevation Characteristics
Figure 21 quantifies peak wave elevation amplitudes at typical locations across both cage types exposed to two irregular sea states. The semi-closed structure amplifies internal tank sloshing magnitudes while suppressing wave elevations on the outer wave-facing side. At transverse sections (WG2/WG2M), semi-closed cage exhibited sloshing amplitudes 200–300% greater than closed cage.
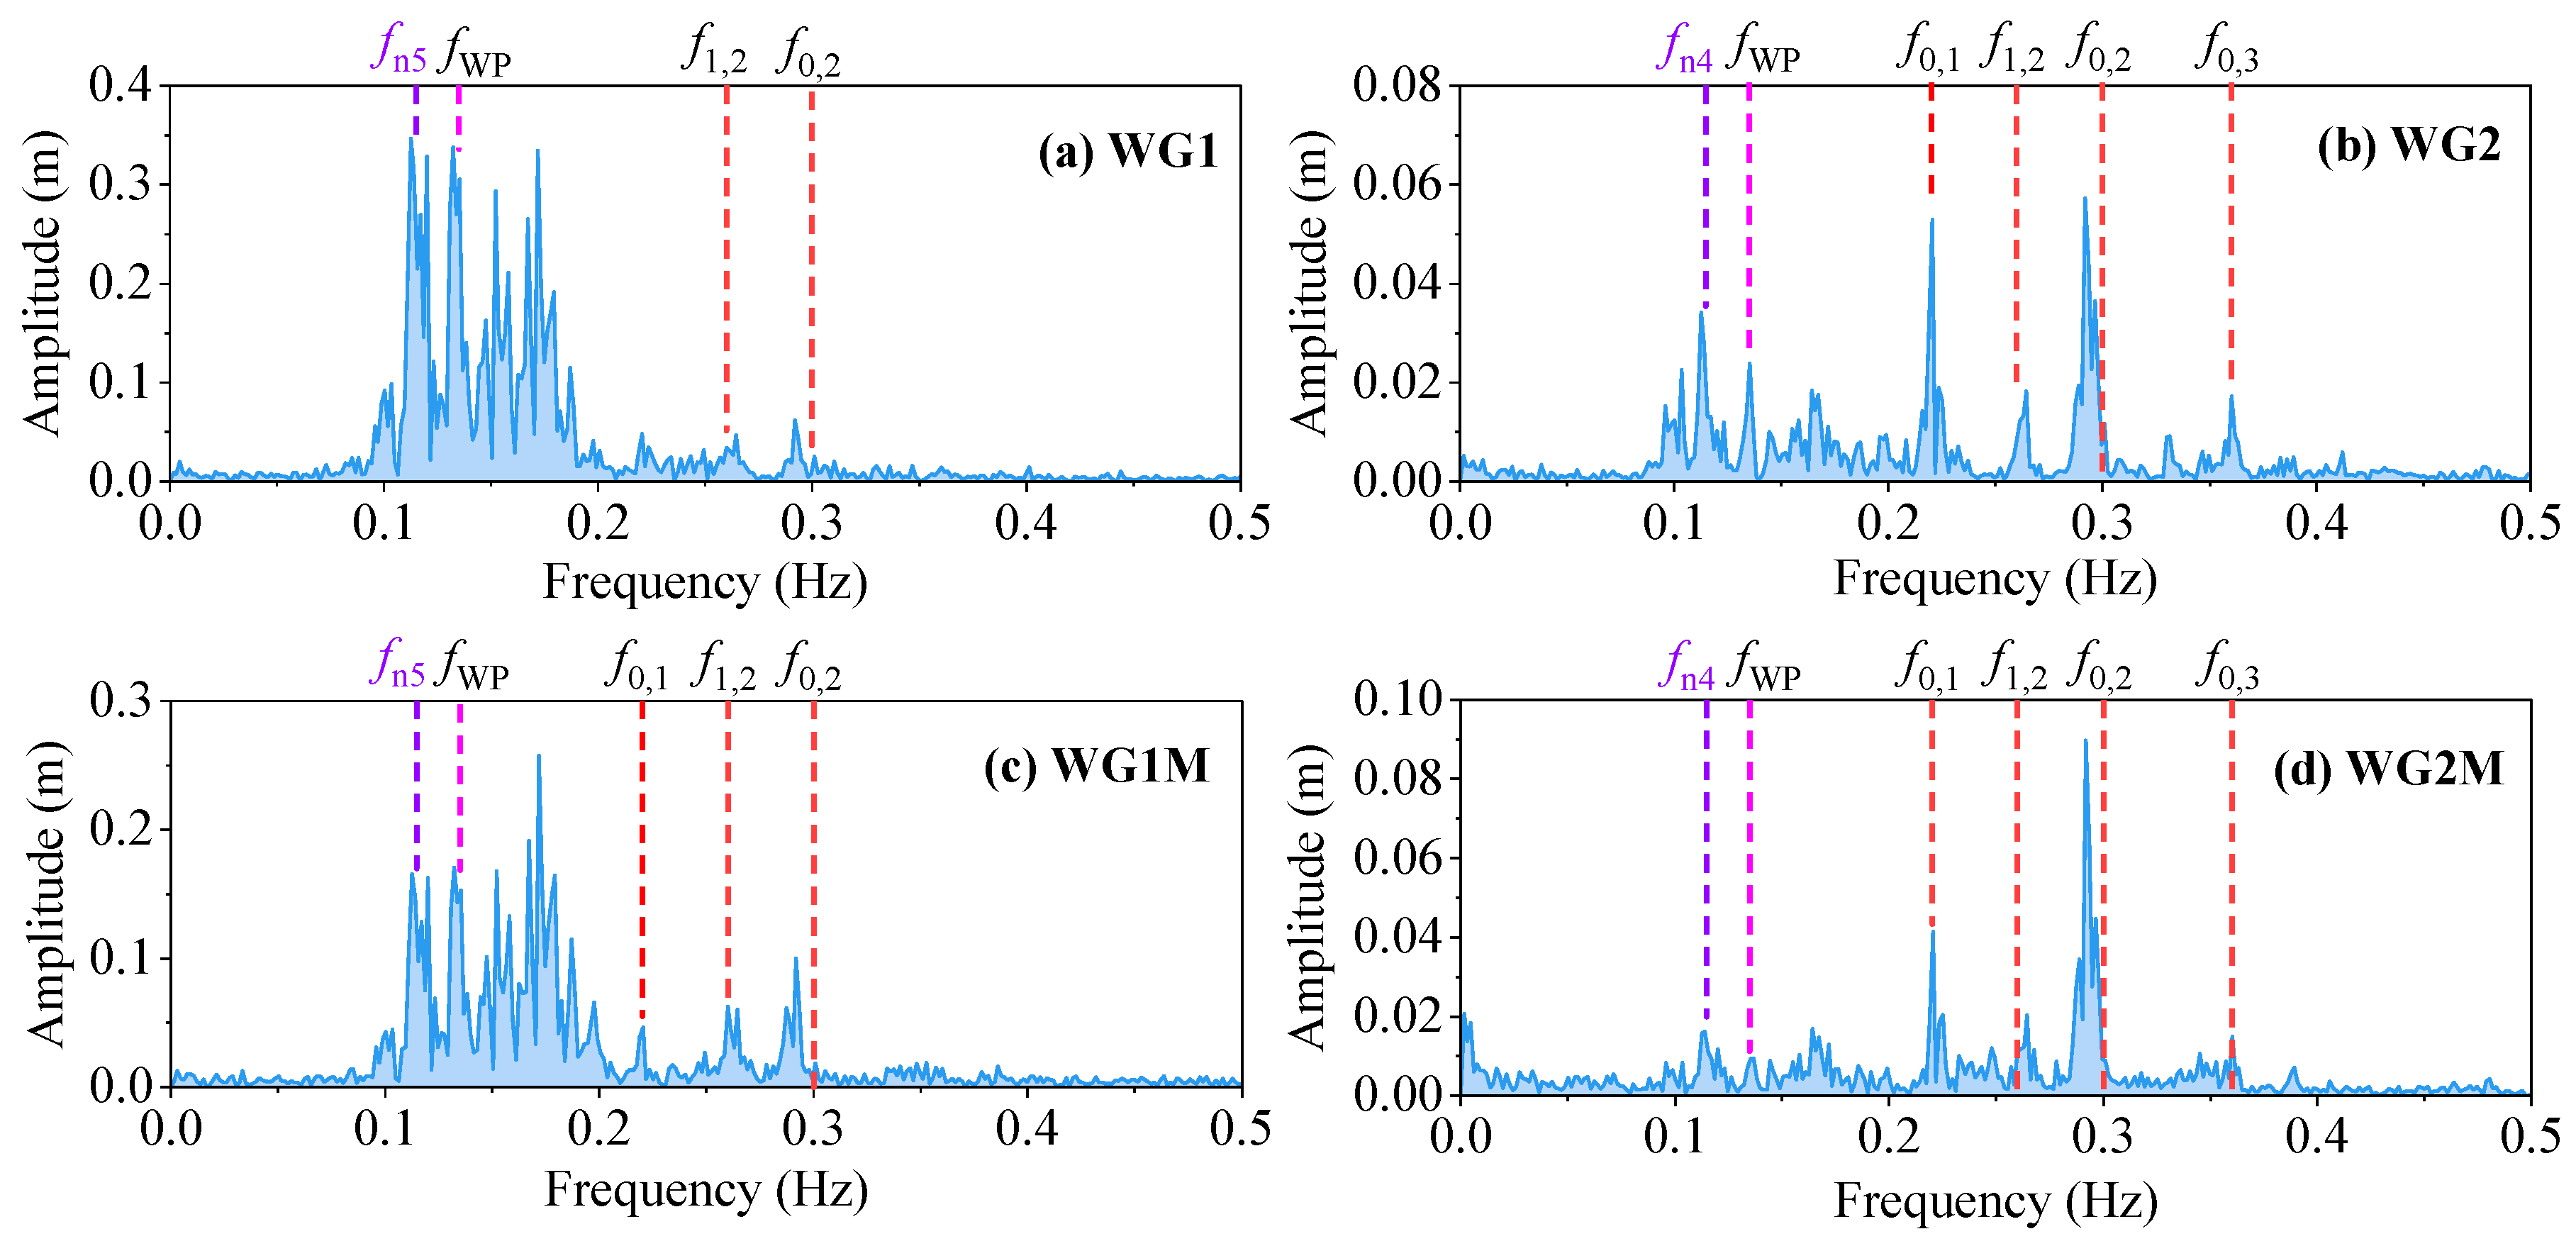
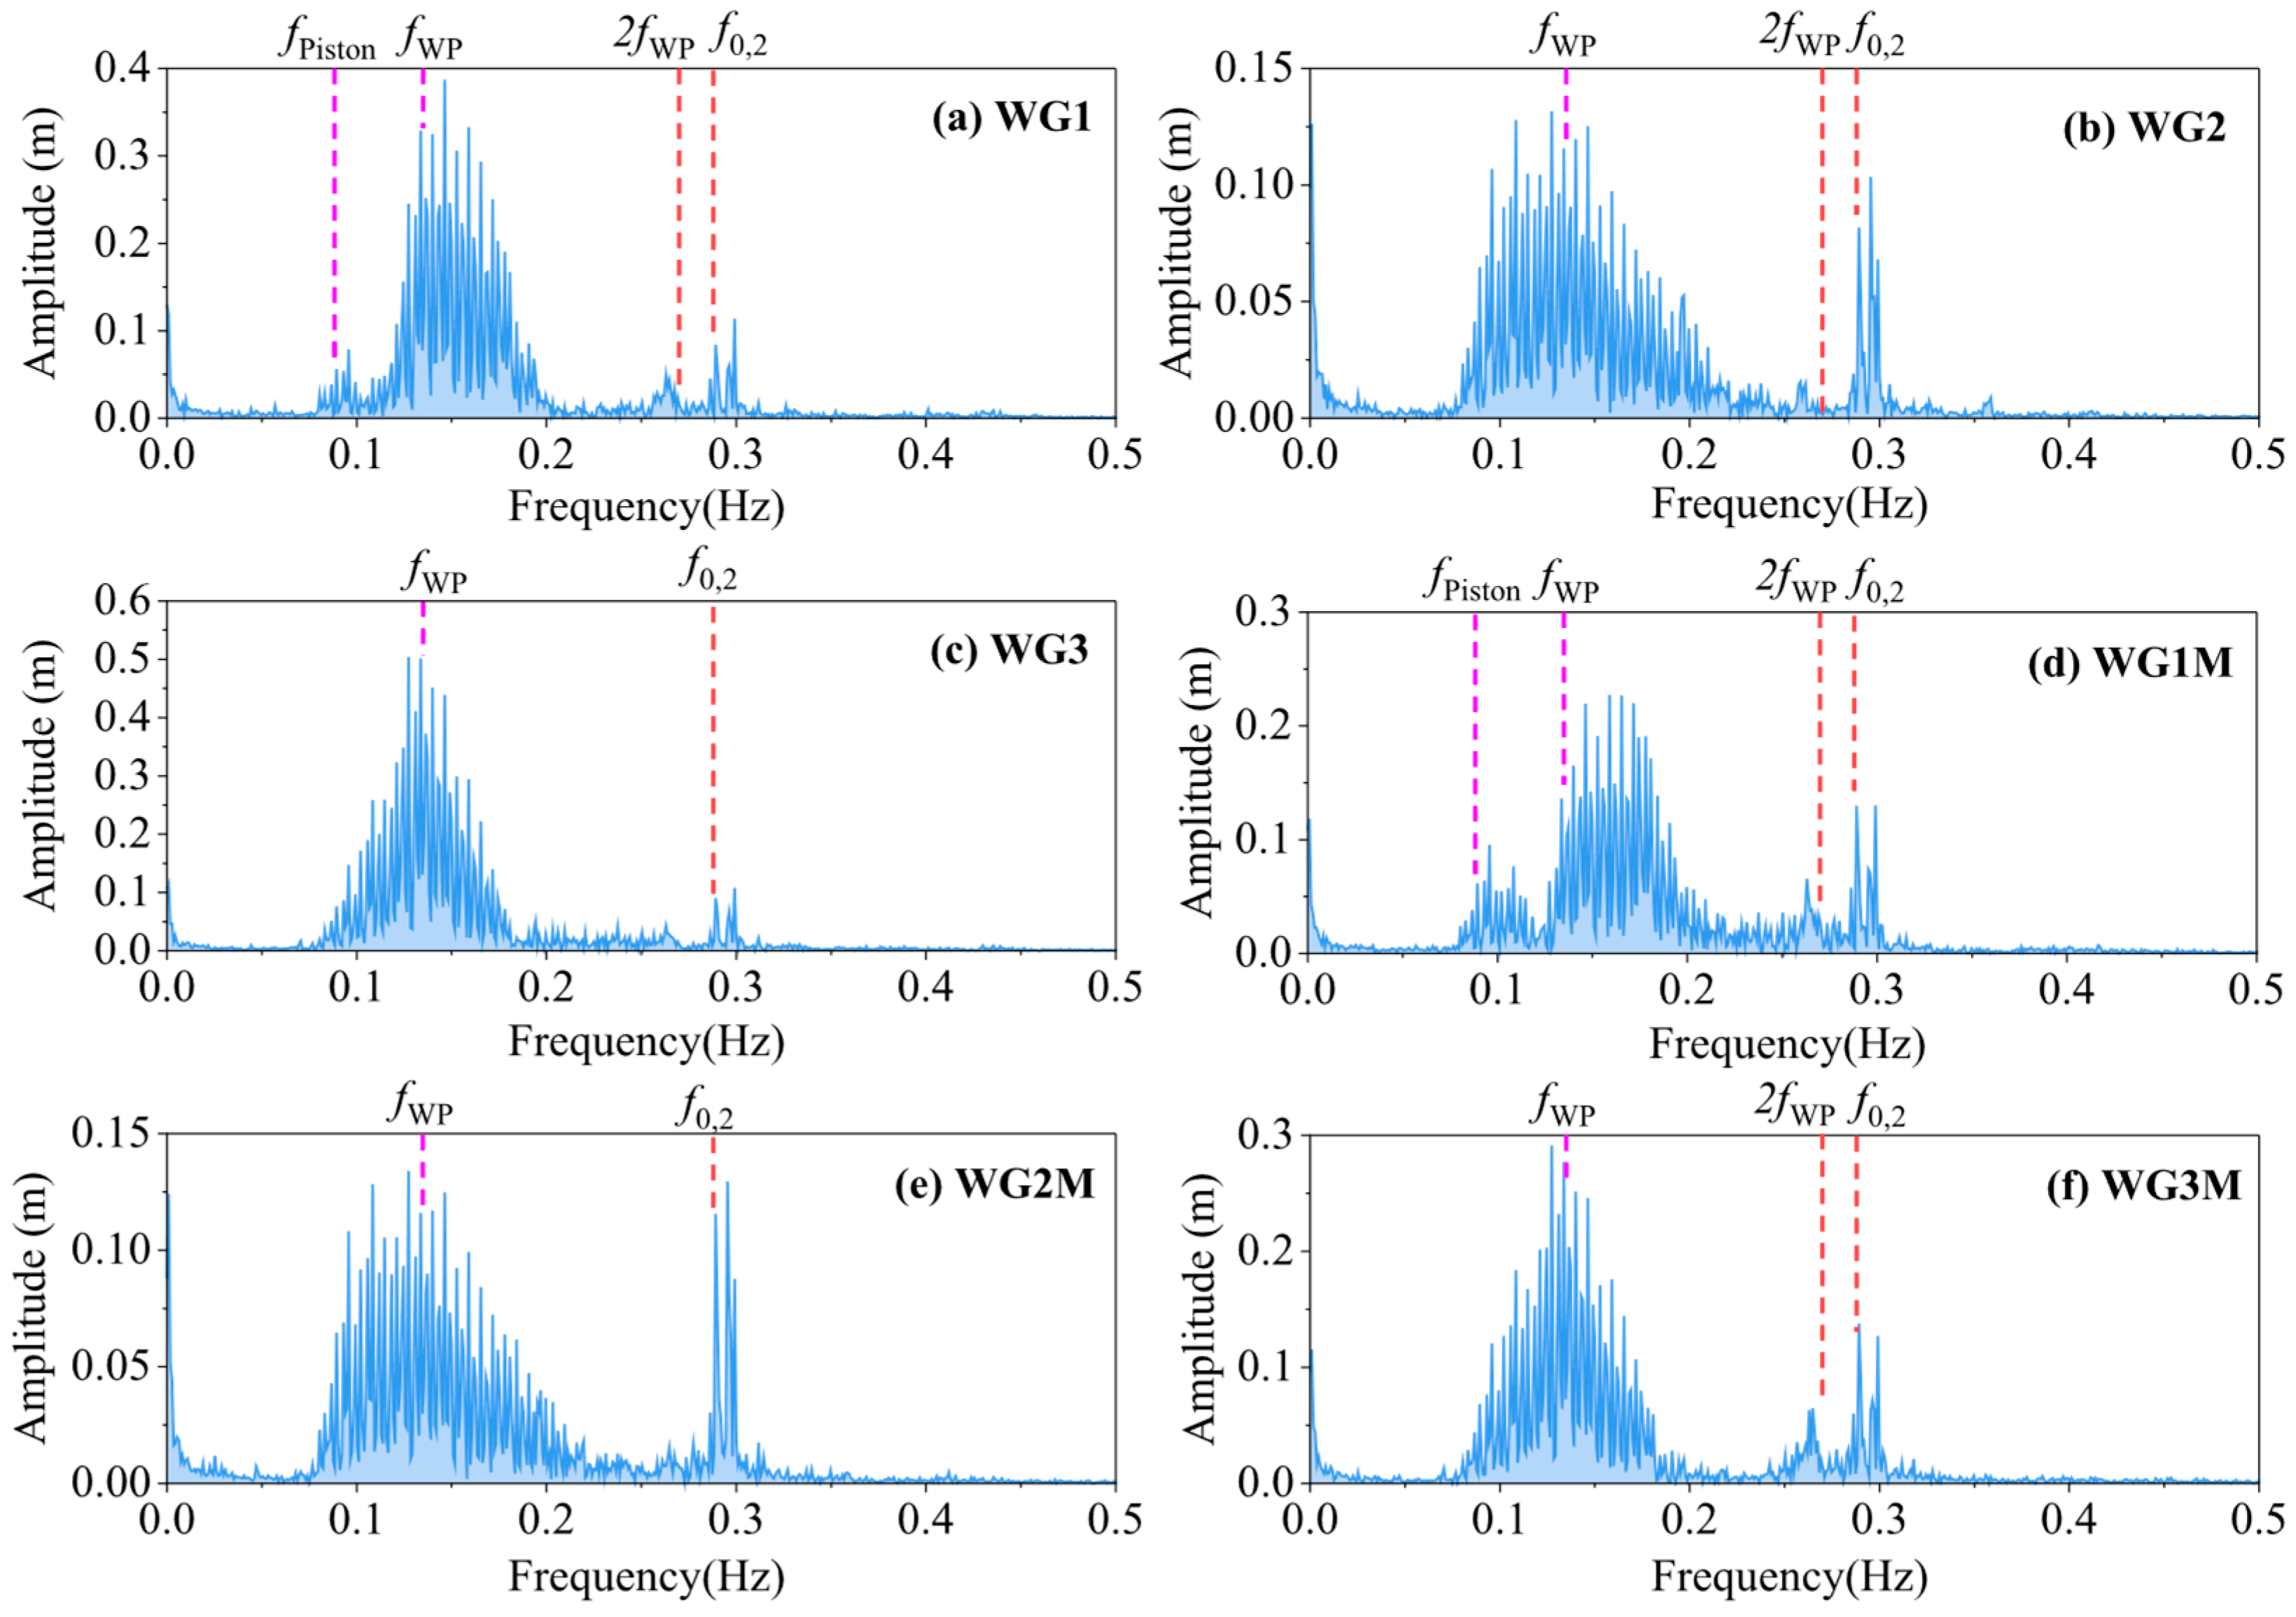
To characterize wave elevation frequency-domain behavior, Fast Fourier Transform (FFT) analysis was applied to key wave gauge within both cage types under IRR2 conditions, and the wave elevation response spectra are shown in
Figure 22 and
Figure 23. Due to the strong symmetry of the sloshing response in both the forward-backward and left-right directions of the closed aquaculture platform, their sloshing response spectra also show high similarity, so only the sway response spectra in the 1/4 quadrant of the aquaculture tanks are listed in
Figure 20. The sloshing response of WG1 and WG1M on the mid-longitudinal section is mainly concentrated in the range where the wave frequency is from the pitch natural frequency (
fn5) to 0.18 Hz, and the high-frequency sloshing modes are relatively small compared to the wave-frequency response. The sloshing response at WG2 and WG2M is dominated by the high-frequency response, with large peaks at frequencies equal to
f0,1,
f1,2 and
f0,2. The roll motion of the aquaculture platform is induced by wave reflection from the wave basin, which in turn induces a certain wave frequency sloshing response component.
The sloshing response spectrum at WG1 and WG1M inside the semi-closed aquaculture tank retains a certain response component at the moonpool piston natural frequency (). The sloshing response at all wave gauges has localized peaks at wave frequencies close to the f0,2 sloshing frequency, which is especially significant at WG2 and WG2M at the mid-transverse section. A sloshing response component close to occurs at some of the wave gauges, and this component is also observed in the regular wave test.
5. Conclusions
This study examined hydrodynamic behaviors of closed and semi-closed aquaculture platforms by experiment and CFD simulations. The calm water free decay, the motion response under regular and irregular waves, and the wave elevation characteristics inside and outside of the aquaculture platforms were analyzed. The principal conclusions derived from this investigation are as follows:
The closed aquaculture platform exhibited natural pitch and heave periods of 8.72 s and 9.75 s, respectively, whereas the semi-closed aquaculture platform showed corresponding values of 7.35 s and 5.2 s. With the same water plane area as the closed aquaculture platform but 13% less mass, the semi-closed aquaculture platform showed a 47% shorter heave natural period due to its open-bottom structure.
For both aquaculture platforms, peak pitch RAO occurred at natural periods, with resonance when the wavelength is close to the buoyancy tank diameter. The heave motion RAO demonstrated significant differences between the two aquaculture platform types. The heave response of the closed aquaculture platform was smaller than that of the semi-closed aquaculture platform when Ts < 8 s. Moreover, the heave RAO of the semi-closed aquaculture platform decreased when . During two operational sea states (TP = 6.4 s/7.2 s, Hs = 2.0 m/2.5 m), closed aquaculture platform demonstrated significantly reduced heave/roll/pitch motions relative to semi-closed aquaculture platform.
Closed aquaculture platforms exhibited symmetric sloshing about the mid-transverse plane, whereas semi-closed aquaculture platform showed pronounced asymmetry. Under the two typical sea states, the semi-closed aquaculture platform amplified internal sloshing magnitudes, especially by 200–300% at transverse sections, while the wave elevation on outer wave-facing side was reduced.
The sloshing response of both types of aquaculture platforms in irregular wave sea state was dominated by wave-frequency response in the mid-longitudinal section, and a certain high-frequency component was generated at f0,2 frequency. There were significant differences in the sloshing response spectrum at the mid-transverse section between the two aquaculture platforms: the sloshing response of the closed aquaculture platform was dominated by the high-frequency f0,1 and f0,2 frequencies, while the semi-closed aquaculture platform was dominated by the wave-frequency response, with some high-frequency components at the f0,2 frequency.
Due to limitations in computing resources and the relatively high computational demands of the CFD method, this study currently employs model tests specifically for the irregular wave components. The application of CFD methods for comparative validation in the future will be considered when computational conditions become more readily available.
Author Contributions
M.X.: conceptualization, methodology, formal analysis, investigation, writing—review & editing. Y.T.: conceptualization, software, validation, formal analysis, investigation, writing—original draft. H.L.: data curation, methodology, resources, writing—review and editing. J.C.: data curation, validation, writing—review and editing. D.Y.: conceptualization, writing— review & editing, supervision. All authors have read and agreed to the published version of the manuscript.
Funding
This research received no external funding.
Data Availability Statement
Data are contained within the article.
Acknowledgments
The authors would like to gratefully acknowledge the School of Naval Architecture and Ocean Engineering, Jiangsu University of Science and Technology for supplying the information and data, Renqing Zhu and Baohe Yang for supplying valuable opinions and guidance on this research.
Conflicts of Interest
The authors declare that they have no known competing financial interests or personal relationships that could have appeared to influence the work reported in this paper.
References
- FAO. The State of World Fisheries and Aquaculture 2022: Towards Blue Transformation; FAO: Rome, Italy, 2022. [Google Scholar]
- Nilsen, A.; Hagen, Ø.; Johnsen, C.A.; Prytz, H.; Zhou, B.; Nielsen, K.V.; Bjørnevik, M. The importance of exercise: Increased water velocity improves growth of Atlantic salmon in closed cages. Aquaculture 2019, 501, 537–546. [Google Scholar] [CrossRef]
- Nilsen, A. Production of Atlantic Salmon (Salmo salar) in Closed Confinement Systems (CCS)-Salmon Lice-Growth Rates-Mortality and Fish Welfare; Norwegian University of Life Sciences: Oslo, Norway, 2019. [Google Scholar]
- Long, L.; Liu, H.; Cui, M.; Zhang, C.; Liu, C. Offshore aquaculture in China. Rev. Aquac. 2023, 16, 254–270. [Google Scholar] [CrossRef]
- Nilsen, A.; Nielsen, K.V.; Bergheim, A. A closer look at closed cages: Growth and mortality rates during production of post-smolt Atlantic salmon in marine closed confinement systems. Aquac. Eng. 2020, 91, 102124. [Google Scholar] [CrossRef]
- Wang, C.; Wiegerink, J.; Leow, B. Opportunities for floating closed containment systems for fish farming. J. Aquac. Mar. Biol. 2020, 9, 123–127. [Google Scholar] [CrossRef]
- Chu, Y.I.; Wang, C.M.; Park, J.C.; Lader, P.F. Review of cage and containment tank designs for offshore fish farming. Aqua-culture 2020, 519, 734928. [Google Scholar] [CrossRef]
- Øvrebø, T.K. Growth Performance and Welfare of Post-Smolt (Salmo salar L.) Reared in Semi Closed Containment Systems (S-CCS)—A Comparative Study; University of Bergen: Bergen, Norway, 2020. [Google Scholar]
- Tao, Y.W.; Zhu, R.Q.; Gu, J.Y.; Li, Z.Y.; Zhang, Z.Y.; Xu, X.S. Experimental and numerical investigation of the hydrodynamic response of an aquaculture vessel. Ocean Eng. 2023, 279, 114505. [Google Scholar] [CrossRef]
- Nam, B.-W.; Kim, Y.; Kim, D.-W.; Kim, Y.-S. Experimental and numerical studies on ship motion responses coupled with sloshing in waves. J. Ship Res. 2009, 53, 68–82. [Google Scholar] [CrossRef]
- Kristiansen, D.; Lader, P.; Endresen, P.C.; Aksnes, V. Numerical and experimental study on the seakeeping behavior of floating closed rigid fish cages. In Proceedings of the ASME 2018 37th International Conference on Ocean, Offshore and Arctic Engineering, Madrid, Spain, 17–22 June 2018. [Google Scholar]
- Gabl, R.; Davey, T.; Nixon, E.; Steynor, J.; Ingram, D.M. Comparison of a Floating Cylinder with Solid and Water Ballast. Water 2019, 11, 2487. [Google Scholar] [CrossRef]
- Shen, Y.G.; Firoozkoohi, R.; Greco, M.; Faltinsen, O.M. Experimental investigation of a closed vertical cylinder-shaped fish cage in waves. Ocean Eng. 2021, 236, 109444. [Google Scholar] [CrossRef]
- Shen, Y.; Firoozkoohi, R.; Greco, M.; Faltinsen, O.M. Comparative investigation: Closed versus semi-closed vertical cylinder-shaped fish cage in waves. Ocean Eng. 2022, 245, 110397. [Google Scholar] [CrossRef]
- Wiegerink, J.J.; Baldock, T.E.; Callaghan, D.P.; Wang, C.M. Slosh Suppression Blocks—A concept for mitigating fluid motions in floating closed containment fish pen in high energy environments. Appl. Ocean Res. 2022, 120, 103068. [Google Scholar] [CrossRef]
- Wiegerink, J.J.; Baldock, T.E.; Callaghan, D.P.; Wang, C.M. Experimental study on hydrodynamic response of a floating rigid fish tank model with slosh suppression blocks. Ocean Eng. 2023, 273, 113772. [Google Scholar] [CrossRef]
- Tan, Y.; Shao, Y.; Read, R. Coupled motion and sloshing analysis of a rigid cylindrical closed fish cage in regular waves. In Proceedings of the 38th International Conference on Ocean, Offshore and Arctic Engineering, Glasgow, UK, 9–14 June 2019. [Google Scholar]
- Su, B.A.; Tsarau, A.; Endresen, P.C.; Kristiansen, D.; Lader, P.F. Numerical study of closed rigid fish cages in waves and comparison with experimental data. Ocean Eng. 2021, 233, 109210. [Google Scholar] [CrossRef]
- Sphaier, S.H.; Torres, F.G.S.; Masetti, I.Q.; Costa, A.P.; Levi, C. Monocolumn behavior in waves: Experimental analysis. Ocean Eng. 2007, 34, 1724–1733. [Google Scholar] [CrossRef]
- Wei, Q.; Gu, J.-Y.; Lyu, H.-G.; Liu, W.-M.; Xu, X.-S. Coupling response of pitch and moonpool water motion of a drilling ship under wave-current excitation. Ocean Eng. 2024, 294, 116817. [Google Scholar] [CrossRef]
- Han, J.; Zhang, X. A numerical study of the influence of the wave reflection on the hydrodynamic characteristics of a cylinder with moonpool. Phys. Fluids 2024, 36, 012113. [Google Scholar] [CrossRef]
- Molin, B.; Zhang, X.; Huang, H.; Remy, F. On natural modes in moonpools and gaps in finite depth. J. Fluid Mech. 2018, 840, 530–554. [Google Scholar] [CrossRef]
- Han, J.; Zhang, X.; Huang, H. Experimental and numerical studies of piston-mode resonance in a three-dimensional circular moonpool. Phys. Fluids 2023, 35, 082106. [Google Scholar] [CrossRef]
- Zhang, C.W.; Dai, J.R.; Cui, L.; Ning, D.Z. Experimental study of nonlinear states of oscillating water column in waves. Phys. Fluids 2023, 35, 017108. [Google Scholar] [CrossRef]
- Moreau, M.; Kristiansen, T.; Ommani, B.; Molin, B. An upright bottomless vertical cylinder with baffles floating in waves. Appl. Ocean. Res. 2022, 119, 102934. [Google Scholar] [CrossRef]
- Faltinsen, O.M.; Timokha, A.N. Sloshing; Cambridge University Press: Cambridge, UK, 2009. [Google Scholar]
- NS 9415; Marine Fish Farms—Requirements for Site Survey Risk, Analysis, Design, Dimensioning, Production, Installation and Operation. Standards Norway: Oslo, Norway, 2009.
- Hashimoto, H.; Omura, T.; Matsuda, A.; Yoneda, S.; Stern, F.; Tahara, Y. Several remarks on EFD and CFD for ship roll decay. Ocean Eng. 2019, 186, 106082. [Google Scholar] [CrossRef]
- Irkal, M.A.R.; Nallayarasu, S.; Bhattacharyya, S.K. Numerical prediction of roll damping of ships with and without bilge keel. Ocean Eng. 2019, 179, 226–245. [Google Scholar] [CrossRef]
- Mancini, S.; Begovic, E.; Day, A.H.; Incecik, A. Verification and validation of numerical modelling of DTMB 5415 roll decay. Ocean Eng. 2018, 162, 209–223. [Google Scholar] [CrossRef]
- Siemens Digital Industries Software. STAR-CCM + User Guide; Siemens Digital Industries Software: Plano, TX, USA, 2022. [Google Scholar]
- ITTC. Uncertainty Analysis in CFD, Verification and Validation Methodology and Procedures; ITTC: Zürich, Switzerland, 2021. [Google Scholar]
Figure 1.
Schematic structure of the aquaculture platform.
Figure 1.
Schematic structure of the aquaculture platform.
Figure 2.
Model fabrication scheme and photograph.
Figure 2.
Model fabrication scheme and photograph.
Figure 3.
Mooring line and wave gauge arrangements.
Figure 3.
Mooring line and wave gauge arrangements.
Figure 4.
Photos of single tank aquaculture platform model.
Figure 4.
Photos of single tank aquaculture platform model.
Figure 5.
Typical wave time history and calibration result.
Figure 5.
Typical wave time history and calibration result.
Figure 6.
Numerical wave tank scale and boundary condition.
Figure 6.
Numerical wave tank scale and boundary condition.
Figure 7.
Computational domain grid profile.
Figure 7.
Computational domain grid profile.
Figure 8.
Motion and sloshing response time history of closed aquaculture platform.
Figure 8.
Motion and sloshing response time history of closed aquaculture platform.
Figure 9.
Convergence of pitch motion.
Figure 9.
Convergence of pitch motion.
Figure 10.
Convergence of sloshing response.
Figure 10.
Convergence of sloshing response.
Figure 11.
Heave and pitch free decay curves of closed aquaculture platform.
Figure 11.
Heave and pitch free decay curves of closed aquaculture platform.
Figure 12.
Heave and pitch free decay curves of semi-closed aquaculture platform.
Figure 12.
Heave and pitch free decay curves of semi-closed aquaculture platform.
Figure 13.
Initial water surface profiles inside and outside the semi-closed aquaculture platform.
Figure 13.
Initial water surface profiles inside and outside the semi-closed aquaculture platform.
Figure 14.
Time history curve of the water surface elevation inside the moonpool.
Figure 14.
Time history curve of the water surface elevation inside the moonpool.
Figure 15.
Typical pitch motion response from model tests and CFD calculation.
Figure 15.
Typical pitch motion response from model tests and CFD calculation.
Figure 16.
Motion response RAO of closed aquaculture platform.
Figure 16.
Motion response RAO of closed aquaculture platform.
Figure 17.
Motion response RAO of semi-closed aquaculture platform.
Figure 17.
Motion response RAO of semi-closed aquaculture platform.
Figure 18.
Wave surface elevation in the fore (WG3) and stern (WG5) of the closed aquaculture tank.
Figure 18.
Wave surface elevation in the fore (WG3) and stern (WG5) of the closed aquaculture tank.
Figure 19.
Wave surface elevation of semi-closed aquaculture platform.
Figure 19.
Wave surface elevation of semi-closed aquaculture platform.
Figure 20.
Motion response of two rigid aquaculture platforms under irregular wave conditions.
Figure 20.
Motion response of two rigid aquaculture platforms under irregular wave conditions.
Figure 21.
Sloshing response of closed and semi-closed aquaculture platform.
Figure 21.
Sloshing response of closed and semi-closed aquaculture platform.
Figure 22.
Sloshing response spectrum of closed aquaculture platform.
Figure 22.
Sloshing response spectrum of closed aquaculture platform.
Figure 23.
Sloshing response spectrum of semi-closed aquaculture platform.
Figure 23.
Sloshing response spectrum of semi-closed aquaculture platform.
Table 1.
Conversion relations for the main physical quantities.
Table 1.
Conversion relations for the main physical quantities.
| Physical Quantity | Full Scale | Model |
|---|
| Length | Ls | Lm = Ls/ |
| Time | ts | tm = ts/ |
| Wave period | Ts | Tm = Ts |
| Frequency | fs | fm = fs |
| Angle | Φm | Φm= Φs |
| Displacement | ∆s | ∆m = ∆s/λ3η |
Table 2.
Model scale and mass parameters.
Table 2.
Model scale and mass parameters.
| Designation | Symbol | Unit | Closed | Semi-Closed |
|---|
| Prototype | Model | Prototype | Model |
|---|
| Outer diameter of AT | Dt | m | 39.2 | 0.98 | 39.2 | 0.98 |
| Inner diameter of AT | Di | m | 38.9 | 0.973 | 38.9 | 0.973 |
| Height of AT | Ht | m | 18.0 | 0.45 | 18.0 | 0.45 |
| Outer diameter of BT | Db | m | 48.0 | 1.2 | 48.0 | 1.2 |
| Draft | T | m | 21.0 | 0.525 | 21.0 | 0.525 |
| Displacement | ∆ | kg | 2.46 × 10⁶ | 38.5 | 2.18 × 10⁶ | 34.1 |
| Center of gravity above baseline | KG | m | 17.36 | 0.434 | 18.92 | 0.473 |
| Radius of roll gyration | kxx | m | 16.40 | 0.41 | 15.00 | 0.38 |
| Radius of pitch gyration | kyy | m | 16.52 | 0.41 | 15.12 | 0.38 |
| Radius of yaw gyration | kzz | m | 20.52 | 0.51 | 19.88 | 0.50 |
Table 3.
Sloshing mode natural periods () of closed and semi-closed aquaculture platforms.
Table 3.
Sloshing mode natural periods () of closed and semi-closed aquaculture platforms.
| Mode | Closed | Semi-Closed |
|---|
| m = 0 | m = 1 | m = 0 | m = 1 |
|---|
| n = 1 | 4.52 | 6.64 | 4.70 | 6.74 |
| n = 2 | 3.34 | 3.83 | 3.47 | 3.98 |
| n = 3 | 2.77 | 3.03 | 2.88 | 3.15 |
| n = 4 | 2.42 | 2.59 | 2.52 | 2.69 |
| n = 5 | 2.18 | 2.30 | 2.27 | 2.38 |
Table 4.
Main parameters of the instruments.
Table 4.
Main parameters of the instruments.
| Instrument | Sensor Type | Measuring Range | Precision | Sampling Rate |
|---|
| Inclinometer | BWH526 | ±30° | 0.003° | 50 Hz |
| Optical measuring instrument | Qualisys Oqus-1-310 | / | 0.1 mm, 0.1° | 100 Hz |
| Wave gauge | ULD200 | 15, 30, 50 cm | 0.15% | 100 Hz |
Table 5.
Regular wave test conditions.
Table 5.
Regular wave test conditions.
| No. | Ts (s) | λs (m) | Tm (s) | λm (m) | Hm (m) | Wave Steepness |
|---|
| 1 | 4.53 | 32.00 | 0.716 | 0.80 | 0.025 | 1/32.0 |
| 2 | 4.80 | 36.00 | 0.759 | 0.90 | 1/36.0 |
| 3 | 5.06 | 40.00 | 0.800 | 1.00 | 1/40.0 |
| 4 | 5.31 | 44.00 | 0.839 | 1.10 | 1/44.0 |
| 5 | 5.54 | 48.00 | 0.876 | 1.20 | 1/48.0 |
| 6 | 6.20 | 60.00 | 0.980 | 1.50 | 0.04 | 1/37.5 |
| 7 | 6.69 | 70.00 | 1.058 | 1.75 | 1/43.75 |
| 8 | 6.79 | 72.00 | 1.073 | 1.80 | 1/45.0 |
| 9 | 7.16 | 80.00 | 1.131 | 2.00 | 1/50.0 |
| 10 | 8.00 | 100.00 | 1.265 | 2.50 | 1/62.5 |
| 11 | 8.76 | 120.00 | 1.386 | 3.00 | 1/75.0 |
| 12 | 9.47 | 140.00 | 1.497 | 3.50 | 1/87.5 |
| 13 | 10.12 | 160.00 | 1.600 | 4.00 | 1/100.0 |
| 14 | 10.73 | 180.00 | 1.697 | 4.50 | 1/112.5 |
| 15 | 11.31 | 200.00 | 1.789 | 5.00 | 1/125.0 |
| 16 | 12.39 | 240.00 | 1.960 | 6.00 | 1/150.0 |
| 17 | 8.76 | 120.00 | 1.386 | 3.00 | 0.06 | 1/50.0 |
| 18 | 9.47 | 140.00 | 1.497 | 3.50 | 1/58.3 |
| 19 | 10.12 | 160.00 | 1.600 | 4.00 | 1/66.7 |
| 20 | 10.73 | 180.00 | 1.697 | 4.50 | 1/75.0 |
| 21 | 11.31 | 200.00 | 1.789 | 5.00 | 1/83.3 |
| 22 | 12.39 | 240.00 | 1.960 | 6.00 | 1/100.0 |
Table 6.
Environmental classification of marine farms.
Table 6.
Environmental classification of marine farms.
| Wave Rating | Hs (m) | Exposure Level |
|---|
| A | 0.0–0.5 | Small |
| B | 0.5–1.0 | Moderate |
| C | 1.0–2.0 | Heavy |
| D | 2.0–3.0 | High |
| E | >3.0 | Extreme |
Table 7.
Irregular wave parameters.
Table 7.
Irregular wave parameters.
| Sea State | Prototype | Model |
|---|
| Hs (m) | Tp (s) | fWP (Hz) | Hs (m) | Tp (s) | fWP (Hz) |
|---|
| IRR1 | 2.0 | 6.4 | 0.156 | 0.05 | 1.02 | 0.980 |
| IRR2 | 2.5 | 7.2 | 0.139 | 0.0625 | 1.14 | 0.877 |
Table 8.
Boundary condition.
Table 8.
Boundary condition.
| Boundary | Condition |
|---|
| Top | Pressure outlet |
| Inlet | Velocity inlet |
| Outlet | Velocity inlet |
| Left | Velocity inlet |
| Right | Velocity inlet |
| Bottom | Wall |
Table 9.
Grid and time-step convergence computational conditions.
Table 9.
Grid and time-step convergence computational conditions.
| Case | Based Grid Size (m) | Grid Number | Time Step (s) | Pitch Amplitude [13] | Sloshing Amplitude (m) |
|---|
| A | 0.141 | 5.70 × 10⁶ | 0.0040 | 2.4320 | 0.0375 |
| B | 0.160 | 4.00 × 10⁶ | 0.0040 | 2.4330 | 0.0370 |
| C | 0.183 | 2.81 × 10⁶ | 0.0040 | 2.4415 | 0.0360 |
| D | 0.160 | 4.00 × 10⁶ | 0.0034 | 2.4365 | 0.0365 |
| E | 0.160 | 4.00 × 10⁶ | 0.0048 | 2.4330 | 0.0370 |
Table 10.
Motion natural period and damping ratio of aquaculture platforms.
Table 10.
Motion natural period and damping ratio of aquaculture platforms.
| Cage Type | Motion | Natural Period Tn3/Tn5 (s) | Damping Ratio |
|---|
| Closed | Heave | 9.75 | 12.6% |
| Pitch | 8.72 | 5.6% |
| Semi-closed | Heave | 5.20 | 14.4% |
| Pitch | 7.35 | 10.9% |
| Disclaimer/Publisher’s Note: The statements, opinions and data contained in all publications are solely those of the individual author(s) and contributor(s) and not of MDPI and/or the editor(s). MDPI and/or the editor(s) disclaim responsibility for any injury to people or property resulting from any ideas, methods, instructions or products referred to in the content. |
© 2025 by the authors. Licensee MDPI, Basel, Switzerland. This article is an open access article distributed under the terms and conditions of the Creative Commons Attribution (CC BY) license (https://creativecommons.org/licenses/by/4.0/).


