Article

Effects of Dish-Shaped Buoy and Perforated Damping Plate on Power Absorption in Floating Two-Body Wave Energy Converters

1
School of Mechanical Engineering, Shandong University, Jinan 250061, China
2
Key Laboratory of High-Efficiency and Clean Mechanical Manufacture of Ministry of Education, Shandong University, Jinan 250061, China
3
National Demonstration Center for Experimental Mechanical Engineering Education, Shandong University, Jinan 250061, China
4
Institute of Marine Science and Technology, Shandong University, Qingdao 266200, China
5
Shenzhen Research Institute, Shandong University, Shenzhen 518057, China
*
Author to whom correspondence should be addressed.
J. Mar. Sci. Eng. 2025, 13(10), 1881; https://doi.org/10.3390/jmse13101881
Submission received: 19 August 2025 / Revised: 23 September 2025 / Accepted: 28 September 2025 / Published: 1 October 2025
(This article belongs to the Section Ocean Engineering)

Abstract

Floating two-body wave energy converters (WECs) exhibit advantages, including insensitivity to water depth and tidal range, along with adaptability to multi-level sea states. However, WECs suffer from drawbacks, including unstable power generation and low wave energy capture efficiency. To enhance the hydrodynamic performance and energy capture efficiency, a dish-shaped buoy and perforated damping plate configuration was designed based on conventional two-body WECs. First, four two-body WECs were developed according to these configurations. Second, a numerical model based on potential flow theory and the boundary element method (BEM) was established, with its accuracy validated through sea trials. Finally, the frequency domain response, motion response, mooring tension and power absorption effect of the WECs under wave excitation of grades 3, 4 and 5 were analyzed. The results demonstrate that both the dish-shaped buoy and perforated damping plate significantly improve the device stability and energy capture potential. Regarding the motion response, both configurations reduced the peak response amplitudes in heave and roll, enhancing the device stability. For mooring tension, both configurations reduced the mooring line tension. For power absorption, the perforated damping plate effectively increased the energy capture efficiency, while the dish-shaped buoy also demonstrated superior performance under higher-energy wave conditions. Overall, this study provides a theoretical foundation and design guidance for floating two-body WECs.

1. Introduction

Sustainable economic growth fundamentally depends on secure energy provision. Recent global energy crises have underscored the imperative of energy self-sufficiency [1]. Among renewable ocean energies, wave energy exhibits exceptional promise due to its high energy density, substantial inherent reserves, and environmental compatibility [2,3]. Two-body WECs have become prominent due to the structural simplicity, high conversion efficiency, cost-effectiveness, and deployment flexibility [4,5]. However, their near-shore deployment in low-energy wave regimes faces challenges such as limited power absorption efficiency [6,7]. Consequently, offshore deployment constitutes an inevitable trend, necessitating advanced floating two-body WECs for deep-water wave energy harvesting [8,9]. Current research focuses on three key aspects: configuration optimization, numerical simulation, and sea trials.
In terms of configuration optimization, Nazari [10] demonstrated that optimized float geometry reduces the viscous–PTO damping disparity, enhancing resonance and power absorption. Son [11] achieved threefold response enhancement in two-body WECs through shape optimization and parameter tuning to minimize viscous losses. Li [12] and Amiri [13] systematically investigated hydrodynamic sensitivity to the float radius and draft variations in two-body WECs. Tan [14] augmented the added mass via damping plates at intermediate float bases, mitigating wave–structure interactions. Al [15,16] optimized submerged buoy and float configurations to enhance the motion response and energy capture efficiency. Payne [17] utilized the boundary element method (BEM) for two-body WECs, quantifying the resonance period discrepancies between simulations and experiments. Kurniawan [18] confirmed that enlarged submerged buoy diameters improve energy capture through shape optimization. Li [19,20] proposed a two-body WEC consisting of a surface-floating streamlined float and a deep-draft slender cylindrical buoy. The streamlined geometry reduces viscous energy dissipation and enhances motion response characteristics. For such WECs, the mass increase of the outer float or damping plates on the inner buoy [21,22] enhances stability, while large-amplitude outer buoy motion significantly improves the relative motion.
In terms of numerical simulation, Falcao [23] employed frequency domain BEM simulations to optimize energy capture for the WEC under regular or irregular waves, refining the riser dimensions and PTO parameters. Bosma [24,25] established frequency domain and time domain BEM models for PowerBuoy, characterizing the hydrodynamic performance and energy extraction in both inviscid and viscous flow regimes. Xu [26,27] enhanced the BEM accuracy for WEC hydrodynamics through optimized free-surface Green’s function solutions. Ruehl [28] advanced time domain modeling for two-body WECs, capturing nonlinear viscous effects and hydraulic PTO coupling dynamics. Ma [5] introduced empirical drag coefficients to model vortex-induced vibrations on submerged bodies, enhancing the response prediction fidelity. Ji [29] incorporated nonlinear stiffness into vertically asymmetric two-body WEC models, achieving superior accuracy over linear simulations. Zhang [30] implemented high-order BEM for time domain analysis of hydrodynamic characteristics. Wang [31] integrated second-order irregular wave theory into numerical models, enabling accurate power absorption analysis under extreme sea states. Agyekum [32] developed a test rig to simulate the electrical pulses of a wave energy converter, employing control algorithms to achieve enhanced power output.
In terms of sea trials, several two-body WECs have successfully undergone sea trials and been deployed in real marine environments. In 1994, Ocean Power Technologies developed the PowerBuoy [33], incorporating a damping plate to increase the added mass and radiation damping. In 1999, Wavebob Ltd. in Ireland introduced the Wavebob converter [4,34], which completed prototype sea trials in 2006. In 2007, Oregon State University successfully conducted sea trials of the SeaBeav I converter [35]. In 2011, the Guangzhou Institute of Energy Conversion deployed “Nezha I” near Wanshan Island, Zhuhai—a floating direct-drive WEC [36]. In 2012, Shandong University developed a 120 kW two-body WEC, “SDU-I,” which underwent sea trials off the coast of Chengshantou, Shandong Province [37]. An improved version, “SDU-II,” was deployed in 2016 [38].
Current efforts predominantly focus on conventional two-body WEC optimization. Exploration of appendage integration and damping plate refinement for enhanced power absorption remains limited. Furthermore, existing numerical studies primarily examine the main buoy, with the hydrodynamic interactions in float and main buoy systems requiring deeper investigation. This study introduces a novel two-body WEC integrating a dish-shaped buoy and perforated damping plate. Building upon the SDU-II WEC, the proposed SDU-III WEC incorporates dish-shaped buoys and perforated damping plates, achieving enhanced stability, reduced mooring line tension, and improved power absorption. The research advantages are summarized in Table 1. The remainder of this paper is organized as follows. Section 2 outlines the theoretical background of the study. Section 3 details four two-body WECs featuring dish-shaped buoy and damping plate variations, with the corresponding numerical models developed. Then, it validates the hydrodynamic responses using experimental sea trial data. Section 4 presents and discusses the results of the study. Section 5 summarizes the main conclusions of the study.

2. Fundamental Theory

2.1. Potential Flow Theory

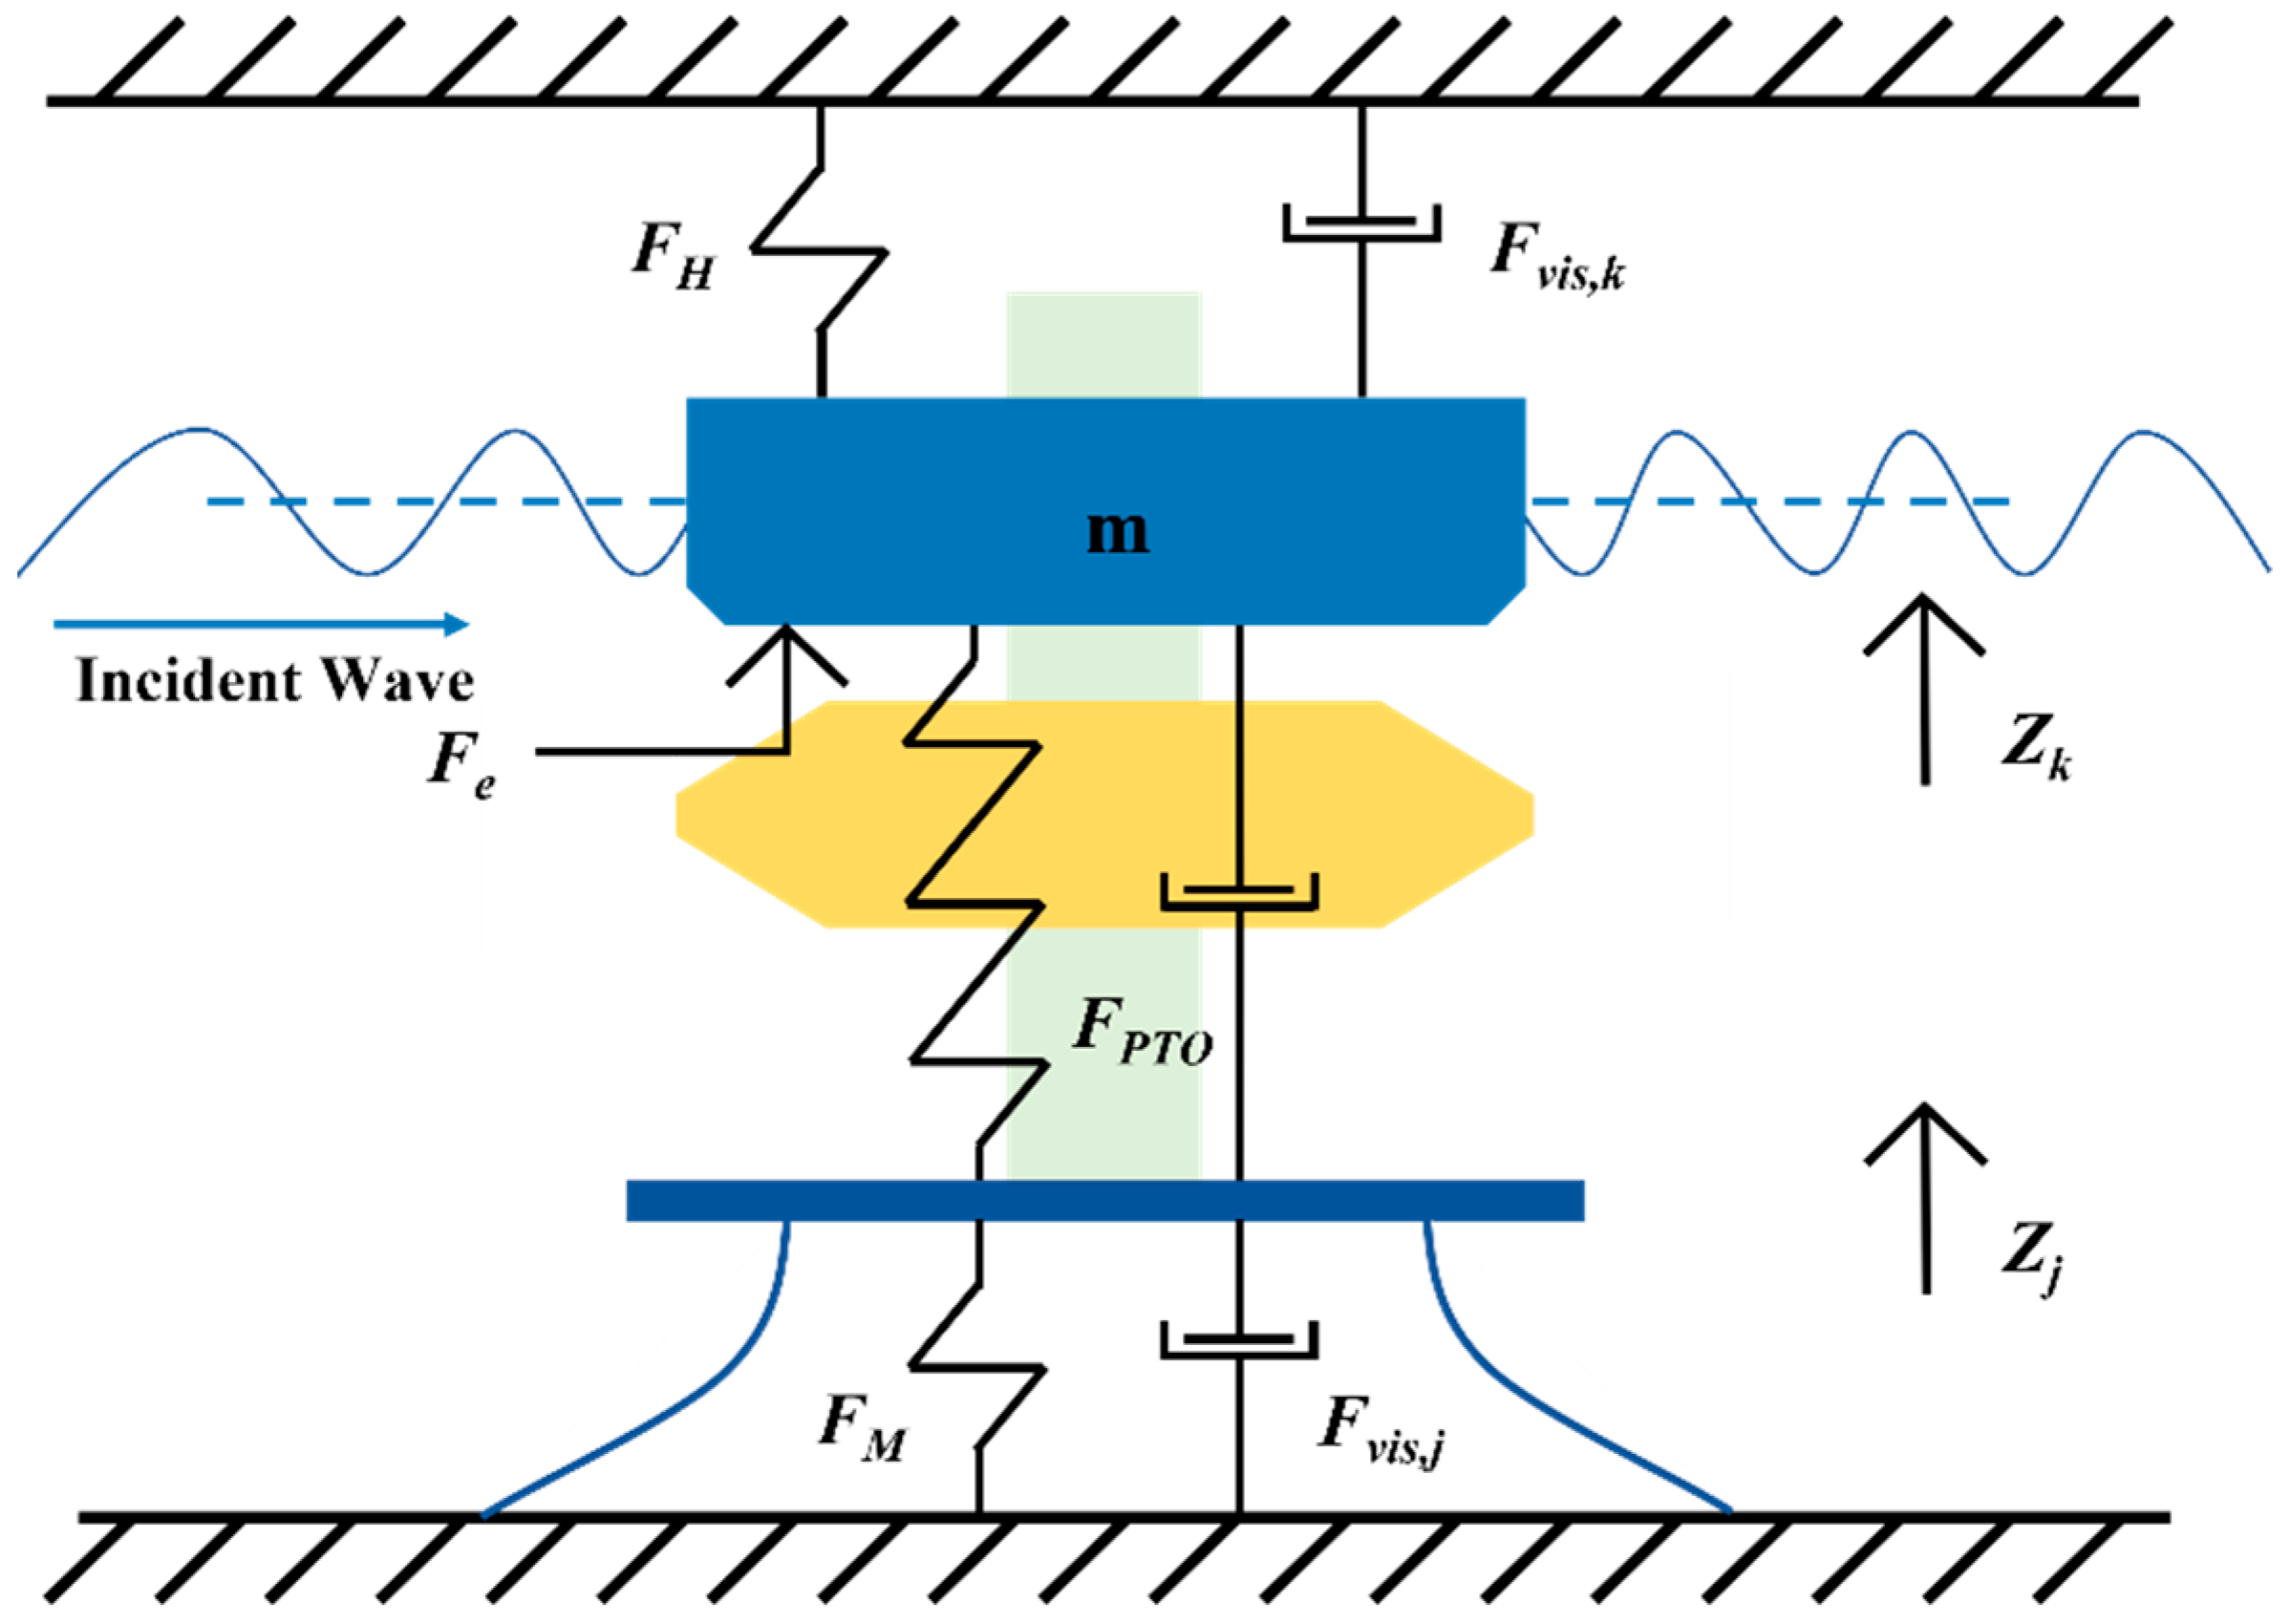
In two-body WECs, a float connects to the main buoy via a power take-off (PTO) system. The PTO system is enabled for mechanical-to-electrical energy conversion by the wave-driven relative motion between the float and main buoy. This energy conversion mechanism is fundamentally modeled as a two-degree-of-freedom oscillator system, as shown in Figure 1.
For structures subjected to wave excitation, the fluid is assumed to be incompressible, inviscid and subject to irrotational flow with gravitational body forces. Based on mass conservation and momentum principles, the velocity potential φ satisfies Laplace’s equation:
2 φ = 0
where ∇2 is the Laplace operator. φ is the velocity potential.
The interaction between fluid and structure can be characterized by boundary condition equations [39].
ω 2 φ + g φ z = 0 , z = 0
φ n = V n
φ z = 0 , z = d
lim r k 0 r φ r i k 0 φ = 0
The Laplace control equation and boundary conditions are linear, and the velocity potential is decomposed based on linear superposition:
φ = φ i + φ d + φ r
where φi is the incident potential. φd is the diffraction potential. φr is the radiation potential.

2.2. Equations of Motion

For the present device, the frequency domain motion equation is expressed as [40]:
ω 0 2 m k + A kk Z k A kj ω 0 2 Z j + i ω 0 B kk Z k + i ω 0 B kj Z j + F PTO + F vis , k + F H , k = F e , k ω 0 2 m j + A jj Z j ω 0 2 A jk Z k + i ω 0 B jj Z j + i ω 0 B jk Z k F PTO + F vis , j + F H , j + F M = F ej
According to classical dynamics theory, the time domain motion equation of the present device is:
m k + A kk Z ¨ k t + A kj Z ¨ j t + B kk z ˙ k t + B kj z ˙ j t + F PTO t + F vis , k t + F H , k t = F e , k t m j + A jj Z ¨ j t + A jk Z ¨ k t + B jj z ˙ j t + B jk z ˙ k t F PTO t + F vis , j t + F H , j t + F M t = F e , j t
where Akk and Bkk are the added mass and radiation damping on the float due to its unit amplitude motion, respectively. Ajj and Bjj are the added mass and radiation damping on the main buoy due to its unit amplitude motion, respectively. mk and mj are the masses of the float and main buoy, respectively. Akj and Bkj are the added mass and radiation damping coefficients on the main buoy due to the float’s unit amplitude motion. Ajk and Bjk are the added mass and radiation damping on the float due to the main buoy’s unit amplitude motion. ω0 is the wave frequency. FPTO,k and FPTO,j are the PTO damping forces on the float and main buoy, respectively. Fvis,k and Fvis,j are the viscous forces on the float and main buoy, respectively. FH,k and FH,j are the hydrostatic restoring forces on the float and main buoy, respectively. Fe,k and Fe,j are the wave excitation forces on the float and main buoy, respectively. Zk and Zj are the displacements of the float and main buoy, respectively. FM is the mooring force on the main buoy.

2.3. Energy Capture Power

The mean absorbed power is obtained from the product of the relative velocity between the float and main buoy and the PTO damping force [5]:
P = 1 N Δ t l = 0 N 1 F P T O ( Z k , l Δ t + Δ t Z j , l Δ t + Δ t ) ( Z k , Δ t Z j , Δ t )
where ∆t is the sampling time interval. N is the number of samples. Zi,t is the position of the main buoy at time ∆t. Zj,t is the position of the float at time ∆t.
The incident wave power per unit width, denoted as Pwave, is expressed as:
P wave = ρ g H 2 L 16 T 1 + 2 c d sinh ( 2 c d )
where ρ is the seawater density. g is the gravitational acceleration. H is the wave height. L is the wavelength. T is the wave period. c is the wave celerity. d is the water depth.
The capture width ratio is defined as:
R CW = P 2 R P wave
where R is the radius of the float.

3. Numerical Modeling

3.1. Model Design

The SDU-II, a conventional two-body WEC, primarily consists of a float, main buoy, damping plate, PTO system, and mooring system. The damping plate is a fully enclosed solid damping plate. However, this device exhibits deficiencies such as poor stability and suboptimal power absorption during operation. To enhance the stability and power absorption of two-body WECs, this study proposes dish-shaped buoy and perforated damping plate configurations based on the SDU-II WEC.
To investigate the effects of the two configurations on the device’s frequency domain response, motion response, mooring response, and power absorption, four model designs were developed with and without a perforated damping plate and a dish-shaped buoy, while maintaining constant draft depth and mooring conditions. The structural forms of the four WECs are shown in Figure 2.
Figure 2a shows the simplified configuration—solid damping plate WEC (SC-S), which lacks the dish-shaped buoy and employs a solid damping plate. This represents the prototype of the conventional SDU-II WEC. The main buoy employs a solid damping plate below its hull and has no appendages.
Figure 2b shows the simplified configuration—perforated damping plate WEC (SC-P), which lacks the dish-shaped buoy and employs a perforated damping plate. To investigate the effect of damping plate perforations on the device stability and power absorption, the SC-P was developed by replacing the solid damping plate in the SC-S with a perforated version.
Figure 2c shows the disc buoy—solid damping plate WEC (DB-S), which features a dish-shaped buoy and a solid damping plate. To examine the effect of the dish-shaped buoy on power absorption, the DB-S was derived from the SC-S by adding a dish-shaped buoy to the main buoy, while retaining the solid damping plate.
Figure 2d shows the disc buoy—perforated damping plate WEC (DB-P), which features a dish-shaped buoy and a perforated damping plate. To examine the effects of the dish-shaped buoy under perforated damping plate conditions and the effects of the perforated damping plate with the dish-shaped buoy present, the DB-P was developed by adding a dish-shaped buoy to the main buoy and adopting a perforated damping plate, enabling comparisons with both SC-P and DB-S.

3.2. Hydrodynamic Numerical Model

Based on the three-dimensional models of the four WECs in Figure 2, this section establishes their frequency domain and time domain numerical models using the hydrodynamic analysis software AQWA 2023.
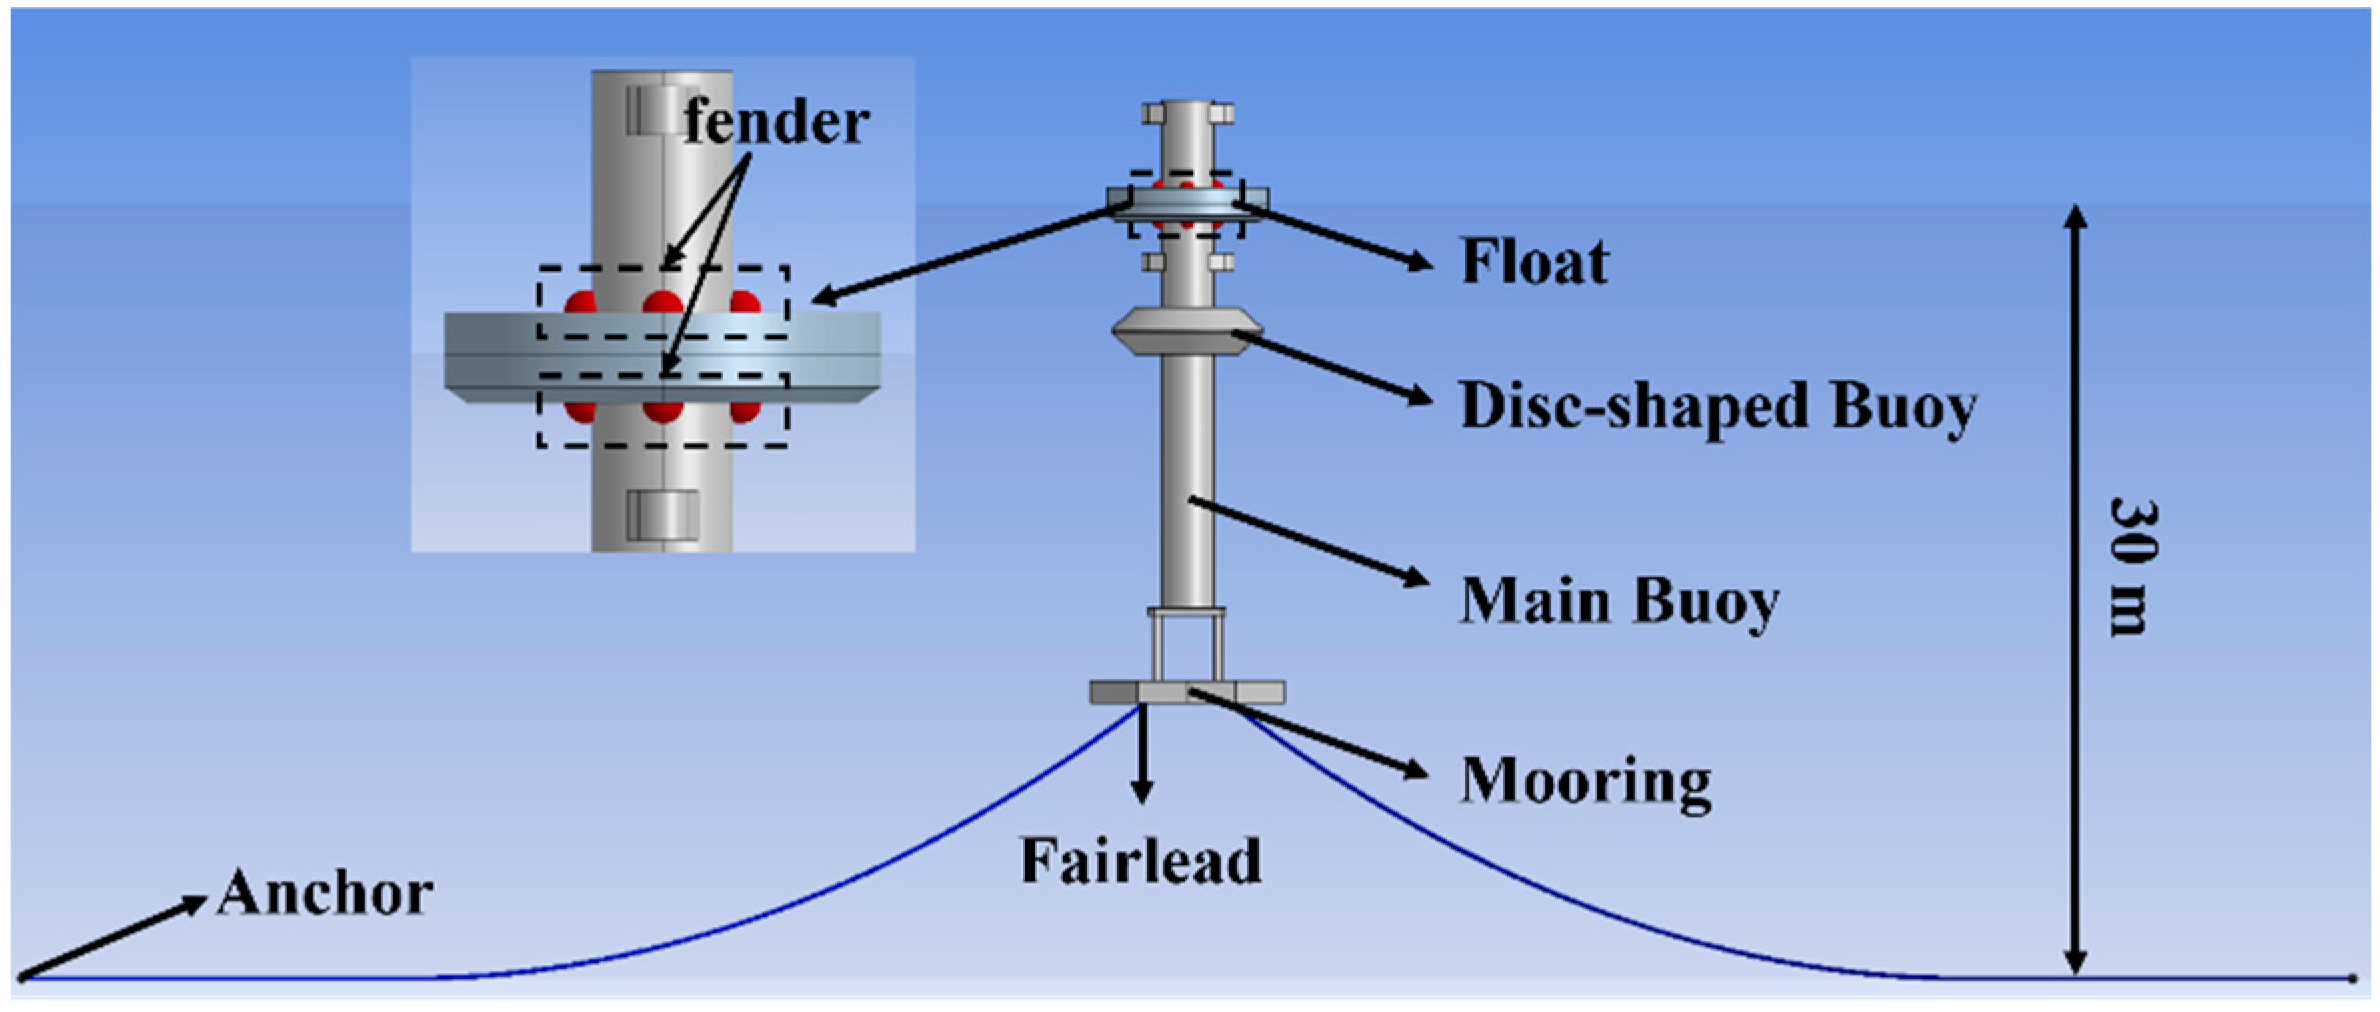
The key parameters of the four WECs are summarized in Table 2. To maintain positioning stability during wave exposure, a four-point mooring system is employed, as shown in Figure 3. Mooring points are positioned at the damping plate base, with the coordinate origin at the WEC center and a mooring radius of 64.2 m. Table 3 lists the detailed mooring cable parameters and anchor coordinates.
To simulate the heave motion of the float relative to the main buoy and constrain it to move only in this vertical degree of freedom, the fender elements within ANSYS AQWA 2023 are employed. The float and the main buoy are modeled as two rigid bodies connected via nonlinear contact constraints. A total of eight fender elements are configured: four positioned at the upper interface and four at the lower interface between the float and the main buoy. These fenders generate a high repulsive force upon compression. This effectively couples the pitch and roll motions of the float and the main buoy, while permitting unrestricted relative heave motion. The PTO damping coefficient is calibrated based on sea trial data and set to 2.0 × 10⁵ N·s/m. The numerical model simplifies the truss structure and PTO system while retaining the main buoy, float, mooring system, damping plate, and dish-shaped buoy, as shown in Figure 4.

3.3. Model Validation

To ensure the reliability of the numerical models developed for the four two-body WECs, this section validates them against experimental data obtained during the SDU-III sea trial.
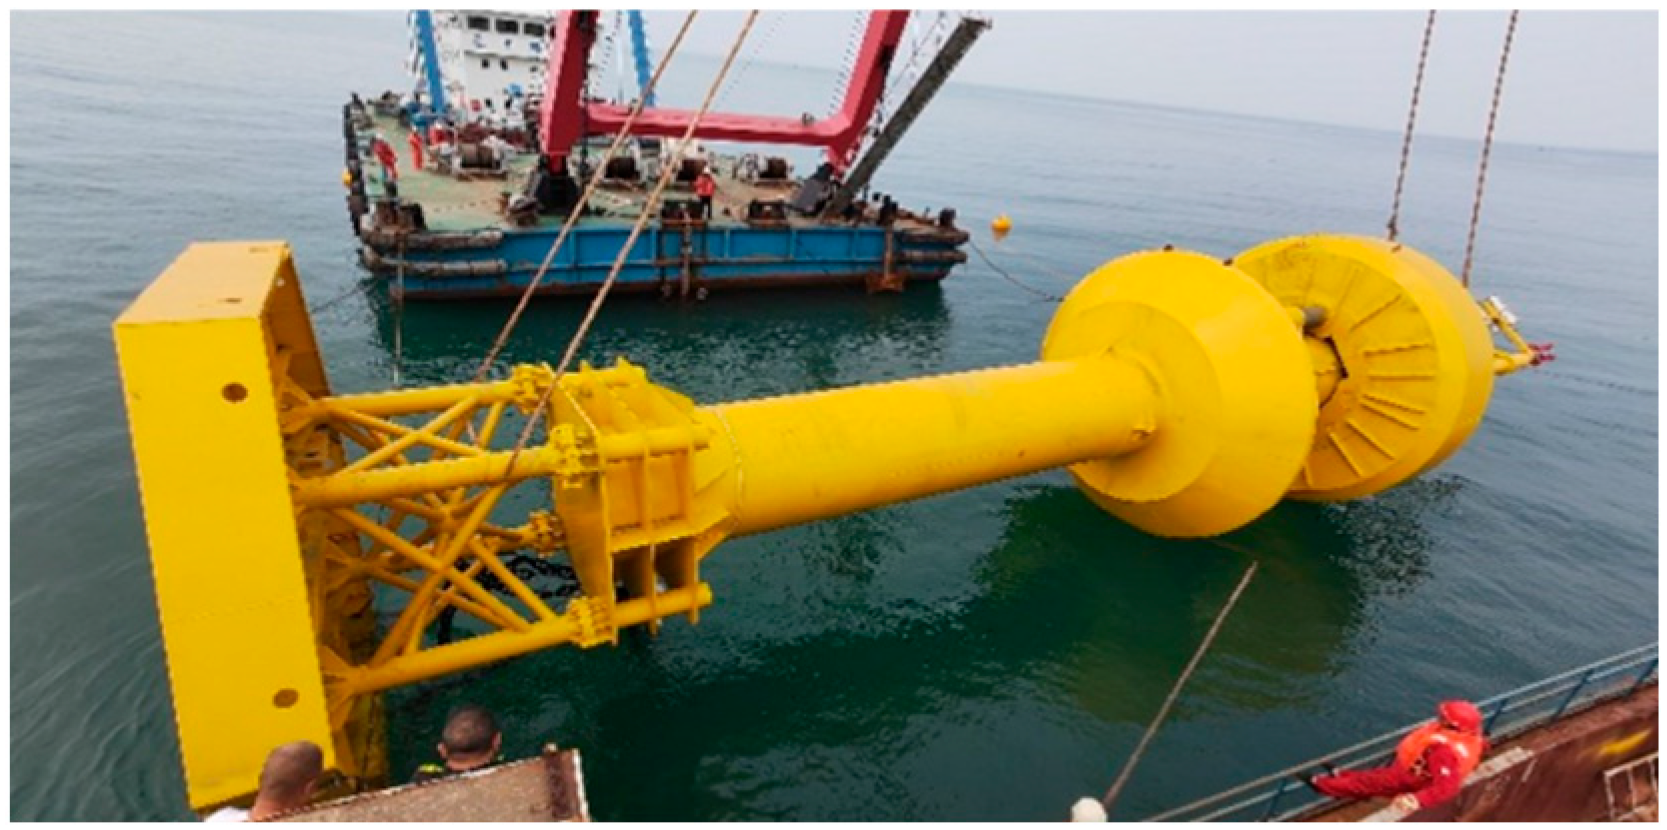
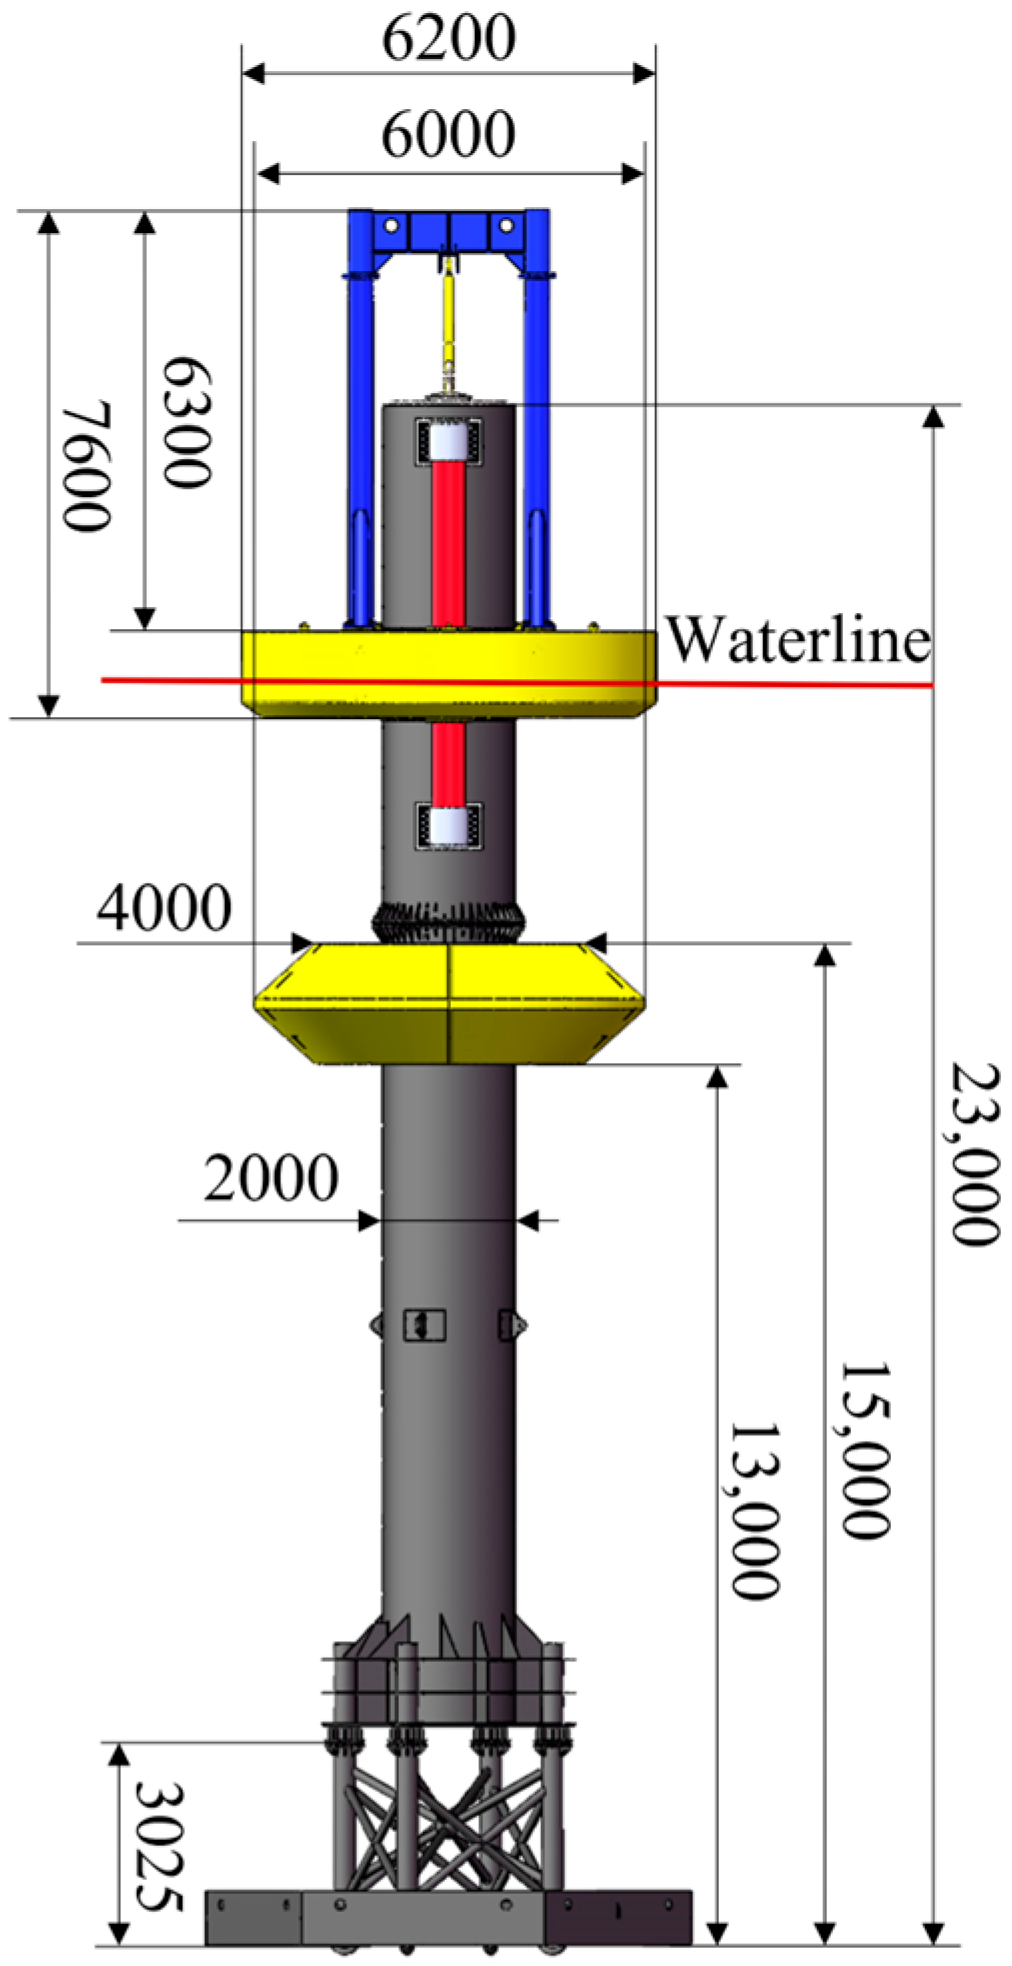
This study developed a 110 kW two-body WEC, named the SDU-III, based on the DB-P configuration presented in Figure 2d The overall structure of the SDU-III, illustrated in Figure 5, comprises six main components: the float, main buoy, disc-shaped buoy, damping plate, PTO system, and mooring system. The operating principle involves converting the kinetic energy of the floats induced by wave motion first into hydraulic energy via the PTO system, and subsequently, into electrical energy. A photograph of the sea trial model is shown in Figure 6. The generated electricity is transmitted to shore via subsea cables and converted into stable, grid-compatible power by power conditioning systems. The control system switches between generators of different rated power capacities based on the prevailing wave conditions. This strategy enhances the overall generator utilization efficiency and protects lower-rated generators from overcurrent conditions during high energy wave events. Table 4 lists the key geometric parameters of the SDU-III, and Figure 7 presents its design schematic, derived from those parameters.
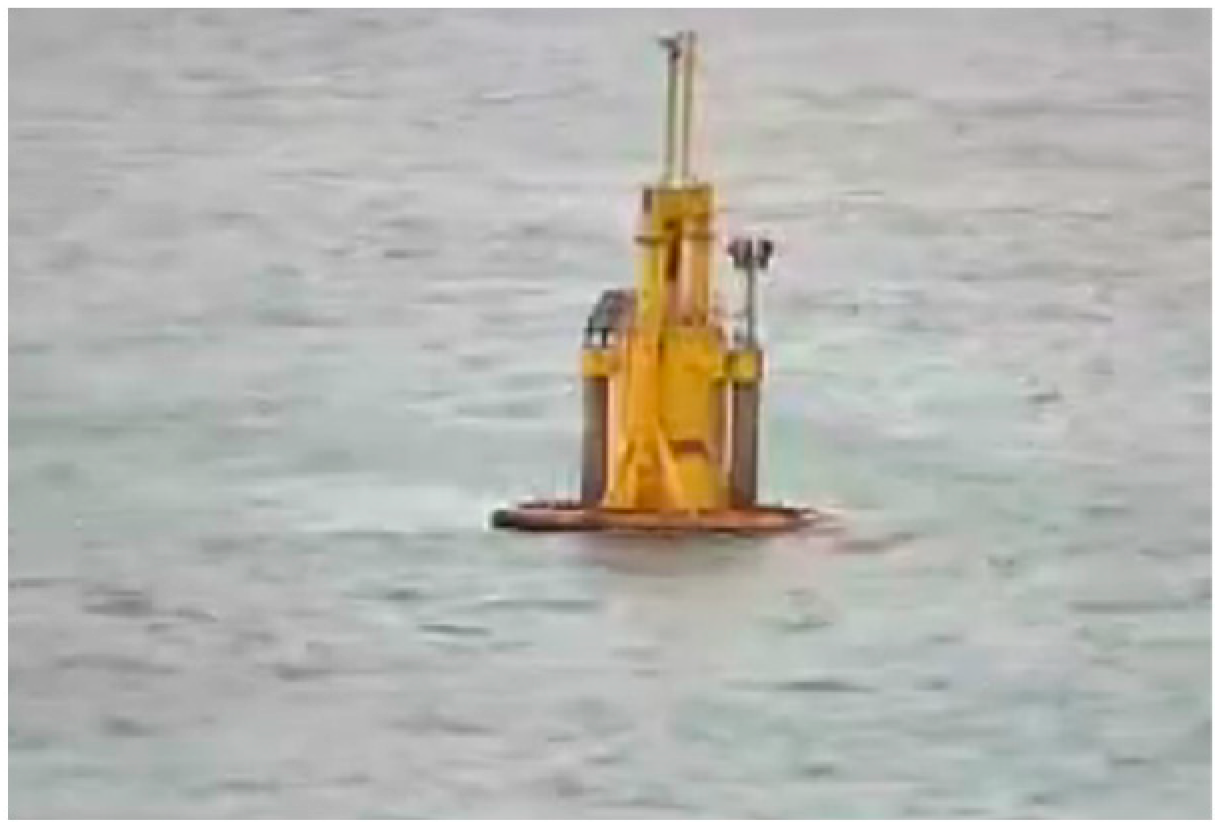
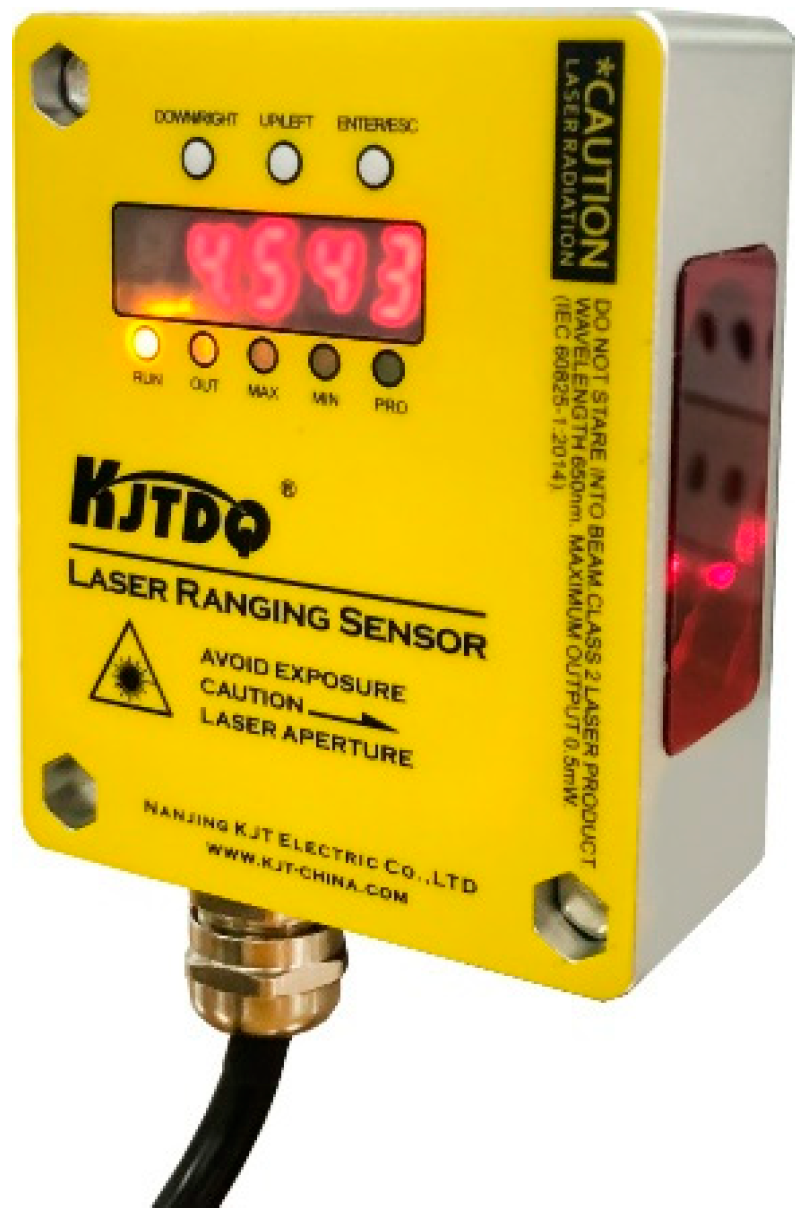
The SDU-III WEC was deployed in the waters near Tuoji Island, Yantai City, Shandong Province, China. Figure 8 shows the location of the study area. The operational water depth at the deployment site is 30 m. Figure 9 illustrates the WEC’s operational performance during sea trials. The laser displacement sensor shown in Figure 10 is mounted at the base of the piston rod to measure the peak-to-peak relative displacement. The peak-to-peak value is defined as the absolute difference between the maximum and minimum values within a single oscillation cycle of this relative displacement time series.
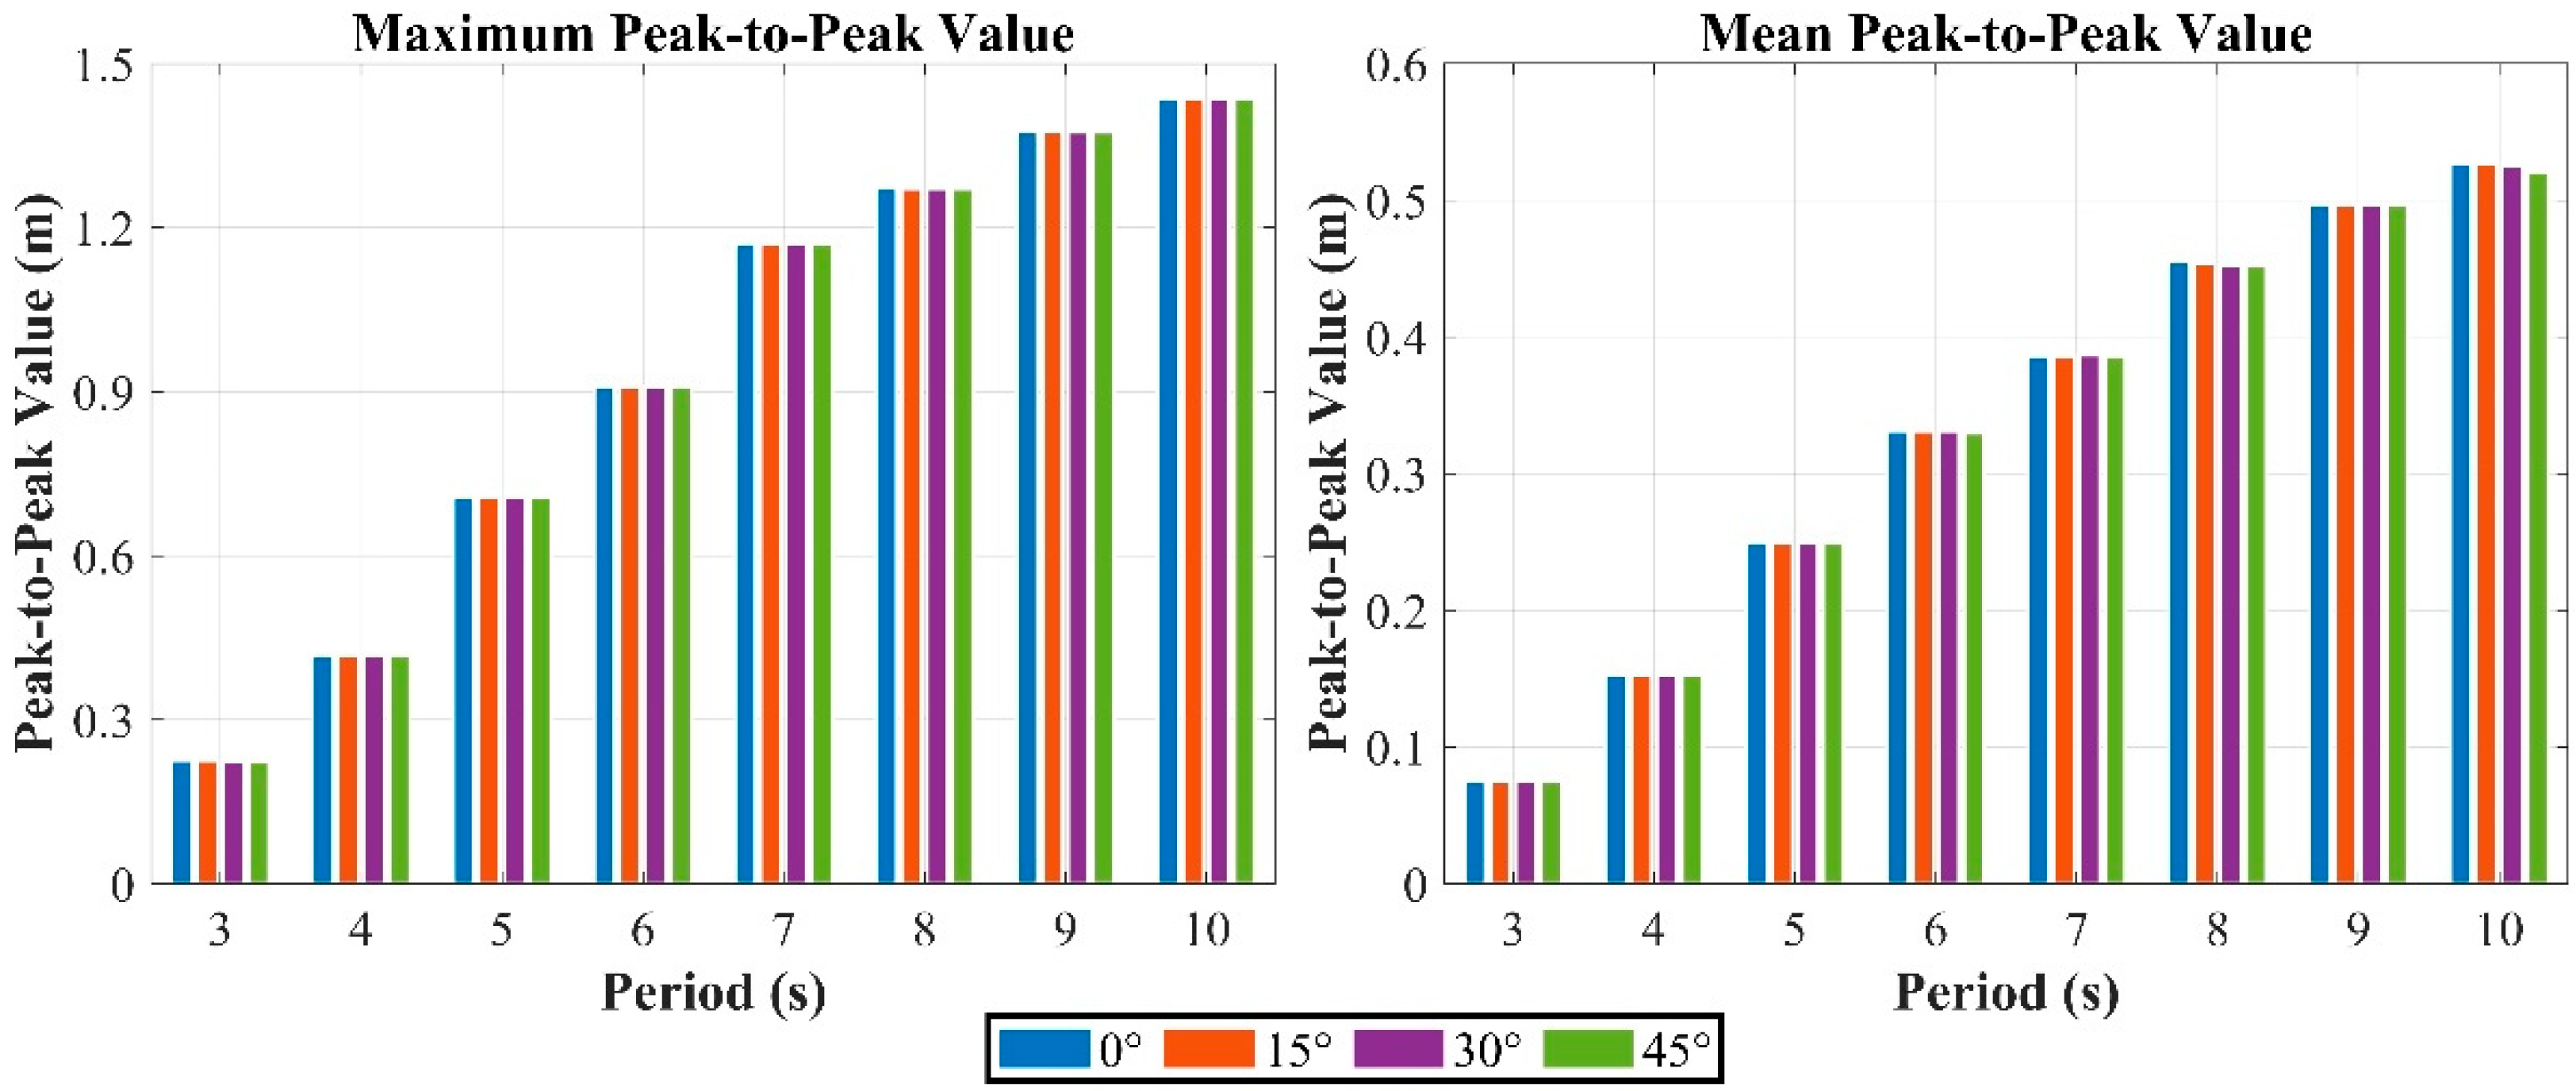
To account for the influence of wave directionality and mitigate its potential confounding effect on the experimental error, this study investigated the impact of the wave incidence angle on the peak-to-peak relative displacement of the SDU-III WEC. Simulations were conducted under two distinct wave condition sets: constant wave height with varying wave periods and constant wave period with varying wave heights. The relative displacement between the float and the main buoy exhibits periodic oscillations under wave excitation. The peak-to-peak value is defined as the absolute difference between the maximum and minimum values within a single oscillation cycle of this relative displacement time series. Owing to the symmetry of the SDU-III WEC design, wave incidence angles of 0°, 15°, 30°, and 45° were selected for investigation. Irregular waves were simulated using the JONSWAP spectrum, with each simulation run having a duration of 3600 s. For each investigated wave condition, five numerical realizations using distinct random seeds were performed to account for wave stochasticity. The reported results are the mean values from these realizations.
Statistical data from one year of deployment at the site show that the wave periods range from 3 to 10 s and the wave heights from 0 to 4 m. When investigating the effects of wave incidence angles under fixed wave height with varying period, the significant wave height was set at 1.2 m, with the peak periods tested at eight values: 3, 4, 5, 6, 7, 8, 9, and 10 s. For a fixed period with varying wave height conditions, the peak period was fixed at 4 s, with significant wave heights tested at 0.5, 1.0, 1.5, 2.0, 2.5, 3.0, 3.5, and 4.0 m. Figure 11 and Figure 12 show the variation of the peak-to-peak values with the wave period and wave height under different wave directions. The left panels show the mean peak-to-peak values, and the right panels show the maximum peak-to-peak values. Both the mean and maximum peak-to-peak values increase as the wave period lengthens and the wave height increases. The peak-to-peak value exhibits better performance under long periods and high wave heights. Different wave incidence angles have little effect on the peak-to-peak value across various wave periods and wave heights. Therefore, a wave incidence angle of 0° was used in this numerical simulation.
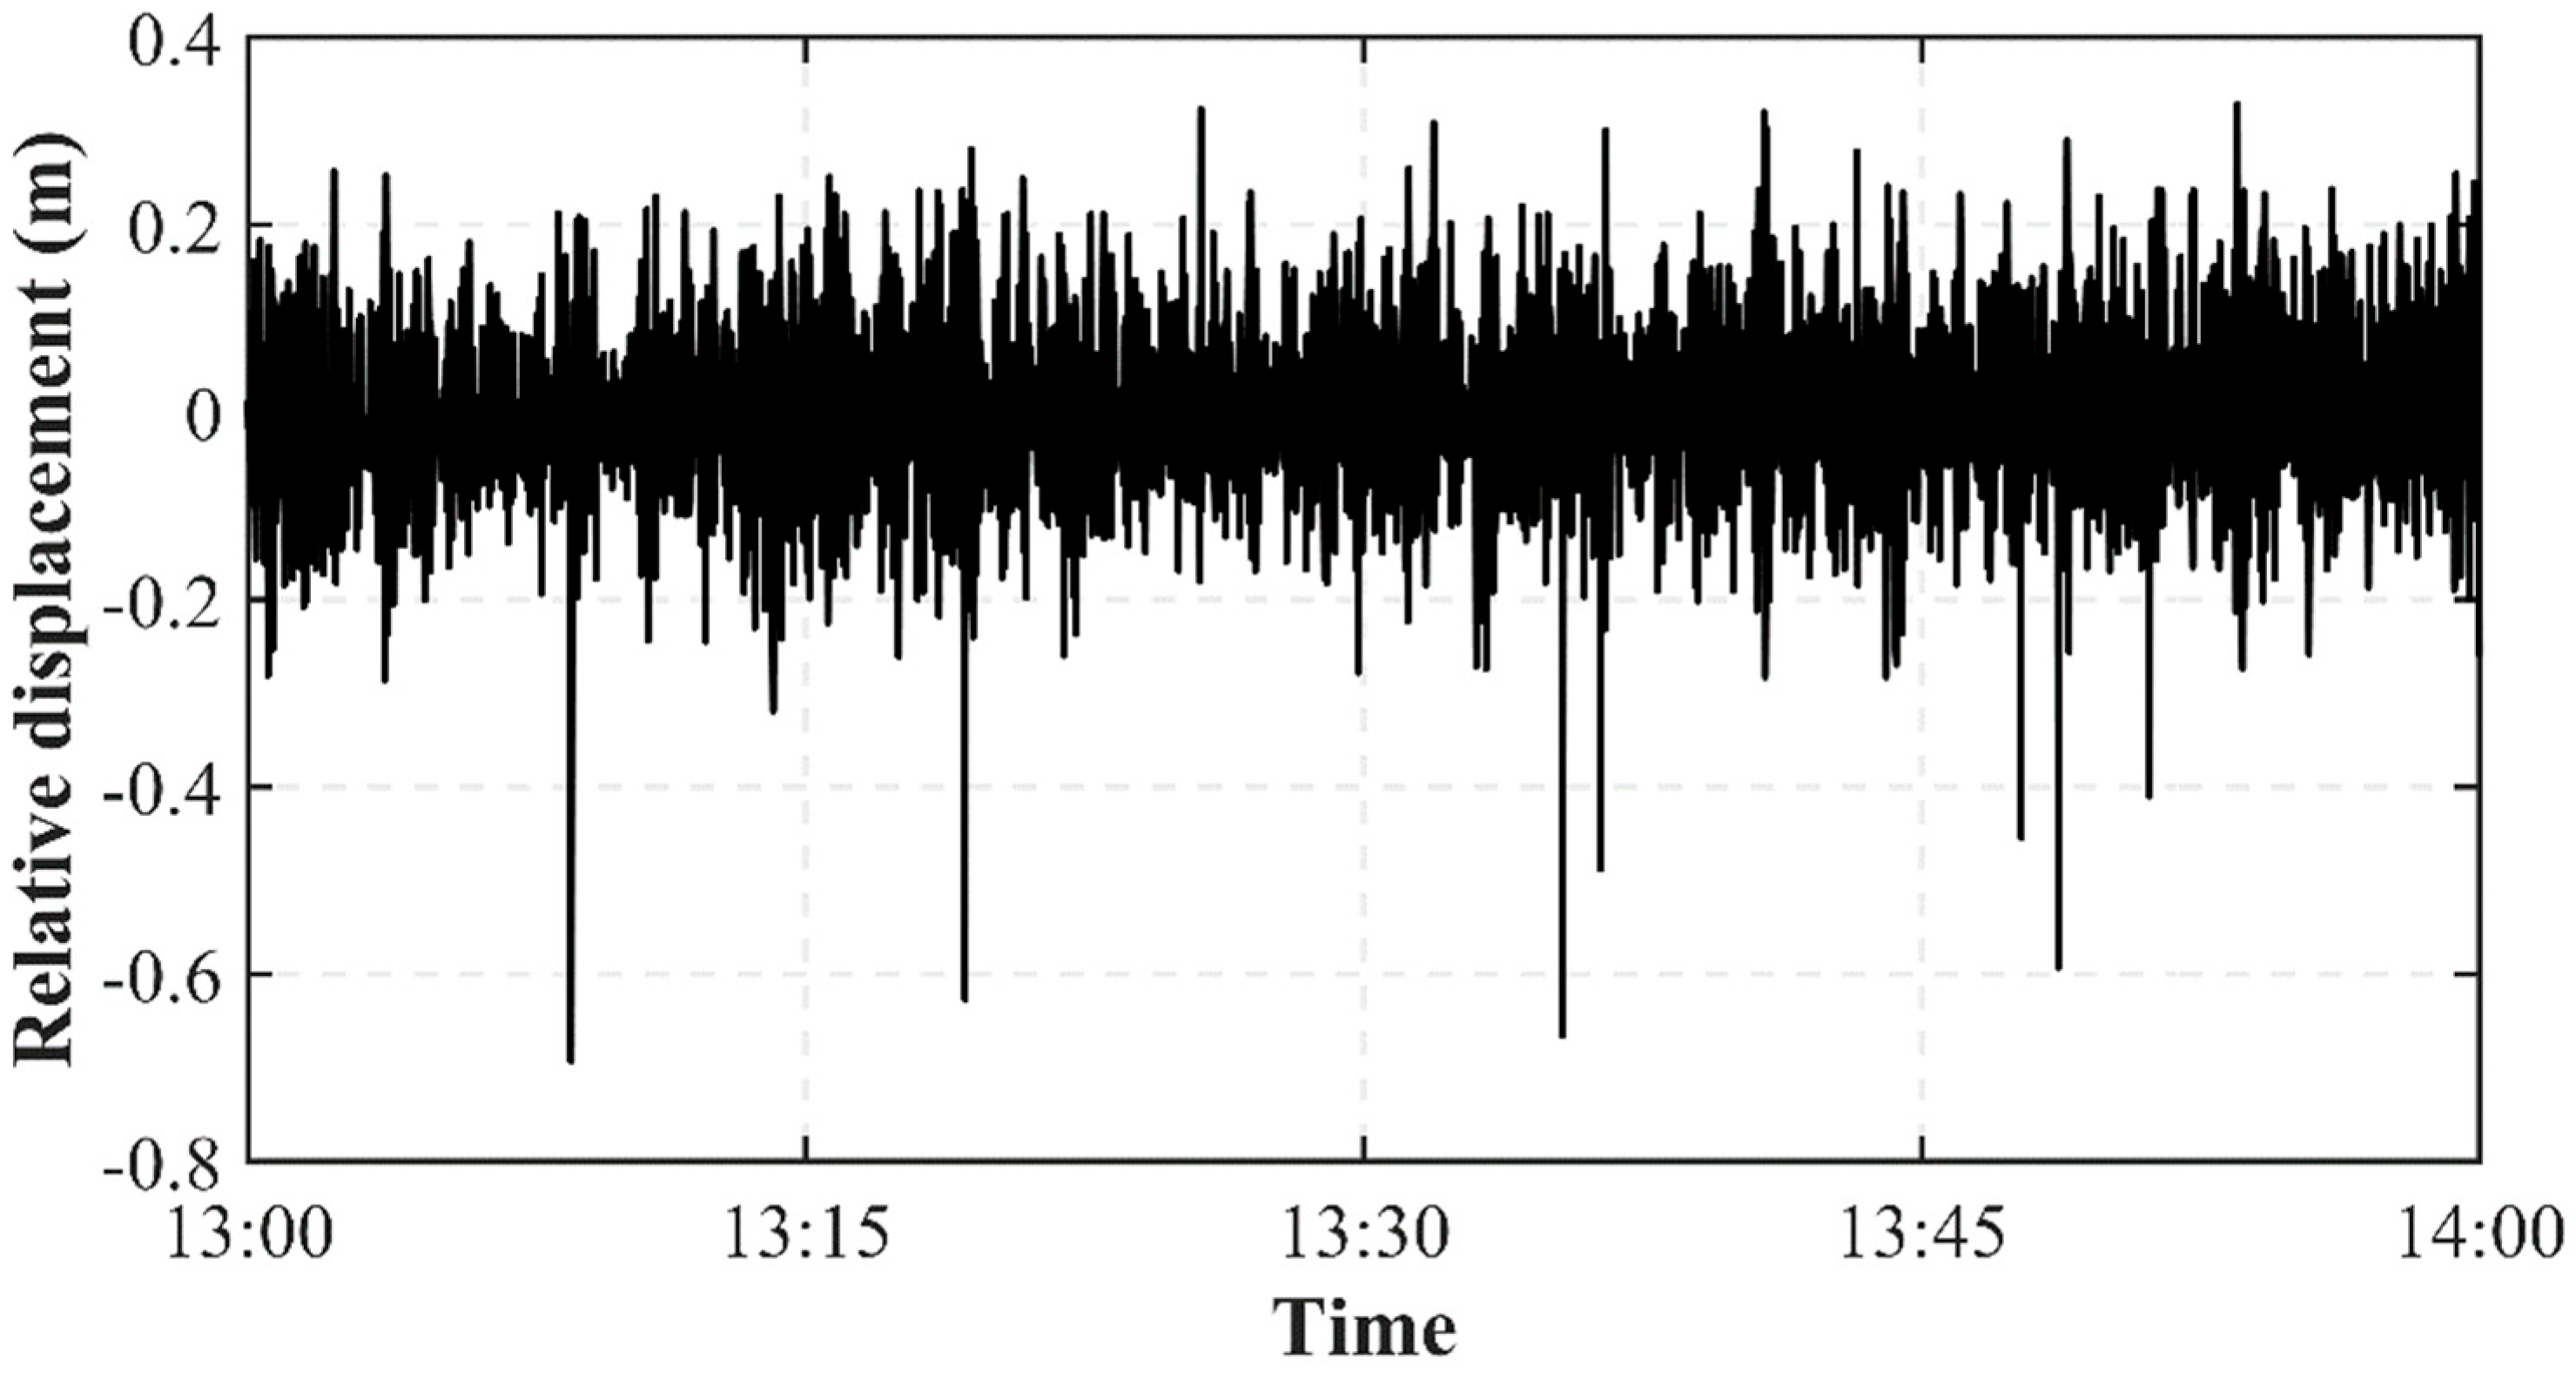
To ensure numerical simulation accuracy, we analyzed the experimental results spanning 11 days from 4 November to 14 November 2023. For each day, we selected one hour of data to analyze the changes in the peak-to-peak values. This period encompassed sea states corresponding to level 3, 4, and 5 waves, thereby covering key operational scenarios from routine operation to survival conditions. Future work will employ this validated model with long-term historical data to assess the device’s annual performance and power generation stability. Table 5 presents the wave parameters determined based on the sea conditions for each day. Figure 13 shows an example of the relative displacement during the period from 13:00 to 14:00 on November 5.
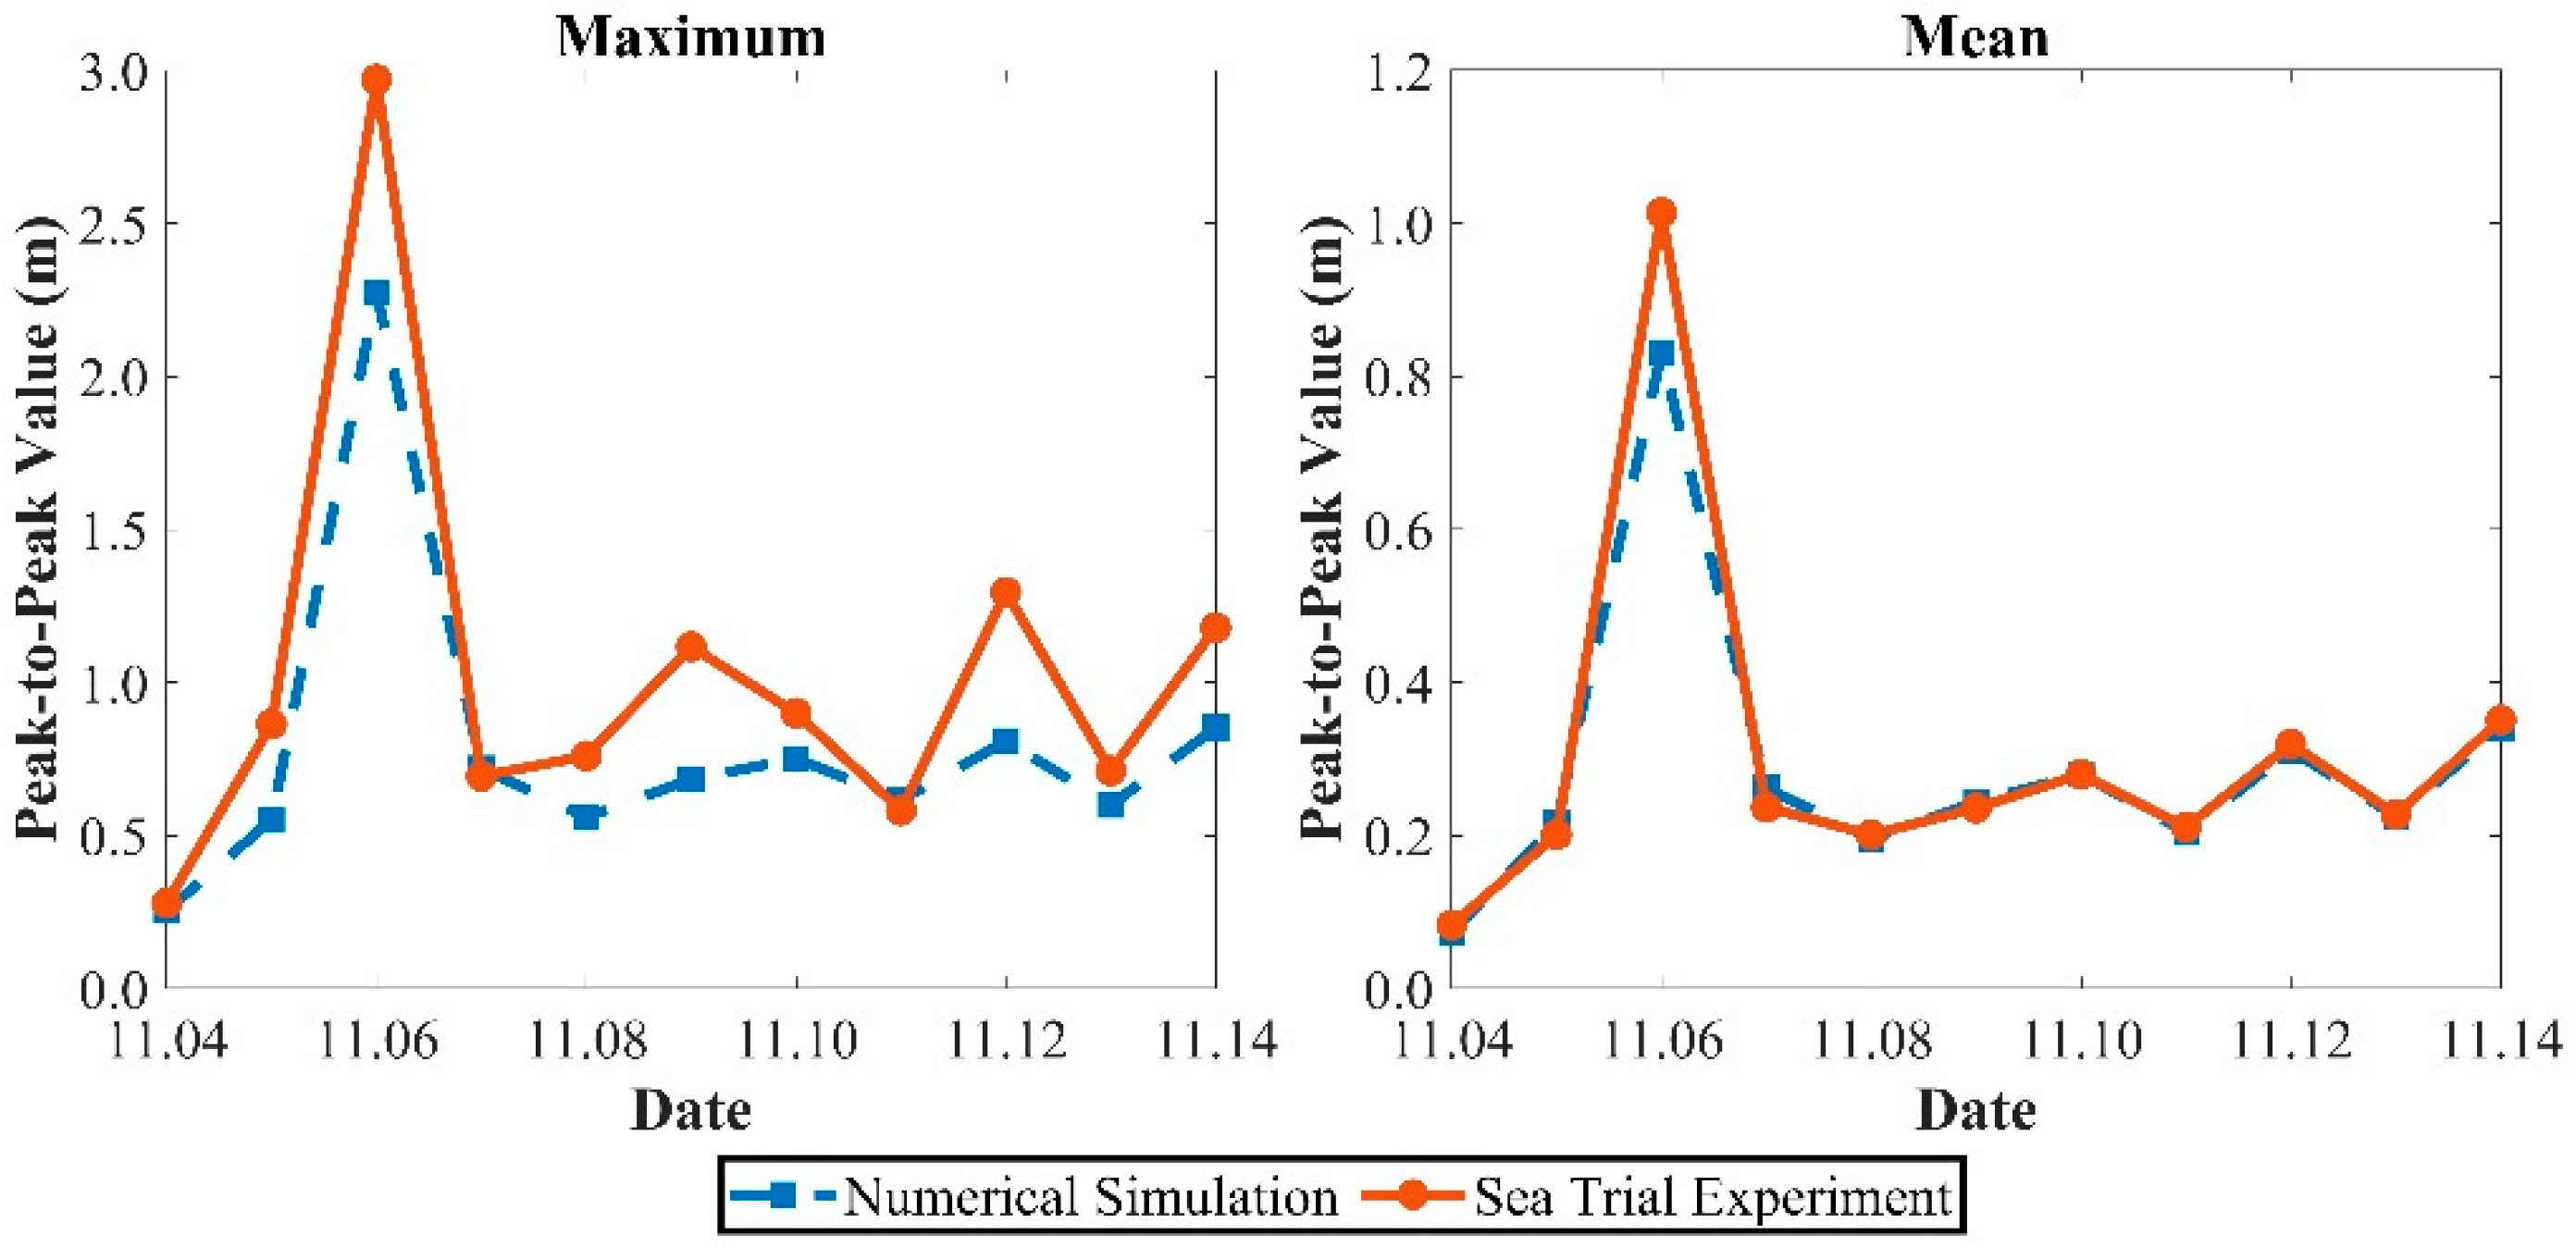
The experiments employed the JONSWAP spectrum for irregular wave simulation, with five distinct random seeds used to derive the averaged statistical properties. Figure 14 presents a comparative analysis between the sea trial measurements and the numerical simulation results. The left panel compares the peak-to-peak maximum values, while the right panel compares the mean peak-to-peak values over the same time periods. Significant discrepancies between the simulated and experimental data are observed for both the mean and maximum values under the level 5 sea state recorded on 6 November. In contrast, the differences are relatively small under the level 3 and 4 sea states, with the simulated mean values showing good agreement with the experimental measurements. Figure 15 displays the relative errors between the sea trials and the numerical simulations. Analysis of the 11-day dataset reveals that the errors in the mean peak-to-peak values are generally smaller than those in the maximum peak-to-peak values. The level 5 sea state on November 6 shows larger errors in the mean values compared to the level 3 and 4 conditions. Under mild sea states, the mean peak-to-peak values agree well with the experimental data, with errors of around 10%. Under more severe conditions, the errors are slightly larger but remain within 20% for the mean relative displacement values. Due to the inherent randomness of field measurements, the errors in the maximum peak-to-peak values are generally larger, with relative displacement errors within 40%. Overall, the error levels are considered acceptable, demonstrating the reliability of the numerical model.

4. Results and Discussion

4.1. Frequency Domain

Prior to domain response analysis of the WECs, frequency domain analysis based on potential flow theory is essential. Given the structural symmetry, the surge, heave, and pitch degrees of freedom at 0° wave incidence were analyzed. The frequency range spanned 0.1–5 rad/s.
Response amplitude operators (RAOs) quantify the phase relationship of the motion response to wave excitation and the power absorption characteristics. Figure 16 shows RAO curves for the surge, heave, and pitch of the main buoys. Their surge and heave RAOs exhibit higher values with distinct low-frequency characteristics in the low-frequency region. The pitch RAOs change rapidly between 1.3 and 1.5 rad/s, with steep curves peaking in this range. The heave and pitch RAOs show secondary peaks at 0.7–0.9 rad/s and 0.2–0.3 rad/s, respectively. The main buoys with dish-shaped buoys show higher surge and heave RAOs but lower pitch RAOs. The differences in the surge RAOs are marginal, whereas the heave and pitch RAOs show significant variations. The peak RAO frequency range is narrower for the main buoys with dish-shaped buoys than without. Perforations in the damping plates minimally affect the surge, heave, and pitch RAO magnitudes. Solid damping plates yield slightly higher RAOs with narrower peak frequency ranges than perforated plates. The dish-shaped buoy significantly enhances the WEC’s power absorption potential and stability performance. While the perforated damping plate exhibits lower power absorption potential, it provides superior stability characteristics.
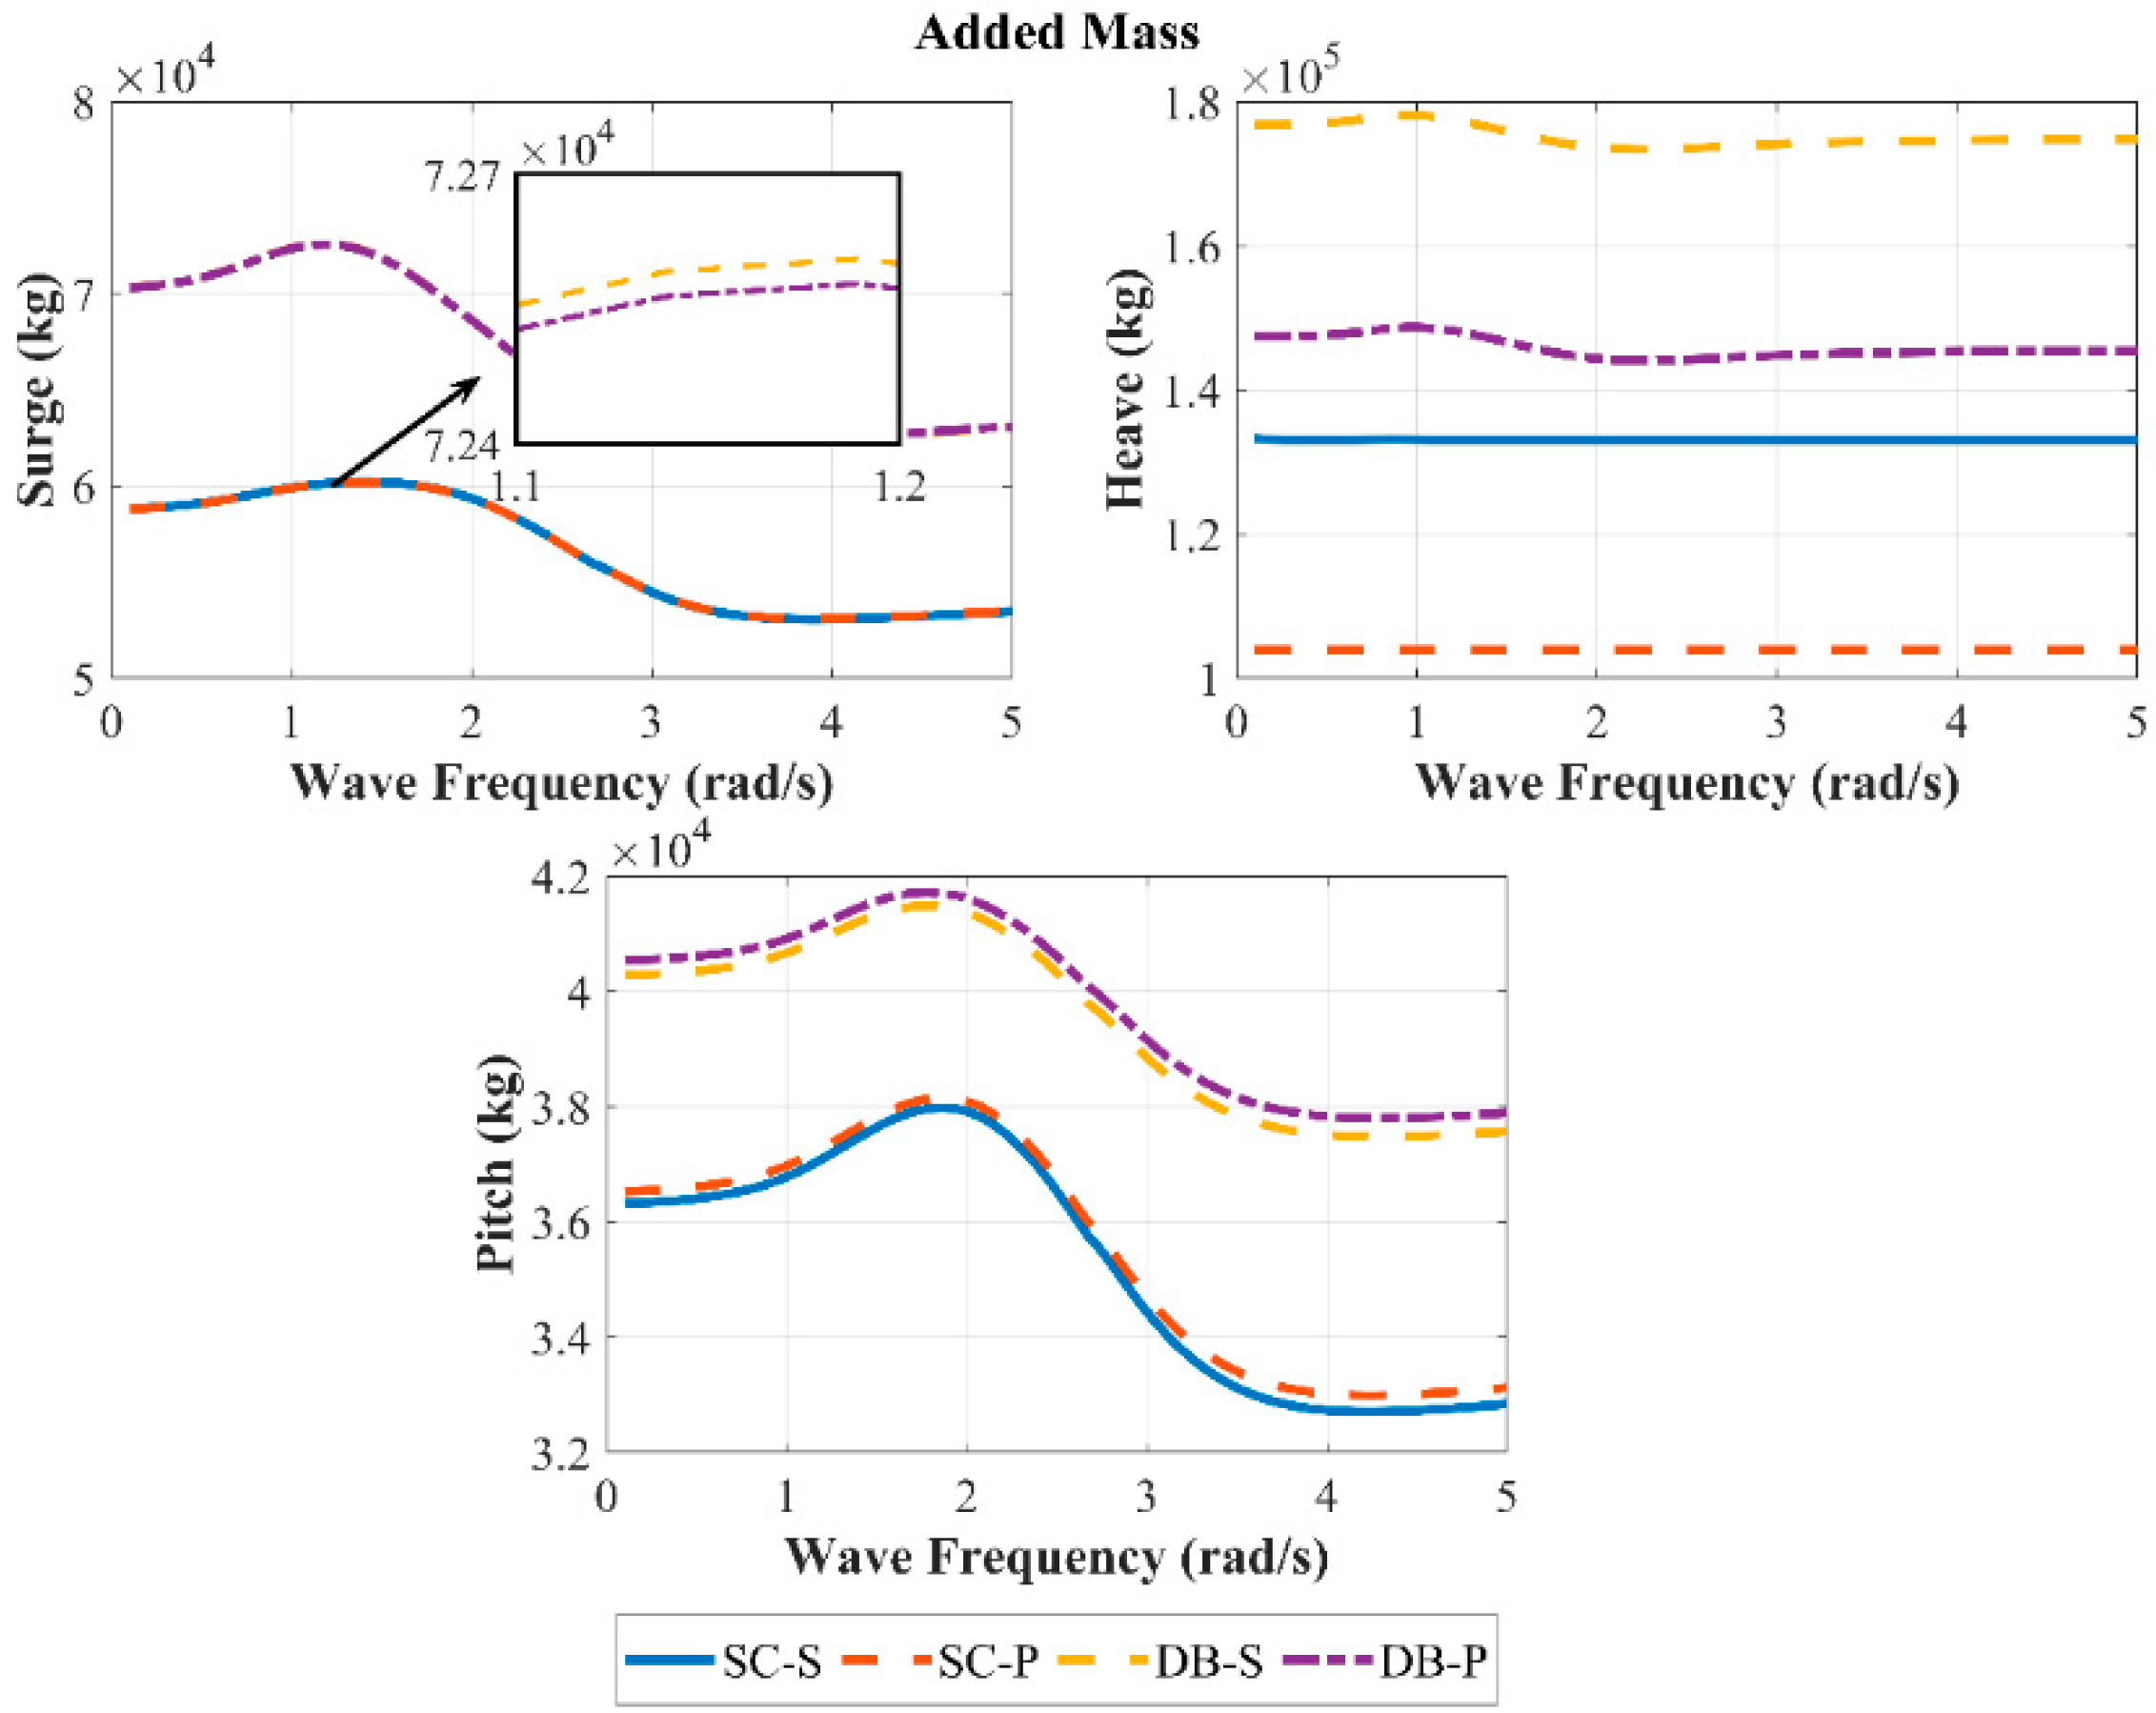
The added mass represents the inertial effect due to fluid motion relative to the body, being especially crucial for two-body systems. Figure 17 presents the added mass variations for the surge, heave, and pitch degrees of freedom of the main buoys. The added mass for all the main buoys initially increases, then decreases, before increasing again across surge, heave, and pitch. For surge, the peak added mass occurs near 1.2 rad/s and the minimum near 3.7 rad/s. Heave peaks near 1 rad/s and reaches minimum near 2 rad/s. Pitch peaks near 1.8 rad/s with a minimum at 4.2 rad/s. The main buoys with dish-shaped buoys exhibit significantly higher added mass in surge, heave, and pitch than those without. Their peak added mass frequencies are also lower than in the simplified configuration. The perforated damping plate exhibits lower added mass in surge and heave, but higher values in pitch, with a particularly significant reduction in heave. Although the dish-shaped buoy exhibits lower response amplitudes, it enhances mooring stability. The perforated damping plate offers both enhanced response characteristics and favorable stability performance.
Radiation damping quantifies the energy dissipation through wave radiation, governing the power absorption potential. The radiation damping curves of the four main buoys are presented in Figure 18. The radiation damping for the surge, heave, and pitch motions of all four main buoys exhibits consistent trends: initially increasing then decreasing with rising wave frequency. The peak radiation damping for surge occurs between 2.4 and 2.9 rad/s, while for heave, it ranges from 1.1 to 1.7 rad/s. The peak radiation damping for pitch occurs near 3 rad/s. In the surge and heave directions, the disc-shaped buoy enhances radiation damping. For pitch motion, however, the disc-shaped buoy reduces radiation damping and shifts the peak frequency: decreasing for surge but increasing for heave. The solid damping plate provides higher radiation damping than the perforated counterpart in the surge, heave, and pitch motions. The solid damping plate exhibits higher radiation damping in the surge, heave, and pitch directions than the perforated counterpart. The dish-shaped buoy and perforated damping plate significantly suppress the peak motion responses of the main buoy, enhancing device stability.
The wave excitation force drives the device. The wave excitation force variations for the four main buoys are presented in Figure 19. For the surge, heave, and pitch degrees of freedom, all four main buoys exhibit wave excitation forces that generally increase initially then decrease with rising wave frequency. The surge excitation force peaks between 1.4 and 1.9 rad/s. The heave excitation force shows relatively high values at low frequencies, with a primary peak occurring at 0.9–1.2 rad/s and a secondary peak near 4.8 rad/s. For pitch excitation, the main peak appears at 2.2–2.4 rad/s and a secondary peak at 0.4–0.5 rad/s. The main buoys with the disc-shaped buoy yield greater wave excitation forces in surge and heave. Their corresponding peak frequencies for heave and pitch are higher than those without the buoy. The solid damping plate exhibits higher wave excitation forces than the perforated plate in the surge, heave, and pitch motions. The dish-shaped buoy and perforated damping plate enhance stability in pitch, with the former exhibiting high power absorption potential.

4.2. Motion Response

This study presents a systematic statistical analysis of one-year wave observation data from the deployment site of the WEC. The recorded waves predominantly occurred in sea states 3, 4, and 5 during the observation period. The most representative wave cases for each sea state were selected. Key parameters are summarized in Table 6.
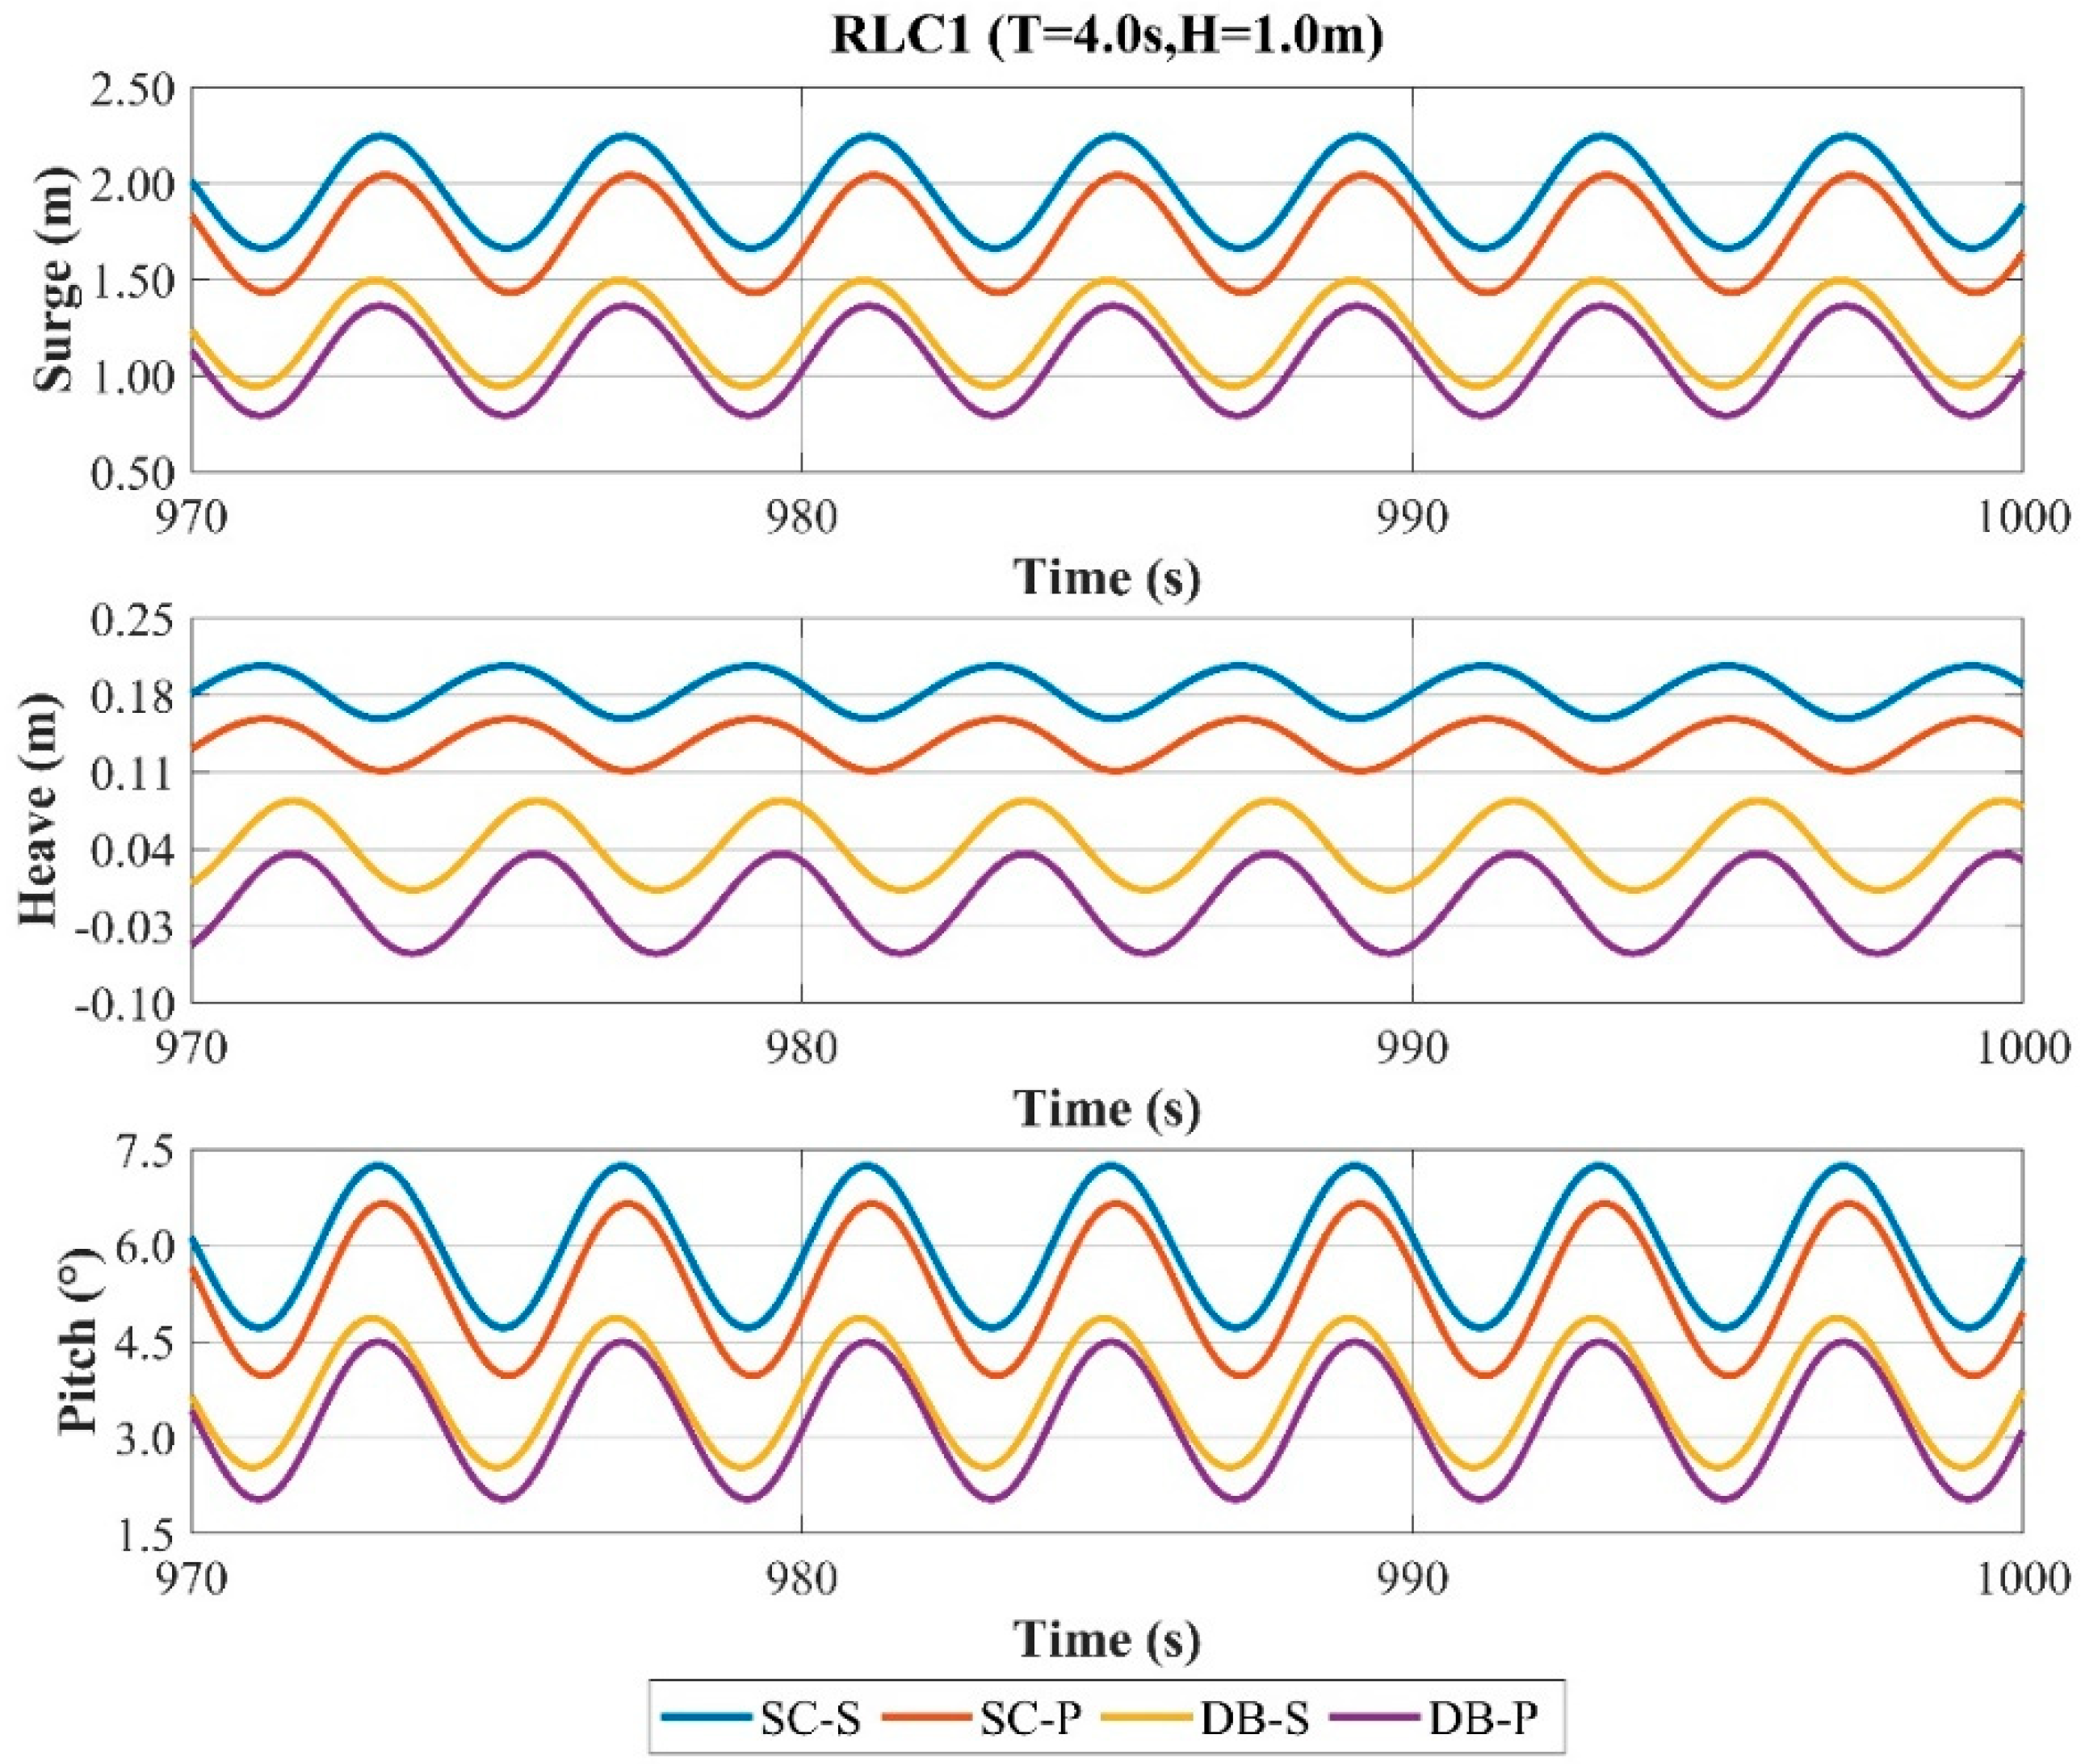
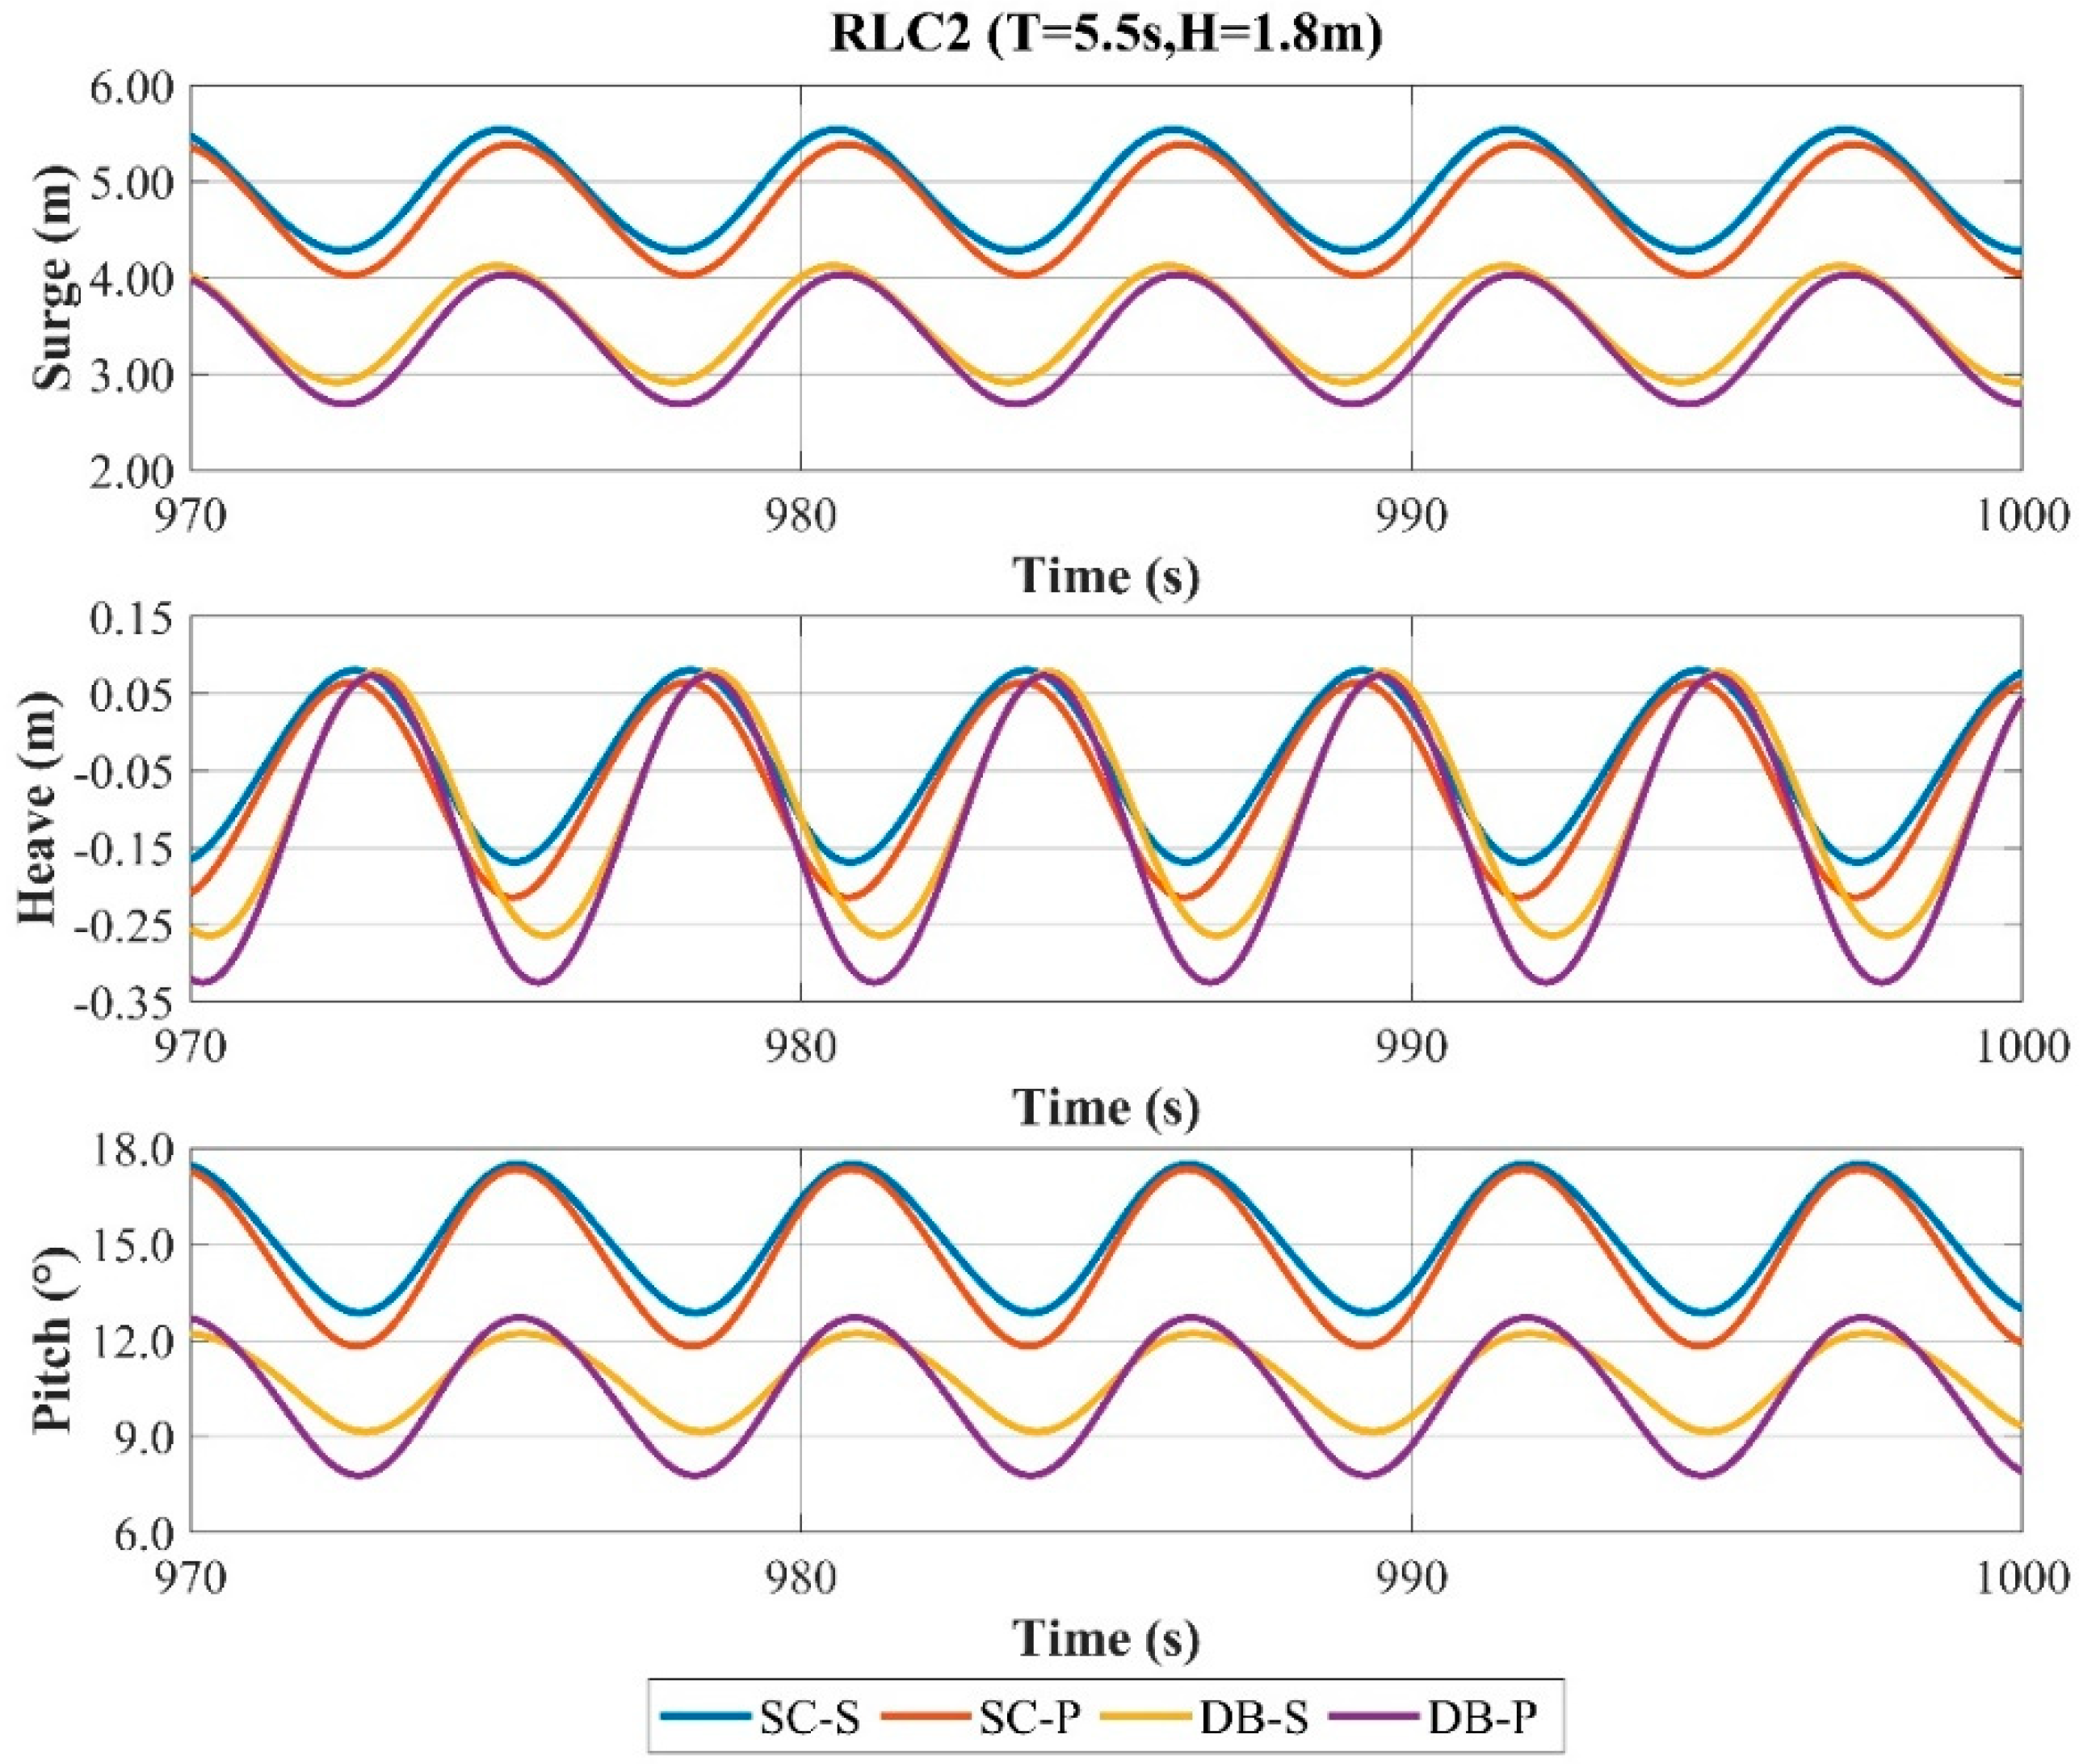
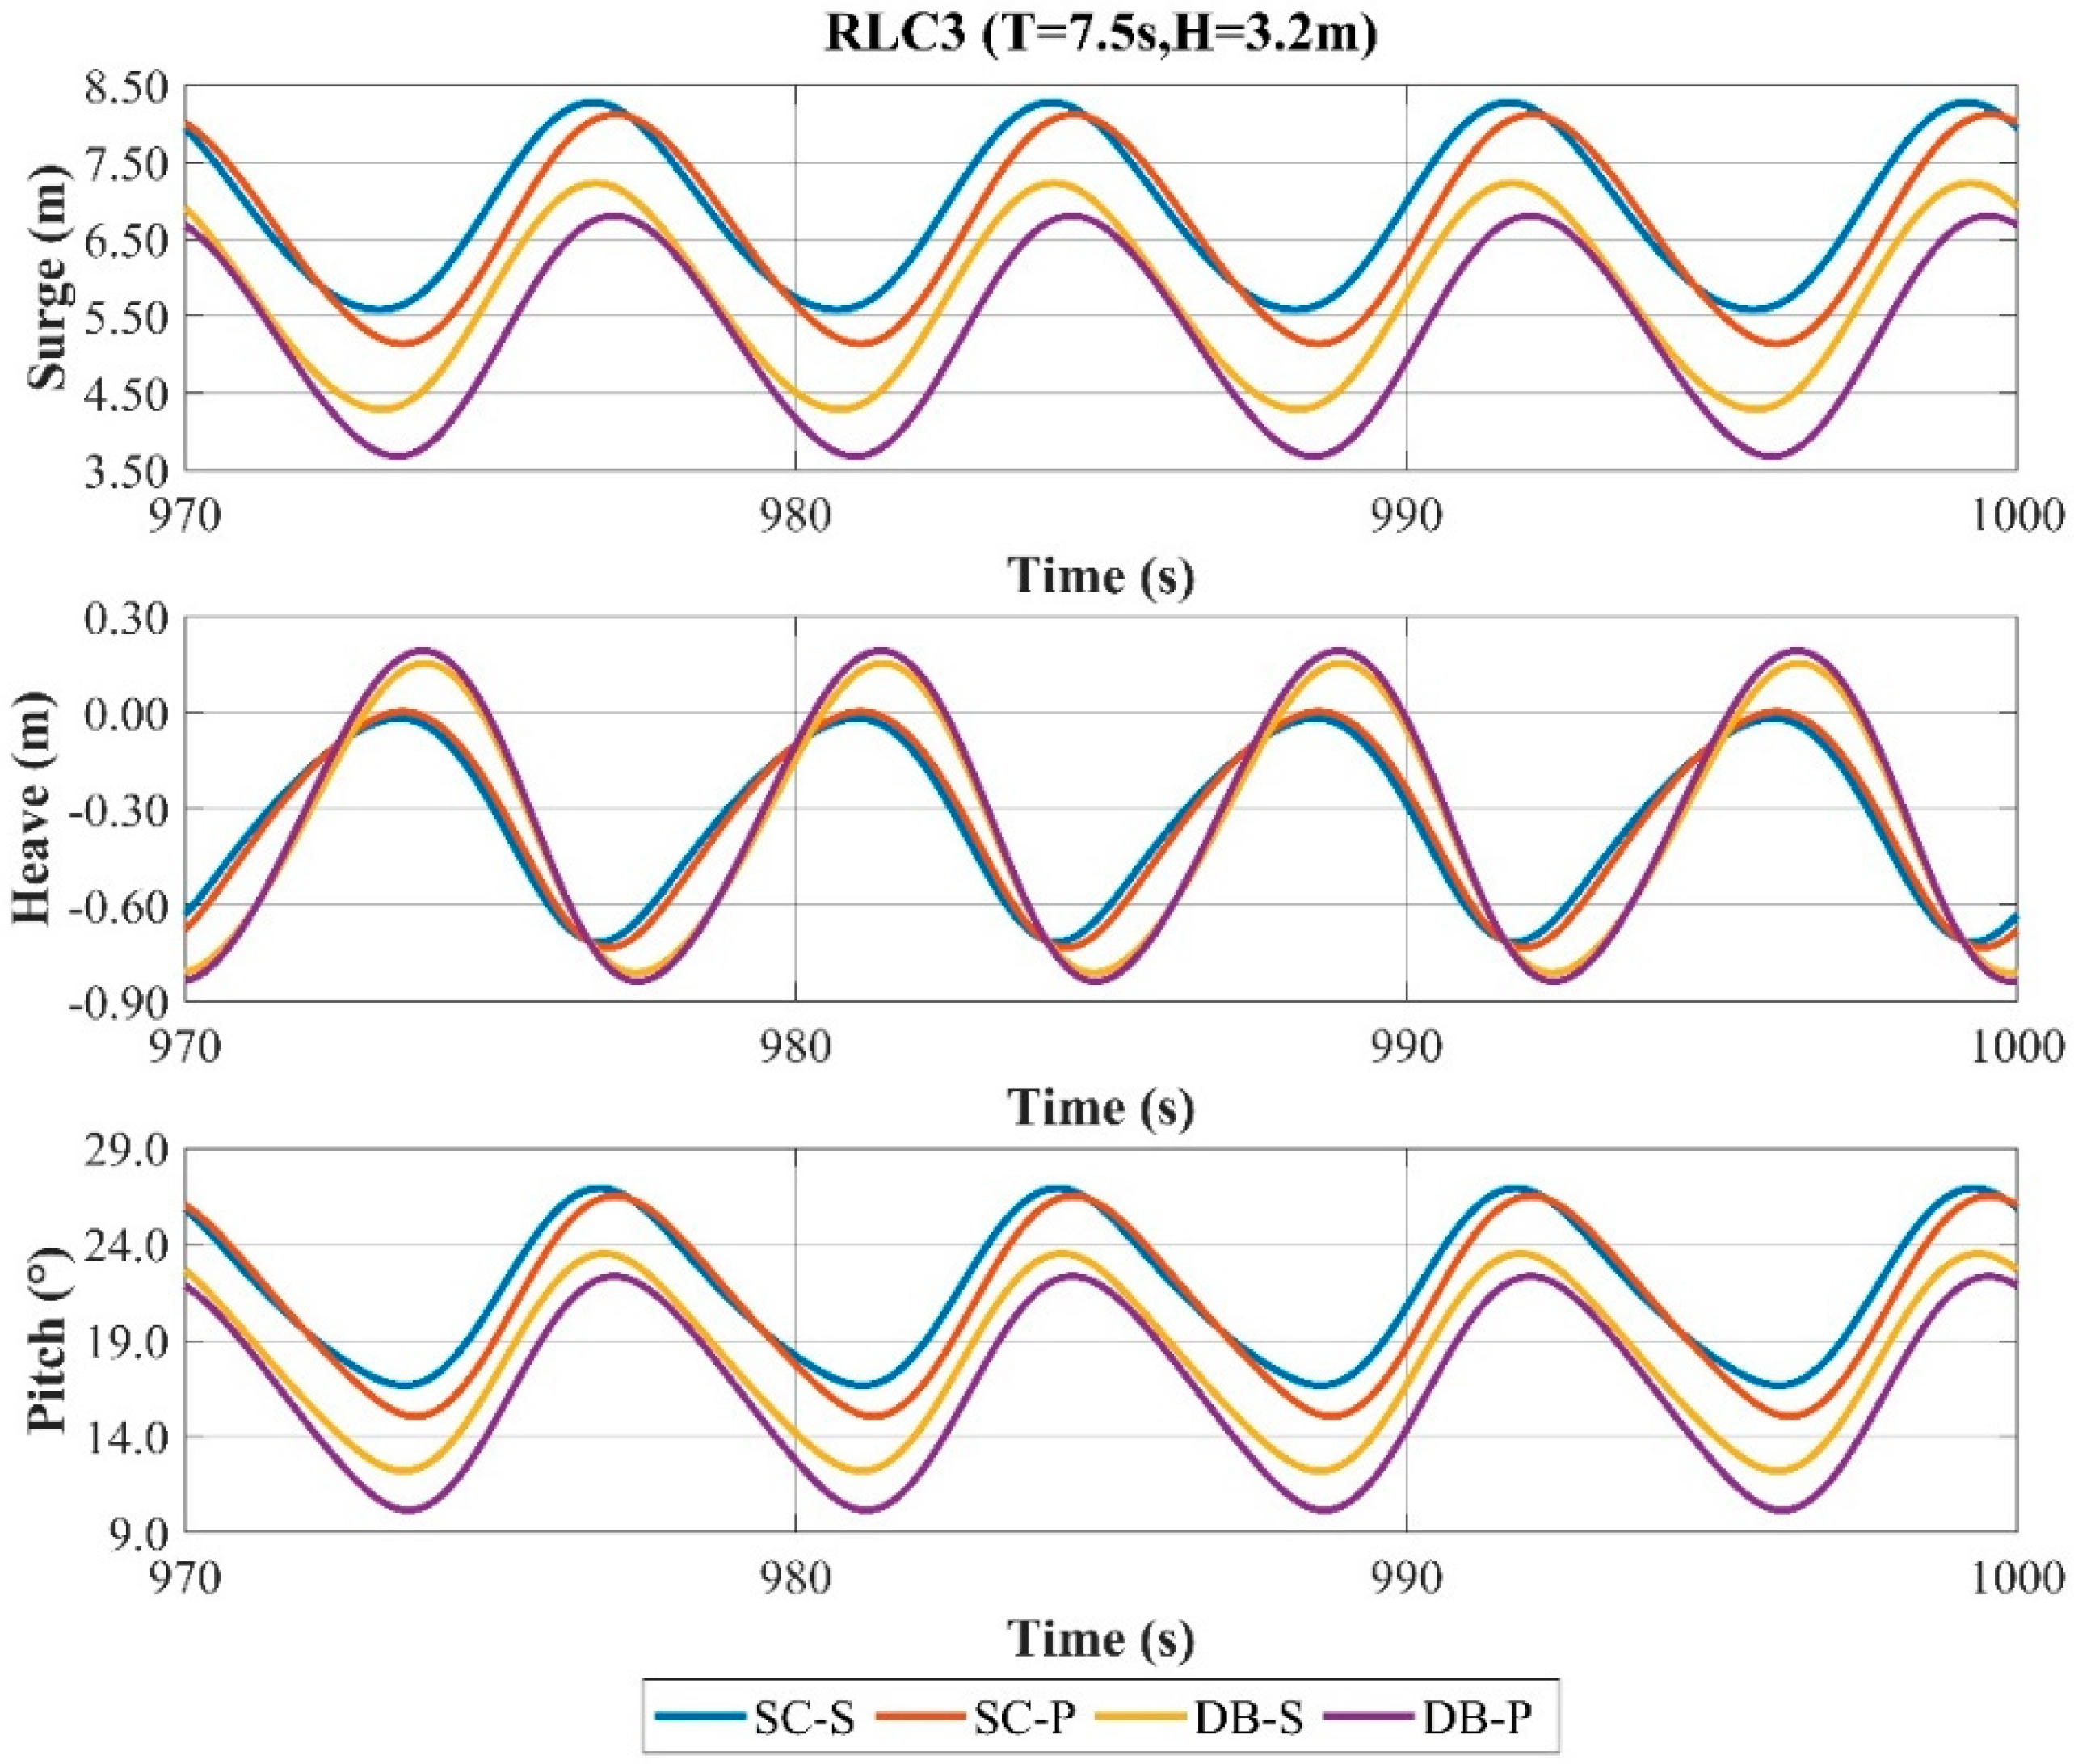
To assess the structural effects on platform motion, Figure 20, Figure 21 and Figure 22 and Table 7 present the motion responses of the four main buoys under three regular waves at 0° wave incidence. Structural and loading symmetry result in minimal motion amplitudes in the sway, roll, and yaw degrees of freedom. Consequently, only the surge, heave, and pitch motions are analyzed.
For the surge response, the peak values across the three wave cases consistently follow DB-P < DB-S < SC-P < SC-S. DB-P and DB-S exhibit similar peak values, both significantly lower than SC-P and SC-S. Respectively, DB-P and SC-P show lower peaks than DB-S and SC-S. Under the RLC1 and RLC2 wave cases, SC-P yields the maximum response amplitude, whereas DB-S gives the minimum. Under RLC3, DB-P produces the maximum amplitude and SC-S the minimum. The solid damping plate shows smaller amplitude but larger peak values than the perforated types across all wave cases. The disc-shaped buoy exhibits lower amplitude under RLC1 and RLC2 but higher under RLC3. Their peak values remain lower than the simplified configurations in all wave cases.
For the heave response, the peak values vary across wave cases among the four main buoys. Under RLC1, the peak responses follow DB-P < DB-S < SC-P < SC-S. For RLC2, the peak values are nearly identical across main buoys. Under RLC3, DB-P and DB-S exhibit comparable peaks, both exceeding those of SC-S and SC-P. Across all wave cases, DB-P and DB-S show higher amplitudes, with DB-P consistently exceeding the other main buoys. The disc-shaped buoy significantly affects the peak values in RLC1 and RLC3, while the simplified configuration yields smaller peaks. Perforated damping plates show significantly smaller peaks only under RLC1. Disc-shaped buoys yield consistently greater heave amplitudes than the simplified configuration across wave cases. Perforated damping plates enhance the heave amplitude more effectively than solid damping plates.
For the pitch response, under the RLC1 and RLC3 wave cases, the peak response magnitudes follow DB-P < DB-S < SC-P < SC-S for all the main buoys. DB-P and SC-P exhibit significant differences in the peak response, yet both are marginally lower than DB-S and SC-S, respectively. Across three wave cases, DB-P and DB-S demonstrate comparable peak responses, which are substantially lower than those of SC-P and SC-S. For the RLC1 and RLC2 cases, SC-P yields the maximum response amplitude, whereas DB-S yields the minimum. Under RLC3, DB-P produces the maximum amplitude and SC-S the minimum. Across all wave cases, the main buoys with disc-shaped buoys show lower peak responses than those simplified configurations. Perforated damping plate configurations exhibit lower peak responses in RLC1 and RLC3 but slightly higher responses in RLC2. For RLC1 and RLC2, the main buoys with disc-shaped buoys demonstrate lower response amplitudes than those simplified configurations, but this trend reverses under RLC3. Across all cases, perforated damping plate configurations yield higher response amplitudes than solid damping plate configurations.

4.3. Mooring Line Tension

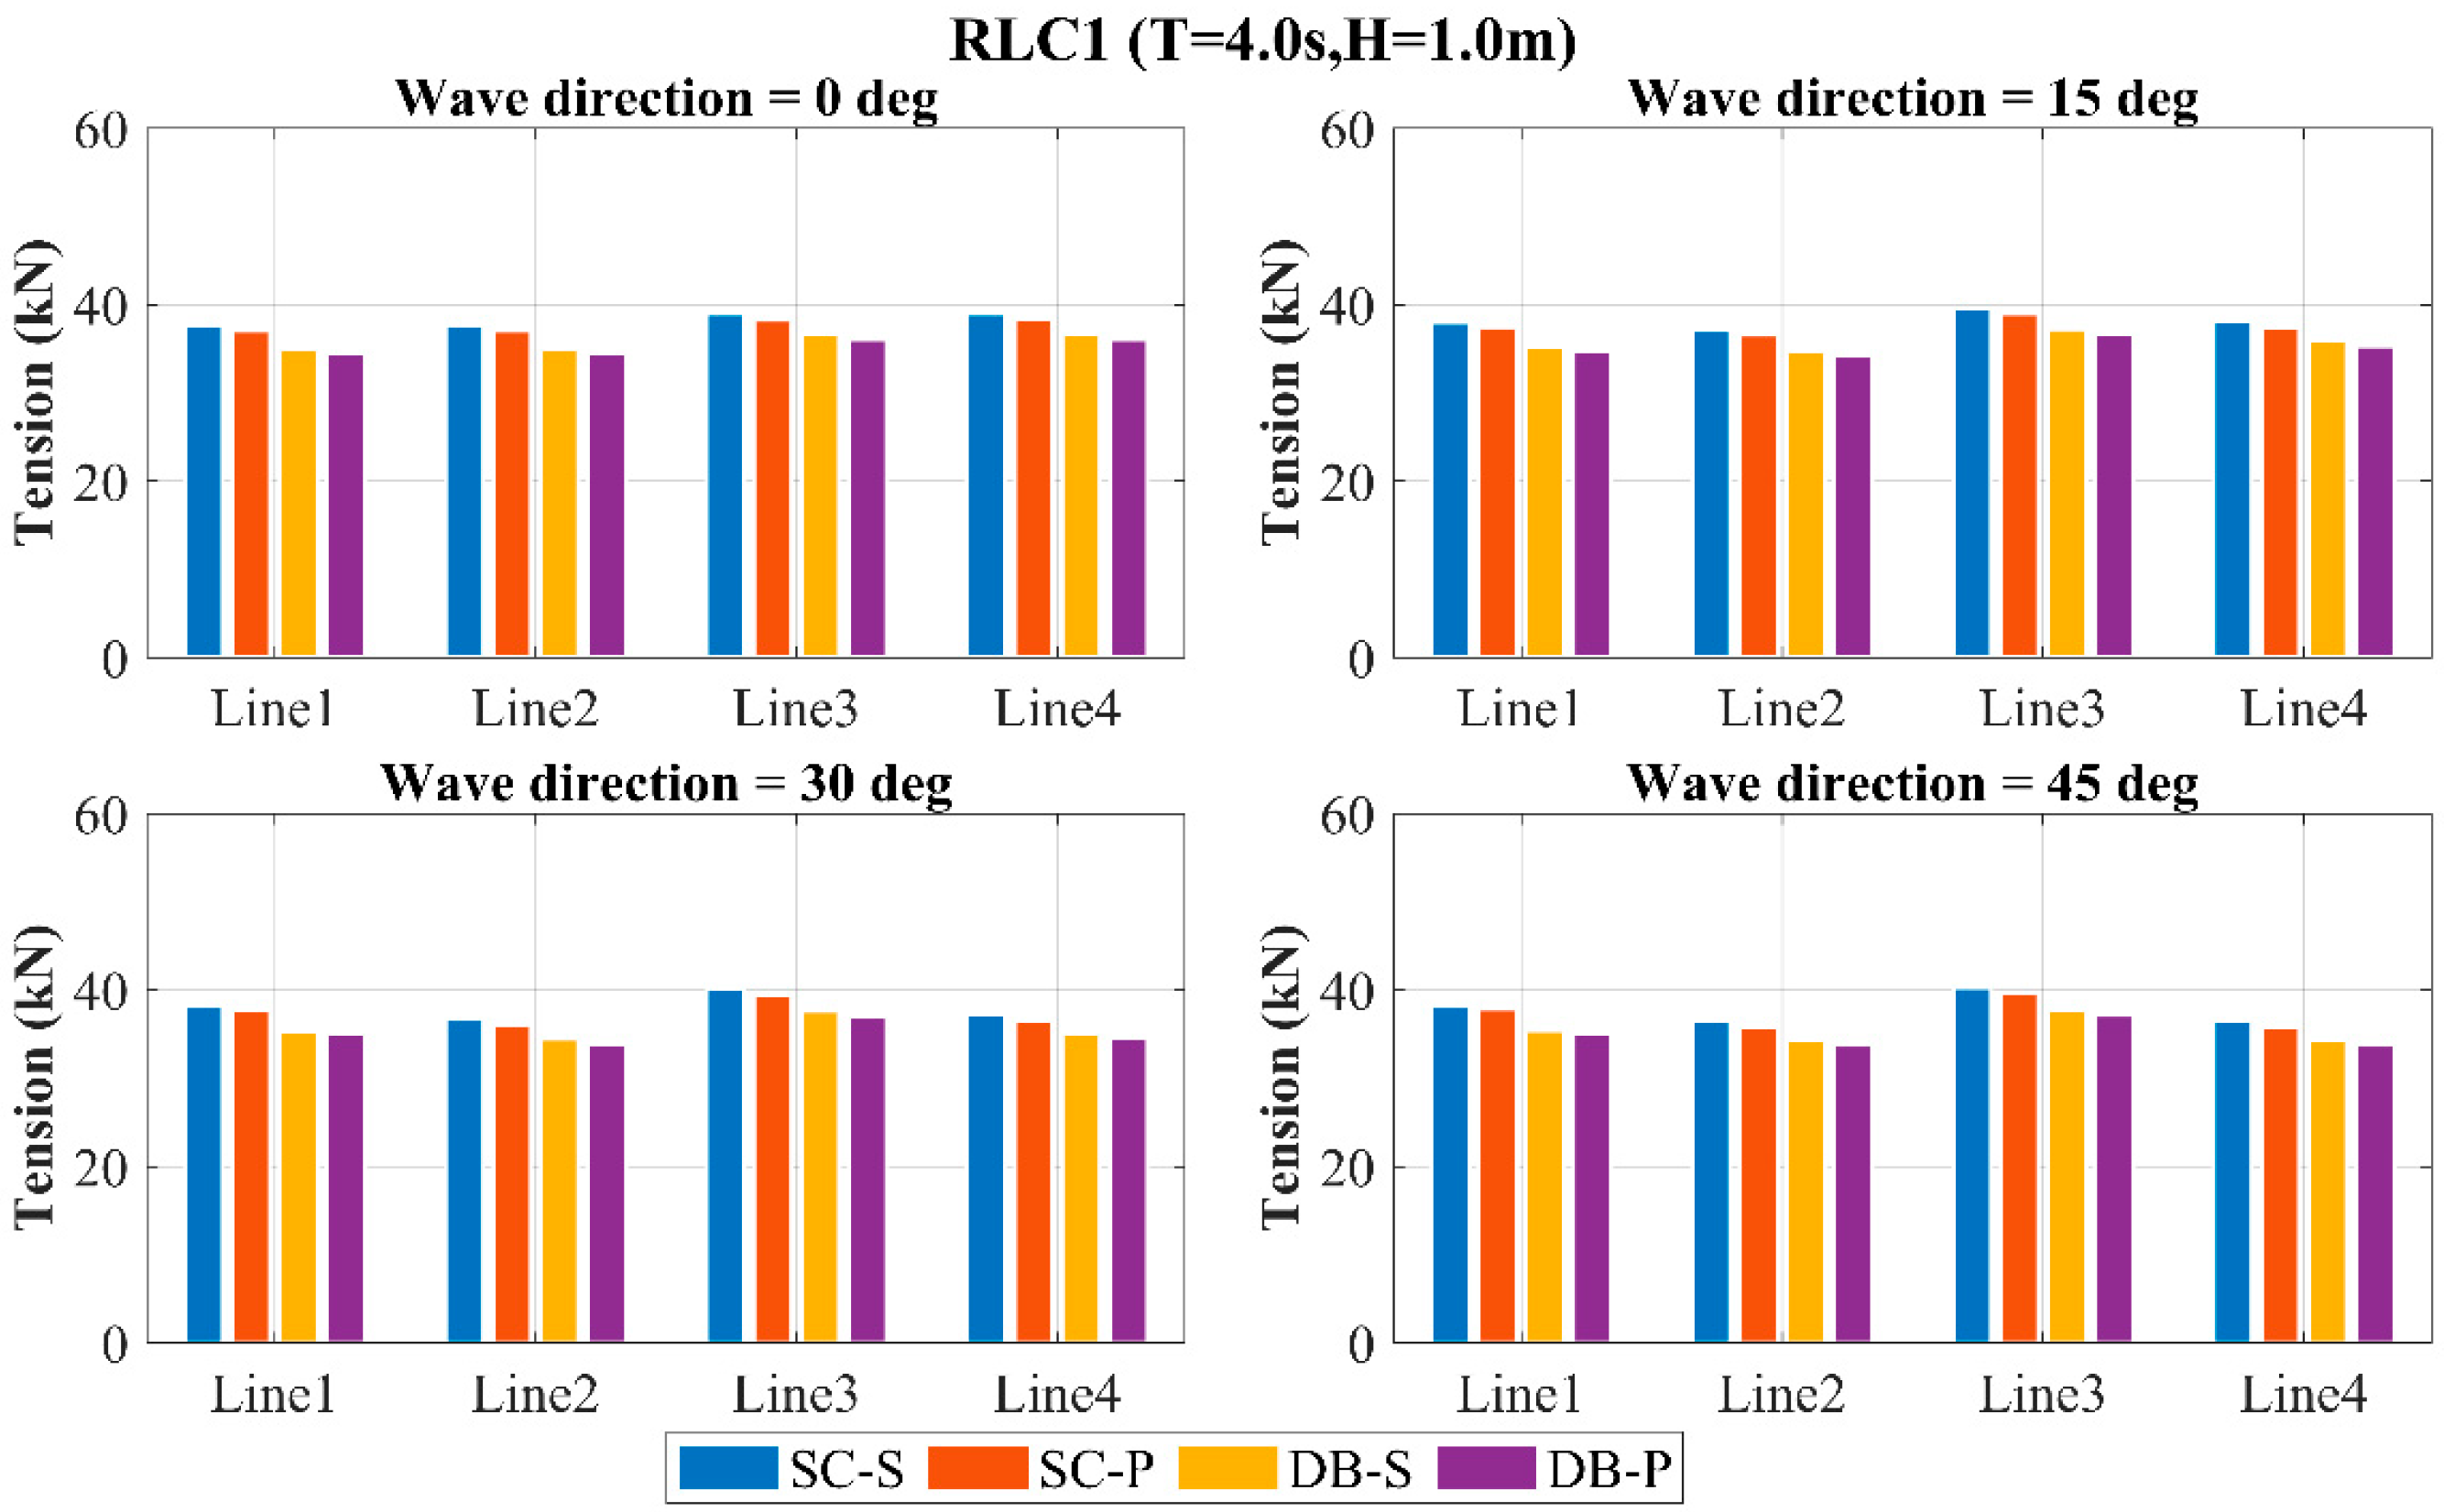
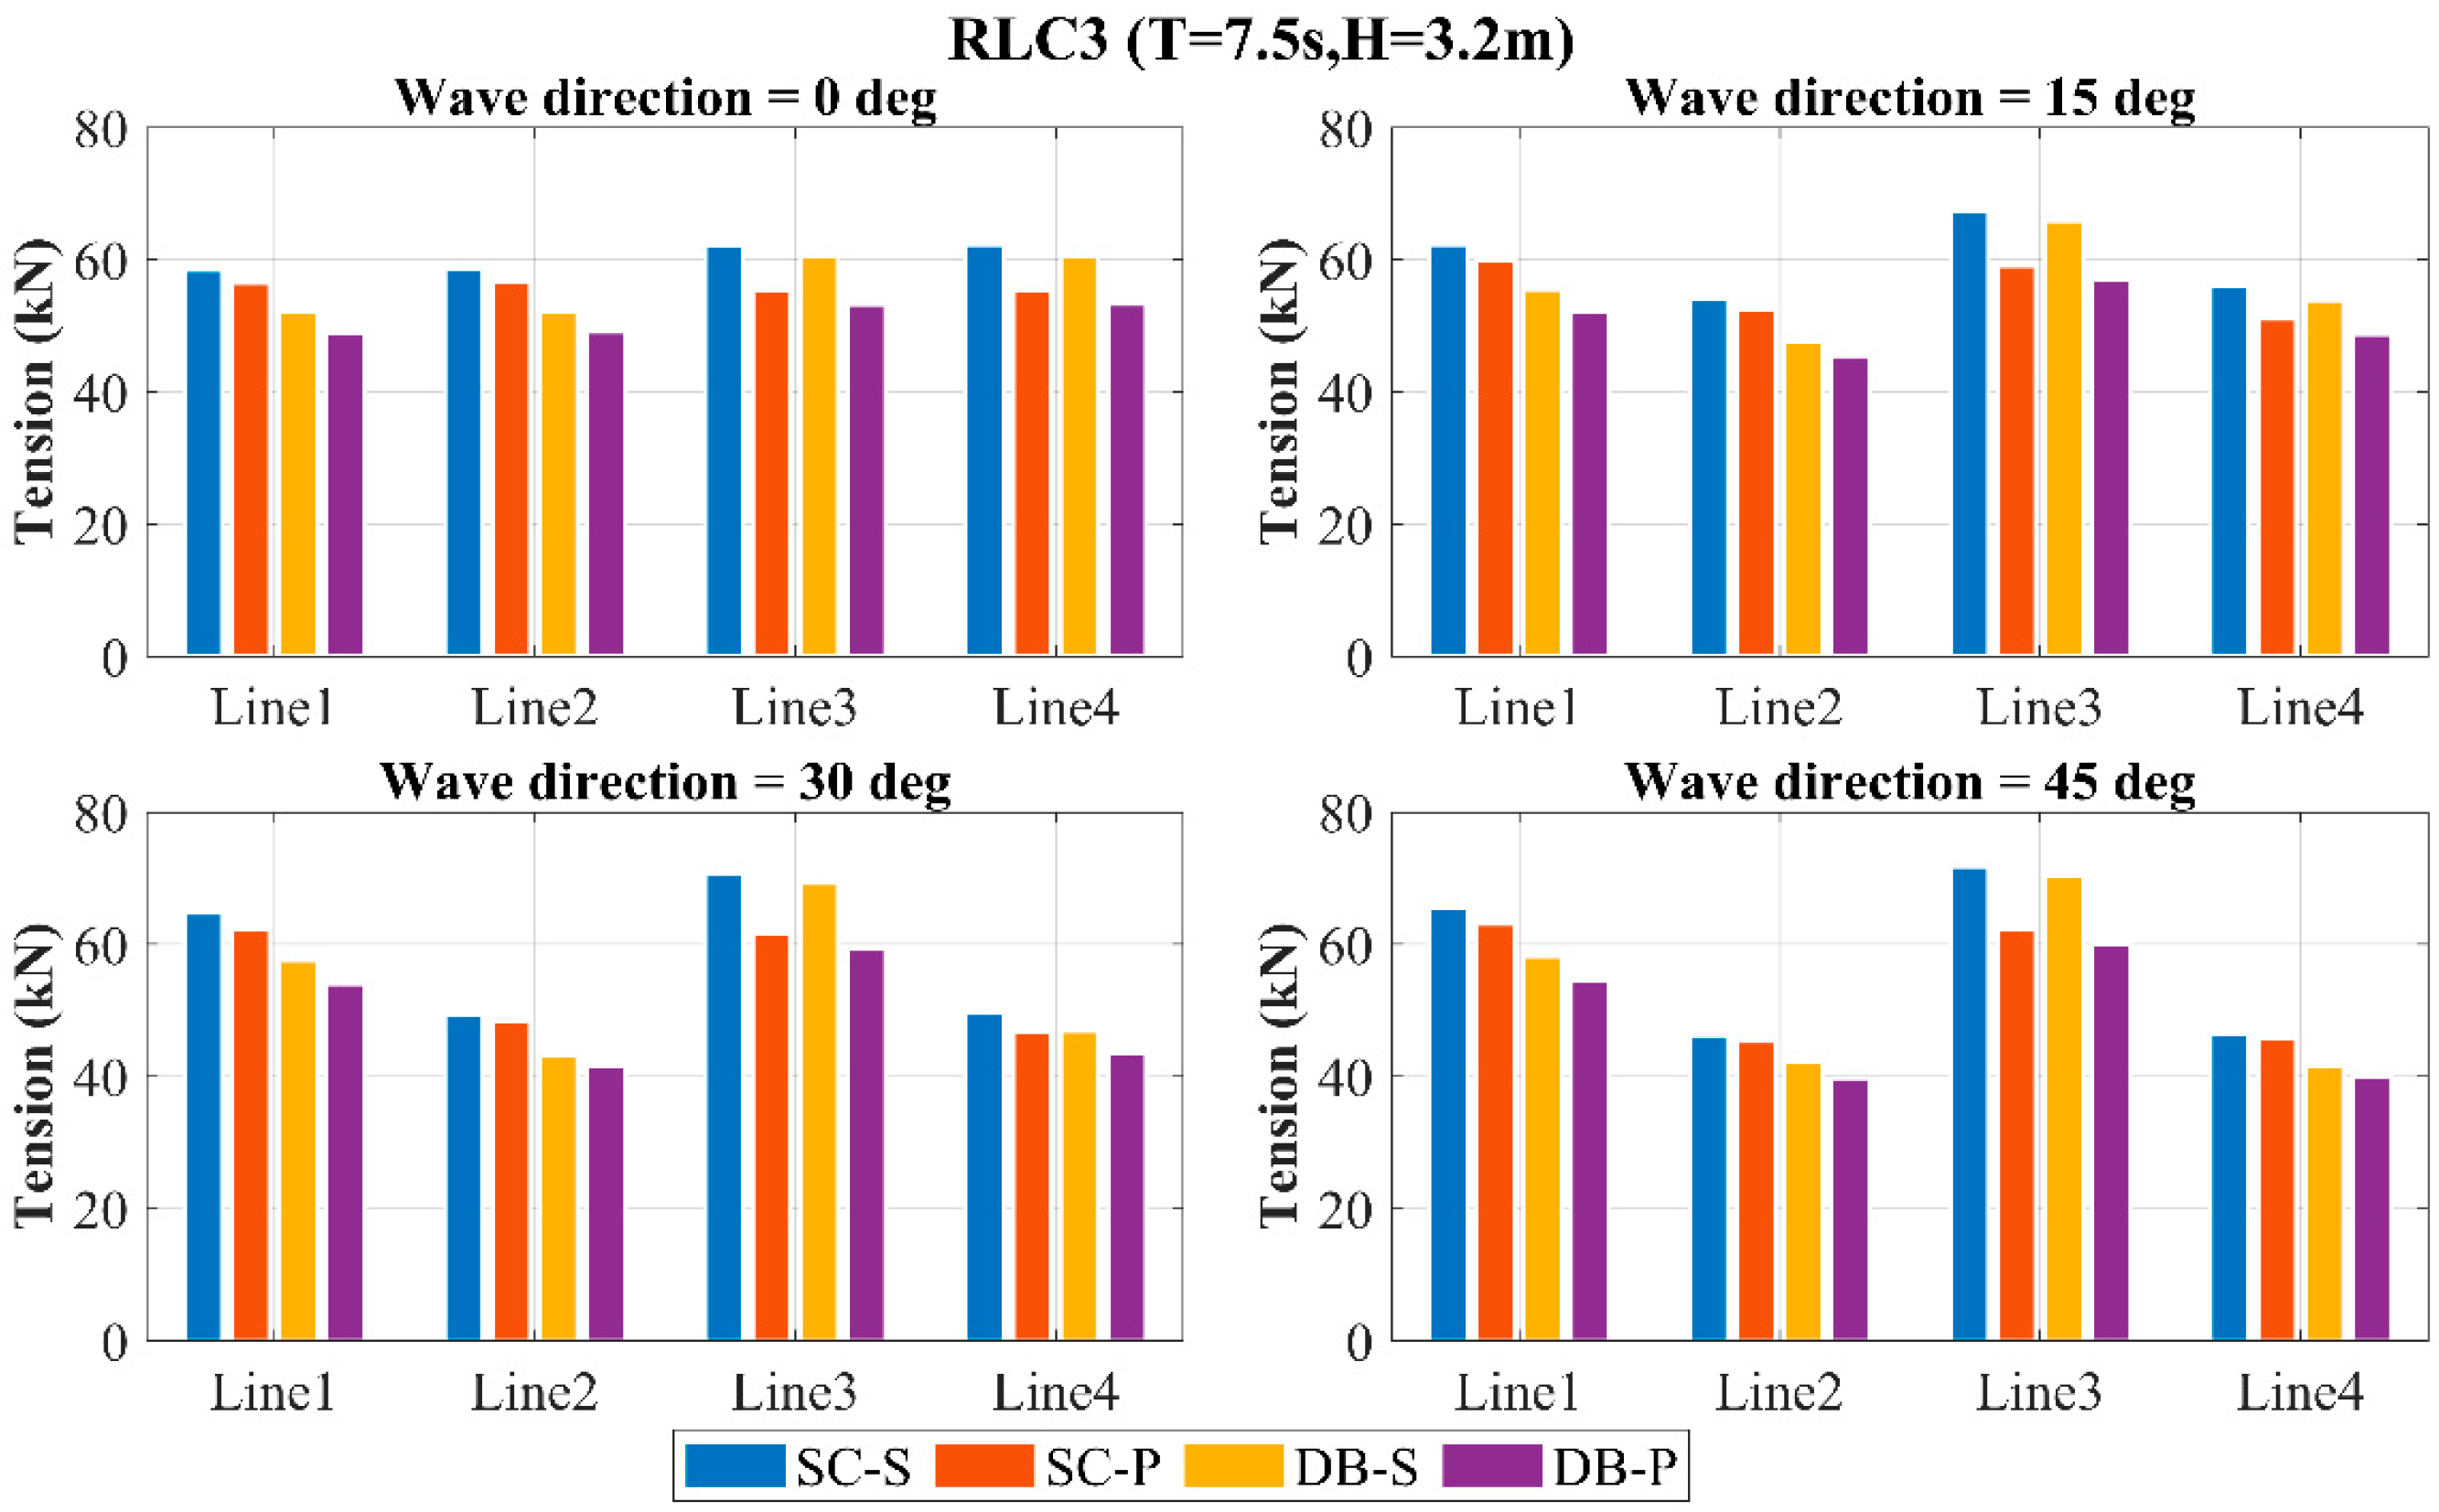
To investigate the mooring line tension characteristics of four two-body WECs, Figure 23, Figure 24 and Figure 25 present the maximum tensions in mooring lines 1–4 for all the WECs under three wave cases at directions of 0°, 15°, 30°, and 45°. The results demonstrate that with increasing sea state severity, the mooring line tensions rise consistently across all directions for each WEC, while the tension differences between WECs significantly diverge.
Across all directions, the SC-S yields maximum mooring line tensions, whereas DB-P gives minimum values. At 0° direction, the tension variations among the four WECs are marginal. With increasing direction, the tensions in lines 1 and 3 rise progressively, while lines 2 and 4 show decreasing values, amplifying the differential between these pairs. Disc-shaped buoys demonstrate lower tensions than simplified configurations across all wave cases and directions. Perforated damping plates generate lower tensions compared to solid plates. The combined use of disc-shaped buoys and perforated damping plates effectively reduces the mooring loads. Collectively, these components reduce the mooring system loads.

4.4. Absorbed Power

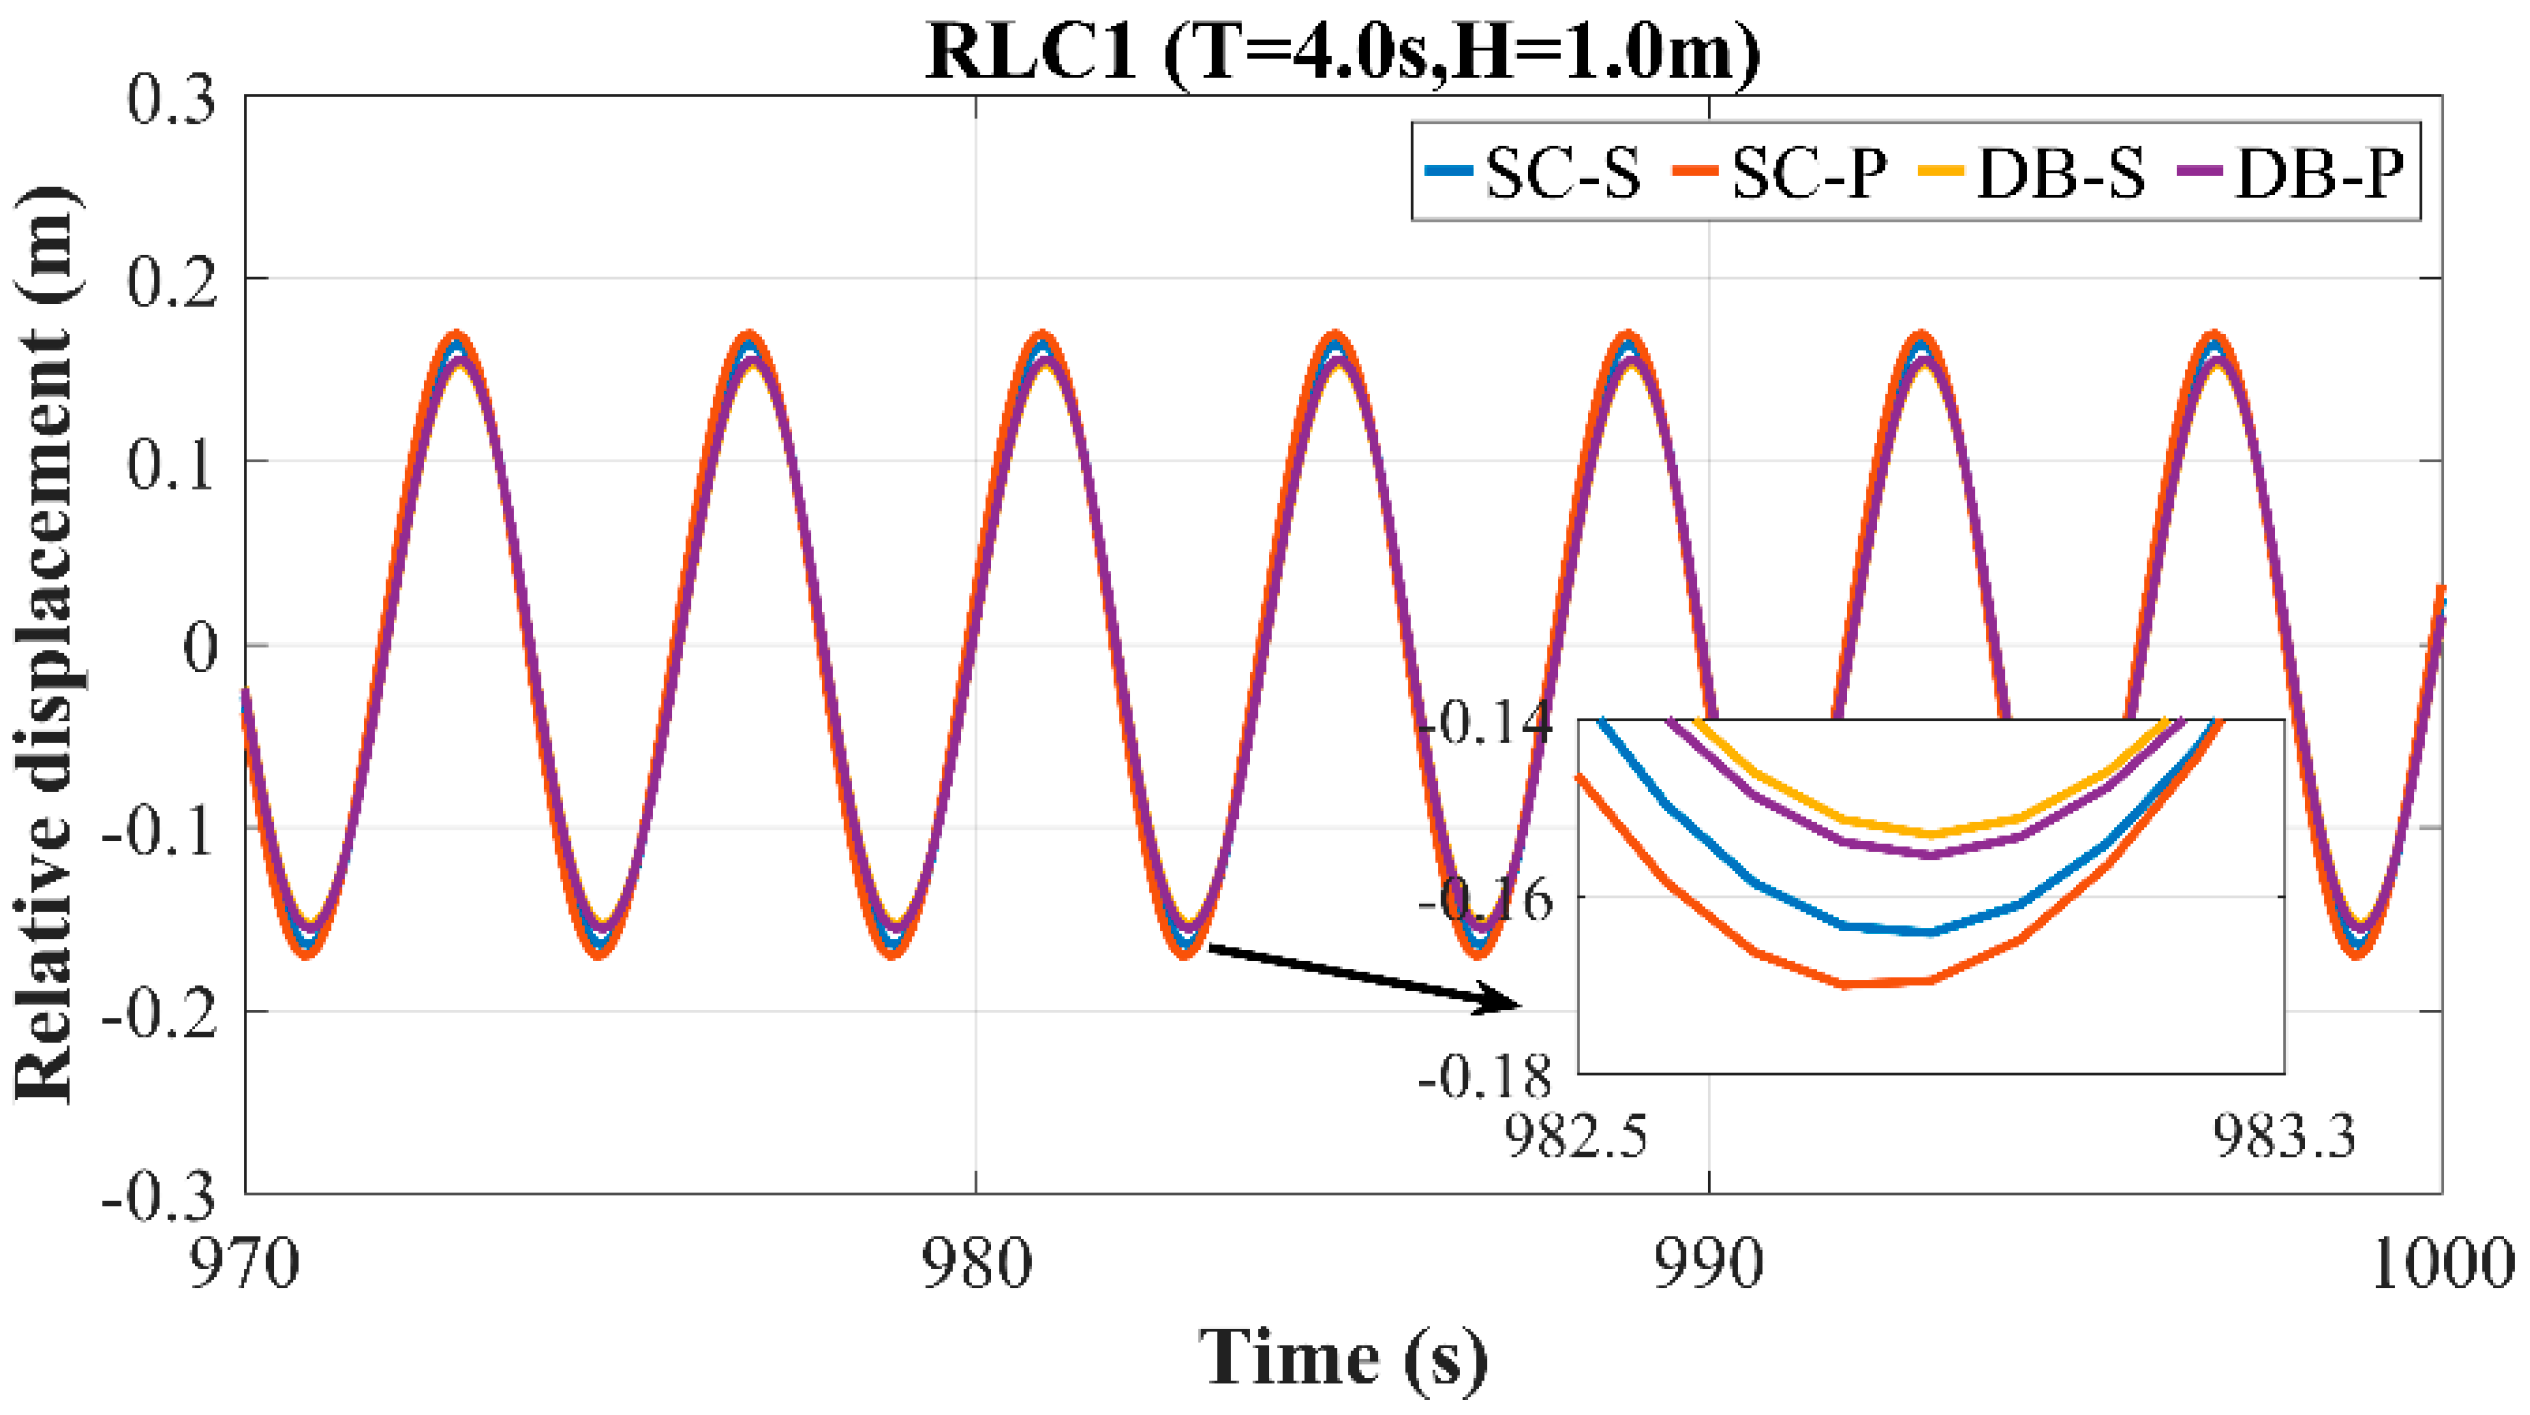
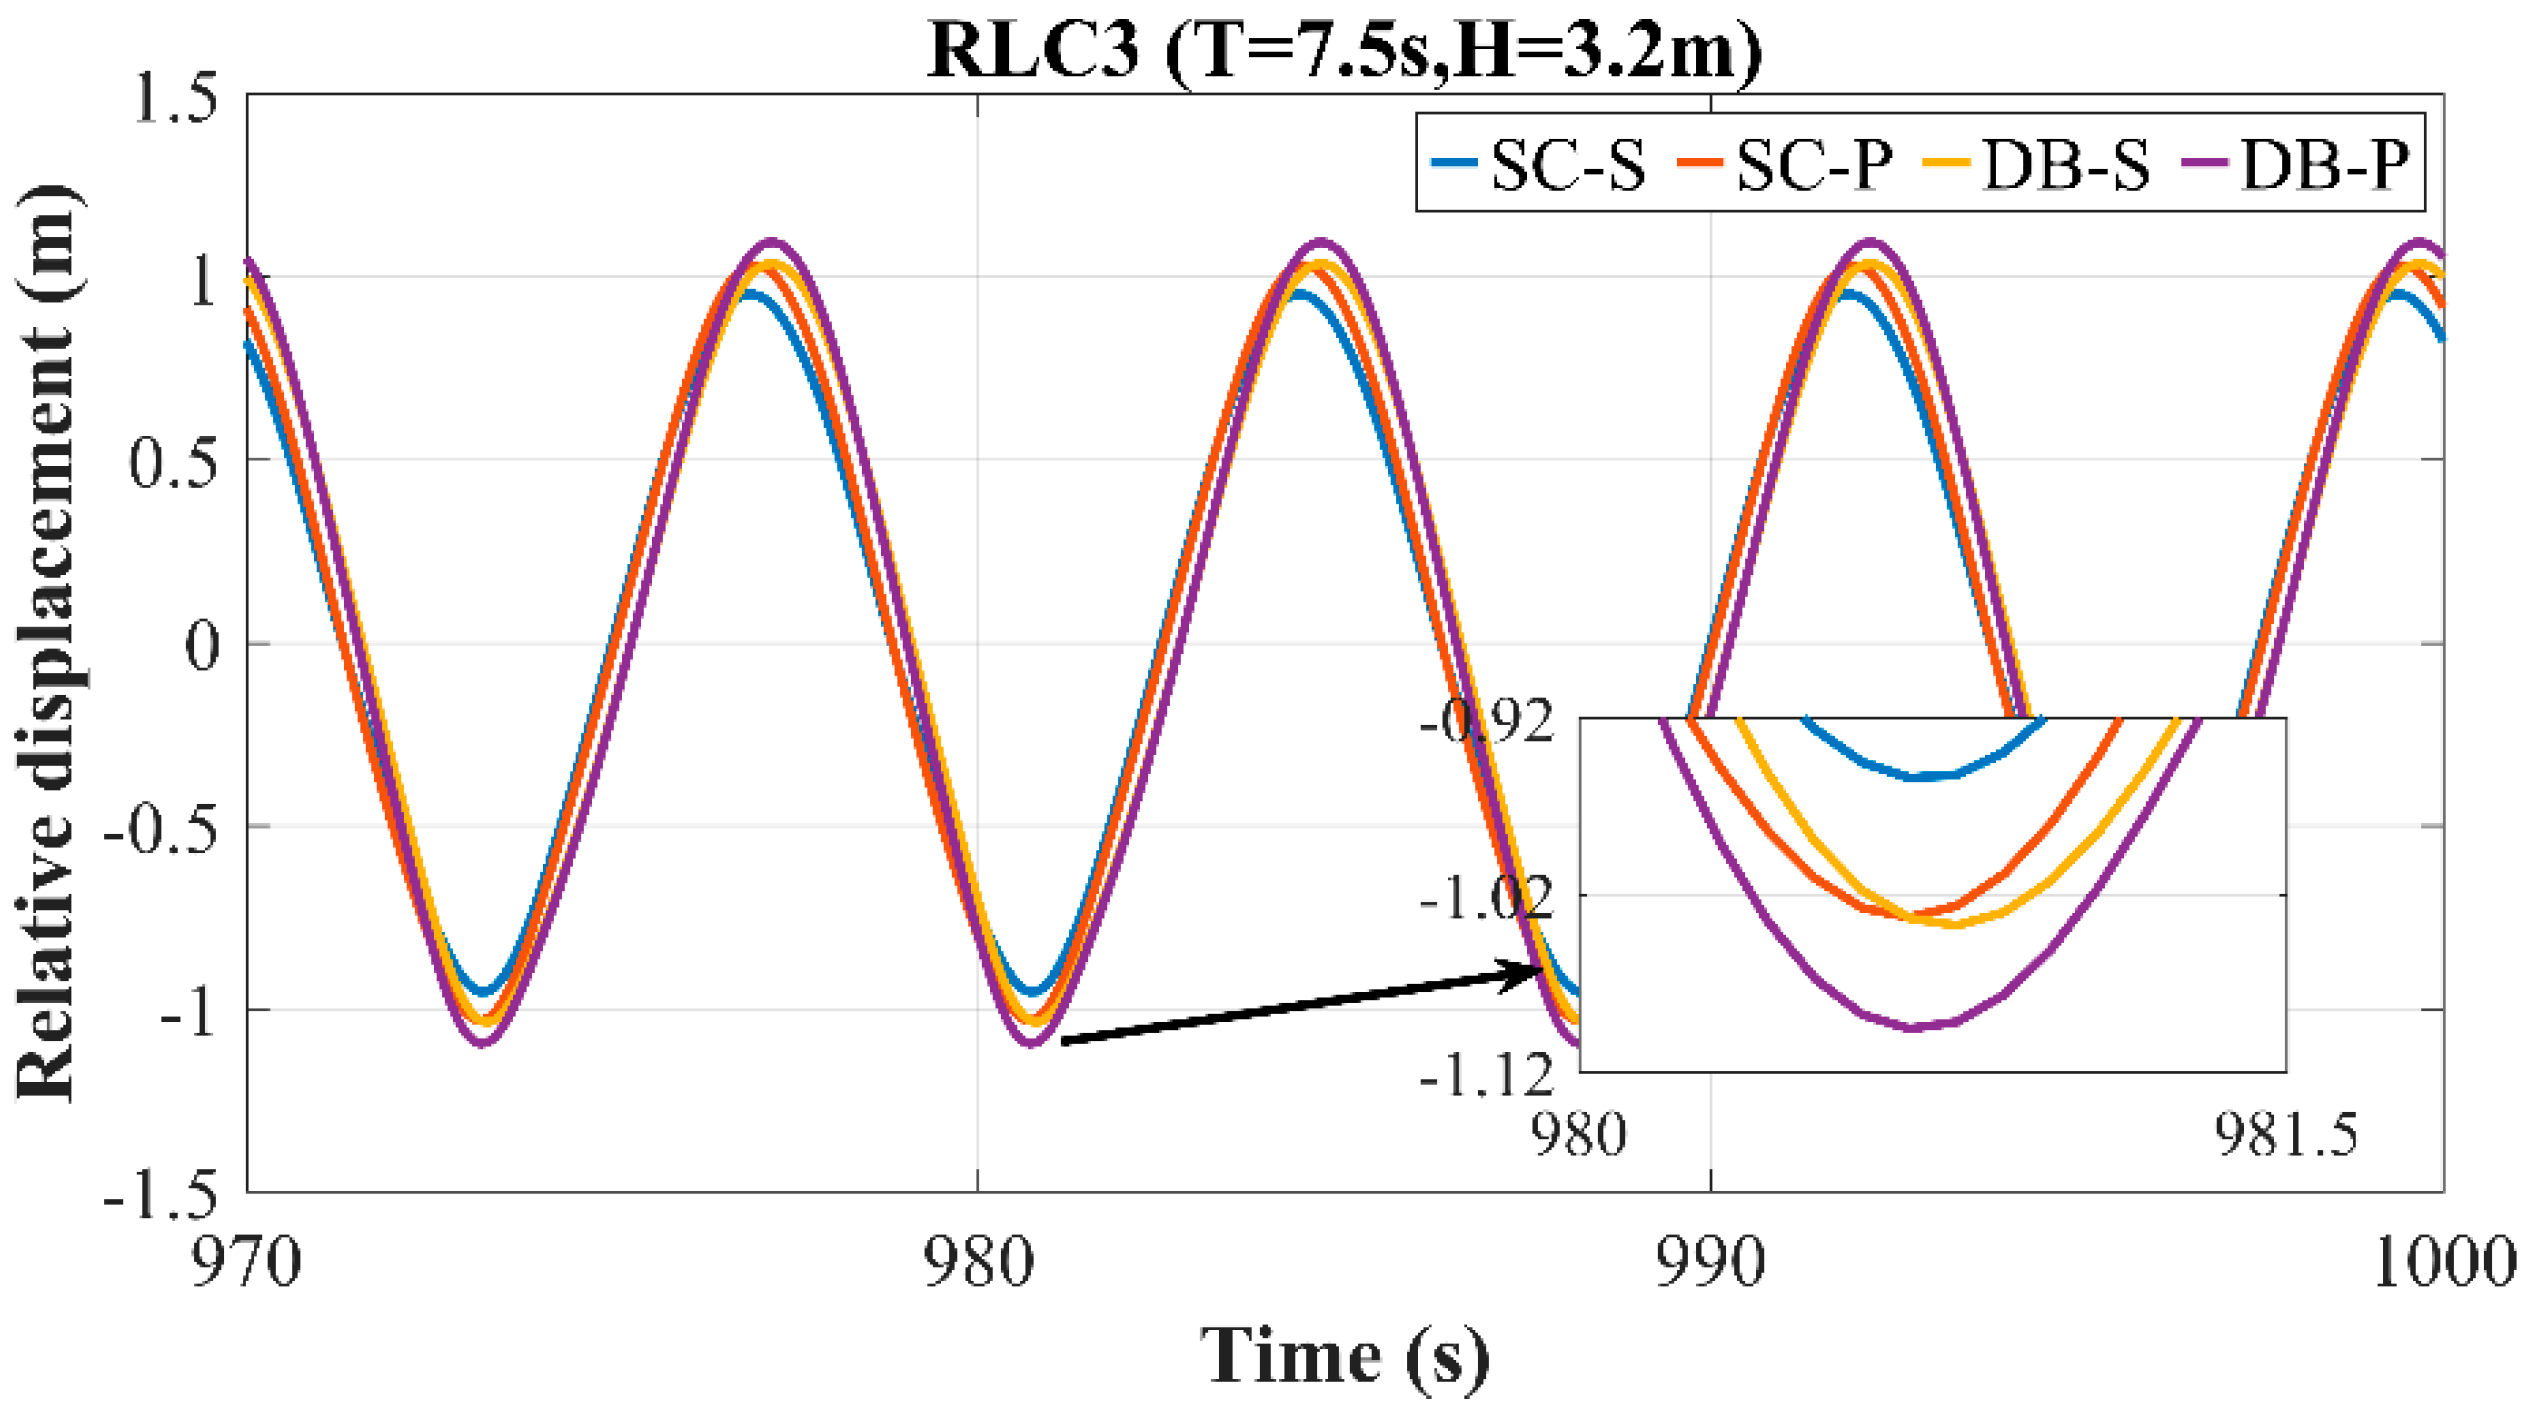
As shown in Equation (9), the power absorption of the WEC depends directly on the relative displacement between the float and the main buoy, and on the magnitude of the PTO damping. Figure 26, Figure 27 and Figure 28 present the simulated relative displacement results for the four WECs in the 0° direction under various wave cases. Due to differences in the motion response among the WECs, their motion amplitudes vary under the same wave case. Therefore, this section accounts for the effect of the motion response in the relative displacement analysis.
As shown in the figure, the peak-to-peak values of the relative displacement increase with increasing wave severity for all four WECs. Under the RLC1 wave case, the SC-P exhibits the largest peak-to-peak value, followed by SC-S, while the DB-S has the smallest value. Under the RLC2 and RLC3 wave cases, DB-P exhibits the largest peak-to-peak value, while SC-S has the smallest. As the wave severity increases, the difference in the peak-to-peak value between SC-P and DB-S gradually decreases. WECs with a perforated damping plate consistently exhibit large relative displacement peak-to-peak values under all three wave cases. Under the RLC1 wave case, WECs with the dish-shaped buoy yield smaller relative displacement peak-to-peak values than those without it. Under the RLC2 and RLC3 wave cases, the presence of the dish-shaped buoy yields larger relative displacement peak-to-peak values than its absence.
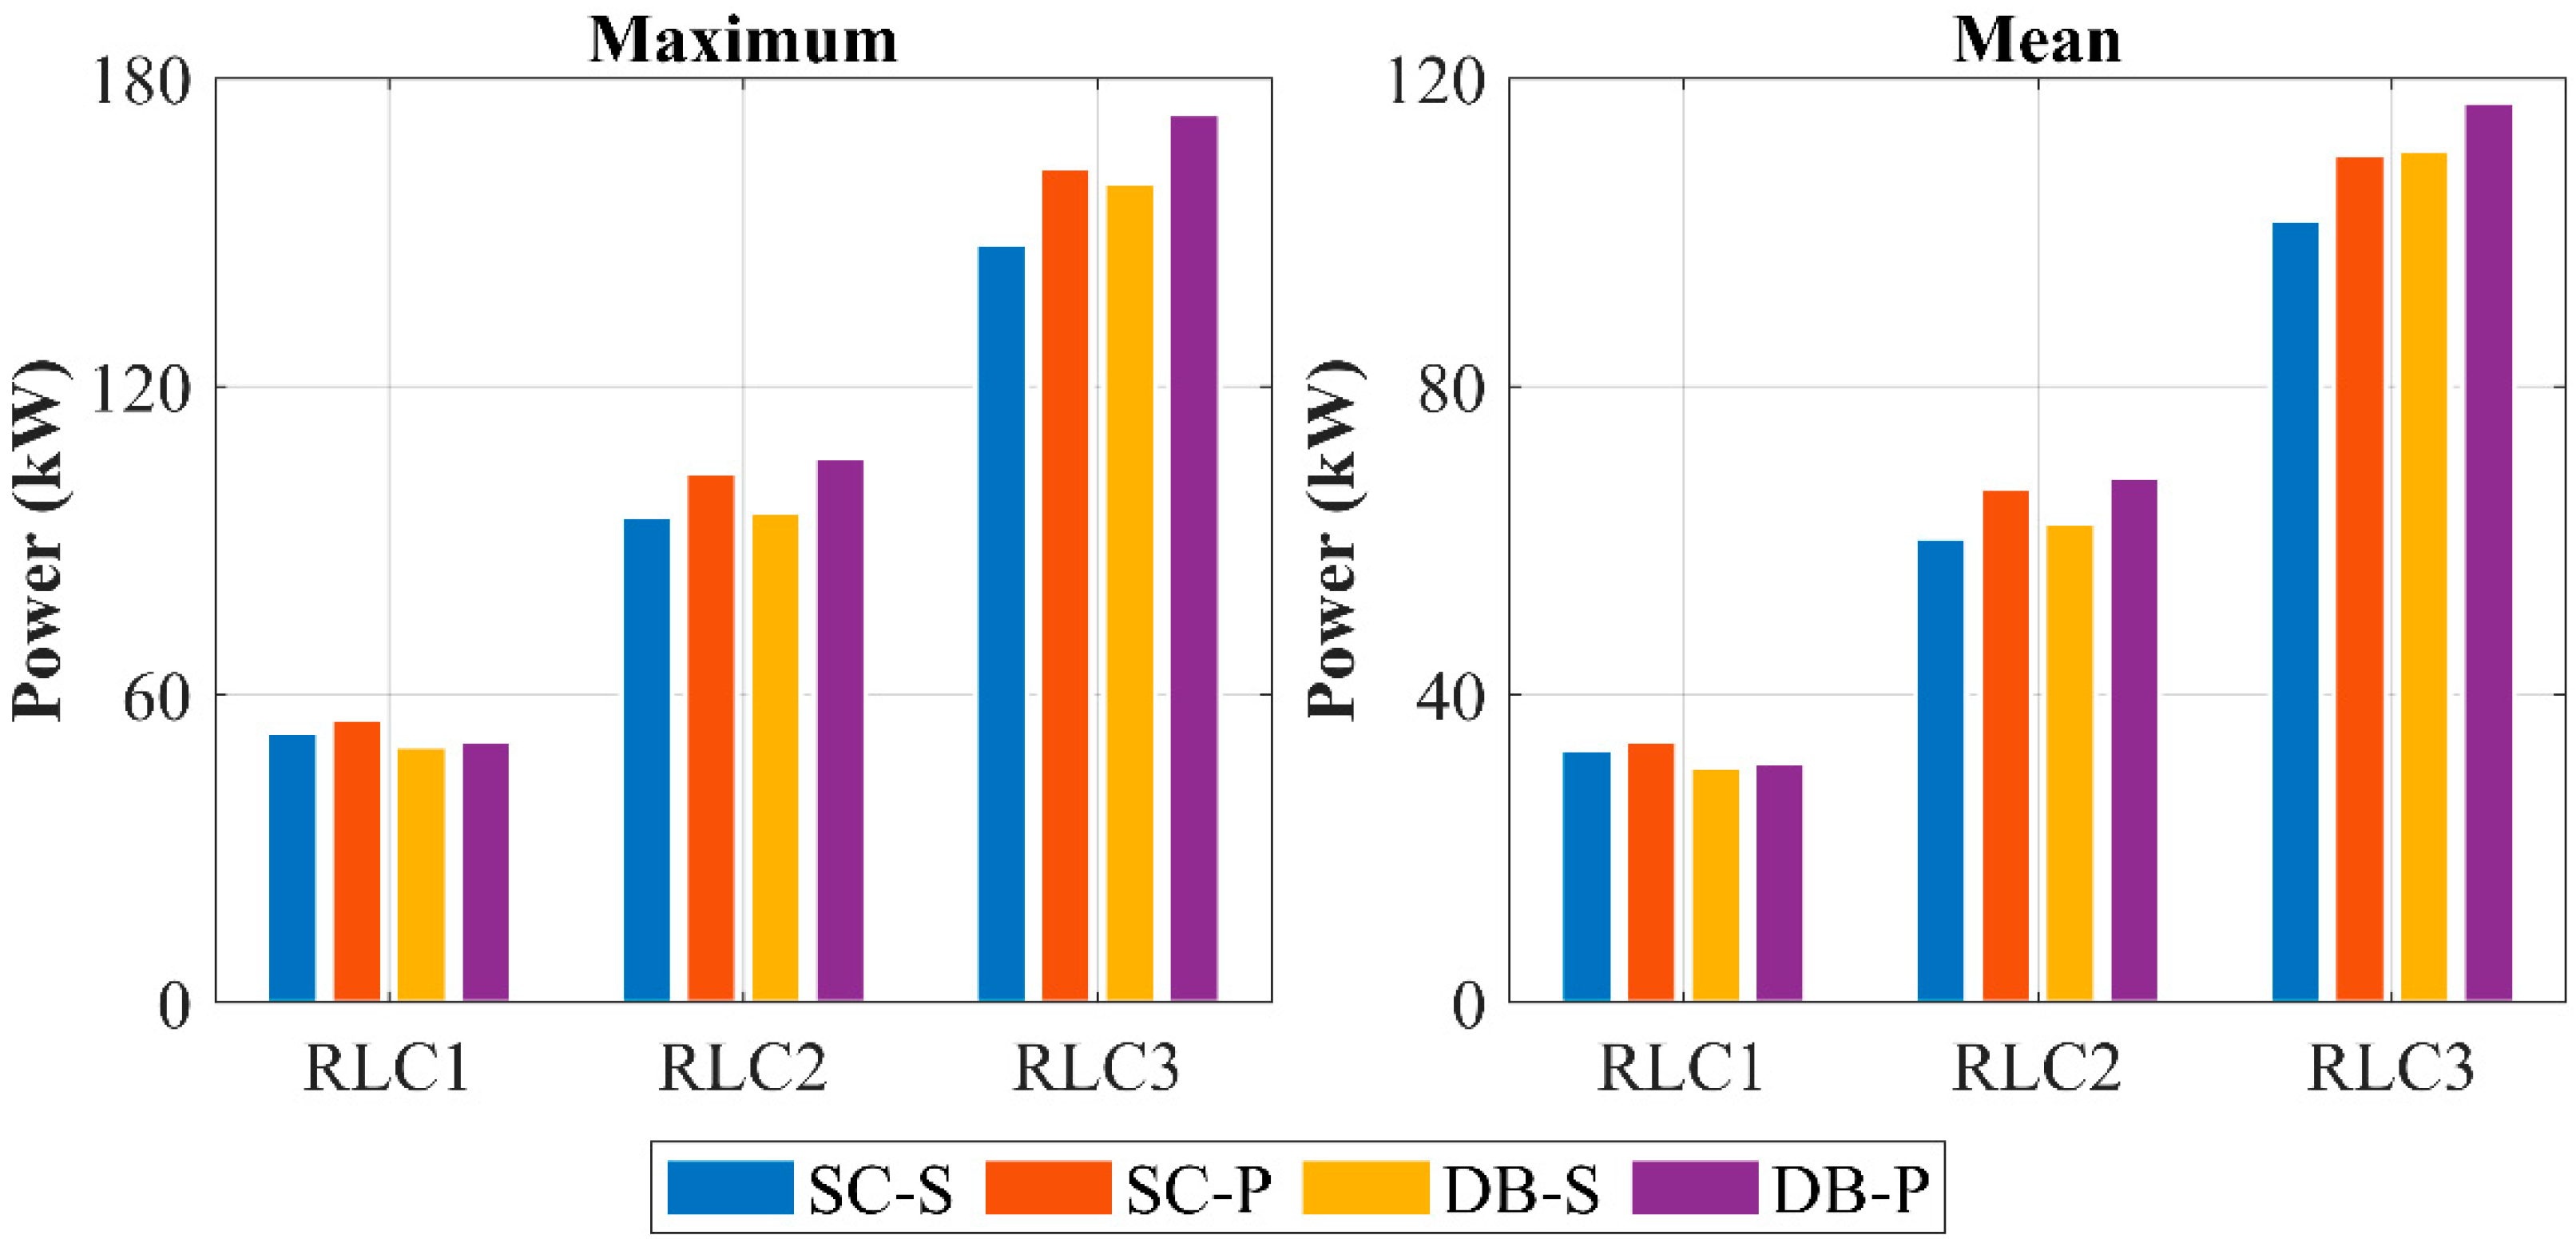
Instantaneous power is obtained from the relative displacement between the float and the main buoy, and the PTO damping force. The time-averaged instantaneous power yields the power absorption for the two-body WEC. Table 8 and Figure 29 present the power absorption results for the four WECs under the three regular wave cases. The results indicate that both the average and peak power differ among the WECs across wave cases, and the disparity in power increases with the wave severity. Both the average and peak power exhibit similar trends across the WECs. Under the RLC1 wave case, SC-P achieves the highest power, whereas DB-S yields the lowest. Under the RLC2 and RLC3 wave cases, DB-P and SC-S achieve the highest and lowest power, respectively. WECs with a perforated damping plate consistently yield relatively high mean and peak power under all three wave cases. Under the RLC1 wave case, WECs featuring the dish-shaped buoy achieve lower mean and peak power than those without it. Conversely, under the RLC2 and RLC3 wave cases, the presence of the dish-shaped buoy results in higher mean and peak power compared to its absence.
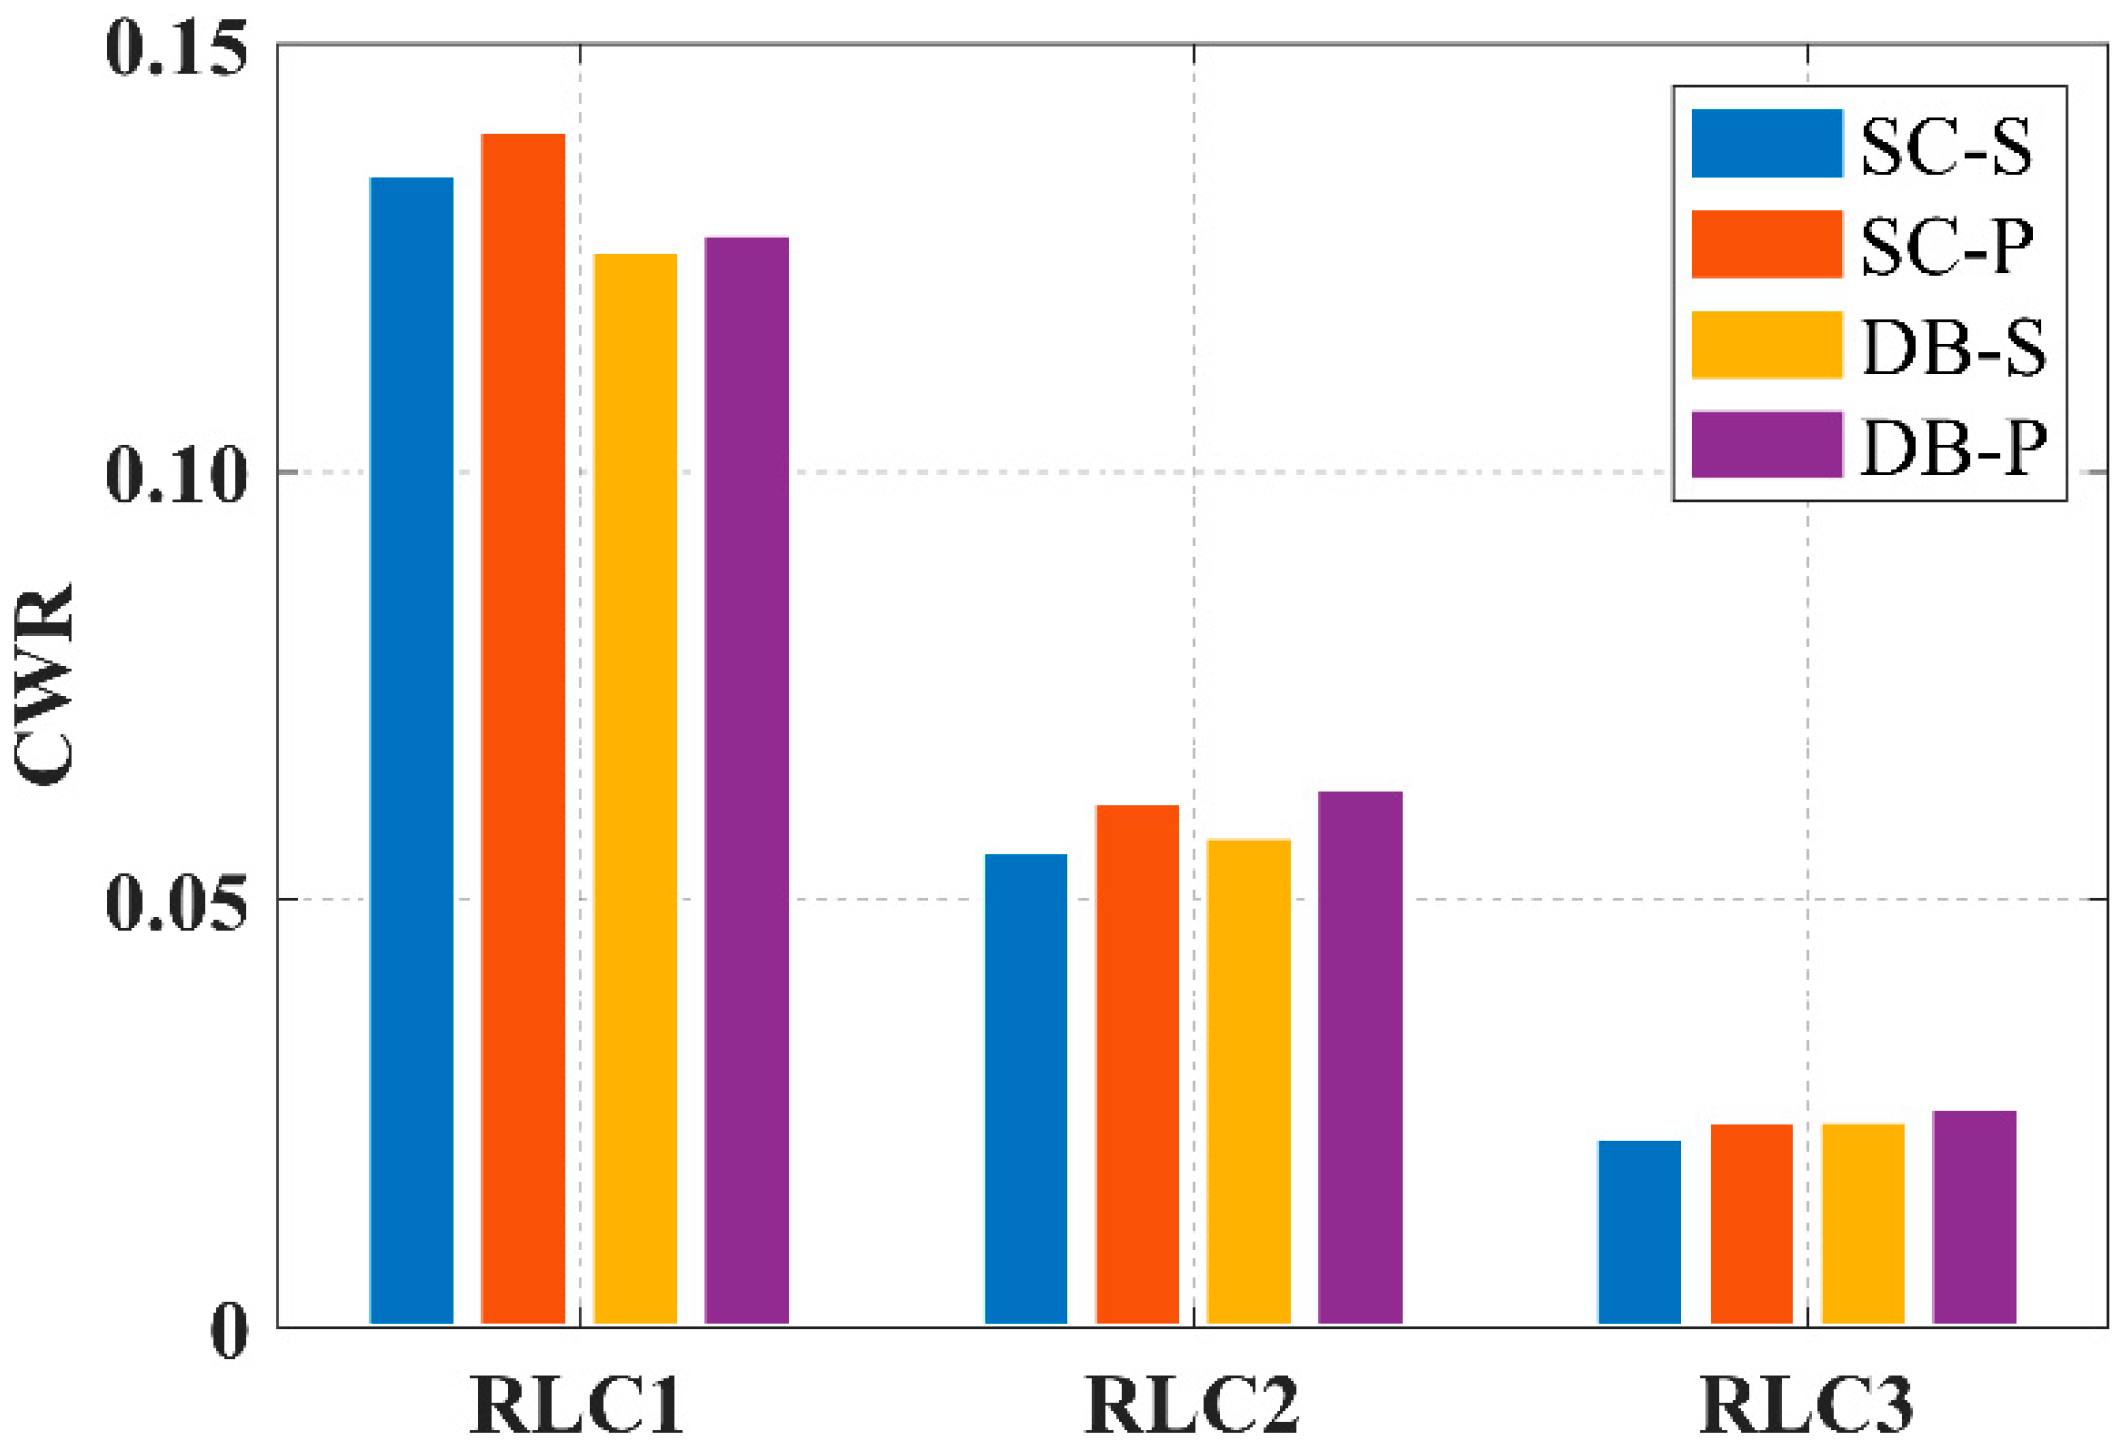
Figure 30 presents the CWR values for the four WECs across wave cases, where the WECs exhibit distinct effects on the CWR. All WECs attain maximum CWR under the RLC1 wave case, with the values declining as the wave severity increases. SC-P yields the maximum CWR under RLC1, whereas DB-P achieves higher CWR under RLC2 and RLC3. WECs with perforated damping plates consistently yield higher CWR, while the dish-shaped buoy enhances the CWR under RLC2 and RLC3 but reduces it under RLC1.

5. Conclusions

This study proposes a novel two-body WEC integrating a dish-shaped buoy with a perforated damping plate. A multi-body coupled hydrodynamic model was developed using potential flow theory, with frequency domain and time domain analyses conducted. Numerical model validation was performed using sea trial data from SDU-III WEC, ensuring model reliability. Four WECs were designed: with or without the dish-shaped buoy and with solid or perforated damping plates. Site-specific numerical simulations assessed the hydrodynamic performance under characteristic wave cases at Tuoji Island. The key findings are summarized as follows.
(1) The dish-shaped buoy significantly enhances the RAO, added mass, radiation damping, and wave excitation force of the WEC in the surge and heave degrees of freedom, while also exhibiting increased added mass in pitch. Regarding the effect of the damping plate porosity, the solid damping plate shows reduced added mass specifically in pitch but generates greater RAO, added mass, radiation damping, and wave excitation forces in surge, heave, and pitch. The dish-shaped buoy and perforated damping plate exhibit enhanced power absorption potential along with superior stability characteristics.
(2) The disc-shaped buoy and perforated damping plate effectively suppress the surge and pitch response peaks of the main buoy, while exhibiting elevated heave response amplitudes, collectively enhancing the device stability.
(3) The disc-shaped buoy and perforated damping plate yield reduced mooring line tensions across four wave incidence angles under three wave cases.
(4) The WEC with a perforated damping plate generates increased peak-to-peak relative displacement, absorbed power, and CWR across all three wave cases. Under smaller wave cases, the disc-shaped buoy reduces the peak-to-peak relative displacement, absorbed power, and CWR compared to the WEC without this buoy, whereas under larger wave cases, it enhances these parameters.
Collectively, this study offers valuable guidance for designing and investigating other two-body WECs. Future work will focus on device optimization through altering the disc-shaped buoy geometry and refining the perforated damping plate porosity distribution. These enhancements are anticipated to boost the overall device performance.
Author Contributions

Ideals, concept and demonstrate the method, L.L.; Draft writing, sorting and analysis, C.W. and M.L.; data sorting, X.S. and Y.L.; responsible for guidance, contact and communication, G.X. All authors have read and agreed to the published version of the manuscript.

Funding

This work was financially supported by the National Key Research and Development Program of China (2023YFB4204103, 2023YFC2810100), the National Natural Science Foundation of China (52171265, 52471331), and the Guangdong Basic and Applied Basic Research Foundation (2024A1515240063).

Data Availability Statement

The original contributions presented in this study are included in the article. Further inquiries can be directed to the corresponding author.

Conflicts of Interest

The authors declare no conflicts of interest.

References

  1. Sundar, V. Ocean Wave Energy. In Ocean Wave Mechanics; John Wiley & Sons, Ltd.: Chichester, UK, 2015; pp. 201–214. ISBN 978-1-119-24165-2. [Google Scholar]
  2. Zhang, C.; Ning, D. Hydrodynamic Study of a Novel Breakwater with Parabolic Openings for Wave Energy Harvest. Ocean Eng. 2019, 182, 540–551. [Google Scholar] [CrossRef]
  3. Yuan, Z.; Wei, C.; Hai, Y.; Li, M.; Liu, Y.; Xue, G. Impact of Turbine Operation Modes on Energy Conversion in Oscillating Water Column Wave Energy Converter. Phys. Fluids 2025, 37, 075166. Available online: https://pubs.aip.org/aip/pof/article-abstract/37/7/075166/3354914/Impact-of-turbine-operation-modes-on-energy?redirectedFrom=fulltext (accessed on 20 September 2025). [CrossRef]
  4. Falcão, A.F.D.O. Wave Energy Utilization: A Review of the Technologies. Renew. Sustain. Energy Rev. 2010, 14, 899–918. [Google Scholar] [CrossRef]
  5. Ma, Y.; Zhang, A.; Yang, L.; Li, H.; Zhai, Z.; Zhou, H. Motion Simulation and Performance Analysis of Two-Body Floating Point Absorber Wave Energy Converter. Renew. Energy 2020, 157, 353–367. [Google Scholar] [CrossRef]
  6. Castro, F.A.; Chiang, L.E. Design Optimization and Experimental Validation of a Two-Body Wave Energy Converter with Adjustable Power Take-Off Parameters. Energy Sustain. Dev. 2020, 56, 19–32. [Google Scholar] [CrossRef]
  7. Li, M.; Wei, C.; Li, L.; Yuan, Z.; Liu, Y.; Xue, G. Numerical Study of Hybrid Systems Combining Different WECs Microarrays Based on the TGL Semi-Submersible Floating Platform. Front. Mar. Sci. 2025, 12, 1563310. [Google Scholar] [CrossRef]
  8. Xu, S.; Wang, S.; Guedes Soares, C. Review of Mooring Design for Floating Wave Energy Converters. Renew. Sustain. Energy Rev. 2019, 111, 595–621. [Google Scholar] [CrossRef]
  9. Zhang, Y.; Zhao, Y.; Sun, W.; Li, J. Ocean Wave Energy Converters: Technical Principle, Device Realization, and Performance Evaluation. Renew. Sustain. Energy Rev. 2021, 141, 110764. [Google Scholar] [CrossRef]
  10. Berenjkoob, M.N.; Ghiasi, M.; Soares, C.G. On the Improved Design of the Buoy Geometry on a Two-Body Wave Energy Converter Model. J. Renew. Sustain. Energy 2019, 11, 054702. [Google Scholar] [CrossRef]
  11. Son, D.; Belissen, V.; Yeung, R.W. Performance Validation and Optimization of a Dual Coaxial-Cylinder Ocean-Wave Energy Extractor. Renew. Energy 2016, 92, 192–201. [Google Scholar] [CrossRef]
  12. Li, D.; Dong, X.; Shi, H.; Li, Y. Theoretical and Experimental Study of A Coaxial Double-Buoy Wave Energy Converter. China Ocean Eng. 2021, 35, 454–464. [Google Scholar] [CrossRef]
  13. Amiri, A.; Panahi, R.; Radfar, S. Parametric Study of Two-Body Floating-Point Wave Absorber. J. Marine. Sci. Appl. 2016, 15, 41–49. [Google Scholar] [CrossRef]
  14. Tan, Y.; Lin, K.; Zhang, Z. Comprehensive Modelling of A Slotess Halbach Linear Generator Based Wave Energy Converter. In Proceedings of the IECON 2018—44th Annual Conference of the IEEE Industrial Electronics Society, Washington, DC, USA, 21–23 October 2018; pp. 1717–1722. [Google Scholar]
  15. Gao, Y.; Shao, S.; Zou, H.; Tang, M.; Xu, H.; Tian, C. A Fully Floating System for a Wave Energy Converter with Direct-Driven Linear Generator. Energy 2016, 95, 99–109. [Google Scholar] [CrossRef]
  16. Al Shami, E.; Wang, X.; Zhang, R.; Zuo, L. A Parameter Study and Optimization of Two Body Wave Energy Converters. Renew. Energy 2019, 131, 1–13. [Google Scholar] [CrossRef]
  17. Payne, G.S.; Taylor, J.R.M.; Bruce, T.; Parkin, P. Assessment of Boundary-Element Method for Modelling a Free-Floating Sloped Wave Energy Device. Part 1: Numerical Modelling. Ocean Eng. 2008, 35, 333–341. [Google Scholar] [CrossRef]
  18. Kurniawan, A.; Grassow, M.; Ferri, F. Numerical Modelling and Wave Tank Testing of a Self-Reacting Two-Body Wave Energy Device. Ships Offshore Struct. 2019, 14, 344–356. [Google Scholar] [CrossRef]
  19. Li, Q.; Murai, M.; Kuwada, S. A Study on Electrical Power for Multiple Linear Wave Energy Converter Considering the Interaction Effect. Energies 2018, 11, 2964. [Google Scholar] [CrossRef]
  20. Wei, C.; Liu, Y.; Li, L.; Xue, G.; Huang, S. Hydrodynamic and Energy Capture Analysis of Oscillating Water Column Wave Energy Converter Arrays with Shared Mooring under Concentrated Wave Action by Parabolic Breakwater. Phys. Fluids 2025, 37, 083301. Available online: https://pubs.aip.org/aip/pof/article-abstract/37/8/083301/3357318/Hydrodynamic-and-energy-capture-analysis-of?redirectedFrom=fulltext (accessed on 23 September 2025). [CrossRef]
  21. Edwards, K.A.; Mekhiche, M. Ocean Power Technologies Powerbuoy®: System—Level Design, Development and Validation Methodology. In Proceedings of the 2nd Marine Energy Technology Symposium METS2014, Seattle, WA, USA, 15–18 April 2014. [Google Scholar]
  22. Fard, H.R.; Mahmoodi, K.; Vaghefi, M. Geometry Optimization of a Two-Body Heaving Point Absorber Wave Energy Converter Based on the Long-Term Oman Gulf Wave Climate. Renew. Energy 2025, 253, 123498. [Google Scholar] [CrossRef]
  23. Zheng, C.W.; Zhou, L.; Jia, B.K.; Pan, J.; Li, X. Wave Characteristic Analysis and Wave Energy Resource Evaluation in the China Sea. J. Renew. Sustain. Energy 2014, 6, 043101. [Google Scholar] [CrossRef]
  24. Bosma, B.; Zhang, Z.; Brekken, T.K.A.; Oezkan-Haller, H.T.; McNatt, C.; Yim, S.C. Wave Energy Converter Modeling in the Frequency Domain: A Design Guide. In Proceedings of the 2012 IEEE Energy Conversion Congress and Exposition (ECCE), Raleigh, NC, USA, 15–20 September 2012; pp. 2099–2106. [Google Scholar]
  25. Bosma, B.; Brekken, T.K.A.; Oezkan-Haller, H.T.; Yim, S.C. Wave Energy Converter Modeling in the Time Domain: A Design Guide. In Proceedings of the 2013 1ST IEEE Conference on Technologies for Sustainability (SUSTECH), Portland, OR, USA, 1–2 August 2013; pp. 103–108. [Google Scholar]
  26. Xu, Q.-L.; Li, Y.; Lin, Z.-L. An Improved Boundary Element Method for Modelling a Self-Reacting Point Absorber Wave Energy Converter. Acta Mech. Sin. 2018, 34, 1015–1034. [Google Scholar] [CrossRef]
  27. Gaebele, D.T.; Anderson, M.L.; Roach, A.L.; Forbush, D.D.; Roberts, J.D.; Weber, J. From TPL Assessment to Design Optimization: Wave Energy Converter Control Co-Design Applied to the RM3. Renew. Energy 2025, 241, 122338. [Google Scholar] [CrossRef]
  28. Ruehl, K.; Brekken, T.K.; Bosma, B.; Paasch, R. Large-Scale Ocean Wave Energy Plant Modeling. In Proceedings of the 2010 IEEE Conference on Innovative Technologies for an Efficient and Reliable Electricity Supply, Waltham, MA, USA, 27–29 September 2010. [Google Scholar]
  29. Ji, X.; Shami, E.A.; Monty, J.; Wang, X. Modelling of Linear and Non-Linear Two-Body Wave Energy Converters under Regular and Irregular Wave Conditions. Renew. Energy 2020, 147, 487–501. [Google Scholar] [CrossRef]
  30. Zhang, L.; Jin, P.; Zhou, B.; Zheng, X.; Liu, H. Oscillation and Conversion Performance of Double-Float Wave Energy Converter. J. Marine. Sci. Appl. 2019, 18, 54–63. [Google Scholar] [CrossRef]
  31. Wang, Y. Predicting Absorbed Power of a Wave Energy Converter in a Nonlinear Mixed Sea. Renew. Energy 2020, 153, 362–374. [Google Scholar] [CrossRef]
  32. Agyekum, E.B.; PraveenKumar, S.; Eliseev, A.; Velkin, V.I. Design and Construction of a Novel Simple and Low-Cost Test Bench Point-Absorber Wave Energy Converter Emulator System. Inventions 2021, 6, 20. [Google Scholar] [CrossRef]
  33. Hart, P.; Lurie, R.F. Application of PowerBuoy Wave Energy Converter Technology to Remote Power Requirements in Oil and Gas Field Developments. In Proceedings of the Offshore Technology Conference, Houston, TX, USA, 30 April–3 May 2012. [Google Scholar]
  34. Muliawan, M.J.; Gao, Z.; Moan, T. Application of the Contour Line Method for Estimating Extreme Responses in the Mooring Lines of a Two-Body Floating Wave Energy Converter. J. Offshore Mech. Arct. Eng. 2013, 135, 031301. [Google Scholar] [CrossRef]
  35. Elwood, D.; Yim, S.C.; Prudell, J.; Stillinger, C.; Von Jouanne, A.; Brekken, T.; Brown, A.; Paasch, R. Design, Construction, and Ocean Testing of a Taut-Moored Dual-Body Wave Energy Converter with a Linear Generator Power Take-Off. Renew. Energy 2010, 35, 348–354. [Google Scholar] [CrossRef]
  36. Wu, B.; Diao, X.; Wang, K. 10 kW Floating Point Absorber Direct Drive Wave Energydevice. Ocean. Technol. 2012, 31, 68–73. [Google Scholar]
  37. Liu, Y.; Wu, S.; Wang, D.; Wang, R. Research Progress of Ocean Wave Energy Converters. J. Shandong Univ. (Eng. Sci.) 2021, 51, 63–75. [Google Scholar]
  38. Luo, H.Q.; Liu, Y.J.; Zhang, M.Q.; Rui, J. Hydrodynamic Research on Floating Body of Oscillating Buoy Wave Power Device Based on AQWA. Ship Eng. 2016, 38, 39–42. [Google Scholar]
  39. Newman, J.N. The Theory of Ship Motions. In Advances in Applied Mechanics; Elsevier: Amsterdam, The Netherlands, 1979; pp. 221–283. ISBN 978-0-12-002018-8. [Google Scholar]
  40. Bao, X.; Xiao, W.; Li, S.; Iglesias, G. Parametric Study and Optimization of a Two-Body Wave Energy Converter. IET Renew. Power Gener. 2021, 15, 3319–3330. [Google Scholar] [CrossRef]
Figure 1. Force analysis of heave motion in two-body WECs.
Jmse 13 01881 g001
Figure 2. The four two-body WECs. (a) SC-S. (b) SC-P. (c) DB-S. (d) DB-P.
Jmse 13 01881 g002
Figure 3. Mooring system arrangement.
Jmse 13 01881 g003
Figure 4. Numerical modeling.
Jmse 13 01881 g004
Figure 5. Structural schematic of the SDU-III WEC.
Jmse 13 01881 g005
Figure 6. The experimental setup of the SDU-III WEC during sea trials.
Jmse 13 01881 g006
Figure 7. Three-dimensional structure diagram of the SDU-III WEC.
Jmse 13 01881 g007
Figure 8. Location map of Tuoji Island.
Jmse 13 01881 g008
Figure 9. Sea trial of the SDU-III WEC at Tuoji Island.
Jmse 13 01881 g009
Figure 10. TLS laser displacement sensor.
Jmse 13 01881 g010
Figure 11. Peak-to-peak value versus wave period under various wave incidence angles.
Jmse 13 01881 g011
Figure 12. Peak-to-peak value versus wave height under various wave incidence angles.
Jmse 13 01881 g012
Figure 13. Schematic diagram of the relative displacement from 13:00 to 14:00 on 5 November 2023.
Jmse 13 01881 g013
Figure 14. Comparison of sea trial and numerical simulation results.
Jmse 13 01881 g014
Figure 15. Relative errors between numerical results and sea trial (experimental) results.
Jmse 13 01881 g015
Figure 16. RAO comparison of the main buoys for the four WECs.
Jmse 13 01881 g016
Figure 17. Added mass comparison of the main buoys for the four WECs.
Jmse 13 01881 g017
Figure 18. Radiation damping comparison of the main buoys for the four WECs.
Jmse 13 01881 g018
Figure 19. Wave excitation force comparison of the main buoys for the four WECs.
Jmse 13 01881 g019
Figure 20. Motion responses of the four main buoys under RLC1 (T = 4.0 s, H = 1.0 m).
Jmse 13 01881 g020
Figure 21. Motion responses of the four main buoys under RLC2 (T = 5.5 s, H = 1.8 m).
Jmse 13 01881 g021
Figure 22. Motion responses of the four main buoys under RLC3 (T = 7.5 s, H = 3.2 m).
Jmse 13 01881 g022
Figure 23. Maximum mooring tensions for four WECs in the RLC1 wave case.
Jmse 13 01881 g023
Figure 24. Maximum mooring tensions for four WECs in the RLC2 wave case.
Jmse 13 01881 g024
Figure 25. Maximum mooring tensions for four WECs in the RLC3 wave case.
Jmse 13 01881 g025
Figure 26. Relative displacement of the four WECs under the RLC1 wave case.
Jmse 13 01881 g026
Figure 27. Relative displacement of the four WECs under the RLC2 wave case.
Jmse 13 01881 g027
Figure 28. Relative displacement of the four WECs under the RLC3 wave case.
Jmse 13 01881 g028
Figure 29. Power absorption of the four WECs across wave cases.
Jmse 13 01881 g029
Figure 30. CWR of the four WECs across wave cases.
Jmse 13 01881 g030
Table 1. Research advantages comparison.
Existing Research LimitationsAdvantages of This Study
Configuration optimization
  • Suboptimal main structure geometry
  • Relies on solid plates for ballast
  • Limited exploration of appendages
  • Pioneering dish-shaped buoy + perforated damping plate
  • Synergistically regulates flow and vortex-induced vibrations
  • Significantly improves stability and power absorption efficiency
Numerical simulation
  • Focus on single body/linear systems
  • Limited accuracy in nonlinear coupling
  • Oversimplified environmental conditions
  • High-fidelity, fully-coupled nonlinear model
  • Accurately simulates two-body and flow field interactions
  • Closely represents realistic marine environments
Sea trial
  • Demonstrated basic feasibility
  • Challenges: high mooring loads, survivability
  • Barriers to large-scale deployment
  • Focuses on high stability and low mooring loads
  • Enhances structural durability and survivability
  • Provides a reliable solution for commercial deployment
Table 2. Key parameters of the four WECs.
Key ParametersMain BuoyFloat
SC-SSC-PDB-SDB-P
Mass (kg)55,26055,50086,63086,90018,225
Center of gravity (m)(0, 0, −7.87)(0, 0, −7.82)(0, 0, −7.05)(0, 0, −7.01)(0, 0, −0.04)
Roll inertia Ixx (kg/m2)2.81 × 1062.80 × 1063.37 × 1063.35 × 1065.06 × 104
Pitch inertia Iyy (kg/m2)2.81 × 1062.80 × 1063.37 × 1063.35 × 1065.06 × 104
Yaw inertia Izz (kg/m2)8.18 × 1048.09 × 1041.86 × 1051.85 × 1059.63 × 104
Table 3. Parameters and coordinates of the mooring lines.
NameCoordinate
Mooring linePosition of the fairleadsPosition of the anchors
Line 1 (m)(1.184, 1.184, −19.3)(45.1, 45.1, −30)
Line 2 (m)(1.184, −1.184, −19.3)(45.1, −45.1, −30)
Line 3 (m)(−1.184, −1.184, −19.3)(−45.1, −45.1, −30)
Line 4 (m)(−1.184, 1.184, −19.3)(−45.1, 45.1, −30)
Length (m)64
Mass in water (kg/m)52.31
Anchor radius (m)64.2
Table 4. Key parameters of the SDU-III WEC.
CompositionMain ParametersValue
Main BuoyMain buoy height23 m
Draught19.3 m
Diameter2 m
Maximum diameter of disc-shaped buoy6 m
Minimum diameter of disc-shaped buoy4 m
Height of disc-shaped buoy2 m
Height of the damping plate3.25 m
Damping plate dimensions3.65 × 6 m
FloatHeight of float7.6 m
Draught0.69 m
Float height1.3 m
Diameter6.2 m
Table 5. Wave conditions during sea trials.
DateWave Height (m)Wave Period (s)
11.40.64.0
11.52.04.0
11.63.37.0
11.71.35.0
11.81.24.5
11.91.25.0
11.101.45.0
11.111.05.0
11.121.65.0
11.131.44.5
11.141.85.0
Table 6. Environmental conditions.
Load CaseWave Height (m)Wave Period (s)
RLC11.04.0
RLC21.85.5
RLC33.27.5
Table 7. Motion response amplitudes of the four main buoys under three wave cases.
Wave CaseDegree of FreedomSC-S (m)SC-P (m)DB-S (m)DB-P (m)
RLC1Surge0.5840.6110.5530.573
Heave0.0480.0470.0810.091
Pitch2.5282.6892.3312.460
RLC2Surge1.2641.3611.2101.349
Heave0.2500.2800.3430.399
Pitch4.6425.5273.0714.926
RLC3Surge2.6962.9792.9423.130
Heave0.6970.7350.9661.031
Pitch10.24911.45211.29312.156
Table 8. Average and peak power of the four WECs across wave cases.
Power
Absorption
SC-S (kW)SC-P (kW)DB-S (kW)DB-P (kW)
MeanPeakMeanPeakMeanPeakMeanPeak
RLC132.8652.6534.0855.1530.6549.9031.1550.86
RLC260.3894.5366.72103.2662.3395.4968.28106.25
RLC3101.68147.78110.15162.56110.72159.54116.94173.03
Disclaimer/Publisher’s Note: The statements, opinions and data contained in all publications are solely those of the individual author(s) and contributor(s) and not of MDPI and/or the editor(s). MDPI and/or the editor(s) disclaim responsibility for any injury to people or property resulting from any ideas, methods, instructions or products referred to in the content.