Abstract
Shipping carries over 80% of global trade volumes and emits 3% of global greenhouse gas emissions, but it is hard to abate due to the simple fact that ships require a lot of energy and move around. Therefore, a large amount of research and development is poured into understanding the choices of alternative fuels and developing new technologies. Unfortunately, much of the work and policies derived, therefore, seem to rest on a hidden assumption that a relevant amount of green alternative fuel will be available, but that assumption does not stand up to scrutiny on a global level. For example, the results show that decarbonizing global shipping using green ammonia produced from renewable energy sources will require 3.7 times the total EU-27 power production in 2022. The purpose and novelty of this paper are to offer a clear rationale for the correct contextualization of research and development on curbing greenhouse gas emissions from global shipping and individual shipping segments to avoid overpromising and underdelivering.
1. Introduction
Shipping carries over 80% of global trade volume [1] and emits about 3% of the total global greenhouse gas (GHG) emissions, or slightly above the GHG emissions of Germany as a whole country [2]. Without any effective countermeasures, the share is expected to grow to 10–13% [3].
The challenge with ships is that they move and consume large quantities of energy, and batteries are not relevant. Large ships require about 3000 MWh per day on average [4], which is on par with the largest grid battery in the world (Moss Landing Energy Storage Facility) with its 3000 MWh capacity [5]. In fact, a state-of-the-art Lithium Ion (Li-ion) battery’s energy content (kWh/kg) is approximately 50 times smaller than that of liquid fossil fuels [6]. Therefore, batteries are only relevant for short distances. However, batteries can serve as an excellent technology for peak-shaving, thus reducing the load variations on main and auxiliary machinery, resulting in subsequent lower GHG emissions and operating costs.
Therefore, the focus is currently on alternative fuels in shipping. The term ‘alternative fuels’, however, is not unambiguously defined. The DNV Alternative Fuels Insight online platform is useful because it published actual commercial activities, and in the first 11 months of 2024, it has logged 252 ships contracted using LNG, 47 using LPG, 162 using methanol, 23 using ammonia, and only 7 using hydrogen. Out of these, hydrogen, ammonia, and methanol have very low life-cycle GHG emissions and, therefore, constitute the foci of this paper.
Green ammonia is produced as 100% renewable and carbon-free by using hydrogen from water electrolysis and nitrogen separated from the air, which is subsequently fed into the Haber–Bosch process, all powered by sustainable electricity [7]. “There is a strong focus on [green] ammonia as a possible alternative to fossil carbon fuel for propulsion”, according to Andrea Pestarino at the Engimmonia project [3]. Furthermore, he estimates that “[green] Ammonia is currently seen as the most efficient way to decarbonize the shipping sector, especially propulsion”. This view is shared by most, and “The alternative energy fuels most suited for international shipping are primarily advanced biofuels and e-fuels (i.e., synthetic fuels), namely methanol and ammonia” [1].
Green methanol is produced from methanol from renewable electricity (e-methanol) and captured carbon dioxide [8] reducing the GHG emissions by 59% in comparison to the conventional processes [9] and, therefore, within the climate targets set forth by IMO [10] for the next decades. Conceptually, renewable electricity is used to produce green compressed hydrogen by water electrolysis, whereas CO2 can be captured from concentrated sources (e.g., flue gas from power generation or industrial plants) or directly from air. In the remainder of this paper, green hydrogen is understood as green compressed hydrogen at 350 bar pressure.
Biofuels are also green alternative fuels, but it is critical to distinguish between biofuels produced using virgin biomass, which is far from sustainable [11], and biofuels using genuine biological waste. The ultimate dilemma regarding biofuel is, therefore, the intensified competition for finite land [12]. Basically, a key barrier for biofuels at relevant scales is the lack of sufficient quantities of some biofuels for large-scale experimentation and costs [13].
The purpose of this paper is to address the fact that the production of these green alternative fuels is taken for granted; see, for example, [6], which has written an otherwise excellent paper. In fact, all technologies that use hydrogen have additional major practical challenges [14]; although, green methanol has a major benefit over the other green alternative fuels in that the current install base of engines can be used with only minor changes. The availability of green alternative fuels at scale is also taken for granted in policy documents, such as in the UK [15] and IMO [16]. There are also papers, reports, and books that do not discuss fuel availability at all.
Despite the importance of fuel availability in addressing the climate goals set forth by IMO [10], there are very few documents addressing the availability of green alternative fuels. The excellent study of [17] is an exemption, but it does not model the global fleet and how large the demand for green alternative fuels will become. Another interesting study [18] considerably underestimates the amount of fuel consumed by shipping globally, but it reaches a similar conclusion as this paper in that the required amount of electricity from renewable energy sources is prohibitively large (5500 TWh/year). This report to the IMO has unfortunately not been taken into account in any IMO policies, as far as this author observes. Neither of the two aforementioned studies are peer-reviewed.
The purpose of this paper is, therefore, to research the availability of green alternative fuels to better understand the implications of scaling these fuels to a global level and question the assumption that green alternative fuels will be available. Furthermore, it will become the first peer-reviewed study on the topic. The novelty of this paper is to discuss the availability of green alternative fuels explicitly, on a correct global scale, taking into account all major fossil fuels used by shipping. Obtaining a correct scale is necessary to understand the decarbonization challenge. This paper will also break the results down into the different shipping segments to provide additional understanding. Finally, this study provides a correct contextualization for research and development, including exemplifying niches where green alternative fuels can succeed at a useful scale.
This study has a narrow scope, focusing only on fuel availability to ensure that this crucial aspect of decarbonizing shipping receives the attention it deserves. There is no doubt, however, that cost analyses are also required to obtain a complete picture of green alternative fuels, particularly given the importance of shipping in the world economy. Unfortunately, cost analyses in the literature are far from converging towards any consensus, and including them in this paper would be a major undertaking in itself, requiring a full review and additional analyses. Cost analyses are, therefore, future work.
2. Materials and Methods
The method is straightforward and consists of five steps, which are explained in the subsequent sections. The first step is to obtain the necessary input data from the literature, which is split into two separate sections for clarity.
2.1. Step 1A—Estimate the Total Fossil Fuel Consumed by Shipping in 2022
First, the fuel requirements of today’s global shipping are identified from the literature, using 2022 as a reference year. The dataset [19] of fossil fuel consumption has an overall best fit with other literature sources. The data set is from 2012 and must be updated. The data set can be updated by using the annual growth in tonnage from 2011 to 2022, which is 4.9% [1]. However, the growth of tonnage is not necessarily the same as growth in fuel consumption. For example, focusing on the Heavy Fuel Oil (HFO) segment only, the estimated HFO consumption in 2022 would be more than 50 million tonnes (Mtonnes) higher than we find in other sources. Therefore, to stay on the conservative side, 300 Mtonnes HFO [20] are used to scale the data of [19] from 2012 to 2022. The result is an increased fuel consumption of 32% across all fossil fuel categories, assuming a constant mix; see Figure 1. The data of [14,21] are almost in full agreement—only a deviation of 1.8% on HFO for which they both provide data.
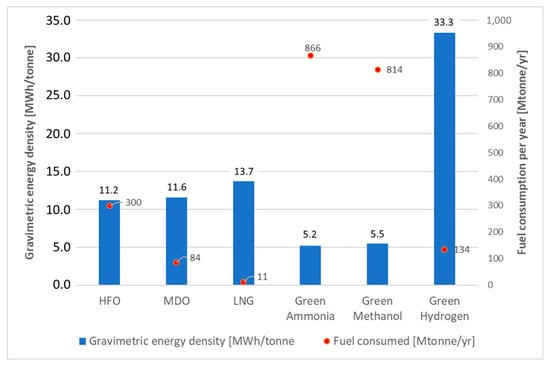
Figure 1.
Gravimetric energy density [MWh/tonne] of fuels and the amount of green alternative fuel [Mtonne/yr] that corresponds to the same amount of energy to shipping as the three fossil fuels (HFO, MDO, and LNG) in 2022. Authors fuel calculations based on data from [14,19,20,21].
2.2. Step 1B—Obtain the Gravimetric Energy Density of the Respective Fossil Fuels
To convert fossil fuels to the energy-equivalent amount of green alternative fuels, gravimetric energy density data are used; see Figure 1. These data are based on physiochemical properties, but measuring them can introduce some uncertainties; see [17].
Note that such physiochemical properties are not subject to innovation or anything—just as little as gravity is. ‘Gravimetric energy density’ is not the same as ‘volumetric energy density’ [22]. Gravimetric energy density is the energy available per unit mass [Joule/kg or MWh/kg] and is often referred to as ‘specific energy’, whereas volumetric energy density is what a physicist will refer to as ‘energy density’ and is measured as the amount of energy per unit volume [Joule/m3 or MWh/m3]. Volumetric and gravimetric energy densities are therefore related through the density of the substance [kg/m3], which may vary for some substances according to temperature and pressure, see for example [23], making quantification difficult under certain circumstances that are not relevant here. Note that power density is essentially the instantaneous gravimetric energy density focusing on effect (power) and not energy (power over time).
2.3. Step 2—Estimate the Energy Equivalent Amount of Green Alternative Fuels Using the Gravimetric Energy Density of the Respective Fossil Fuels
By assuming that the ships will operate as today, the amount of fossil fuels can be converted into the energy equivalent amount of green ammonia, green methanol, and green hydrogen by using the gravimetric energy density data found in Figure 1. Using the axis to the right in Figure 1, we see that 866 Mtonnes of green ammonia, 814 Mtonnes of green methanol, or 134 Mtonnes of hydrogen will produce the same amount of energy as the 395 Mtonnes of fossil fuels (300 Mtonnes HFO, 84 Mtonnes MDO, and 11 Mtonnes LNG).
2.4. Step 3—Estimate the Amount of Electricity Required to Produce the Green Alternative Fuels
The production of green alternative fuels will require a certain amount of specific electricity, as shown in Figure 2. For simplicity, it is assumed that there are no losses in transmissions, grid bottlenecks, or the like concerning the electricity used in the production of green alternative fuels. This is, of course, a convenient assumption, but it also results in a conservative estimate. For example, in Norway, the losses in the grid are in the order of 6–7%.
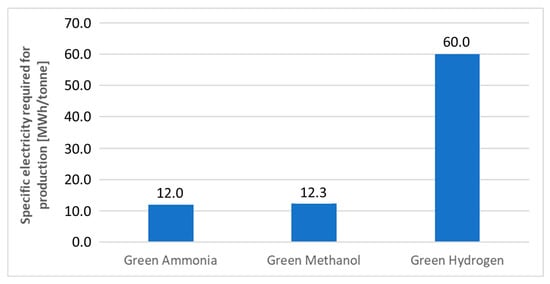
Figure 2.
Specific electricity [MWh/tonne] required to make green alternative fuels. Data are from [8,14,17].
It is also assumed that variable renewable energy can be used for electrolysis because it is a common assumption in the literature—the very definitions of green alternative fuels depend on this assumption. Practically all industrial users, however, need 100% reliability, particularly for large industrial installations and energy-intensive processes [24]. A shutdown of an LNG plant, for example, creates both a safety hazard and a major loss of production, taking up to 48 h to come back online [25]. Currently, only hydroelectric power (of the renewable energy types) is used for large industrial facilities. Therefore, using variable renewable energy is a questionable assumption.
Note that the exact technologies used in the conversion processes behind the steps discussed will introduce some uncertainties in both the production and demand for green alternative fuels. Hence, the estimates probably have an accuracy of ±10%, which is accurate enough given the overall conclusion.
The renewable electricity required (RER) per year to produce a certain amount of green alternative fuel (GAF) can be calculated from Equation (1) by multiplying the fossil fuel consumption (FFC) by the corresponding gravimetric energy density (GED) and dividing the sum of all fossil fuels (HFO, MDO and LNG) by the gravimetric energy density (GED) of the green alternative fuel in question and multiply it by its specific electricity (SE) requirement in production:
2.5. Step 4—Compare Results to a Known Entity to Make a Compelling Argument
Understanding large numbers is difficult, and to make a compelling comparison, in order to help people understand the scale, data for major countries and continents are used. The challenge with such data is that there are often minor discrepancies. For example, while the total EU-27 electricity production in 2022 was 2641 TWh [26], the same figure from OurWorldInData is 2812 TWh or 6.5% higher. Such smaller differences are common, but they do not influence the overall conclusion.
2.6. Step 5—Break Results Down into Different Ship Segments for Better Understanding
Finally, different ship segments are analyzed using data from [6], assuming that the shipping segment mix is constant, as noted earlier. By understanding the different shipping segments better, more suitable solutions can arguably be found, and research and development can be better contextualized.
3. Results
The electricity required to produce green alternative fuels is shown in Figure 3. Green ammonia and green methanol will require more than 10,000 TWh/yr of available electricity. The suitability of these fuels for shipping, as argued by [1], is therefore highly questionable due to the scale of the available electricity required. Green hydrogen comes out somewhat better, but not enough to make a material difference.
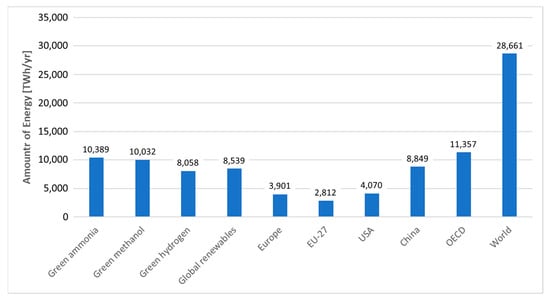
Figure 3.
The electricity requirement of decarbonizing shipping [TWh/yr] compared to large geographical entities. Note that renewable energy in the figure also includes hydro.
Some context is beneficial to help us understand the scale; see Figure 3. Of all the major industrial entities on the planet, only the entire world or the entire Organization of Economic Cooperation and Development (OECD) will have enough electricity supply but at the expense of other electricity users. If we include losses, shipping would essentially need all the electricity in the OECD in 2022, which is mostly fossil.
There are currently 38 OECD member countries: Australia, Austria, Belgium, Canada, Chile, Colombia, Costa Rica, Czech Republic, Denmark, Estonia, Finland, France, Germany, Greece, Hungary, Iceland, Ireland, Israel, Italy, Japan, South Korea, Latvia, Lithuania, Luxembourg, Mexico, The Netherlands, New Zealand, Norway, Poland, Portugal, Slovak Republic, Slovenia, Spain, Sweden, Switzerland, Türkiye, United Kingdom, and the United States of America.
Some more details may be helpful in better targeting decarbonization approaches. The results per shipping segment are shown in Table 1, Table 2 and Table 3. Evidently, the large shipping segments, such as container ships, will require as much electricity as the entire EU-27; see Figure 3. Even the smallest segments, such as offshore vessels, will require more than half of Germany’s electricity generation, which in 2022 was 561 TWh.

Table 1.
Green ammonia results per ship segments. Authors calculations using the data above and the segmentation from [6]. Overall power conversion loss ratio is found by dividing grand total electricity amount by energy content in the fossil fuels, and for green ammonia, it becomes 2.3 times, which implies 57% losses. Author’s calculations.
Table 2.
Green methanol results per ship segments. Authors calculations using the data above and the segmentation from [6]. Overall power conversion loss ratio is 2.2 times, which implies 55% losses. Author’s calculations.
Table 3.
Green hydrogen results per ship segments. Authors calculations using the data above and the segmentation from [6]. Overall power conversion loss ratio is 1.8 times, which implies 44% losses. Author’s calculations.
Another interesting observation is that about 2.3 times more electric power is necessary to replace fossil fuels on average, and this is because of all the losses in converting electric power into green alternative fuels. In total, 57% of the energy is lost, whereas a large two-stroke engine with heat recovery can give a peak thermal efficiency of 60–65% [6]. There are additional losses in the supply chain for all alternatives.
The key results in Table 1 for green ammonia are shown in Figure 4 for easier comparison. The green methanol and green hydrogen results are very similar. Green hydrogen requires about 20% less electricity than the two other green alternative fuels. This would help, of course, but the sheer amount is still as high as all of the Chinese electricity production that the conclusion becomes materially the same, i.e., that there is insufficient amount of renewable electricity to produce the green alternative fuels.
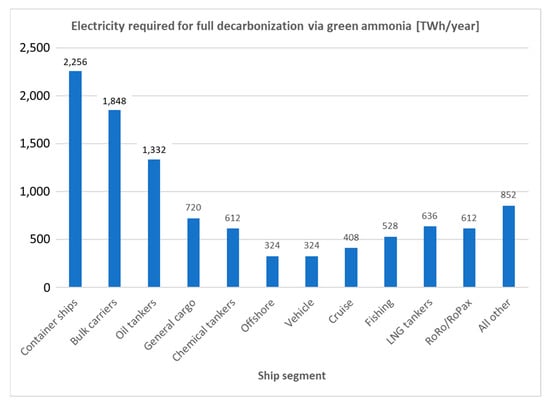
Figure 4.
Electricity required globally to provide green ammonia for all shipping segments.
Note that
- TWh(th) is the unit of the useful part of the thermal energy produced by the engine that results in work being done.
- TWh(e) is the electrical energy used to produce the amount of green alternative fuel that will deliver the equivalent amount of work.
Due to the fact that even the smallest shipping segments are too large to fully supply green alternative fuels, a different approach is required, as discussed in Section 4.
4. Discussion
The presented analysis has one major uncertainty that noticeably impacts the result—the uncertainty of the electricity required to produce green alternative fuels. The literature is not conclusive. The current mid-range estimates for the electricity requirements are therefore used as the best approximation.
To validate the results and prove their robustness, an uncertainty analysis using Monte Carlo simulations of the model is performed, where all parameters are modeled as triangular uncertainty distributions with ±10%, except the electricity required for producing green alternative fuels, where the uncertainty in the literature is ±20%. See [27] for details about how to conduct such analyses and the usage of triangular uncertainty distribution. The results are shown in Figure 5 for the green alternative fuels discussed here.
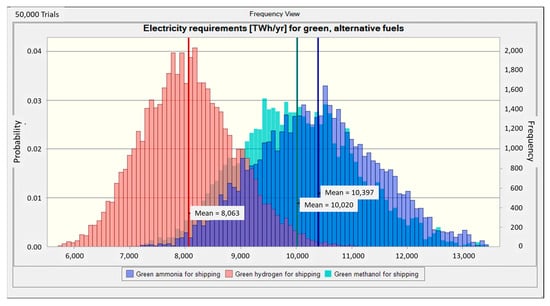
Figure 5.
Electricity [TWh/yr] required globally to provide green ammonia for all shipping segments where actual data uncertainties are included.
With the inherent conservatism of the analysis, the overall conclusion stands irrespectively because the estimated electricity requirements are so large that the amount of renewable electricity required to produce green alternative fuels is far beyond the current power system capabilities. Thus, the conclusion is robust beyond any uncertainties.
Given that humanity has spent more than 100 years developing the current power system, the time horizon discussed here becomes beyond the foreseeable future and probably also beyond 2100. Thus, fresh thinking is required with more realistic contextualization concerning the availability of green alternative fuels.
For completeness, it is also useful to discuss two related topics that are frequently mentioned in the same context: (1) aviation as another example of a hard-to-abate industry, and (2) a possible solution before we discuss how to improve the contextualization of research and development in Section 4.3.
4.1. Green Alternative Fuels for Aviation
The annual jet fuel consumption of 220 Mtonnes [28] and the overall demand is expected to grow. The higher gravimetric energy density of jet fuel compared to HFO indicates that replacing the 220 Mtonnes of jet fuel with green alternative fuels will require more renewable electric power than the same amount of HFO. Thus, if we add aviation to the same discussion, providing green alternative fuel from renewable energy sources will worsen the situation considerably. In fact, we are talking more or less about a doubling to almost 20,000 TWh/yr.
4.2. A Possible Solution
Power density (the time derivative of energy density) has always been a key driver of development [29], and the next step on the gravimetric energy density ladder is nuclear power. For shipping, the traditional light water reactor technologies have issues [30], but some Generation IV reactor technologies have promising results [31]. Researching nuclear propulsion is, therefore, a possible avenue for the future of maritime transport, particularly for large ships that arguably have no green alternative fuel options in sight.
Nuclear power has the additional benefit of producing thermal rest energy that can be used for biofuel production and significantly improve the energy calculations of biofuel for a given availability of sustainably gathered biomass. Furthermore, nuclear can also produce alternative fuels directly that can be used for smaller ships and aviation.
4.3. How to Improve the Contextualization of Research and Development
The results show conclusively that a relevant supply of green alternative fuels for shipping as an industry is beyond the capabilities of the current power system, even beyond the foreseeable future. However, this conclusion does not necessarily include small ships such as ferries, fishing vessels, and the like that fall under the ‘All other’ category in Figure 4 for local and mostly domestic shipping.
For example, a similar analysis shows that replacing the 1.15 Mtonnes of MDO consumed by domestic shipping in Norway will require 31 TWh/year of electricity or 23% of the total hydroelectric power production in Norway [32]. Thus, supplying domestic shipping in Norway with green alternative fuels, with a moderate expansion of the power system, is arguably possible.
The keyword of [32] is ‘domestic’. Domestic shipping has, per definition, much shorter routes, thereby reducing the amount of fuel that must be carried along while in transit. Therefore, unlike international shipping, domestic shipping can utilize green alternative fuels by expanding the land-based infrastructure provided that there is a sufficient amount of renewable electricity available. Hydroelectric power is critical in this context to maintain production without safety-related production interruptions, as discussed earlier. Whether or not hydroelectric power is used for applications with such high conversion losses is another question that is outside the scope of the discussion here.
Clearly, research and development of technologies and development of policies must make a conscious choice concerning the availability of green alternative fuels. Basically, the availability of green alternative fuels cannot be taken for granted. There are, however, niches in shipping where a supply of green alternative fuels is possible, as discussed. In the grand scheme of the global shipping industry, however, the relevant scaling of green alternative fuels is practically impossible due to the power system constraints today and well beyond the foreseeable future. Therefore, the availability of green alternative fuels should become an important reality check for all research and development aiming at decarbonizing hard-to-abate industries such as shipping and aviation.
5. Conclusions
This paper has presented some basic realities of replacing fossil fuels in shipping with green alternative fuels for the same amount of work being performed. The required amount of electric power for producing these green alternative fuels is subsequently calculated. Compared on a scale equal to major industrial entities globally, it is proven beyond any doubt that there is basically not enough electricity in the world to make a relevant amount of green alternative fuels for shipping.
Basically, the gravimetric energy densities are orders of magnitude too low, or the thermodynamical losses are too high, for electricity to replace fossil fuel in this particular application. This finding also questions the conventional wisdom of the merit of an all-encompassing electrification of society. There are, however, niches where a relevant supply of green alternative fuels is possible to secure, albeit difficult.
Therefore, much of today’s research on green alternative fuels rests on a hidden assumption—that there will be available fuels. However, green alternative fuels will not be available in relevant quantities unless the research is well contextualized for small ships on short, domestic distances. The fuel availability is, therefore, a key constraint to incorporate in future work on green alternative fuels for shipping.
Furthermore, it seems prudent to open up a wider search for solutions, including nuclear propulsion, based on the fact that the gravimetric energy densities are physical realities that we must respect. The wise words of St. Francis of Assisi come to mind:
Lord, grant me the strength to accept things I cannot change, the courage to change the things I can, and the wisdom to know the difference.
Funding
This research received no external funding including the APC.
Institutional Review Board Statement
The author has attempted to the best of his abilities to abide by the ethical guidelines for authors provided by the publisher.
Informed Consent Statement
Not applicable.
Data Availability Statement
The original contributions presented in this study are included in the article. Further inquiries can be directed to the corresponding author.
Acknowledgments
The author would like to thank the reviewers and the guest editor for providing very detailed and useful feedback which has essentially resulted in the paper as presented.
Conflicts of Interest
The author declares that there are no conflicts of interest.
References
- UNCTAD. Review of Maritime Transport 2023; United Nations, United Nations Conference on Trade and Development (UNCTAD): New York, NY, USA, 2023; p. 126. [Google Scholar]
- Olmer, N.; Comer, B.; Roy, B.; Mao, X.; Rutherford, D. Greenhouse Gas Emissions from Global Shipping, 2013–2015; International Council on Clean Transportation (ICCT): Washington, DC, USA, 2017; p. 27. [Google Scholar]
- King, A. Emissions-Free Sailing Is Full Steam Ahead for Ocean-Going Shipping. Horizon—The EU Research & Innovation Magazine 2022. Available online: https://ec.europa.eu/research-and-innovation/en/horizon-magazine/emissions-free-sailing-full-steam-ahead-ocean-going-shipping (accessed on 15 October 2023).
- Emblemsvåg, J. Electricity is Easy—Fuels are Hard: Lessons from the Maritime Industry. In Handbook of Electrical Power Systems; Freunek, M., Doleski, O., Eds.; De Gruyter: Berlin, Germany, 2024; pp. 843–867. [Google Scholar]
- Lewis, M. The World’s Largest Battery Storage System Just Got Even Larger. Electrek 2023. Available online: https://electrek.co/2023/2008/2003/worlds-largest-battery-storage-system-just-got-even-larger/ (accessed on 10 October 2024).
- Curran, S.; Onorati, A.; Payri, R.; Agarwal, A.K.; Arcoumanis, C.; Bae, C.; Boulouchos, K.; Chuahy, F.D.F.; Gavaises, M.; Hampson, G.J.; et al. The future of ship engines: Renewable fuels and enabling technologies for decarbonization. Int. J. Energy Res. 2024, 25, 85–110. [Google Scholar] [CrossRef]
- The Royal Society. Ammonia: Zero-Carbon Fertiliser, Fuel and Energy Store; The Royal Society: London, UK, 2020; p. 39. [Google Scholar]
- Sollai, S.; Porcu, A.; Tola, V.; Ferrara, F.; Pettinau, A. Renewable methanol production from green hydrogen and captured CO2: A techno-economic assessment. J. CO2 Util. 2023, 68, 102345. [Google Scholar] [CrossRef]
- von der Assen, N.; Jung, J.; Bardow, A. Life-cycle assessment of carbon dioxide capture and utilization: Avoiding the pitfalls. Energy Environ. Sci. 2013, 6, 2721–2734. [Google Scholar] [CrossRef]
- IMO. The 2023 IMO Strategy on Reduction of GHG Emissions from Ships (the 2023 IMO GHG Strategy); International Maritime Organization (IMO): London, UK, 2023; Available online: https://www.imo.org/en/OurWork/Environment/Pages/2023-IMO-Strategy-on-Reduction-of-GHG-Emissions-from-Ships.aspx (accessed on 10 October 2024).
- 800 Scientists. Letter from Scientists to the EU Parliament Regarding Forest Biomass. 2018. Available online: https://sites.tufts.edu/gdae/files/2019/10/LetterFromScientistsToEuParliament_ForestBiomass_Jan2018.pdf (accessed on 10 October 2023).
- Fairley, P. The biofuel course correction. Nature 2022, 611, 15–17. [Google Scholar] [CrossRef] [PubMed]
- Kass, M.; Abdullah, Z.; Biddy, M.; Drennan, C.; Hawkins, T.; Jones, S.; Holladay, J.; Longman, D.; Newes, E.; Theiss, T.; et al. Understanding the Opportunities of Biofuels for Marine Shipping; US Department of Energy, Oak Ridge National Laboratory (ORNL): Oak Ridge, TN, USA, 2018; p. 14. [Google Scholar]
- Kim, K.; Roh, G.; Kim, W.; Chun, K. A Preliminary Study on an Alternative Ship Propulsion System Fueled by Ammonia: Environmental and Economic Assessments. J. Mar. Sci. Eng. 2020, 8, 183. [Google Scholar] [CrossRef]
- Department for Transportation. Clean Maritime Plan; The Crown, Department for Transportation: London, UK, 2019; p. 57. [Google Scholar]
- IMO. Fourth IMO GHG Study 2020; International Maritime Organization (IMO): London, UK, 2021; p. 495. [Google Scholar]
- Genovese, M.; Blekhman, D.; Dray, M.; Fragiacomo, P. Multi-year energy performance data for an electrolysis-based hydrogen refueling station. Int. J. Hydrogen Energy 2024, 52, 688–704. [Google Scholar] [CrossRef]
- Intertanko. Reduction of GHG Emissions from Ships: Analysis of Fuel Options to Meet the Levels of Ambition in the Initial IMO Strategy on Reduction of GHG Emissions from Ships; International Maritime Organization (IMO), Marine Environment Protection Committee: London, UK, 2022; p. 15. [Google Scholar]
- Concawe. Marine Fuel Facts; Concawe: Brussels, Belgium, 2017; Available online: https://www.concawe.eu/wp-content/uploads/marine_factsheet_web.pdf (accessed on 1 October 2024).
- Jacoby, M. The Shipping Industry Looks for Green Fuels. Chemical & Engineering News. 2022. Available online: https://cen.acs.org/environment/greenhouse-gases/shipping-industry-looks-green-fuels/100/i8?ref=search_results (accessed on 4 June 2023).
- Foretich, A.; Zaimes, G.G.; Hawkins, T.R.; Newes, E. Challenges and opportunities for alternative fuels in the maritime sector. Marit. Transp. Res. 2021, 2, 100033. [Google Scholar] [CrossRef]
- Thompson, A.; Taylor, B.N. Guide for the Use of the International System of Units (SI): NIST Special Publication 811; US Department of Commerce, National Institute of Standards and Technology (NIST): Gaithersburg, MD, USA, 2008; p. 78. [Google Scholar]
- Tozzini, V.; Pellegrini, V. Prospects for hydrogen storage in graphene. Phys. Chem. Chem. Phys. 2013, 15, 80–89. [Google Scholar] [CrossRef] [PubMed]
- Csik, B.J.; Kupitz, J. Nuclear power applications: Supplying heat for homes and industries. IAEA Bull. 1997, 39, 21–25. [Google Scholar]
- Devold, H.; Nestli, T.; Hurter, J. All Electric LNG Plants: BETTER, Safer, More Reliable—and Profitable; ABB Process Automation Oil and Gas: Oslo, Norway, 2006; p. 7. [Google Scholar]
- European Council. Infographic—How Is EU Electricity Produced and Sold? European Council, Council of the European Union: Brussels, Belgium, 2023; Available online: https://www.consilium.europa.eu/en/infographics/how-is-eu-electricity-produced-and-sold/ (accessed on 3 June 2023).
- Emblemsvåg, J. Life-Cycle Costing: Using Activity-Based Costing and Monte Carlo Methods to Manage Future Costs and Risks; John Wiley & Sons: Hoboken, NJ, USA, 2003; p. 320. [Google Scholar]
- Tan, E.C.D.; Hawkins, T.R.; Lee, U.; Tao, L.; Meyer, P.A.; Wang, M.; Thompson, T. Techno-Economic Analysis and Life Cycle Assessment of Greenhouse Gas and Criteria Air Pollutant Emissions for Biobased Marine Fuels; US Department of Transportation, Marine Administration, National Renewable Energy Laboratory (NREL): Golden, CO, USA, 2020; p. 29. [Google Scholar]
- Smil, V. Power Density: A Key to Understanding Energy Sources and Uses; MIT Press: Boston, MA, USA, 2016; p. 318. [Google Scholar]
- Schøyen, H.; Steger-Jensen, K. Nuclear propulsion in ocean merchant shipping: The role of historical experiments to gain insight into possible future applications. J. Clean. Prod. 2017, 169, 152–160. [Google Scholar] [CrossRef]
- Emblemsvåg, J. How Thorium-based Molten Salt Reactor can provide clean, safe and cost-effective technology for deep-sea shipping. Mar. Technol. Socieity J. 2021, 55, 56–72. [Google Scholar] [CrossRef]
- Emblemsvåg, J. Fremtiden til grønne maritime drivstoff i Norge—En energianalyse (in Norwegian). Naturen 2025, 150. accepted for publication. [Google Scholar]
Disclaimer/Publisher’s Note: The statements, opinions and data contained in all publications are solely those of the individual author(s) and contributor(s) and not of MDPI and/or the editor(s). MDPI and/or the editor(s) disclaim responsibility for any injury to people or property resulting from any ideas, methods, instructions or products referred to in the content. |
© 2025 by the author. Licensee MDPI, Basel, Switzerland. This article is an open access article distributed under the terms and conditions of the Creative Commons Attribution (CC BY) license (https://creativecommons.org/licenses/by/4.0/).