


Accident Data-Driven Consequence Analysis in Maritime Industries

Abstract
1. Introduction
2. Literature Review
2.1. RIFs of Maritime Accidents
2.2. Consequences of Maritime Accidents
2.3. Research Gaps
3. Research Methods
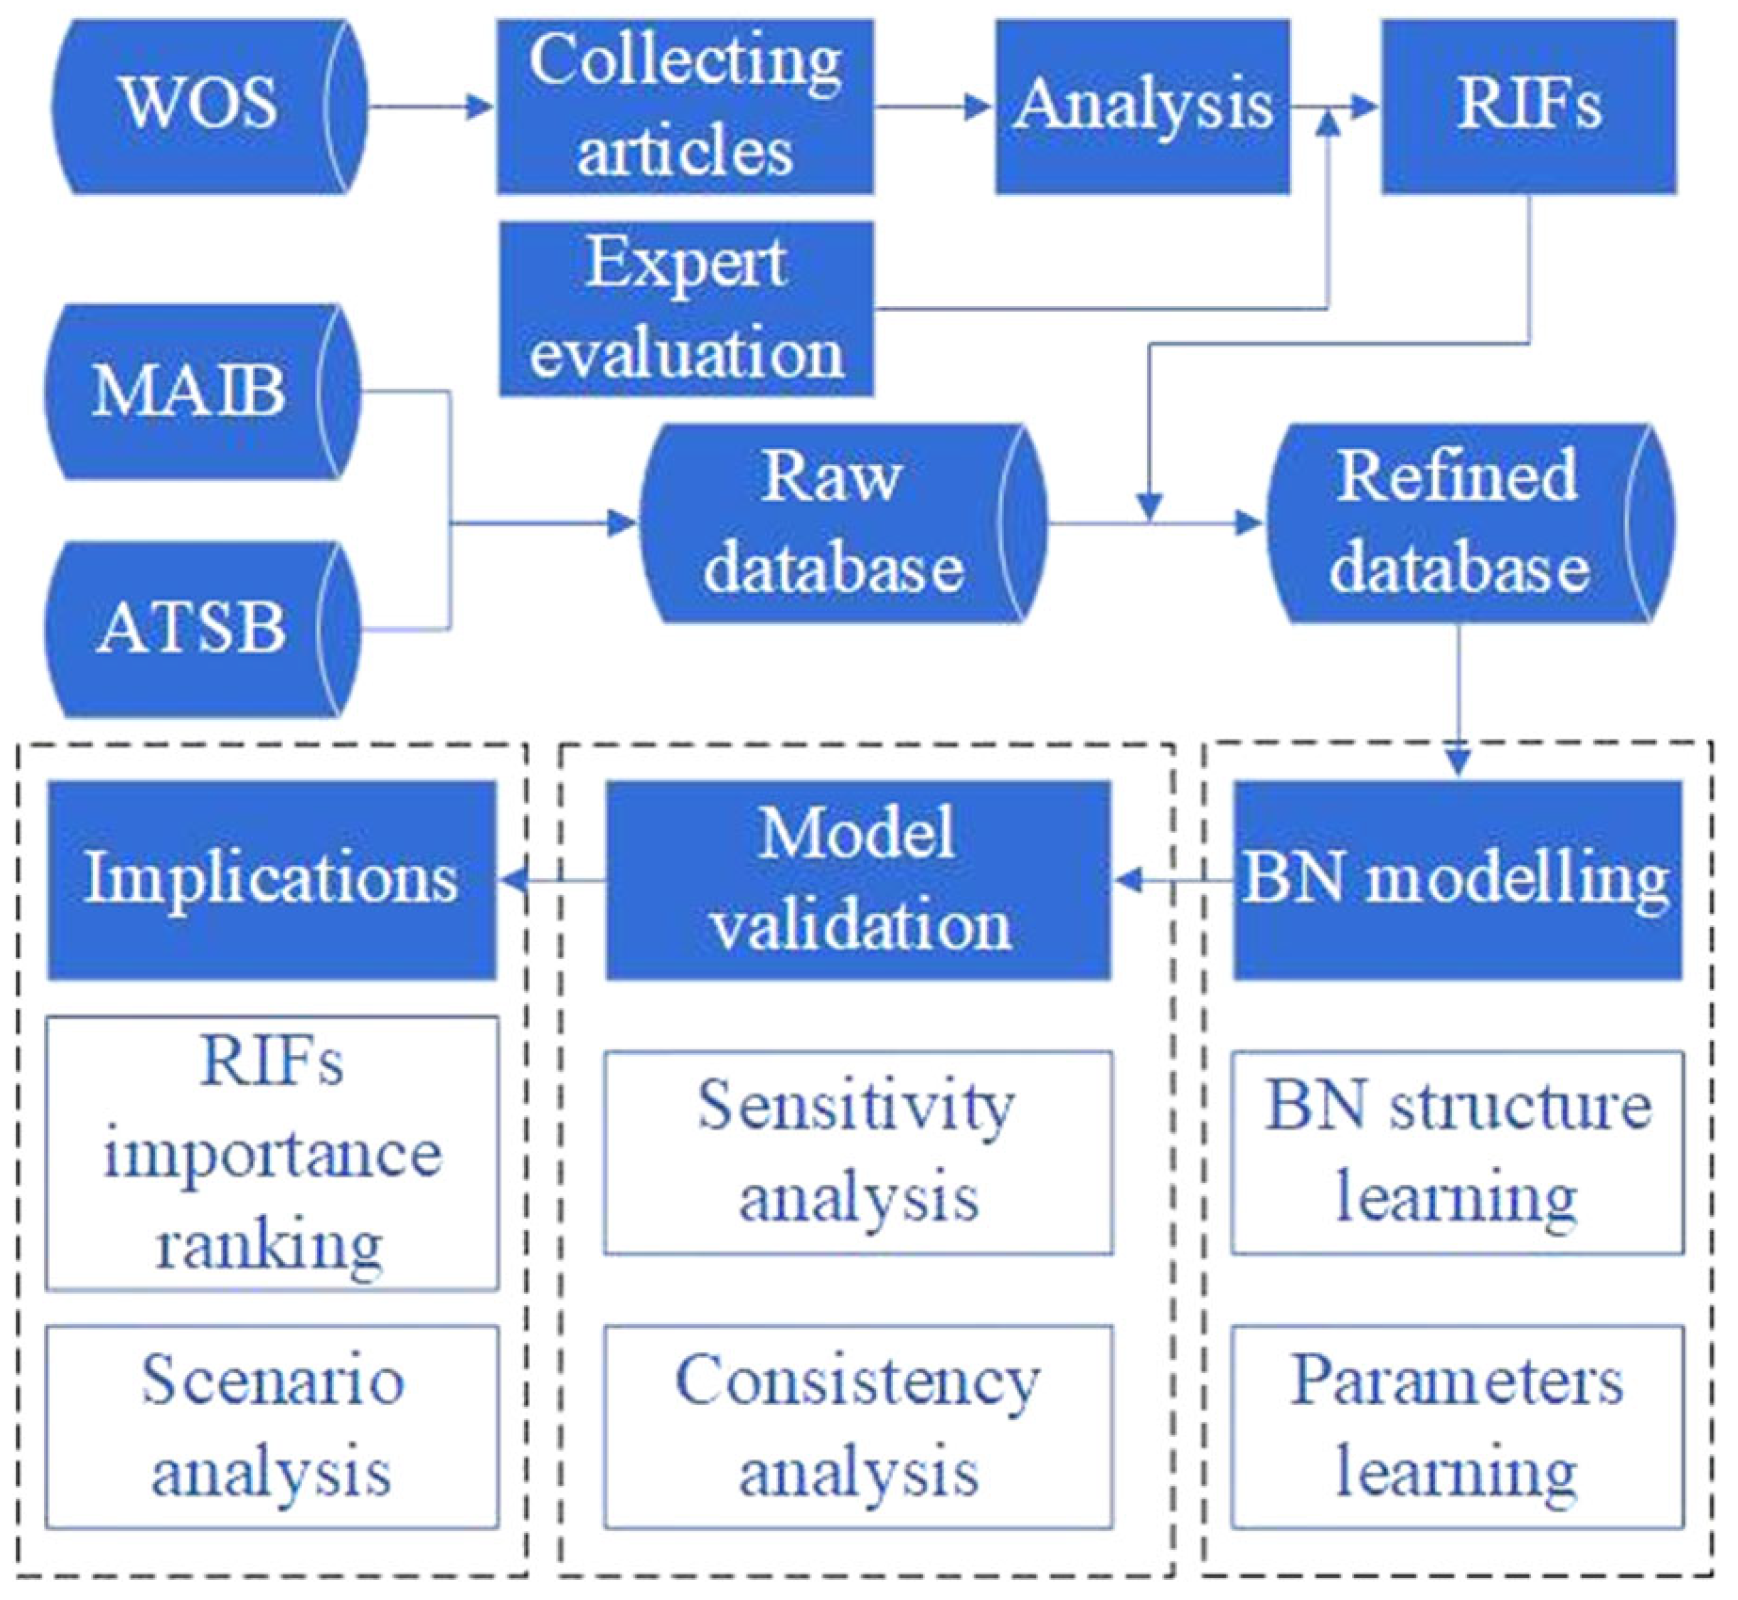
3.1. The Framework of the Method
3.2. Data Sources
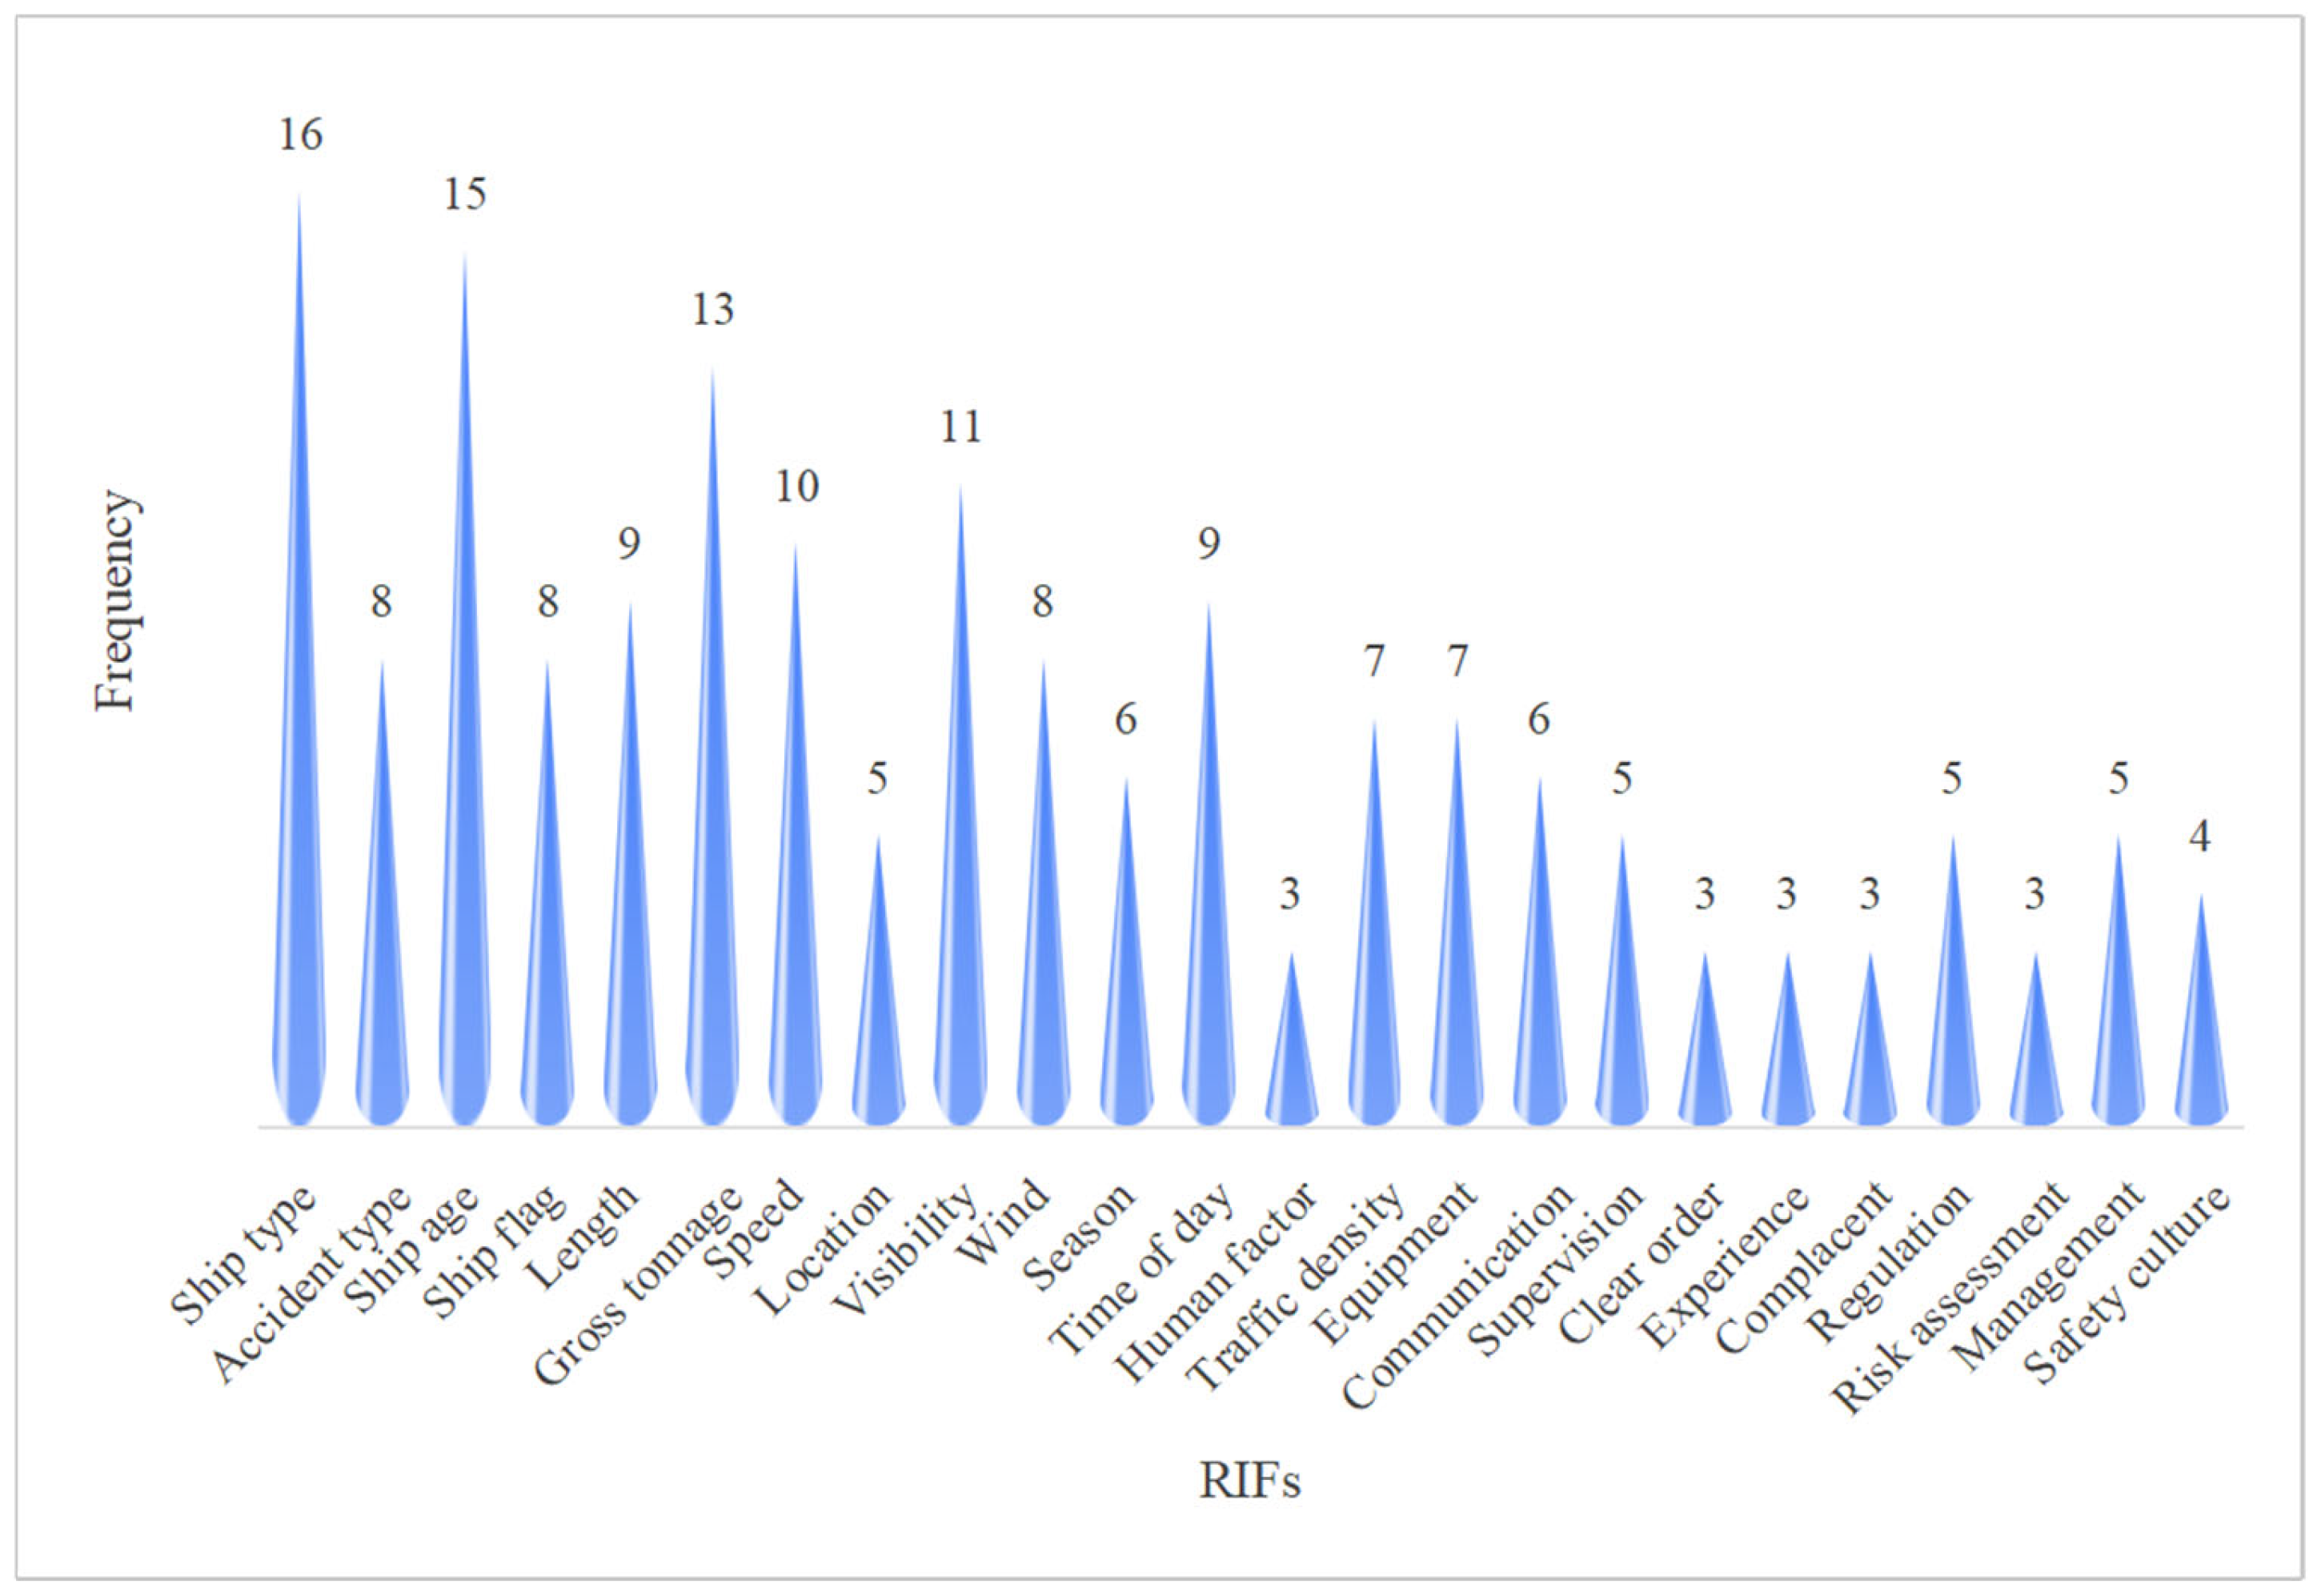
3.3. Identifing and Determining the RIFs
3.4. BN Modeling
3.5. Model Evaluation
4. Results and Discussion
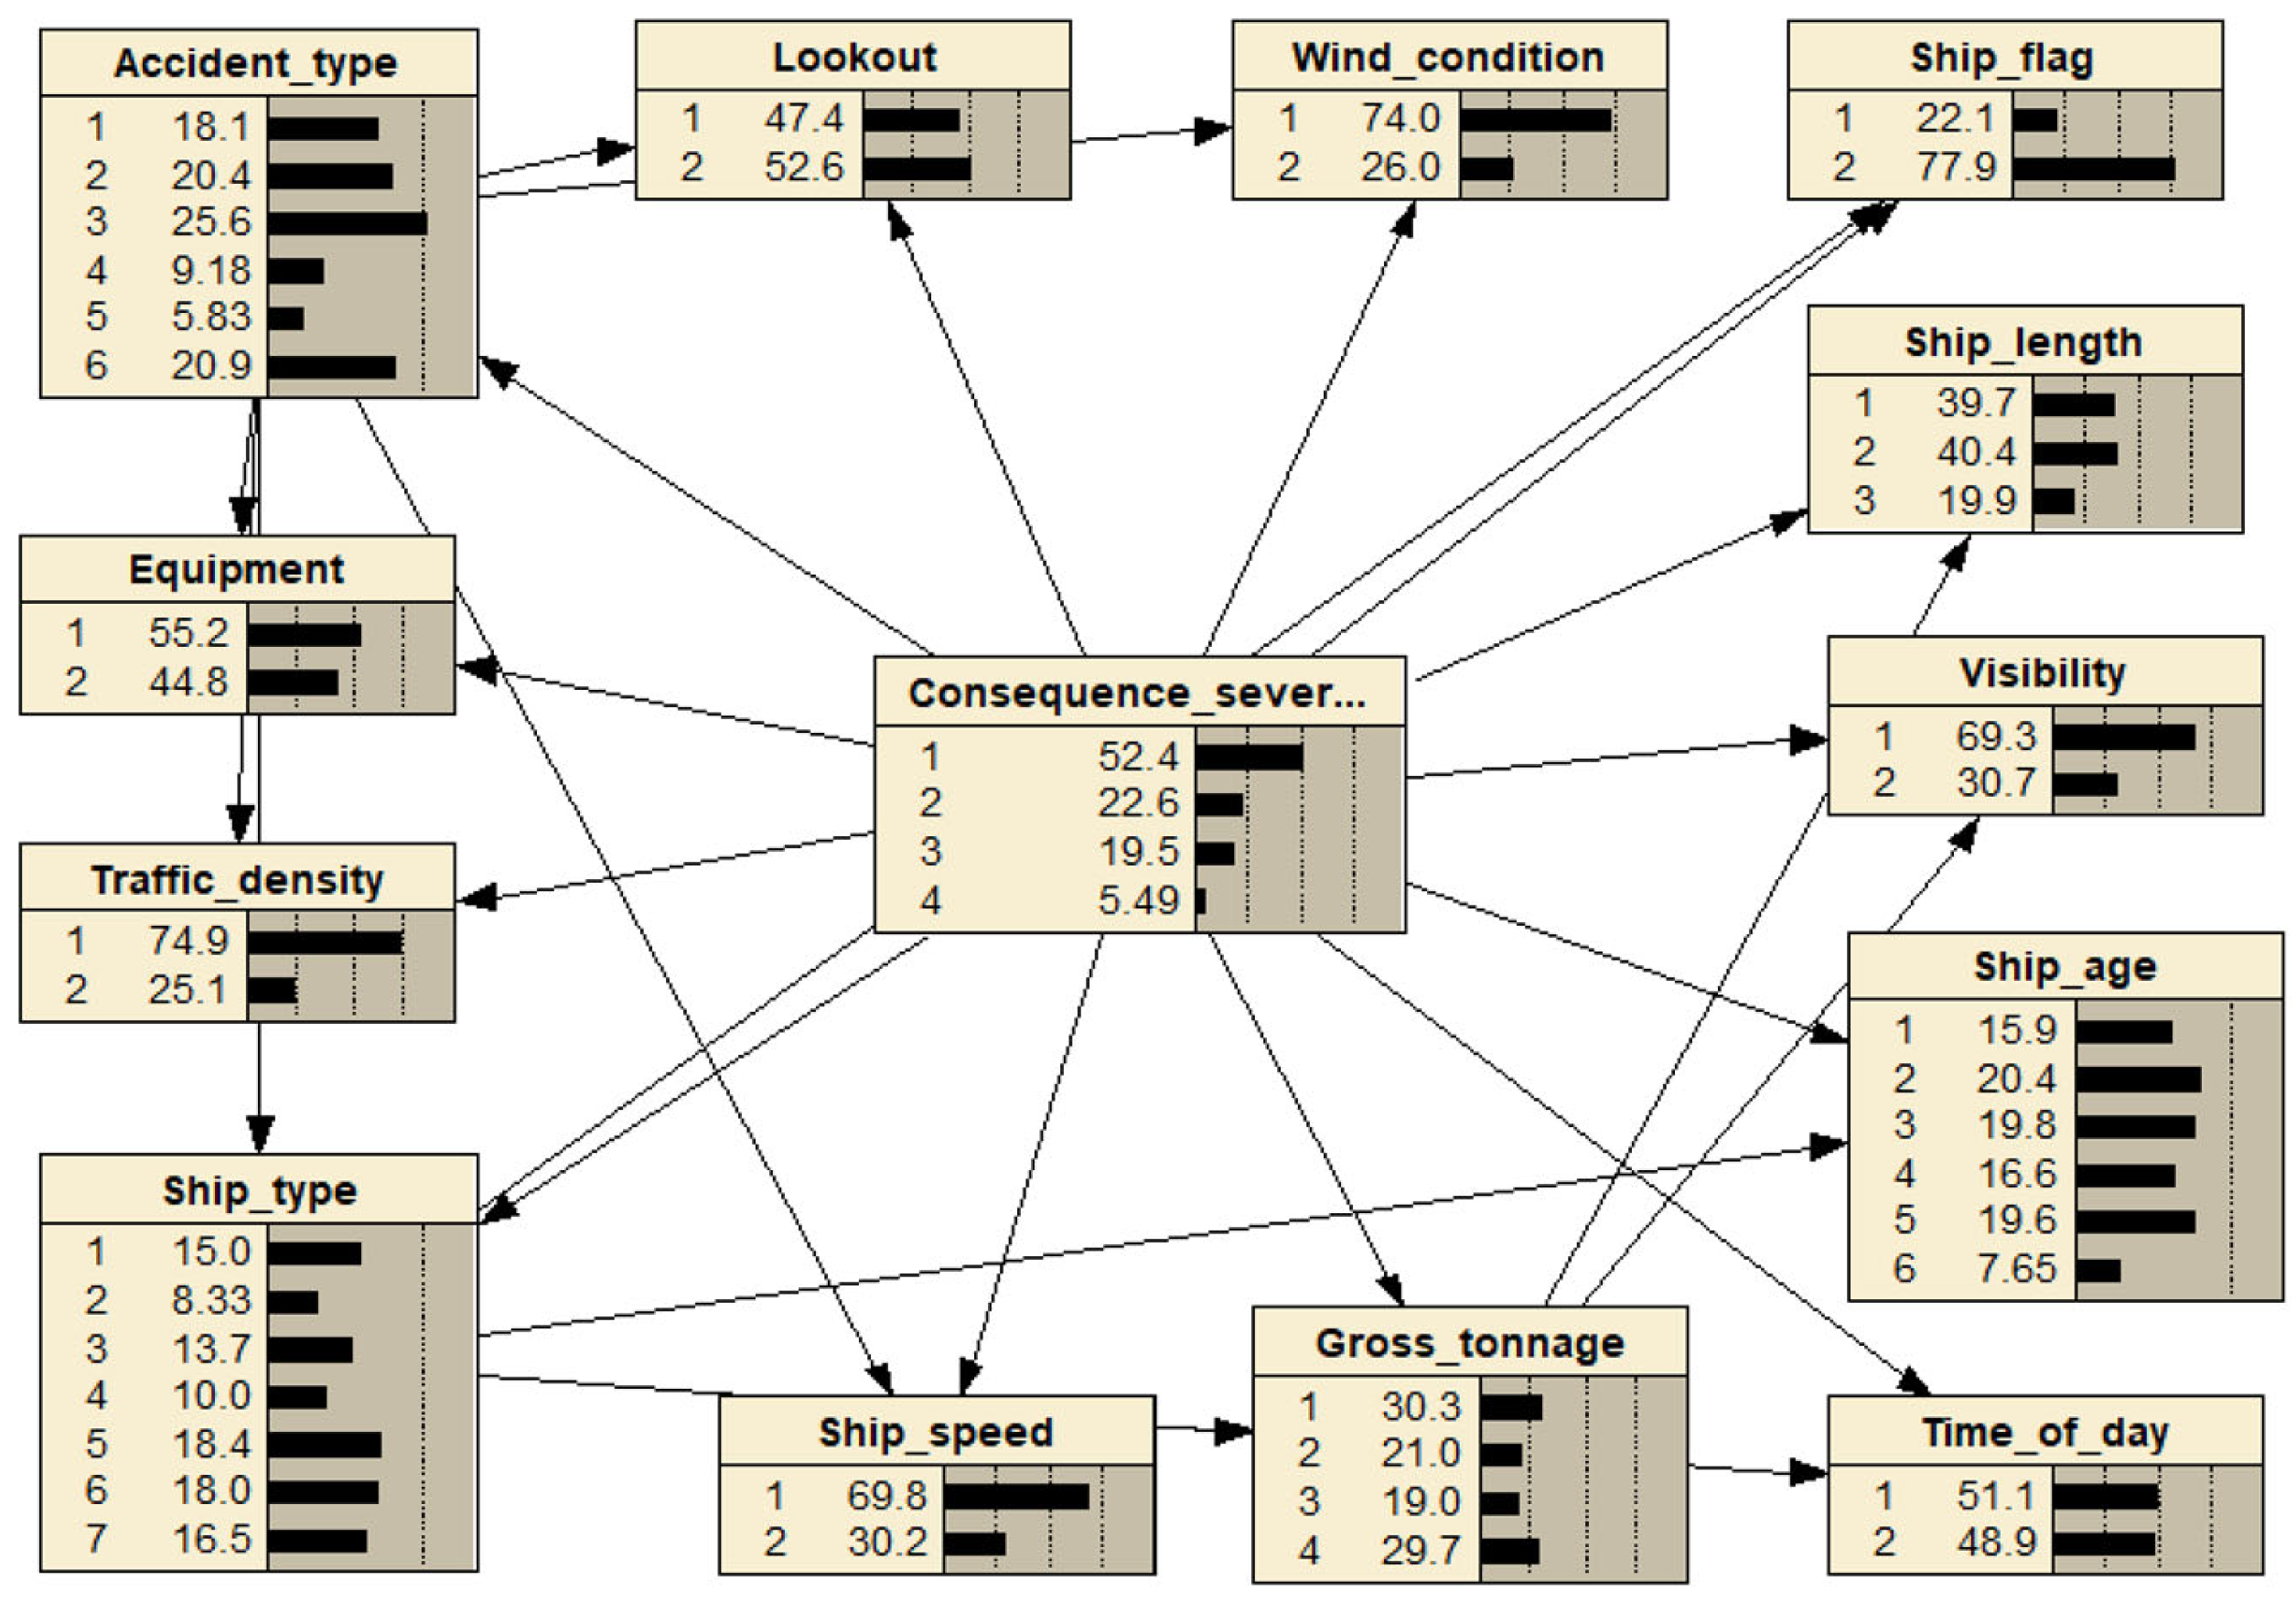
4.1. Trained Model
4.2. Validation of BN Model
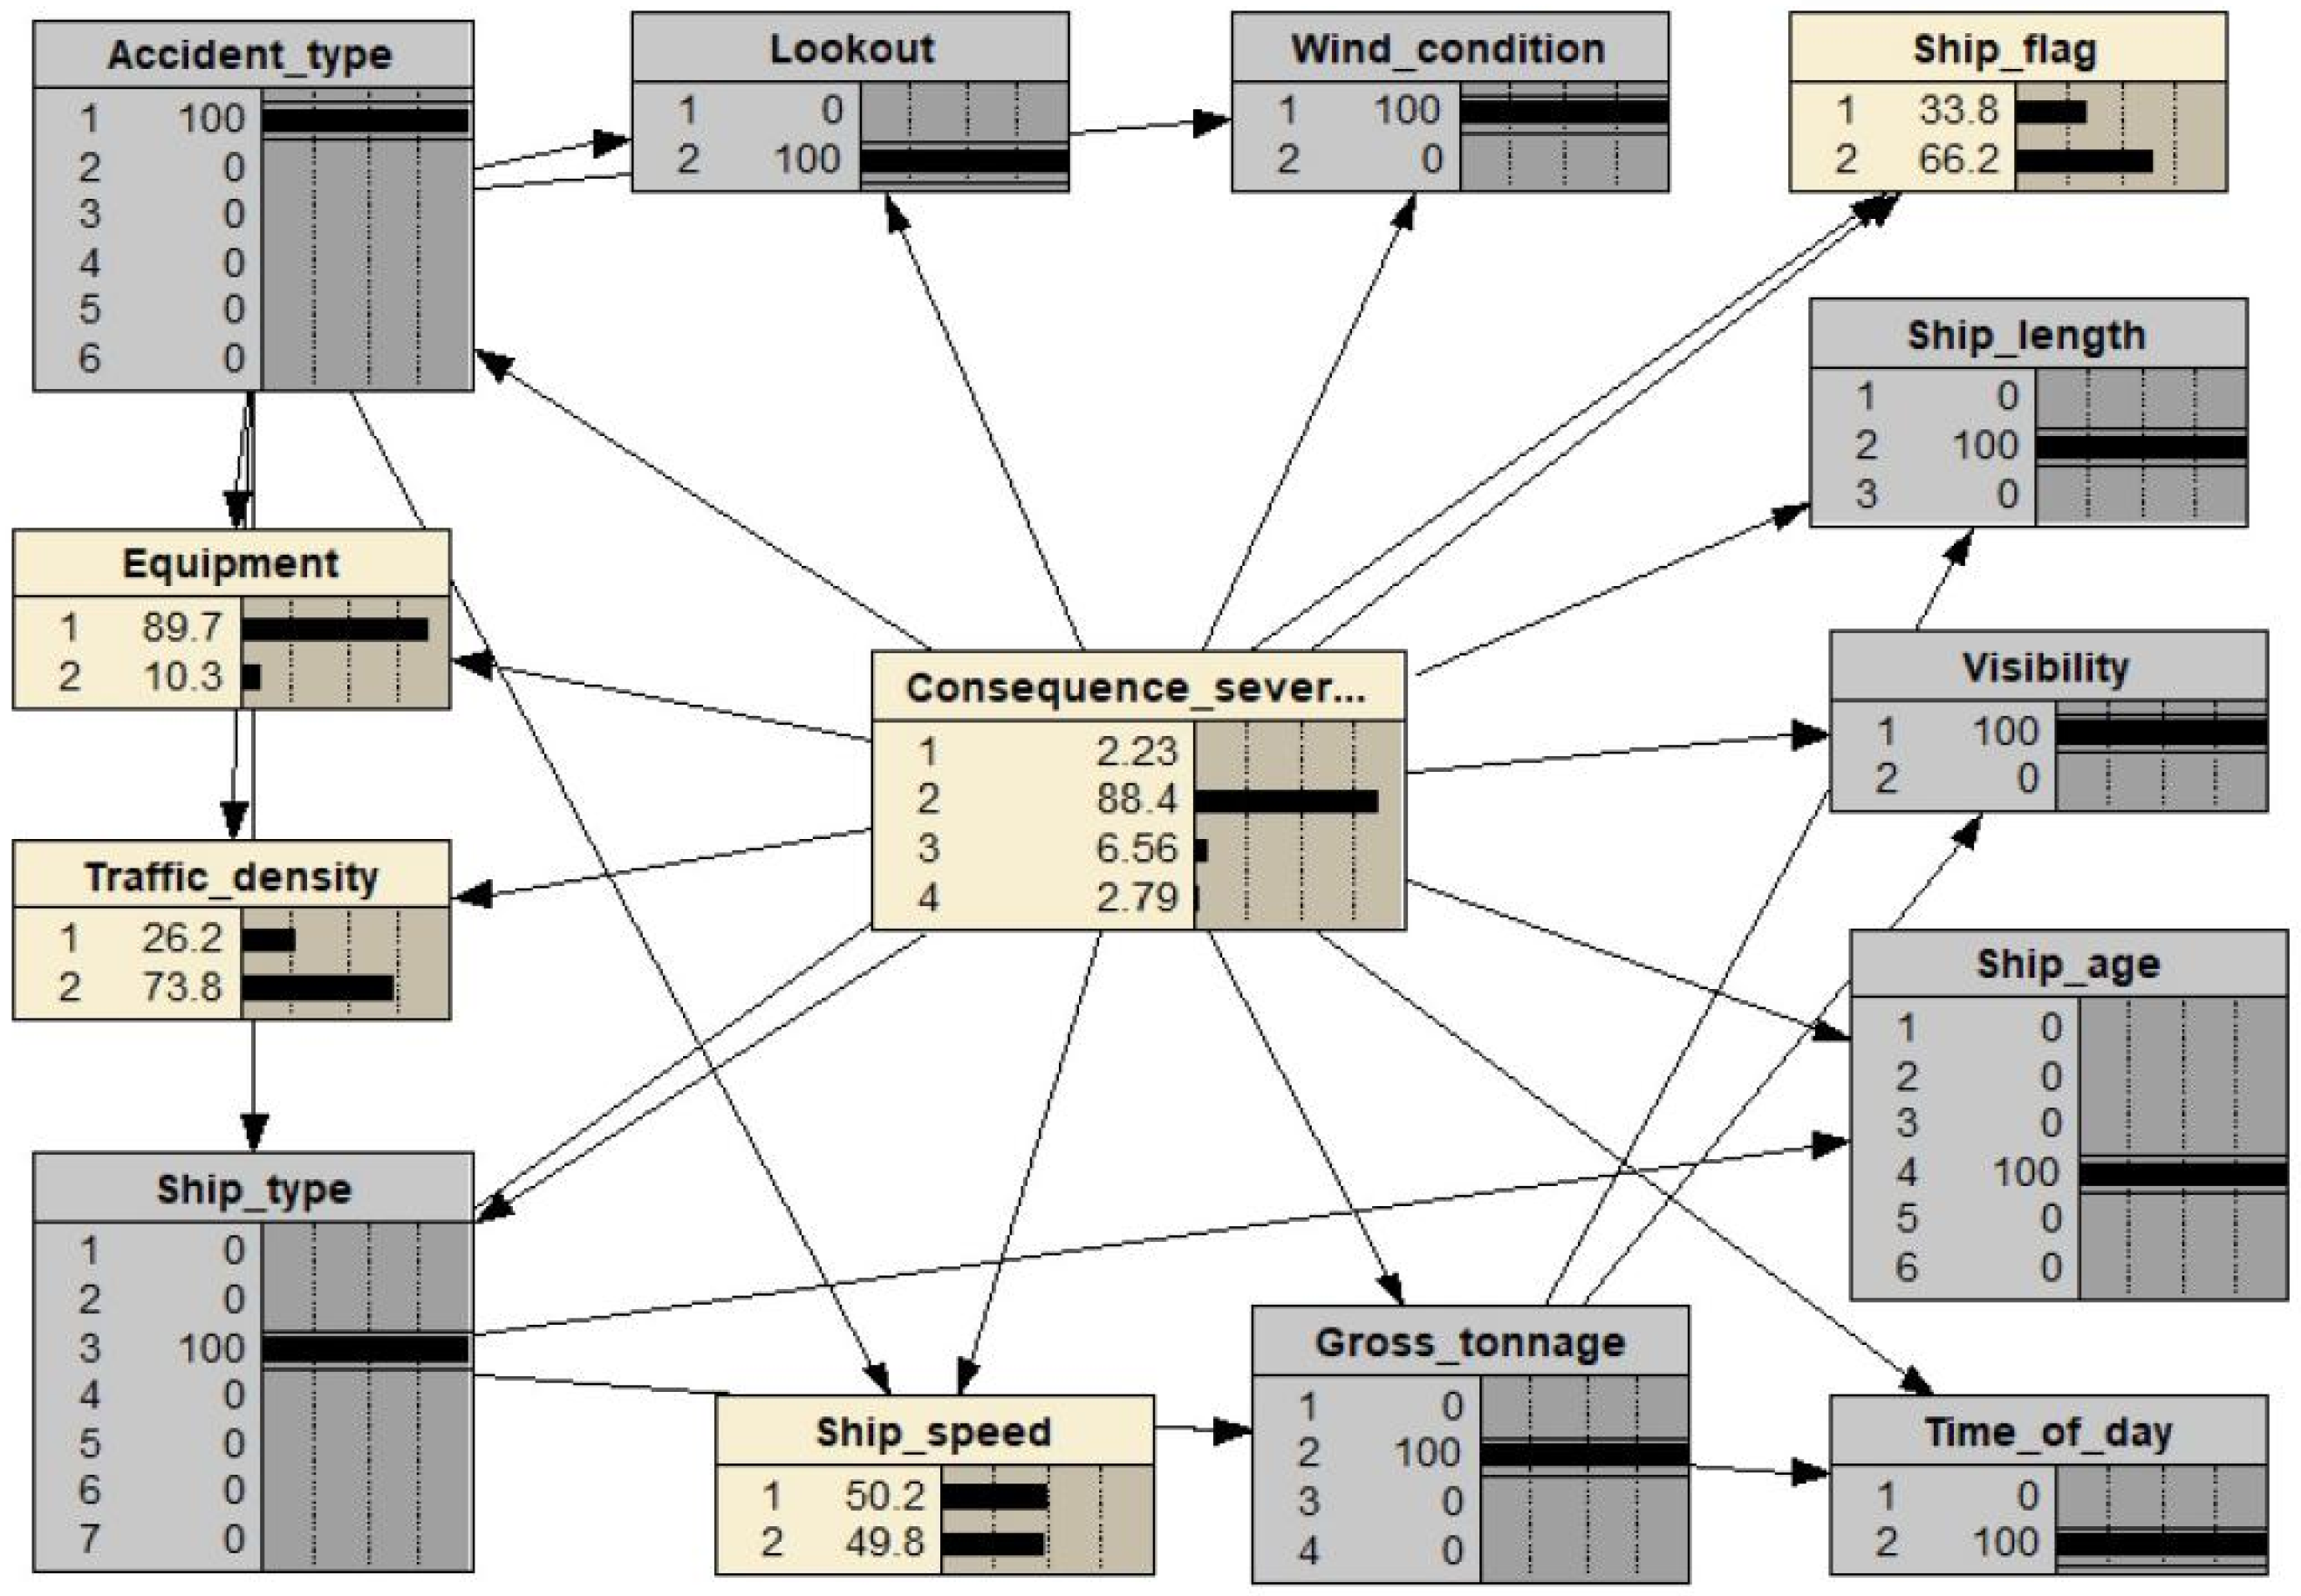
4.3. Analytical Implications
- (1)
- Accident type ‘accident to person’ and ship type ‘general cargo ship’, ship length ‘less than 100 meters’, ship flag ‘non-FOC’, ship age ‘over 20 years’, gross tonnage ‘less than 3000’.
- (2)
- Time of the day ‘night’, ‘light’ wind, and visibility ‘good’.
- (3)
- ‘Proper’ lookout, ‘safe’ speed, in ‘low’ traffic, with ‘good’ equipment.
4.4. Comparative Analysis
5. Conclusions
Author Contributions
Funding
Institutional Review Board Statement
Informed Consent Statement
Data Availability Statement
Conflicts of Interest
References
- AGCS, Safety and Shipping Review. 2022. Available online: https://www.agcs.allianz.com/search.html#searchTerm=Safety%20and%20Shipping%20Review%2022 (accessed on 20 November 2024).
- Annual Highlights 2023, EMSA. Available online: https://emsa.europa.eu/publications/highlights.html (accessed on 20 November 2024).
- Maritime Safety Trends, DNV. Available online: https://www.dnv.com/maritime/publications/maritime-safety-trends-2012-2022-advancing-a-culture-of-safety-in-a-changing-industry-landscape/ (accessed on 20 November 2024).
- Siddiqui, A.; Verma, M. An Expected Consequence Approach to Route Choice in the Maritime Transportation of Crude Oil. Risk Anal. 2013, 33, 2041–2055. [Google Scholar] [CrossRef]
- Wu, B.; Tian, H.; Yan, X.; Soares, C.G. A probabilistic consequence estimation model for collision accidents in the downstream of Yangtze River using Bayesian Networks. Proc. Inst. Mech. Eng. Part O J. Risk Reliab. 2020, 234, 422–436. [Google Scholar] [CrossRef]
- Wu, B.; Yip, T.L.; Yan, X.; Mao, Z. A Mutual Information-Based Bayesian Network Model for Consequence Estimation of Navigational Accidents in the Yangtze River. J. Navig. 2019, 73, 559–580. [Google Scholar] [CrossRef]
- Li, B.; Lu, J.; Lu, H.; Li, J. Predicting maritime accident consequence scenarios for emergency response decisions using optimization-based decision tree approach. Marit. Policy Manag. 2023, 50, 19–41. [Google Scholar] [CrossRef]
- Zhang, L.; Wang, H.; Meng, Q.; Xie, H. Ship accident consequences and contributing factors analyses using ship accident investigation reports. Proc. Inst. Mech. Eng. Part O J. Risk Reliab. 2019, 233, 35–47. [Google Scholar] [CrossRef]
- MAIB, UK. Available online: https://www.gov.uk/government/organisations/marine-accident-investigation-branch/about (accessed on 10 March 2024).
- ATSB, Canada. Available online: https://www.atsb.gov.au/marine-investigation-reports (accessed on 20 November 2024).
- Ma, X.; Deng, W.; Qiao, W.; Lan, H. A methodology to quantify the risk propagation of hazardous events for ship grounding accidents based on directed CN. Reliab. Eng. Syst. Saf. 2022, 221, 108334. [Google Scholar] [CrossRef]
- Fan, S.; Yang, Z.; Wang, J.; Marsland, J. Shipping accident analysis in restricted waters: Lesson from the Suez Canal blockage in 2021. Ocean Eng. 2022, 266, 113119. [Google Scholar] [CrossRef]
- Weng, J.; Yang, D. Investigation of shipping accident injury severity and mortality. Accid. Anal. Prev. 2015, 76, 92–101. [Google Scholar] [CrossRef] [PubMed]
- de Maya, B.N.; Kurt, R.E. Marine Accident Learning with Fuzzy Cognitive Maps (MALFCMs): A case study on bulk carrier’s accident contributors. Ocean Eng. 2020, 208, 107197. [Google Scholar] [CrossRef]
- Lyu, Q.; Fu, G.; Wang, Y.; Li, J.; Han, M.; Peng, F.; Yang, C. How accident causation theory can facilitate smart safety management: An application of the 24Model. Process Saf. Environ. Prot. 2022, 162, 878–890. [Google Scholar] [CrossRef]
- Chen, J.; Bian, W.; Wan, Z.; Wang, S.; Zheng, H.; Cheng, C. Factor assessment of marine casualties caused by total loss. Int. J. Disaster Risk Reduct. 2020, 47, 101560. [Google Scholar] [CrossRef]
- Wang, Y.; Zhang, F.; Yang, Z.; Yang, Z. Incorporation of deficiency data into the analysis of the dependency and interdependency among the risk factors influencing port state control inspection. Reliab. Eng. Syst. Saf. 2021, 206, 107277. [Google Scholar] [CrossRef]
- Gucma, L.; Androjna, A.; Łazuga, K.; Vidmar, P.; Perkovič, M. Reconstructing Maritime Incidents and Accidents Using Causal Models for Safety Improvement: Based on a Case Study. J. Mar. Sci. Eng. 2021, 9, 1414. [Google Scholar] [CrossRef]
- Li, H.; Ren, X.; Yang, Z. Data-driven Bayesian network for risk analysis of global maritime accidents. Reliab. Eng. Syst. Saf. 2023, 230, 108938. [Google Scholar] [CrossRef]
- Sevgili, C.; Fiskin, R.; Cakir, E. A data-driven Bayesian Network model for oil spill occurrence prediction using tankship accidents. J. Clean. Prod. 2022, 370, 133478. [Google Scholar] [CrossRef]
- Chen, J.; Bian, W.; Wan, Z.; Yang, Z.; Zheng, H.; Wang, P. Identifying factors influencing total-loss marine accidents in the world: Analysis and evaluation based on ship types and sea regions. Ocean Eng. 2019, 191, 106495. [Google Scholar] [CrossRef]
- de Maya, B.N.; Arslan, O.; Akyuz, E.; Kurt, R.E.; Turan, O. Application of data-mining techniques to predict and rank maritime non-conformities in tanker shipping companies using accident inspection reports. Ships Offshore Struct. 2020, 17, 687–694. [Google Scholar] [CrossRef]
- Zhang, J.; Teixeira, P.; Soares, C.G.; Yan, X. Quantitative assessment of collision risk influence factors in the Tianjin port. Saf. Sci. 2018, 110, 363–371. [Google Scholar] [CrossRef]
- Jiang, M.; Lu, J.; Yang, Z.; Li, J. Risk analysis of maritime accidents along the main route of the Maritime Silk Road: A Bayesian network approach. Marit. Policy Manag. 2020, 47, 815–832. [Google Scholar] [CrossRef]
- Chen, D.; Pei, Y.; Xia, Q. Research on human factors cause chain of ship accidents based on multidimensional association rules. Ocean Eng. 2020, 218, 107717. [Google Scholar] [CrossRef]
- Yıldırım, U.; Başar, E.; Uğurlu, Ö. Assessment of collisions and grounding accidents with human factors analysis and classification system (HFACS) and statistical methods. Saf. Sci. 2019, 119, 412–425. [Google Scholar] [CrossRef]
- Paolo, F.; Gianfranco, F.; Luca, F.; Marco, M.; Andrea, M.; Francesco, M.; Vittorio, P.; Mattia, P.; Patrizia, S. Investigating the Role of the Human Element in Maritime Accidents using Semi-Supervised Hierarchical Methods. Transp. Res. Procedia 2021, 52, 252–259. [Google Scholar] [CrossRef]
- Uğurlu, Ö.; Yıldırım, U.; Başar, E. Analysis of grounding accidents caused by human error. J. Mar. Sci. Tech. 2015, 23, 19. [Google Scholar] [CrossRef]
- Kum, S.; Sahin, B. A root cause analysis for Arctic Marine accidents from 1993 to 2011. Saf. Sci. 2015, 74, 206–220. [Google Scholar] [CrossRef]
- Fu, S.; Goerlandt, F.; Xi, Y. Arctic shipping risk management: A bibliometric analysis and a systematic review of risk influencing factors of navigational accidents. Saf. Sci. 2021, 139, 105254. [Google Scholar] [CrossRef]
- Luo, M.; Shin, S.-H. Half-century research developments in maritime accidents: Future directions. Accid. Anal. Prev. 2019, 123, 448–460. [Google Scholar] [CrossRef] [PubMed]
- Kulkarni, K.; Goerlandt, F.; Li, J.; Banda, O.V.; Kujala, P. Preventing shipping accidents: Past, present, and future of waterway risk management with Baltic Sea focus. Saf. Sci. 2020, 129, 104798. [Google Scholar] [CrossRef]
- Browne, T.; Taylor, R.; Veitch, B.; Helle, I.; Parviainen, T.; Khan, F.; Smith, D. A general method to combine environmental and life-safety consequences of Arctic ship accidents. Saf. Sci. 2022, 154, 105855. [Google Scholar] [CrossRef]
- Pitblado, R.M.; Baik, J.; Hughes, G.J.; Ferro, C.; Shaw, S.J. Consequences of liquefied natural gas marine incidents. Process. Saf. Prog. 2005, 24, 108–114. [Google Scholar] [CrossRef]
- Wang, L.; Yang, Z. Bayesian network modelling and analysis of accident severity in waterborne transportation: A case study in China. Reliab. Eng. Syst. Saf. 2018, 180, 277–289. [Google Scholar] [CrossRef]
- Fan, S.; Blanco-Davis, E.; Yang, Z.; Zhang, J.; Yan, X. Incorporation of human factors into maritime accident analysis using a data-driven Bayesian network. Reliab. Eng. Syst. Saf. 2020, 203, 107070. [Google Scholar] [CrossRef]
- Jiang, M.; Lu, J. The analysis of maritime piracy occurred in Southeast Asia by using Bayesian network. Transp. Res. Part. E Logist. Transp. Rev. 2020, 139, 101965. [Google Scholar] [CrossRef]
- Liu, K.; Yu, Q.; Yuan, Z.; Yang, Z.; Shu, Y. A systematic analysis for maritime accidents causation in Chinese coastal waters using machine learning approaches. Ocean Coast. Manag. 2021, 213, 105859. [Google Scholar] [CrossRef]
- Fan, S.; Zhang, J.; Blanco-Davis, E.; Yang, Z.; Yan, X. Maritime accident prevention strategy formulation from a human factor perspective using Bayesian Networks and TOPSIS. Ocean Eng. 2020, 210, 107544. [Google Scholar] [CrossRef]
- Ma, L.; Ma, X.; Wang, T.; Zhao, Y.; Lan, H. A data-driven approach to determine the distinct contribution of human factors to different types of maritime accidents. Ocean Eng. 2024, 295, 116874. [Google Scholar] [CrossRef]
- Kamal, B.; Çakır, E. Data-driven Bayes approach on marine accidents occurring in Istanbul strait. Appl. Ocean Res. 2022, 123, 103180. [Google Scholar] [CrossRef]
- Cao, Y.; Wang, X.; Wang, Y.; Fan, S.; Wang, H.; Yang, Z.; Liu, Z.; Wang, J.; Shi, R. Analysis of factors affecting the severity of marine accidents using a data-driven Bayesian network. Ocean Eng. 2023, 269, 113563. [Google Scholar] [CrossRef]
- Zhou, K.; Xing, W.; Wang, J.; Li, H.; Yang, Z. A data-driven risk model for maritime casualty analysis: A global perspective. Reliab. Eng. Syst. Saf. 2024, 244, 109925. [Google Scholar] [CrossRef]
- Fu, S.; Gu, S.; Zhang, Y.; Zhang, M.; Weng, J. Towards system-theoretic risk management for maritime transportation systems: A case study of the yangtze river estuary. Ocean Eng. 2023, 286, 115637. [Google Scholar] [CrossRef]
- Kim, G.; Lim, S. Development of an Interpretable Maritime Accident Prediction System Using Machine Learning Techniques. IEEE Access 2022, 10, 41313–41329. [Google Scholar] [CrossRef]
- Zhao, X.; Yuan, H.; Yu, Q. Autonomous Vessels in the Yangtze River: A Study on the Maritime Accidents Using Data-Driven Bayesian Networks. Sustainability 2021, 13, 9985. [Google Scholar] [CrossRef]
- Fan, S.; Yang, Z.; Blanco-Davis, E.; Zhang, J.; Yan, X. Analysis of maritime transport accidents using Bayesian networks. Proc. Inst. Mech. Eng. Part O J. Risk Reliab. 2020, 234, 439–454. [Google Scholar] [CrossRef]
- Liao, S.; Weng, J.; Zhang, Z.; Li, Z.; Li, F. Probabilistic Modeling of Maritime Accident Scenarios Leveraging Bayesian Network Techniques. J. Mar. Sci. Eng. 2023, 11, 1513. [Google Scholar] [CrossRef]
- Fu, S.; Zhang, Y.; Zhang, M.; Han, B.; Wu, Z. An object-oriented Bayesian network model for the quantitative risk assessment of navigational accidents in ice-covered Arctic waters. Reliab. Eng. Syst. Saf. 2023, 238, 209459. [Google Scholar] [CrossRef]
- Ma, X.; Fan, S.; Blanco-Davis, E.; Shi, G.; Yang, Z. Bulk carrier accident severity analysis in Australian waters using a data-driven Bayesian network. Ocean Eng. 2024, 310, 118605. [Google Scholar] [CrossRef]
- FOCs, ITF. Available online: https://www.itfseafarers.org/en/focs/what-are-focs (accessed on 20 November 2024).
- Özaydın, E.; Fışkın, R.; Uğurlu, Ö.; Wang, J. A hybrid model for marine accident analysis based on Bayesian Network (BN) and Association Rule Mining (ARM). Ocean Eng. 2022, 247, 110705. [Google Scholar] [CrossRef]
- Friedman, N.; Geiger, D.; Goldszmidt, M. Bayesian Network Classifiers. Mach. Learn. 1997, 29, 131–163. [Google Scholar] [CrossRef]
- Li, K.X.; Yin, J.; Bang, H.S.; Yang, Z.; Wang, J. Bayesian network with quantitative input for maritime risk analysis. Transp. A Transp. Sci. 2014, 10, 89–118. [Google Scholar] [CrossRef]
- Netica. Norsys. Available online: https://www.norsys.com/ (accessed on 20 November 2024).
- MO-2020-001, ATSB. Available online: https://www.atsb.gov.au/marine-investigation-reports?field_report_id_value=MO-2020-001 (accessed on 20 November 2024).
- Mair 197_001, ATSB. Available online: https://www.atsb.gov.au/marine-investigation-reports?field_report_id_value=197 (accessed on 20 November 2024).
- Mair 201_001, ATSB. Available online: https://www.atsb.gov.au/publications/investigation_reports/2004/mair/mair201 (accessed on 20 November 2024).
- Mair 178_001, ATSB. Available online: https://www.atsb.gov.au/publications/investigation_reports/2002/mair/mair178 (accessed on 20 November 2024).
- Mair 243_001, ATSB. Available online: https://www.atsb.gov.au/publications/investigation_reports/2007/mair/mair243 (accessed on 20 November 2024).
- Mair 174_001, ATSB. Available online: https://www.atsb.gov.au/publications/investigation_reports/2001/mair/mair174 (accessed on 20 November 2024).


| NO | Citation | Focus | Method | Database |
|---|---|---|---|---|
| 1. | [39] | Human factors, maritime accident | HFACS (Human Factors Analysis and Classification System), grounding theory, ARM (Association rule mining) | Accident reports from China MSA (Maritime Safety Administration of China), JTSB (Japan Transport Safety Board), and NTSB (United States National Transportation Safety Board) |
| 2. | [24] | Risk, maritime accident | BN-based risk analysis model | Accident reports from LRF (Lloyd’s Register Fairplay), IMO database |
| 3. | [21] | Risk, total-loss maritime accident | BN, TOPSIS (Technique for Preference by Similarity to Ideal Solution) | Collection of total-loss maritime accidents in the world from 1998 to 2018 |
| 4. | [36] | Accident prevention | Data-driven BN | MAIB and TSB (the Transportation Safety Board of Canada) |
| 5. | [38] | Accidents causation | Data-driven BN, machine learning | Accident reports from China MSA |
| 6. | [35] | Accident consequence, Chinese waters | ABN (augmented naïve BN) model | Accident reports from China MSA |
| 7. | [5] | Yangtze River, accident consequence | BN | Historical accident data of Yangtze River |
| 8. | [8] | Accident consequence, RIFs | Kendall’s tau coefficient, Cramer’s V analysis and Kruskal–Wallis test | Accident reports from EMSA (European Maritime Safety Agency), MAIB |
| 9. | [6] | Yangtze River, collision accidents | BN | Historical accident data of Yangtze River |
| 10. | [13] | Accident injury severity | Binary logistic regression model, zero-truncated binomial regression model | Accident reports from Lloyd’s List Intelligence |
| 11. | [12] | Confined waters, maritime accident | Data-driven risk model | Accident reports from MAIB and TSB |
| 12. | [40] | Istanbul strait, maritime accident | Data-driven BN | 418 vessel accident records that occurred in the Istanbul Strait |
| 13. | [41] | Accident consequence | Data-driven BN | Accident reports from China MSA, JTSB |
| 14. | [42] | Maritime casualty, risk | Data-driven method | Accident reports from LRF, IMO database |
| 15. | [43] | Risk management, Yangtze River | System-based model | Accident reports from China MSA |
| 16. | [44] | Accident prediction | Machine learning | The maritime accident log data from January 2010 to December 2020 in Korean waters |
| 17. | [45] | Yangtze River, MASS | Data-driven BN | Accident reports in the Yangtze River from China MSA |
| 18. | [46] | Maritime accident | BN-based risk model | Accident reports from MAIB and TSB |
| 19. | [47] | Maritime accident | BN-based risk model | Accident reports from the GISIS (Global Integrated Shipping Information System) |
| 20. | [48] | Risk management, arctic waters | BN-based risk model | Accident reports from the GISIS, TSB |
| NO. | RIFs | Description | State |
|---|---|---|---|
| 1 | Ship age [37] | (0 5], [6 10], [11 15], [16 20], >20, NA | 1,2,3,4,5,6 |
| 2 | Gross tonnage [21] | (0 3000], (3000 10,000], (10,000 20,000], >20,000 | 1,2,3,4 |
| 3 | Ship length [21] | (0 100], (100 200], >200 | 1,2,3 |
| 4 | Ship type [38] | Container ship, tanker, bulk carrier, passenger ship, general cargo ship, RORO, others | 1,2,3,4,5,6,7 |
| 5 | Equipment [6] | Good condition, available; bad condition, not available | 1,2 |
| 6 | Ship flag [4] | FOC *, non-FOC | 1,2 |
| 7 | Ship speed [39] | Safe speed, unsafe speed | 1,2 |
| 8 | Wind condition [21] | (0 5], >5 | 1,2 |
| 9 | Visibility [40] | Good or bad | 1,2 |
| 10 | Time of the day [26] | Day (06:00/17:59), night (18:00/05:59) | 1,2 |
| 11 | Traffic density [38] | Low, high | 1,2 |
| 12 | Lookout [34] | Proper, improper | 1,2 |
| 13 | Accident type [49] | Collision, grounding, accident to person, fire/explosion, machinery failure, others | 1,2,3,4,5,6 |
| 14 | Consequence severity [50] | Minor, significant, severe, catastrophic | 1,2,3,4 |
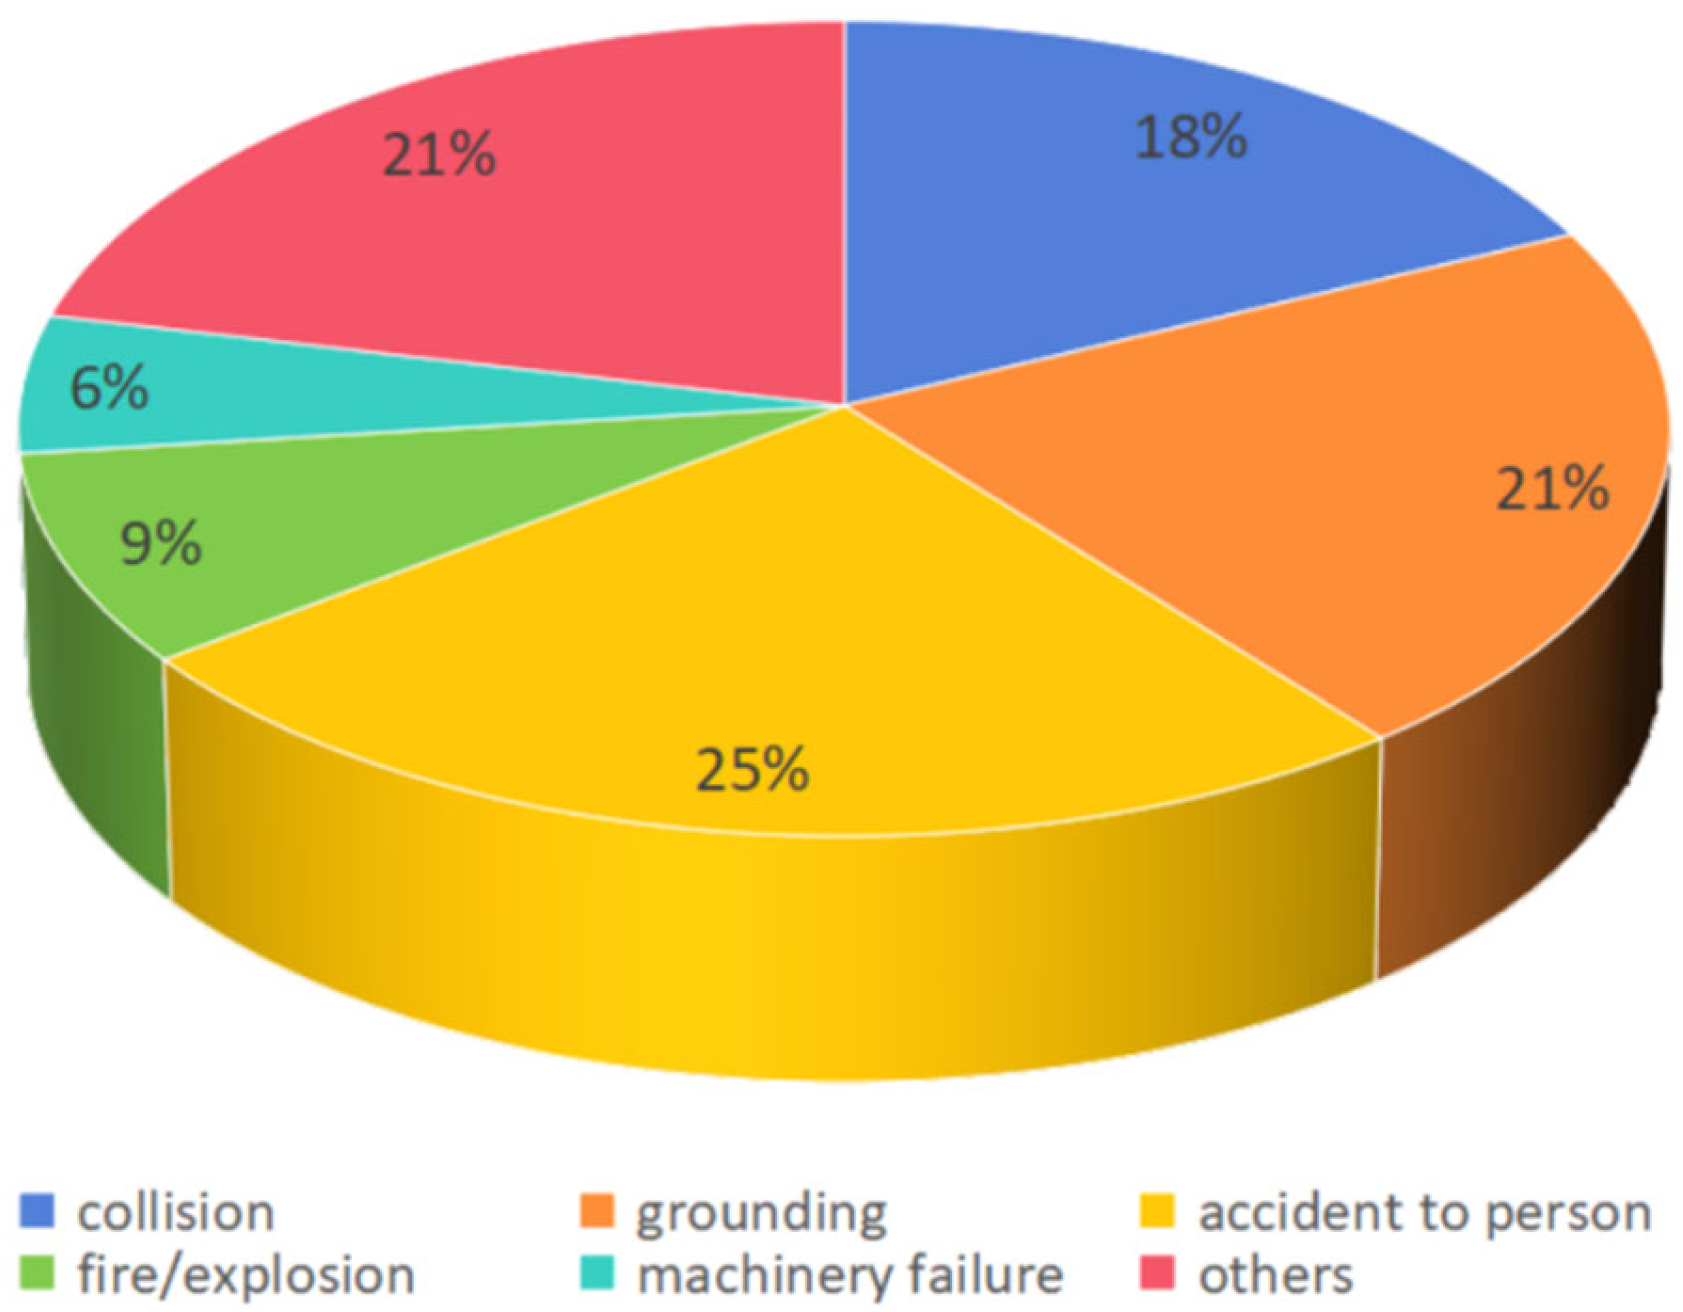
| Accident Type | Statistical Results (%) | Predicted Results (%) | Difference (%) |
|---|---|---|---|
| Collision | 18 | 18.1 | 0.6 |
| Grounding | 21 | 20.4 | 2.9 |
| Accident to person | 25 | 25.6 | 2.4 |
| Fire/explosion | 9 | 9.18 | 2 |
| Machinery failure | 6 | 5.83 | 2.8 |
| Others | 21 | 20.9 | 0.5 |
| - | Minor | Significant | Severe | Catastrophic | Actual Total | Accuracy (%) |
|---|---|---|---|---|---|---|
| Minor | 1 | 0 | 0 | 0 | 1 | 100 |
| Significant | 0 | 22 | 2 | 0 | 24 | 91.7 |
| Severe | 0 | 2 | 13 | 0 | 15 | 86.7 |
| Catastrophic | 0 | 0 | 0 | 0 | 0 | 100 |
| Predicted total | 1 | 24 | 15 | 0 | 40 | 90 |
| RIFs | MI | Percentage (%) | Variance of Belief |
|---|---|---|---|
| Accident type | 0.16917 | 11.2 | 0.04089 |
| Ship length | 0.02834 | 1.87 | 0.00555 |
| Visibility | 0.02154 | 1.43 | 0.00154 |
| Wind condition | 0.02070 | 1.37 | 0.00073 |
| Ship age | 0.01898 | 1.26 | 0.00295 |
| Ship flag | 0.01702 | 1.13 | 0.00066 |
| Gross tonnage | 0.01681 | 1.11 | 0.00298 |
| Traffic density | 0.01325 | 0.876 | 0.00187 |
| Ship type | 0.01029 | 0.8 | 0.00160 |
| Time of day | 0.00665 | 0.44 | 0.00117 |
| Ship speed | 0.00543 | 0.359 | 0.00027 |
| Equipment | 0.00327 | 0.216 | 0.00051 |
| lookout | 0.00217 | 0.144 | 0.00008 |
| (0 3000] | (3000 10,000] | (10,000 20,000] | >20,000 | Minor | HRI | LRI | TRI |
|---|---|---|---|---|---|---|---|
| / | / | / | / | 52.4 | 3.2 | 3.8 | 3.5 |
| 100% | 0 | 0 | 0 | 48.6 | |||
| 0 | 100% | 0 | 0 | 55.6 | |||
| 0 | 0 | 100% | 0 | 53.5 | |||
| 0 | 0 | 0 | 100% | 53.4 |
| Minor | Significant | Severe | Catastrophic | Average | |
|---|---|---|---|---|---|
| Accident type | 5.6 | 22.6 | 28.25 | 2.66 | 14.78 |
| Ship length | 5.95 | 8.35 | 8.1 | 1.85 | 6.06 |
| Visibility | 4.47 | 8.1 | 0.05 | 4.66 | 4.32 |
| Wind condition | 2.57 | 1.75 | 4.55 | 3.73 | 3.15 |
| Ship age | 3.94 | 11.7 | 6.15 | 8.93 | 7.68 |
| Ship flag | 2.59 | 0.9 | 5.05 | 3.37 | 2.98 |
| Gross tonnage | 3.5 | 8.25 | 9.6 | 2.63 | 6.0 |
| Traffic density | 1.35 | 4.55 | 7.35 | 1.43 | 3.67 |
| Ship type | 3.04 | 5.8 | 8.4 | 1.51 | 9.38 |
| Time of day | 1.18 | 3.05 | 4.45 | 0.5 | 2.3 |
| Ship speed | 1.78 | 0 | 3 | 1.21 | 1.5 |
| Equipment | 1.01 | 1.85 | 2.95 | 0.1 | 1.48 |
| Lookout | 1.18 | 0.75 | 1 | 0.6 | 0.88 |
| RIFs | Minor | Significant | Severe | Catastrophic |
|---|---|---|---|---|
| Accident type | accident to person | others | accident to person | others |
| Ship length | <100 | <100 | <100 | <100 |
| Visibility | good | good | good | good |
| Wind condition | <5 | <5 | <5 | >5 |
| Ship age | >20 | [11 15] | >20 | >20 |
| Ship flag | non-FOC | non-FOC | non-FOC | non-FOC |
| Gross tonnage | <3000 | <3000 | <3000 | <3000 |
| Traffic density | low | low | low | low |
| Ship type | general cargo ship | others | others | others |
| Time of day | night | day | day | day |
| Ship speed | safe speed | safe speed | safe speed | safe speed |
| Equipment | good | bad | good | bad |
| Lookout | proper | improper | improper | proper |
| Citation | Critical RIFs | Results and Findings |
|---|---|---|
| Li et al. [19] |
|
|
| Sevgili et al. [18] |
|
|
| Cao et al. [41] |
|
|
| This research |
|
|
Disclaimer/Publisher’s Note: The statements, opinions and data contained in all publications are solely those of the individual author(s) and contributor(s) and not of MDPI and/or the editor(s). MDPI and/or the editor(s) disclaim responsibility for any injury to people or property resulting from any ideas, methods, instructions or products referred to in the content. |
© 2025 by the authors. Licensee MDPI, Basel, Switzerland. This article is an open access article distributed under the terms and conditions of the Creative Commons Attribution (CC BY) license (https://creativecommons.org/licenses/by/4.0/).
Share and Cite
Shi, J.; Liu, Z. Accident Data-Driven Consequence Analysis in Maritime Industries. J. Mar. Sci. Eng. 2025, 13, 117. https://doi.org/10.3390/jmse13010117
Shi J, Liu Z. Accident Data-Driven Consequence Analysis in Maritime Industries. Journal of Marine Science and Engineering. 2025; 13(1):117. https://doi.org/10.3390/jmse13010117
Chicago/Turabian StyleShi, Jiahui, and Zhengjiang Liu. 2025. "Accident Data-Driven Consequence Analysis in Maritime Industries" Journal of Marine Science and Engineering 13, no. 1: 117. https://doi.org/10.3390/jmse13010117
APA StyleShi, J., & Liu, Z. (2025). Accident Data-Driven Consequence Analysis in Maritime Industries. Journal of Marine Science and Engineering, 13(1), 117. https://doi.org/10.3390/jmse13010117