Abstract
The operating environment of large mechanical equipment on ships is extremely harsh. Under such harsh conditions, it is necessary to effectively monitor and assess the health status of machinery and equipment and to take appropriate maintenance measures to ensure the normal operation of the ship and the safety of the lives and property of the crew. However, currently used methods are less effective in detecting non-ferromagnetic abrasive particles and non-metallic contaminants and may not be able to respond to certain emergencies promptly. Therefore, in this paper, a quad-solenoid coil multi-contaminant oil detection sensor is proposed to detect metallic abrasive particles and non-metallic contaminants using the voltage–capacitance dual mode. We provide an analytical expression for the magnetic field strength of the present sensor and develop a corresponding mathematical model. In order to verify its accuracy, we compared the model results with finite element analysis and verified them experimentally. Analysis of the experimental results shows that by switching the detection mode of the sensor, ferromagnetic metal particles, non-ferromagnetic metal particles, and non-metallic contaminants in the oil can be identified according to the different experimental signal curves. The sensor recognizes ferromagnetic particles over 70 μm in diameter, non-ferromagnetic particles over 220 μm in diameter, water droplets over 100–110 μm in diameter, and air bubbles over 180–190 μm in diameter. By comparing the sensor with existing sensors, the sensor can provide accurate information about various pollutants, help maintenance personnel to develop a reasonable maintenance program, and reduce the maintenance cost of ship machinery.
1. Introduction
In the marine operating environment, marine equipment usually works in high-load, high-temperature, high-humidity, and other complex conditions, while high speed will make the equipment withstand greater centrifugal forces and thus lead to friction and wear, these factors will cause the contamination and deterioration of lubricating oil for mechanical equipment, resulting in the blockage of pipelines and other problems, increasing the risk of equipment failure. Oil detection is crucial for large-scale machinery and equipment on board ships, and oil detection technology can help detect signs of wear and failure within the equipment in a timely manner to ensure the quality and performance of the lubricant. In the high-intensity maritime operating environment, regular fluid testing can effectively extend the service life of equipment, reduce unplanned downtime and maintenance costs, and ensure the safe operation and operational efficiency of the ship [1,2].
At the initial stage, the detection of oil fluid mainly relies on the method of particle counting, and later on, iron spectrum analysis is mostly used, but it cannot be widely applied because iron spectrum analysis requires a higher technical level of the staff. Currently, the detection of metallic wear particles in lubricating oils used by ships mainly includes optical detection [3,4], acoustic detection [5,6], capacitance detection [7,8], resistance detection [9,10], and inductance detection [11]. The optical method has high measurement accuracy, but the detection results are easily affected by the transmittance of the oil; the acoustic method can distinguish between solid and gaseous pollutants in the oil, but the stability of the detection results is greatly interfered with by the environmental noise; the inductance method is based on the principle of electromagnetic induction and distinguishes between metal particles with different magnetic properties according to the enhancement and weakening of the magnetic field by magnetization and eddy current effects [12]. By detecting and collecting the pulse signals generated by changes in the magnetic field of the detection coil, further information, such as the material and size of the metal particles, can be deduced [13,14,15]. The capacitive detection method can recognize non-metallic contaminants but cannot detect metallic wear particles [16]. Many research organizations are conducting research based on similar sensors that have been improved to achieve a higher throughput or accuracy of detection. However, these sensors can only see a single contaminant and cannot detect multiple contaminants. Macom (Macom Systems, Vector, NY, USA) manufactures the TechAlert™ sensor [17], an inductive sensor for wind turbine applications. The sensor detects ferromagnetic metal particles larger than 100 μm and non-ferromagnetic metal particles between 200 μm in the oil. The Patrol In-Line sensor manufactured by MTML consists of two coils. The sensor detects ferromagnetic metal particles larger than 25 μm and non-ferromagnetic metal particles larger than 90 μm [18].
Li et al. [19] designed an oil detection sensor consisting of three coils with a circuit design, whose detection system can be used for signal processing and is capable of detecting and distinguishing iron particles from copper particles. Zhu et al. [20] improved sensor accuracy by adding a ferrite core to the sensor. Ren et al. used one excitation coil and multiple induction coils to design the oil detection sensor, which increases the detection throughput and improves the detection accuracy [21]. Du et al. used LC resonant circuits to improve the detection system, which significantly improved the performance of the sensor for pollutants. The sensitivity of the sensor was significantly improved, but only metal particles could be detected [22].
Therefore, to address the above problems, a four-solenoid coil multi-impurity oil detection sensor is proposed in this paper. The main research is as follows:
- The sensor uses the magnetic coupling principle, which utilizes electromagnetic coupling between coils to detect oil contaminants in the sensor channel by monitoring the change in the excitation coil signal. The inductive–capacitive dual mode is used to detect metallic abrasive particles and non-metallic contaminants.
- The sensor has a flexible multi-mode switching function. In the voltage mode, it recognizes metal particles of different magnetic properties mixed in the fluid; while in the mode of capacitive detection, the sensor can differentiate between the types and sizes of contaminants such as water droplets and air bubbles. This design makes the detection of contaminants in fluids more convenient and faster.
- The sensor designed in this paper for detecting ferromagnetic particles and copper particles has a total of five peaks in the signal image. The material of the particles can be determined by observing the characteristics of the signal, while the type and size of air bubbles and water droplets mixed in the oil can be effectively identified by the direction of the detected signal in capacitive mode.
Compared with the existing oil detection sensors, the sensor has a simple structure, is easy to operate, can realize the measurement of multiple pollutants by switching modes, and at the same time, the signal characteristics are obvious, the detection accuracy is high, and it is easy to realize the integration. Given the above advantages, the sensor is easy to produce and easy to operate, laying the foundation for the development of a new generation of oil contaminant detection devices. At the same time, due to the wide range of applications of the oil detection sensor, it can be extended to a wide range of applications in other fields in the future, including the power industry, aerospace, offshore wind platforms, and gas turbines.
2. Sensor Design and Principle
Figure 1 shows the structure of the sensor, which utilizes a four-solenoid coil structure. The sensor consists of four solenoid coils and a microchannel. The sensor’s inner part uses an induction coil wound with 200 turns of 0.05 mm enameled wire as the excitation coil, with a coil height of 5 mm and a bore diameter of 1 mm; the sensor’s outer part uses a solenoid coil wound with 200 turns of 0.05 mm enameled wire as the excitation coil, with a coil height of 1 mm and a bore diameter of 2 mm. The microchannel has a diameter of 1 mm and passes through the inner hole of the internal solenoid to ensure that the coils and the microchannel are on the exact center axis. The multi-contaminant oil detection sensor operates in the voltage and capacitance detection modes.
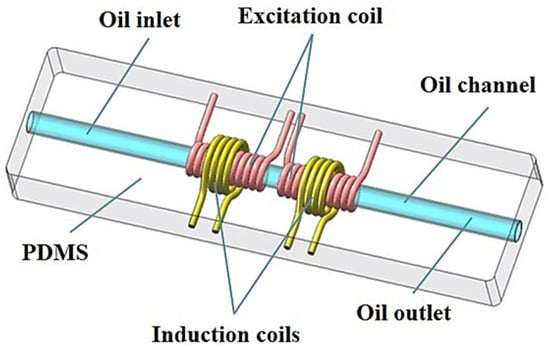
Figure 1.
Sensor design.
2.1. Voltage Detection Mode
Figure 2 shows the schematic diagram of the sensor connection in the voltage detection mode. As shown in Figure 3, when terminals B and C are connected; terminals A and D are connected to the voltage detection circuit; and terminals E, F, G, and H are connected to the AC power supply, the sensor is in the voltage detection mode. When the oil is mixed with metal particles such as iron, copper and other contaminants, the voltage detection circuit will operate, and at the same time, it will transmit the change in the sensor’s voltage signal to the computer, and the software will carry out the work of processing the digital signal.
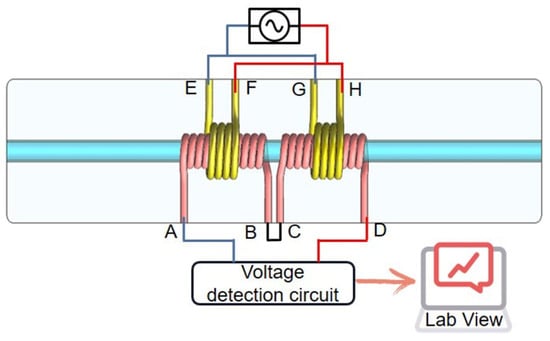
Figure 2.
Voltage detection mode.
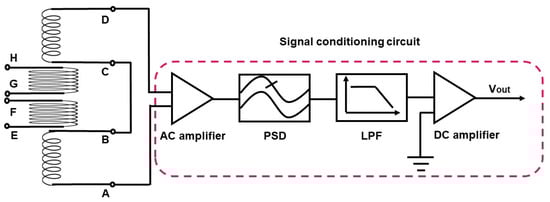
Figure 3.
Voltage detection circuit.
2.2. Capacitance Detection Mode
Figure 4 shows a schematic diagram of the sensor connection in the capacitive detection mode. As shown in Figure 5, when the A and D ends are connected to the impedance analyzer, the sensor only works on the left and right coils and is in the capacitance detection mode. When impurities such as water droplets or air bubbles are present in the oil, the impedance analyzer picks up the capacitance signal changes and transfers them to a computer for digital signal processing.
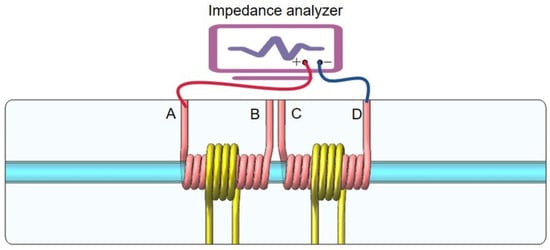
Figure 4.
Capacitance detection mode.
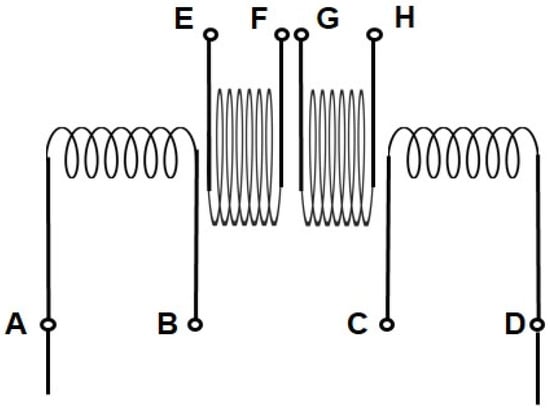
Figure 5.
Capacitance detection circuit.
2.3. Detection Principle
- (1)
- Voltage Detection Principle:
In the voltage mode, the two coils inside the sensor are excitation coils with the same current direction, providing a magnetic field with the same device; the two coils outside are induction coils, which convert the change in the magnetic field of the two excitation coils into an induced voltage when metal particles pass through the sensor. Due to the different electrical conductivity and magnetic properties of various metals, they have other effects on the magnetic field. As the particulate contaminant passes through the sensor, its magnetic field distribution changes and so does the induced voltage of the coil.
The mutual inductance coefficients and joint electromotive forces of the excitation and induction coils are shown in Table 1.

Table 1.
Comparison table of mutual inductance coefficient and mutual inductance electromotive force of excitation coil and induction coil.
When the current through the coil [23,24,25],
The induced voltage produced by the change in magnetic flux on induction coil 1 is
The induced voltage produced by the change in magnetic flux on induction coil 2 is
Then, the total induced voltage resulting from the change in magnetic flux is
From Equation (7), it can be seen that there is a link between the output-induced voltage and the mutual inductance coefficient, and when particles pass through different coils, the degree of influence on their mutual inductance coefficients, M1, M2, M3, and M4, is different, thus affecting the output voltage.
- (2)
- Capacitance Detection Principle:
The capacitive mode designed in this paper is two identical solenoid coils inside the sensor, as shown in Figure 6. The capacitive coupling effect of the solenoid coil needs to be taken into account when performing capacitance measurements on a dual-mode probe with the sensitive element shown in Figure 6. In particular, the capacitive coupling effect of the solenoid coil mainly consists of the lead capacitance CL, the turn-to-turn capacitance Ct, and the wiring’s capacitance Cs.
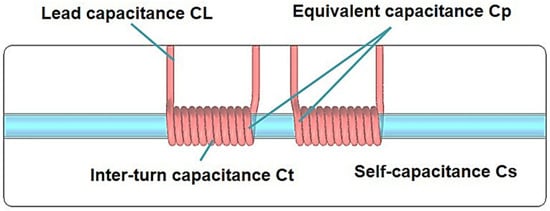
Figure 6.
Capacitive coupling effect of the solenoid coil.
The total capacitance value of the coil capacitive coupling effect is denoted as C1, which is the sum of the wiring’s own capacitance Cs, the coil turn-to-turn capacitance Ct, and the load capacitance CL, as shown in Equation (8).
In addition to the coil capacitive coupling effect, there is an equivalent capacitance of the two solenoid coils in addition to the coil capacitive coupling effect when utilizing the dual-mode probe for detection, and Figure 6 shows a schematic diagram of the shape of the equivalent capacitance of the two solenoid coils.
The two opposing solenoid coils inside can be equivalently viewed as two flat capacitor pole plates, as shown in Figure 7, and the ends of the capacitor pole plates are connected to the impedance analyzer with positive and negative poles to form a closed-circuit capacitor. There is a capacitive edge effect at the ends of the capacitor pole plate, and the capacitive coupling effect of the electromagnetic coil needs to be considered [26].
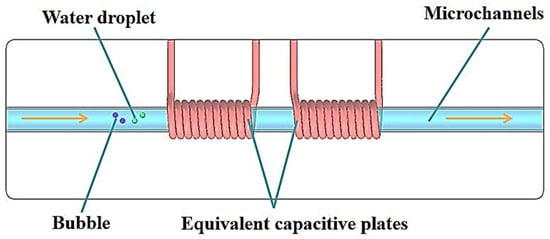
Figure 7.
Simulation modeling of sensors. The arrows show the direction of oil flow.
The formula for the flat capacitance is shown in Equation (9).
where ε0 is the vacuum relative permittivity, the value of 8.854 × 10⁻¹² F/M; εr is the relative permittivity of the medium; d is the distance between the two-capacitance pole plate; S is the capacitance pole plate area.
In summary, the total capacitance value detected by the sensor capacitance is C = C1 + Cp. Since water and air have different dielectric constants, when fluid mixed with water and air passes through the sensor, contaminants are recognized based on the changes in the sensor’s capacitance value.
3. Finite Element Simulation
Magnetic Field Simulation
COMSOL 6.0 finite element calculation software is comprehensive and very suitable for this study as part of multi-physics field coupling [27]. Its unique magnetic field module gives it a significant advantage in the field of magnetic field analysis and enables it to solve a variety of complex multiphysics field problems [28,29,30]. In this paper, the magnetic field module is used to analyze the magnetic field distribution around the sensor and to investigate the effect of the change in the position of the spherical ferromagnetic metal particles on the magnetic flux density mode of the sensor. Subsequently, the sensor model is established based on the sensor design parameters, and Figure 8 shows the simulation model of the sensor in the software. Mesh delineation was carried out after establishing the model, and an adaptive meshing technique was adopted to improve the calculation accuracy and efficiency. In the simulation, a voltage of 2 V was applied to the excitation frequency was 1.5 MHz. A Lenovo T490s (Lenovo, Beijing, China) was used to perform the simulation calculation.
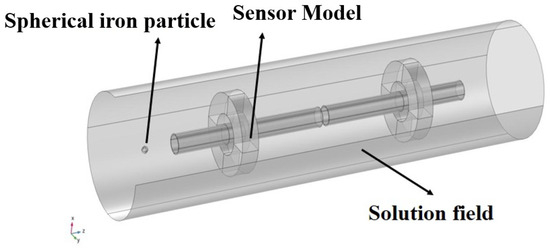
Figure 8.
Three-dimensional modeling of sensors in COMSOL.
To validate the above sensor model, a finite element model was built in COMSOL 6.0 multiphysics to obtain the flux density modes of each part of the sensor. The flux density mode reflects the distribution of the magnetic field in the sensor coil, and it can be seen in the sectional view that the flux density mode has the largest value at the inner wall of the inner coil. Figure 9 shows the magnetization of ferromagnetic metal particles as they pass through the sensor.
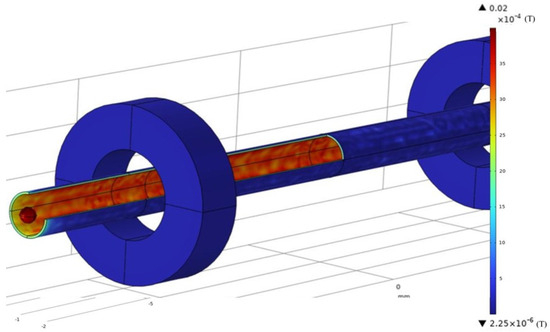
Figure 9.
Magnetization of ferromagnetic metal particles as they pass through.
The magnetic field distribution of the model constructed according to the actual parameters of the sensor is shown in Figure 9, which verifies the accuracy of the theoretical model and lays the foundation for the subsequent experiments to measure the signals of the sensor-induced voltage. Figure 10 shows the curve derived from COMSOL 6.0 simulation when a 350 µm iron particle passes through the sensor.
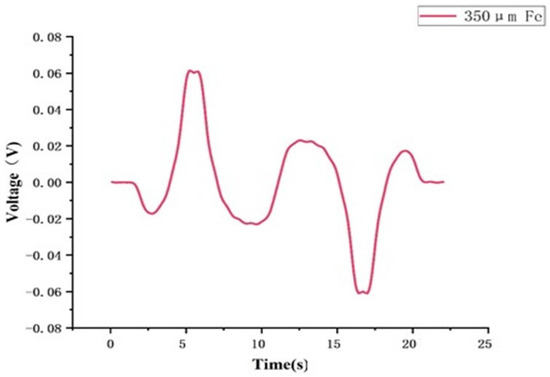
Figure 10.
Simulation curves.
4. Experimental Analyses
4.1. Sensor and Detection System
To fabricate the sensors, enameled copper wire was first selected, and four solenoid coils required for fabricating the sensors in the experiment were wound using SRDZ23-1B Precision Winding Machine and then set aside. Next, the external readout coils were fixed on a slide and a 6 cm long, 1 mm diameter iron rod was selected to pass through the bore of the two internal coils, which were used to make the oil channels of the sensor. Subsequently, the PDMS binder (polydimethylsiloxane) and hardener were mixed in a 10:1 ratio, and the homogeneous gelling solution was placed in a vacuum chamber for 30 min under vacuum. The configured gelling solution was poured into a mold, and the molded sensor was placed in a drying oven for curing at a temperature of 80 °C for 90 min. After curing, the iron rod is pulled out to form a 1 mm micro-channel, which is then perforated to make the oil inlet and outlet. Thus, the sensor designed in this paper was fabricated.
The following is the experimental procedure, which involves the preparation of the liquid to be tested, the mixing of particles of different diameters, and the use of a detection system constructed using a sensor for the experiment. The steps are as follows:
The preparation of the liquid to be tested: First, the liquid to be tested was prepared, and particles of different diameters were mixed into the lubricant. These particles were obtained from the Metallurgical Research Institute of China (MRIC), and three diameter measurements were carried out using an electron microscope to select spherical particles that met the criteria.
The construction of the detection system: A detection system was constructed using the fabricated sensors. The system consists of an oil detection sensor, a 2018 edition LabVIEW data acquisition unit, an impedance analyzer (Agilent E4980A, Agilent Technologies, Balk, Malaysia), a microscope (Nikon AZ100, Nikon Corporation, Tokyo, Japan) connected to a computer, and a miniature syringe pump (Harvard Apparatus B-85259, Harvard Apparatus, Holliston, MA, USA) for injecting oil. The sensor detection system is shown in Figure 11.
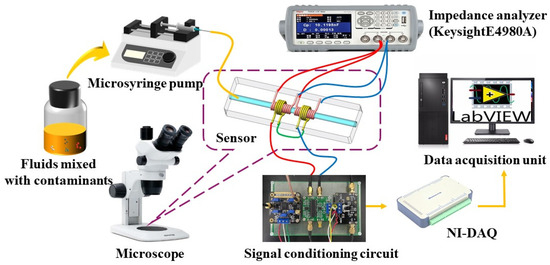
Figure 11.
Sensor detection system.
Experimental operation: In the experiment, the micro syringe pump pumped the oil to be measured into the sensor at a constant rate. First, an impedance analyzer is used to apply an excitation signal to the oil detection sensor, and the LabVIEW 2018 data acquisition system reads and saves the wear particle signal measured in real time. The experimental data thus saved can be processed and analyzed by a computer with the Matlab R2023a program installed, and the results of the analysis can be saved.
4.2. Voltage Detection Experiment
The preparation work before the experiment and the specific operation steps during the experiment are as follows:
- Instrument warm-up: Before the experiment, warm up the impedance analyzer (Agilent E4980A, Agilent Technologies, Balk, Malaysia) for 30 min to ensure stable operation. The detection voltage was set to 2 V and the detection frequency to 1.55 MHz.
- Prepare metal particles of contaminants: Iron particles with a particle size of 30–510 μm and copper particles with a particle size of 200–650 μm were selected, and the metal particles with different particle sizes were measured at 0.8 mg each using a precision balance and mixed with 200 mL of hydraulic fluid to prepare a sample of the fluid containing the required contaminants.
- Set up the experimental parameters: The LabVIEW 2018 data acquisition unit was set up, and the flow rate of the micro syringe pump was set to 50 uL/min.
- Experimental operation: During the experiment, oil mixed with particulate contaminants was passed into the sensor using a micro syringe pump, and then the flow of particles in the sensor was observed under a microscope. When the particles passed through the sensing unit, the voltage detection circuit detected the particles and obtained the voltage value through the LabVIEW 2018 data acquisition unit.
These steps help to ensure that the experiments are accurate and reproducible, as well as that the experimental data are collected efficiently. The first step is the detection frequency selection for the sensor. In this experiment, 350 µm iron particles are selected to pass through the sensor, and the experiment is carried out at different frequencies. The experimental results are shown in Figure 12. The voltage amplitude is the largest at the frequency of 1.5 MHz, so 1.5 MHz is selected as the frequency of this experiment.
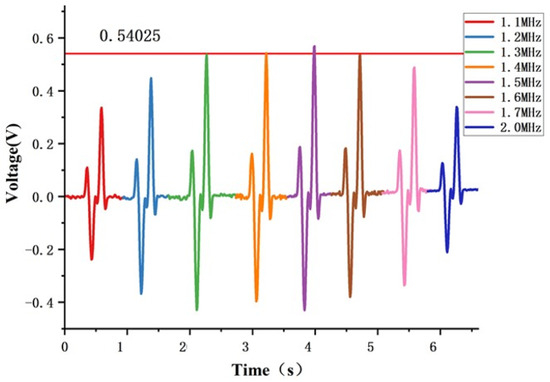
Figure 12.
Signal images at different excitation frequencies.
As shown in Figure 13, the sensor detection value curve consists of six peaks. In this paper, the second and fifth peaks are called the central peak, the first and sixth peaks are called secondary peaks, and the third and fourth segments called the intermediate peaks. When the ferromagnetic metal particles through the sensor detection area, the signal is presented as a six-peak signal; from left to right, the signal direction in order as “up-down-up-down-up-down-up-down-up-down”. When copper particles pass through the sensor, the signal is presented as six peak signals; from left to right, the signal direction is “down-up-down-down-up-down-up-down-down-up”, where the main peak value is first up and then down, and the secondary peak value and intermediate peak value are first up and then down. When copper particles pass through the sensor, the signal is presented as six peak signals; from left to right, the signal direction is “down-up-down-down-down-down-up”, where the central peak value is first up and then down, and the secondary peak value and intermediate peak value are first down and then up. The primary peak is first up and then down, and the secondary peak and the middle peak are first down and then up. The curve trend of iron particles and copper particles is apparent.
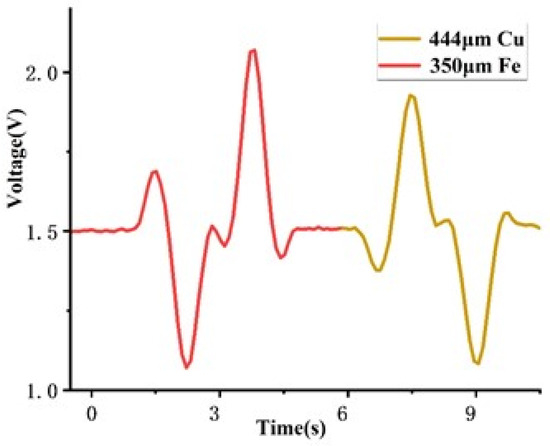
Figure 13.
Comparison of signals from iron and copper particles.
In the detection of iron particles, from large-size particles to small-size detection, the first detection is 350 μm iron particles. The signal graph shown in Figure 14 is better in the detection of 350 μm iron particles, which indicates that the sensor has a significant detection ability for large-size particles. Figure 15 shows the results of the detection of 70 µm iron particles. According to the description, although the signal values are relatively significant, they are less effective than for larger-sized particles. This means that there may be challenges in detecting 70 µm iron particles, such as signal fluctuations that are not significant enough or more signal noise detected, resulting in less accuracy in determining particle passage.
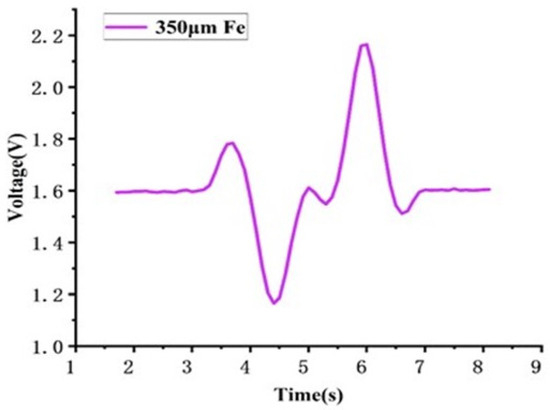
Figure 14.
Signal of 350 μm iron particles.
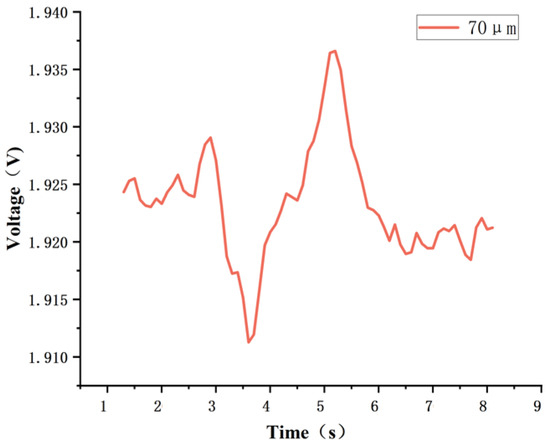
Figure 15.
Signal of 70 μm iron particles.
The signal-to-noise ratio (SNR) is an important measure of a sensor’s detection capability, and its value is determined by the ratio of the numerical magnitude of the signal to the numerical magnitude of the noise. The higher the SNR, the greater the impact of the sensor on the detection of pollutants, i.e., the ability to detect the target signal more accurately and with less interference from noise. In Figure 16, the signal values and their signal-to-noise ratios are shown for iron particles of different size ranges. It is observed that as the size of the particles increases, the signal-to-noise ratio also increases, whereas the signal-to-noise ratio is lower for smaller-sized particles. This indicates that for smaller-sized particles, the sensor is less effective in detecting the particles and may have large errors, hence not suitable for experiments.
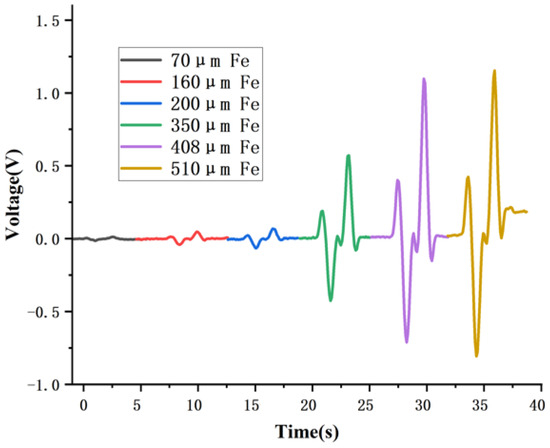
Figure 16.
Signal of 70–510 μm iron particles.
In Figure 17, the situation when detecting copper particles is depicted. When large-sized copper particles (500 μm) pass through the detection area, the signal is unambiguous. However, when smaller-sized copper particles (220 μm) pass through, the signal amplitude decreases, as shown in Figure 18. This may be caused by the smaller detection signal of the smaller-sized particles or the higher noise interference.
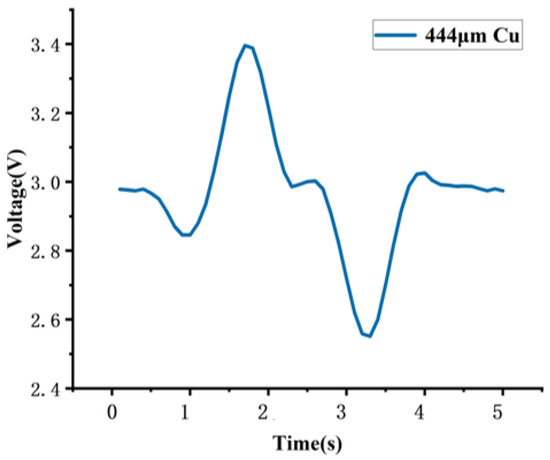
Figure 17.
Signal of 444 μm copper particle.
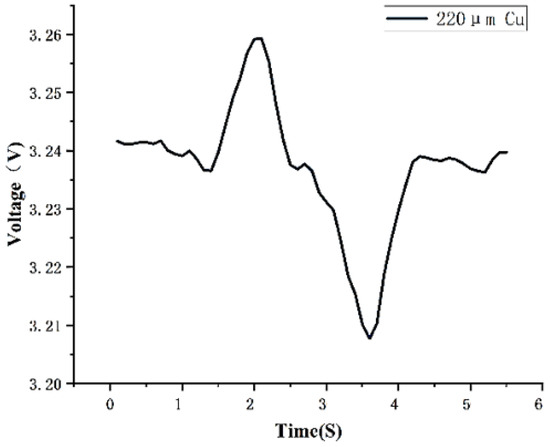
Figure 18.
Signal of 220 μm copper particle.
These results suggest that the effect of particle size on sensor performance needs to be taken into account during experimental design and data analysis to more accurately evaluate the detection results and make appropriate adjustments.
Based on the data displayed in Figure 19, a similar conclusion to the previous one can be drawn: for smaller-sized copper particles (below 220 μm), the sensor is able to detect their presence, but with poor detection and a low signal-to-noise ratio, making it unsuitable for experimental purposes. For larger-sized copper particles (greater than 220 μm), the sensor was able to detect them better, and the signal-to-noise ratio was correspondingly higher.
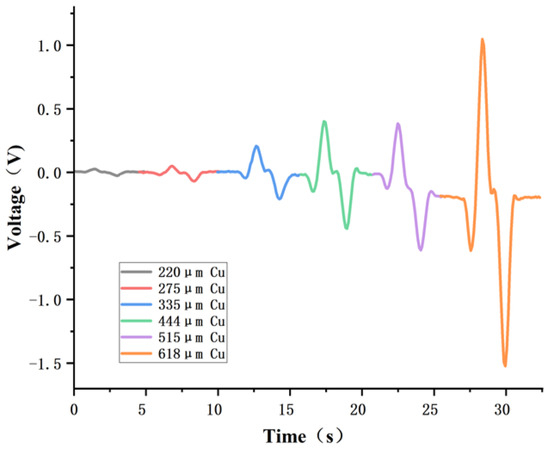
Figure 19.
Signal of 220–618 μm copper particle.
This finding re-emphasizes the need to consider the effect of particle size on sensor performance during experimental design and data interpretation to ensure accurate and reliable assessment of detection results.
4.3. Capacitance Detection Experiment
By changing the wiring of the external wires of the sensor coil, it is possible to convert its sensor into a capacitive detection mode for detecting contaminants such as water and air bubbles present in the lubricating oil. In the experiment, water and air were mixed with hydraulic oil and then oscillated in an ultrasonic oscillator to prepare a mixture of water droplets and air.
During the capacitive detection process, since hydraulic oil, water droplets, and air have different dielectric constants, they are detected differently in the sensor. According to the results in Figure 20, when oil and water are mixed, the detection capacitance increases instantaneously, and the signal rises to be able to detect the signal for water droplets of 100–110 µm. Figure 21 shows that for droplet sizes from 100 to 280 µm, the larger the size of the particulate contaminant, the more pronounced the signal curve, i.e., the higher the signal-to-noise ratio; the opposite is true for smaller particle sizes. For particles smaller than 100 µm, although they can be detected, the detection is relatively poor, and the error can be large.
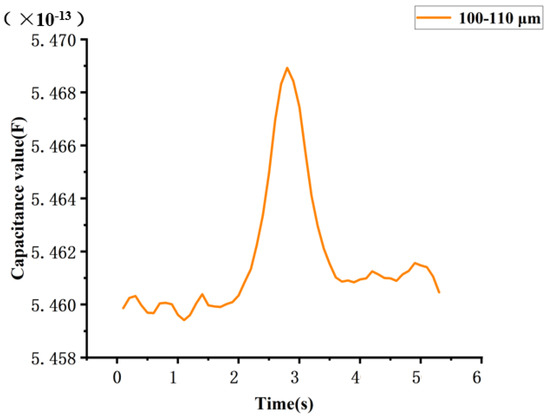
Figure 20.
Signal of 100–110 μm water droplet.
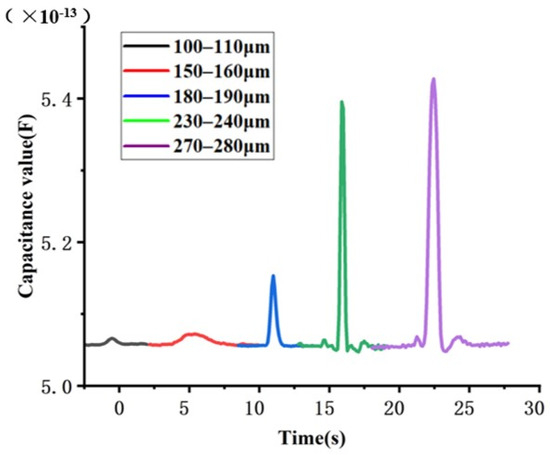
Figure 21.
Signal of 100–280 μm water droplet.
As the bubbles mix with the water, the detection capacitance decreases, causing the signal to travel downwards. In Figure 22, when bubble particles of 210–220 μm pass through the detection area, the signal is very clear. However, in Figure 23, the signal is weak when 180–190 μm bubble particles pass through the detection area.
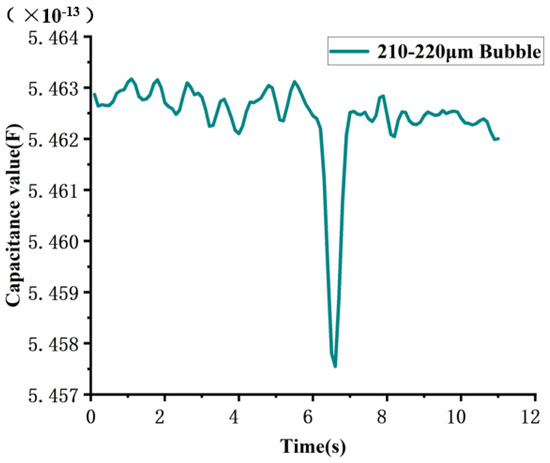
Figure 22.
Signal of 210–220 μm bubble.
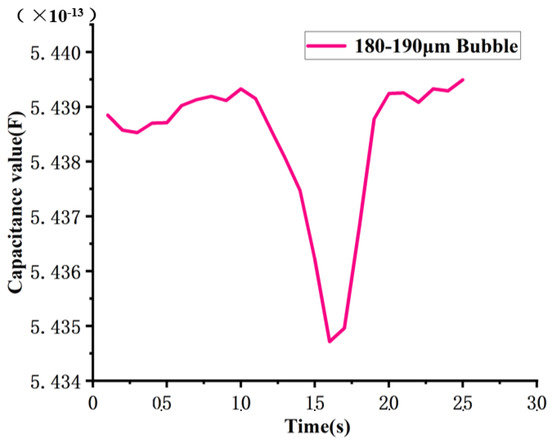
Figure 23.
Signal of 180–190 μm bubble.
According to Figure 24, for water droplet particles with particle sizes from 100 μm to 280 μm, the following conclusions are drawn: as with the water droplet conclusion above, the larger the particle size of the bubble, the higher the calculated signal-to-noise ratio will be. For particles smaller than 100 microns, although the sensor can detect them, the detection is poor.
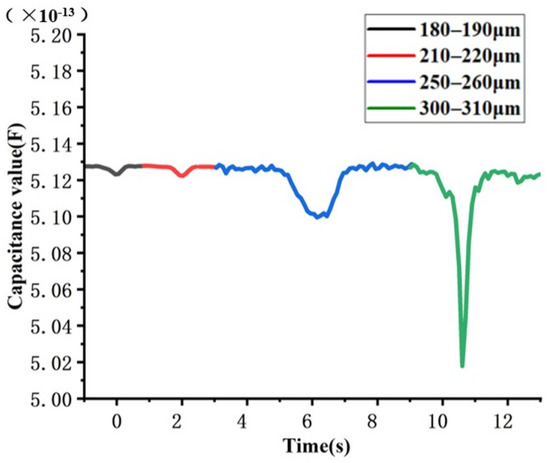
Figure 24.
Signal of 180–280 μm bubble.
The sensor can be used to detect multiple pollutants by switching the detection mode, and in the experiment, different signal characteristics can be recognized to separate the particle types. When ferromagnetic metal particles pass through the sensor’s detection area, the signal indicates a six-peak trend. From left to right, the signal direction is “up-down-up-down-up-down-up-down”, in which the primary peak value for the first down and then up, and the secondary peak and the intermediate peak for the first up and then down. When copper particles pass through the sensor’s detection area, the signal shows six peaks, from left to right. The signal direction is “down-up-down-up-down-up-down-down-up”, in which the primary peak value is first up and then down, and the sub-peak value and the middle peak value are first down and then up.
In the process of recognizing non-metallic particles, when the water droplet passes through the detection area of the sensor, the signal shows a single peak trend, and the signal direction is “up”; and when the air bubbles in the oil pass through the detection area of the sensor, the signal also shows a single peak trend, but the signal direction is “down”. The signal also shows a single peak trend, but the signal direction is “downward”. By observing the different characteristics of the signal direction, it is possible to clearly distinguish between different materials and pollutants.
5. Conclusions
In this study, a novel sensor was developed based on microfluidic oil detection technology, which is capable of detecting a wide range of oil contaminants. The sensor adopts a quad-coil design, which can accurately identify different magnetic particles and non-metallic contaminants in oil according to different detection modes and signal curves. The detection range includes ferromagnetic particles larger than 70 μm in diameter, non-ferromagnetic particles larger than 220 μm in diameter, water droplets larger than 100–110 μm in diameter, and air bubbles larger than 180–190 μm in diameter. With high sensitivity and accuracy, the sensor can effectively monitor trace metal and non-metal contaminants in oil, providing a new method for rapid detection of oil contaminants. This research provides technical support for the monitoring and maintenance of ship machinery and equipment, and the operator can set the corresponding threshold value for the particle size of pollutants according to the specific operating conditions, when the particle size of the particles reaches a specific value, the maintenance of machinery and equipment will be carried out. In the future, the inspection system will continue to be improved, and based on its universality, it will be popularized by the shipbuilding field and applied to the electric power industry, offshore wind power platforms, and gas turbines.
Author Contributions
Conceptualization, S.Z. and Z.Z.; methodology, Z.Z.; software, Z.Y.; validation, S.Z., Z.Z., S.H., C.B. and H.Z.; formal analysis, S.Z.; investigation, H.W., L.Q. and D.Y.; resources, C.B. and H.Z.; data curation, S.Z.; writing—original draft preparation, S.Z.; writing—review and editing, Z.Z.; visualization, S.H.; supervision, B.W. and H.Z.; supervision, B.W.; funding acquisition, C.B. and H.Z. All authors have read and agreed to the published version of the manuscript.
Funding
This work was supported by the Natural Science Foundation of China (Grant No. 52301361, 52271303), Fundamental Research Funds for the Central Universities (Grant No. 3132023522), Project funded by China Postdoctoral Science Foundation (Grant No. 2023M730454), Science and Technology Innovation Fund of Dalian (Grant No. 2022JJ11CG010), Innovative Projects for the Application of Advance Research on Equipment (No. 62602010210).
Data Availability Statement
The data presented in this study are available upon request from the respective authors.
Conflicts of Interest
Authors Huancheng Wang, Liang Qu and Debao Yang were employed by the company Yantai Port Barge Co., Ltd. The remaining authors declare that the research was conducted in the absence of any commercial or financial relationships that could be construed as a potential conflict of interest.
References
- Gupta, K.K.; Hirani, H.; Muzakkir, S.M. Online Gear Wear Particle Detection and Categorization Using a Convolutional Neural Network Algorithm Integrated with Cascade Classifier. Tribol. Ind. 2023, 45, 212–225. [Google Scholar] [CrossRef]
- Urban, A.; Urban, A.; Zhe, J.; Zhe, J. A microsensor array for diesel engine lubricant monitoring using deep learning with stochastic global optimization. Sens. Actuators A Phys. 2022, 343, 113671. [Google Scholar] [CrossRef]
- Liu, Z.; Liu, Y.; Zuo, H.; Wang, H.; Wang, C. Oil debris and viscosity monitoring using optical measurement based on Response Surface Methodology. Measurement 2022, 195, 111152. [Google Scholar] [CrossRef]
- Iwai, Y.; Honda, T.; Miyajima, T.; Yoshinaga, S.; Higashi, M.; Fuwa, Y. Quantitative estimation of wear amounts by real time measurement of wear debris in lubricating oil. Tribol. Int. 2010, 43, 388–394. [Google Scholar] [CrossRef]
- Xu, C.; Zhang, P.; Wang, H.; Li, Y.; Lv, C. Ultrasonic echo waveshape features extraction based on QPSO-matching pursuit for online wear debris dis-crimination. Mech. Syst. Signal Process. 2015, 60, 301–315. [Google Scholar] [CrossRef]
- Weser, R.; Wöckel, S.; Hempel, U.; Wessely, B.; Auge, J. Particle characterization in highly concentrated suspensions by ultrasound scattering method. Sens. Actuators A Phys. 2013, 202, 30–36. [Google Scholar] [CrossRef]
- Han, Z.; Wang, Y.; Qing, X. Characteristics Study of In-Situ Capacitive Sensor for Monitoring Lubrication Oil Debris. Sensors 2017, 17, 2851. [Google Scholar] [CrossRef] [PubMed]
- Zhu, L.; Xiao, X.; Wu, D.; Wang, Y.; Qing, X.; Xue, W. Qualitative Classification of Lubricating Oil Wear Particle Morphology Based on Coaxial Capacitive Sensing Network and SVM. Sensors 2022, 22, 6653. [Google Scholar] [CrossRef]
- Birkin, P.R.; Linfield, S.; Denuault, G.; Jones, R.; Youngs, J.J.; Wain, E. An Analytical Differential Resistance Pulse System Relying on a Time Shift Signal Analysis–Applications in Coulter Counting. ACS Sens. 2019, 4, 2190–2195. [Google Scholar] [CrossRef]
- Song, Y.; Zhang, H.; Chon, C.H.; Pan, X.; Li, D. Nanoparticle detection by microfluidic Resistive Pulse Sensor with a submicron sensing gate and dual detecting channels-two stage differential amplifier. Sens. Actuators B Chem. 2011, 155, 930–936. [Google Scholar] [CrossRef]
- Zhang, H.; Zhang, Z.; Zhao, X.; Li, H.; Li, W.; Wang, C.; Bai, C.; Hu, S. An LC resonance-based sensor for multi-contaminant detection in oil fluids. IEEE Sens. J. 2024, 24, 9772–9782. [Google Scholar] [CrossRef]
- Muthuvel, P.; George, B.; Ramadass, G.A. A Highly Sensitive In-Line Oil Wear Debris Sensor Based on Passive Wireless LC Sensing. IEEE Sens. J. 2021, 21, 6888–6896. [Google Scholar] [CrossRef]
- Du, L.; Zhe, J. A high throughput inductive pulse sensor for online oil debris monitoring. Tribol. Int. 2011, 44, 175–179. [Google Scholar] [CrossRef]
- Zhang, Z.; Hu, S.; Bai, C.; Wang, C.; Li, H.; Zhang, H. Characterization of multi-abrasive mixed signals from LC resonance-based dual-coil oil detection sensors. IEEE Sens. J. 2024; ahead of print. [Google Scholar] [CrossRef]
- Ding, Y.; Wang, Y.; Xiang, J. An online debris sensor system with vibration resistance for lubrication analysis. Rev. Sci. Instrum. 2016, 87, 025109. [Google Scholar] [CrossRef] [PubMed]
- Jagtiani, A.V.; Sawant, R.; Carletta, J.; Zhe, J. Wavelet transform-based methods for denoising of Coulter counter signals. Meas. Sci. Technol. 2008, 19, 065102. [Google Scholar] [CrossRef]
- Available online: https://www.macom.com/ (accessed on 19 February 2024).
- Available online: https://www.poseidonsys.com/mtml/ (accessed on 19 February 2024).
- Li, Y.; Wu, J.; Guo, Q. Electromagnetic Sensor for Detecting Wear Debris in Lubricating Oil. IEEE Trans. Instrum. Meas. 2020, 69, 2533–2541. [Google Scholar] [CrossRef]
- Zhu, X.; Zhong, C.; Zhe, J. A high sensitivity wear debris sensor using ferrite cores for online oil condition monitoring. Meas. Sci. Technol. 2017, 7, 075102. [Google Scholar] [CrossRef]
- Ren, Y.J.; Li, W.; Zhao, G.F.; Feng, Z.H. Inductive debris sensor using one energizing coil with multiple sensing coils for sensitivity improvement and high throughput. Tribol. Int. 2018, 128, 96–103. [Google Scholar] [CrossRef]
- Du, L.; Zhu, X.; Han, Y.; Zhao, L.; Zhe, J. Improving sensitivity of an inductive pulse sensor for detection of metallic wear debris in lubricants using parallel LC resonance method. Meas. Sci. Technol. 2013, 24, 075106. [Google Scholar] [CrossRef]
- Yin, Y.H.; Yan, X.P.; Xiao, H.L. Study on the magnetic field homogeneity of wear debris detector. Tribology 2001, 3, 228–231. [Google Scholar]
- Xu, T.; Han, J.; Nie, P.; Xu, Z. Simulation study on embedded inductive sensor monitoring multiple wear particles. Lubr. Eng. 2016, 41, 57–61. [Google Scholar]
- Bai, Y.; Liu, Y.; Yang, L.; Fan, B.; Zhang, P.; Feng, S. A Wear Particle Sensor Using Multiple Inductive Coils Under a Toroidal Magnetic Field. IEEE Access 2021, 9, 6250–6258. [Google Scholar] [CrossRef]
- Bai, C.; Zhang, H.; Wang, W.; Zhao, X.; Chen, H.; Zeng, N. Inductive-Capacitive Dual-Mode Oil Detection Sensor Based on Magnetic Nanoparticle Material. IEEE Sens. J. 2020, 20, 12274–12281. [Google Scholar] [CrossRef]
- Multiphysics, COMSOL. Introduction to COMSOL Multiphysics®; COMSOL Multiphysics: Burlington, MA, USA, 1998; Volume 32, Available online: https://cdn.comsol.com/doc/5.5/IntroductionToCOMSOLMultiphysics.pdf (accessed on 19 February 2024).
- Kennedy, M.W.; Akhtar, S.; Bakken, J.A.; Aune, R.E. Analytical and experimental validation of electromagnetic simulations using COMSOL®, re inductance, induction heating and magnetic fields. In Proceedings of the COMSOL Users Conference, Stuttgart, Germany, 1 July 2011. [Google Scholar]
- Xu, Z.; Li, P.; Tang, J. Simulation analysis of magnetic field of degaussing coils by COMSOL. In Proceedings of the 2019 Chinese Automation Congress (CAC), Hangzhou, China, 22–24 November 2019; pp. 3537–3542. [Google Scholar]
- Sattel, T.F.; Biederer, S.; Knopp, T.; Lüdtke-Buzug, K.; Gleich, B.; Weizenecker, J.; Borgert, J.; Buzug, T.M. Single-Sided Coil Configuration for Magnetic Particle Imaging. In Proceedings of the World Congress on Medical Physics and Biomedical Engineering, Munich, Germany, 7–12 September 2009. [Google Scholar]
Disclaimer/Publisher’s Note: The statements, opinions and data contained in all publications are solely those of the individual author(s) and contributor(s) and not of MDPI and/or the editor(s). MDPI and/or the editor(s) disclaim responsibility for any injury to people or property resulting from any ideas, methods, instructions or products referred to in the content. |
© 2024 by the authors. Licensee MDPI, Basel, Switzerland. This article is an open access article distributed under the terms and conditions of the Creative Commons Attribution (CC BY) license (https://creativecommons.org/licenses/by/4.0/).