1. Introduction
With the increasing demand for electrical power in ships and the growing stringency of environmental regulations, new solutions are needed for the future development of shipboard power systems (SPSs) [
1,
2,
3,
4]. The DC distribution SPS, as an independent power system with limited inertia, exhibits good angular stability [
5], enhancing the efficiency and reliability of SPSs [
6,
7,
8], and is poised to become a developmental trend in future marine power systems [
9]. However, propulsion loads, acting as constant power loads (CPLs), exhibit negative incremental impedance, destabilizing the DC bus voltage. This issue is exacerbated by variations in CPLs due to changes in motor speed or torque, particularly in maritime environments [
10].
During the operation of DC SPSs, the system frequently encounters minor disturbances resulting from random load changes, adjustment reactions of generator sets, and variations in transmission line spacing due to natural causes [
11,
12,
13,
14]. Although these disturbances do not fundamentally alter the overall structure of the electrical system, they can lead to varying degrees of oscillations in electrical quantities. The unique operating environment of maritime vessels complicates SPS operation, demanding higher reliability and stability. Failure to swiftly restore stability after minor disturbances during stable operation may result in system failure, jeopardizing the safety of onboard personnel and hindering vessel navigation. Analyzing and calculating the stability status of the system under various conditions is critical to ensuring its stable operation, given the characteristics of DC power distribution systems. Therefore, conducting small-signal stability analyses of DC distribution SPSs is paramount to guarantee stable operation under diverse operational conditions.
Currently, two main methods are utilized for the small-signal stability analysis of an SPS: eigenvalue analysis based on the time domain and impedance analysis grounded in the frequency domain [
15,
16]. The utilization of eigenvalue analysis offers distinct advantages, notably its ability to provide comprehensive insight into the system’s stability by directly assessing the behavior of eigenvalues. This method allows for a precise determination of the system’s response to small perturbations, facilitating the identification of stability margins and critical system parameters that influence stability.
Recent studies on the stability analysis of the DC SPS investigated the effects of design parameters on system stability [
17,
18]. An eigenvalue analysis for a hybrid power SPS incorporating virtual synchronous machines was performed to examine the impact of the voltage controller, line reactance, and virtual reactance on system stability [
19]. The stability of a hybrid DC SPS equipped with energy storage systems was assessed through a hybrid H-matrix model, focusing on the influence of energy storage working mode and inverter current controller parameters on system stability [
20].
Small-signal stability analyses are also executed for SPSs operating with generator sets in parallel. To address stability issues arising from the parallel operation of inverters with synchronous generators, small-signal models have been developed for variable-speed generator set parallel systems, analyzing stability across different system configurations [
21]. Small-signal models for synchronous generators are established by paralleling two isolated inverters, enabling calculation of participation factors and conducting an eigenvalue sensitivity analysis and small-signal stability analysis [
22]. A parameter design strategy for parameterizing parallel virtual synchronous generator systems was articulated in [
23], factoring in both AC and DC constraints, thereby delineating detailed stability boundaries through small-signal modeling. These studies primarily focused on synchronous generators and their operation in parallel, neglecting the effects of power distribution among Permanent Magnet Synchronous Generators (PMSGs) on stability, particularly when PMSGs are connected to fully controlled rectifiers involving multiple control loops.
Supercapacitors, as high-performance energy storage devices, contribute to the rapid development of low-power electronic products (wearables, portable electronic devices) and high-power military applications (guided missile technology and techniques) [
24]. Serving as buffer elements, they help stabilize the voltage of the DC bus and reduce fluctuations between power sources and loads, thus enhancing the overall stability and reliability of the system. The addition of supercapacitors in DC distribution systems may induce changes in the system’s dynamic characteristics, impacting small-signal stability. A small-signal model for a battery and supercapacitor hybrid energy storage system employing a master-slave control scheme was proposed, analyzing the effects of controller and filter parameter variations on system performance using frequency-domain analysis [
25]. This methodology was extended to the small-signal modeling and control of battery-supercapacitor systems within DC microgrids [
26]. A distributed cooperative control framework for multiple dc electric springs in a dc microgrid was established and analyzed for small-signal stability in [
27], with system stability effects of communication weight demonstrated through an eigenvalue analysis.
While existing studies on the integration of a supercapacitor into a DC SPS have laid a foundational understanding of its impact on small-signal stability, research primarily targets individual hybrid energy storage systems, leaving the broader implications of SPS stability less explored. The integration of a supercapacitor into an SPS and its consequent effect on the stability has been insufficiently considered. Existing analyses often overlook the nuanced impacts of newly introduced electrical and control parameters, such as the input-output characteristics of converters and the parameters of PI controllers for supercapacitors on system stability. These parameters play a crucial role in the operational efficiency and stability of SPSs, especially when integrated with supercapacitors.
This paper proposes a small-signal stability analysis method based on the integration of supercapacitors into a marine DC SPS under parallel operation of PMSGs, investigating the specific impact of newly introduced electrical and control parameters by a supercapacitor on system stability. The main contributions can be summarized as follows:
- (1)
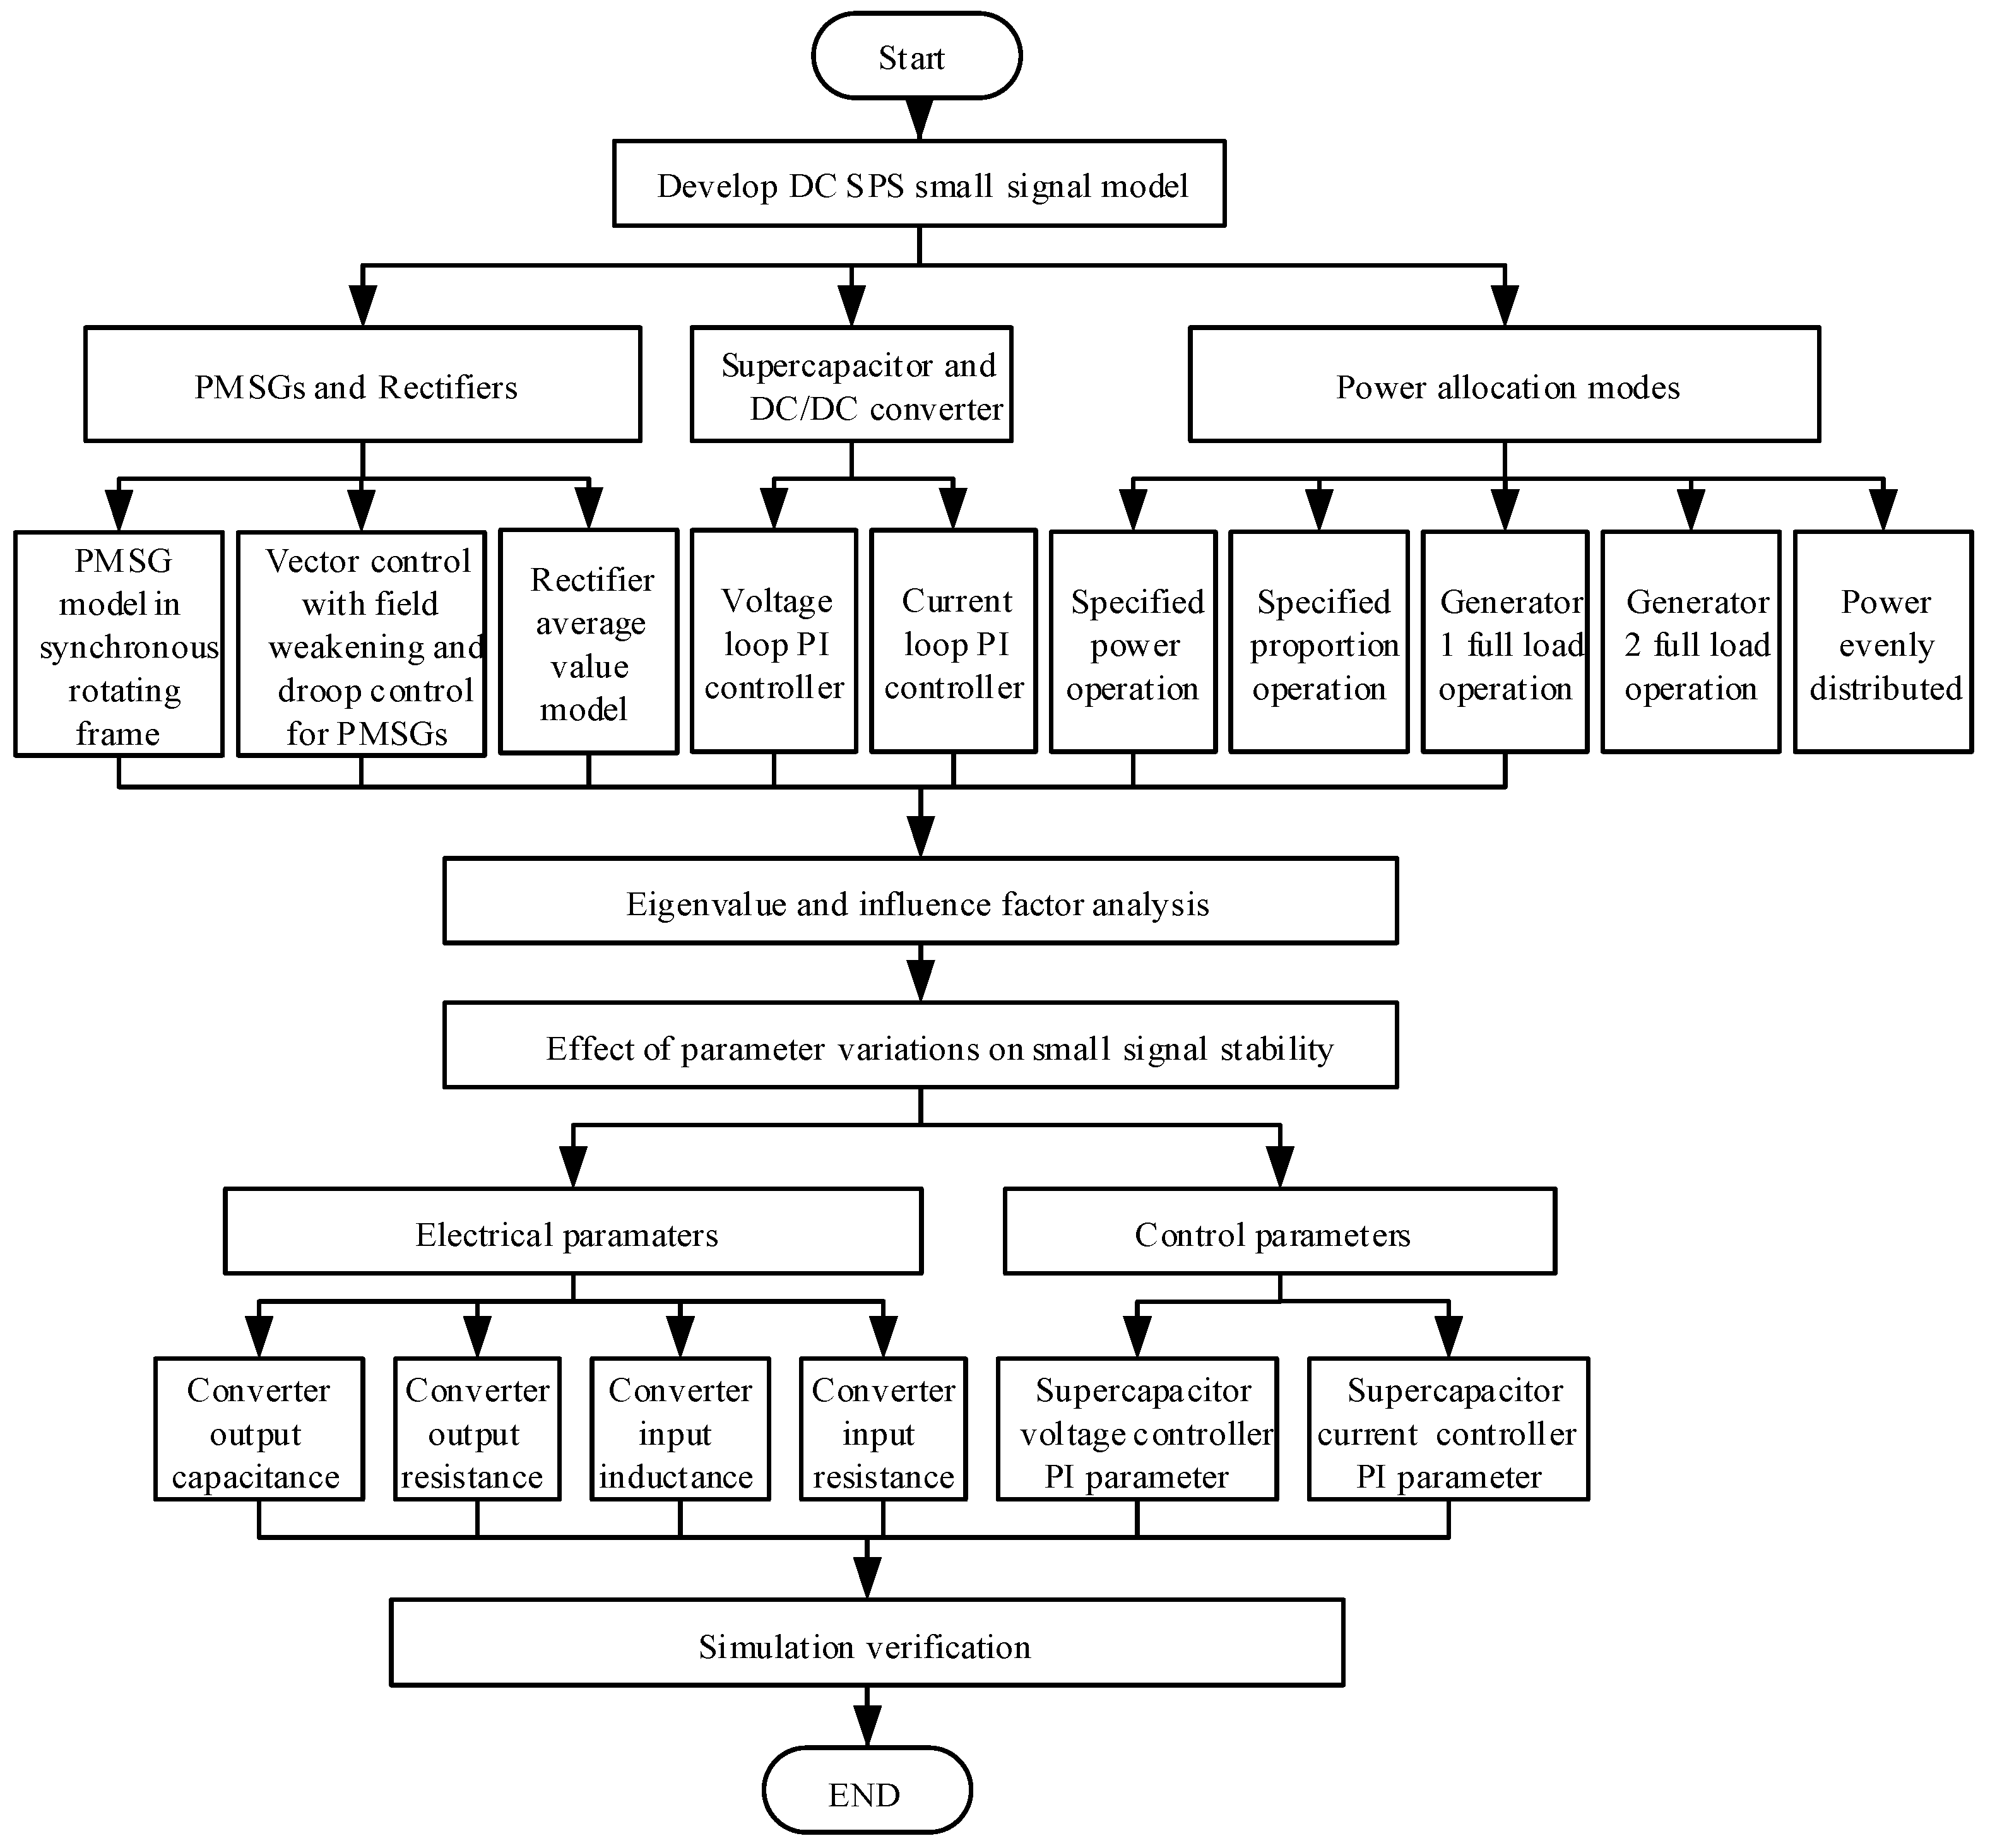
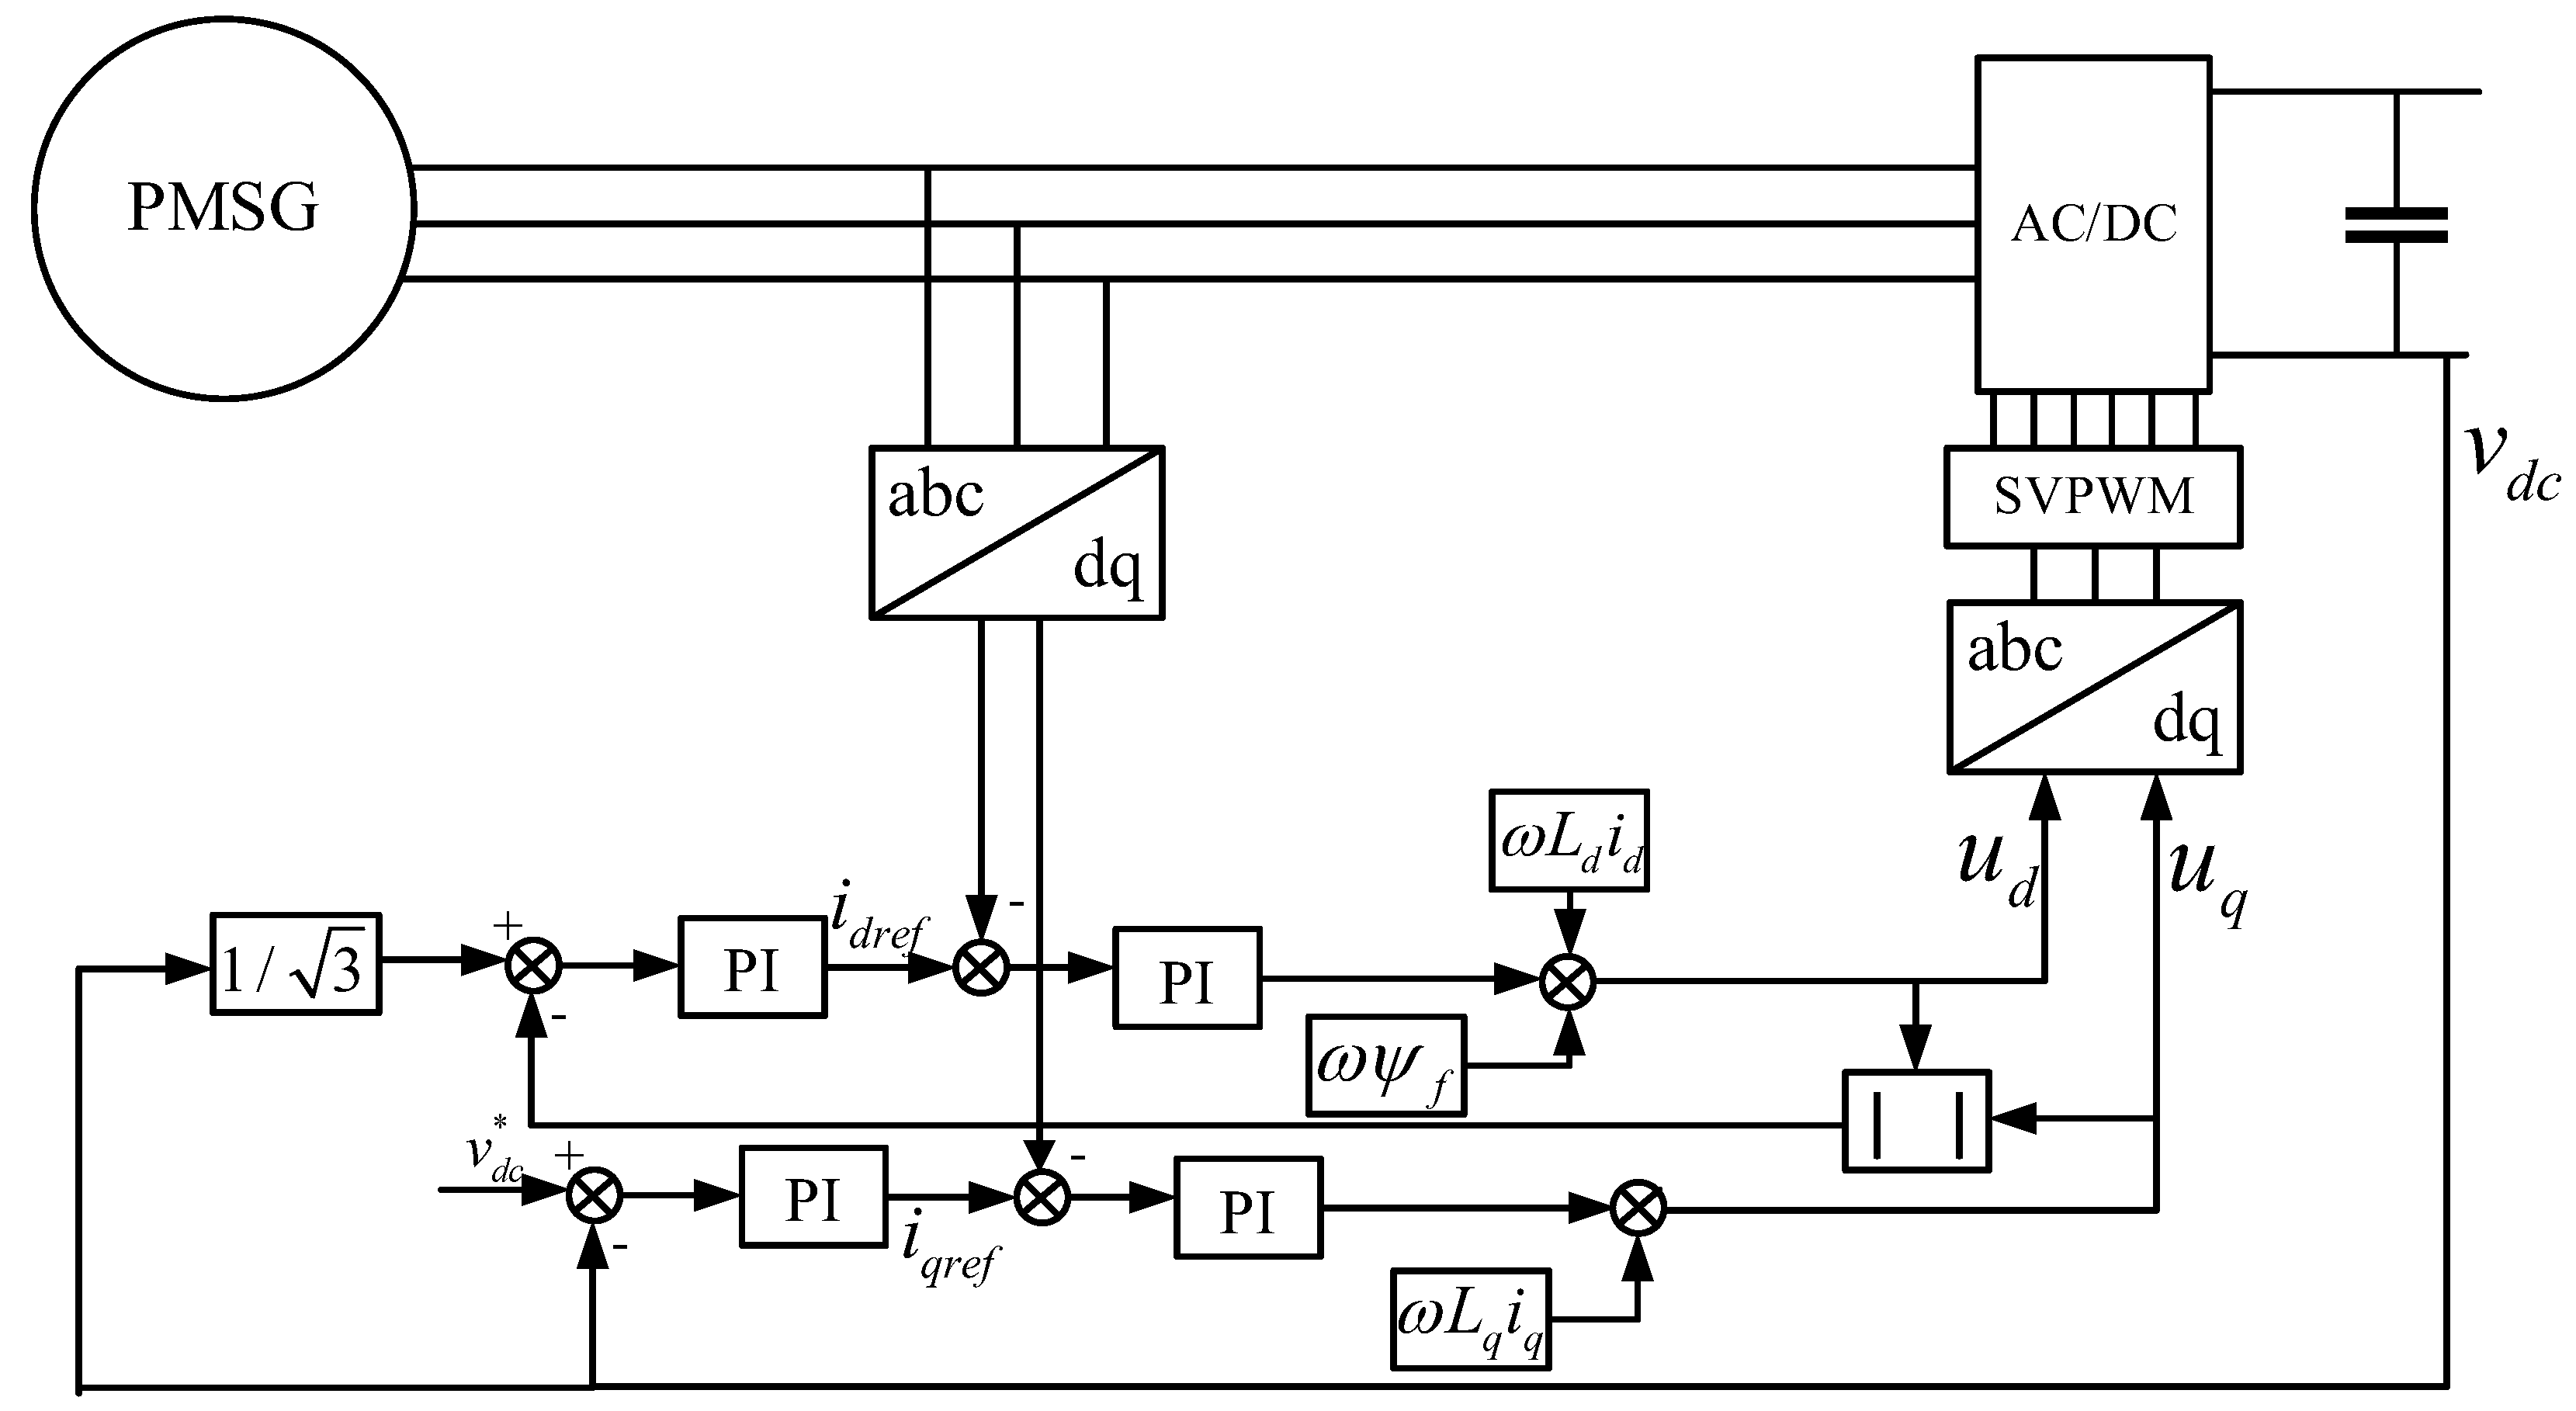
This paper develops detailed control and small-signal models for PMSGs operating in parallel across five distinct power allocation modes, offering a nuanced understanding of system behavior under various operational scenarios.
- (2)
This paper rigorously analyzes how newly introduced electrical and control parameters, such as converters’ input-output characteristics and supercapacitor PI controller settings, impact system stability after supercapacitor integration, identifying key factors influencing system resilience and stability.
- (3)
The system stability analysis results are validated by MATLAB simulations and comparative analyses, confirming the supercapacitor-introduced parameters’ impact on stability and showing how precise control parameter adjustments can enhance stability and identify critical thresholds.
The structure of this paper is organized as follows.
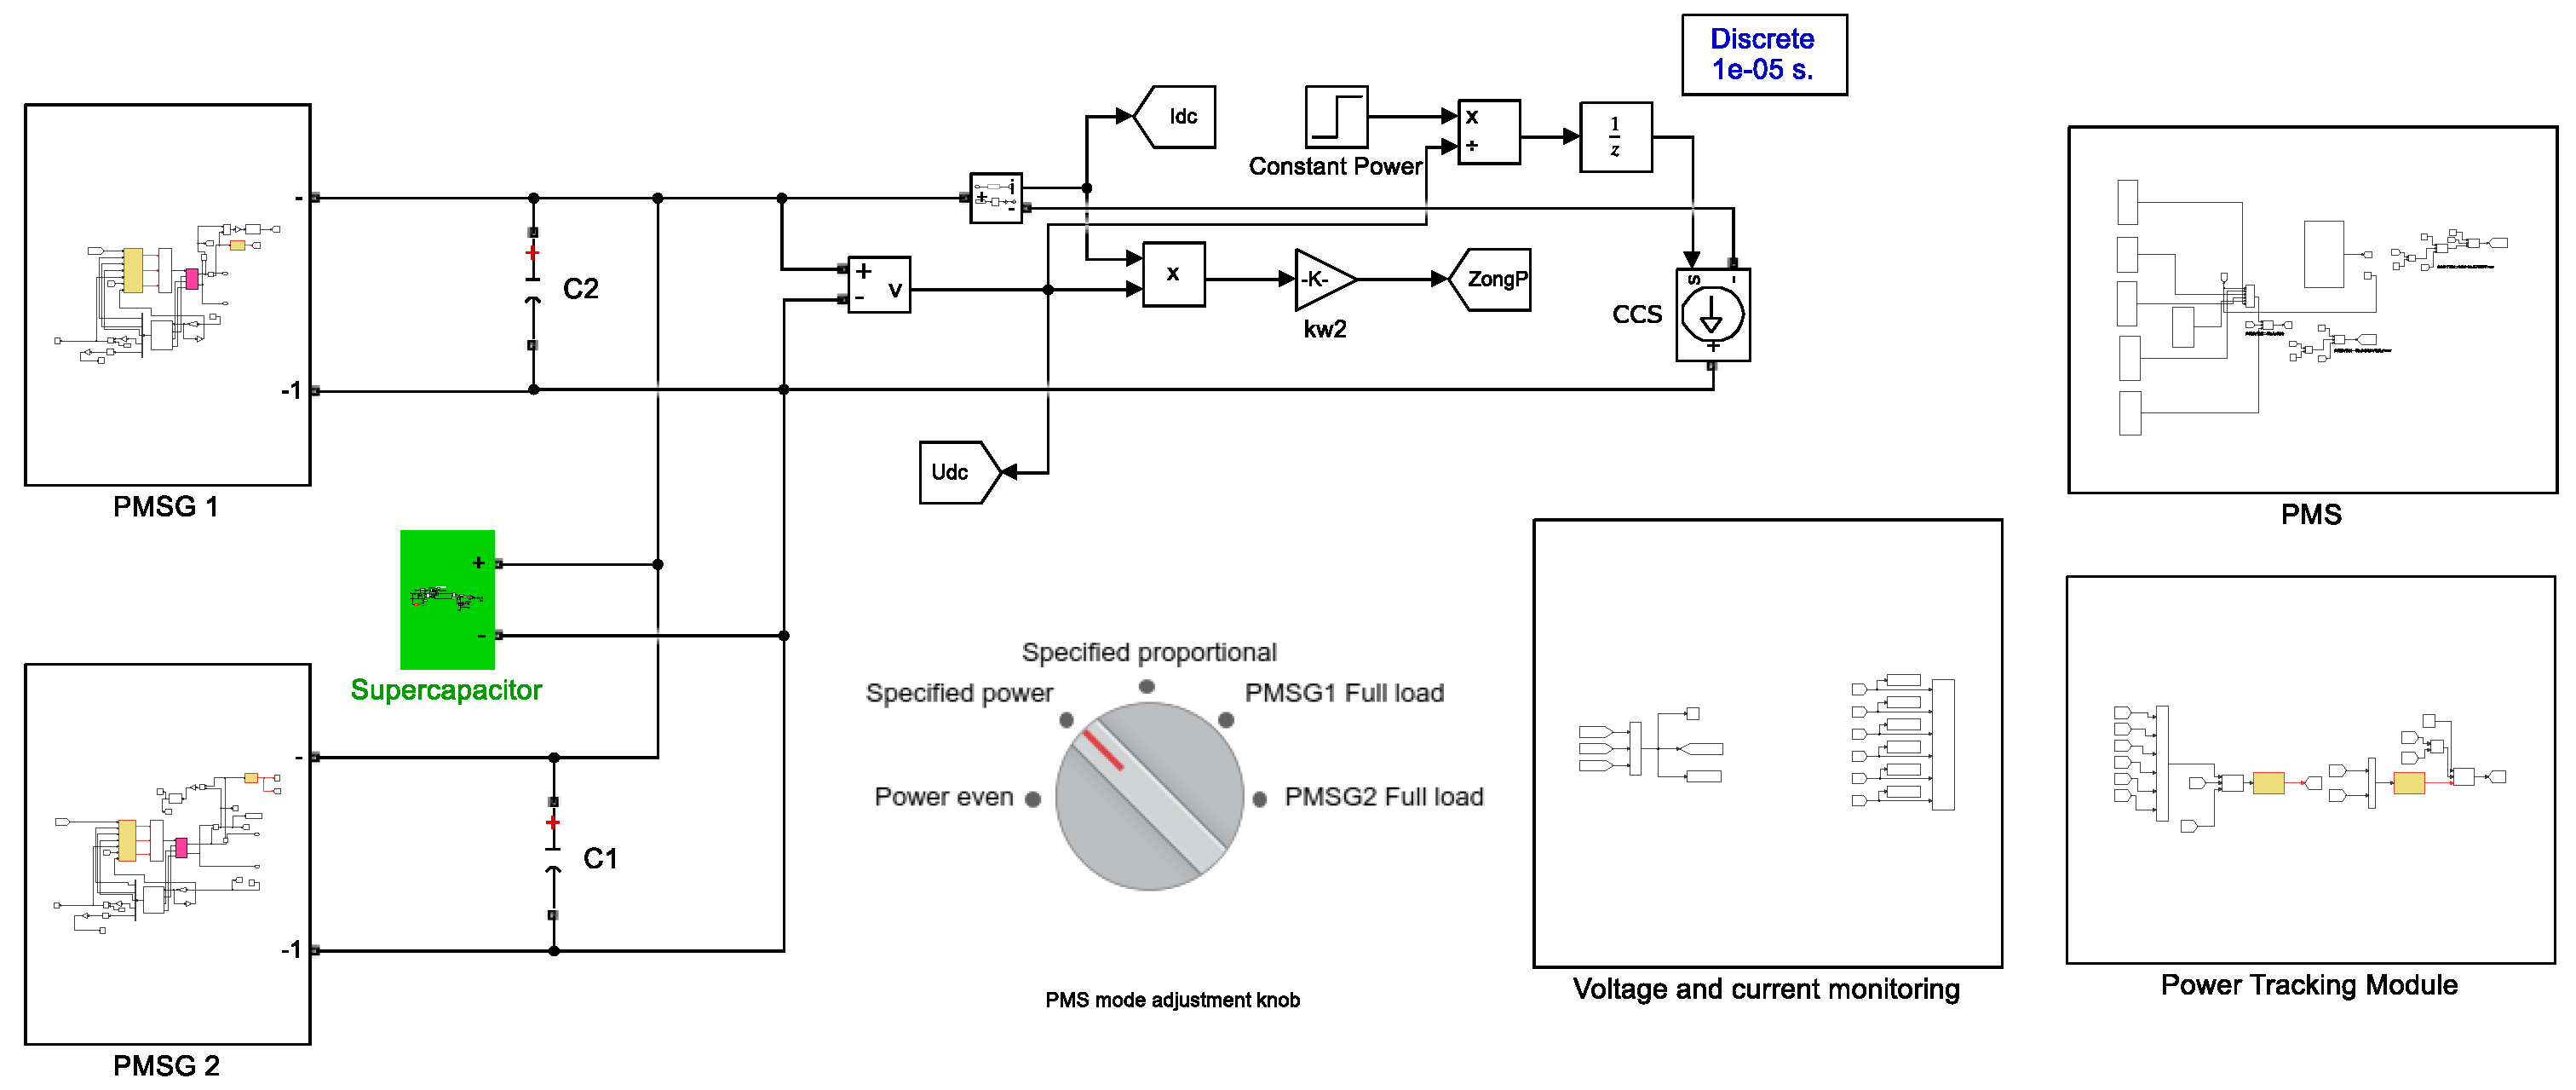
Section 2 elaborates on the topology of DC SPS and the small-signal model of the parallel operation of PMSGs, discussing five main power allocation methods.
Section 3 establishes the small-signal model for integrating SC into a DC SPS with parallel-operating PMSGs and analyzes the implications of this integration on the system’s small-signal stability.
Section 4 explores the impact of parameter variations on system stability, presenting both a simulation analysis and experimental findings.
Section 5 concludes this paper.
3. Small-Signal Stability Analysis of the DC SPS
In this section, the impact of integrating supercapacitors into DC SPS under the parallel operation of two PMSGs is investigated. All system parameters are listed in
Table 1. Through quantitative numerical simulations and qualitative analyses, the key influencing factors of system stability under different operating conditions with supercapacitor integration are analyzed.
3.1. Eigenvalue and Influence Factor Analysis
Under the scenario of the parallel operation of diesel generator sets and integration of supercapacitors into the DC distribution system with a load resistance of 0.56 Ω, five power allocation methods are employed. Stability points and Jacobian matrices are computed, and the eigenvalues of the system and the corresponding influence factors of each state variable are determined. The system’s eigenvalues are depicted in
Figure 5.
As illustrated in
Figure 5, the eigenvalue distribution clearly demonstrates that, irrespective of the power allocation method employed, all eigenvalues are positioned within the left half-plane. This placement unequivocally indicates that the system is in a stable state. Furthermore, to provide a more detailed analysis, three distinct regions have been identified within the eigenvalue distribution, as highlighted by the red boxes in the figure. These regions are categorized based on stability margins, specifically: high stability margin region, medium stability margin region, and low stability margin region. This emphasizes that while the high and medium stability margin regions, due to their considerable distance from the imaginary axis, generally do not affect the system’s stability, the low stability margin region warrants closer scrutiny.
Taking the case of generator 1 operating under specified power as an example, specific eigenvalues along with their corresponding damping ratios and oscillation frequencies are provided in
Table 2.
In
Table 2, most of the eigenvalues have an imaginary part of zero and a damping ratio of 1, indicating an overdamped state where small disturbances do not induce oscillations in the system. Among the 22 eigenvalues, 16 are negative real roots, corresponding to decaying modes.
,
, and
are negative eigenvalues corresponding to three oscillatory modes with oscillation frequencies of 234.26 Hz, 79.45 Hz, and 12.86 Hz, respectively. The damping ratio of
is not high, suggesting that insufficient damping may be provided to suppress low-frequency oscillations when the system experiences small disturbances. Conversely,
has a slightly lower oscillation frequency but a relatively higher damping ratio.
The influence factors are computed to determine the state variables associated with low-frequency oscillations, as shown in
Table 3.
Through the analysis of influence factors, the impact of system state variables on eigenvalues is discernible. Specifically, is primarily associated with , which relates to the DC/DC converter output capacitor voltage. Given its significant distance from the imaginary axis, ‘s impact on system stability is minimal. , predominantly influenced by the d-axis stator current and voltage of generator 1 and also situated far from the imaginary axis, exerts little effect on system stability. and , chiefly affected by the q-axis stator current and voltage of generator 1, are influenced by the droop control coefficient. and , related to the stator current and voltage of generator 2 and DC bus state variables, respectively, are located far from the imaginary axis and hence have a minimal influence on stability. and , associated with the q-axis stator current of both generators and DC bus state variables, are influenced by DC bus voltage and the PMSG voltage controller. and , related to the stator voltage of generator 1 and 2, respectively, are also distant from the imaginary axis. and , related to the supercapacitor output current and its current loop controller, represent a pair of dominant conjugate roots introduced by supercapacitor integration. and are associated with the supercapacitor voltage and its outer voltage controller. to and to , related to the outer voltage controllers, flux-weakening controllers, and d-axis and q-axis current control inner loops of both generator units, are influenced by PI controller parameters. However, compared to the electromagnetic transient time constants of the generators and rectifiers, their inertia time constants are considerably larger, resulting in very small variations in eigenvalues and thus a lesser impact on system stability.
From the preceding analysis, it is concluded that the integration of supercapacitors into the DC distribution system primarily affects the trajectories of five key eigenvalues: , , , , and . Notably, and are conjugate roots; serving as the dominant modes with relatively lower oscillation frequencies, they are particularly sensitive to variations in supercapacitor parameters. The specific effects of these electrical and control parameters on the stability are analyzed theoretically under different conditions.
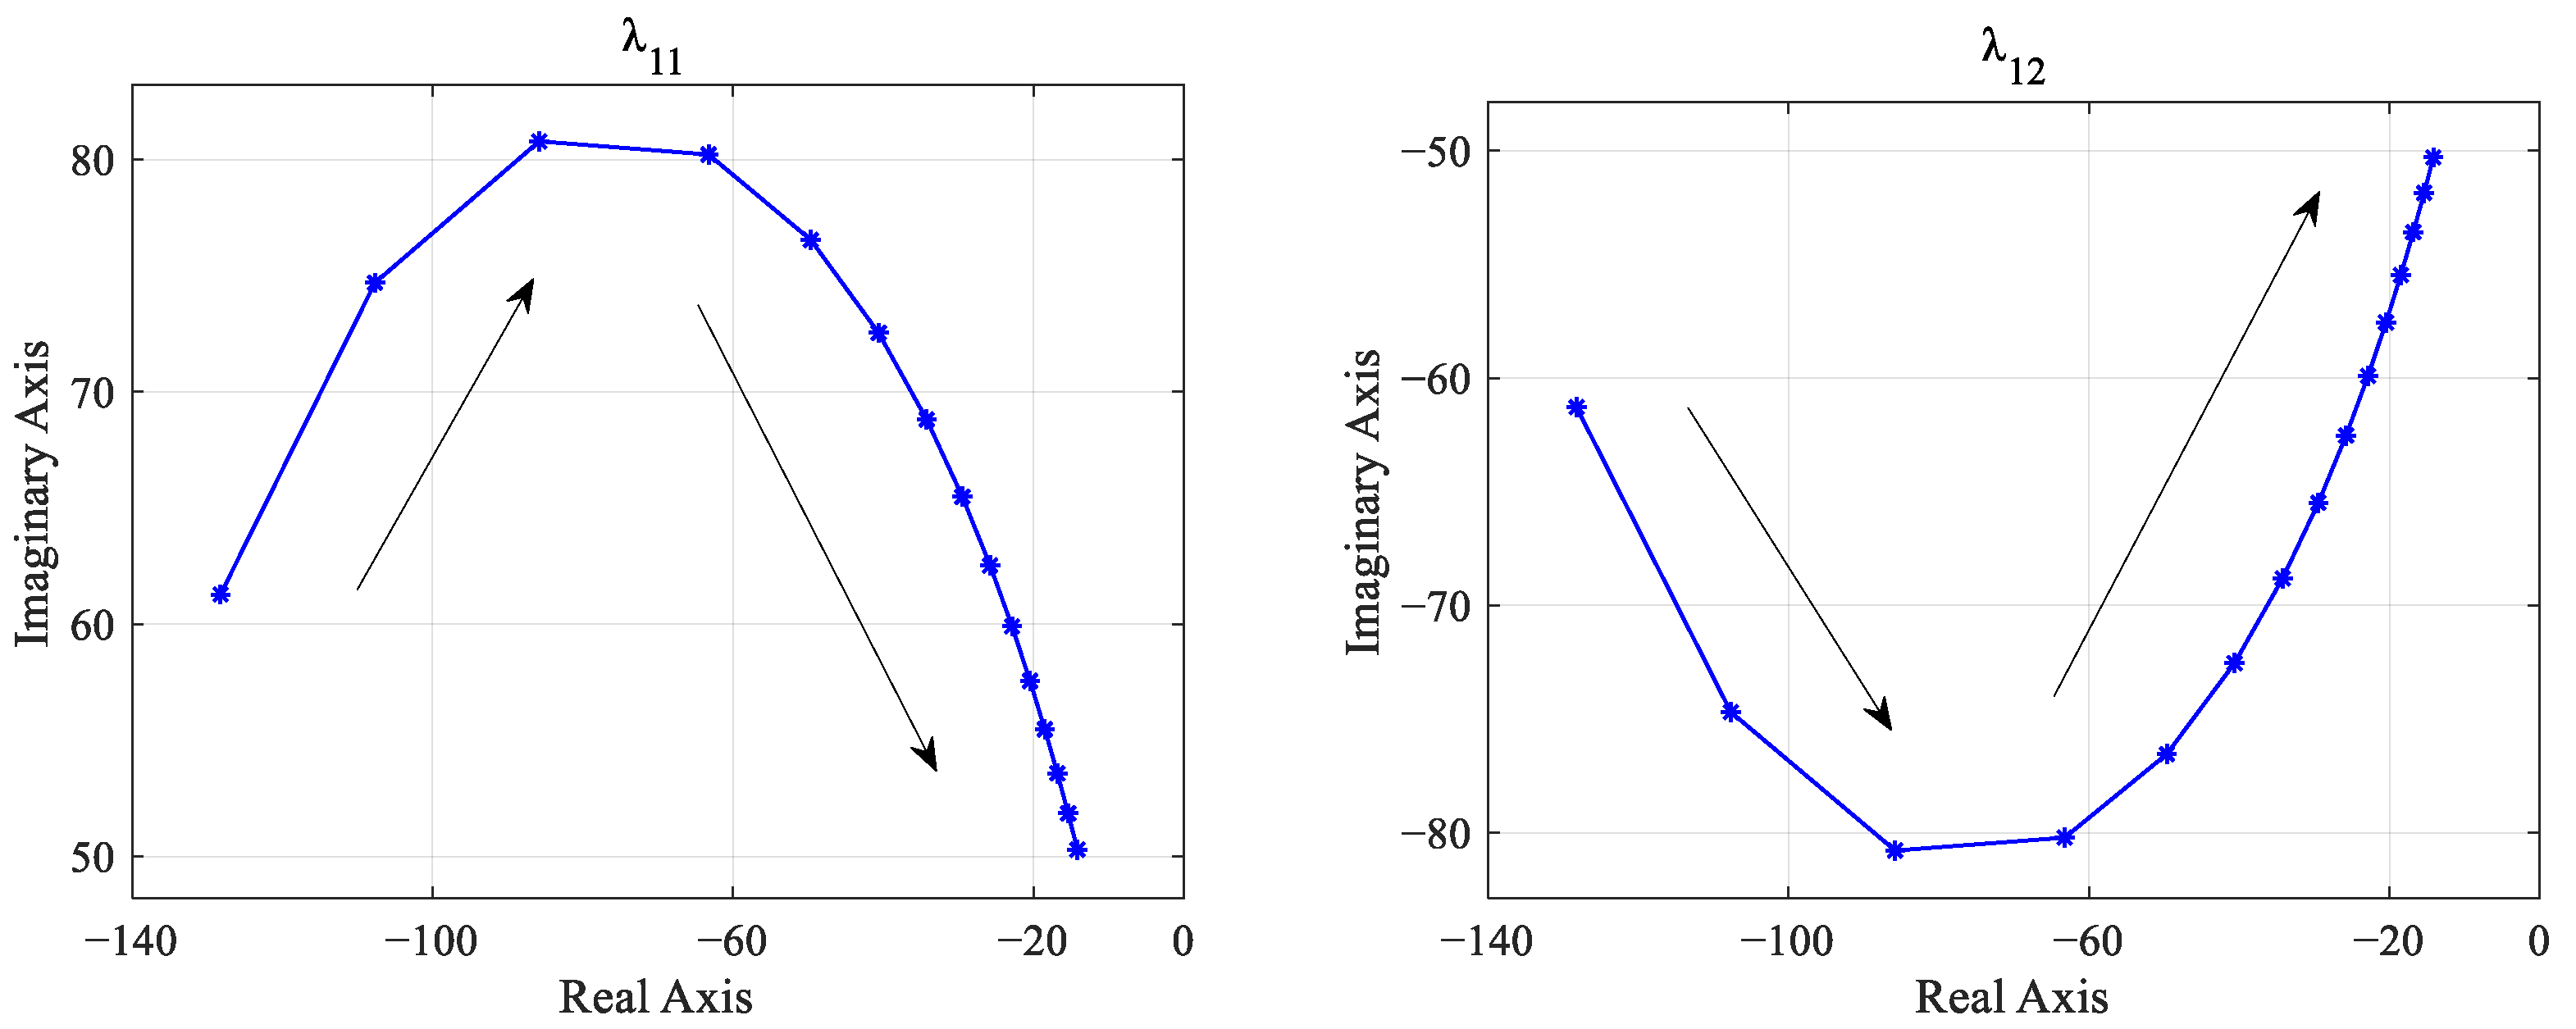
3.2. Impact of Capacitance and Resistance Parameter Variations on Converter Output
At the interface between the DC/DC converter and the DC bus, a pair of series-connected capacitor
and resistor
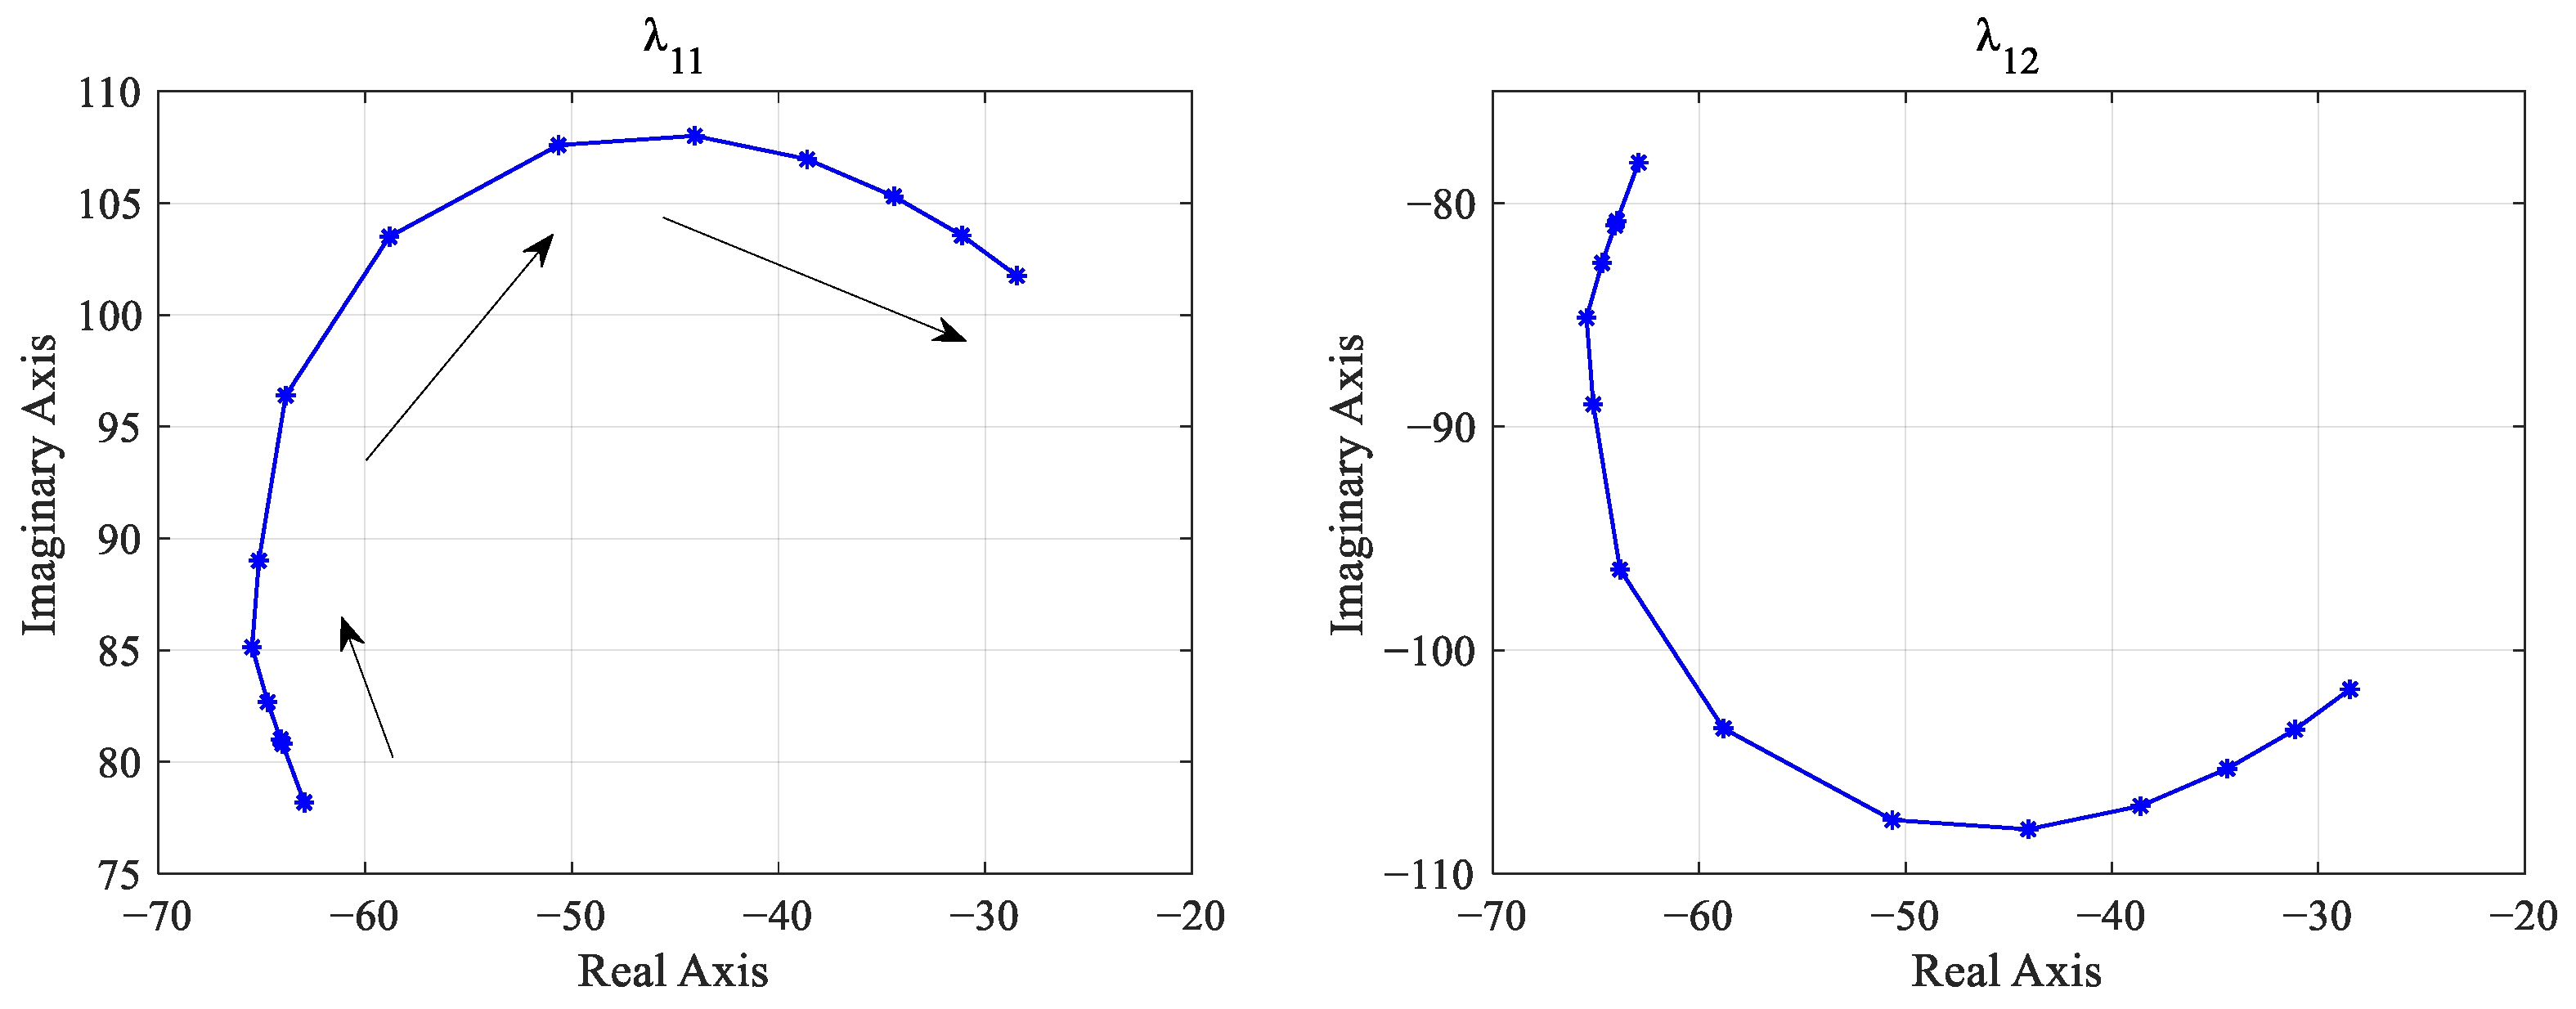
are paralleled. Here, the influence of parameter variations on the system stability is analyzed. Employing the same power allocation method for generator 1 operating at specified power, trajectories of
and
are calculated as
gradually increases from 0.1 mF to 100 mF, as depicted in
Figure 6.
In
Figure 6, the blue asterisk represents the location of eigenvalues in the s-plane. The arrows, on the other hand, indicate the direction of movement for these eigenvalues as the
increase. It can be observed that as the output capacitance of the converter increases, the eigenvalues gradually approach the imaginary axis in an arc shape, but always remain on the left-hand side of the imaginary axis, indicating stability within this range.
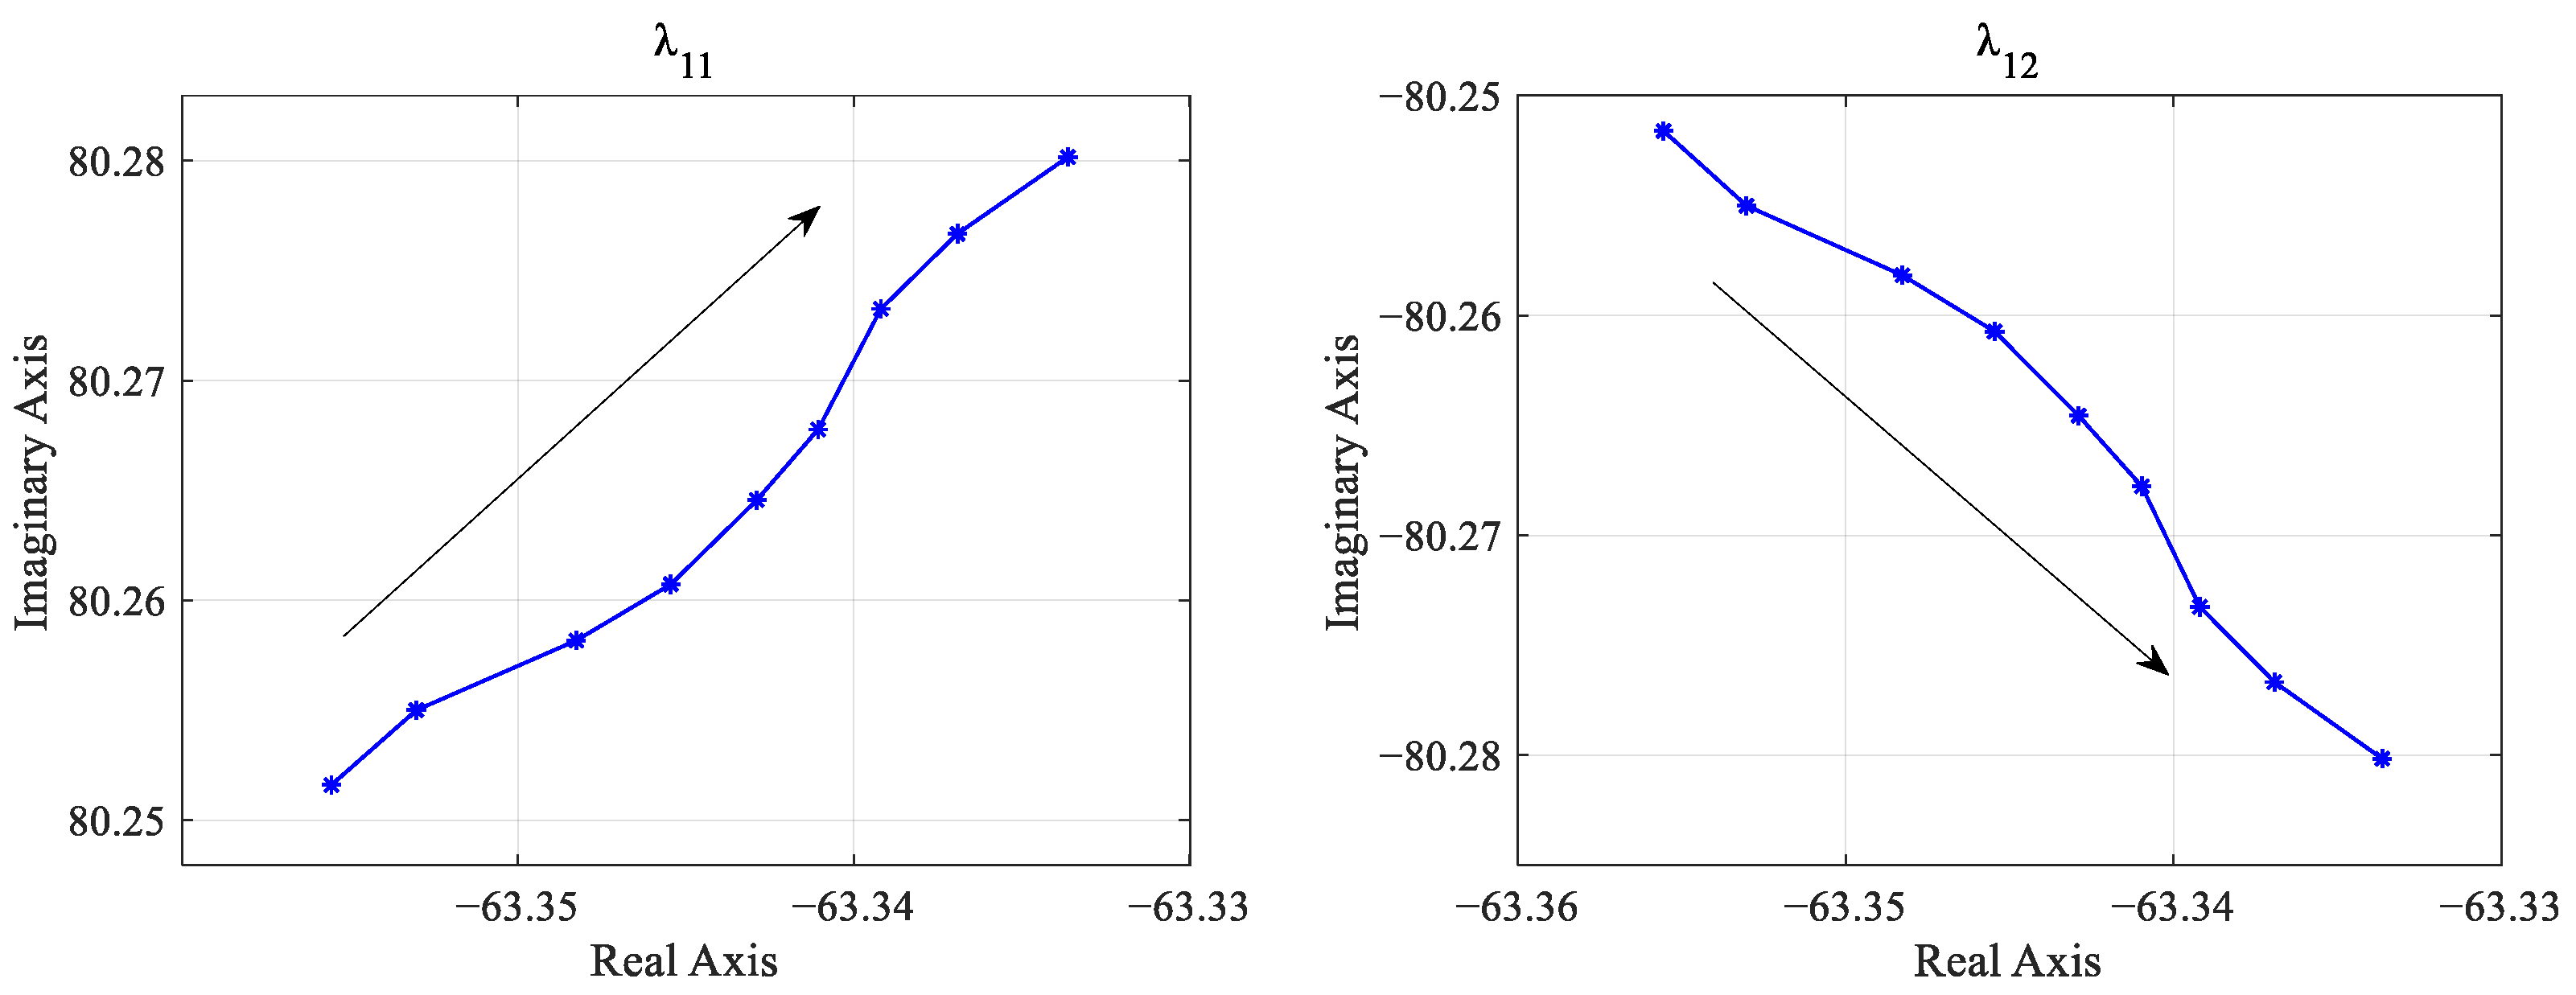
Similarly, with
gradually increasing from 1 mΩ to 1 Ω, the trajectories of
and
with
are calculated, as shown in
Figure 7.
From
Figure 7, it can be observed that as the output resistance of the converter increases, the eigenvalues move very slowly towards the imaginary axis, indicating that the variation of
has minimal impact on the eigenvalues and virtually no effect on the stability of the system.
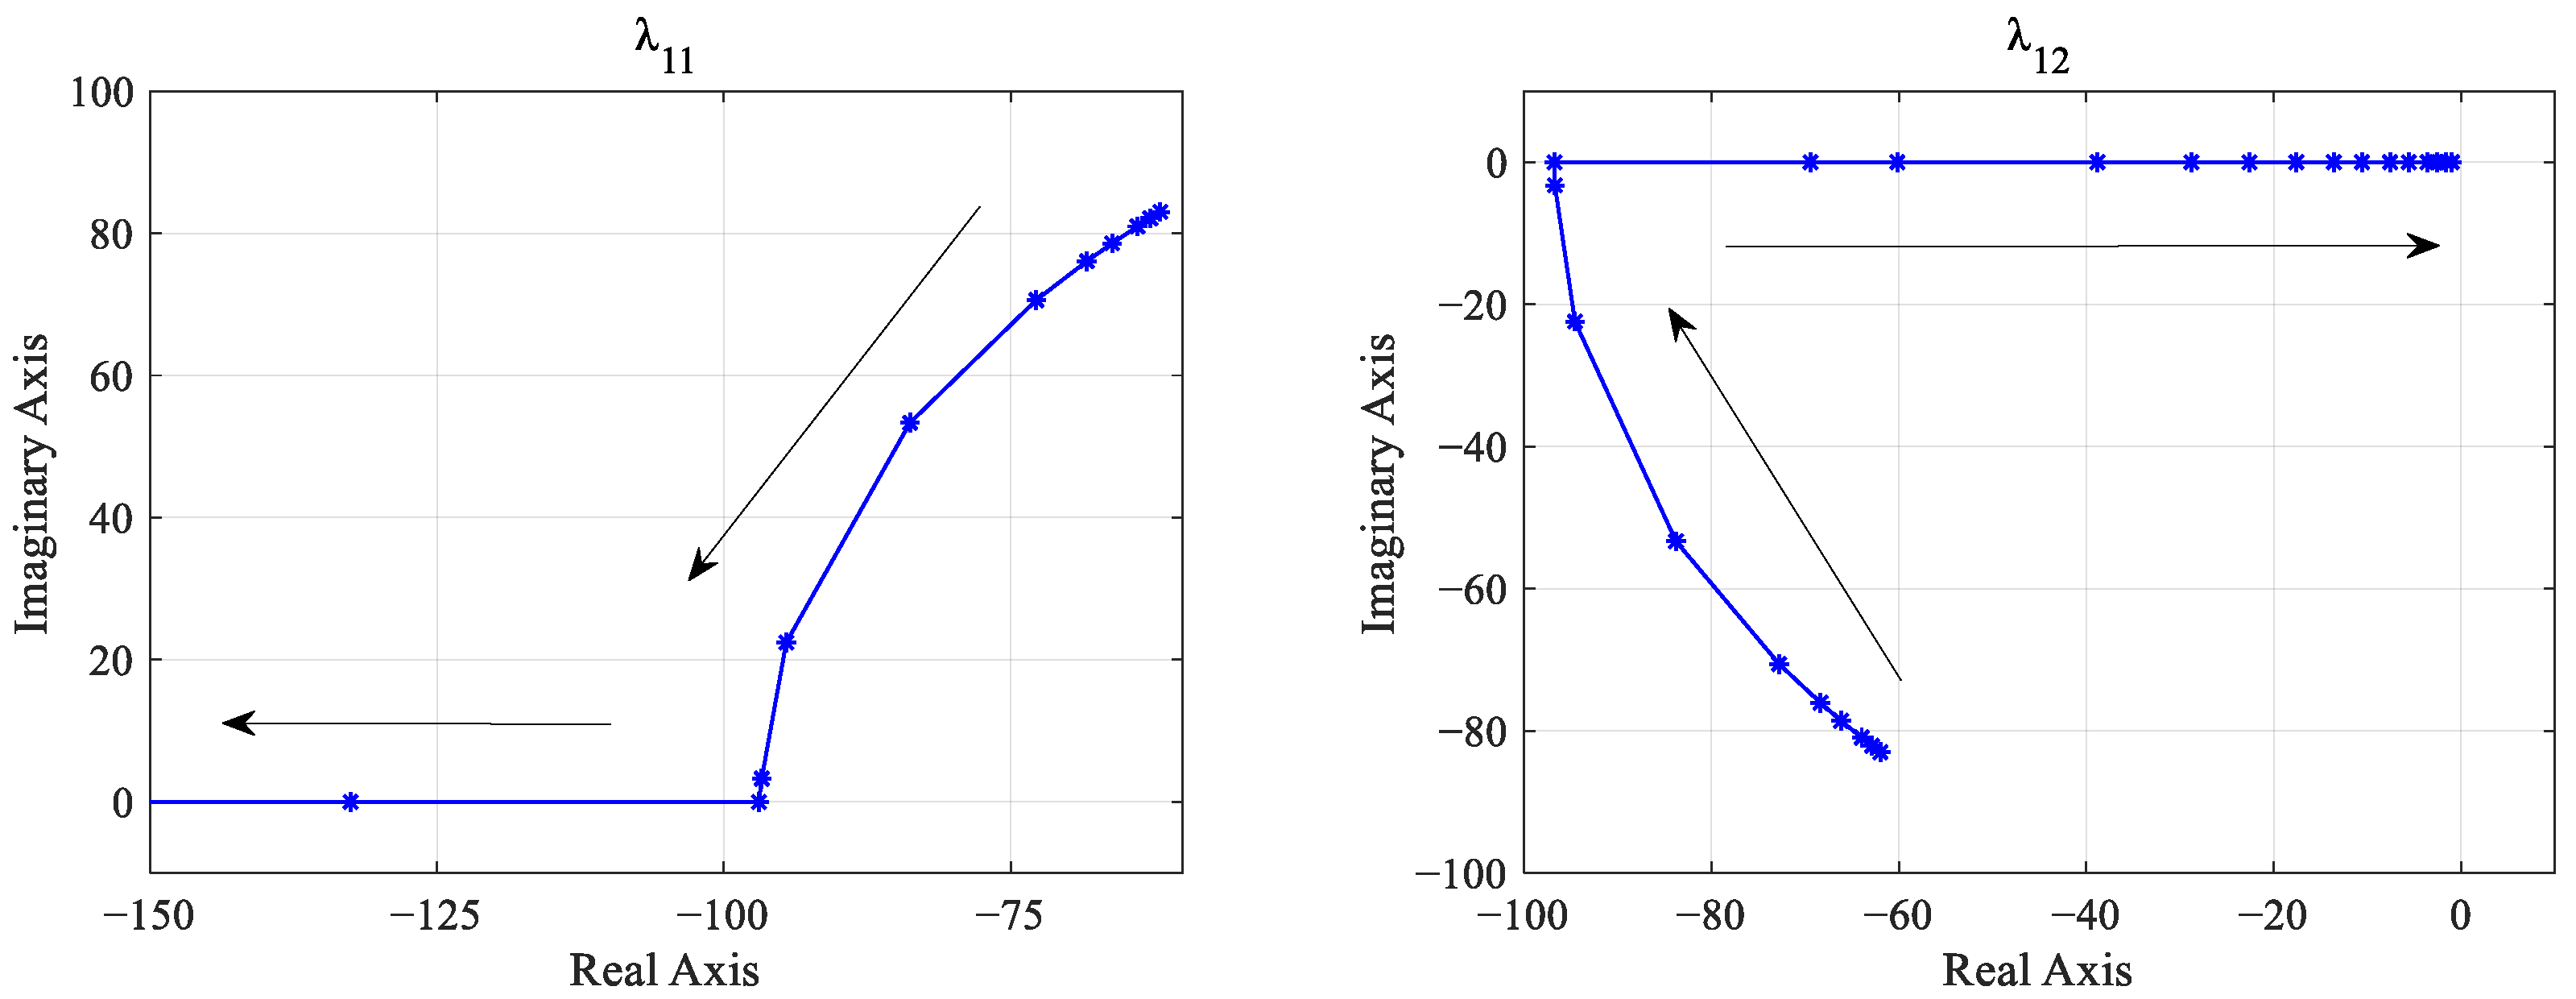
3.3. Impact of Inductance and Resistance Parameter Variations on Converter Input
The input stage of the supercapacitor and DC/DC converter is connected in a series with a pair of inductors
and resistors
. Here, the influence of parameter variations on the system stability is analyzed. When
gradually increases from 0.1 mH to 10 mH, the trajectories of
and
are computed with respect to the variation, as shown in
Figure 8.
As shown in
Figure 8, as
gradually increases, the dominant low-frequency eigenvalues approach the imaginary axis but do not cross it. This indicates that the variation in the input inductance of the converter has a minor impact on the system stability. However, it is worth noting that when the value of
becomes excessively large, the dominant low-frequency eigenvalues may shift to the right half-plane, causing the system to lose stability.
When
increases gradually from 1 mΩ to 50 Ω, the trajectories of
and
with respect to the variation are computed, as shown in
Figure 9.
As shown in
Figure 9, when
exceeds 5 mΩ, two eigenvalues converge on the real axis and move in opposite directions along the real axis. With the increase in the input resistance of the converter, the rate at which
approaches the imaginary axis slows down, while the speed at which
moves away from the imaginary axis increases. Even when
reaches 50,
continues its gradual approach towards the imaginary axis without crossing into the right half-plane, thus maintaining stability. Therefore, the system remains stable within the range where
is less than 50 Ω.
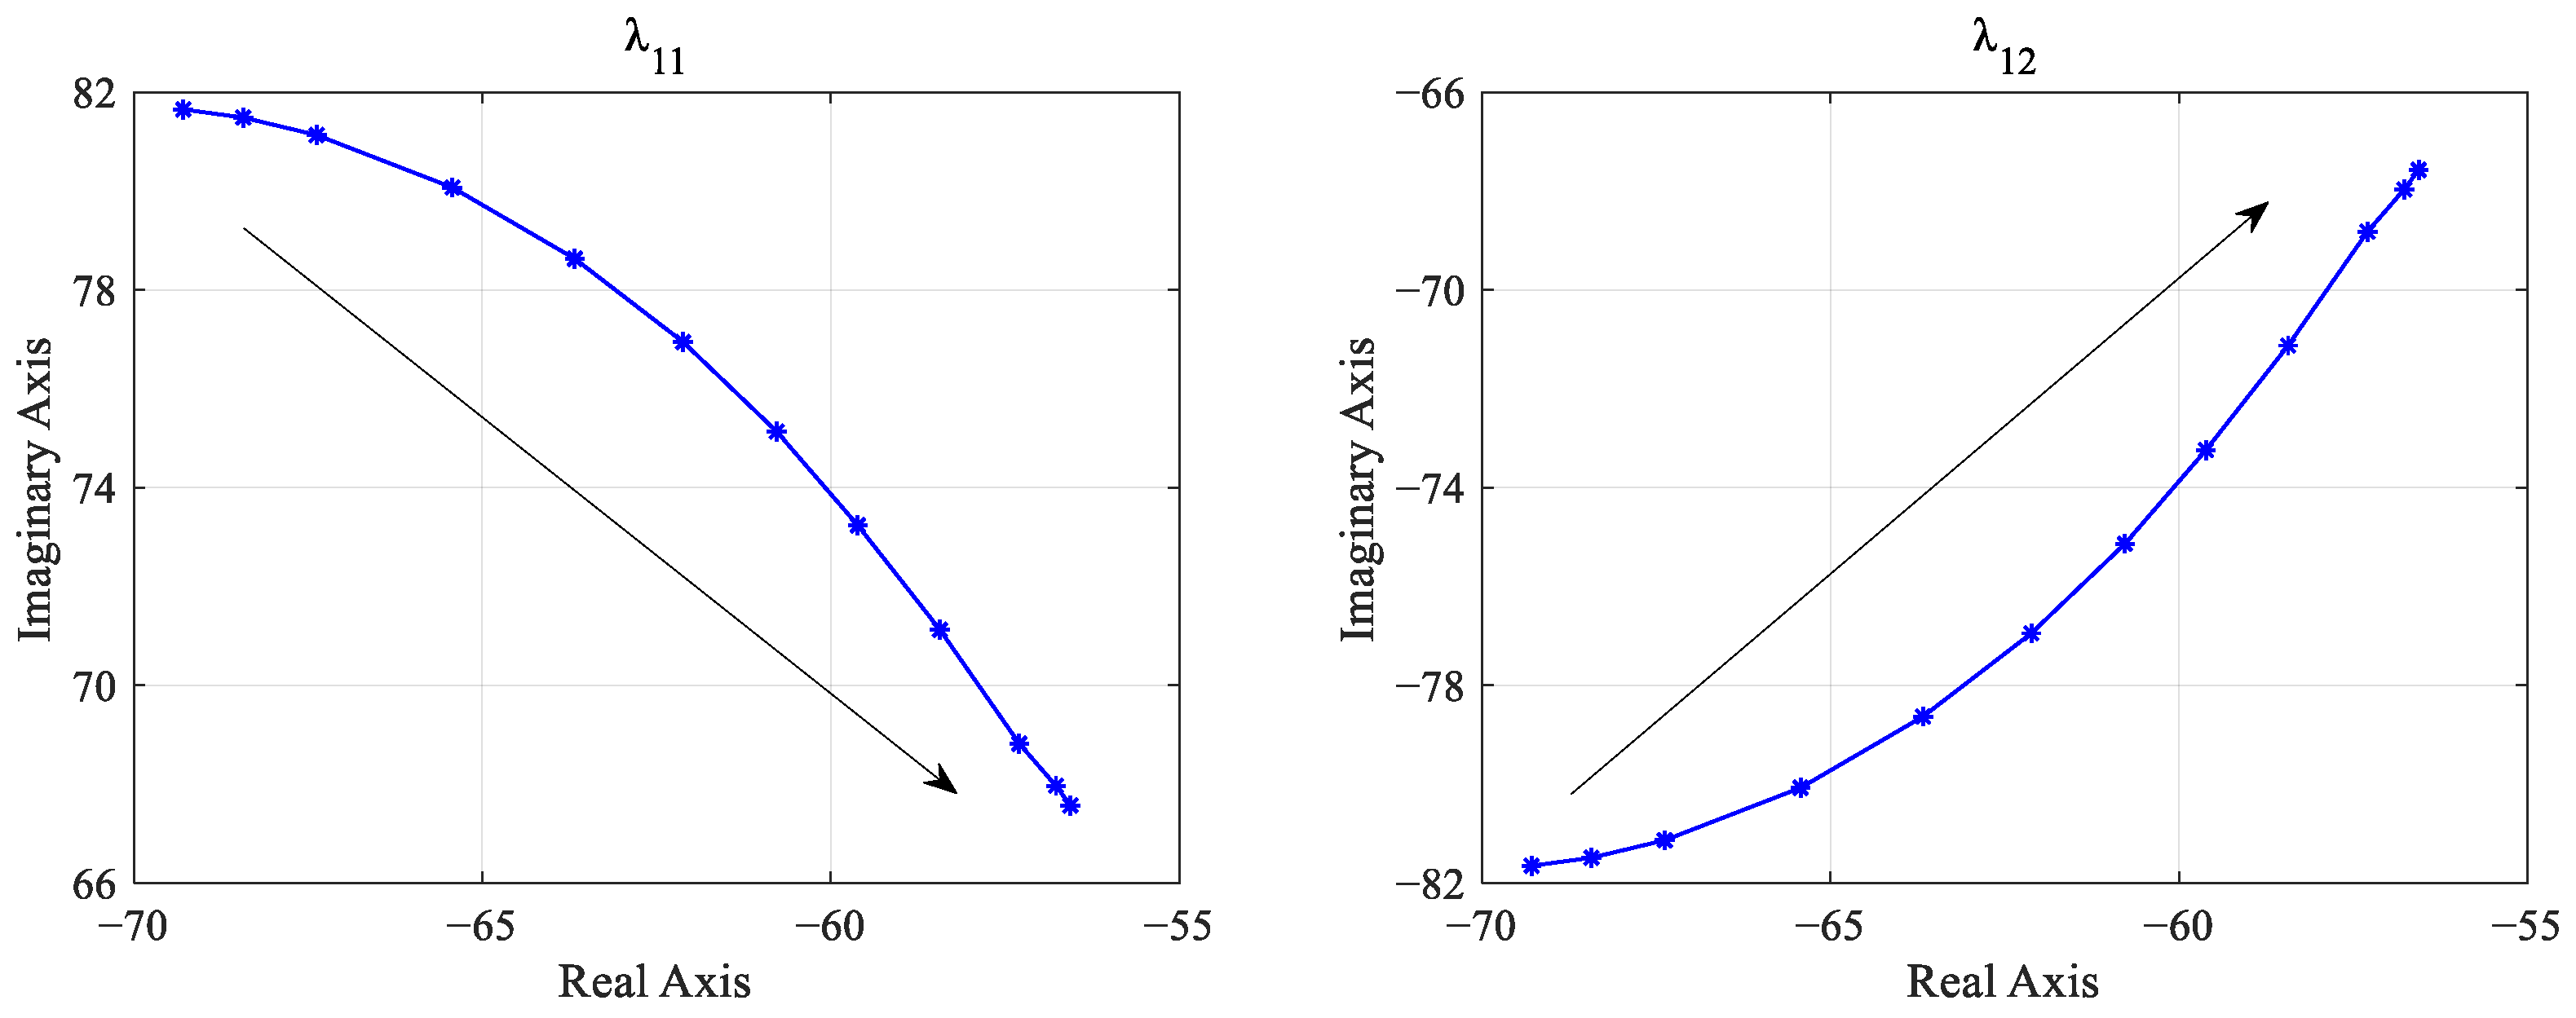
3.4. Impact of Supercapacitor Voltage Controller PI Parameter Variation
The voltage controller input is composed of the voltage difference multiplied by the output power control coefficient, and the output of the PI controller regulates the reference value of the super capacitor output current. To analyze the impact of the voltage control loop on the system stability, increasing
and
separately, the root locus of the characteristic values
and
with
variation is obtained, as shown in
Figure 10.
From
Figure 10, it can be observed that as
increases gradually from 1 to 100, the real parts of the dominant characteristic roots affecting system stability will also gradually shift leftwards towards the real axis, indicating an improvement in system stability.
The root locus of the characteristic roots for the voltage outer loop, as shown in
Figure 11, indicates that as
increases from 0.1 to 10, the roots
and
gradually approach the imaginary axis, but they never cross it, indicating system stability within this range.
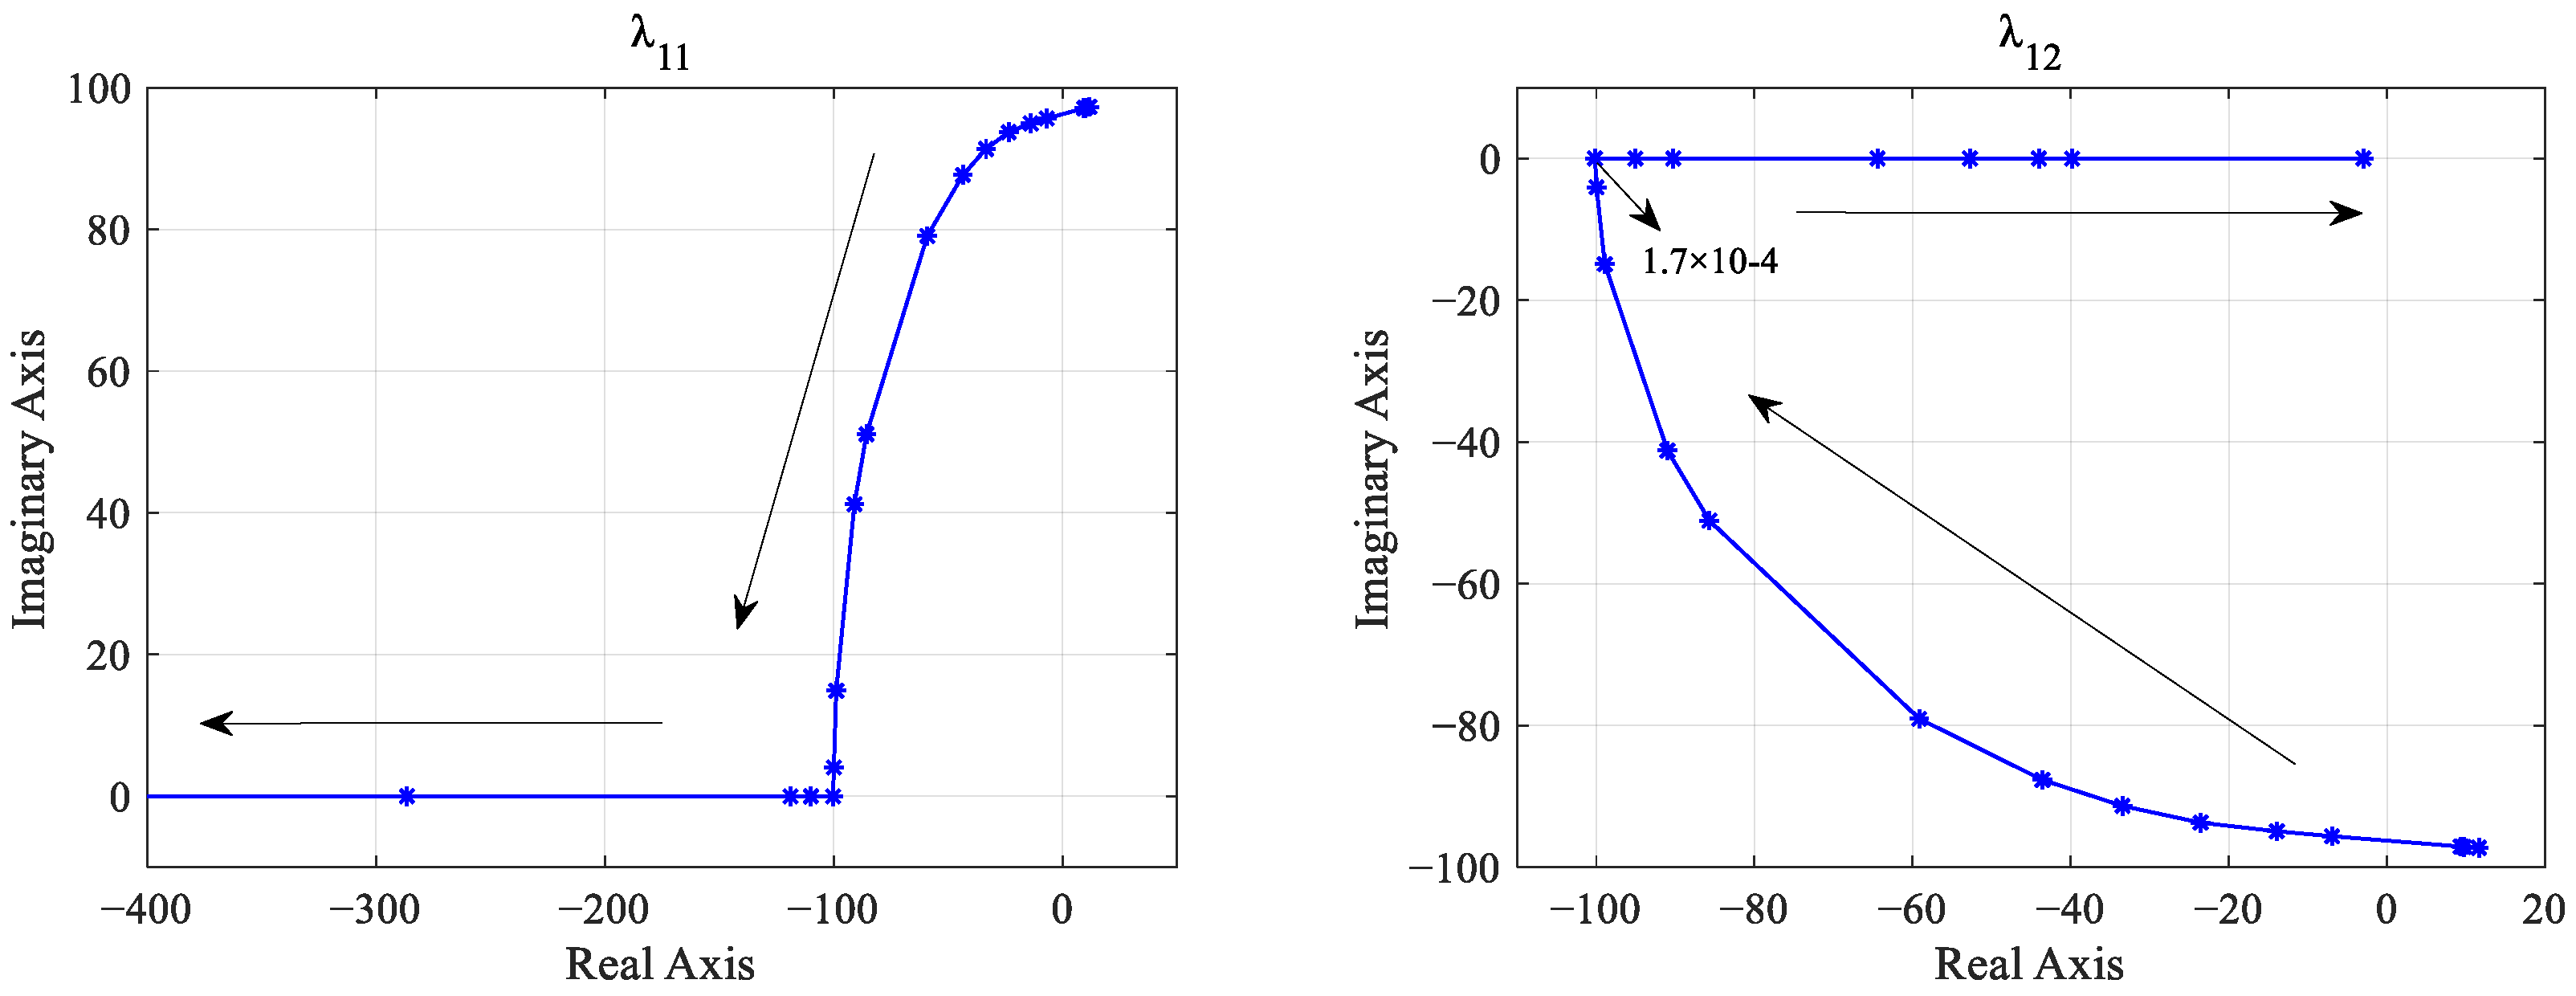
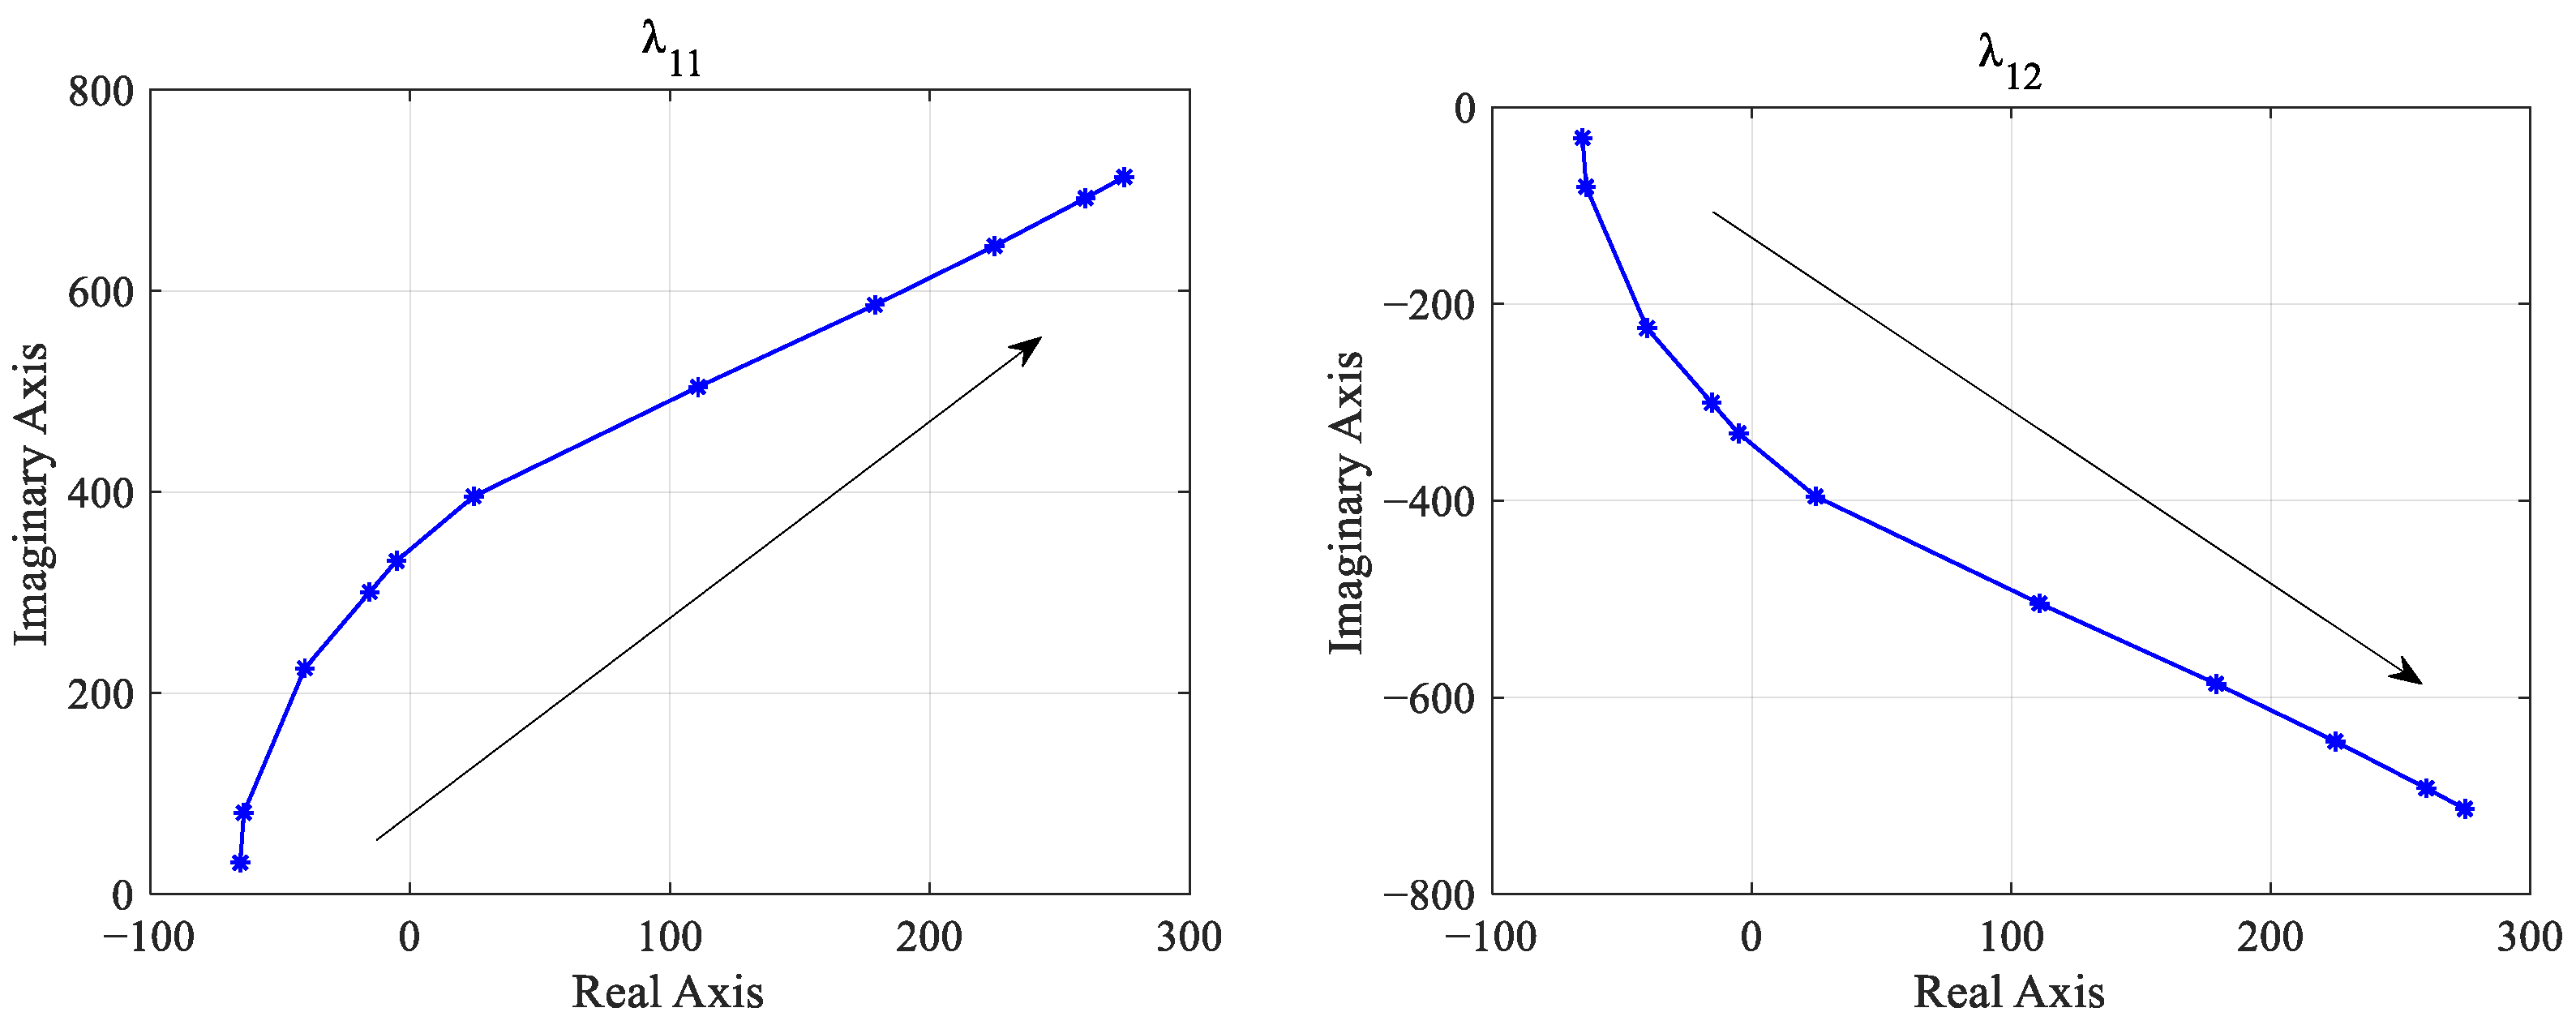
3.5. Impact of Supercapacitor Current Controller PI Parameter Variation
The current controller is responsible for generating the modulation signal for the DC/DC converter. It calculates the difference between the reference current value for the supercapacitor output and the actual current value to obtain the current error. Subsequently, the PI controller adjusts this error to generate the modulation signal. This modulation signal, after PWM modulation, eventually controls the switching devices by controlling on and off states. To analyze the effect of the voltage control loop on system stability, the PI parameters of the current inner loop, namely
and
, are individually increased. The resulting characteristic roots and their trajectories with parameter variations are depicted in
Figure 12.
As depicted in
Figure 12, when
increases from 1 × 10
−6 to 1,
and
move from the right half-plane to the left half-plane of the s-domain with the increase in
, crossing the imaginary axis into the left half-plane when
exceeds 9 × 10
−6, indicating the system’s transition to stability. At
= 1.7 × 10
−4, the two eigenvalues intersect with the real axis and then move in opposite directions along it. As
continues to increase,
approaches the imaginary axis very slowly and does not cross it even at
= 1. Due to the inherent upper and lower limits of the PI controller, further increases in
are inconsequential. Hence, the system remains stable within the range where
is greater than 9 × 10
−6.
Figure 13 depicts the root locus of the characteristic roots as
increases from 0.001 to 1. It can be observed that
and
gradually approach the imaginary axis with increasing
. When
reaches 0.15, the characteristic values cross the imaginary axis into the right half-plane of the
s domain, causing system instability. This indicates that under the specified operating conditions, the system remains stable when
is less than 0.15; however, when
exceeds 0.15, the system enters the right side of the imaginary axis, becoming unstable.
4. Simulation Verification
In this section, the small-signal stability of SPS integrated with a supercapacitor is examined through case studies. The impact of newly introduced electrical and control parameters on system stability after the integration of a supercapacitor are explored through simulation experiments, as illustrated in
Figure 14. The selection and adjustment of PI parameters for controlling the charging and discharging of the supercapacitor not only affect the performance of the supercapacitor but also directly influence the overall system stability.
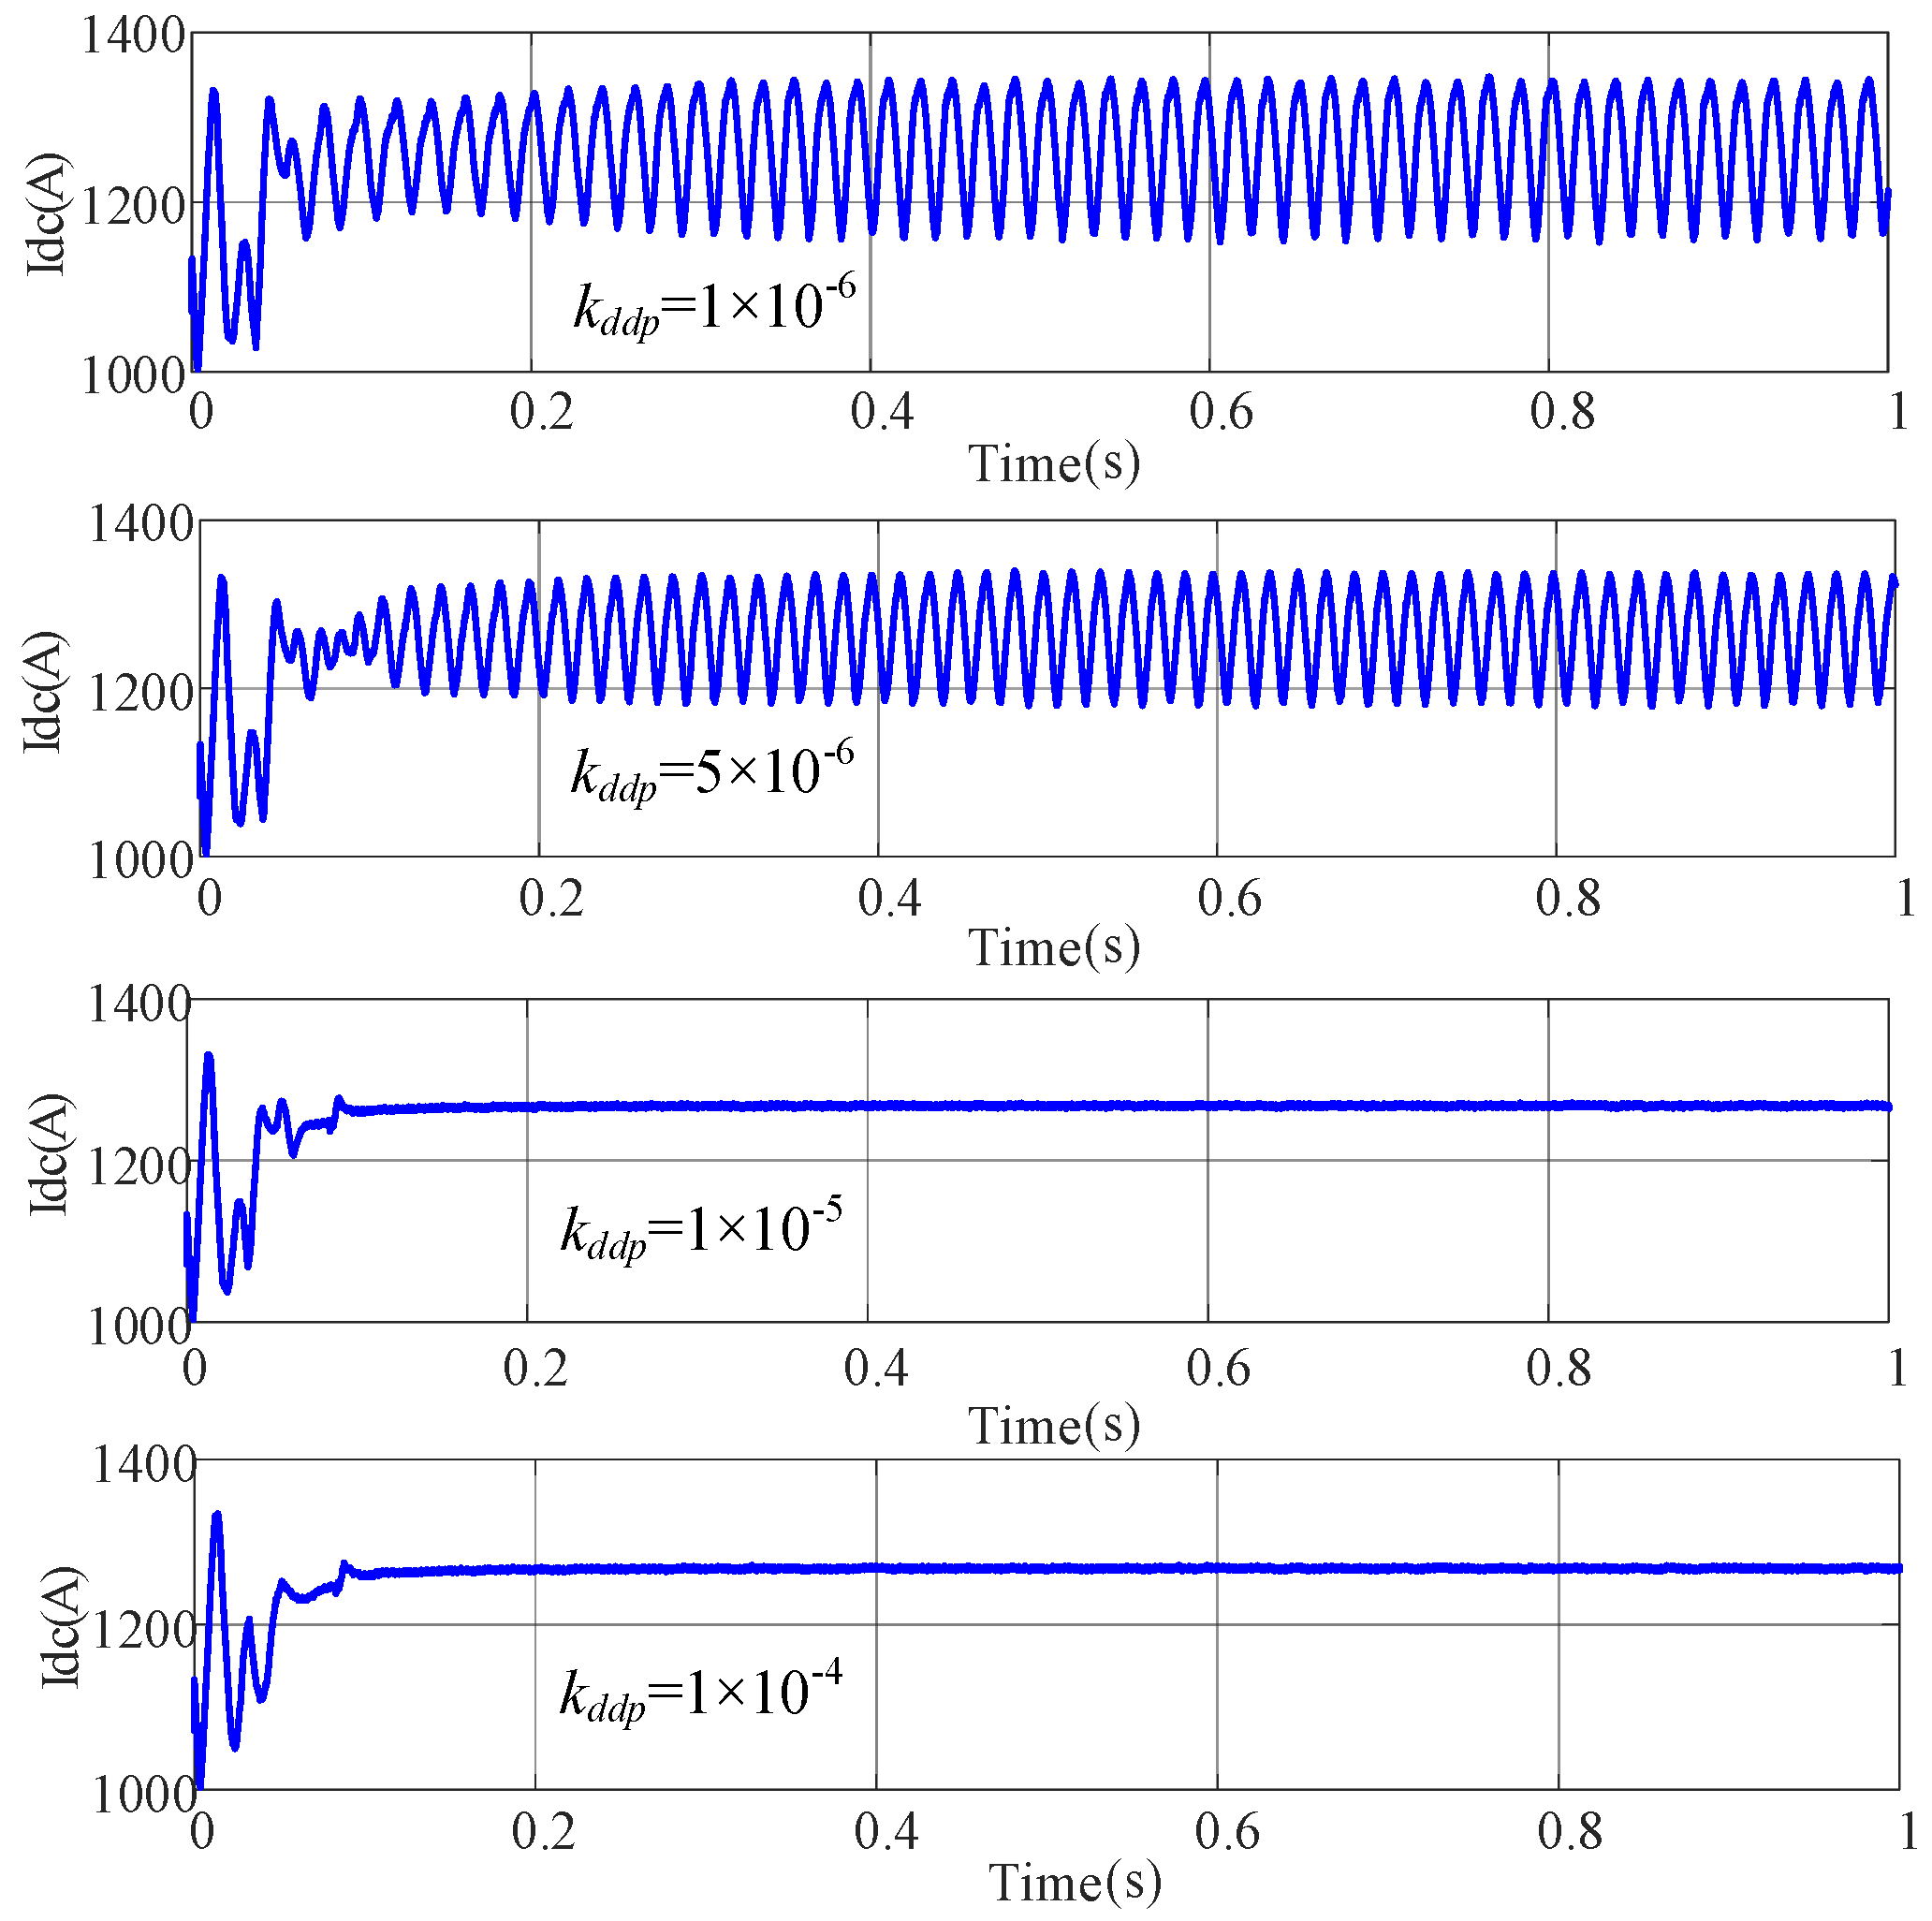
4.1. Case 1
In this case, a comprehensive simulation analysis was conducted to investigate the impact of varying proportional gain
of the current controller on system stability. Specifically,
was set at values of 1 × 10
−6, 5 × 10
−6, 1 × 10
−5, and 1 × 10
−4, aiming to explore how changes in this parameter affect the dynamic behavior and stability of the system. Simulation curves are shown in
Figure 15 and
Figure 16.
The simulation results revealed several key observations. At lower values of 1 × 10⁻⁶, significant oscillations in the DC bus voltage and current were observed, indicating system instability. As was increased to 5 × 10⁻⁶, although oscillations persisted in the voltage curve, the amplitude of these oscillations decreased, suggesting an improvement in system stability, albeit not yet reaching an ideal state of stability. These oscillations not only signify an unstable system state but also suggest that the lower values do not provide sufficient control strength to counteract disturbances. The presence of these oscillations directly impacts system reliability and performance, exposing the system’s vulnerability under these parameter settings.
With an increase in to 1 × 10⁻⁵ and 1 × 10⁻⁴, a marked improvement in system performance was noted. Particularly, when reached 1 × 10⁻⁵, the amplitude of oscillations in the DC bus voltage and current significantly reduced, indicating the onset of system stability. At =1 × 10⁻⁴, the system exhibited stable responses in both DC bus voltage and current without noticeable oscillations, demonstrating that higher values effectively enhance the system’s ability to resist disturbances and bolster stability.
These simulation outcomes unequivocally demonstrate the decisive role of the current controller’s proportional gain in the stability of DC SPS. Lower values lead to diminished system stability, whereas an increase in significantly enhances stability.
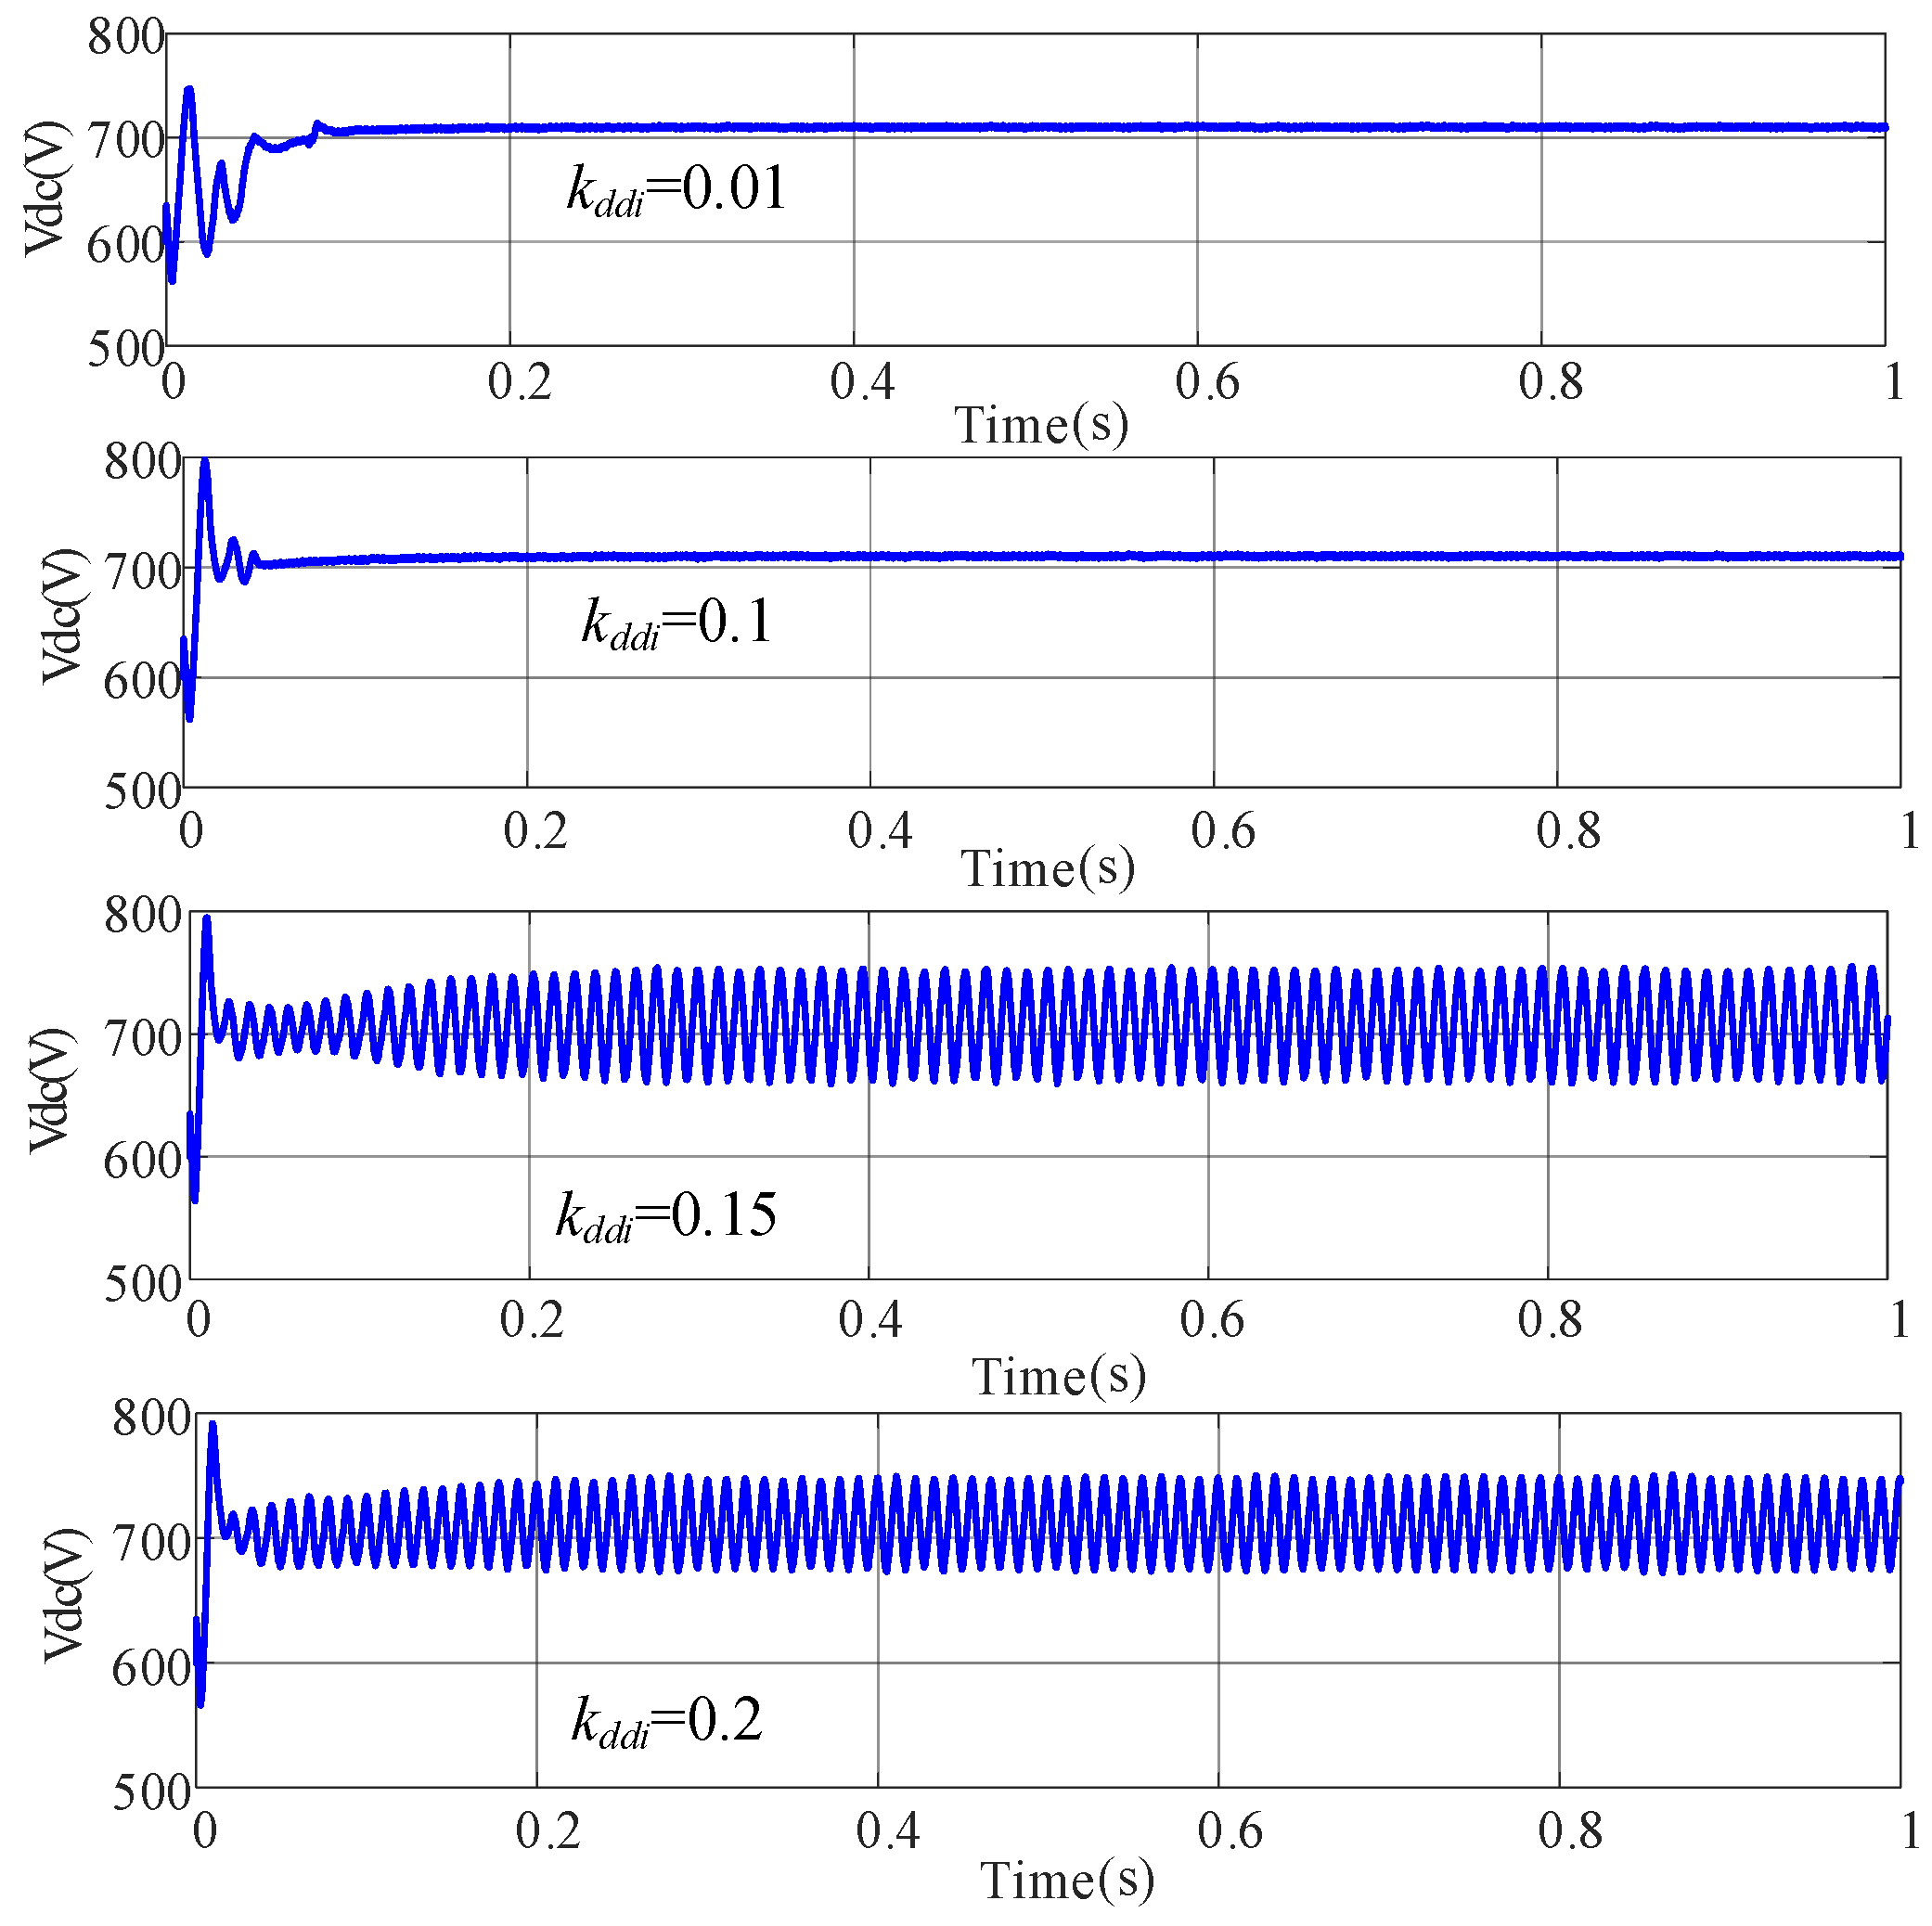
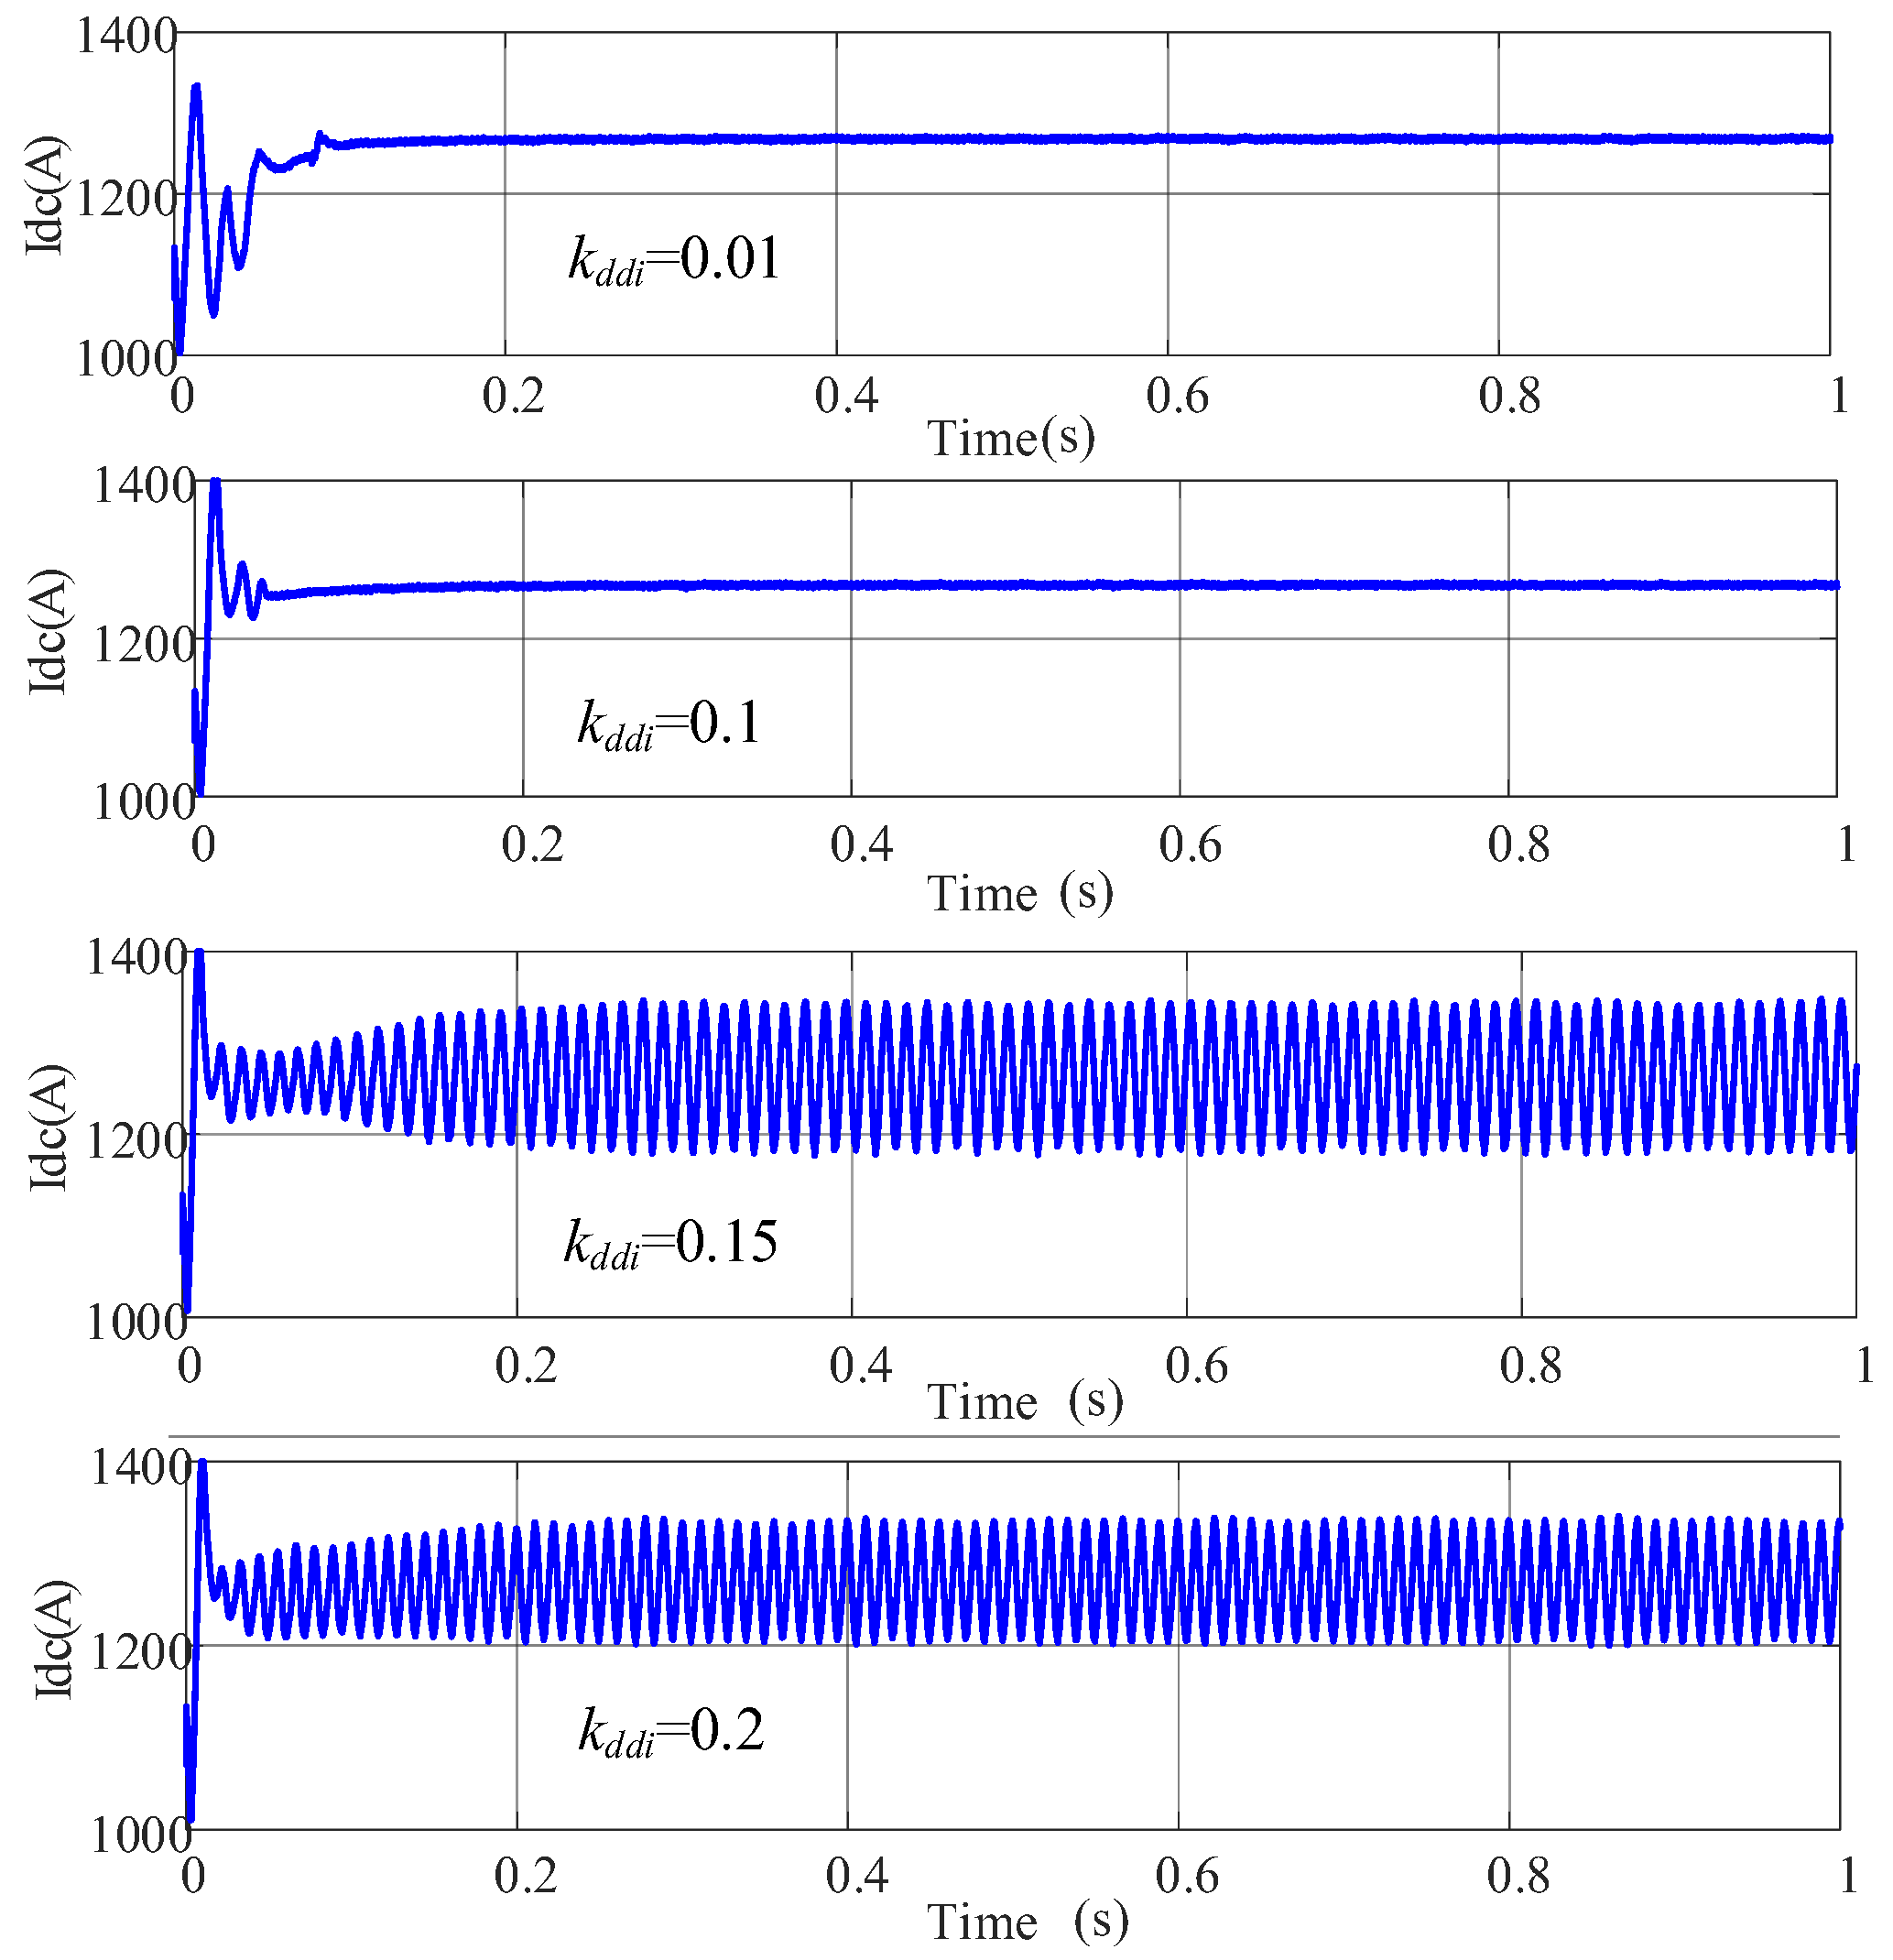
4.2. Case 2
In case 2, the integral gain
was methodically adjusted to values of 0.01, 0.1, 0.15, and 0.2 in distinct simulation experiments. This setup aimed to scrutinize the influence of
adjustments on the system’s dynamic stability and operational behavior. The simulation curves are illustrated in
Figure 17 and
Figure 18.
The simulation findings presented a detailed narrative of how influences system stability. For values set at 0.01 and 0.1, the system exhibited stable responses with the DC bus voltage and current maintaining equilibrium without significant fluctuations. This stability indicates that at these levels, provides adequate damping to system perturbations, ensuring robust system performance under varying operational conditions.
However, as increased to 0.15 and further to 0.2, the stability of the system was compromised. Specifically, simulations at these higher settings revealed pronounced oscillations in both the DC bus voltage and current, signifying a transition to an unstable system state. The emergence of these oscillations at higher values indicates an overcompensation in the system’s response to disturbances, leading to instability. The oscillation amplitude approached nearly ±10%, a deviation that significantly breaches the system performance criteria.
These insights from the simulation analysis align with the theoretical results in
Section 3.5 and confirm the critical role of the current controller’s integral gain
in maintaining system stability. While lower
values ensure system stability by effectively damping oscillations, exceeding a threshold (
> 0.15) precipitates instability.
5. Conclusions
This study investigated the small-signal stability of integrating supercapacitors into a DC SPS. The control model for PMSG and their small-signal models were formulated, featuring a detailed analysis of PMSG parallel operations across five power distribution modes. The specific impacts of newly introduced electrical and control parameters, including the input-output parameters of converters and the PI controllers’ parameters of supercapacitor controllers, on system stability were explored following the integration of supercapacitors. Simulations conducted using MATLAB revealed that the converter’s input-output electrical parameters have a negligible influence on eigenvalues and overall system stability. It was found that system stability increases with and stabilizes when exceeds 5 × 10⁻⁶, maintaining stability when is below 0.15, but instability occurs beyond 0.15.
This research highlights that supercapacitor integration can significantly enhance system stability by mitigating oscillations and providing additional damping, especially in dominant modes. The findings illustrate the pivotal role of electrical and control parameter adjustments in leveraging supercapacitor benefits while ensuring the system’s resilience. The exploration into the nuanced influences of these parameters under various conditions sheds light on the critical balance between enhancing performance and maintaining system stability.
Future avenues for research may include investigating the effects of modified droop control strategies on power distribution and assessing system behavior under the variable-speed operations of diesel generator sets.


