Article

A New Method for the Correction of Spectrum Drift Caused by Temperature Changes When Using a NaI(Tl) Seawater Radioactivity Sensor

Institute of Oceanographic Instrumentation, Qilu University of Technology (Shandong Academy of Sciences), Qingdao 266061, China
*
Author to whom correspondence should be addressed.
J. Mar. Sci. Eng. 2024, 12(4), 546; https://doi.org/10.3390/jmse12040546
Submission received: 13 November 2023 / Revised: 20 December 2023 / Accepted: 6 January 2024 / Published: 25 March 2024
(This article belongs to the Section Physical Oceanography)

Abstract

:
The seawater radioactivity sensor based on the NaI(Tl) scintillation crystal detection method is prone to spectrum drift due to environment temperature changes during actual measurement, which pose difficulties in the activity analysis of seawater radionuclides. This paper adopts experiment design and analysis methods to study the relationship laws between temperature and peak position channel address and between gain and the peak position channel address. On the basis of studying and summarizing the two relationship laws of the NaI(Tl) seawater radioactivity sensor, a spectrum drift correction method combining gain adjustment and spectrum processing is proposed. Laboratory air and water environment experiments verify that the peak position channel address drift after air environment correction does not exceed ±2 channels, and after water environment correction does not exceed ±1 channel. Long-term verification experiments at the seawater work site have shown that this correction method can effectively correct the spectrum drift of the NaI(Tl) seawater radioactivity sensor and meet the requirements of long-term automatic operations at sea for the measured spectrum.

1. Introduction

The seawater radioactivity sensor developed based on the NaI(Tl) scintillation crystal detection method has become the main technical means for the in situ automatic monitoring of marine radioactivity environments due to its advantages of programmed, continuous observation. The use of seawater radioactivity sensors for the long-term continuous monitoring of seawater radioactivity levels can provide valuable information for seawater environmental protection [1]. Using full-spectrum analysis technology to analyze the spectrum could achieve the automatic identification and the quantitative detection of multiple radionuclides in seawater [2]. Therefore, the spectrum stabilization performance has become an important topic that provides a guarantee for the validity of measurement data for spectrum analysis.
Seawater temperature changes during the long-term continuous operation of the radioactivity sensor affect the NaI(Tl) scintillation crystal, the photomultiplier, and other electronic components effects [3,4,5]. Thus, the measured spectrum is affected by environment temperature changes, which add difficulty and even lead to errors for spectrum analysis [6]. Therefore, implementing drift correction on the spectrum obtained from the long-term continuous measurement of the seawater radioactivity sensor is very important.
The current spectrum drift correction methods mainly focus on the radioactivity sensor used in terrestrial environment measurements and can be divided into two categories. The first type is according to the reference peak of the spectrum and achieves spectrum drift correction by adjusting the hardware setting values such as sensor gain [7,8,9]. The advantage of this type is that it can correct the large-scale spectrum drift of the seawater radioactivity sensor. The second type reprocesses the measured spectrum using algorithms to obtain the spectrum without drift [10,11,12,13]. The advantage of this type is that it does not need to search for peaks during use, and the long-term continuity of the spectrum is good.
Seawater radioactivity sensors are usually deployed on marine-automated monitoring platforms such as buoys for long-term continuous measurement [14]. Based on their working conditions and performance requirements, using only a single type of correction method cannot effectively achieve the spectrum drift correction of the seawater radioactivity sensor. Thus, studying more effective and comprehensive correction methods by combining the two types will achieve better correction results.
This paper conducts temperature experiments on the seawater radioactivity sensor to study and analyze the relationship laws between temperature and peak position channel address and between gain and peak position channel address. The effectiveness and accuracy of the correction method were evaluated through laboratory experiments and verified in the seawater work site by deploying the seawater radioactivity sensor to an offshore platform for long-term measurements.

2. Experiment Devices and Methods

2.1. Experiment Devices

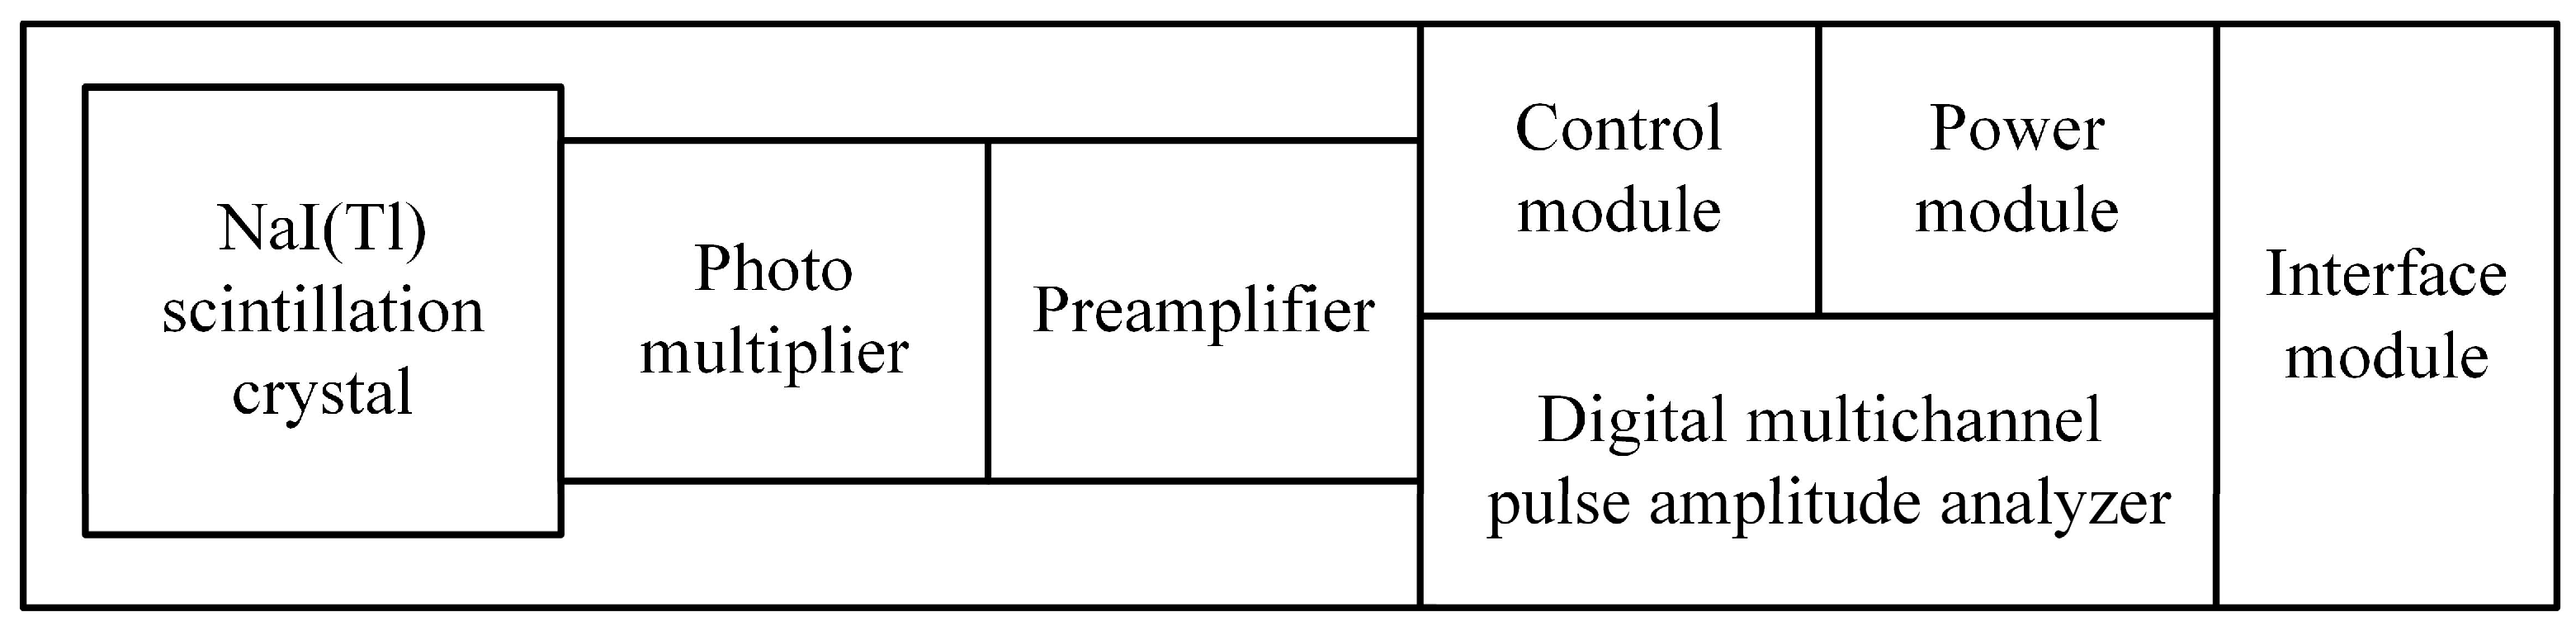
2.1.1. Seawater Radioactivity Sensor

The seawater radioactivity sensor based on the NaI(Tl) scintillation crystal detection method was used in the experiment (structure is shown in Figure 1), which is mainly composed of the NaI(Tl) scintillation crystal, the photomultiplier, the preamplifier, the digital multichannel pulse amplitude analyzer, the control module, the power module, and the interface module [15]. When the gamma ray in the seawater irradiates the NaI(Tl) scintillation crystal, the crystal emits fluorescence, and the photomultiplier collects the fluorescence and converts it into pulse voltage, which is amplified and shaped before entering the digital multichannel pulse amplitude analyzer for analysis to generate the spectrum. Peaks are generated in the spectrum due to the different counts of a certain channel in multiple channels. Based on the inherent spectrum characteristic peaks of the radionuclides, detailed information on the radionuclides in seawater can be obtained by analyzing the measured spectrum.
The seawater radioactivity sensor is packaged as a whole in a white cylindrical shell, which is waterproof, pressure resistant, and corrosion resistant, ensuring that the seawater radioactivity sensor can work continuously at 200 m underwater. The body of the seawater radioactivity sensor is connected to the shell with a bolt structural join, and an O-ring is designed at the seal to improve the high tightness of the shell package. The watertight connector provides the seawater radioactivity sensor external power and signal accesses. The measurement condition of minimum detectable activity was the surface seawater off the Chinese coast. The detailed specifications and parameters of the seawater radioactivity sensor are shown in Table 1.

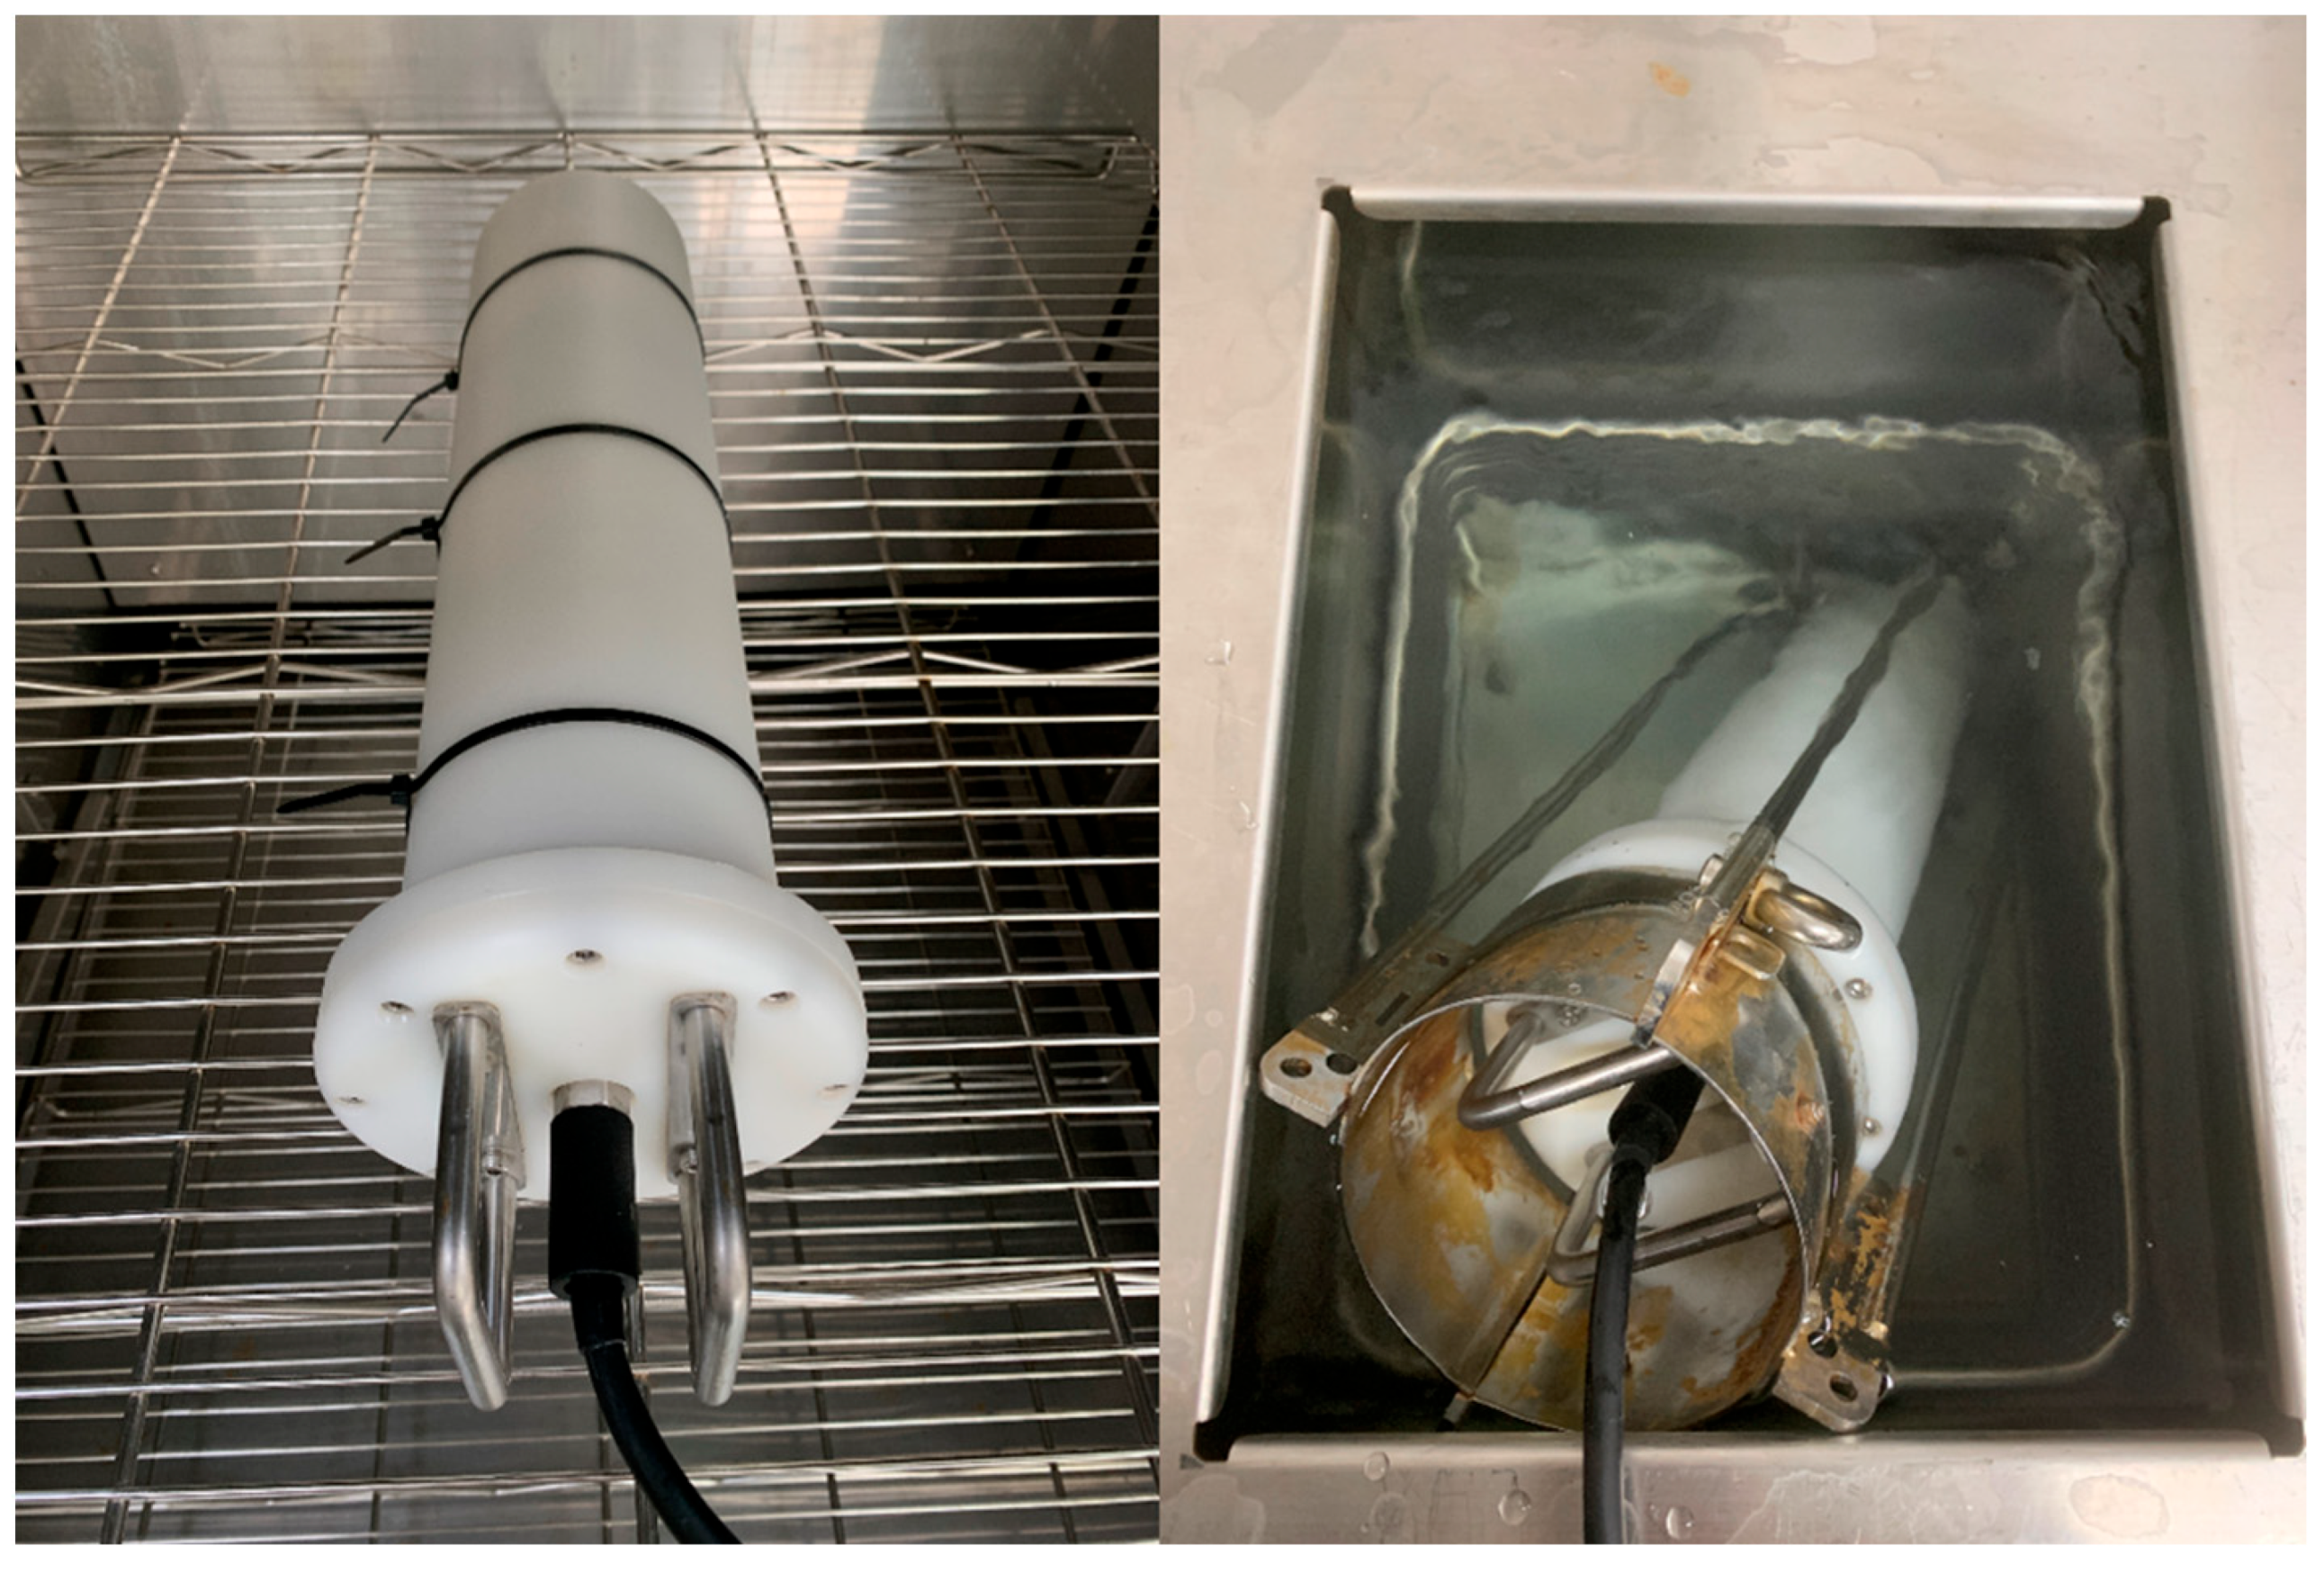
2.1.2. Temperature Experiment Boxes

Two types of temperature experiment boxes were used in the experiment. The first type was the air temperature experiment box, which has programming operation functions. The air temperature experiment box can control the rate of temperature changes, set the temperature holding time, and adjust the temperature range from −20 °C to 100 °C. Experiments were conducted on the relationship laws between the temperature and the peak position channel address and between the gain and the peak position channel address of the seawater radioactivity sensor in the air temperature experiment box; the two relationship laws were summarized and analyzed, and the spectrum drift correction method was studied. Then, preliminary verification of the correction method was performed in the air temperature experiment box.
The second type was the water temperature experiment box with a temperature adjustment range of −20 °C to 80 °C. Tap water was injected into the box to simulate the working environment of seawater bodies, further verifying the effectiveness and accuracy of the correction method.

2.2. Experiment Methods

2.2.1. Experiment on the Relationship Law between Temperature and Peak Position Channel Address

Natural radionuclides are ubiquitous in nature, among which the relative contents of 214Bi, 40K, and 208Tl radionuclides are high [16,17], and the three radionuclides can produce more evident natural characteristic peaks in the spectrum. Therefore, when conducting the temperature experiment, three natural characteristic peaks of 214Bi (609 keV), 40K (1461 keV), and 208Tl (2614 keV) were used as references to observe and study the effect of temperature on the spectrum drift.
The temperature range applied in the experiment was the same as the specified working temperature range of the radioactivity sensor: −5 °C to 50 °C. The temperature gradient was 5 °C, and twelve temperature points were set within the temperature range. The temperature of the air temperature experiment box decreased from 50 °C to −5 °C, which is the cooling process, and increased from −5 °C to 50 °C, which is the heating process. Each experiment treated the cooling and heating processes as a measurement cycle to study the drift of the spectrum peak position channel address during different temperature change tendencies and to more accurately investigate the correction method for the spectrum drift.
The experiment of each of the twelve temperature points was performed whenever the temperature in the seawater radioactivity sensor and in the air box controller were equalized for at least 1 h. To obtain a better-quality spectrum, the single spectrum measurement time was 20 min. The drift of the spectrum is the result of the overall temperature effect of all functional modules inside the seawater radioactivity sensor. Therefore, when conducting temperature experiments, the seawater radioactivity sensor must be placed as a whole in the air temperature experiment box (shown in Figure 2).
The environment temperature for the energy calibration of the seawater radioactivity sensor used in this paper was 25 °C, so this temperature was the reference temperature point. The measured spectrum under this temperature condition was used as the reference spectrum, and the characteristic peak position channel address was used as the reference peak position channel address.

2.2.2. Experiment on the Relationship Law between Gain and Peak Position Channel Address

The 40K radionuclide relative content in seawater is high [18], and when the seawater environment changes, its relative content remains stable without substantial changes [19]. The seawater radioactivity sensor was completely submerged in seawater during use, and a very noticeable 40K (1461 keV) natural characteristic peak was formed in the measured spectrum. Therefore, when conducting the gain experiment, 40K (1461 keV) was used as the characteristic peak for observation and study.
To study the relationship law between gain and the peak position channel address, the air temperature experiment box was used to conduct gain adjustment experiments at different temperatures. Similarly, the temperature change range was −5 °C to 50 °C, the temperature change gradient was 5 °C, and the reference temperature was 25 °C. Twelve temperature points were set within the temperature range. The stabilization time to reach each temperature point was greater than 1 h, and the measurement time for each spectrum was 20 min.
When the temperature reached each temperature point, the initial gain was set to 12,000 of the energy calibration. To study the relationship law between gain and peak position channel address accurately and meticulously, the gain was increased or decreased. The gain adjustment gradient was 100, and the gain adjustment range was 9000 to 15,000. Different gain values were used at each temperature point for spectrum measurement to study the influence of gain on peak position channel address.

3. Experiment Results and Analysis

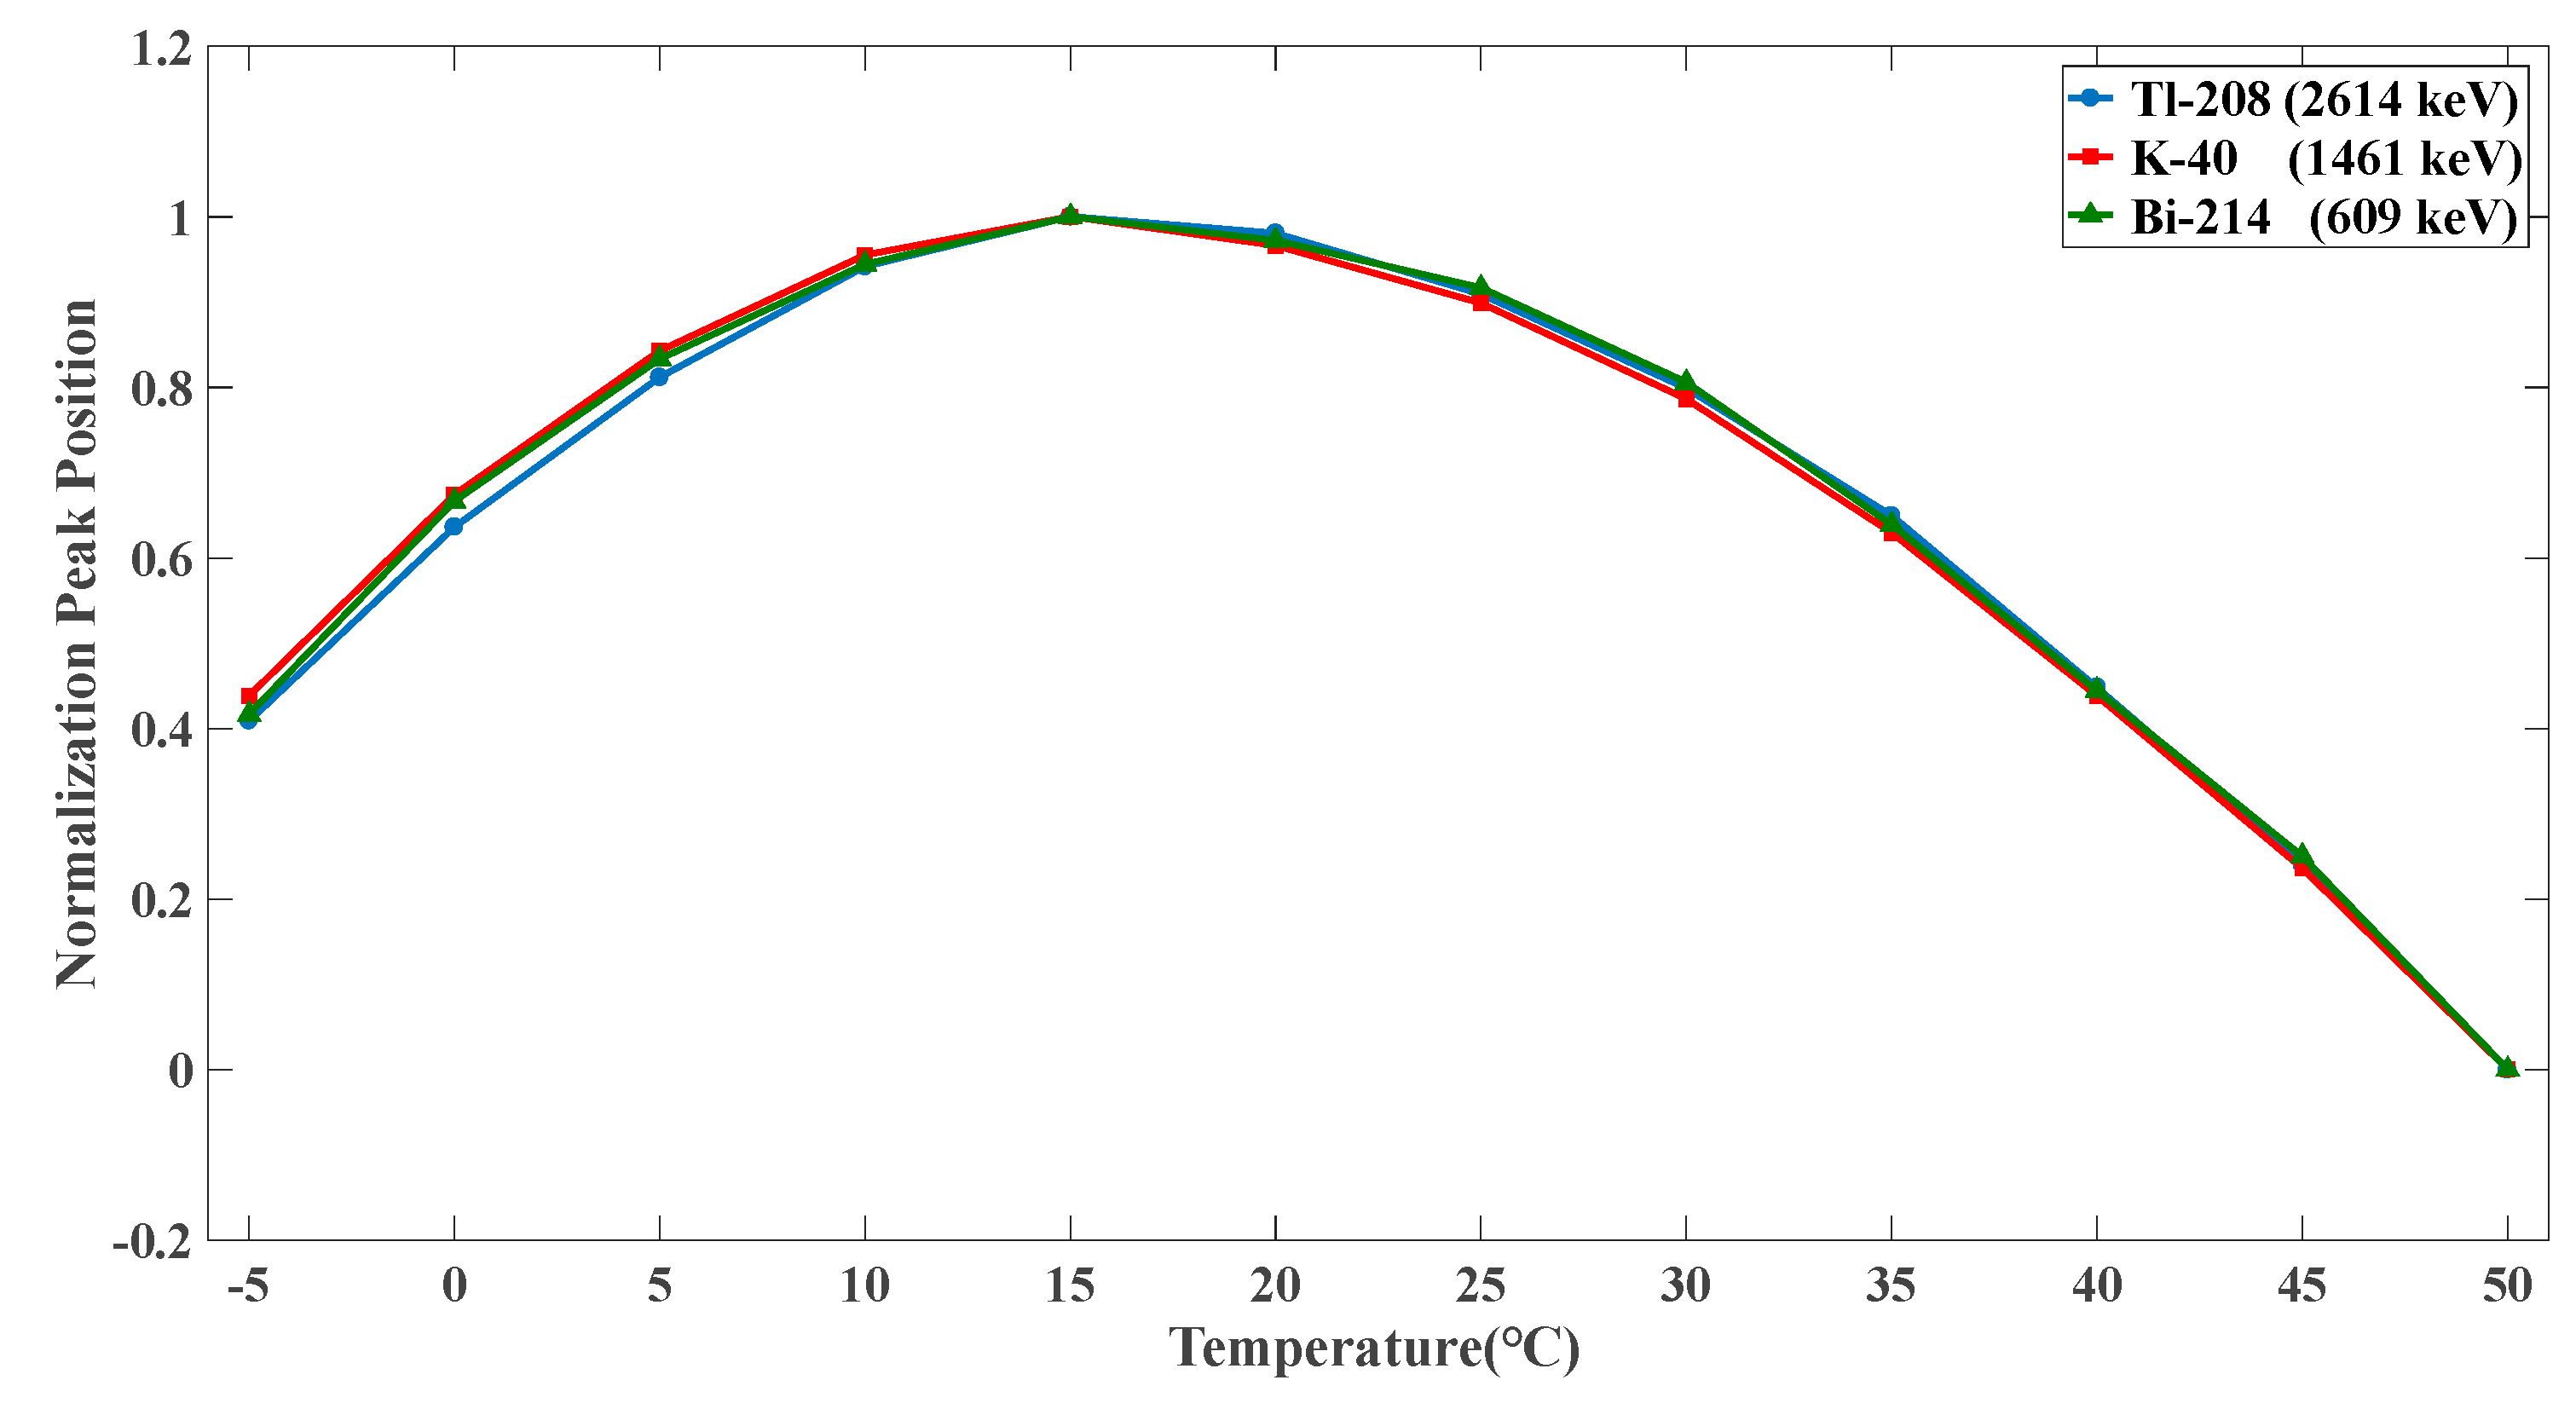
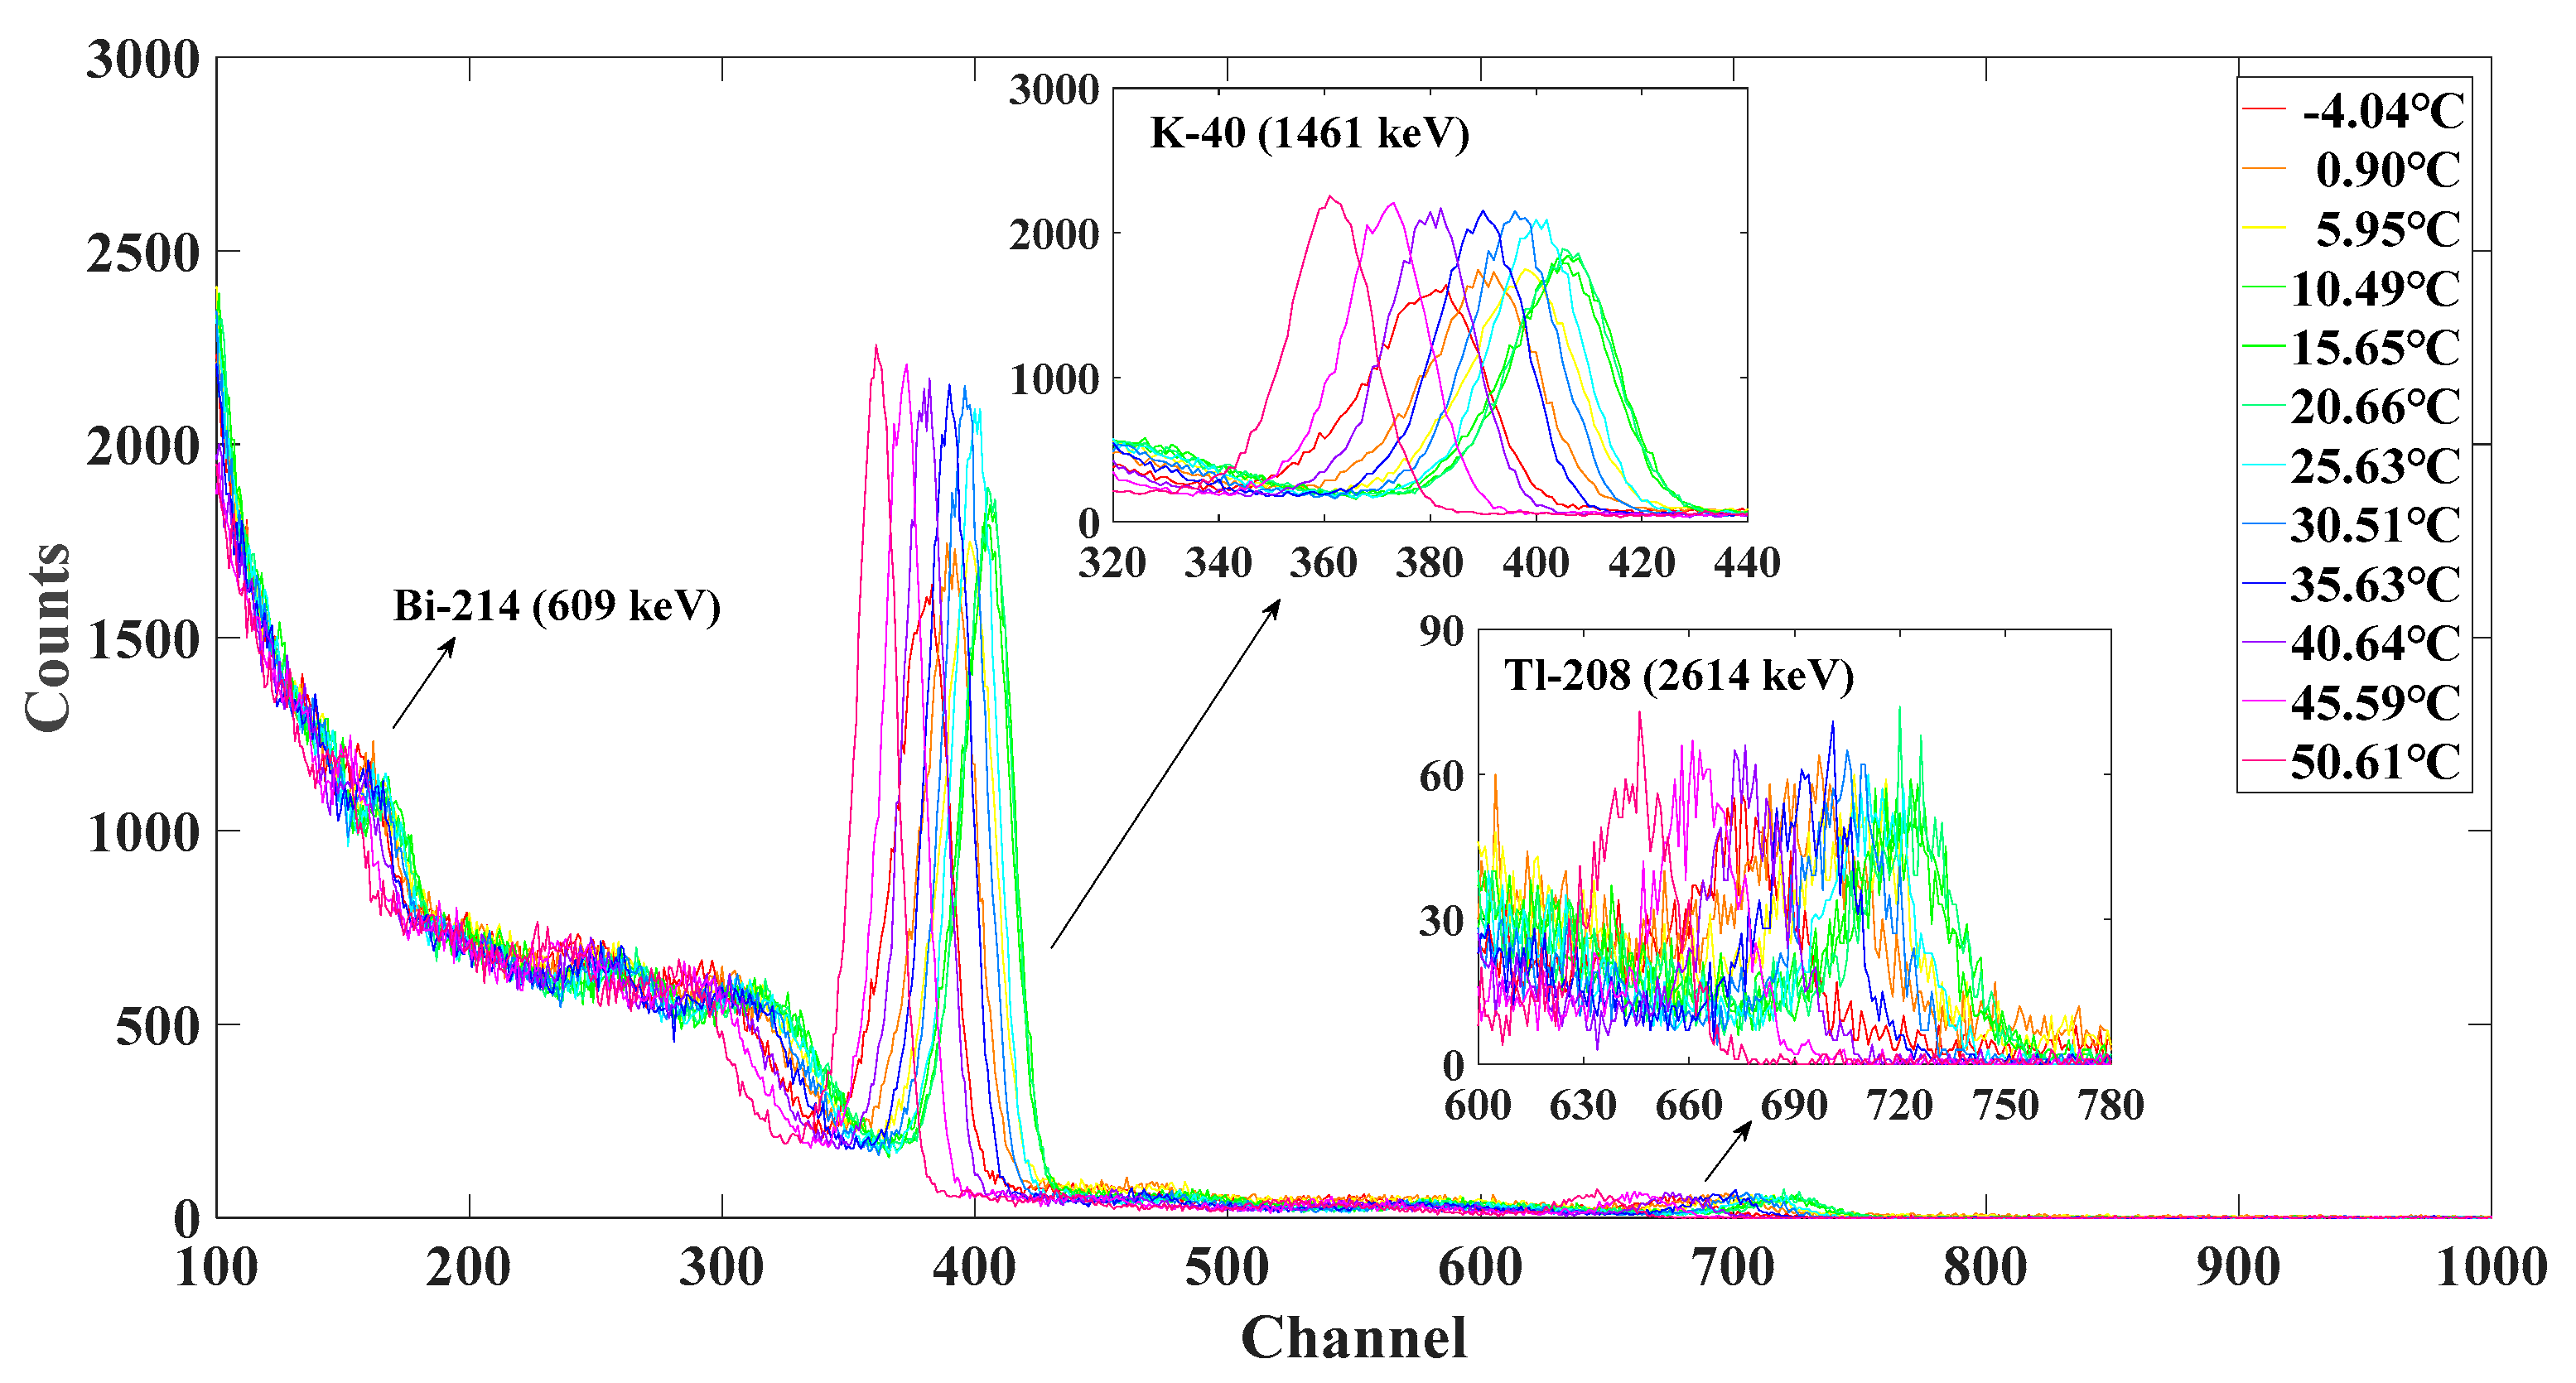
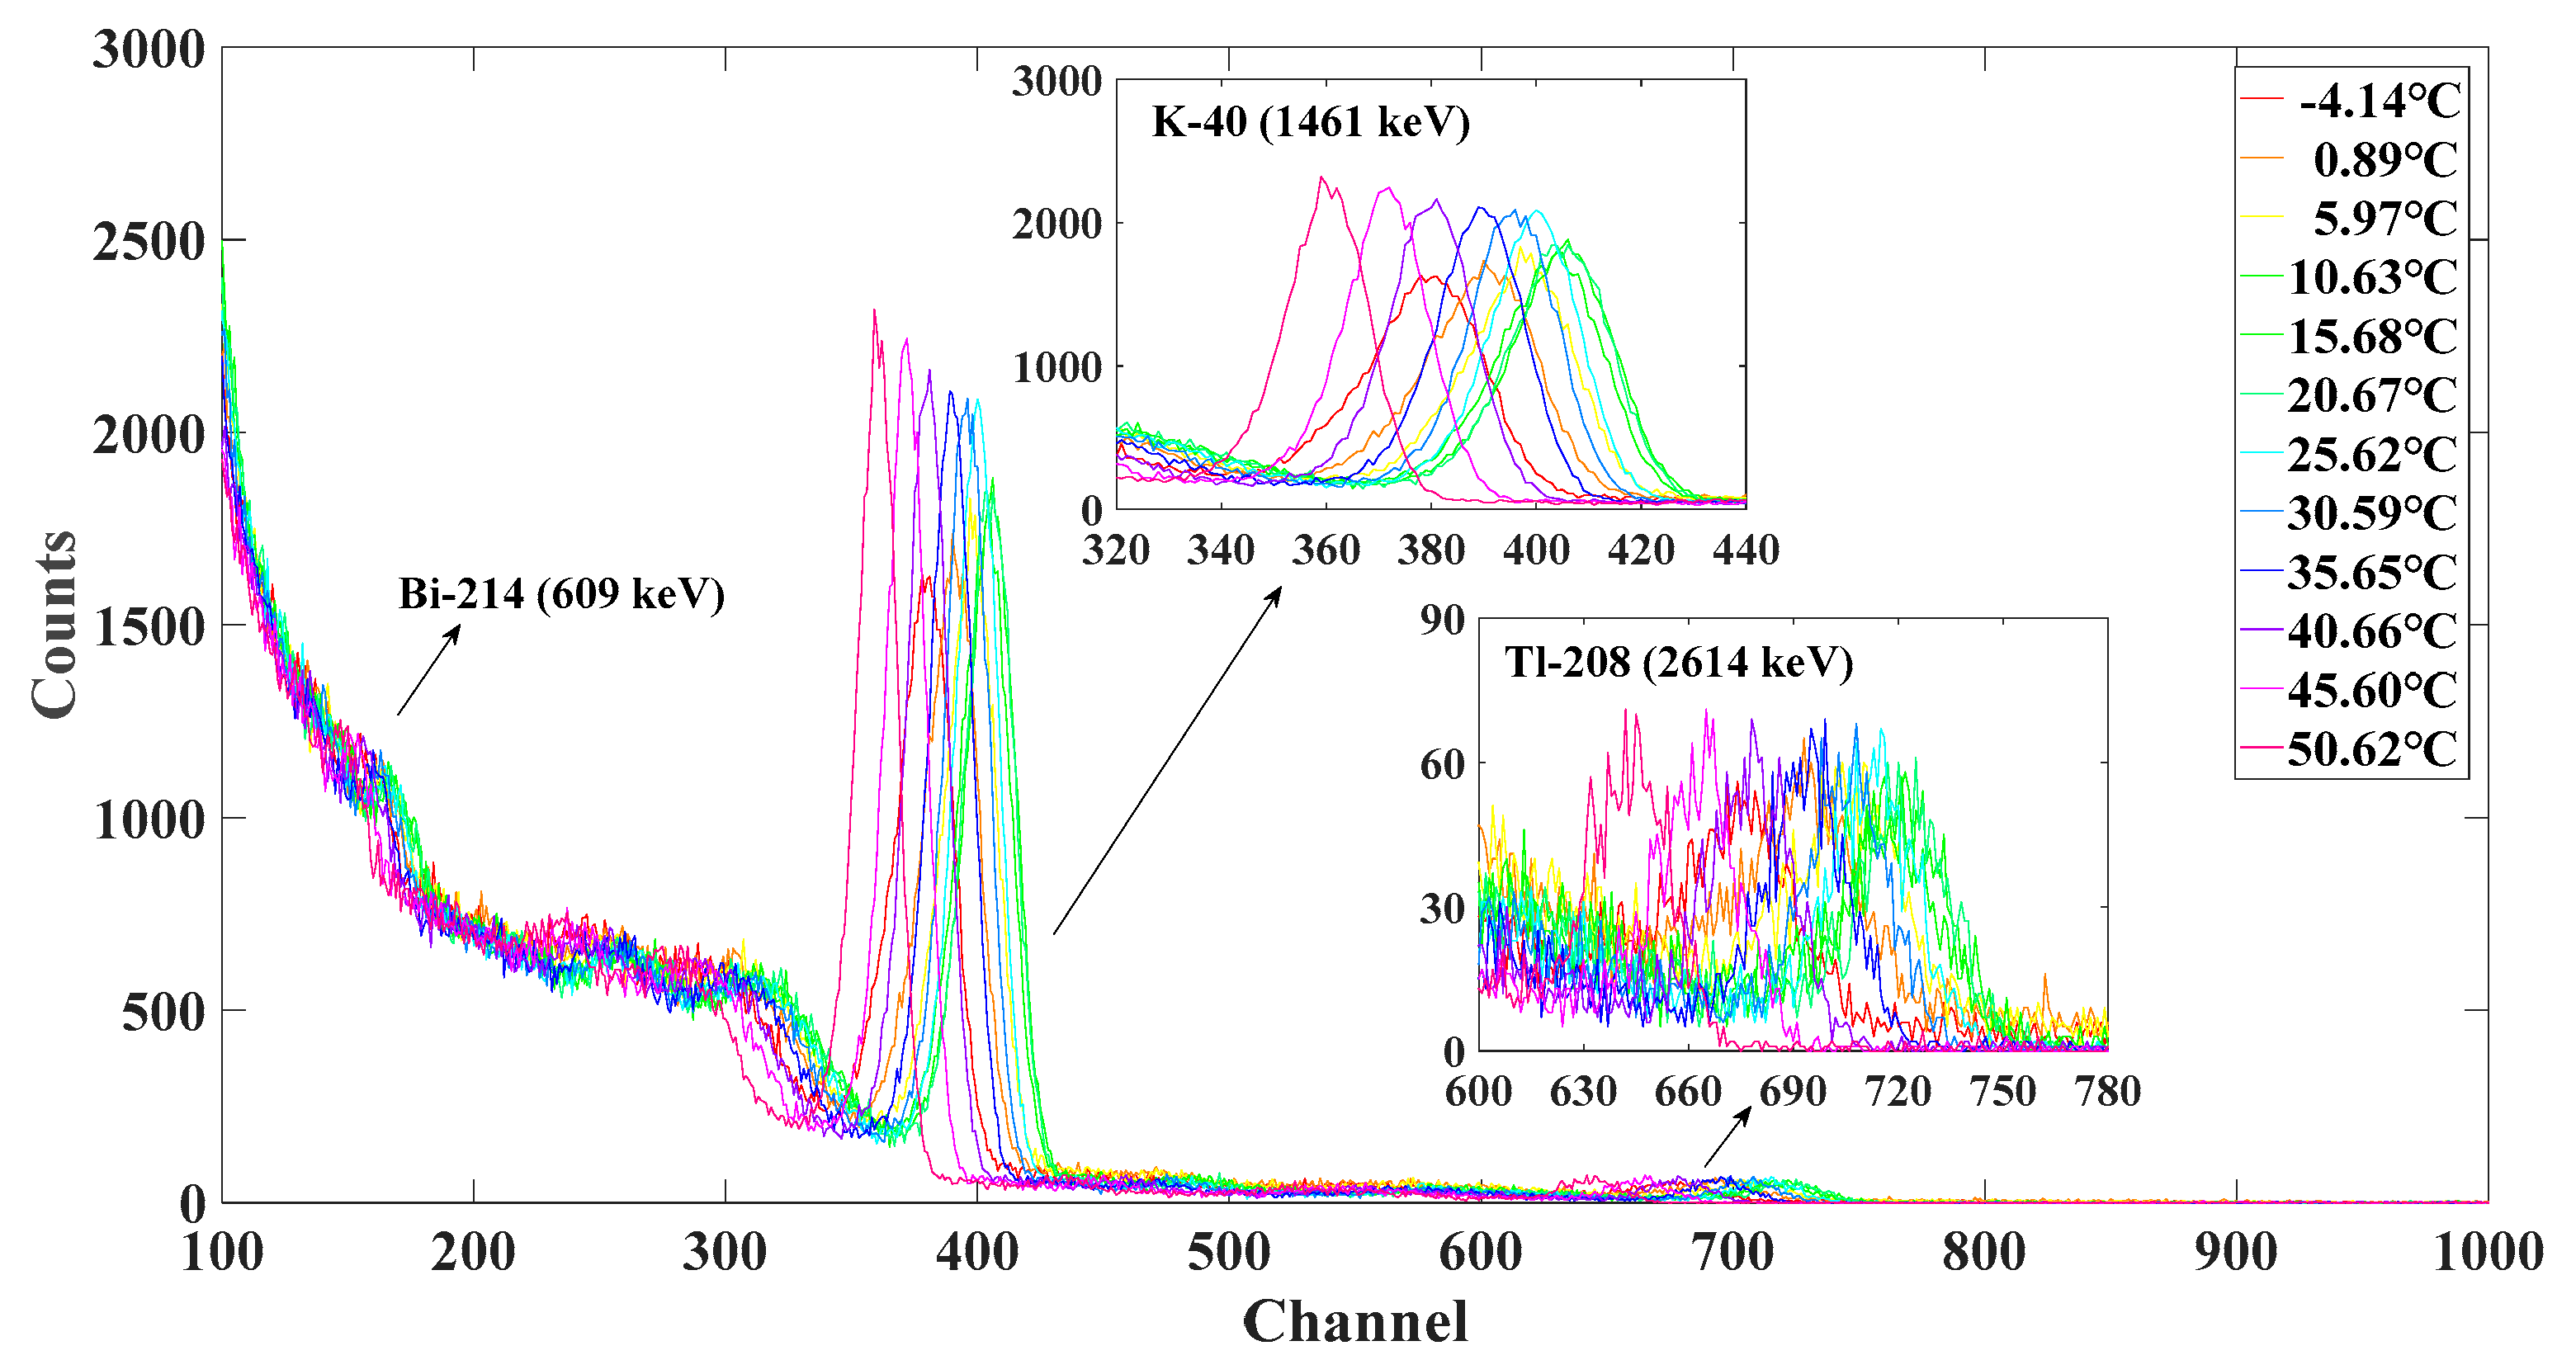
3.1. Relationship Law between Temperature and Peak Position Channel Address

According to the experiment design of the relationship law between temperature and peak position channel address mentioned earlier, multiple measurement cycle experiments were conducted. Considering the validity and representativeness of the experiment data, the average peak position channel addresses of 214Bi (609 keV), 40K (1461 keV), and 208Tl (2614 keV) in each temperature point were taken from multiple measurement cycle experiments. Figure 3 shows the relationship of the 214Bi (609 keV), 40K (1461 keV), and 208Tl (2614 keV) peak position channel addresses with the temperature changes.
Figure 3 shows that the drift of the radionuclide peak position channel address with temperature is not a simple linear relationship. Analysis shows that, within the temperature range of −5 °C to 50 °C, 15 °C is the inflection point of the peak position channel address with temperature changes. That is, before 15 °C, the peak position channel address increases with the increase of temperature, and after 15 °C, the peak position channel address decreases with the increase of temperature. The relationship law range of −5 °C to 50 °C is the same as in Naumenko et al. [20]; after 20 °C, it follows the same relationship law as the experiment data in Mitra et al. [21]. However, it is different from the linear function relationship law in Hung et al. [22] and Chen et al. [23]. This outcome is related to factors such as hardware selection, processing programs, and the software algorithms of radioactivity sensors and illustrates the complexity of spectrum drift from another perspective.
However, a great similarity exists in the drift of different radionuclide peak position channel addresses. To explore the relationship law between temperature and different radionuclide peak position channel address drifts, the effect of temperature changes on the full-spectrum range was further investigated. Normalization was performed on different temperature points 214Bi (609 keV), 40K (1461 keV), and 208Tl (2614 keV) peak position channel addresses, as shown in Figure 4.
Figure 4 shows that the normalized peak position channel address of 214Bi (609 keV), 40K (1461 keV), and 208Tl (2614 keV) have the same trend with temperature changes, and the three curves overlap. Therefore, the influence of the same temperature change on different radionuclide peak position channel addresses has the same proportional relationship; that is, if the value of the peak position channel address is large, and the value of the peak position changing with the temperature is large, the change of the spectrum channel address deviation with the temperature is large, and vice versa. This relationship law lays the foundation for establishing a correction method within the full-spectrum range.
Therefore, if the correction relationship between the peak position of a certain characteristic peak in the spectrum is determined, the peak position drift of multiple characteristic peaks and all characteristic peaks within the full-spectrum range can be corrected, thereby correcting all characteristic peaks and the entire spectrum. The theoretical derivation in Casanovas et al. [24] and the experiment data in Bu et al. [25] and Leroux et al. [26] also confirm this view, and this correction relationship is independent of the primary or the quadratic function rule of the peak position channel address drift with temperature.

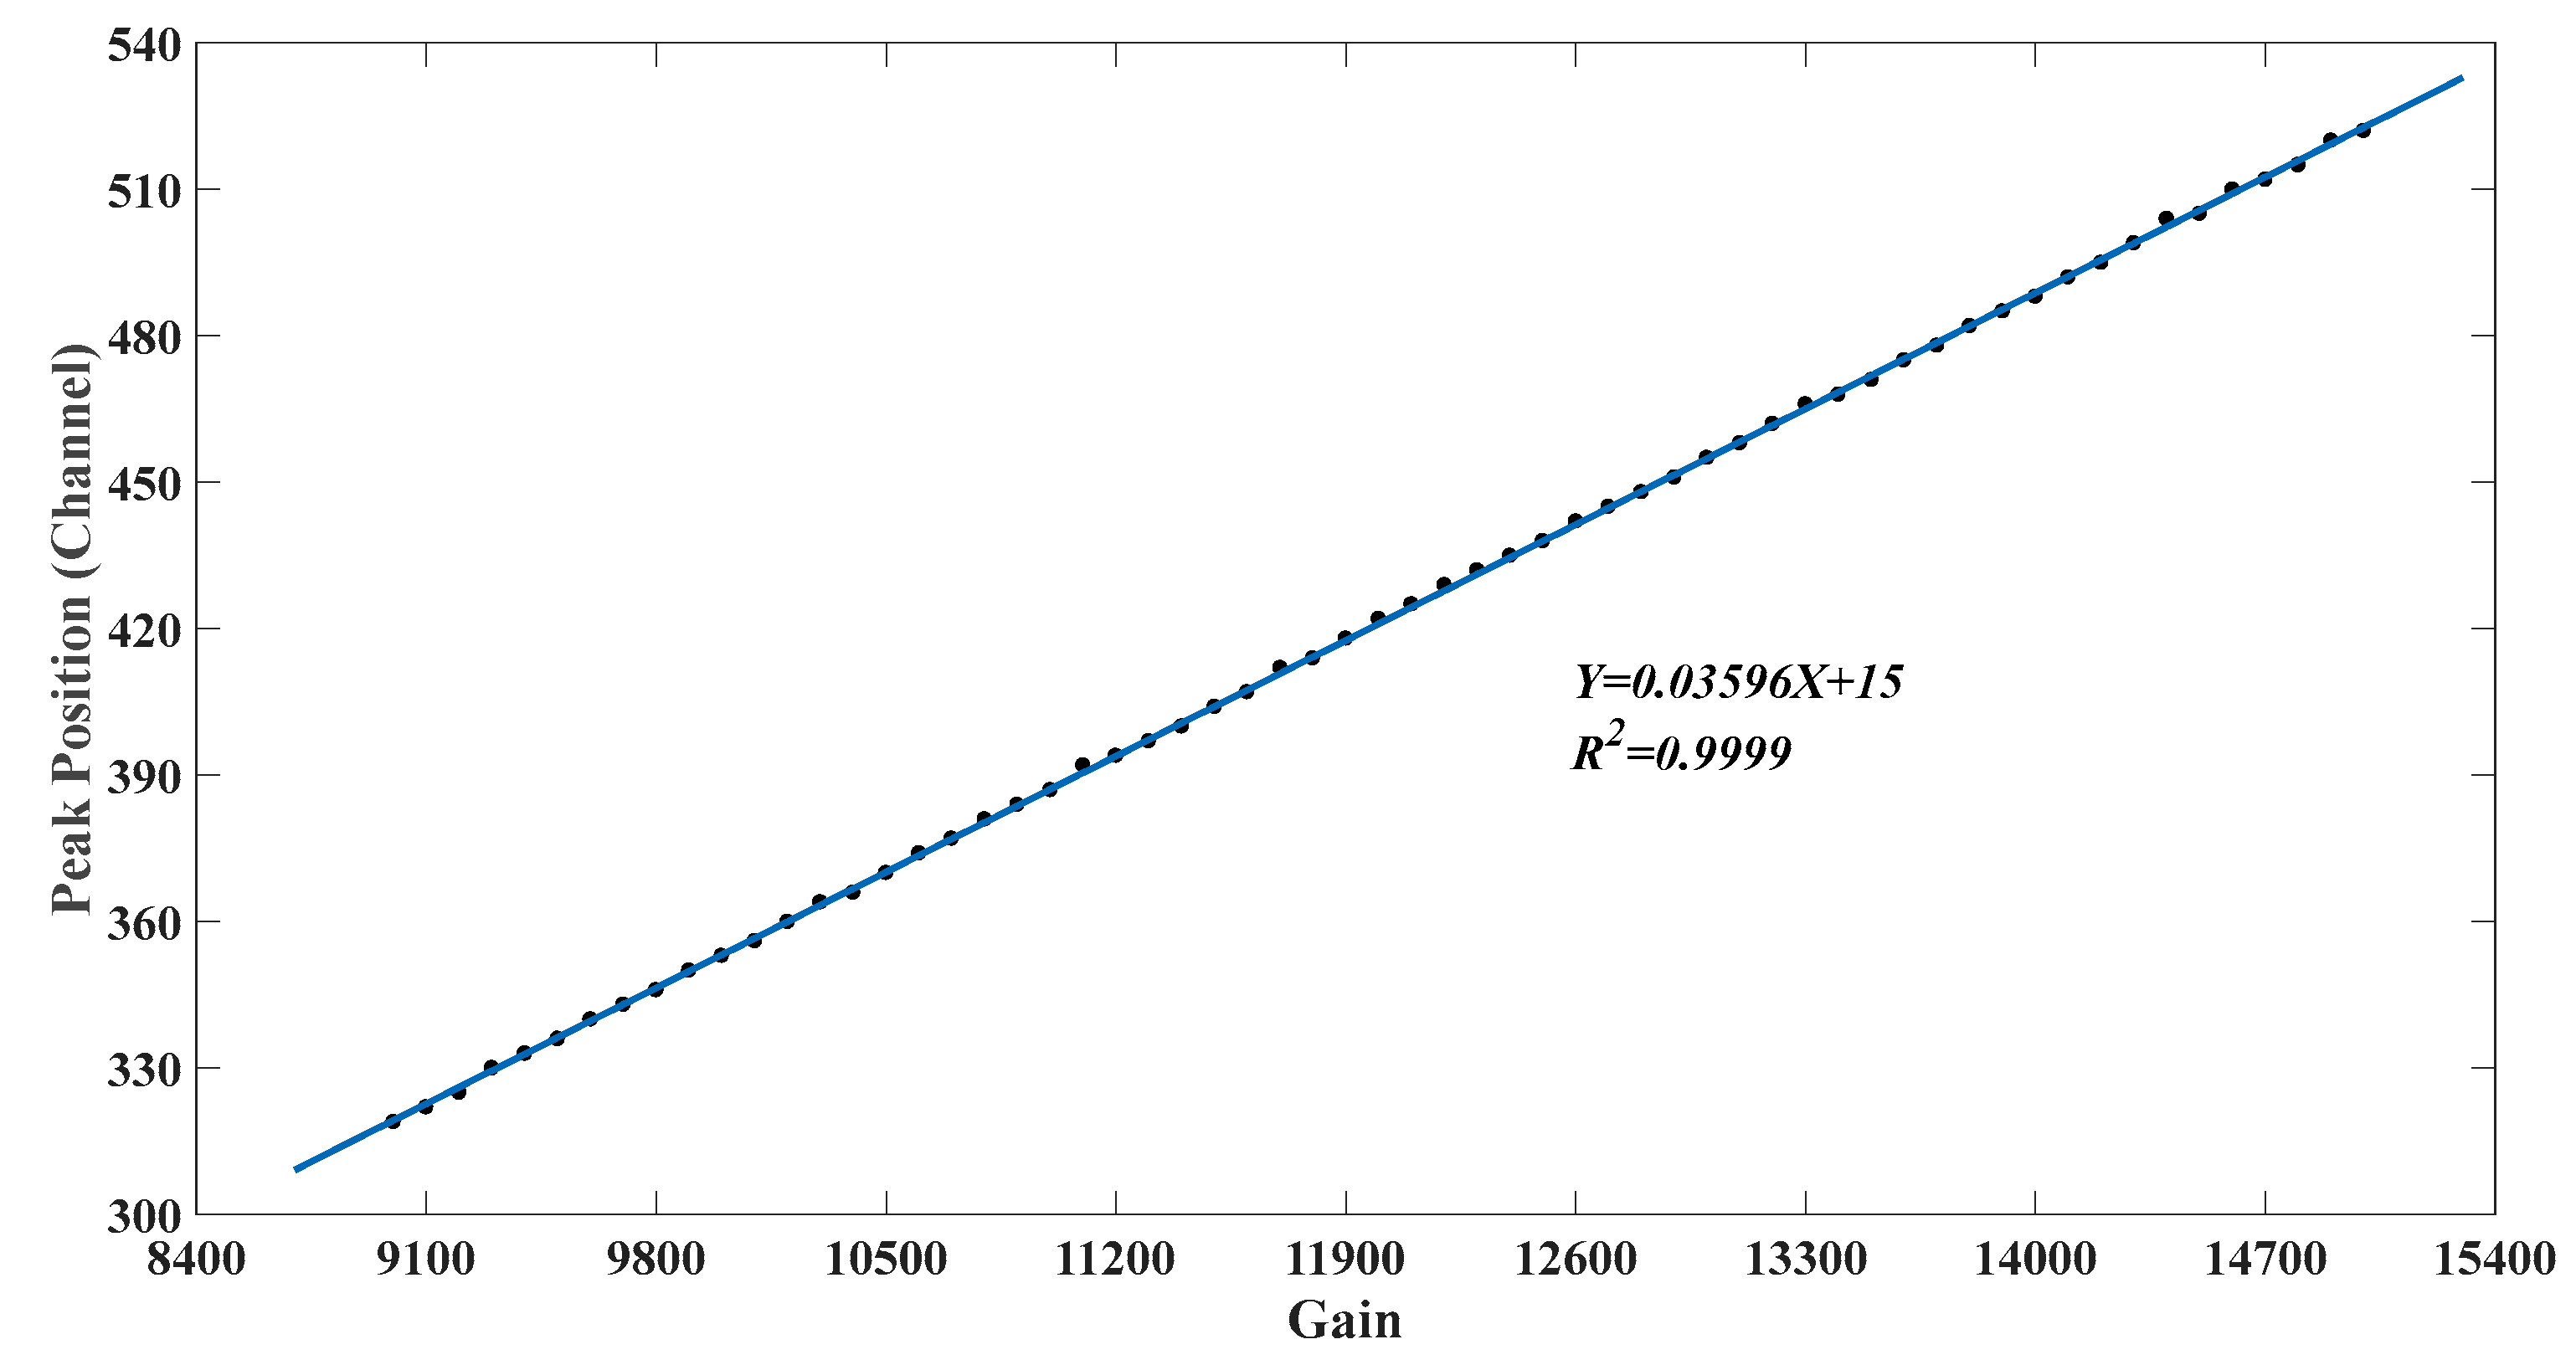
3.2. Relationship Law between Gain and Peak Position Channel Address

According to the experiment design, multiple groups of repeated experiments were conducted at the twelve set temperature points. The multiple groups of 40K (1461 keV) peak position channel address data at the same temperature point were averaged, and the function relationship between the gain value and the 40K (1461 keV) peak position channel address was fitted. The results exhibited a good linear function relationship, and the fitting relationship of all temperature points is shown in Table 2. Although the 40K (1461 keV) peak position corresponds to different channel addresses at varied temperature points, the ratio of the change in the 40K (1461 keV) peak position channel address with the variation in gain value is approximated, that is, the slope k value of the fitting relationship is approximated. To simplify the correction method, the k value at the reference temperature was used as the reference value for the relationship between gain and the peak position channel address.
The fitting relationship between the gain values at the reference temperature point of 25 °C and the 40K (1461 keV) peak position channel address is shown in Figure 5. A good linear relationship exists between the gain values and the 40K (1461 keV) peak position channel address (linear correlation coefficient R2 = 0.9999). When the gain value increases, the 40K (1461 keV) peak position channel address also increases. When the gain value decreases, the 40K (1461 keV) peak position channel address decreases. The gain has the same influence relationship on the full-spectrum range channel address as the 40K (1461 keV) peak position channel address due to the consistency of the change ratio and drift trend of the 214Bi (609 keV), 40K (1461 keV), and 208Tl (2614 keV) peak position channel addresses and the full-spectrum range channel address.

4. Correction Algorithm and Process

4.1. Correction Algorithm

4.1.1. Gain Adjustment Part Correction Algorithm

The gain adjustment correction part aims to correct the seawater radioactivity sensor to the standard operating state, that is, to eliminate the current spectrum drift state. Using 40K (1461 keV) as the reference peak for the gain adjustment correction part, when the peak position channel address of 40K (1461 keV) is corrected to the reference peak position channel address, the spectrum at this time is the reference spectrum, and the working state of the seawater radioactivity sensor is the standard working state.
The deviation of the defined peak position channel address is the difference between the current measured spectrum peak position channel address and the reference peak position channel address:
C H D = P E S P E R
where CHD is the deviation of the peak position channel address, PES is the peak position channel address of the current measured spectrum, and PER is the reference peak position channel address.
According to the relationship law between the gain and the peak position channel address of the spectrum, the following can be obtained:
G A D C H D = 1 k
where GAD represents the gain variation, and k is the slope of the relationship law between the gain and the peak position channel address.
By combining Equations (1) to (2) and the actual change in gain, the correction formula of the gain adjustment correction part can be obtained:
G A D = 1 k ( P E S P E R )
When GAD is positive, the current gain should increase. When GAD is negative, the current gain should decrease.
The gain adjustment correction part is aimed at quickly and accurately correcting the seawater radioactivity sensor to the standard working state after it is turned on or when it experiences large-scale drift due to abnormal conditions and continuing the spectrum measurement work.
The correction algorithm of the gain adjustment correction part uses the 40K (1461 keV) natural characteristic peak formed by a large number of 40K natural radionuclide present in seawater, which solves the problem of introducing the reference source that can have adverse effects on the spectrum of seawater. The correction algorithm is suitable for low-level or extremely low-level radioactivity environments in seawater.

4.1.2. Spectrum Processing Part Correction Algorithm

The previous analysis shows that if the correction relationship of one peak position channel address is determined, then all of the radionuclide characteristic peaks and the full-spectrum range can be effectively corrected. Likewise, the spectrum processing correction part uses the natural characteristic peak of 40K (1461 keV) to establish a correction algorithm.
The drift of the spectrum channel address with temperature has the same proportion relationship. Therefore, the spectrum with drift can be corrected using the following relationship:
C H T C = C H T F ( T )
where CHTC is the spectrum channel address under a certain temperature condition after correction, CHT is the spectrum channel address under a certain temperature condition before correction, F(T) is the temperature correction function, and T is the temperature.
The correction function under specific temperature conditions can be expressed as the ratio between the peak position channel address under that temperature condition and the reference peak position channel address:
F ( T ) = P E T P E R
where PET is the peak position channel address under a certain temperature condition.
The best fit for the temperature experiment data mentioned above, is a cubic polynomial function:
P E T P E R = a + b T + c T 2 + d T 3
where a, b, c, and d are the correction coefficients.
Combining Equations (4) to (6), the correction formula of the spectrum processing correction part is obtained:
C H T C = C H T a + b T + c T 2 + d T 3
In actual work, the environment temperature of seawater usually changes slowly. To ensure that the temperature values used in the spectrum processing correction part are more accurate and representative, the temperature value can be taken as the average of the temperature values from the start, middle, and end of a spectrum measurement period:
T M = 1 3 ( T A + T B + T C )
where TM is the average temperature value during the measurement period, TA is the temperature value at the start time, TB is the temperature value at the middle time, and TC is the temperature value at the end time.
By using the correction formula of the spectrum processing correction part, the counts are redistributed on the spectrum channel address, and the peak position channel address, characteristic peak, and spectrum are corrected. Under specific temperature conditions in the laboratory, the quantitative relationship between the temperature and the peak position channel address of the 40K (1461 keV) natural characteristic peak is obtained. The correction coefficients of the spectrum processing correction part only use the characteristic peak formed by the natural radionuclide, without the need for any radioactivity standard source.
The correction coefficients in the correction algorithm of the spectrum processing correction part are calculated through the quantitative relationship and are only related to the seawater radioactivity sensor itself. After the seawater radioactivity sensor is used in the work site, the spectrum processing correction part does not require any reference peak and only needs to obtain the current temperature value of the measurement environment to correct the spectrum drift, further reducing the complexity of the spectrum analysis.
The seawater radioactivity sensor studied in this paper is based on NaI(Tl) scintillation crystals, which do not possess radioactivity. When using the seawater radioactivity sensor based on LaBr3(Ce) or LaCl3(Ce) scintillation crystals, the correction coefficients can be calculated using the natural characteristic peaks formed by the scintillation crystals that are self-radioactive [27,28,29].

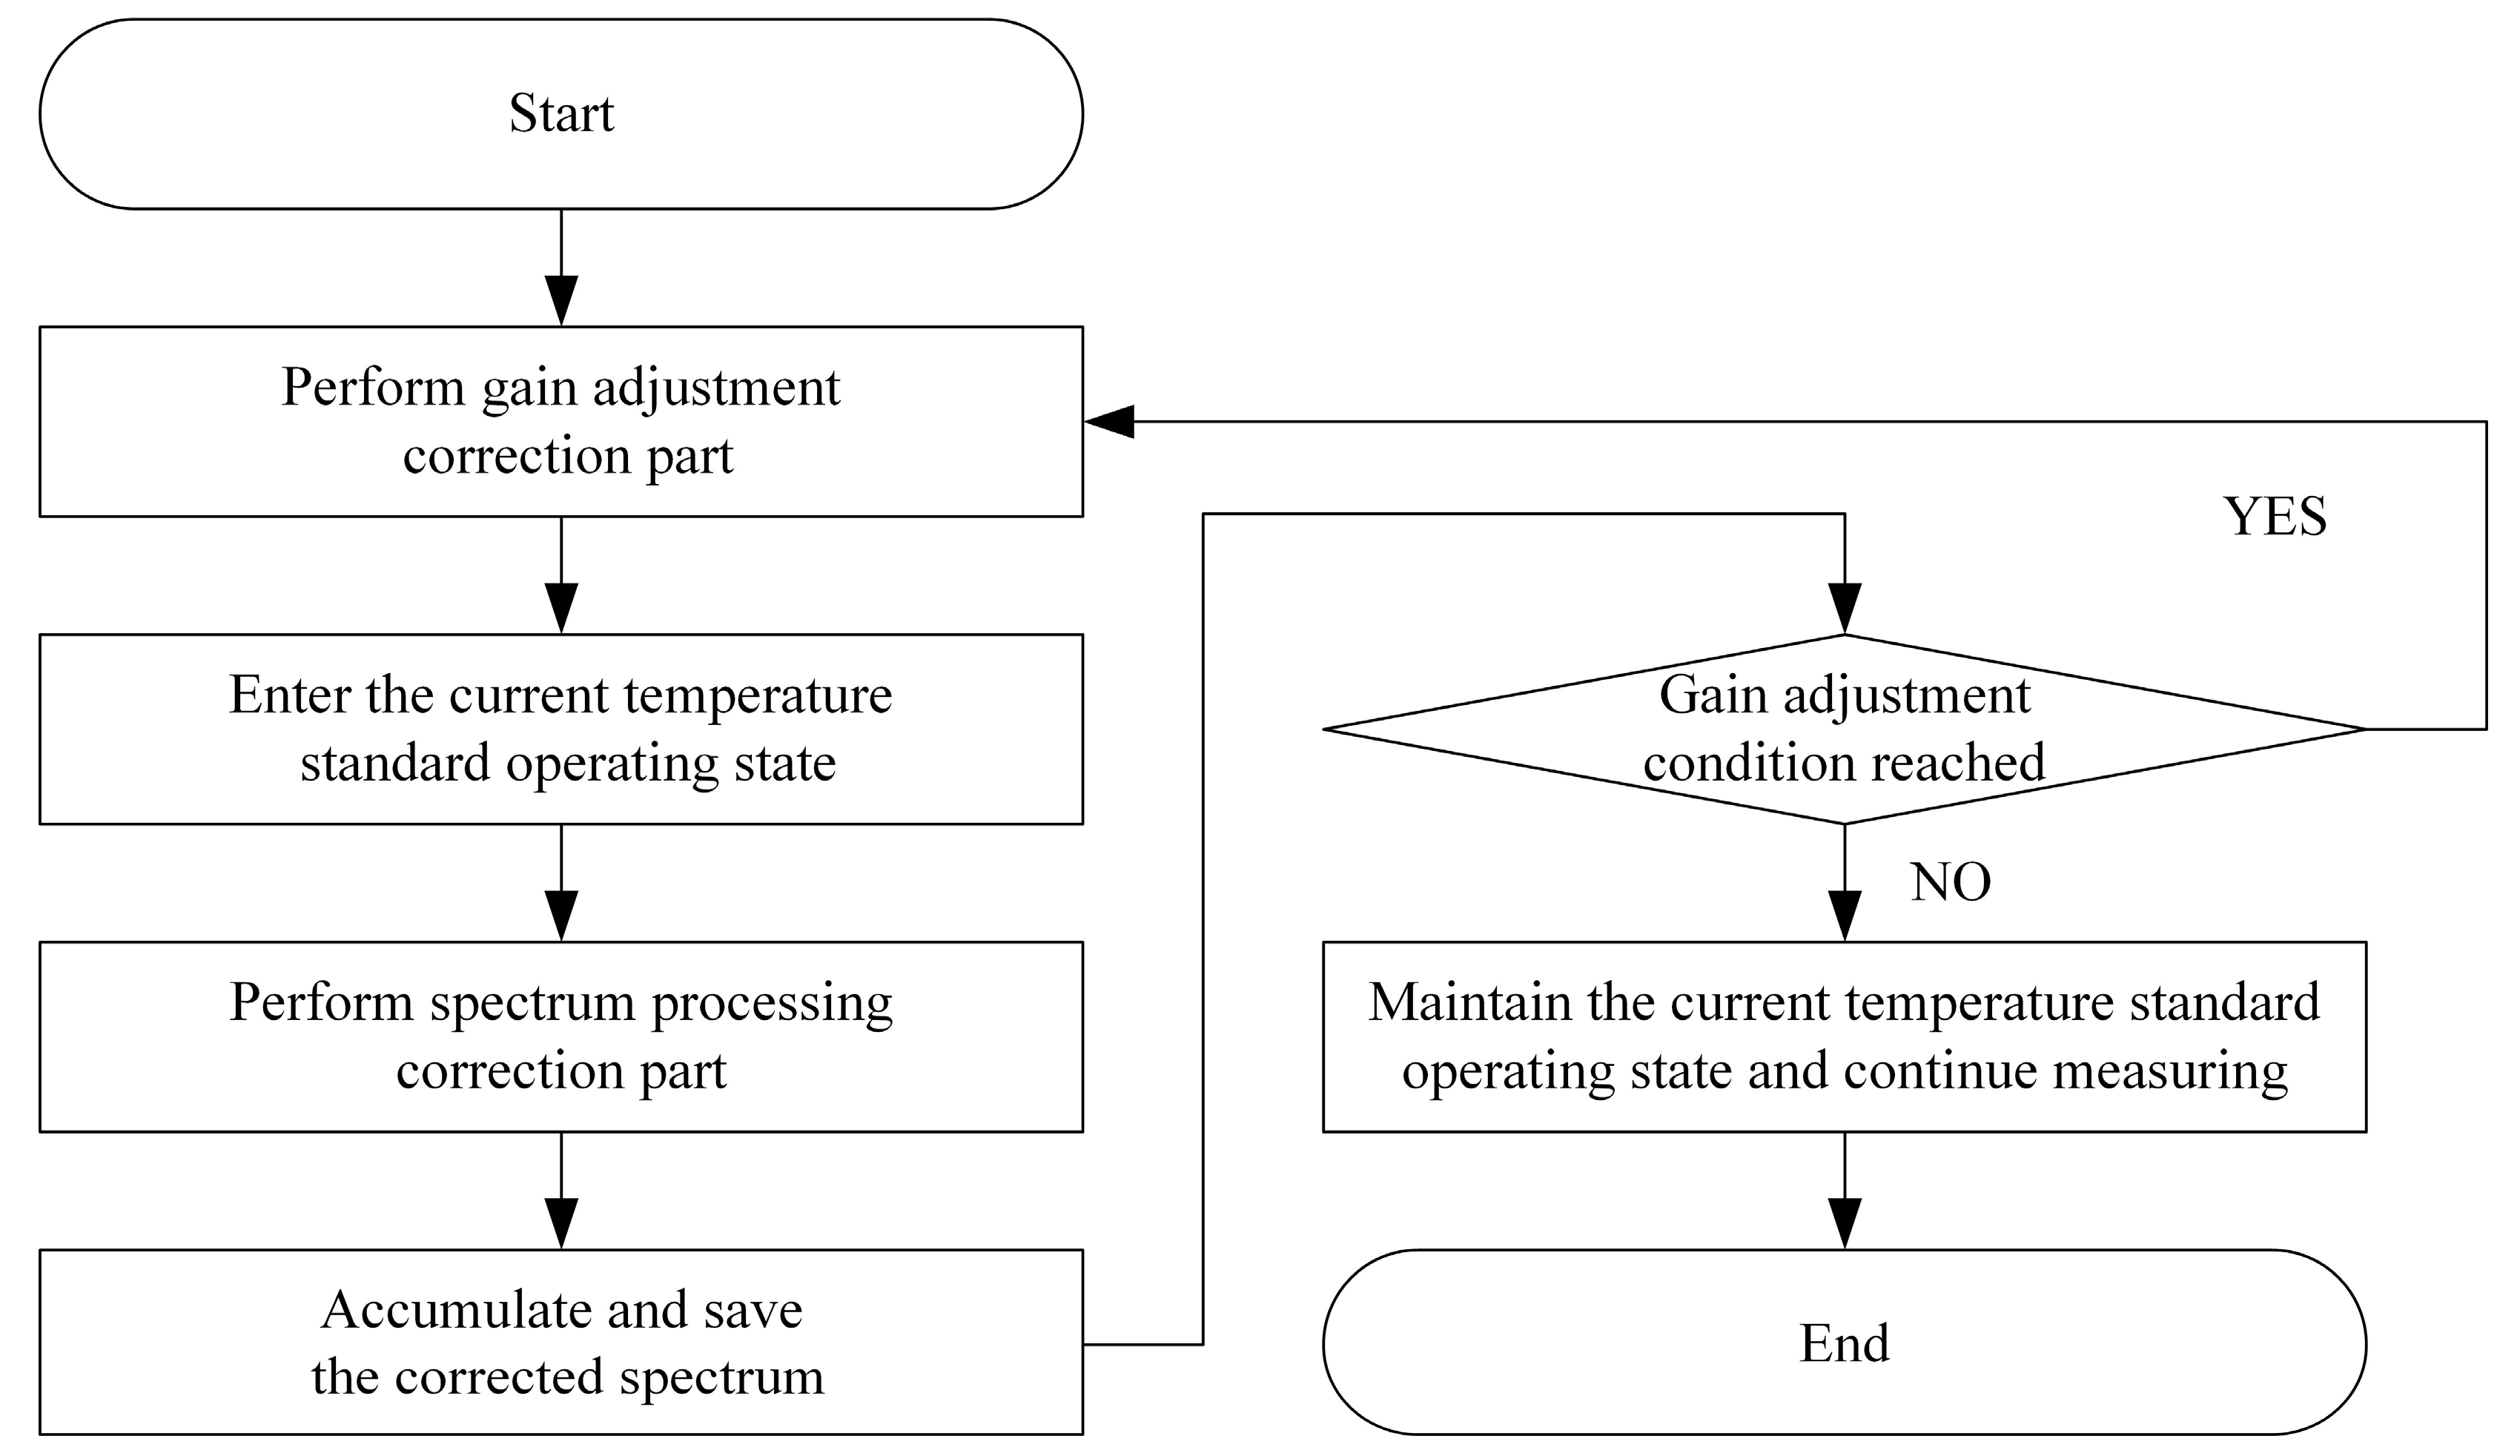
4.2. Correction Process

The workflow of the spectrum drift correction method combining gain adjustment and spectrum processing is shown in Figure 6, which can be described as follows: After the seawater radioactivity sensor is turned on, the first step is to perform the gain adjustment correction part, adjust the seawater radioactivity sensor to the standard operating state, and then start measurement according to the sensor settings. During the continuous measurement, every period of the spectrum measurement is completed, and the spectrum processing correction part is performed to obtain the corrected spectrum. The spectrum is automatically saved and accumulated for analysis.
When the conditions of the gain adjustment correction part are reached, the seawater radioactivity sensor automatically performs the gain adjustment correction part according to the settings to correct the seawater radioactivity sensor to the standard operating state and then continues to perform the spectrum measurement and the spectrum processing correction part.
If the conditions of the gain adjustment correction prat are not reached, the seawater radioactivity sensor does not need to perform the gain adjustment correction prat. The measurement is kept in the standard operating state, and the spectrum processing correction part is executed. After the measurement task of the seawater radioactivity sensor is completed, or when the spectrum needs to be extracted, the accumulated and saved spectrum can be used to obtain the corrected long-term spectrum to meet the needs of spectrum analysis.
According to the characteristics of the actual working environment of the seawater radioactivity sensor, when the seawater radioactivity sensor runs in situ for a long-term, the conditions of the gain adjustment correction part can generally be set as follows:
(1)
The cumulative measurement time of the seawater radioactivity sensor exceeds seven days.
(2)
The seawater radioactivity sensor performs the restart operation.
(3)
The seawater radioactivity sensor undergoes considerable changes in the measurement position during use, including displacement changes in the horizontal distance and vertical depth.
(4)
Extreme weather conditions such as strong winds, high waves, and heavy rainfall occur in the deployment sea area of the seawater radioactivity sensor.

5. Results and Discussion of Correction Method Verification

5.1. Laboratory Verification

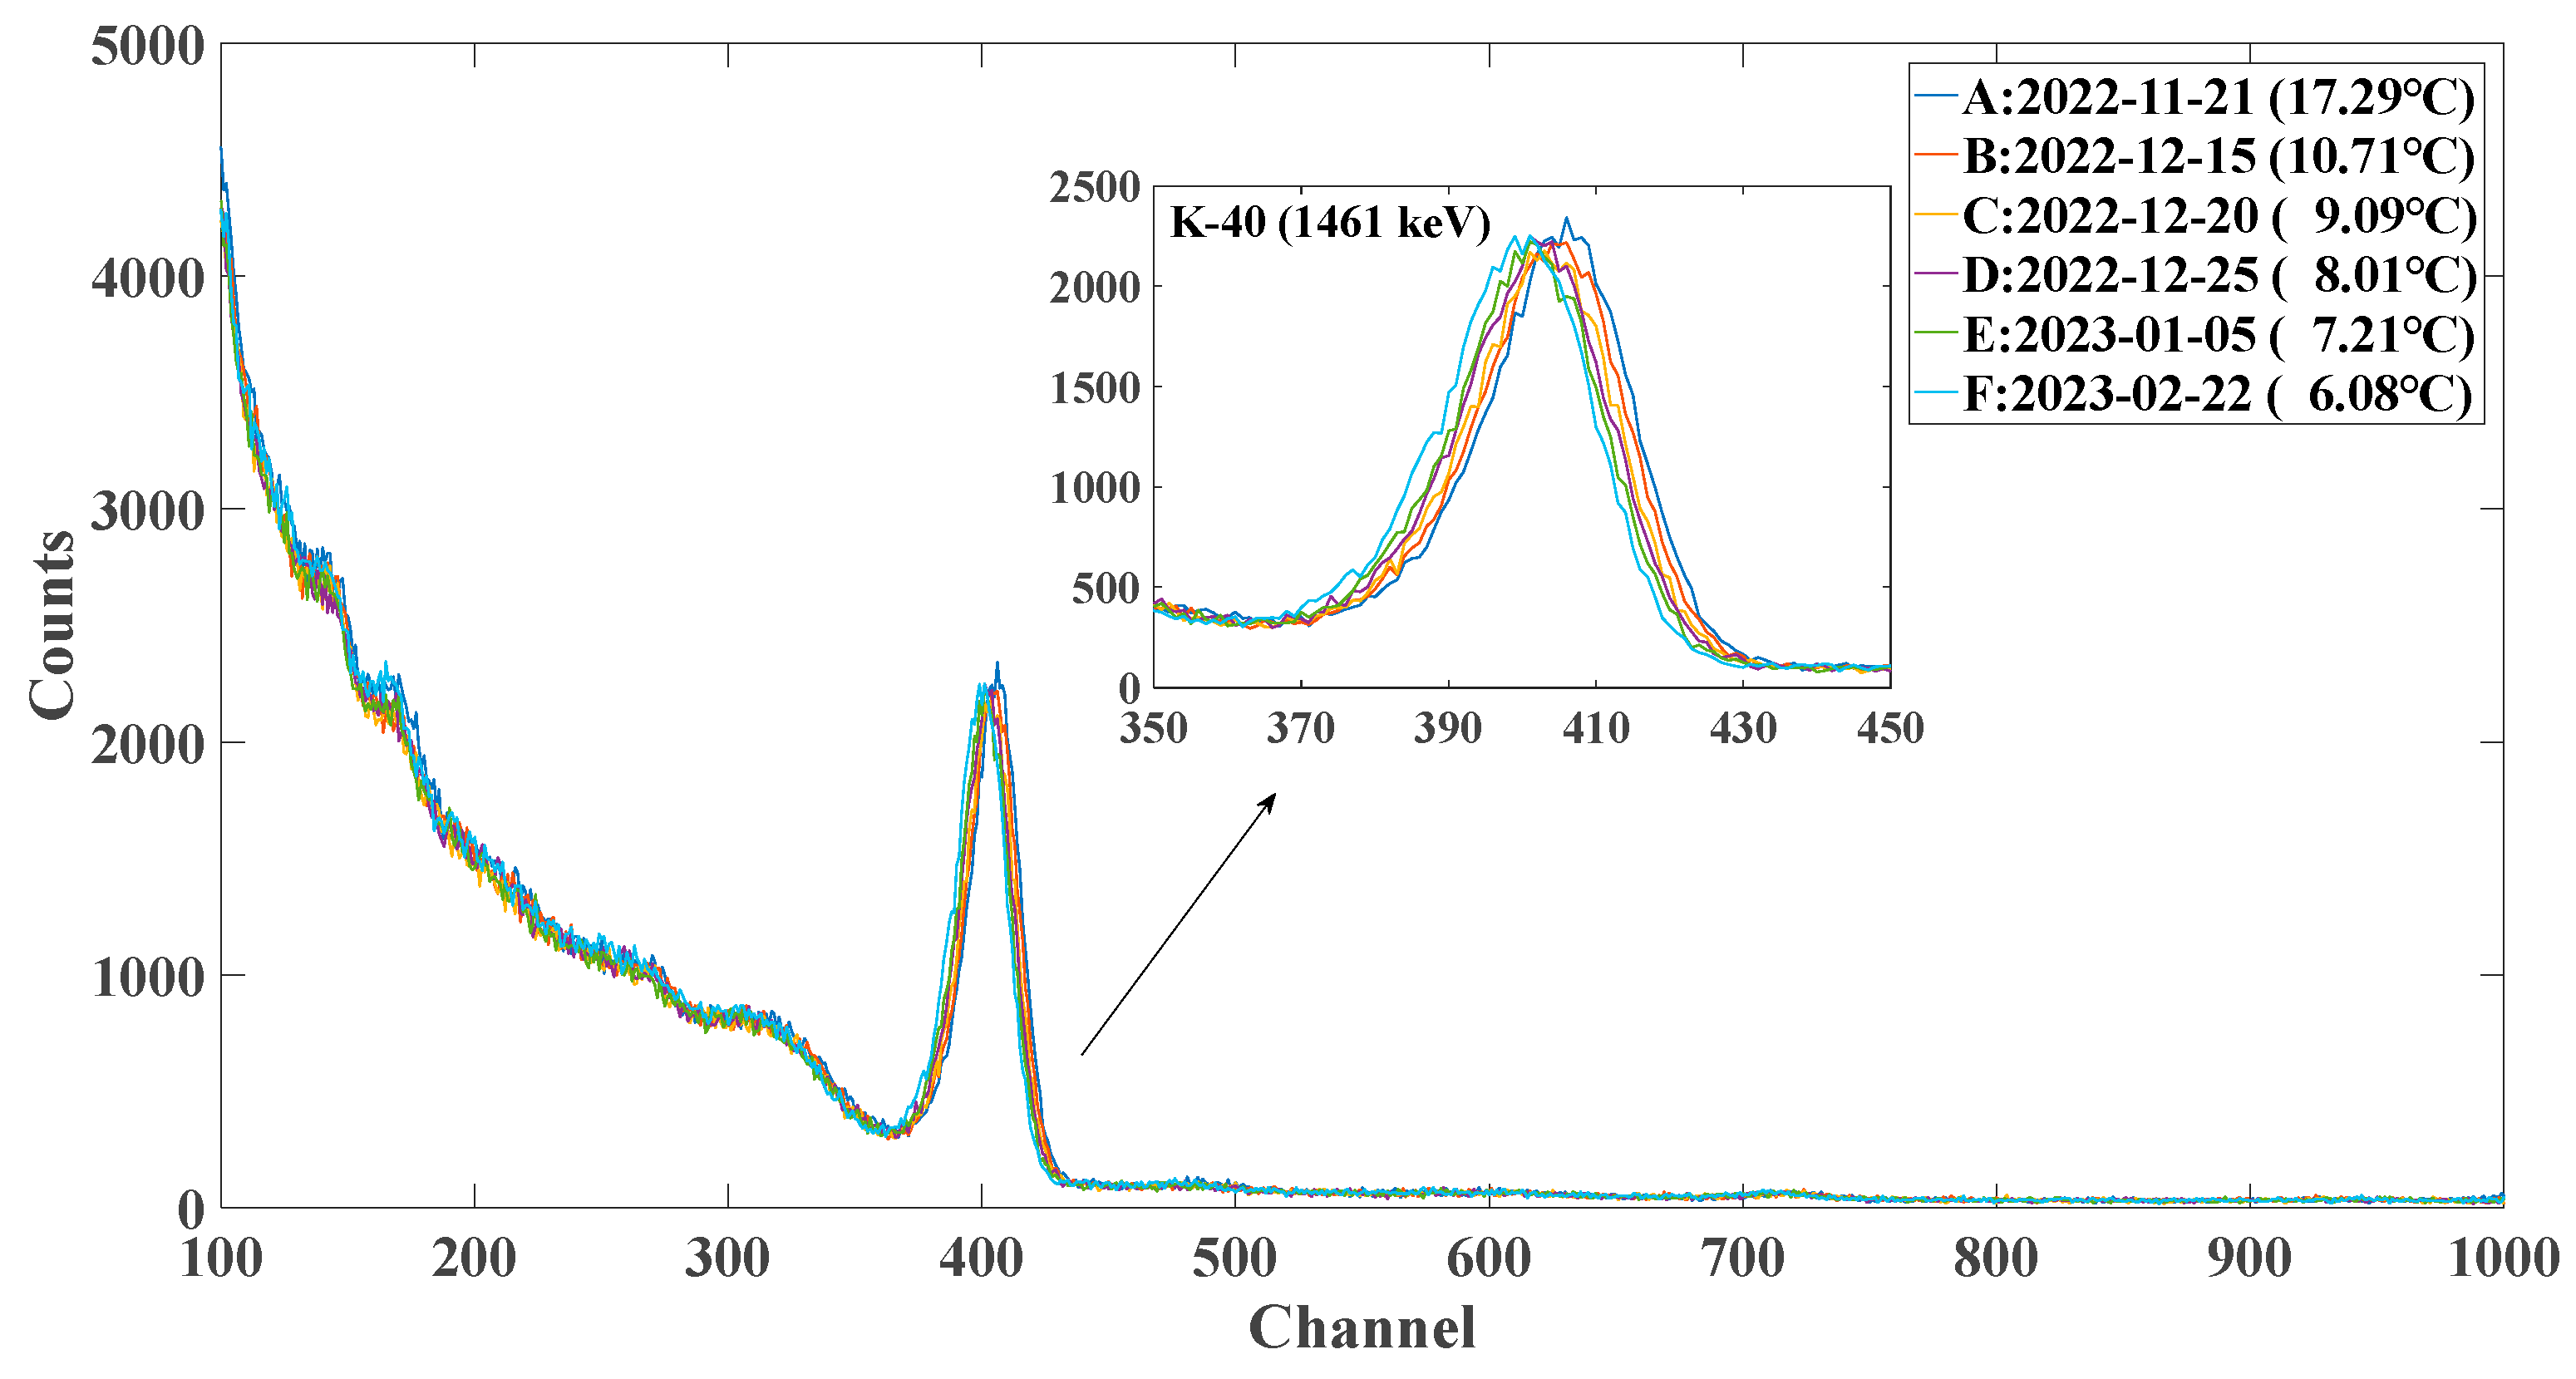
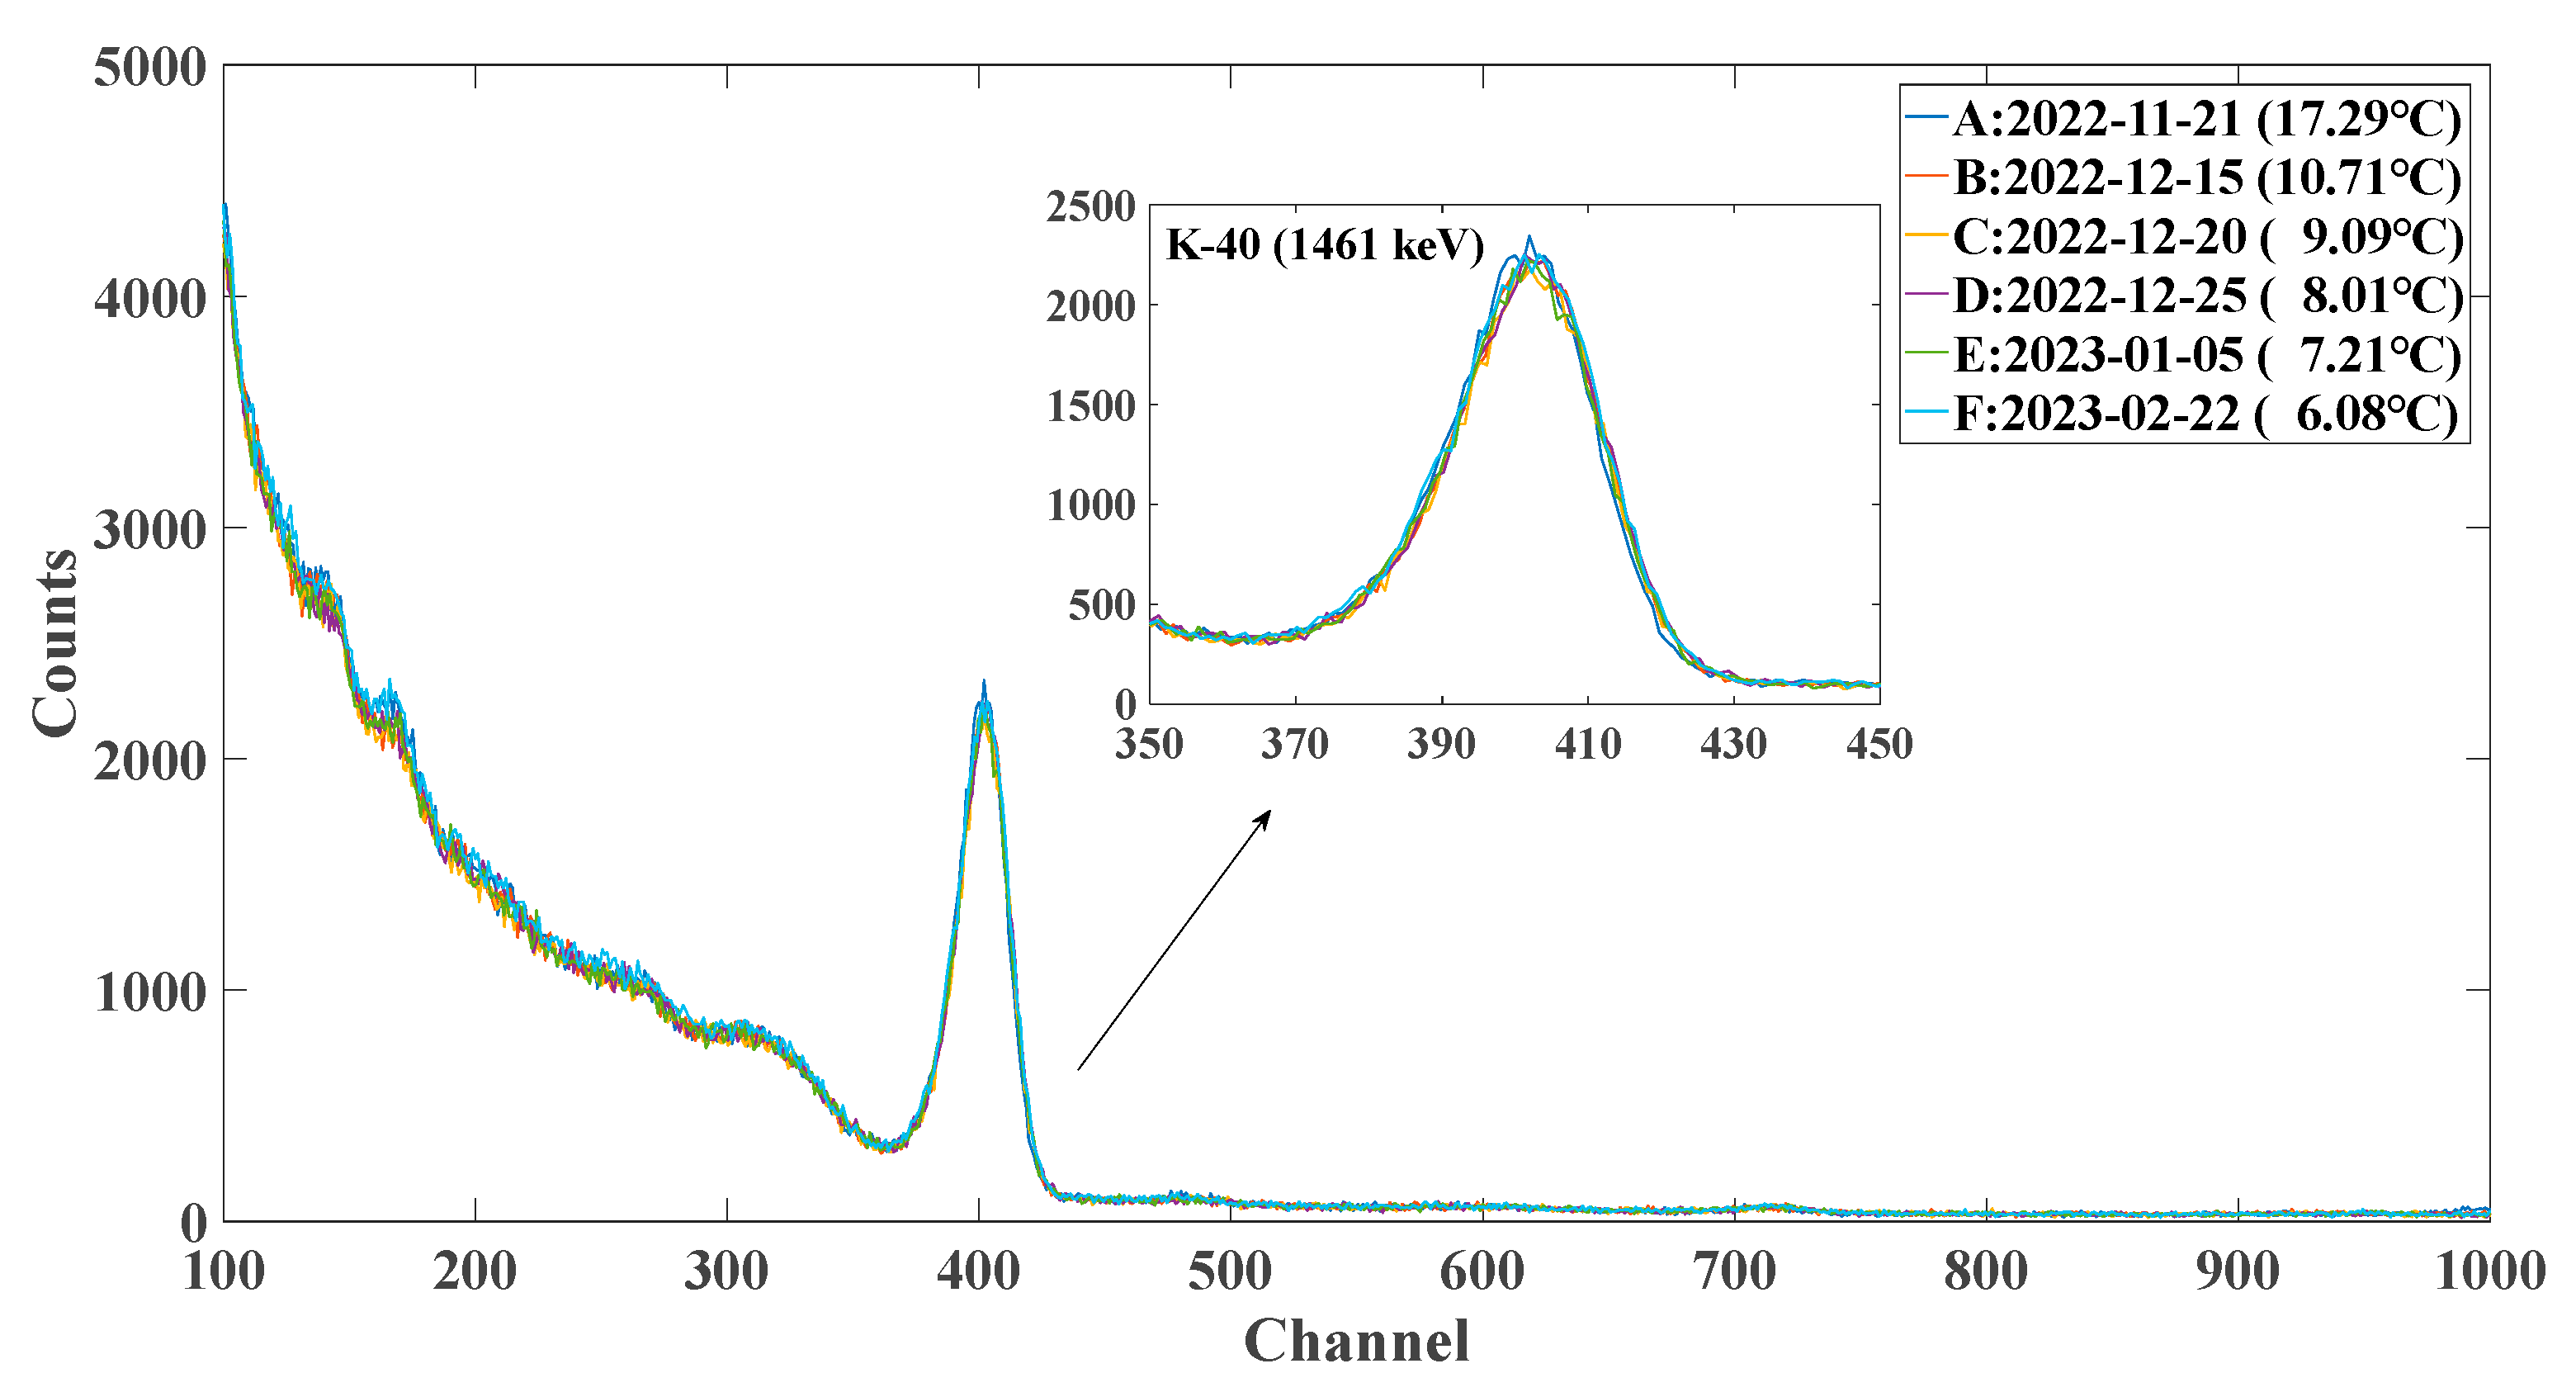
5.1.1. Air Environment Correction Method Verification

The air temperature experiment box was used to verify the effectiveness of the proposed correction method preliminarily for the air environment. The experiment steps were the same as the relationship law between the temperature and the peak position channel address, and multiple measurement cycle verification experiments were conducted.
Before using the correction method in the air environment, the typical spectrum drift during the cooling process (Figure 7) and the typical spectrum drift during the heating process (Figure 8) were obtained. After using the correction method in the air environment, the typical spectrum drift during the cooling process (Figure 9) and the typical spectrum drift during the heating process (Figure 10) were acquired.
Figure 7 and Figure 8 show that before using the correction method, the measured spectrum of each temperature exhibited substantial drift as compared to the reference spectrum, whether during the cooling or heating processes. The amplified 40K (1461 keV) and 208Tl (2614 keV) characteristic peaks show that the spectrum with drift has a considerable deviation in the characteristic peak channel address interval, making identifying radionuclides difficult. Meanwhile, interference with the characteristic peak channel address interval of other radionuclides may lead to misjudgment of radionuclide identification, which may adversely affect the analysis of the spectrum. Additionally, during the long-term operation of the seawater radioactivity sensor at sea, the long-term spectrum needs to be synthesized. If the spectrum drifts, it will cause difficulties and reduce the accuracy of the spectrum synthesis and affect the quantitative analysis of various radionuclides in seawater.
At the low-energy 214Bi (885, 960, and 1120 keV) and middle-energy ends 214Bi (1729, 1764, 2118, and 2204 keV) of the spectrum, the natural characteristic peaks have fewer counts. Radionuclides cannot be distinguished and identified through the energy calibration formula due to the existence of the spectrum peak position channel address drifts at different temperatures.
Figure 9 and Figure 10 show that after using the correction method, the spectrum drift caused by the temperature changes in the measurement environment during cooling and heating processes is eliminated, and the spectrum measured under different temperature conditions coincide with the reference spectrum. For important channel address intervals in the spectrum analysis, such as the enlarged channel address intervals of 40K (1461 keV) and 208Tl (2614 keV) in Figure 9 and Figure 10, the coincidence of the spectrum is good. This result makes the synthesis of long-term measurement more convenient, thereby making the analytical results of long-term continuous automatic measurement spectrum more accurate.
According to the energy calibration formula of the seawater radioactivity sensor, the low-energy end 214Bi (609, 885, 960, and 1120 keV) and the middle-energy end 214Bi (1729, 1764, 2118, and 2204 keV) of the spectrum achieve correction for the characteristic peak drift.
To display and analyze the correction results of the spectrum better, Table 3 presents the situation of the 40K (1461 keV) and 208Tl (2614 keV) peak position channel addresses with temperature changes after correction. The maximum deviation of the 40K (1461 keV) peak position channel address does not exceed ±1 channel, and the maximum deviation of the 208Tl (2614 keV) peak position channel address does not exceed ±2 channels. The results indicate that the correction method proposed in this paper can effectively correct the peak position channel address of the two target radionuclides, 40K (1461 keV) and 208Tl (2614 keV), in the air environment and can effectively correct the drift of the spectrum within the full-spectrum range.

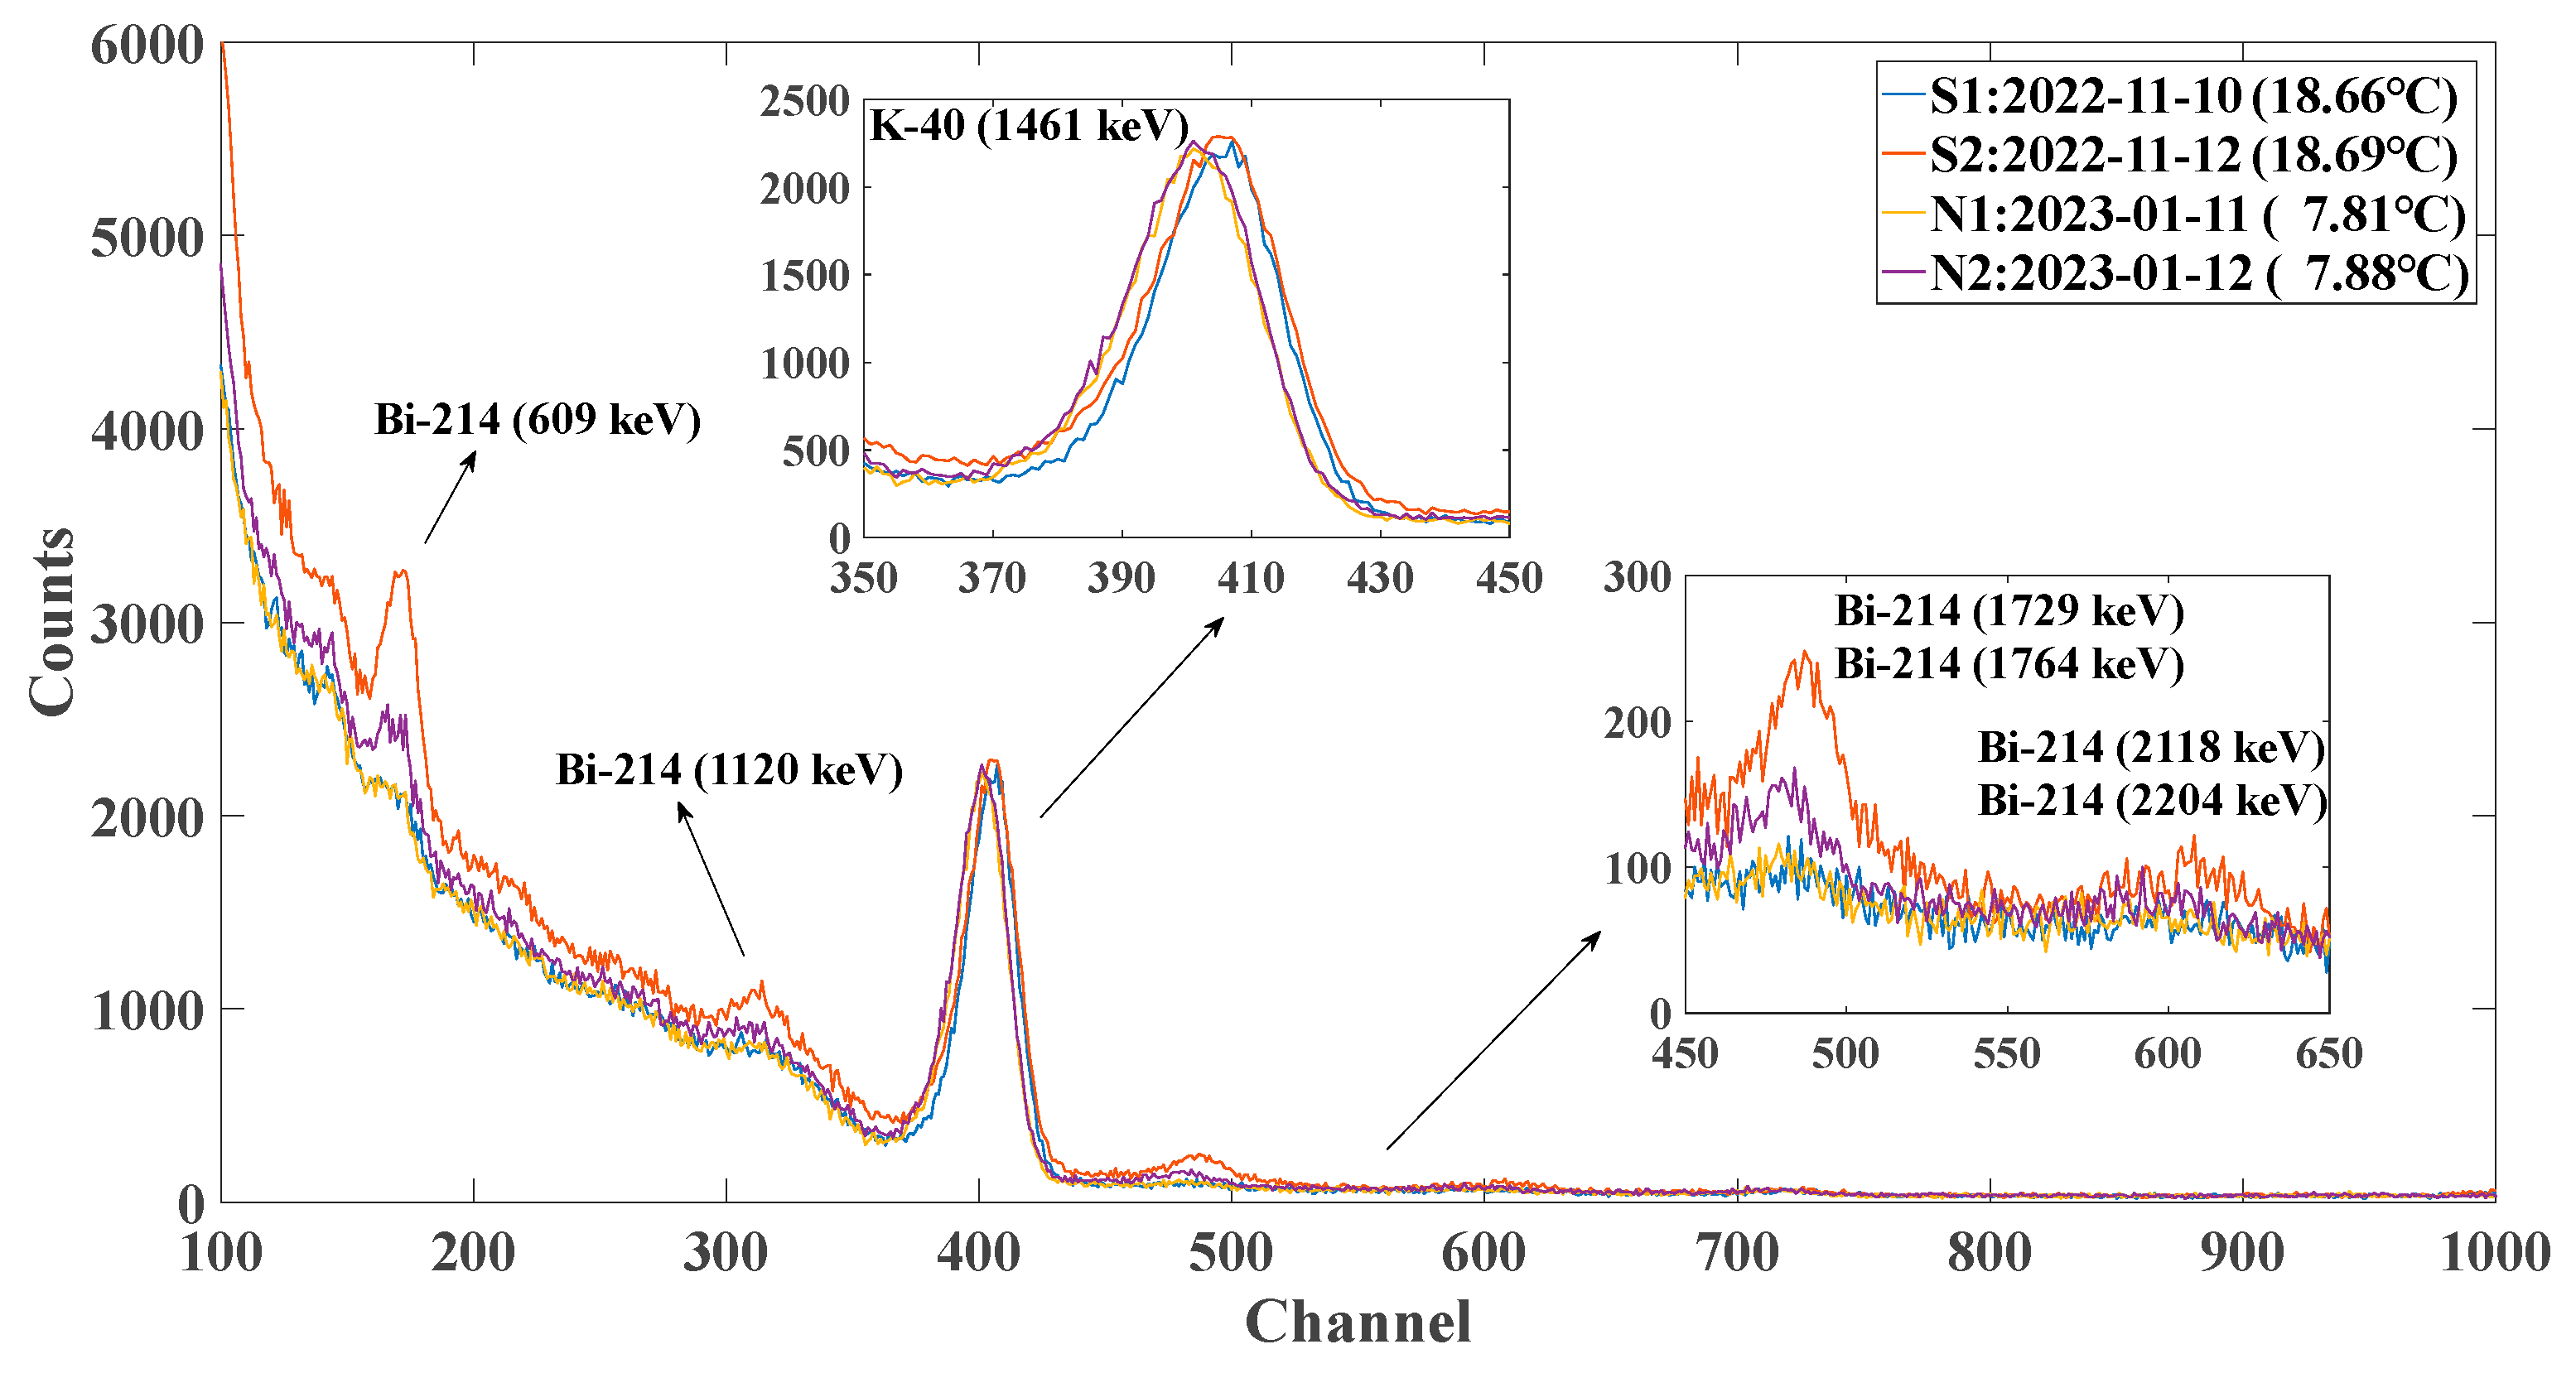
5.1.2. Water Environment Correction Method Verification

The correction method preliminarily verified through the air environment temperature experiment was written into the seawater radioactivity sensor. To simulate the actual working environment of seawater bodies better when the seawater radioactivity sensor was used, a further design experiment was conducted to verify the correction method in the water environment using the water temperature experiment box. Given the presence of the freezing point of the tap water injected into the water temperature experiment box, the temperature variation range was 0 °C to 50 °C, and other experiment settings and steps were the same as those in the air temperature experiment box. The seawater radioactivity sensor was placed as a whole into the water temperature experiment box (shown in Figure 2), and multiple measurement cycle verification experiments were conducted.
Before using the correction method in the water environment, the typical spectrum drift during the cooling process (Figure 11) and the typical spectrum drift during the heating process (Figure 12) were obtained. After using the correction method in the water environment, the typical spectrum drift during the cooling process (Figure 13) and the typical spectrum drift during the heating process (Figure 14) were obtained.
Figure 11 and Figure 12 show that before using the correction method, the spectrum of the water environment drifts with temperature changes, whether during the cooling or heating processes, and the drift situation is similar to that of the air environment. The reason for the decrease in the spectrum counts in the water environment is the shielding effect of water bodies and the water temperature experiment box on the external radiation environments [30].
Figure 13 and Figure 14 show that during the cooling and heating processes of water environment, due to the automatic implementation of the correction method, the spectrum drift caused by the measurement environment temperature changes in the seawater radioactivity sensor is eliminated. The spectrum measured under different temperature conditions can overlap with the reference temperature spectrum. For important channel address intervals of the spectrum analysis, such as the channel address intervals of the two characteristic peaks 40K (1461 keV) and 208Tl (2614 keV), the overlap of the spectrum is good, which is convenient for the synthesis work of the long-term measurement cumulative spectrum, thus making the analysis results of the spectrum obtained from the long-term automatic continuous measurement of the seawater radioactivity sensor more accurate. The 214Bi (609, 885, 960, and 1120 keV) at the low-energy end and the 214Bi (1729, 1764, 2118, and 2204 keV) at the middle-energy end of the spectrum achieve characteristic peak drift corrections.
In the verification experiment of the spectrum drift correction method in the water environment, the peak position channel address corresponding to the two characteristic peaks of 40K (1461 keV) and 208Tl (2614 keV) in the spectrum measured by the seawater radioactivity sensor are shown in Table 4. The 40K (1461 keV) peak position channel address completely eliminates drift, and the maximum drift of the 208Tl (2614 keV) peak position channel address does not exceed ±1 channel. The results indicate that the correction method proposed in this paper can effectively correct the peak position channel address of the two target radionuclides 40K (1461 keV) and 208Tl (2614 keV) in the water environment and can effectively correct the spectrum drift within the full-spectrum range.

5.2. Seawater Onsite Verification

The seawater radioactivity sensor was deployed to the offshore experiment platform at the Badaxia Wharf (N 36°05′, E 120°30′) in the Yellow Sea, China. The seawater radioactivity sensor was fixed on a steel frame and sunk into a vertical shaft of the offshore experiment platform (shown in Figure 15). The depth of the vertical shaft was about 5 m, and the seawater radioactivity sensor entered the seawater at a depth of about 3 m, with a depth greater than 2 m from the seabed. This depth considered the effects of cosmic rays and other radioactive environments such as seabed sediments [31,32,33], making the measurement of the seawater radioactivity environment by the seawater radioactivity sensor more accurate.
The reference spectrum was set to the measured spectrum at a temperature of 25 °C, and the reference peak was set to the natural characteristic peak of 40K (1461 keV) formed by the large number of 40K radionuclide present in the seawater. The working mode of the seawater radioactivity sensor was set to the continuous automatic measurement mode, with single-spectrum measurement time of 20 min, and the measured seawater spectrum before and after each correction was automatically saved.
On 7 October 2022, the seawater radioactivity sensor was successfully deployed to the offshore experiment platform for the experiment. As of 6 March 2023, the seawater radioactivity sensor had undergone 151 days of continuous experimentation on the offshore experiment platform, successfully obtaining a large amount of seawater spectra. The following section analyzes the measured seawater spectra from two aspects.

5.2.1. Drift Correction under Normal Weather Conditions

Only the characteristic peak of natural radionuclide 40K (1461 keV) can be clearly observed in the measured seawater spectrum due to the deployment location of the seawater radioactivity sensor, which shields the effects of other radiation environments as much as possible. Therefore, the correction effect analysis was conducted using the characteristic peak of 40K (1461 keV) as an example. Temperature changes were slower in the seawater environment than in the terrestrial air environment. According to the temperature measurement data, the temperature range of the seawater radioactivity sensor during the entire experiment was 6.03 °C to 21.19 °C. According to the data analysis obtained from the temperature experiments conducted in the laboratory earlier, the drift of the spectrum is not very severe within this temperature range. Taking 24 h as the cumulative time unit of the spectrum, the representative spectrum was selected for analysis. The measured seawater spectrum before correction is shown in Figure 16.
Figure 16 shows the measured seawater spectrum, in late November to early December, had the greater temperature drops registered from 17.29 °C to 10.71 °C. However, the drift of the 40K (1461 keV) peak position channel address with the temperature is not the most severe. The most severe month of the drift at the 40K (1461 keV) peak position channel address is from the middle of December to early January, corresponding to the spectra of B, C, D, and E. The reason for this phenomenon is that the drift law of the seawater radioactivity sensor is a quadratic function relationship. Although A and B have large temperature changes, the 40K (1461 keV) peak position channel address drift is small because A and B are in a slow range of spectrum drift, as is shown in Figure 4 (Section 3.1). Although the temperature changes of B, C, D, E, and F are small, the drift of the 40K (1461 keV) peak position channel address is large because B, C, D, E, and F are in the range of intense drift changes in the spectrum.
Figure 17 shows the measured seawater spectrum corrected using combined correction methods, corresponding to the seawater gamma spectrum in Figure 16. The 40K (1461 keV) characteristic peaks of spectra A, B, C, D, E, and F eliminate the drift, and they overlap well. The coincidence of the low-energy end of the spectrum is also better than the uncorrected. With this good foundation, when long-term measured seawater spectra need to be synthesized, the obtained measured seawater spectra will be more accurate, and the resolution of characteristic peak will be better.

5.2.2. Drift Correction under Precipitation Weather Conditions

Precipitation can wash suspended solids of radioactivity in the air and dust can carry radioactive substances from land into seawater [34,35,36,37], leading to an increase in the background level of seawater radioactivity [38,39,40]. Precipitation may also affect the performance of the seawater radioactivity sensor, causing spectrum to drift. During the deployment of the seawater radioactivity sensor to the offshore experiment platform for the experiment, precipitation monitoring was also carried out, and the two recorded precipitation processes corresponding to the S2 and N2 spectra are shown in Figure 18. When precipitation occurs, the counts of measured seawater spectra substantially increase, and the degree of change is positively correlated with the precipitation. Further analysis shows that the temperatures of S1 and S2, N1 and N2 are almost the same, but due to the influence of precipitation, the peak position channel addresses of 214Bi (609, 1120, 1729, 1764, 2118, and 2204 keV) undergo substantial drift.
In Figure 19, S1, S2, N1, and N2, the corrected spectra are obtained by automatically using the correction method, corresponding to the spectra in Figure 18. Whether the 40K (1461 keV) or the 214Bi (609, 1120, 1729, 1764, 2118, and 2204 keV) characteristic peak increases due to precipitation, the peak position channel address is automatically corrected back to the position of the reference peak position channel address. Under the same counts, the coincidence of the measured seawater spectrum is also good. This finding indicates that the correction method proposed in this paper can correct the spectrum drift within the full-spectrum range in special working environments such as actual precipitation, and its effectiveness and stability can meet the requirements of practical applications.

6. Conclusions

This paper studies and discusses the relationship laws between the temperature and peak position channel address and between the gain and the peak position channel address of the NaI(Tl) seawater radioactivity sensor through experiment analysis methods. On this basis, the drift correction method for the NaI(Tl) seawater radioactivity sensor that combines gain adjustment and spectrum processing is proposed. The following main conclusions are drawn:
(1)
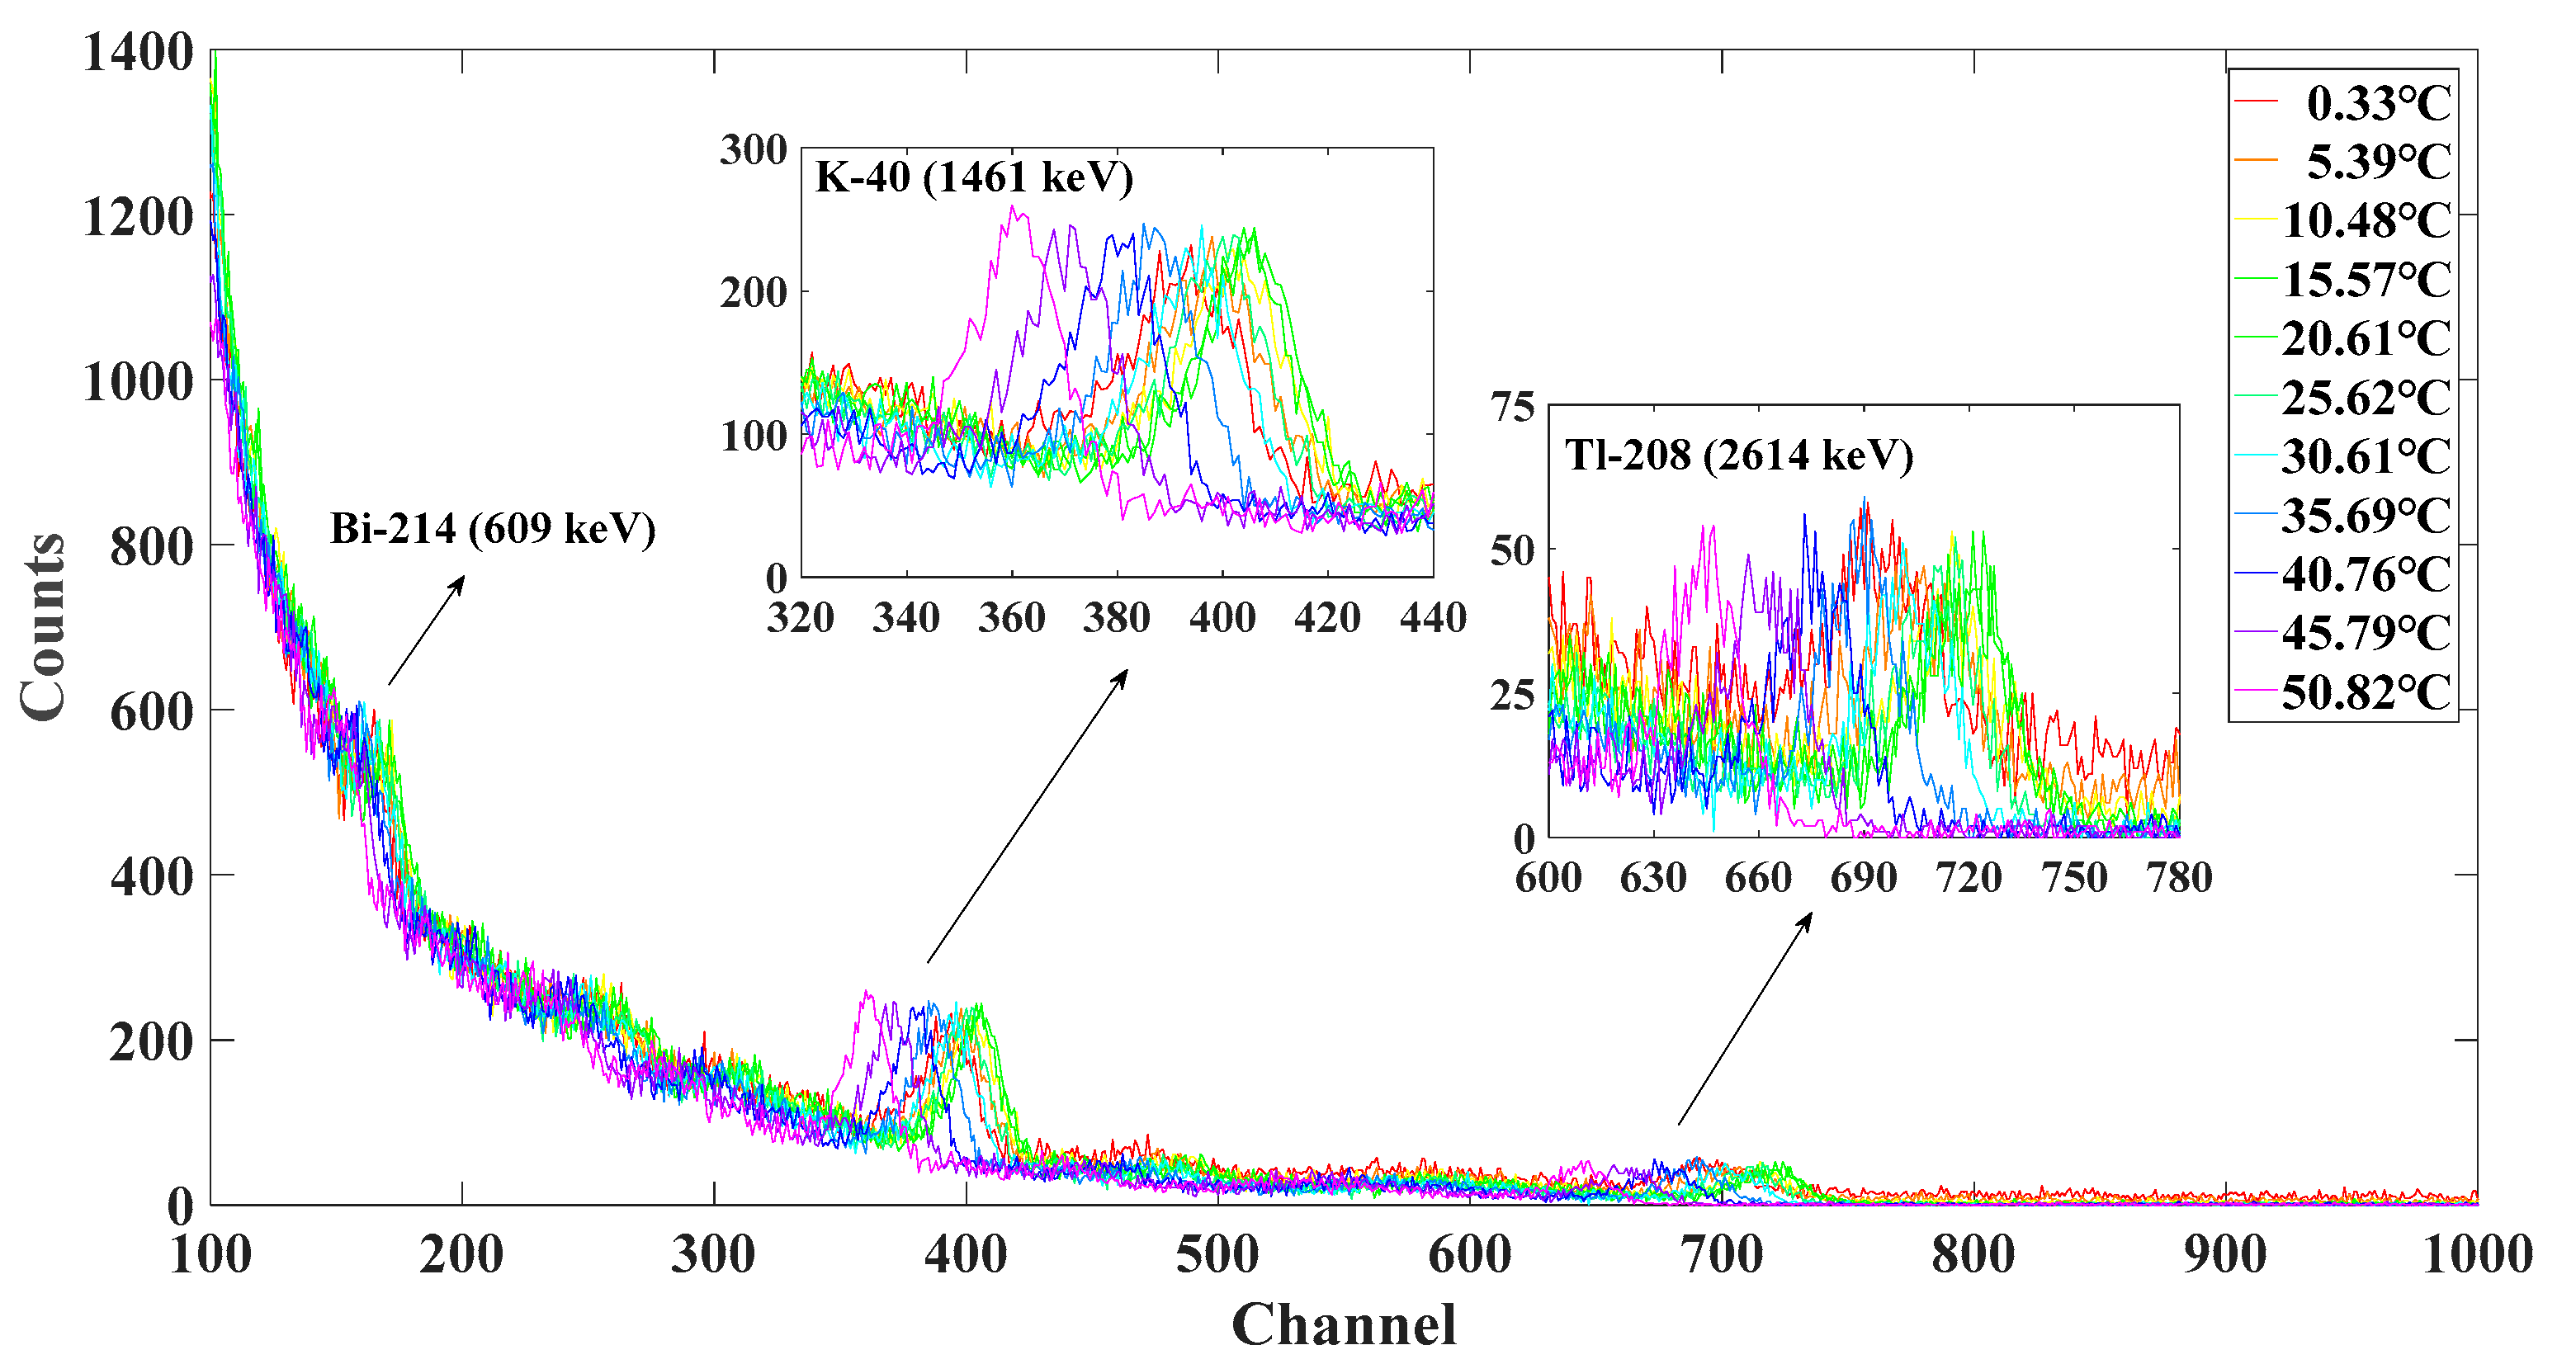
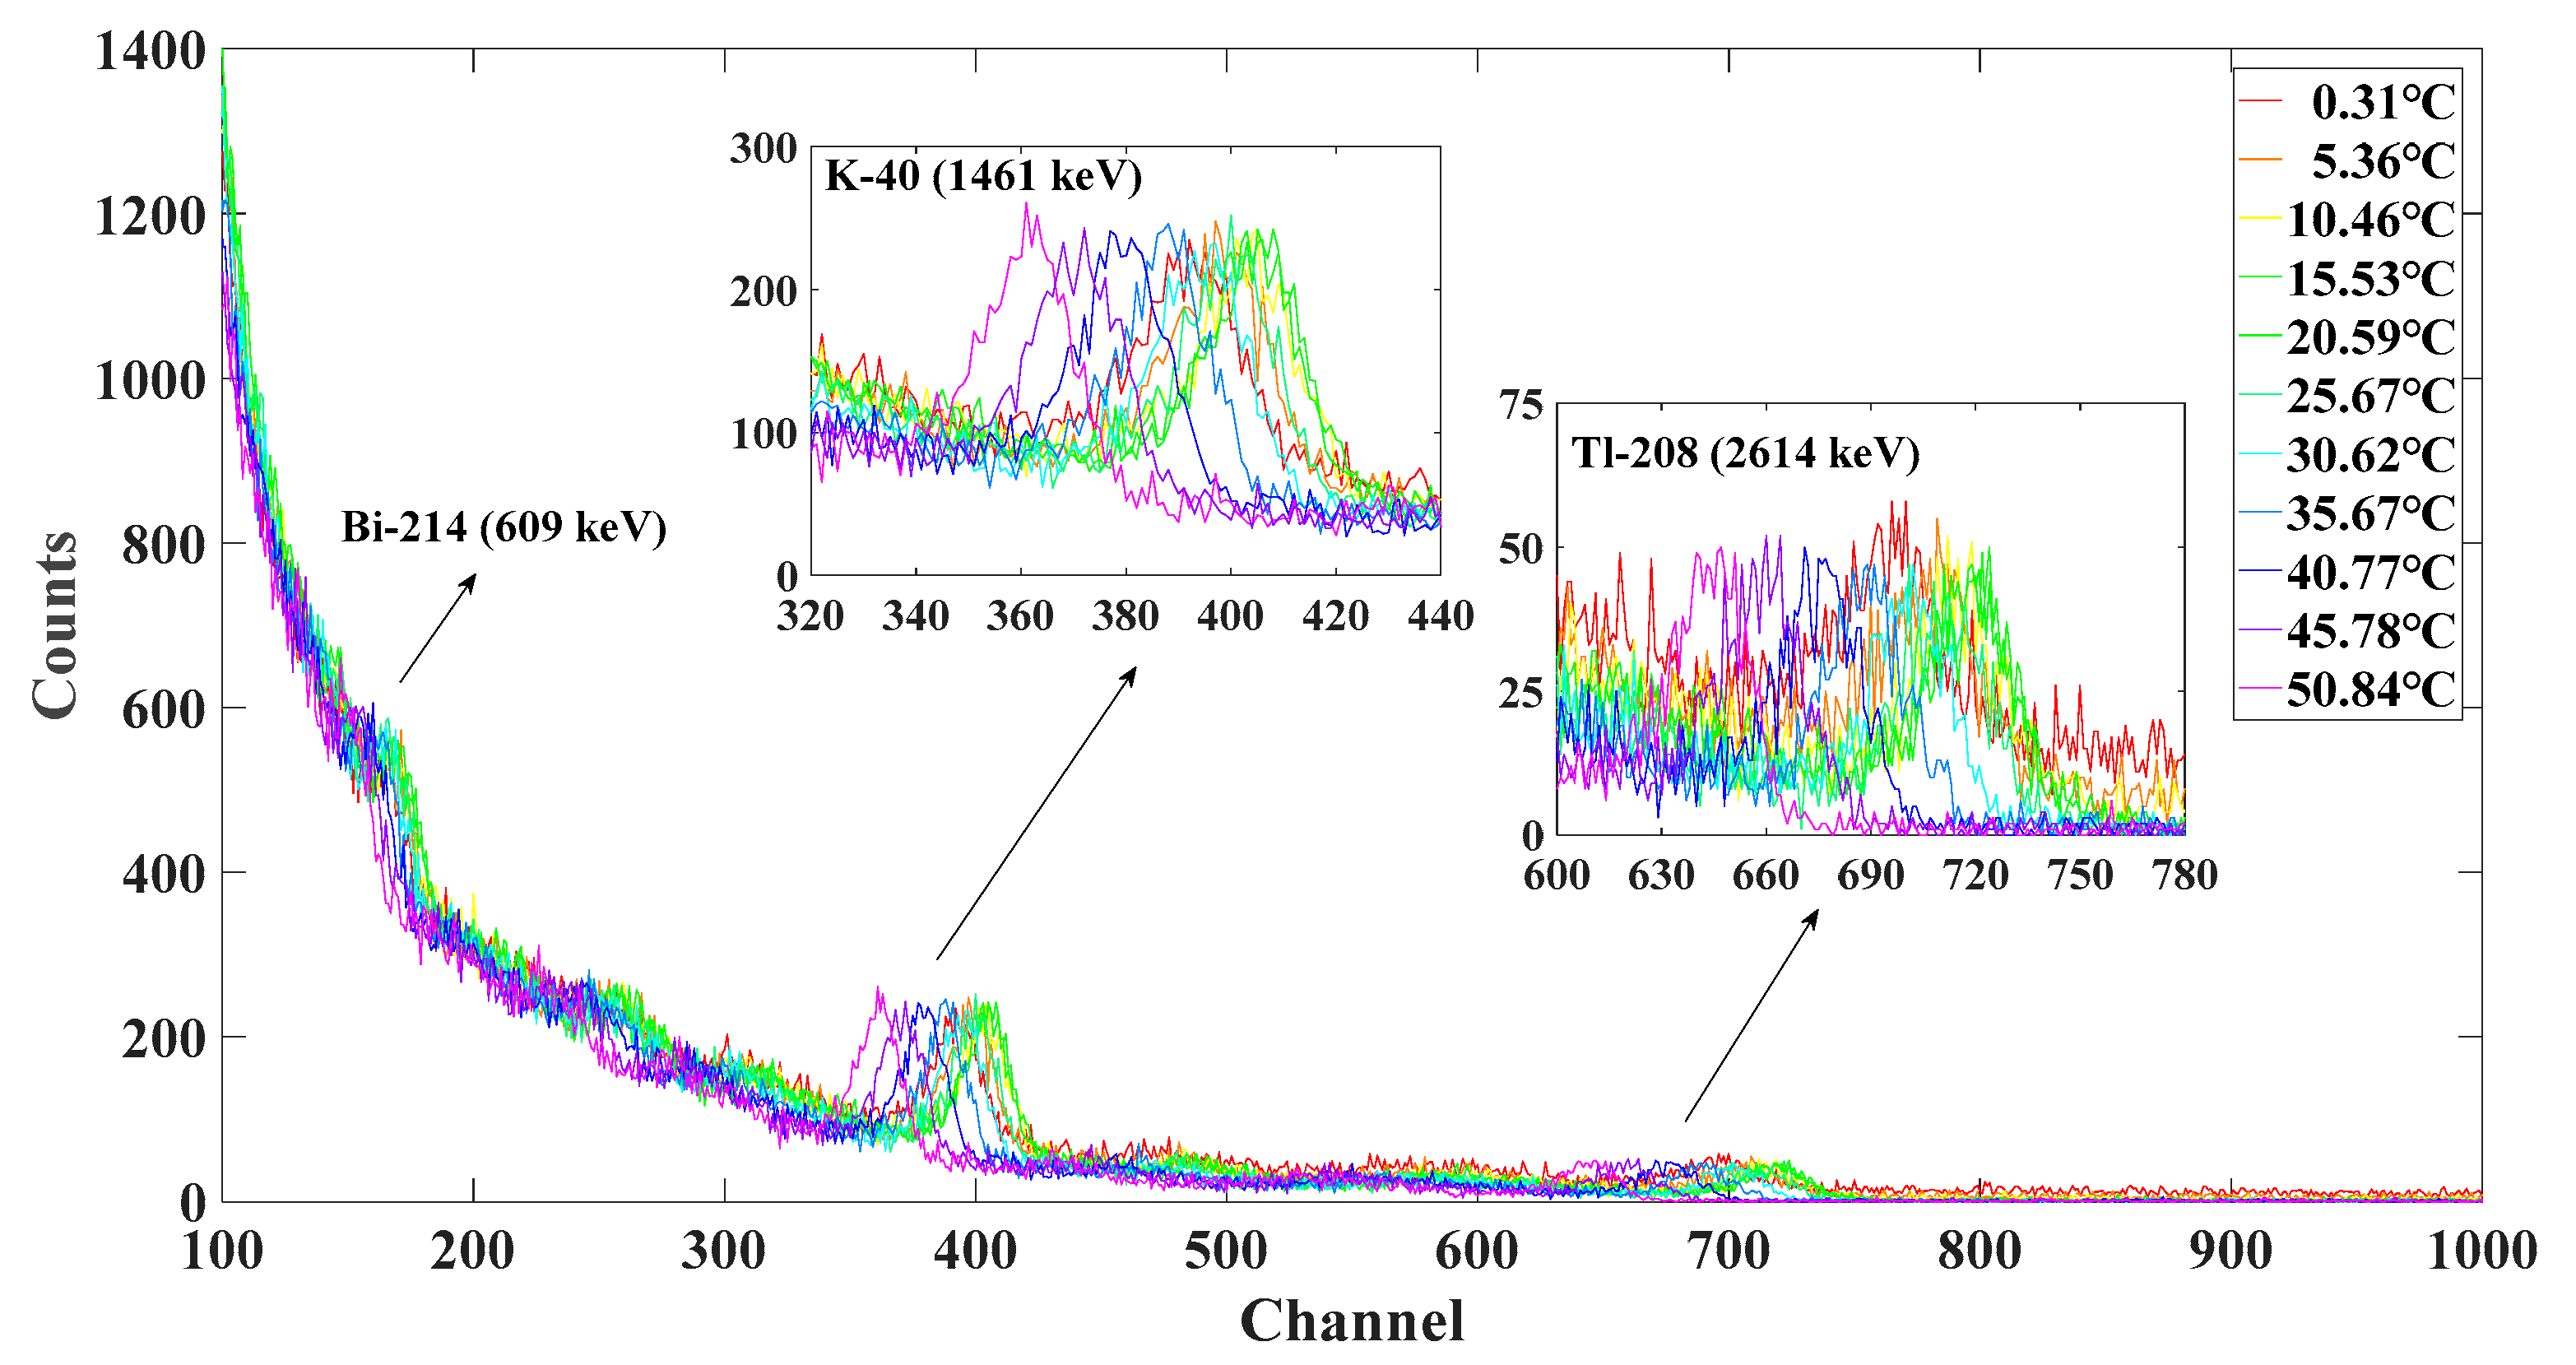
When the environment temperature of the seawater radioactivity sensor changes, the peak position channel address is the quadratic function of the temperature, and the inflection point of the peak position channel address change is 15 °C. When the temperature is lower than 15 °C, the peak position channel address increases with the increase of temperature. When the temperature is higher than 15 °C, the peak position channel address decreases with the increase of temperature.
(2)
The drift of different radionuclide characteristic peak positions has the same proportion relationship. The larger the value of the peak position channel address is, the larger the drift amplitude of peak position with the temperature. The smaller the value of the peak position channel address is, the smaller the drift amplitude of the peak position with the temperature.
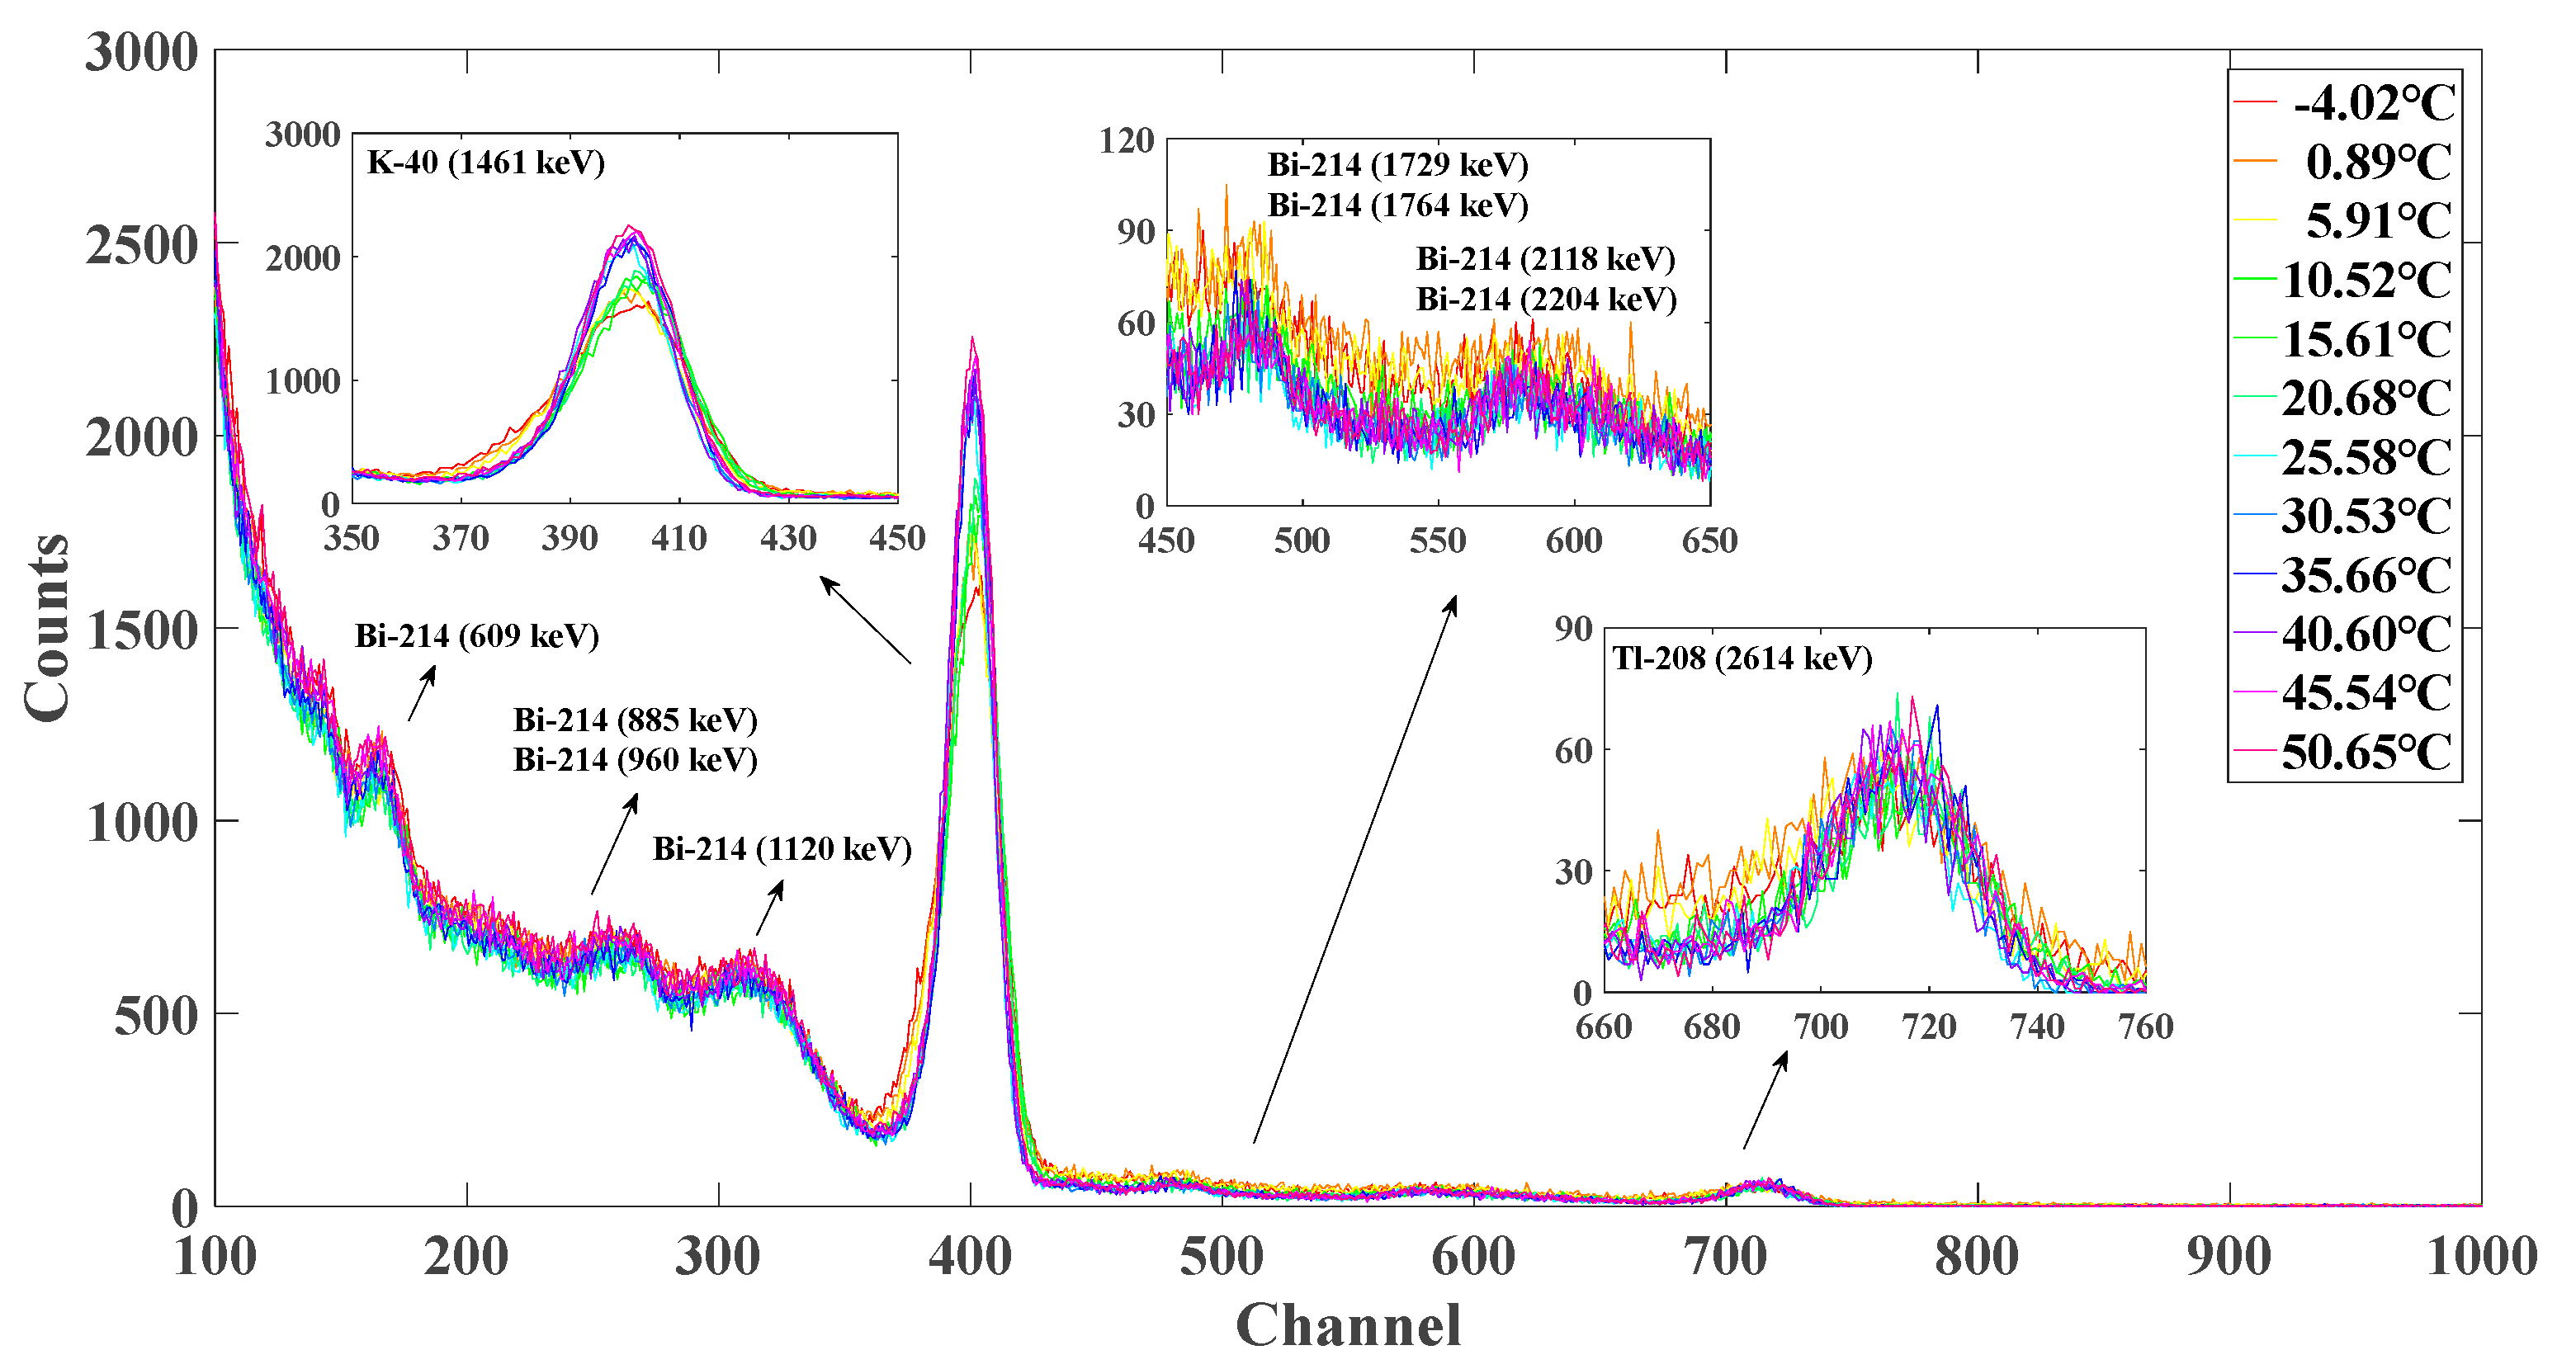
(3)
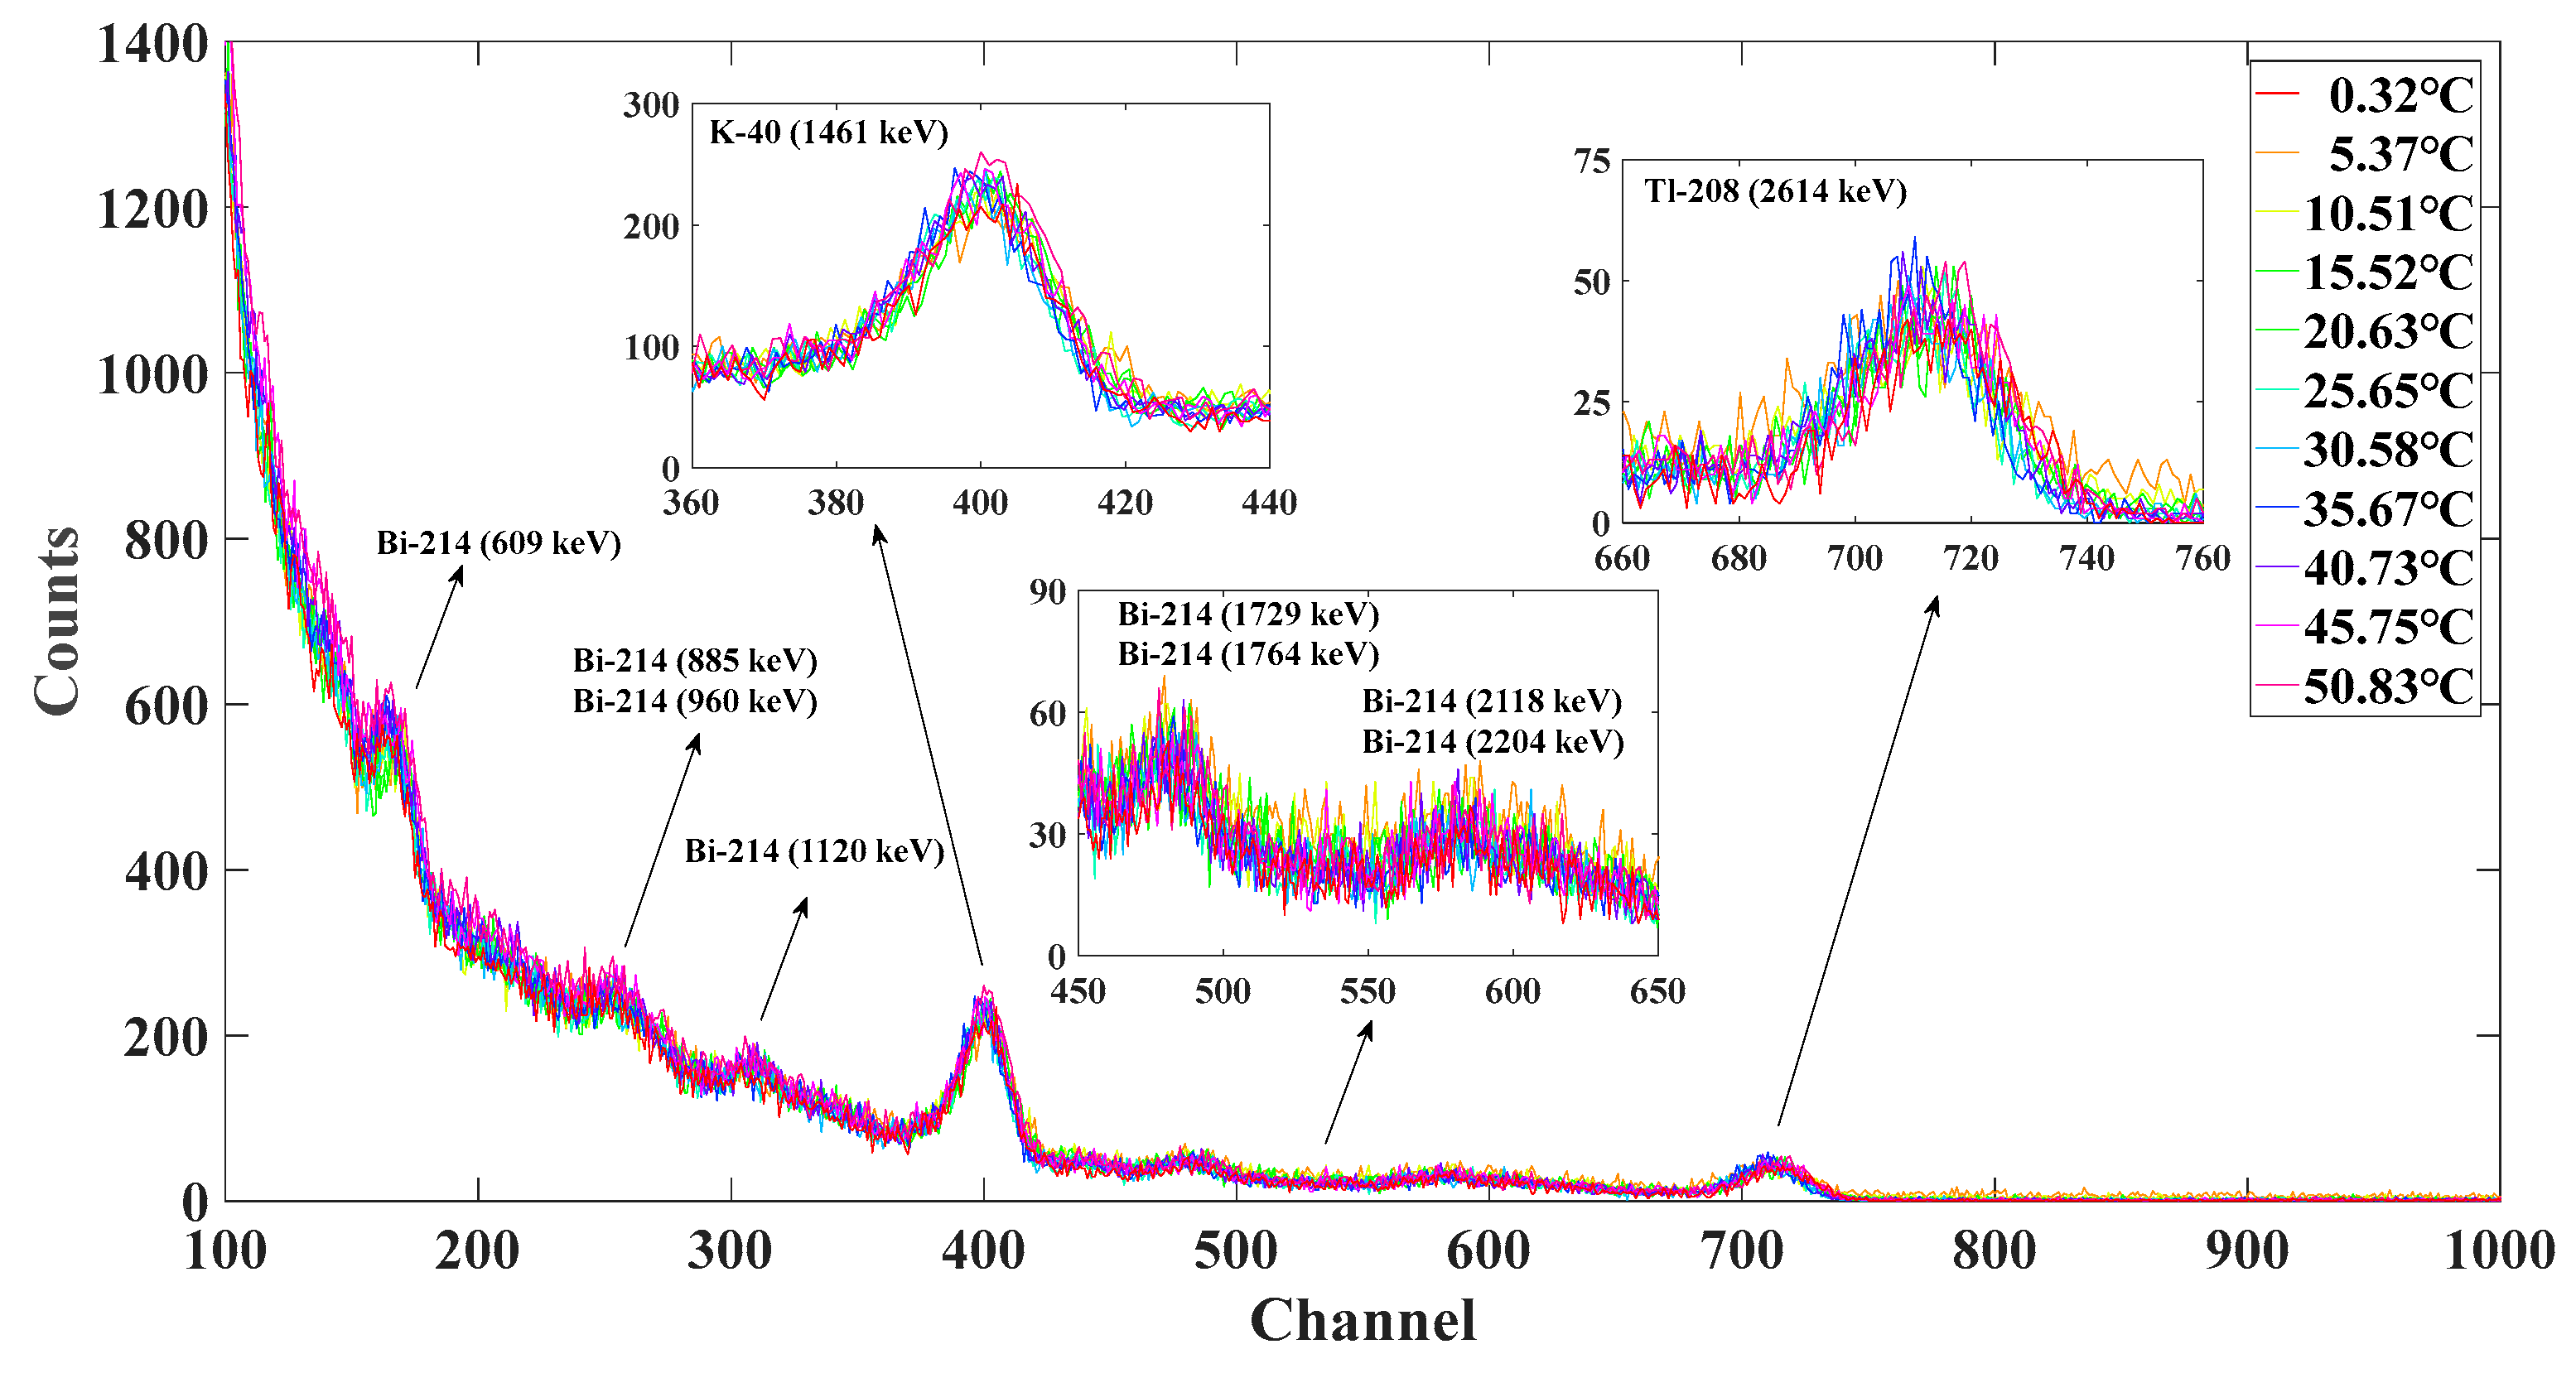
The laboratory verification experiment results show that after using the correction method, the coincidence of the spectrum at different temperatures is high, and the maximum number of peak position channel address drifts does not exceed ±2 channels. The verification experiment shows that the correction method can effectively correct the drift of the spectrum measured by the seawater radioactivity sensor, and the effectiveness and accuracy of the correction method can meet the drift correction requirements.
(4)
The long-term experiment results of the seawater work site indicate that the correction method can correct the drift of the actual working scene and state of the seawater radioactivity sensor, and the effectiveness and stability of the correction method are very high.
The highlights of the correction method only use a natural characteristic peak of 40K (1461 keV) without the need for any reference standard sources or modifications to the hardware structure of the seawater radioactivity sensor. Compared with traditional correction methods, the correction method has the advantages of low algorithm complexity and simple flow configuration. The temperature gradients are more evident when the radioactivity sensor operates in the atmospheric environment as compared to the radioactivity sensor operation in the marine environment, and thus this study may play a crucial role for monitoring activities in the atmosphere in order to study air-sea interactions.

Author Contributions

Y.S.: Conceptualization, data curation, formal analysis, investigation, methodology, resources, software, validation, visualization, writing—original draft, writing—review and editing; Y.Z.: funding acquisition, project administration, supervision, writing—review and editing; X.F.: investigation, resources, validation; D.Y.: resources, writing—review and editing; B.W.: investigation, resources; H.B.: resources. All authors have read and agreed to the published version of the manuscript.

Funding

This work is supported by Taishan Scholar Program, Education and Production Integration Project of Qilu University of Technology (Shandong Academy of Sciences) (No. 2022JBZ01-02-02), Science and Technology Innovation Project of Laoshan Laboratory (No. 2021WHZZB0202; No. LSKJ202204602), Key Research and Development Program of Shandong Province (No. 2023CXPT015), National Key Research and Development Program of China (No. 2023YFC2812900), and National Natural Science Foundation of China (No. U2006222; No. 41606111).

Data Availability Statement

Data will be made available on request.

Conflicts of Interest

The authors declare no conflicts of interest.

References

  1. Kumar, K.A.; Sundaram, G.A.; Sharma, B.K.; Venkatesh, S.; Thiruvengadathan, R. Advances in gamma radiation detection systems for emergency radiation monitoring. Nucl. Eng. Technol. 2020, 52, 2151–2161. [Google Scholar] [CrossRef]
  2. Androulakaki, E.G.; Kokkoris, M.; Tsabaris, C.; Eleftheriou, G.; Patiris, D.L.; Pappa, F.K.; Vlastou, R. In Situ γ-ray spectrometry in the marine environment using full spectrum analysis for natural radionuclides. Appl. Radiat. Isot. 2016, 114, 76–86. [Google Scholar] [CrossRef]
  3. Ianakiev, K.D.; Alexandrov, B.S.; Littlewood, P.B.; Browne, M.C. Temperature behavior of NaI(Tl) scintillation detectors. Nucl. Instrum. Meth. A 2009, 607, 432–438. [Google Scholar] [CrossRef]
  4. Metwally, W.A.; Gardner, R.P. Stabilization of prompt gamma-ray neutron activation analysis (PGNAA) spectra from NaI detectors. Nucl. Instrum. Meth. A 2004, 525, 518–521. [Google Scholar] [CrossRef]
  5. Moszyński, M.; Nassalski, A.; Każuch, A.; Szczęśniak, T.; Czarnacki, W.; Wolski, D.; Pausch, G.; Stein, J. Temperature dependences of LaBr3(Ce), LaCl3(Ce) and NaI(Tl) scintillators. Nucl. Instrum. Meth. A 2006, 568, 739–751. [Google Scholar] [CrossRef]
  6. Tsabaris, C.; Prospathopoulos, A. Automated quantitative analysis of in-situ NaI measured spectra in the marine environment using a wavelet-based smoothing technique. Appl. Radiat. Isot. 2011, 69, 1546–1553. [Google Scholar] [CrossRef] [PubMed]
  7. Vlachos, D.S. Self-calibration techniques of underwater gamma ray spectrometers. J. Environ. Radioact. 2005, 82, 21–32. [Google Scholar] [CrossRef]
  8. Saucke, K.; Pausch, G.; Stein, J.; Ortlepp, H.G.; Schotanus, P. Stabilizing scintillation detector systems with pulsed LEDs: A method to derive the LED temperature from pulse height spectra. IEEE Trans. Nucl. Sci. 2005, 52, 3160–3165. [Google Scholar] [CrossRef]
  9. Schroettner, T.; Kindl, P. Long term comparison of methods to sustain energy calibration in low level gamma-ray spectroscopy and investigation of possible sources for drift. Appl. Radiat. Isot. 2010, 68, 164–168. [Google Scholar] [CrossRef]
  10. Choi, Y.; Kim, K.J.; Park, K.; Kim, Y. A LaBr3(Ce) detector system with a simple spectral shift correction method for applications in harsh environments. Radiat. Meas. 2021, 142, 106567. [Google Scholar] [CrossRef]
  11. Qiu, M.; Jia, W.; Hei, D.; Sun, A.; Li, J. Digital stabilization algorithm for the gamma spectra of scintillator detectors in PGNAA. IEEE Trans. Nucl. Sci. 2022, 69, 113–117. [Google Scholar] [CrossRef]
  12. Wang, C.; Zhang, Q.; Sun, Y.; Liu, J.; Zhou, Y.; Zhang, M. A new numerical correction method for gamma spectra based on the system transformation theory of random signals. Appl. Radiat. Isot. 2021, 172, 109671. [Google Scholar] [CrossRef] [PubMed]
  13. Zeng, G.; Tan, C.; Ge, L.; Zhang, Q.; Gu, Y. Frequency spectrum analysis for spectrum stabilization in airborne gamma-ray spectrometer. Appl. Radiat. Isot. 2014, 85, 70–76. [Google Scholar] [CrossRef] [PubMed]
  14. Zhang, Y.; Wang, J.; Vorontsov, A.M.; Hou, G.; Nikanorova, M.N.; Wang, H. Using a neural network approach and time series data from an international monitoring station in the yellow sea for modeling marine ecosystems. Environ. Monit. Assess. 2014, 186, 515–524. [Google Scholar] [CrossRef] [PubMed]
  15. Zhang, Y.; Wu, B.; Liu, D.; Zhang, Y.; Cheng, Y. Development and deployment of an autonomous sensor for the in-situ radioactivity measurement in the marine environment. Appl. Radiat. Isot. 2018, 142, 181–186. [Google Scholar] [CrossRef] [PubMed]
  16. Datar, G.; Vichare, G.; Selvaraj, C.; Bhaskar, A.; Raghav, A. Causes of the diurnal variation observed in gamma-ray spectrum using NaI(Tl) detector. J. Atmos. Sol. Terr. Phys. 2020, 207, 105369. [Google Scholar] [CrossRef]
  17. Kumar, K.A.; Sundaram, G.A.; Thiruvengadathan, R. Advances in detection algorithms for radiation monitoring. J. Environ. Radioact. 2020, 217, 106216. [Google Scholar] [CrossRef] [PubMed]
  18. Wang, J.; Zhang, Y.; Liu, D.; Wu, B.; Zhang, Y.; Jiang, H. Automated spectra analysis of in situ radioactivity measurements in the marine environment using NaI(Tl) detector. Appl. Radiat. Isot. 2018, 141, 88–94. [Google Scholar] [CrossRef]
  19. Wang, Y.; Zhang, Y.; Wu, N.; Wu, B.; Liu, Y.; Cao, X.; Wang, Q. Monte Carlo simulation of in situ gamma-spectra recorded by NaI(Tl) detector in the marine environment. J. Ocean. Univ. 2015, 14, 471–474. [Google Scholar] [CrossRef]
  20. Naumenko, A.; Andrukhovich, S.; Kabanov, V.; Kabanau, D.; Kurochkin, Y.; Martsynkevich, B.; Shoukavy, D.; Shpak, P. Autonomous NaI(Tl) gamma-ray spectrometer for in situ underwater measurements. Nucl. Instrum. Meth. A 2018, 908, 97–109. [Google Scholar] [CrossRef]
  21. Mitra, P.; Roy, S.A.; Verma, A.K.; Pant, A.D.; Prakasha, M.S.; Anilkumar, S.; Vinod Kumar, A. Application of spectrum shifting methodology to restore NaI(Tl)-recorded gamma spectra, shifted due to temperature variations in the environment. Appl. Radiat. Isot. 2016, 107, 133–137. [Google Scholar] [CrossRef] [PubMed]
  22. Hung, D.T.; Cao, V.H.; Khang, P.D.; Hai, N.X.; Anh, N.N.; Dinh, D.A.; Hao, T.V.N.; Pham, V. Gamma spectrum stabilization for environmental radiation monitoring stations using NaI(Tl) detector. Radiat. Prot. Dosim. 2020, 189, 48–55. [Google Scholar] [CrossRef] [PubMed]
  23. Chen, Y.; Li, J.; Zhang, Y.; Xiao, W. Gamma spectrum stabilization method based on nonlinear least squares optimization. Appl. Radiat. Isot. 2021, 169, 109515. [Google Scholar] [CrossRef] [PubMed]
  24. Casanovas, R.; Morant, J.J.; Salvadó, M. Temperature peak-shift correction methods for NaI(Tl) and LaBr3(Ce) gamma-ray spectrum stabilisation. Radiat. Meas. 2012, 47, 588–595. [Google Scholar] [CrossRef]
  25. Bu, M.; Murray, A.S.; Kook, M.; Helsted, L.M.; Buylaert, J.; Thomsen, K.J. Characterisation of scintillator-based gamma spectrometers for determination of sample dose rate in OSL dating applications. Radiat. Meas. 2018, 120, 253–259. [Google Scholar] [CrossRef]
  26. Leroux, R.R.; Bezuidenhout, J. An automated drift correction method for in situ NaI(Tl)-detectors used in extreme environments. Appl. Radiat. Isot. 2022, 181, 110069. [Google Scholar] [CrossRef] [PubMed]
  27. Cheng, H.; Sun, B.; Zhu, L.; Li, T.; Li, G.; Li, C.; Wu, X.; Zheng, Y. Intrinsic background radiation of LaBr3(Ce) detector via coincidence measurements and simulations. Nucl. Sci. Tech. 2020, 31, 99. [Google Scholar] [CrossRef]
  28. Milbrath, B.D.; Choate, B.J.; Fast, J.E.; Hensley, W.K.; Kouzes, R.T.; Schweppe, J.E. Comparison of LaBr3:Ce and NaI(Tl) scintillators for radio-isotope identification devices. Nucl. Instrum. Meth. A 2007, 572, 774–784. [Google Scholar] [CrossRef]
  29. Zeng, Z.; Pan, X.; Ma, H.; He, J.; Cang, J.; Zeng, M.; Mi, Y.; Cheng, J. Optimization of an underwater in-situ LaBr3:Ce spectrometer with energy self-calibration and efficiency calibration. Appl. Radiat. Isot. 2017, 121, 101–108. [Google Scholar] [CrossRef]
  30. Zhang, Y.; Wu, B.; Liu, D.; Lv, H.; Feng, X. Research on minimum detectable activity (MDA) of underwater gamma spectrometer for radioactivity measurement in the marine environment. Appl. Radiat. Isot. 2020, 155, 108917. [Google Scholar] [CrossRef]
  31. Osvath, I.; Povinec, P.P. Seabed gamma-ray spectrometry: Applications at IAEA-MEL. J. Environ. Radioact. 2001, 53, 335–349. [Google Scholar] [CrossRef]
  32. Tsabaris, C.; Bagatelas, C.; Dakladas, T.; Papadopoulos, C.T.; Vlastou, R.; Chronis, G.T. An autonomous in situ detection system for radioactivity measurements in the marine environment. Appl. Radiat. Isot. 2008, 66, 1419–1426. [Google Scholar] [CrossRef]
  33. Zhang, Y.; Li, C.; Liu, D.; Zhang, Y.; Liu, Y. Monte Carlo simulation of a NaI(Tl) detector for in situ radioactivity measurements in the marine environment. Appl. Radiat. Isot. 2015, 98, 44–48. [Google Scholar] [CrossRef]
  34. Patiris, D.; Tsabaris, C.; Livanou, K.; Roumelioti, S.K.; Alexakis, S. Atmospheric in situ gamma-ray spectrometry for precipitation investigation. Acta Geophys. 2023, 71, 2517–2533. [Google Scholar] [CrossRef]
  35. Casanovas, R.; Morant, J.J.; Salvadó, M. Implementation of gamma-ray spectrometry in two real-time water monitors using NaI(Tl) scintillation detectors. Appl. Radiat. Isot. 2013, 80, 49–55. [Google Scholar] [CrossRef] [PubMed]
  36. Tsabaris, C. Monitoring natural and artificial radioactivity enhancement in the Aegean Sea using floating measuring systems. Appl. Radiat. Isot. 2008, 66, 1599–1603. [Google Scholar] [CrossRef] [PubMed]
  37. Gusev, A.A.; Martin, I.M.; Alves, M.A.; Abreu, A.J. Simulation of the radiation fallout from gamma-ray measurements. Model. Earth Syst. Environ. 2015, 1, 18. [Google Scholar] [CrossRef]
  38. Tsabaris, C.; Ballas, D. On line gamma-ray spectrometry at open sea. Appl. Radiat. Isot. 2005, 62, 83–89. [Google Scholar] [CrossRef] [PubMed]
  39. Zhang, W.; Korpach, E.; Berg, R.; Ungar, K. Testing of an automatic outdoor gamma ambient dose-rate surveillance system in Tokyo and its calibration using measured deposition after the Fukushima nuclear accident. J. Environ. Radioact. 2013, 125, 93–98. [Google Scholar] [CrossRef] [PubMed]
  40. Tsabaris, C.; Androulakaki, E.G.; Ballas, D.; Alexakis, S.; Perivoliotis, L.; Iona, A. Radioactivity monitoring at north Aegean Sea integrating in-situ sensor in an ocean observing platform. J. Mar. Sci. Eng. 2021, 9, 77. [Google Scholar] [CrossRef]
Figure 1. Structure of the seawater radioactivity sensor.
Jmse 12 00546 g001
Figure 2. The seawater radioactivity sensor placed as a whole in the air temperature experiment box (left) and the water temperature experiment box (right).
Jmse 12 00546 g002
Figure 3. Relationship of the peak position channel addresses with the temperature changes for 208Tl (2614 keV) (A), 40K (1461 keV) (B), and 214Bi (609 keV) (C).
Jmse 12 00546 g003
Figure 4. Normalization of the peak position channel address.
Jmse 12 00546 g004
Figure 5. Relationship between the gain values and the 40K (1461 keV) peak position channel address at the reference temperature point.
Jmse 12 00546 g005
Figure 6. Correction method workflow.
Jmse 12 00546 g006
Figure 7. Spectrum drift during the cooling process in the air environment before correction.
Jmse 12 00546 g007
Figure 8. Spectrum drift during the heating process in the air environment before correction.
Jmse 12 00546 g008
Figure 9. Spectrum drift during the cooling process in the air environment after correction.
Jmse 12 00546 g009
Figure 10. Spectrum drift during the heating process in the air environment after correction.
Jmse 12 00546 g010
Figure 11. Spectrum drift during the cooling process in the water environment before correction.
Jmse 12 00546 g011
Figure 12. Spectrum drift during the heating process in the water environment before correction.
Jmse 12 00546 g012
Figure 13. Spectrum drift during the cooling process in the water environment after correction.
Jmse 12 00546 g013
Figure 14. Spectrum drift during the heating process in the water environment after correction.
Jmse 12 00546 g014
Figure 15. Deployment of the seawater radioactivity sensor from the offshore experiment platform.
Jmse 12 00546 g015
Figure 16. Measured seawater spectrum before correction.
Jmse 12 00546 g016
Figure 17. Measured seawater spectrum after correction.
Jmse 12 00546 g017
Figure 18. Measured seawater spectrum affected by precipitation before correction.
Jmse 12 00546 g018
Figure 19. Measured seawater spectrum affected by precipitation after correction.
Jmse 12 00546 g019
Table 1. Specifications and parameters of the seawater radioactivity sensor.
ParameterIndex
Sensor type3″ × 3″ NaI(Tl)
Energy RangeAdjustable (Max < 3000 keV)
Energy Resolution<7% (661.6 keV)
Minimum detectable activity~20 Bq m−3 (in 24 h) (661.6 keV)
Spectroscopy1024 channels
Operating temperature−5~50 °C
Operating voltage9~18 V DC
Consumption~2 W
Communication protocolRS485
Table 2. Fitting relationship between gain values and the 40K (1461 keV) average peak position channel address at different temperature points.
Temperature Point (°C)Fitting RelationR2k
−5Y = 0.03441X + 13.680.99990.03441
0Y = 0.03529X + 14.290.99990.03529
5Y = 0.03564X + 15.570.99990.03564
10Y = 0.03614X + 14.290.99990.03614
15Y = 0.03643X + 14.140.99990.03643
20Y = 0.03618X + 16.290.99990.03618
25Y = 0.03596X + 15.000.99990.03596
30Y = 0.03511X + 20.000.99990.03511
35Y = 0.03486X + 14.140.99990.03486
40Y = 0.03418X + 14.140.99990.03418
45Y = 0.03329X + 13.710.99990.03329
50Y = 0.03211X + 16.000.99990.03211
Table 3. Comparison of the peak position channel address before and after the use of the correction method in the air environment.
Temperature Point (°C)Cooling ProcessHeating Process
BeforeAfterBeforeAfter
40K208Tl40K208Tl40K208Tl40K208Tl
−5380675399711379672401711
0392695400712392695400712
5396705400712397705400712
10403717400712403717401712
15404718400712405718401712
20403717400712403717401712
25400712400712399712400712
30394701400713394701401713
35388690400713388689400713
40379676400713379676400713
45370660400713370660401714
50359641400713360643401714
Table 4. Comparison of the peak position channel address before and after the use of the correction method in the water environment.
Temperature Point (°C)Cooling ProcessHeating Process
BeforeAfterBeforeAfter
40K208Tl40K208Tl40K208Tl40K208Tl
0391694400711391694400711
5397706400711398706400711
10402716400712402716400711
15405719400712405719400712
20404718400712404718400712
25400712400712400712400712
30393700400712393700400712
35389691400713389690400712
40379677400713379677400713
45369659400713369659400713
50358640400713359641400713
Disclaimer/Publisher’s Note: The statements, opinions and data contained in all publications are solely those of the individual author(s) and contributor(s) and not of MDPI and/or the editor(s). MDPI and/or the editor(s) disclaim responsibility for any injury to people or property resulting from any ideas, methods, instructions or products referred to in the content.

