Article

Examining the Impact of Long-Term Industrialization on the Trace Metal Contaminants Distribution in Seawater of the Pula Bay, Croatia

1
Teaching Public Health Institute of Istrian Region, Nazorova 23, 52100 Pula, Croatia
2
Ruđer Bošković Institute, Bijenička 54, 10000 Zagreb, Croatia
*
Author to whom correspondence should be addressed.
J. Mar. Sci. Eng. 2024, 12(3), 440; https://doi.org/10.3390/jmse12030440
Submission received: 6 February 2024 / Revised: 23 February 2024 / Accepted: 23 February 2024 / Published: 1 March 2024
(This article belongs to the Special Issue Chemical Contamination on Coastal Ecosystems)

Abstract

:
In this study, we examined for the first time the spatio-temporal distribution of trace metal (TM) contaminants (Zn, Cd, Pb, Cu, Ni and Co) in the seawater column of Pula Bay. The bay has been known for decades as one of the most industrialized regions on the Croatian side of the Adriatic. Water samples were collected at 20 sites (at two depths) in four different seasons. The main physico-chemical parameters and DOC were measured along the TMs. The spatial distribution clearly showed that areas with industrial and nautical activities are sources of Zn, Pb and Cu, while no increase was observed for Cd, Ni and Co. Compared to the reference area outside the bay, the increase in dissolved concentrations ranged from a factor of 1.1 for Ni and Co to 8.5 for Pb. A clear difference in TM concentrations was observed between seasons, with concentrations being higher in warmer periods than in colder periods. The potential bioavailability/toxicity of TMs was examined using a passive sampling technique: diffusive gradients in thin films (DGT). In addition, a single-factor pollution index based on the available EQSs was used for both the dissolved TMs and DGT to assess the potential risk to the environment.

1. Introduction

Trace metals (TMs) are a non-degradable part of the aquatic environment. Once they have entered, they are persistent, only changing form and storage location (sediment/water/biota) [1]. Transport, bioavailability and toxicity of metals depend on the distribution of their chemical forms, i.e., speciation [2]. TM concentrations are naturally very low, and even a small anthropogenic input can be critical. TMs can reach the marine environment through a wide variety of sources, and once in the water column, the main mechanisms of removal are biological activity and scavenging [3]. The ecotoxicological effects of TMs are well known for a number of elements, including Zn [4], Cd [5], Pb [6], Cu [7,8], Ni [9] and Co [10]. Sediments are most often the final destination of trace elements. However, they act also as their source, as metals can be remobilized to the water column, even to toxic levels [1,3,11].
The general principles of TM distribution in the water column are well known: larger fractions of mostly nutrient-type profile elements (Cd, Cu and Ni) are expected in the dissolved fraction, and scavenged vertical profile elements (Pb and Co) are expected mainly in the particulate fraction, while Zn can be found in both [3,12]. Zinc, Cd, Cu and Ni are elements involved in the main biogeochemical cycles [12,13], although Cd does not have a biological role [5]. Also, relatively simple relationships exist between Zn, Cd and some nutrient concentrations [3,14,15]. Horizontal distributions of scavenged profile elements show that their concentrations are the highest at the point where they enter seawater [12]. Although the information on total dissolved TM concentrations is important for a general perspective of TM distribution, chemical speciation plays a crucial role in assessing TM bioavailability and mobility in aquatic systems [2,16]. Many TMs (e.g., Cu, Fe) exist in the water column preferentially in the form of stable complexes with natural organic ligands [12,16]. Thus, determination of their speciation and related bioavailability is of great importance in the chemistry of TMs in marine waters.
Water quality standards (WQSs) worldwide are still based on dissolved concentrations of TMs. However, the water framework directive (WFD) recommends determining the bioavailable fraction of TMs where possible (e.g., chemical speciation analysis). There is an initiative proposed by the EU project MONITOOL to use DGT-type passive sampling devices for the monitoring of TMs in a regulatory context [17]. DGT facilitates the pre-concentration of TMs in situ during the deployment period. The concentration determined by DGT is referred to as the time-weighted average (TWA) or DGT-labile concentration, which is also known as the potentially bioavailable concentration [18,19,20]. The latter is crucial for the determination of the role that a metal has in the environment, since there are numerous examples of metals that have a nutrition role at low concentrations but become toxic when their concentration is above a certain limit (e.g., [21]).
Pula Bay (Croatia) is one of the most suitable natural ports on the Adriatic coast (Figure 1). It can be divided into two parts: the inner, which is industrial, and the outer, or non-industrial (indicated by a red dashed line in Figure 1). The outer bay is demarcated by a seawall at the limit with the coastal water. Pula Bay is naturally protected from all winds except from the northwest, and that is why the bay has been used for defense purposes and industry for centuries. During the Austro-Hungarian monarchy, Pula Bay was the main port of the empire (1890–1914) and during the Second World War, the bay was the headquarters of the Italian and German submarine fleets. That is why the city was heavily bombed in 1944 and 1945. Until recently, a significant area of the shore was closed to the public, as it was part of the military zone. To this day, access to the Muzil Peninsula is limited, while on the northern coast (the Katarina–Monumenti zone), former military buildings are being converted into facilities for touristic purposes. The main characteristic of Pula Bay is that it is heavily industrialized (Figure 1). Uljanik Shipyard (one of the four biggest in Croatia) was founded in 1856 and is still operational. An aluminate cement factory (founded in 1926) is still very active (there are ongoing discharges to the bay). The bay hosts two nautical marinas, one in the inner bay (213 berths) and a newer one at the border between the inner and the outer bay (400 berths). There is also a small local marina on the north side of the inner bay (195 berths). A passenger terminal is also located between the two marinas. Until 2015, the bay was the end-point of the wastewater drainage system of the city of Pula. Due to the bay’s relatively long history of industrialization, sediments, as long-time receptors of contaminants [22], could be also a source of TMs in the water column. As listed above, it is evident that there are numerous potential sources of TMs in the bay. Data on trace elements in this part of the Adriatic are very scarce, especially in seawater. Di Cesare et al. published results on metal concentrations in sediments collected from Pula Bay in 2013 [22]. They showed significant pollution by some elements, but within the ranges found in other parts of the Croatian Adriatic coast under similar anthropogenic influences.
Considering the upcoming revitalization of the bay, it is of great importance to estimate the actual status of TM concentrations in the bay, with a particular emphasis in identifying potential anthropogenic influences. Thus, the main aims of this work are (i) to evaluate, for the first time, the spatio-temporal distribution of TMs in the water column in Pula Bay, (ii) to examine the potential short-term variation in TMs in a selected potentially contaminated site, (iii) to use DGT passive sampling devices in order to determine potentially bioavailable TM concentrations and to compare them to average dissolved TM concentrations during the deployment period and (iv) to perform a basic risk assessment of TMs in the bay.

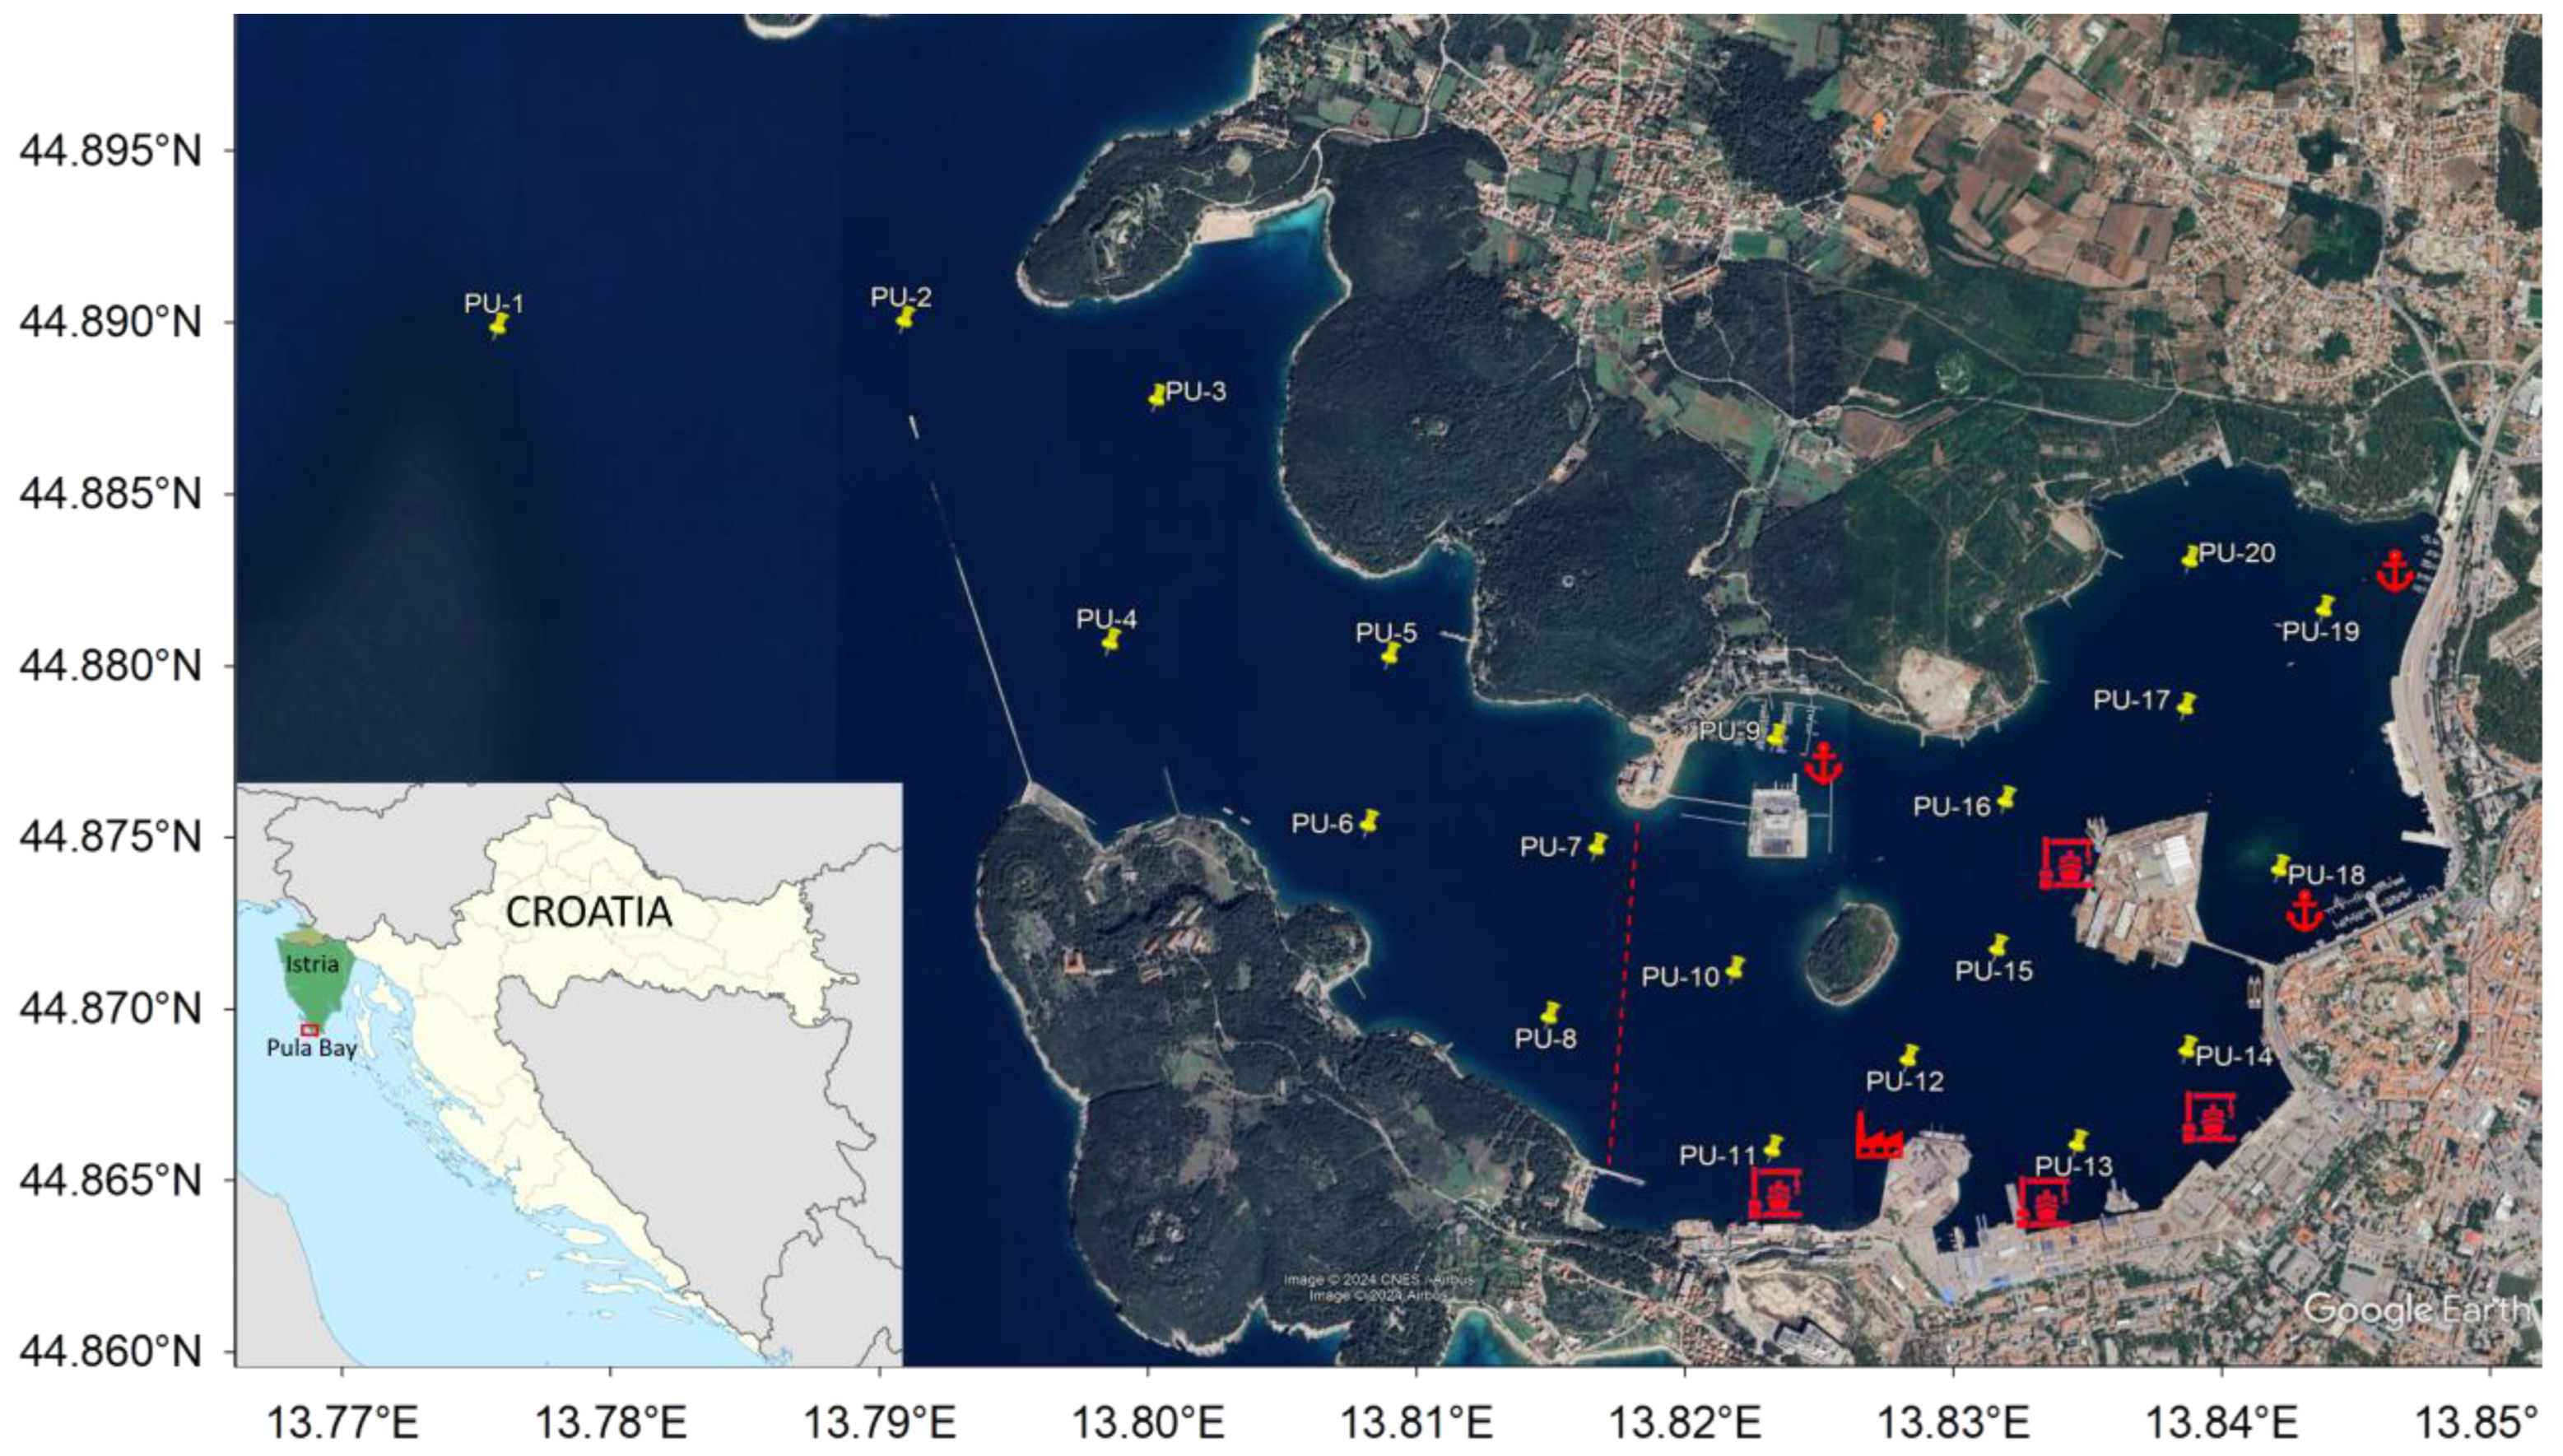
2. Materials and Methods

2.1. Physico-Chemical Parameters and Total/Dissolved TMs

Four sampling campaigns were carried out in Pula Bay in 2021 and 2022, corresponding to the four seasons: summer (July 2021), autumn (November 2021), winter (March 2022) and spring (June 2022). Samples were taken at two depths: just below the surface (0.5 m; hereafter referred to as “surface samples”) and a few meters above the bottom of the water column (variable depths; hereafter referred to as “bottom samples”) with a home-made vertical “butterfly”-type water sampler (https://sites.google.com/site/daromasoft/home/sampler; accessed on 29 January 2024). Sampling was conducted at 20 locations (Figure 1): 19 inside the bay (PU-2 to PU-20) and 1 outside the bay, referred to as a reference site (considered unpolluted) (PU-1). Maximum depths are given in the supporting document (Table S1).
Samples for the determination of total and dissolved TMs and dissolved organic carbon (DOC) concentrations were collected. Physico-chemical parameters, including salinity, dissolved oxygen, temperature, turbidity and pH were measured in situ using an EXO2 CTD multiprobe (YSI, Xylem, Yellow Springs, OH, USA). Samples were collected in 500 mL FEP bottles (Nalgene, Thermo Fisher Scientific, Waltham, MA, USA), previously soaked for 24 h in diluted HNO3 (10% v/v) and then rinsed three times with MilliQ water and filled with MilliQ until their use in the field. All reagents were used as received without any additional purification. A part of each sample was syringe-filtered using 0.2 µm pore cellulose–acetate filters (Minisart, Sartorius, Göttingen, Germany) (previously rinsed with 60 mL of MilliQ water) to determine the concentrations of dissolved TMs and DOC. The DOC sample was taken from the last filtration batch after at least 150 mL of the sample had passed through the filter. The samples for TMs were stored in 125 mL FEP bottles, while samples for DOC analyses were stored in borosilicate glass cuvettes (22 mL), which were preserved by adding 20 µL ultrapure HCl (36%, Rotipuran Supra, Carl Roth, Karlsruhe, Germany). Filtered and non-filtered samples (~120 mL each) for TMs determination were preserved to pH below 2 by addition of ultrapure HNO3 (67%, Rotipuran Supra, Carl Roth, Karlsruhe, Germany). For clarity, the TM concentrations in the filtered fraction are referred to as “dissolved concentrations” in this article, while the concentrations in the non-filtered samples are referred to as “total concentrations”.
Autolab (Metrohm/EcoChemie) with 663 VA Stand (Metrohm) three-electrode system (hanging Hg drop as working electrode, Pt wire as auxiliary electrode and Ag/AgCl/NaCl(sat) as reference electrode) with stirrer was used for TM analyses. Total and dissolved TM concentrations were determined using the standard addition method in UV-irradiated samples (at least 24 h directly in FEP bottles; 250 W high-pressure Hg UV lamp). Differential pulse anodic stripping voltammetry (DPASV) was used for the determination of Zn, Cd, Pb and Cu: simultaneous analysis of Cd, Pb and Cu was followed by the determination of Zn after addition of CH3COONa buffer solution to increase the pH to about 3–4 [23]. Differential pulse adsorptive cathodic stripping voltammetry (DPAdCSV) was used for the determination of Ni and Co after addition of dimethylglyoxime–DMG (ligand), NaNO2 (catalyst) and borate buffer solution to a pH of around 9. Sample purging (deoxygenation) was performed with nitrogen 5.0 gas. The voltammograms were processed using ECDSOFT software (https://sites.google.com/site/daromasoft/home/ecdsoft; accessed on 29 January 2024).
All voltametric analyses were performed using a fully automated measurement system, consisting of the electrochemical instrument, homemade autosampler and automatic burettes (Tecan Cavro, Männedorf, Switzerland). Quality control (QC) was performed by analyzing the coastal Standard Certified Reference Material (SCRM) CASS-6 obtained from the National Research Council of Canada (NRCC). All measured TMs were within the limits of the provided uncertainty of the SCRM. The analytical uncertainty of the methods was estimated to be between 10% and 15% of the results obtained.
High-temperature catalytic oxidation (HTCO) was used for DOC analyses. The measurement was carried out with MultiN/C 3100 (Analytik Jena, Jena, Germany) or TOC-L (Shimadzu, Kyoto, Japan) instruments. Inorganic carbon was removed by purging the sample with carbon-free air for at least 5 min.
In order to obtain comparable information on the examined metals, the enrichment factor (EF) and the dissolved fraction (DF) were calculated. EF is defined as the ratio between an average concentration found at the inner-bay stations (PU-9 to PU-20) and the concentration of the metal found at the two cleanest sites (PU-1 and PU-2). DF is the ratio between the dissolved and total (non-filtered) TM concentrations.

2.2. DGT Deployment and Analyses

In November 2022, a DGT deployment campaign was carried out in the area of a shipyard inside the bay, at a site considered polluted (near the site PU-11). Commercially available DGT devices (DGT Research Ltd., Lancaster, UK), consisting of a piston-like plastic holder with a cellulose–acetate filter, polyacrylamide diffusive gel (0.8 mm) and Chelex-100 as a resin were used for this purpose. The devices were mounted in triplicate on a PVC holder and deployed beside the dock, approximately 0.5 m above the bottom. The devices were deployed for seven days (168 h). After retrieval, the DGTs were rinsed with MilliQ water and stored in zip-lock plastic bags at 4 °C. During the deployment period, discrete seawater samples were taken daily (every 24 h) and the temperature was measured. The seawater samples were taken in precleaned 1 L FEP bottles mounted on a telescopic rod. Filtration of the samples was conducted within 30 min after the sampling. Precleaning and filtration processes were as described earlier. At the end of the deployment period, a composite water sample was made out of discrete (daily) sample portions. The DGT gel retrieval was processed in a controlled atmosphere (Class-100 laminar bench): the resin gel was transferred into precleaned 2 mL PP vials (Eppendorf) and eluted in 1.5 mL of 1 M ultrapure HNO3 [24]. Additionally, three non-deployed DGTs were processed in the same way and used as blanks. Analyses of TMs in DGT eluates and in discrete seawater samples were performed by inductively coupled plasma mass spectrometry (ICP-MS, Agilent 8900 QQQ, Santa Clara, CA, USA). All samples were spiked with indium (In) as an internal standard at a concentration of 10 μg/L. A certified standard reference material (SLRS-6, National Research Council Canada) was used for quality control of the ICP-MS measurements. Four separate SLRS-6 control samples were measured, and the determined TM concentrations were within 10% of the certified reference values.

3. Results and Discussion

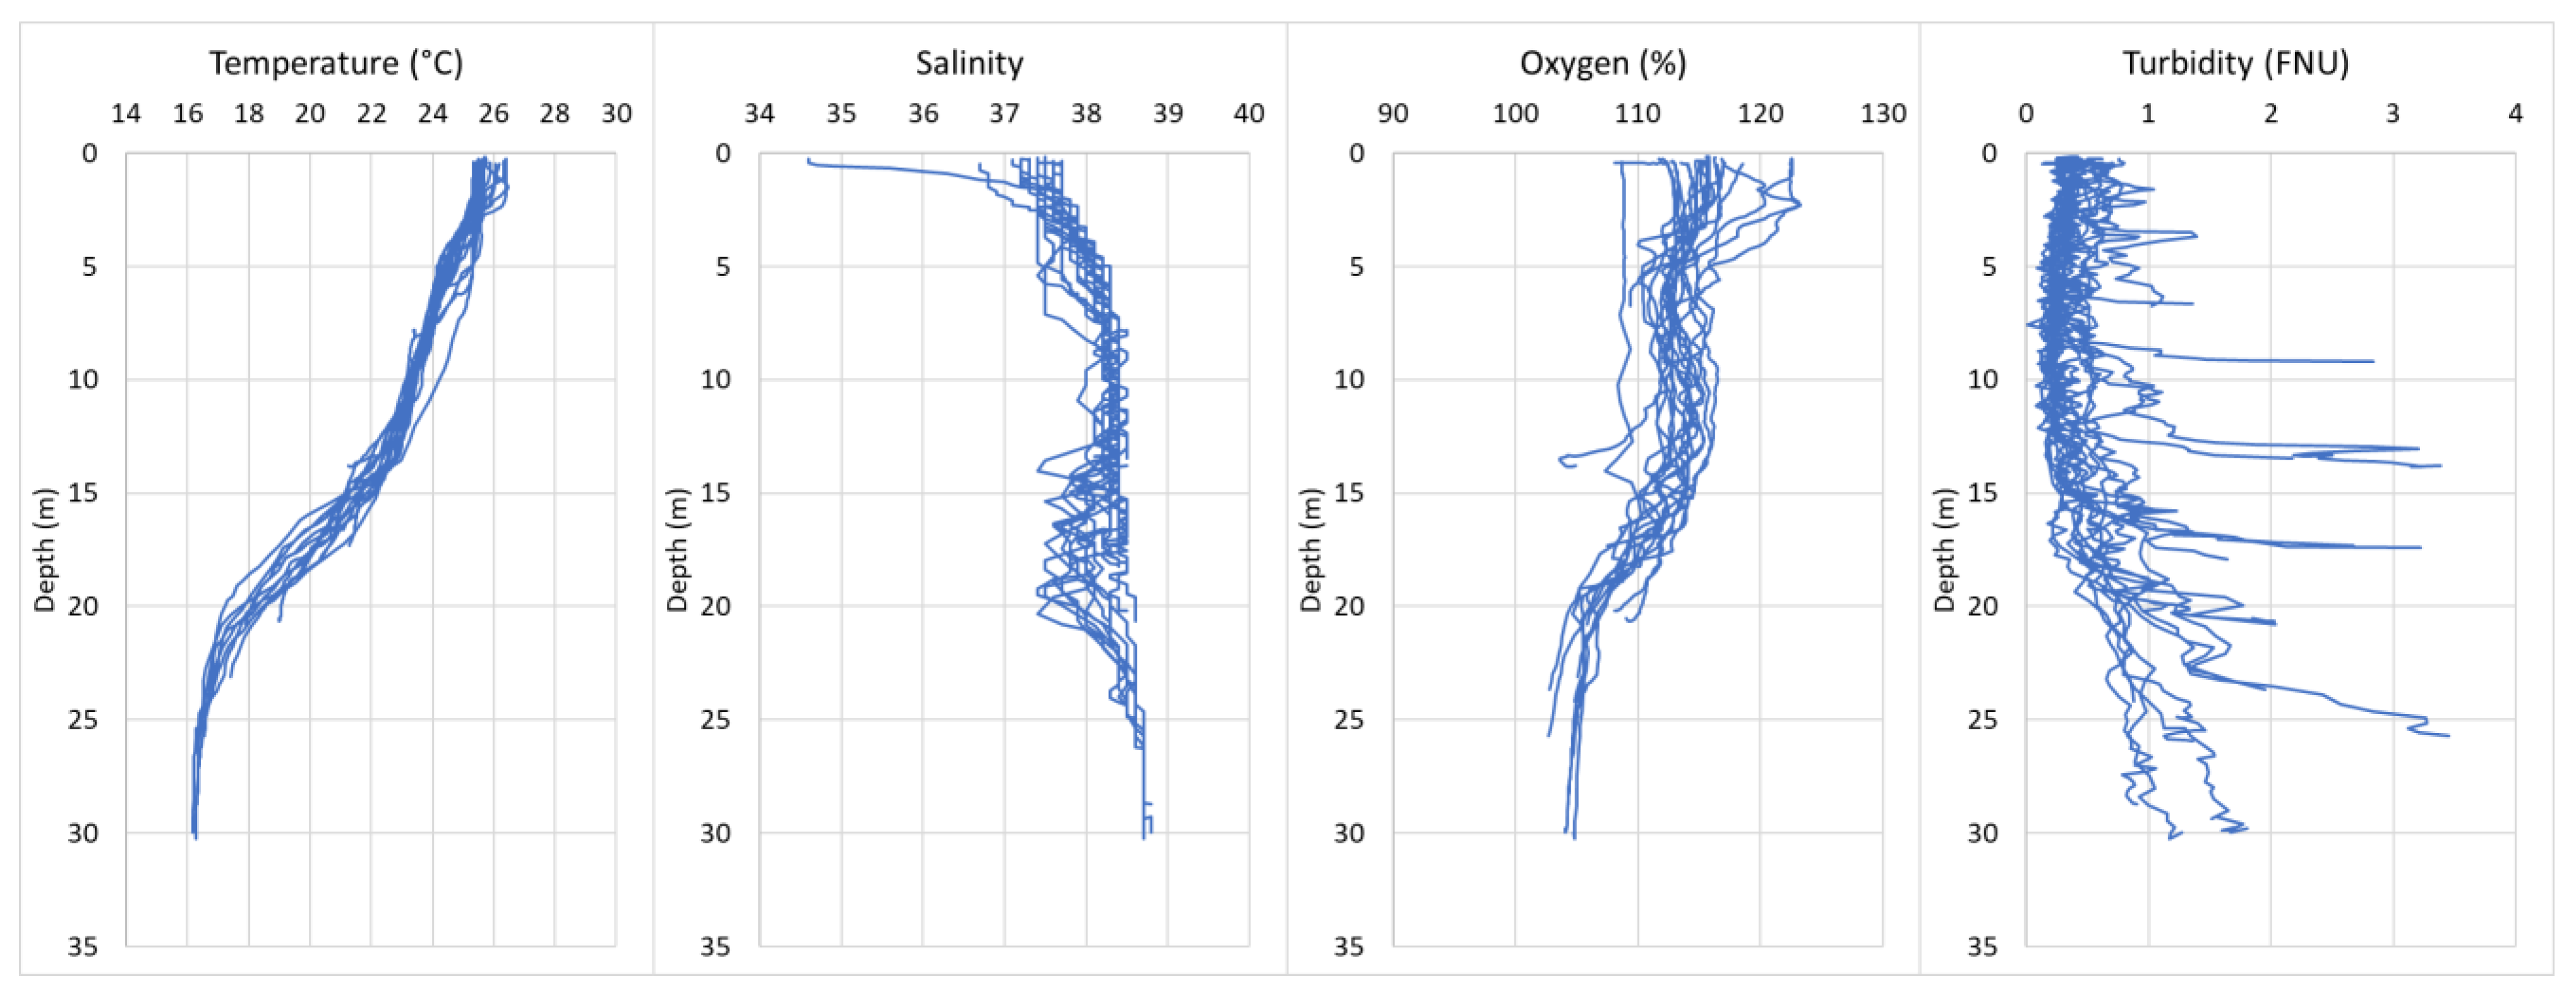
3.1. Physico-Chemical Parameters

Figure 2 shows the vertical profiles of the physico-chemical parameters measured during the July 2021 campaign: temperature, salinity, dissolved oxygen and turbidity. The graphs combine the vertical profiles of all sampling sites for the given parameter. We have avoided providing the legend of the plots here and assigning colors to the different sampling stations as it would be too difficult to follow the individual profiles. Thus, note that these profiles are only intended to show general trends. Profiles taken during other campaigns can be found in the supporting document (Figures S1–S3).
The measured pH values for all locations and campaigns were within the expected range, around 8.2. Other physico-chemical parameters show the expected spatial and temporal variability: temperature and dissolved oxygen (oxygen saturation) generally decrease and salinity increases with depth. The temperature ranged between 9.7 °C (winter campaign—March 2022) and 25 °C (summer campaign—July 2021). The absence of temperature gradients in the autumn (November 2021) and winter (March 2022) campaigns suggests that the temperature in the bay depends primarily on weather conditions. Oxygen saturation values between 94% and 120% were recorded. Salinity, on the other hand, increased from the surface to the bottom and ranged between ~37.0 and 39.2. An exception was a region on the northern side of the bay (PU-20; July 2021), where a small input of fresh water was observed, with salinity slightly below 35. A significant increase in turbidity was observed at depths closer to the sediment (bottom), indicating the accumulation of scavenged inorganic and organic particles.
Concentrations of DOC changed within the expected range, considering the positions of the sites and the seasons. During the warmer part of the year (July 2021 and June 2022), DOC concentrations ranged from 0.95 mgC/L to ~2.15 mgC/L, while in the colder months (November 2021 and March 2022), the values were slightly lower, and ranged from 0.52 mgC/L to 1.6 mgC/L. DOC concentrations increased slightly from the reference point (PU-1) towards the inner bay sites. The concentrations in the surface water were slightly higher (up to 20%) compared to the bottom seawater layer. The above ranges of DOC concentrations are fully consistent with the range previously reported for the Northern Adriatic (~0.8–3.0 mgC/L) [25]. No specific increase in DOC was detected at any site and in any season, indicating its primarily natural origin, free of any significant and permanent anthropogenic influence from industrial activities within the bay.

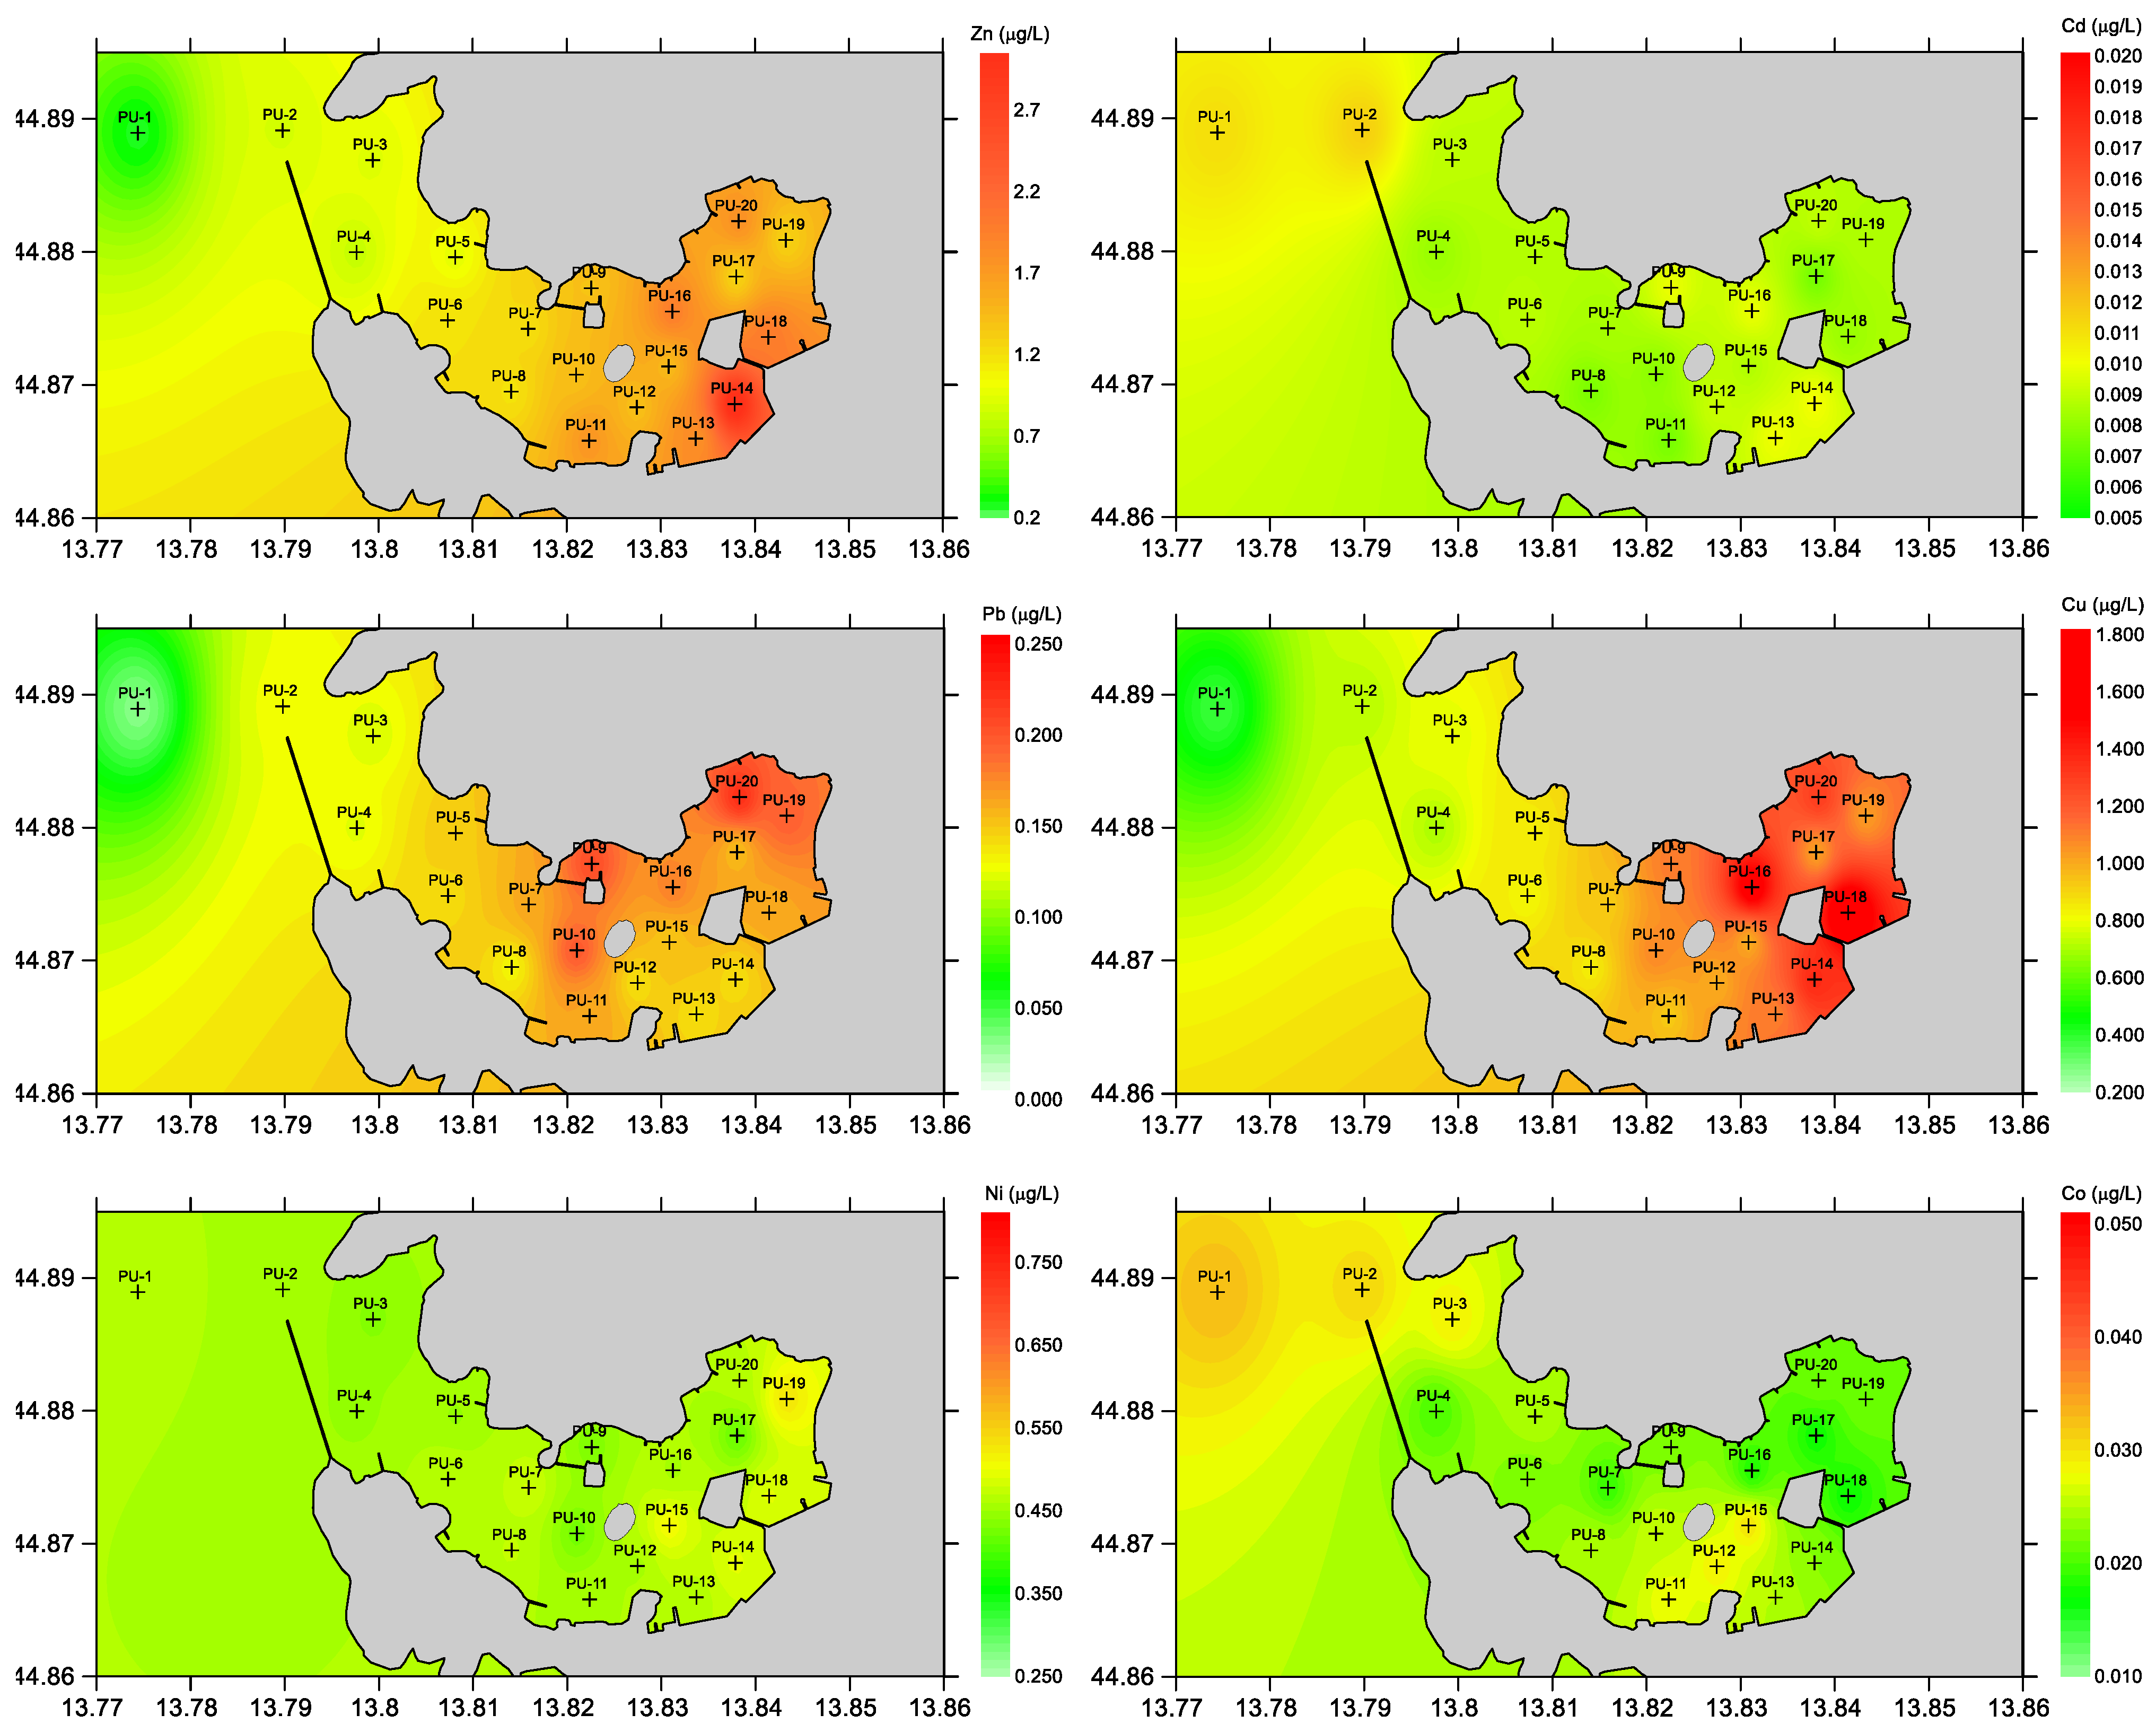
3.2. Spatio-Temporal Distribution of TMs

Figure 3 shows contour plots of a typical spatial distribution of the dissolved concentrations of the six analyzed TMs in the surface layer of the studied site, as determined for the July 2021 campaign. A clear increase in Zn, Cu and Pb concentrations was observed from the reference site (PU-1) toward the sites inside the bay.
The same pattern, but with a different intensity (different enrichment factors—EF), was observed for all four campaigns and also for the bottom seawater layer (the plots for other campaigns are shown in Figures S4–S6). The ranges of dissolved TM concentrations in the surface and bottom layers for all four campaigns are given in Table 1, while their average concentrations are shown in Figure 4.
All of the concentrations for dissolved and total TMs are provided graphically in Figure S7 in the supporting document. For Zn, Pb and Cu, the lowest concentrations were always measured at the reference site (PU-1), while the highest concentrations of TMs were regularly found at sampling sites in the inner bay (PU-9 to PU-20), located near TM sources (Uljanik Shipyard, two marinas, terminal and ex-wastewater discharge). Spatial distributions indicate a clear input of Zn, Pb and Cu from the aforementioned anthropogenic sources. The concentrations of all TMs at the reference site (PU-1) and also at the PU-2 site were relatively stable over the seasons, while seasonal differences in concentrations were observed at the sites inside the bay, especially near sources. Note that all of the measured concentrations are presented graphically in Figure S7, which we consider to be easier to follow than a tabular presentation.
A progressive, almost linear decrease in Zn, Pb and Cu from the heavily polluted area inside the bay towards the reference site could be explained by a simple dilution effect (Figure 3 and Figure S7). Although the concentrations of Cd, Ni and Co varied up to three times (considering all four campaigns), their spatial distributions were quite uniform throughout the bay, as is evident from the contour plots in Figure 3 and the small error bars in Figure 4, indicating an absence of anthropogenic influence. The exceptions to the uniform distribution were evidenced for Cd (three-fold increase), and slightly for Ni and Co (up to 40% increase) for the November 2021 campaign (both in the surface and bottom seawater layers) (see Figure S7). We have no explanation for this increase in concentrations between the reference site and the most polluted site within the bay.
The obtained ranges of TM concentrations within Pula Bay are comparable to the ranges obtained in Šibenik Bay (Croatia) [23], which exhibits similar anthropogenic sources of TM (Table 1). The measured maximum concentrations of Zn and Cu were higher in Šibenik Bay, while higher concentration of Pb was measured in Pula Bay. The concentration ranges for Cd, Ni and Co are very similar, indicating the absence of anthropogenic sources of these metals in Šibenik Bay as well. Such similarity is to be expected for the two anthropogenically impacted bays. However, it is quite surprising that relatively high concentrations for all six TMs were measured in the open part of the northern Adriatic (Stations 107 and 108) [26] (for some TMs, even higher than the concentrations measured in the most polluted part of the Pula Bay). Compared to our reference site (PU-1; which is considered an “open sea”), the high maximum concentrations measured at Stations 107 and 108 are unexpected and indicate the possible contamination of some samples/TMs in that study [26]. Lower maximum concentrations in the northern Adriatic than those found by Penezić et al. (2022) and the absence of a potential high influence of the Po River were also found in the studies by Zago et al. (2002) [27] and Illuminati et al. (2019) [28], with concentration ranges very similar to our reference site. Compared to the data from some heavily industrialized European cities such as Toulon (France, Mediterranean [29]) or Vigo (Spain, Atlantic coast [30]), the TM concentrations in Pula Bay are significantly lower.
The average concentrations of the four campaigns shown in Figure 4 clearly show that the surface Zn and Cu concentrations were lower in the autumn and winter campaigns compared to the spring and summer campaigns. These differences are less pronounced in the bottom seawater layer, indicating limited vertical transport of Zn and Cu. The lowest dissolved concentrations of all metals (except Ni) found in the winter campaign (March 2022) for both layers could be ascribed to a higher exchange of water masses during the winter period with good vertical mixing, together with lower anthropogenic inputs due to the reduced number of activities within the harbor.
An obvious difference between the surface and bottom seawater layers was observed for Zn and Cu for the two campaigns in the warmer part of the year (July 2021 and June 2022). Similar behavior was also observed in Šibenik Bay and is ascribed to the more intensive nautical traffic in the late spring and summer periods [23,31]. Namely, Cu and Zn are leached from the antifouling paints used as biocide on boats/yachts and sacrificial anodes, respectively. The opposite behavior was observed for Pb, with lower concentrations at the surface than in the bottom seawater layer, a trend that was also found in Šibenik Bay [23,31]. Higher concentrations of dissolved Pb could be explained by a progressive accumulation of Pb, most likely due to the longer residence time of seawater (not confirmed) in warmer periods combined with the input of Pb from the sediment [22]. The same behavior was also observed for the total (unfiltered) Pb concentrations, which disregards the influence of particles on the vertical distribution/transport of Pb.
To obtain a general overview of the increase in TM concentrations at the most polluted sites (PU-9 to PU-20) inside the bay versus the cleanest sites (PU-1 and PU-2), the average enrichment factors (EF) for the dissolved and total metals were calculated and are presented in Table 2. Note that these EFs are lower than the maximum ones that could be calculated separately from the maximum and minimum concentrations for each campaign. We avoided presenting these values as they could provide an unreliable overall picture of pollution intensity, and we decided to present them as a robust mean of the EFs as described in the experimental section.
The average EFs of the dissolved TM range from 1.0 to 9.0 and for the total TM from 1.1 to 10. It should be highlighted that the low EFs for Cd, Ni and Co for both depths are also characterized by relatively small standard deviations, indicating a relatively uniform seasonal and spatial distribution of their concentrations, as already mentioned. The highest average EF calculated for Pb with a high standard deviation indicates a rather high seasonal variability of Pb concentrations in the polluted area, which can be confirmed by the values and error bars presented in Figure 4. A decreasing order of EFs, Pb > Zn > Cu > Cd = Ni = Co, shows the importance of these TMs in relation to the anthropogenic pressure in the heavily industrialized Pula Bay. A careful examination of both spatial and seasonal concentrations of Pb, Zn and Cu did not reveal any evidence of the specific site, i.e., point source(s) of these metals, signifying a diffuse input of contaminants, at least considering the exact locations where the samples were taken. This does not mean that there are no point sources but indicates a dilution effect away from the point sources that prevents the determination of their exact location. Even when we found that some muddy effluents from an anchored ship were discharged ~100 m from a sampling site (PU-14; July 2021), the only detected pollution could be attributed to Zn (both dissolved and total), whose concentrations in the surface layer were doubled compared to the neighboring sites.
As can be seen in Figure S8 in the supporting document, all TMs are mainly present in the dissolved fraction (DF). The highest DF was found for Cd and Ni (91–94%), followed by Cu, Co and Zn (79–90%), while the lowest DF was found for Pb (~59%). These values are consistent with previous studies conducted in the northern Adriatic [26] and the Krka River Estuary [23,32], systems characterized by a low content of suspended particulate matter. The low DF of Pb is a particularity as it is known as a particle reactive metal [13,23,28], especially towards Fe and Mn oxyhydroxides. A slightly lower DF was found for all TMs in the bottom seawater layer, indicating a higher content of scavenged inorganic and/or organic particles. The lowest DF values were found in the November 2021 campaign. Despite the calm weather on the day of sampling, the days prior to the sampling were characterized by strong wind/waves, which probably led to an additional input of terrestrial particles from the surrounding industrial area. Additional particles from resuspended sediment in deeper layers could not be excluded.

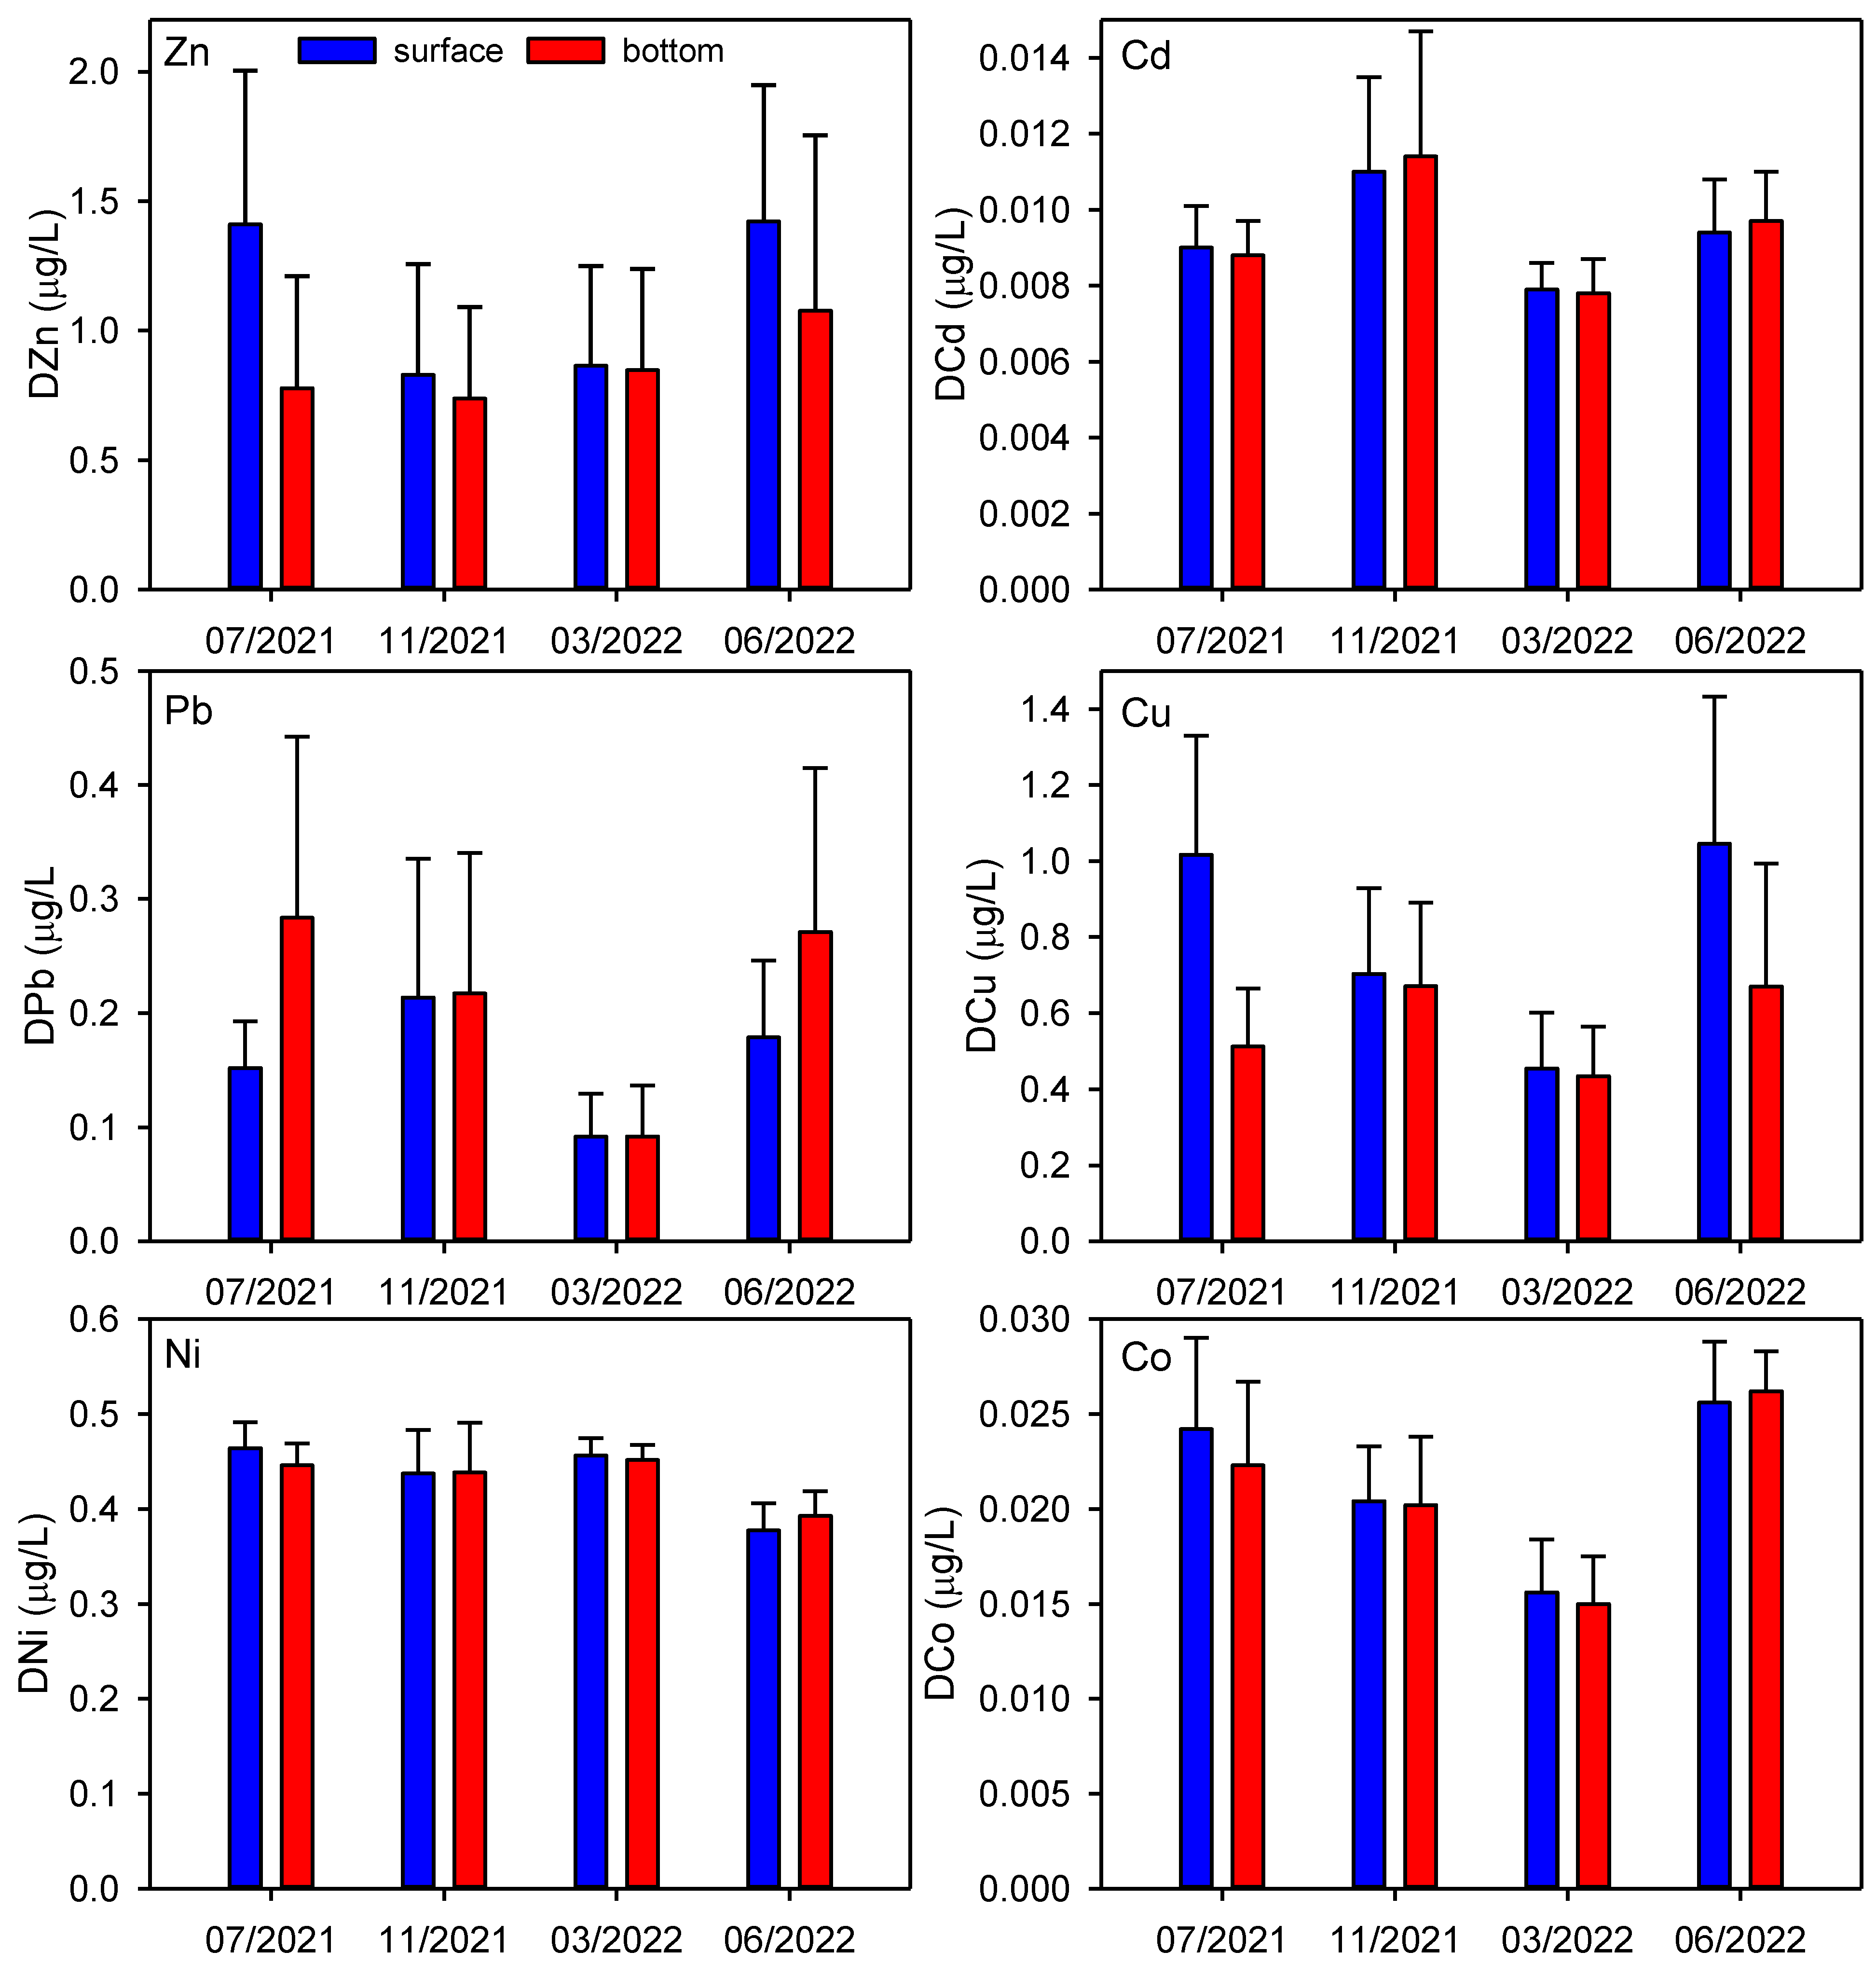
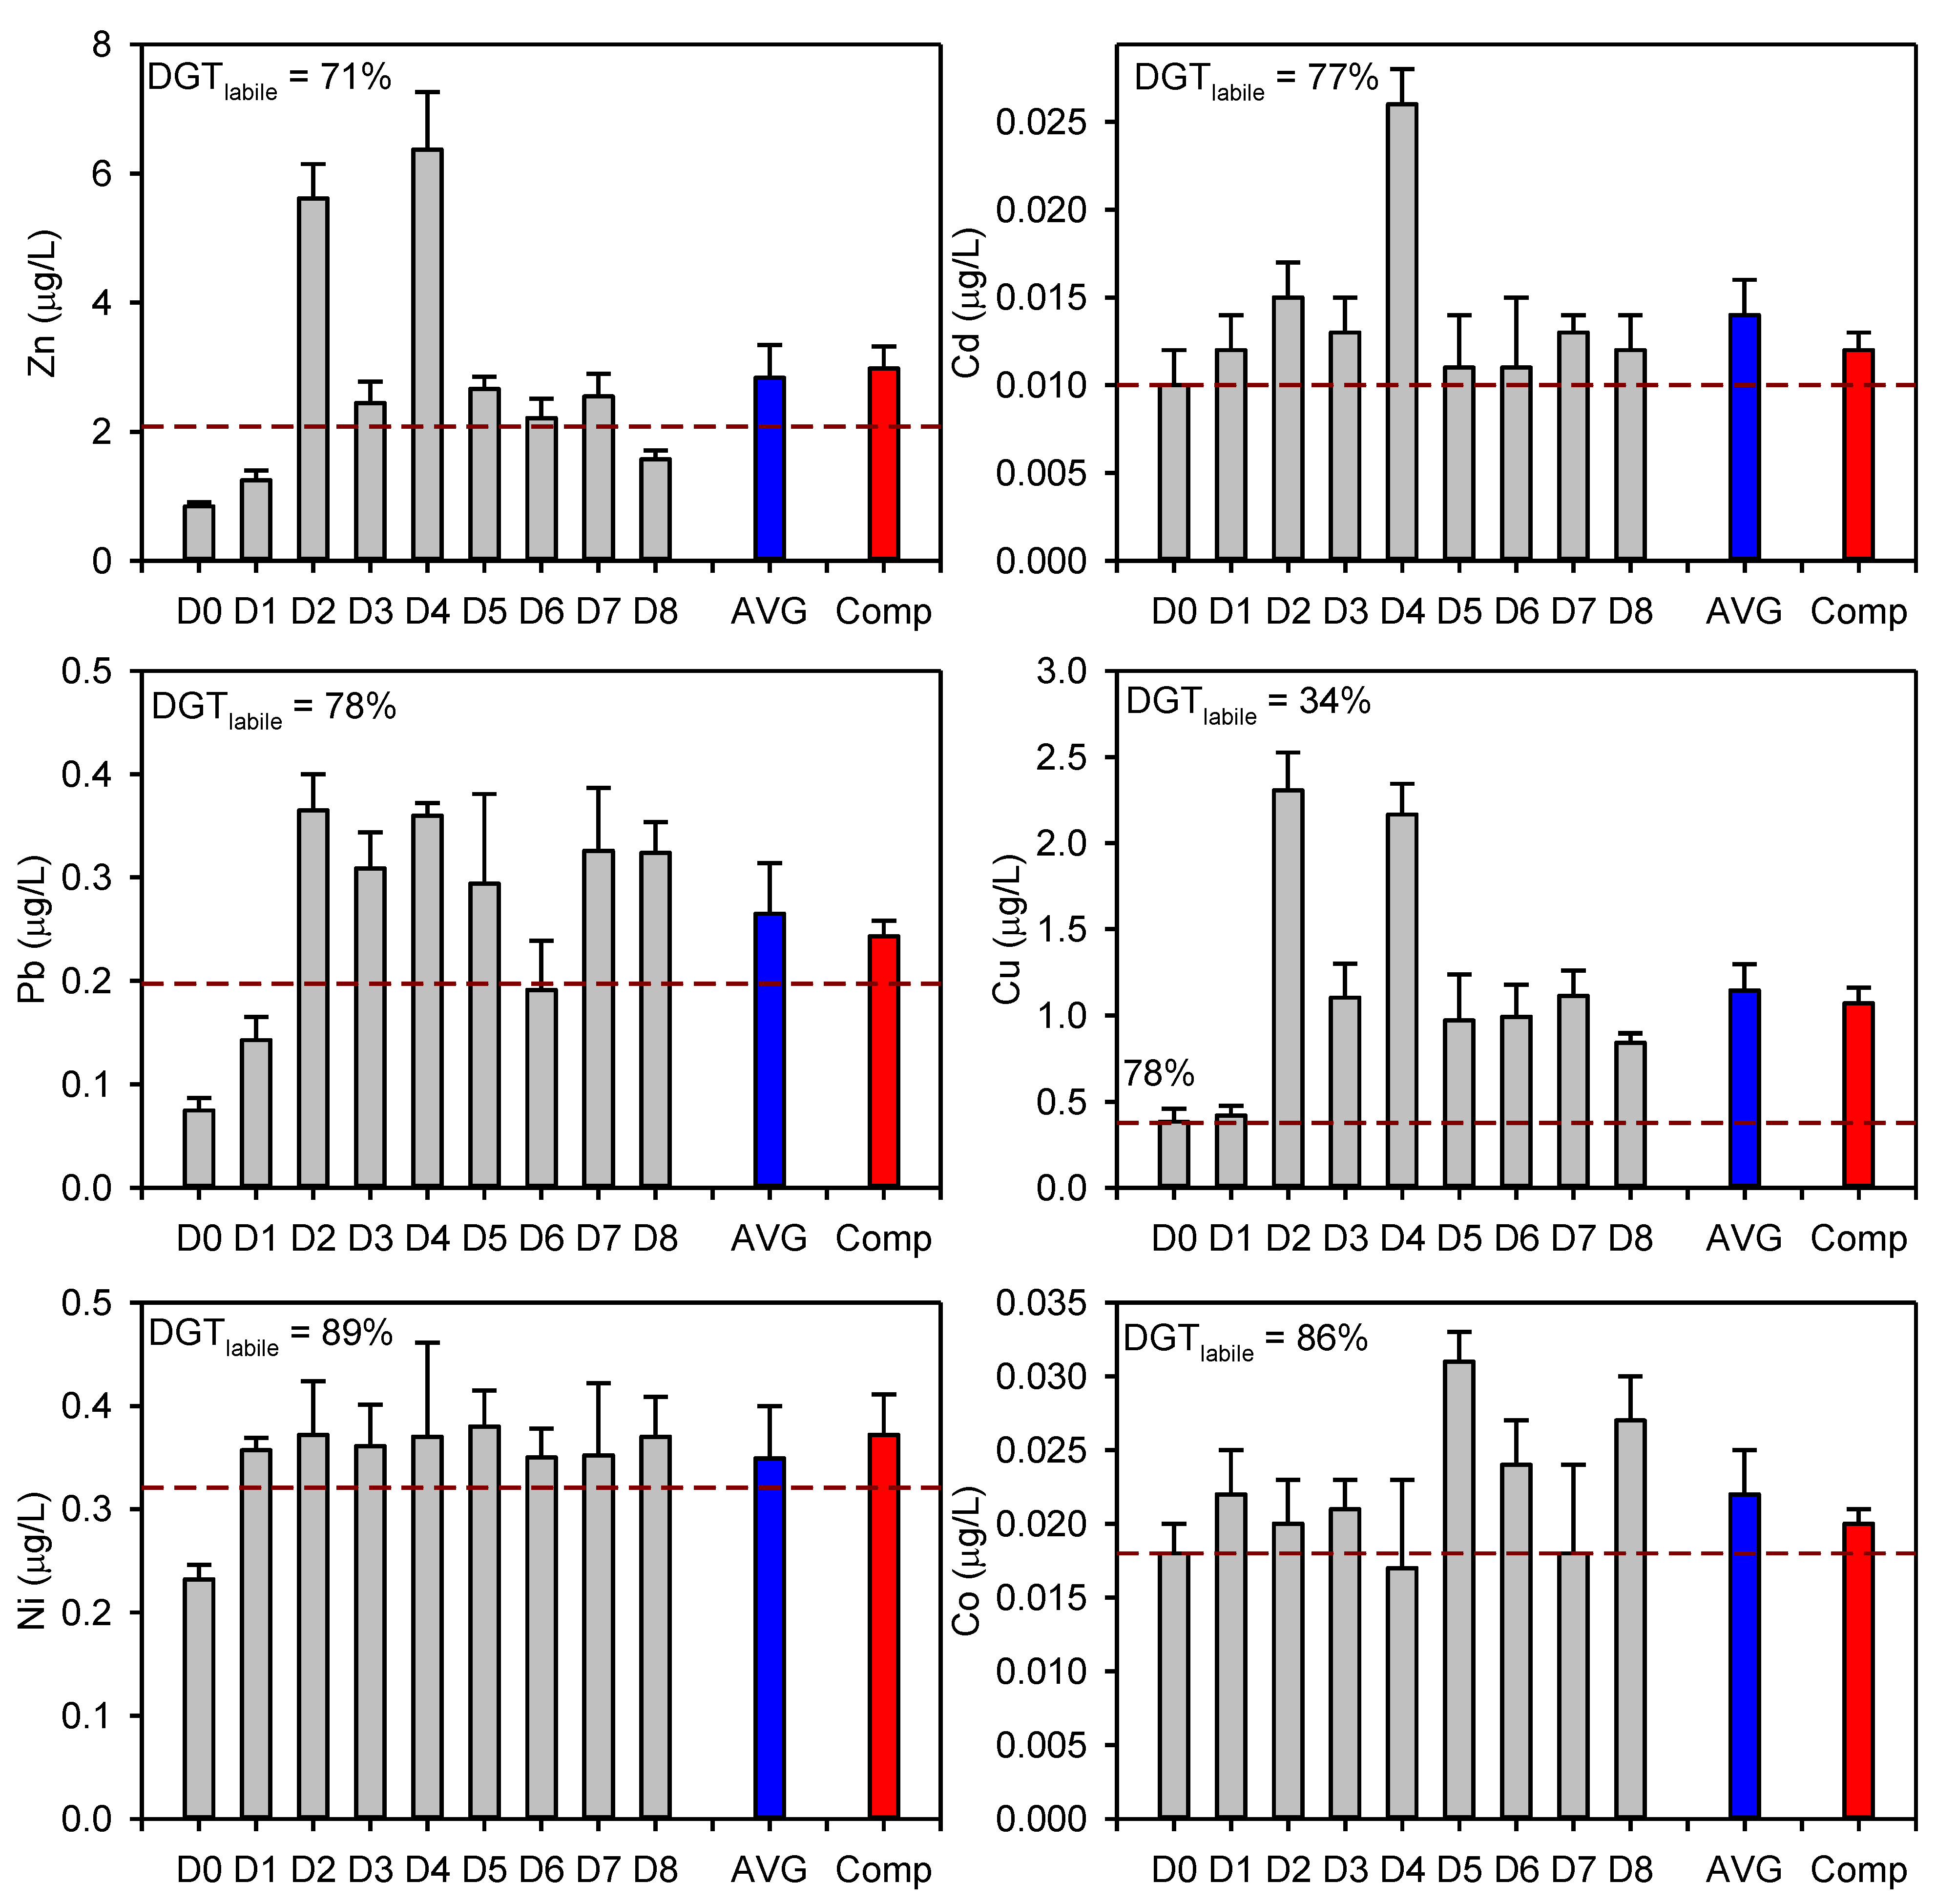
3.3. Inter-Annual and Daily Variations and Potentially Bioavailable Fractions of TMs

Figure 5 shows the concentrations in discrete samples (dissolved fraction) taken during the DGT campaign in November 2022. The DGT samplers were deployed in the close vicinity of a potential TM source to assess the potential variability of TM concentrations on a daily basis. Only one test site was monitored for this study, while a separate DGT campaign was conducted at ten sites across the bay in 2023 as a part of an additional study.
The concentrations of all TMs shown in Figure 5 clearly show that they fluctuated considerably during the 8 days of sampling but exhibited a common pattern. Especially indicative changes were registered for Zn and Cu, and to some extent also for Cd and Pb. The higher daily concentrations in discrete samples observed on Day 2 and Day 4 of the deployment are most likely due to the activities in the shipyard. The deployment site was close (~100 m) to the PU-11 sampling site (Figure 1), where no extreme concentrations were detected during seasonal sampling. Also taking into account the significantly lower concentrations measured on Day 3 and Day 5, it can be concluded that the mixing of the water mass occurs very quickly, resulting in a rapid dilution of these TMs. Comparing the seasonal fluctuations in TM concentrations (max/min) at the nearest site (PU-11) with the daily concentration changes shown at the DGT deployment site, there is a much higher variability on a daily basis for all metals: 7.6 vs. 2.6 for Zn, 2.6 vs. 1.5 for Cd, 4.9 vs. 3.6 for Pb, 6.0 vs. 2.3 for Cu, 1.6 vs. 1.3 for Ni and 1.8 vs. 1.7 for Co. This shows a high dynamic responses of the localized TM concentration changes, which are probably related to the input from point sources in close vicinity. However, due to the dilution effect and “homogenization”, these changes are less visible at sampling sites located at a certain distance (>50 m) from the potential point sources. In addition to the daily concentrations in Figure 5, the average concentrations (D0–D8) and the concentrations in the composite sample are also shown. These two values agree quite well with each other, indicating a proper sampling protocol and analytical measurements of high quality, free of contamination. The mean of these two values is further used to calculate the DGT-labile fractions (potentially bioavailable) which are shown as percentages in Figure 5. The DGT-labile fraction of Cu was the lowest (34%), followed by Zn (71%), Cd and Pb (77% and 78%, respectively) and finally Co and Ni with an 86% and 89% DGT-labile fraction, respectively. These data can be compared to previous studies, especially for Cu [23,31]. The high variability of the presented TM concentrations clearly shows the drawback of the discrete sampling method in environmental monitoring. Therefore, a time-weighted average concentration using passive samplers is recommended, with the DGT technique being one of the most widely tested and best known [17].

3.4. Risk Assessment

A single-factor pollution index method was used to evaluate the potential ecological risk. The pollution index was calculated with respect to the environmental quality standards (EQS) in the regulation on water quality standards of the Republic of Croatia (OG Nos. 96/2019, 20/2023 and 50/2023, [33]) defined for Cd, Pb and Ni. The pollution index was calculated using the following formula [34]:
p i = γ i A A E Q S
where pi is the pollution index of a single element “i”, γi is the concentration of the metal “i” in µg/L and AA-EQS is the environmental quality standard expressed as the average annual concentration (0.2 µg/L for Cd, 1.3 µg/L for Pb and 8.6 µg/L Ni). It should be noted that these values correspond to the environmental quality standards for Cd, Pb and Ni defined by the European Union Water Framework Directive (WFD) [35].
The pollution index values were calculated for each separate concentration value (pi > 1 indicates that pollution was found). The maximum pollution index based on the dissolved concentrations was 0.41 for Pb, detected at the sampling site PU-14 during the July 2021 campaign. The maximum pollution index was found to be 0.18 for Cd and 0.06 for Ni.
The potential influence of other TMs on ecosystems is recognized by the Australian and New Zealand legislation which defines threshold values (default guideline values—DGVs: see Table S2 for values) for a number of substances including Zn, Cu and Co [36]. Based on the proposed values and dissolved concentrations, the maximum pollution indexes for Cu and Co are above 1 (8.4 and 5.8, respectively) regarding the action level for the protection of 99% of marine species. The cobalt concentrations do not exceed the other specified values (95%, 90% and 80% of species protection), while the Cu concentration is 1.3-times higher than the 95% species protection threshold.
Based on the USEPA continuous concentration criteria for chronic exposure (CCC) [37] and the concentrations of dissolved TMs, none of the pollution indexes exceeded 1. The highest index was found for Cu (0.56).
In 2023, an environmental quality standard for the DGT technique (DGT-EQS) was proposed with the aim of implementing it to comply with the WFD [17,35]. The proposed thresholds are 0.18 µg/L for Cd, 3.08 µg/L for Ni and 0.12 µg/L for Pb. Based on the proposed values, the calculated pi values are 0.05, 1.64 and 0.10 for Cd, Pb and Ni, respectively. Based on the definition of EQS in the WFD, Pb can have adverse effects on human health and the marine ecosystem. However, the proposed DGT-EQS system needs to be further validated, especially in high concentration ranges [17].

4. Conclusions

Pula Bay is one of the most industrialized areas on the Croatian coast, hosting numerous industries that are potential sources of various contaminants. The concentrations of trace metal (TM) contaminants in seawater have never been analyzed in the bay. To fill this gap, the spatio-temporal distribution of dissolved and total (unfiltered) trace metals was studied in four different seasons (2021/2022). The surface and bottom water layers were sampled at 20 sites, while the bioavailability of metals was assessed using Chelex-DGT probes at a selected site located near a point source. In parallel, spot water samples were collected daily during the DGT deployment period (7 days). The spatial distribution revealed that the concentrations of Zn, Pb and Cu are enriched from the reference point outside the bay towards the inner bay, reaching the average enrichment factor (EF) values of 4.3, 8.5 and 3.2, respectively, for the dissolved fractions of the mentioned metals. This is a clear indication of the source of the metals within the bay. However, with the exception of the marinas, which are known to be a source of Cu and Zn, no specific point source was identified. Nickel, Cd and Co concentrations were relatively homogeneous throughout the bay, with no significant EF. Higher concentrations of Zn, Cu and Pb were found during the warmer period due to more intense activities. The bottom water layer had a higher concentration of Pb, while Zn and Cu were found in higher concentrations at the surface. For the other metals, there were no significant differences between the surface and bottom layers. As expected, lower DGT-labile concentrations than dissolved concentrations were determined. The percentages of DGT-labile fractions to total dissolved concentrations were 34%, 71%, 77%, 78%, 86% and 89% for Cu, Zn, Cd, Pb, Co and Ni, respectively. These are very similar values to those found in our previous work in the Krka River estuary [31]. The risk assessment based on national and EU legislation resulted in a pollution index of 0.41 for Pb, while the pollution index associated with DGT-EQS [17] is up to a factor of 1.64 for Pb. For other TMs, the pollution index was below 1, which means that the TM concentrations are unlikely to pose a potential environmental risk.
The results presented reflect the current state of pollution in the bay. However, as the region has been industrialized for decades, a complete picture of the pollution status and potential diffuse sources could be assessed by analyzing sediment cores for total TM concentrations and their reactive fractions. This study is already underway, as is the detailed DGT study covering the entire bay.

Supplementary Materials

The following supporting information can be downloaded at: https://www.mdpi.com/article/10.3390/jmse12030440/s1, Table S1: Maximum and sampling depths at sampling stations for all the sampling campaigns; Figure S1: Temperature, salinity, oxygen saturation and turbidity profiles taken during the November 2021 campaign; Figure S2: Temperature, salinity, oxygen saturation and turbidity profiles taken during the March 2022 campaign; Figure S3: Temperature, salinity, oxygen saturation and turbidity profiles taken during the June 2022 campaign; Figures S4–S6: Spatial variability of dissolved TMs found during the 11/2021, 3/2022 and 6/2022 campaigns, surface layer; Figure S7: Dissolved (upper panel) and total (lower panel) concentrations of analyzed TMs for every campaign in both sampled layers; Figure S8: Dissolved fraction of analyzed TMs for every campaign in both sampled layers; Table S2: Environmental quality standards for metals in marine waters.

Author Contributions

O.G. and A.-M.C. contributed equally to this paper and share first authorship. Conceptualization, O.G., A.-M.C. and D.O.; methodology, D.O.; formal analysis, O.G. and A.-M.C.; investigation, O.G., A.-M.C., I.F. and D.O.; resources, O.G. and D.O.; data curation, O.G. and D.O.; writing—original draft preparation, O.G.; writing—review and editing, O.G., A.-M.C., I.F. and D.O.; visualization, O.G.; supervision, D.O.; project administration, D.O.; funding acquisition, O.G. and D.O. All authors have read and agreed to the published version of the manuscript.

Funding

This work was realized within the scope of the project “New methodological approach to bio-geochemical studies of trace metal speciation in coastal aquatic ecosystems” supported by the Croatian Science Foundation under the project number IP–2014–09–7530.

Institutional Review Board Statement

Not applicable.

Informed Consent Statement

Not applicable.

Data Availability Statement

Data are contained within the article and Supplementary Materials.

Acknowledgments

We would like to thank the captain of the vessel “Helga”, Ivan Perković, for his kind assistance in realizing sampling campaigns.

Conflicts of Interest

The authors declare no conflicts of interest.

References

  1. Fichet, D.; Radenac, G.; Miramand, P. Experimental studies of impacts of harbour sediments resuspension to marine invertebrates larvae: Bioavailability of Cd, Cu, Pb and Zn and toxicity. Mar. Pollut. Bull. 1998, 36, 509–518. [Google Scholar] [CrossRef]
  2. Gao, Y.; Zhou, C.Y.; Gaulier, C.; Bratkic, A.; Galceran, J.; Puy, J.; Zhang, H.; Leermakers, M.; Baeyens, W. Labile trace metal concentration measurements in marine environments: From coastal to open ocean areas. Trac.-Trend Anal. Chem. 2019, 116, 92–101. [Google Scholar] [CrossRef]
  3. Mason, R. Trace metal(oid)s in marine waters. In Trace Metals in Aquatic Systems; Mason, R., Ed.; A John Wiley & Sons: Chichester, UK, 2013; pp. 219–309. [Google Scholar]
  4. Egleston, E.S.; Morel, F.M.M. Nickel limitation and zinc toxicity in a urea-grown diatom. Limnol. Oceanogr. 2008, 53, 2462–2471. [Google Scholar] [CrossRef]
  5. Chiarelli, R.; Martino, C.; Roccheri, M.C. Cadmium stress effects indicating marine pollution in different species of sea urchin employed as environmental bioindicators. Cell Stress Chaperones 2019, 24, 675–687. [Google Scholar] [CrossRef]
  6. Echeveste, P.; Agusti, S.; Tovar-Sanchez, A. Toxic thresholds of cadmium and lead to oceanic phytoplankton: Cell size and ocean basin-dependent effects. Environ. Toxicol. Chem. 2012, 31, 1887–1894. [Google Scholar] [CrossRef]
  7. Karlsson, J.; Ytreberg, E.; Eklund, B. Toxicity of anti-fouling paints for use on ships and leisure boats to non-target organisms representing three trophic levels. Environ. Pollut. 2010, 158, 681–687. [Google Scholar] [CrossRef] [PubMed]
  8. Ytreberg, E.; Karlsson, J.; Eklund, B. Comparison of toxicity and release rates of Cu and Zn from anti-fouling paints leached in natural and artificial brackish seawater. Sci. Total Environ. 2010, 408, 2459–2466. [Google Scholar] [CrossRef]
  9. Blewett, T.A.; Leonard, E.M. Mechanisms of nickel toxicity to fish and invertebrates in marine and estuarine waters. Environ. Pollut. 2017, 223, 311–322. [Google Scholar] [CrossRef]
  10. Saili, K.S.; Cardwell, A.S.; Stubblefield, W.A. Chronic Toxicity of Cobalt to Marine Organisms: Application of a Species Sensitivity Distribution Approach to Develop International Water Quality Standards. Environ. Toxicol. Chem. 2021, 40, 1405–1418. [Google Scholar] [CrossRef]
  11. Long, E.R.; Robertson, A.; Wolfe, D.A.; Hameedi, J.; Sloane, G.M. Estimates of the Spatial Extent of Sediment Toxicity in Major U.S. Estuaries. Environ. Sci. Technol. 1996, 30, 3585–3592. [Google Scholar] [CrossRef]
  12. Bruland, K.W.; Lohan, M.C. Controls of Trace Metals in Seawater. In Treatise on Geochemistry; Elderfield, H., Ed.; The Oceans and Marine Geochemistry; Elsevier: Oxford, UK, 2003; Volume 6, pp. 23–47. [Google Scholar]
  13. Cuculić, V.; Cukrov, N.; Kwokal, Ž.; Mlakar, M. Natural and anthropogenic sources of Hg, Cd, Pb, Cu and Zn in seawater and sediment of Mljet National Park, Croatia. Estuar. Coast. Shelf Sci. 2009, 81, 311–320. [Google Scholar] [CrossRef]
  14. Neff, J.M. Zinc in the Ocean. In Bioaccumulation in Marine Organisms; Neff, J.M., Ed.; Elsevier: Oxford, UK, 2002; pp. 175–189. [Google Scholar]
  15. Neff, J.M. Cadmium in the Ocean. In Bioaccumulation in Marine Organisms; Neff, J.M., Ed.; Elsevier: Oxford, UK, 2002; pp. 89–102. [Google Scholar]
  16. Hirose, K. Chemical speciation of trace metals in seawater: A review. Anal. Sci. 2006, 22, 1055–1063. [Google Scholar] [CrossRef]
  17. Amouroux, I.; Gonzalez, J.L.; Guesdon, S.; Belzunce-Segarra, M.J.; Bersuder, P.; Bolam, T.; Caetano, M.; Dos Santos, M.C.; Larreta, J.; Lebrun, L.; et al. A new approach to using Diffusive Gradient in Thin-films (DGT) labile concentration for Water Framework Directive chemical status assessment: Adaptation of Environmental Quality Standard to DGT for cadmium, nickel and lead. Environ. Sci. Eur. 2023, 35, 29. [Google Scholar] [CrossRef]
  18. Unsworth, E.R.; Warnken, K.W.; Zhang, H.; Davison, W.; Black, F.; Buffle, J.; Cao, J.; Cleven, R.; Galceran, J.; Gunkel, P.; et al. Model predictions of metal speciation in freshwaters compared to measurements by in situ techniques. Environ. Sci. Technol. 2006, 40, 1942–1949. [Google Scholar] [CrossRef]
  19. Davison, W.; Zhang, H. Progress in understanding the use of diffusive gradients in thin films (DGT)—Back to basics. Environ. Chem. 2012, 9, 1–13. [Google Scholar] [CrossRef]
  20. Amato, E.D.; Simpson, S.L.; Jarolimek, C.V.; Jolley, D.F. Diffusive gradients in thin films technique provide robust prediction of metal bioavailability and toxicity in estuarine sediments. Environ. Sci. Technol. 2014, 48, 4485–4494. [Google Scholar] [CrossRef] [PubMed]
  21. Duran, I.; Beiras, R. Ecotoxicologically based marine acute water quality criteria for metals intended for protection of coastal areas. Sci. Total Environ. 2013, 463–464, 446–453. [Google Scholar] [CrossRef]
  22. Di Cesare, A.; Pjevac, P.; Eckert, E.; Curkov, N.; Miko Sparica, M.; Corno, G.; Orlic, S. The role of metal contamination in shaping microbial communities in heavily polluted marine sediments. Environ. Polluttion 2020, 265, 114823. [Google Scholar] [CrossRef]
  23. Cindrić, A.M.; Garnier, C.; Oursel, B.; Pižeta, I.; Omanović, D. Evidencing the natural and anthropogenic processes controlling trace metals dynamic in a highly stratified estuary: The Krka River estuary (Adriatic, Croatia). Mar. Pollut. Bull. 2015, 94, 199–216. [Google Scholar] [CrossRef] [PubMed]
  24. Cindrić, A.-M.; Cukrov, N.; Durrieu, G.; Garnier, C.; Pižeta, I.; Omanović, D. Evaluation of Discrete and Passive Sampling (Diffusive Gradients in Thin-films—DGT) Approach for the Assessment of Trace Metal Dynamics in Marine Waters—A Case Study in a Small Harbor. Croat. Chem. Acta 2017, 90, 177–185. [Google Scholar] [CrossRef]
  25. Ciglenečki, I.; Vilibić, I.; Dautović, J.; Vojvodić, V.; Ćosović, B.; Zemunik, P.; Dunić, N.; Mihanović, H. Dissolved organic carbon and surface active substances in the northern Adriatic Sea: Long-term trends, variability and drivers. Sci. Total Environ. 2020, 730, 139104. [Google Scholar] [CrossRef]
  26. Penezić, A.; Gašparović, B.; Cuculić, V.; Strmečki, S.; Djakovac, T.; Mlakar, M. Dissolved Trace Metals and Organic Matter Distribution in the Northern Adriatic, an Increasingly Oligotrophic Shallow Sea. Water-Sui 2022, 14, 349. [Google Scholar] [CrossRef]
  27. Zago, C.; Capodaglio, G.; Barbante, C.; Giani, M.; Moret, I.; Scarponi, G.; Cescon, P. Heavy Metal Distribution and Speciation in the Northern Adriatic Sea. Chem. Ecol. 2002, 18, 39–51. [Google Scholar] [CrossRef]
  28. Illuminati, S.; Annibaldi, A.; Truzzi, C.; Tercier-Waeber, M.L.; Nöel, S.; Braungardt, C.B.; Achterberg, E.P.; Howell, K.A.; Turner, D.; Marini, M.; et al. In-situ trace metal (Cd, Pb, Cu) speciation along the Po River plume (Northern Adriatic Sea) using submersible systems. Mar. Chem. 2019, 212, 47–63. [Google Scholar] [CrossRef]
  29. Rossi, N.; Jamet, J.L. In situ heavy metals (copper, lead and cadmium) in different plankton compartments and suspended particulate matter in two coupled Mediterranean coastal ecosystems (Toulon Bay, France). Mar. Pollut. Bull. 2008, 56, 1862–1870. [Google Scholar] [CrossRef]
  30. Perez-Cid, B.; Falque, E.; Simal-Gandara, J. Coastline Levels of Dissolved Heavy Metals in the Estuarine Water-System of Vigo. Int. J. Environ. Res. Public Health 2021, 18, 2136. [Google Scholar] [CrossRef]
  31. Cindrić, A.M.; Marcinek, S.; Garnier, C.; Salaun, P.; Cukrov, N.; Oursel, B.; Lenoble, V.; Omanović, D. Evaluation of diffusive gradients in thin films (DGT) technique for speciation of trace metals in estuarine waters—A multimethodological approach. Sci. Total Environ. 2020, 721, 137784. [Google Scholar] [CrossRef] [PubMed]
  32. Marcinek, S.; Cindric, A.M.; Padan, J.; Omanovic, D. Trace Metal Partitioning in the Salinity Gradient of the Highly Stratified Estuary: A Case Study in the Krka River Estuary (Croatia). Appl. Sci. 2022, 12, 5816. [Google Scholar] [CrossRef]
  33. Government of Republic of Croatia. Uredba o Standardu Kakvoće Voda. NN 2023, 96/19, 20/23, 50/23. Available online: https://narodne-novine.nn.hr/clanci/sluzbeni/2023_02_20_341.html (accessed on 29 January 2024).
  34. Su, K.; Wang, Q.; Li, L.; Cao, R.; Xi, Y.; Li, G. Water quality assessment based on Nemerow pollution index method: A case study of Heilongtan reservoir in central Sichuan province, China. PLoS ONE 2022, 17, e0273305. [Google Scholar] [CrossRef] [PubMed]
  35. WFD-2013/39/EU; Directive 2013/39/EU of the European Parliament and of the Council of 12 August 2013 Amending Directives 2000/60/EC and 2008/105/EC as Regards Priority Substances in the Field of Water Policy. European Parliament: Strasbourg, France, 2013.
  36. ANZEEC. Australian and New Zealand Guidelines for Fresh and Marine Water Quality. Available online: https://www.waterquality.gov.au/anz-guidelines/guideline-values/default/water-quality-toxicants/search (accessed on 15 January 2024).
  37. USEPA. National Recommended Water Quality Criteria—Aquatic Life Criteria Table. Available online: https://www.epa.gov/wqc/national-recommended-water-quality-criteria-aquatic-life-criteria-table (accessed on 15 January 2024).
Figure 1. Pula Bay area with indicated sampling sites used for this study and locations of specific industrial/nautical activities. Red dashed line virtually divides the inner and outer parts of the bay.
Jmse 12 00440 g001
Figure 2. Vertical profiles of main physico-chemical parameters measured at all sampling sites during July 2021 sampling campaign: temperature, salinity, oxygen saturation and turbidity.
Jmse 12 00440 g002
Figure 3. Spatial variability of dissolved TMs measured in samples taken during the July 2021 campaign in the surface layer. Metals are indicated on each map.
Jmse 12 00440 g003
Figure 4. Average surface and bottom concentrations of dissolved TMs with standard deviations (error bars), measured during four sampling campaigns at the sampling sites PU-1 to PU-20.
Jmse 12 00440 g004
Figure 5. Dissolved concentrations of TMs in discrete samples taken daily during the DGT deployment period (D0–D8), average value (AVG) and the concentrations in the composite sample (Comp). The red dashed line corresponds to the DGT-labile concentrations. The percentages of DGT-labile fractions shown in the plots represent the portion of the DGT-labile concentration compared to the average dissolved concentration. Error bars represent the standard deviations of analytical measurements.
Jmse 12 00440 g005
Table 1. Comparison of dissolved TM concentrations from this study to other relevant studies.
Zn (ug/L)Cd (μg/L)Pb (μg/L)Cu (μg/L)Ni (μg/L)Co (μg/L)Reference
MinMaxMinMaxMinMaxMinMaxMinMaxMinMax
Pula Bay–Ref. site0.1470.5650.0070.0110.0120.0590.2400.3800.3340.4700.0140.033This study
Pula Bay–Surface0.2353.1830.0070.0160.0120.4080.2431.7360.3080.5280.0120.033This study
Pula Bay–Bottom0.1472.3820.0060.0200.0140.5290.2401.4130.3430.5290.0120.033This study
Šibenik Bay0.4646.6040.0060.0230.0080.2300.4084.3650.3000.6280.0150.030[23]
N. Adriatic, 1080.3277.5850.0040.0200.0100.1310.1911.0800.2350.6460.0120.071[26]
N. Adriatic, 1070.39214.6470.0030.0180.0100.2590.1911.0800.2351.1150.0060.041[26]
North Adriatic0.2032.256 0.1310.726 0.0040.097[27]
River Po plume 0.0080.0280.0190.0830.1270.699 [28]
Table 2. Average EF (SD) for dissolved and total TMs for all four campaigns.
EF Dissolved TMEF Total TM
SurfaceBottomSurfaceBottom
Zn4.3 (2.0)5.7 (3.1)6.1 (2.2)5.1 (2.2)
Cd1.2 (0.4)1.3 (0.5)1.3 (0.6)1.4 (0.6)
Pb8.5 (5.2)9.0 (6.1)10.0 (7.7)7.7 (6.9)
Cu3.2 (1.3)2.8 (0.9)3.7 (1.8)3.8 (1.7)
Ni1.1 (0.2)1.0 (0.1)1.1 (0.2)1.1 (0.2)
Co1.1 (0.5)1.1 (0.5)1.2 (0.6)1.2 (0.6)
Disclaimer/Publisher’s Note: The statements, opinions and data contained in all publications are solely those of the individual author(s) and contributor(s) and not of MDPI and/or the editor(s). MDPI and/or the editor(s) disclaim responsibility for any injury to people or property resulting from any ideas, methods, instructions or products referred to in the content.

