Article

Hydrogen Fuel Cell as an Electric Generator: A Case Study for a General Cargo Ship

by
Omer Berkehan Inal
1,*,
Burak Zincir
1,
Caglar Dere
2 and
Jean-Frédéric Charpentier
3,*
1
Department of Marine Engineering, Maritime Faculty, Istanbul Technical University, Tuzla, 34940 Istanbul, Turkey
2
Department of Marine Engineering, Faculty of Naval Architecture and Maritime, Izmir Katip Celebi University, Cigli, 35620 Izmir, Turkey
3
Naval Academy Research Institute, Ecole Navale, Arts et Métiers Paris Tech, 29240 Cedex 9 Brest, France
*
Authors to whom correspondence should be addressed.
J. Mar. Sci. Eng. 2024, 12(3), 432; https://doi.org/10.3390/jmse12030432
Submission received: 13 January 2024 / Revised: 22 February 2024 / Accepted: 27 February 2024 / Published: 28 February 2024
(This article belongs to the Special Issue New Advances on Energy and Propulsion Systems for Ship)

Abstract

:
In this study, real voyage data and ship specifications of a general cargo ship are employed, and it is assumed that diesel generators are replaced with hydrogen proton exchange membrane fuel cells. The effect of the replacement on CO2, NOX, SOX, and PM emissions and the CII value is calculated. Emission calculations show that there is a significant reduction in emissions when hydrogen fuel cells are used instead of diesel generators on the case ship. By using hydrogen fuel cells, there is a 37.4% reduction in CO2 emissions, 32.5% in NOX emissions, 37.3% in SOX emissions, and 37.4% in PM emissions. If hydrogen fuel cells are not used instead of diesel generators, the ship will receive an A rating between 2023 and 2026, a B rating in 2027, a C rating in 2028–2029, and an E rating in 2030. On the other hand, if hydrogen fuel cells are used, the ship will always remain at an A rating between 2023 and 2030. The capital expenditure (CAPEX) and operational expenditure (OPEX) of the fuel cell system are USD 1,305,720 and USD 2,470,320, respectively, for a 15-year lifetime, and the hydrogen fuel expenses are competitive at USD 260,981, while marine diesel oil (MDO) fuel expenses are USD 206,435.

1. Introduction

The maritime industry plays a key role in facilitating international trade. The international shipping industry is responsible for transporting over 80% of global trade in terms of volume [1]. Compared to other types of transport, maritime transport allows more cargo to be transported from one place to another at once. For this reason, it is the most efficient type of transportation that emits the lowest carbon dioxide (CO2) emissions into the atmosphere in terms of its cargo-carrying capacity per mile. In addition to this huge amount of transported goods, ships use fossil fuels such as heavy fuel oil (HFO), marine diesel oil (MDO), and marine gas oil (MGO) for their propulsion and electric generation. Although vital to the worldwide economy, ship emissions have become a significant concern due to their contribution to GHG emissions and air pollution. The maritime industry has come under increasing examination due to its substantial environmental footprint, especially considering the release of greenhouse gases (GHGs) and pollutant emissions in coastal areas. The shipping industry is responsible for approximately 3% of global CO2 emissions [2], 19.35% of global NOX emissions, 11.05% of global SOX emissions, 4.41% and 8.39% of global PM10 and PM2.5 emissions, and 1.89% of global CO emissions [3]. As the world copes with the challenge of mitigating pollution, climate change, and global warming, shipping emissions have increasingly drawn the attention of policymakers, researchers, and the public due to their significant contributions to climate change and air quality degradation. Furthermore, these emissions have adverse effects not only on the global climate but also on the health of coastal communities and ecosystems [4].
Shipping emissions cover a wide range of pollutants, including CO2, NOX, SOX, and particulate matter (PM) [5]. The scale of these emissions is substantial, with the International Maritime Organization (IMO) estimating that global shipping was responsible for emitting around 796 million tons of CO2 in 2019 [6]. In response to this issue, the International Maritime Organization and other international entities have adopted emission reduction policies such as the Energy Efficiency Design Index (EEDI), the Energy Efficiency Existing Ship Index (EEXI) which covers existing ships, the Carbon Intensity Index (CII), and the Ship Energy Efficiency Management Plan (SEEMP) to improve energy efficiencies and mitigate the environmental impact of shipping [7,8]. Starting from 2023, the required CII must be reduced by 2% per year. To benchmark the annual performance of ships, a rating mechanism is introduced based on the 2019 performance of the global fleet. Ships rated as C or better are not facing corrective actions. However, a D rating for three consecutive years or an E rating leads to a corrective action plan for the SEEMP to maintain compliance [9]. These measures aim to achieve a reduction in GHG emissions and improve energy efficiency in ships [10]. With the candidate measures, it is aimed to reduce CO2 emissions by 40% in 2030 compared to the 2008 level, and by 70% in 2050 compared to the 2008 level [5]. Additionally, the industry is exploring alternative fuels such as liquefied natural gas (LNG), methanol, ammonia, and new propulsion/electric generation systems, for instance, fuel cells [11,12,13]. One approach to reducing ship emissions is through optimizing ship energy efficiency. Energy efficiency management strategies that consider both safety and economic factors are of practical significance in enhancing ship energy efficiency, which leads to reduced CO2 emissions [14]. Acting on mission profile and mission constraints by reducing ship speed is another recommended measure to reduce emissions [15]. Alternatively, the use of after-treatment systems, such as scrubbers and exhaust gas cleaning systems, can effectively reduce harmful emissions such as sulfur dioxide (SO2) and NOX from ships, as well as the implementation of emissions trading systems as a market-based measure to mitigate CO2 emissions [16,17]. Another option is the adoption of fuel cells, an important emission reduction method in terms of compliance with the CII regulation which was put into effect by IMO in January 2023.
Reducing ship emissions is a crucial step in addressing climate change and achieving emission reduction targets. The adoption of various strategies, including optimizing energy efficiency, reducing ship speed, using alternative fuels, and implementing market-based instruments, can contribute to the reduction in GHG emissions and improve the environmental performance of the shipping industry.
In this study, real voyage data and ship specifications of a general cargo ship are taken from a ship management company, and it is assumed that diesel generators are replaced with proton exchange membrane fuel cells (PEMFCs) that use hydrogen as an alternative fuel. The effect of the replacement on CO2, NOX, SOX, and PM emissions and the CII value is calculated. The PEM fuel cell replacement produces promising results that deserve attention.
This article investigates hydrogen fuel cell availability by utilizing a data-driven approach from a real general cargo ship. To be more precise, the article merges information gathered from the existing literature with real-world data provided by a prominent cargo ship operator. This combination serves two main purposes: (a) to determine the potential reduction in emissions specific to each ship based on technical and operational compliance choices, and (b) to assess the economic and technological consequences of implementing short-term measures on a chosen vessel.
This approach illustrates the dependency of the results on ship-specific characteristics. Unlike the current literature, it analyzes the operational data of the case ship to provide the evidence-based perspective missing from the more generalized model-based previous results. This paper is structured as follows. First, Section 2 introduces the methodology used for the case study by giving the properties of hydrogen PEMFCs. Section 3 analyzes the obligations resulting from the recent regulatory interventions while introducing a set of technical and operational compliance options for which ship-specific reduction potentials are calculated. Lastly, Section 4 concludes this study.

2. Methodology

The methodology section comprises the introduction of the case ship, the voyage information of the case ship, and the equations and assumptions for the calculations.

2.1. Ship Specifications
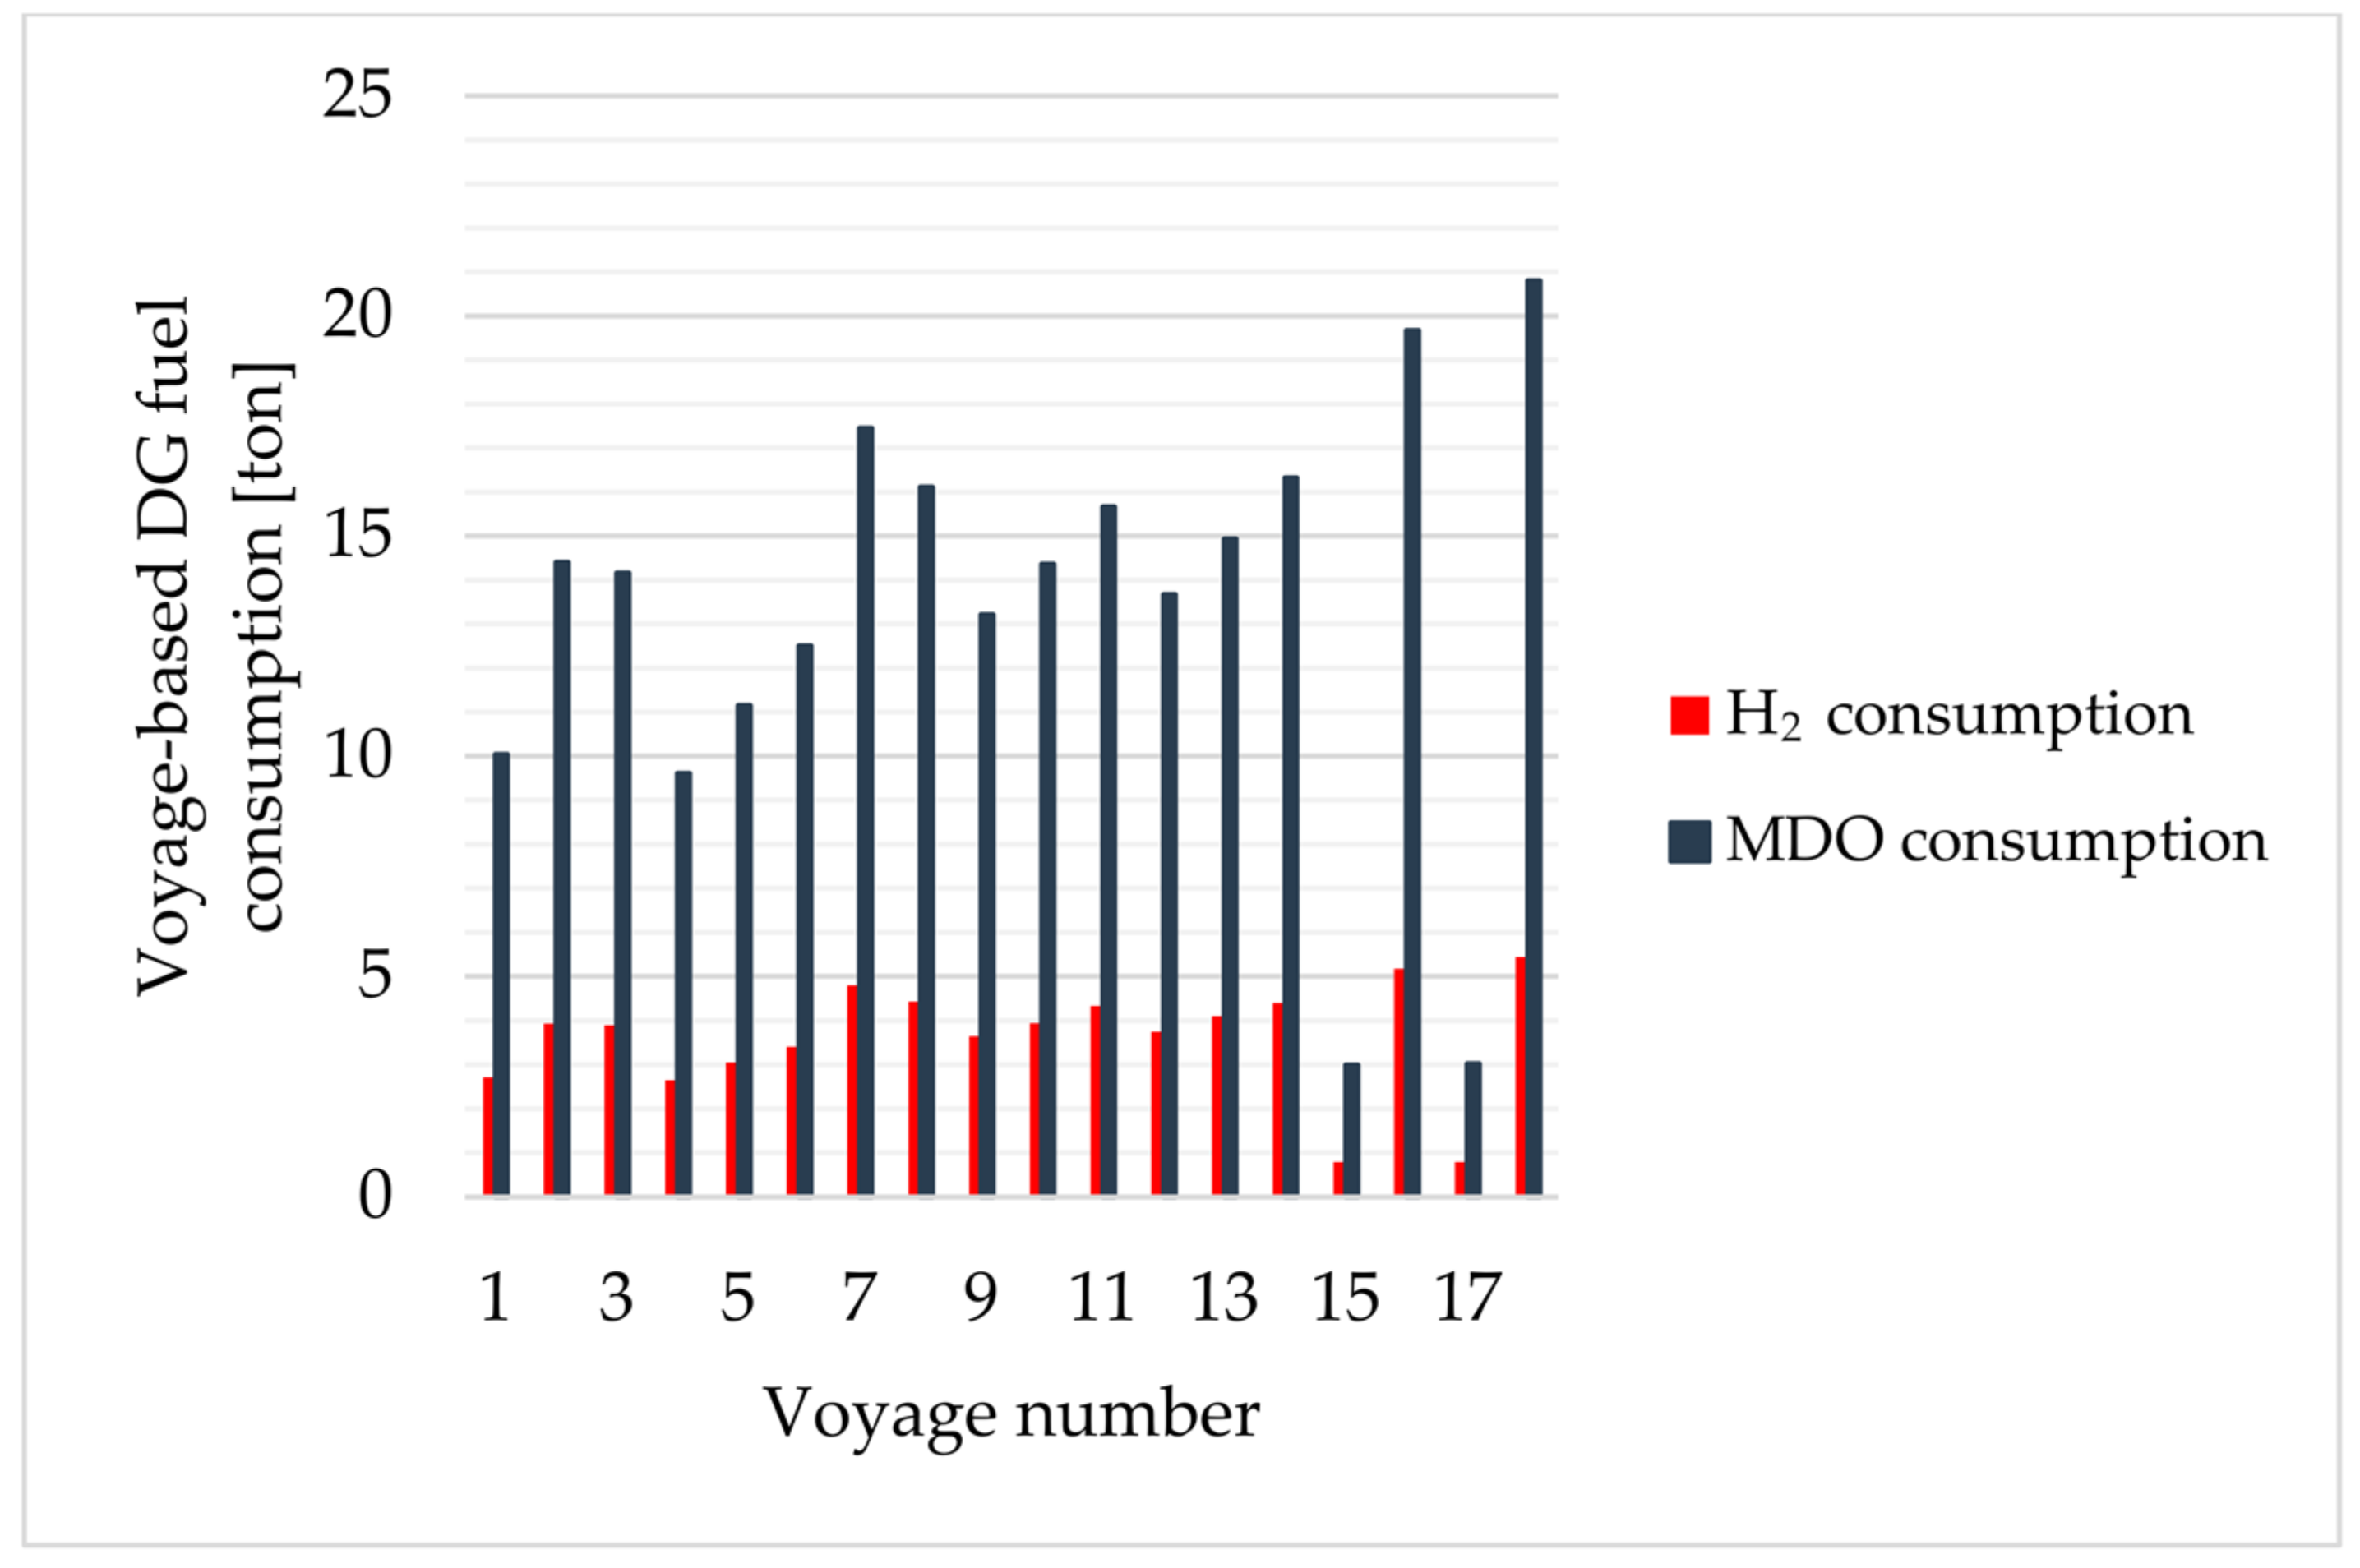
The case ship subject to this study is a general cargo ship that undertakes voyages in the Mediterranean Sea, the Black Sea, and the Marmara Sea. The case ship is a medium-sized general cargo ship. This kind of ship constitutes 43% of the total global fleet undertaking international voyages [18]. The ship specifications are obtained from the ship management company, Seahorse Shipping and Engineering Co., Ltd. (Istanbul, Turkey), and are shown in Table 1.

2.2. Voyage Data

The management company of the case ship provided the real voyage data between March 2020 and January 2021. Table 2 shows eighteen voyages with the voyage duration, port stay duration, and idle stay duration. The voyage distances were calculated by the Netpas Distance 4.0 program [19]. The ports and average ship speed were entered into the program and it calculated the shortest route and voyage duration. The average speed, port stay duration, and idle stay duration were given by the management company. The idle stay duration means that the ship waited to berth at a port or for a new voyage to be fixed.

2.3. Equations and Assumptions

This case study focuses on fuel consumption, CO2, NOX, SOX, and PM emissions, CII rating, cost, and storage space calculations. The calculations are initiated by the fuel consumption calculation. To calculate the fuel consumption, Figure 1 and Figure 2 and Equations (1)–(4) are used [13].
γ M E = P a c t u a l , M E P d e s i g n , M E = ( V a c t u a l V d e s i g n ) α
γ D G = P a c t u a l , D G P d e s i g n , D G
F v o y = S F C M E × P a c t u a l , M E × D v o y + S F C D G × P a c t u a l , D G × D v o y + S F C D G × P a c t u a l , D G × D p o r t + S F C D G × P a c t u a l , D G × D i d l e
F t o t = i = 1 i = 18 F v o y i
γ M E is the main engine load. P a c t u a l , M E and V a c t u a l are the actual main engine power in kW and the actual ship speed in knots during the voyage, and P d e s i g n , M E and V d e s i g n are the design power of the main engine in kW and the design ship speed in knots. α is the speed coefficient which is between 2.5 and 3 [20]. It is taken as 2.5 in this study according to the ship power–ship speed data taken from the noon reports. γ D G is the diesel generator (DG) load in percent. P a c t u a l , D G and P d e s i g n , D G are the actual DG power in kW and the design power of the DG in kW, respectively. F v o y is the voyage-based fuel consumption in fuel tons, D v o y is the voyage duration in hours, and F t o t is the total fuel consumption of eighteen voyages. SFCME and SFCDG are the specific amounts of fuel consumption derived from the instruction books of the main engine and diesel generators and are given by the curve of Figure 1 for the main engine and Figure 2 for the diesel generators.
The total emissions of the eighteen voyages are calculated by Equations (5)–(9) [12,13].
V C O 2 = F v o y × C f M D O
V C O 2 t o t a l = i = 1 i _ 18 V C O 2 i
V N O X = ( c N O X × P a c t u a l , M E × D v o y + c N O X × P a c t u a l , D G × D v o y + c N O X × P a c t u a l , D G × D p o r t + c N O X × P a c t u a l , D G × D i d l e
V S O X = S F C M E × 2 × 0.97753 × f s × P a c t u a l , M E × D v o y + S F C D G × 2 × 0.97753 × f s × P a c t u a l , D G × D v o y + S F C D G × 2 × 0.97753 × f s × P a c t u a l , D G × D p o r t + ( S F C D G × 2 × 0.97753 × f s × P a c t u a l , D G × D i d l e )
V P M = 0.23 + S F C M E × 7 × 0.02247 × f s 0.0024 × P a c t u a l , M E × D v o y + 0.23 + S F C D G × 7 × 0.02247 × f s 0.0024 × P a c t u a l , D G × D v o y + 0.23 + S F C D G × 7 × 0.02247 × f s 0.0024 × P a c t u a l , D G × D p o r t + 0.23 + S F C D G × 7 × 0.02247 × f s 0.0024 × P a c t u a l , D G × D i d l e
where V C O 2 is the voyage-based CO2 emissions in tons, C f M D O is the carbon content of MDO, which is 3.206, V C O 2 t o t a l is the total CO2 emissions of the eighteen voyages in tons, V N O X is the total NOX emissions of the eighteen voyages in tons, and C N O X is the NOX coefficient in g/kWh, which is assumed as 12.1 g/kWh for the maximum limit for the NOX Tier I. D p o r t is the port stay duration in days and D i d l e is the idle stay duration in days. V S O X is the total SOX emissions of the eighteen voyages in tons, 2 is the ratio of the molecular weight of SO2 to sulfur, 0.97753 is the conversion factor of fuel sulfur to SOX, f s is the sulfur fraction, which is 0.1% for LSMDO, and 0.23 is the fuel type coefficient for MDO. V P M is the total PM emissions of the eighteen voyages in tons, 7 is the ratio of the molecular weight of sulfate PM to sulfur, and 0.02247 is the conversion factor of fuel to PM [6].
Lastly, the CII rating is calculated by the following equations [21,22,23,24]:
C I I r e f = a × c a p a c i t y c
R e q u i r e d   C I I = 100 z 100 × C I I r e f
A t t a i n e d   C I I = V C O 2 t o t a l c a p a c i t y × d i s t a n c e
c R = A t t a i n e d   C I I R e q u i r e d   C I I
where a and c are the coefficients, which are 588 and 0.3885 for a general cargo ship [22], respectively, capacity is the deadweight of the ship, z is the year-based reduction factor, and distance is the total voyage distance, which is 16,841 NM for this study.

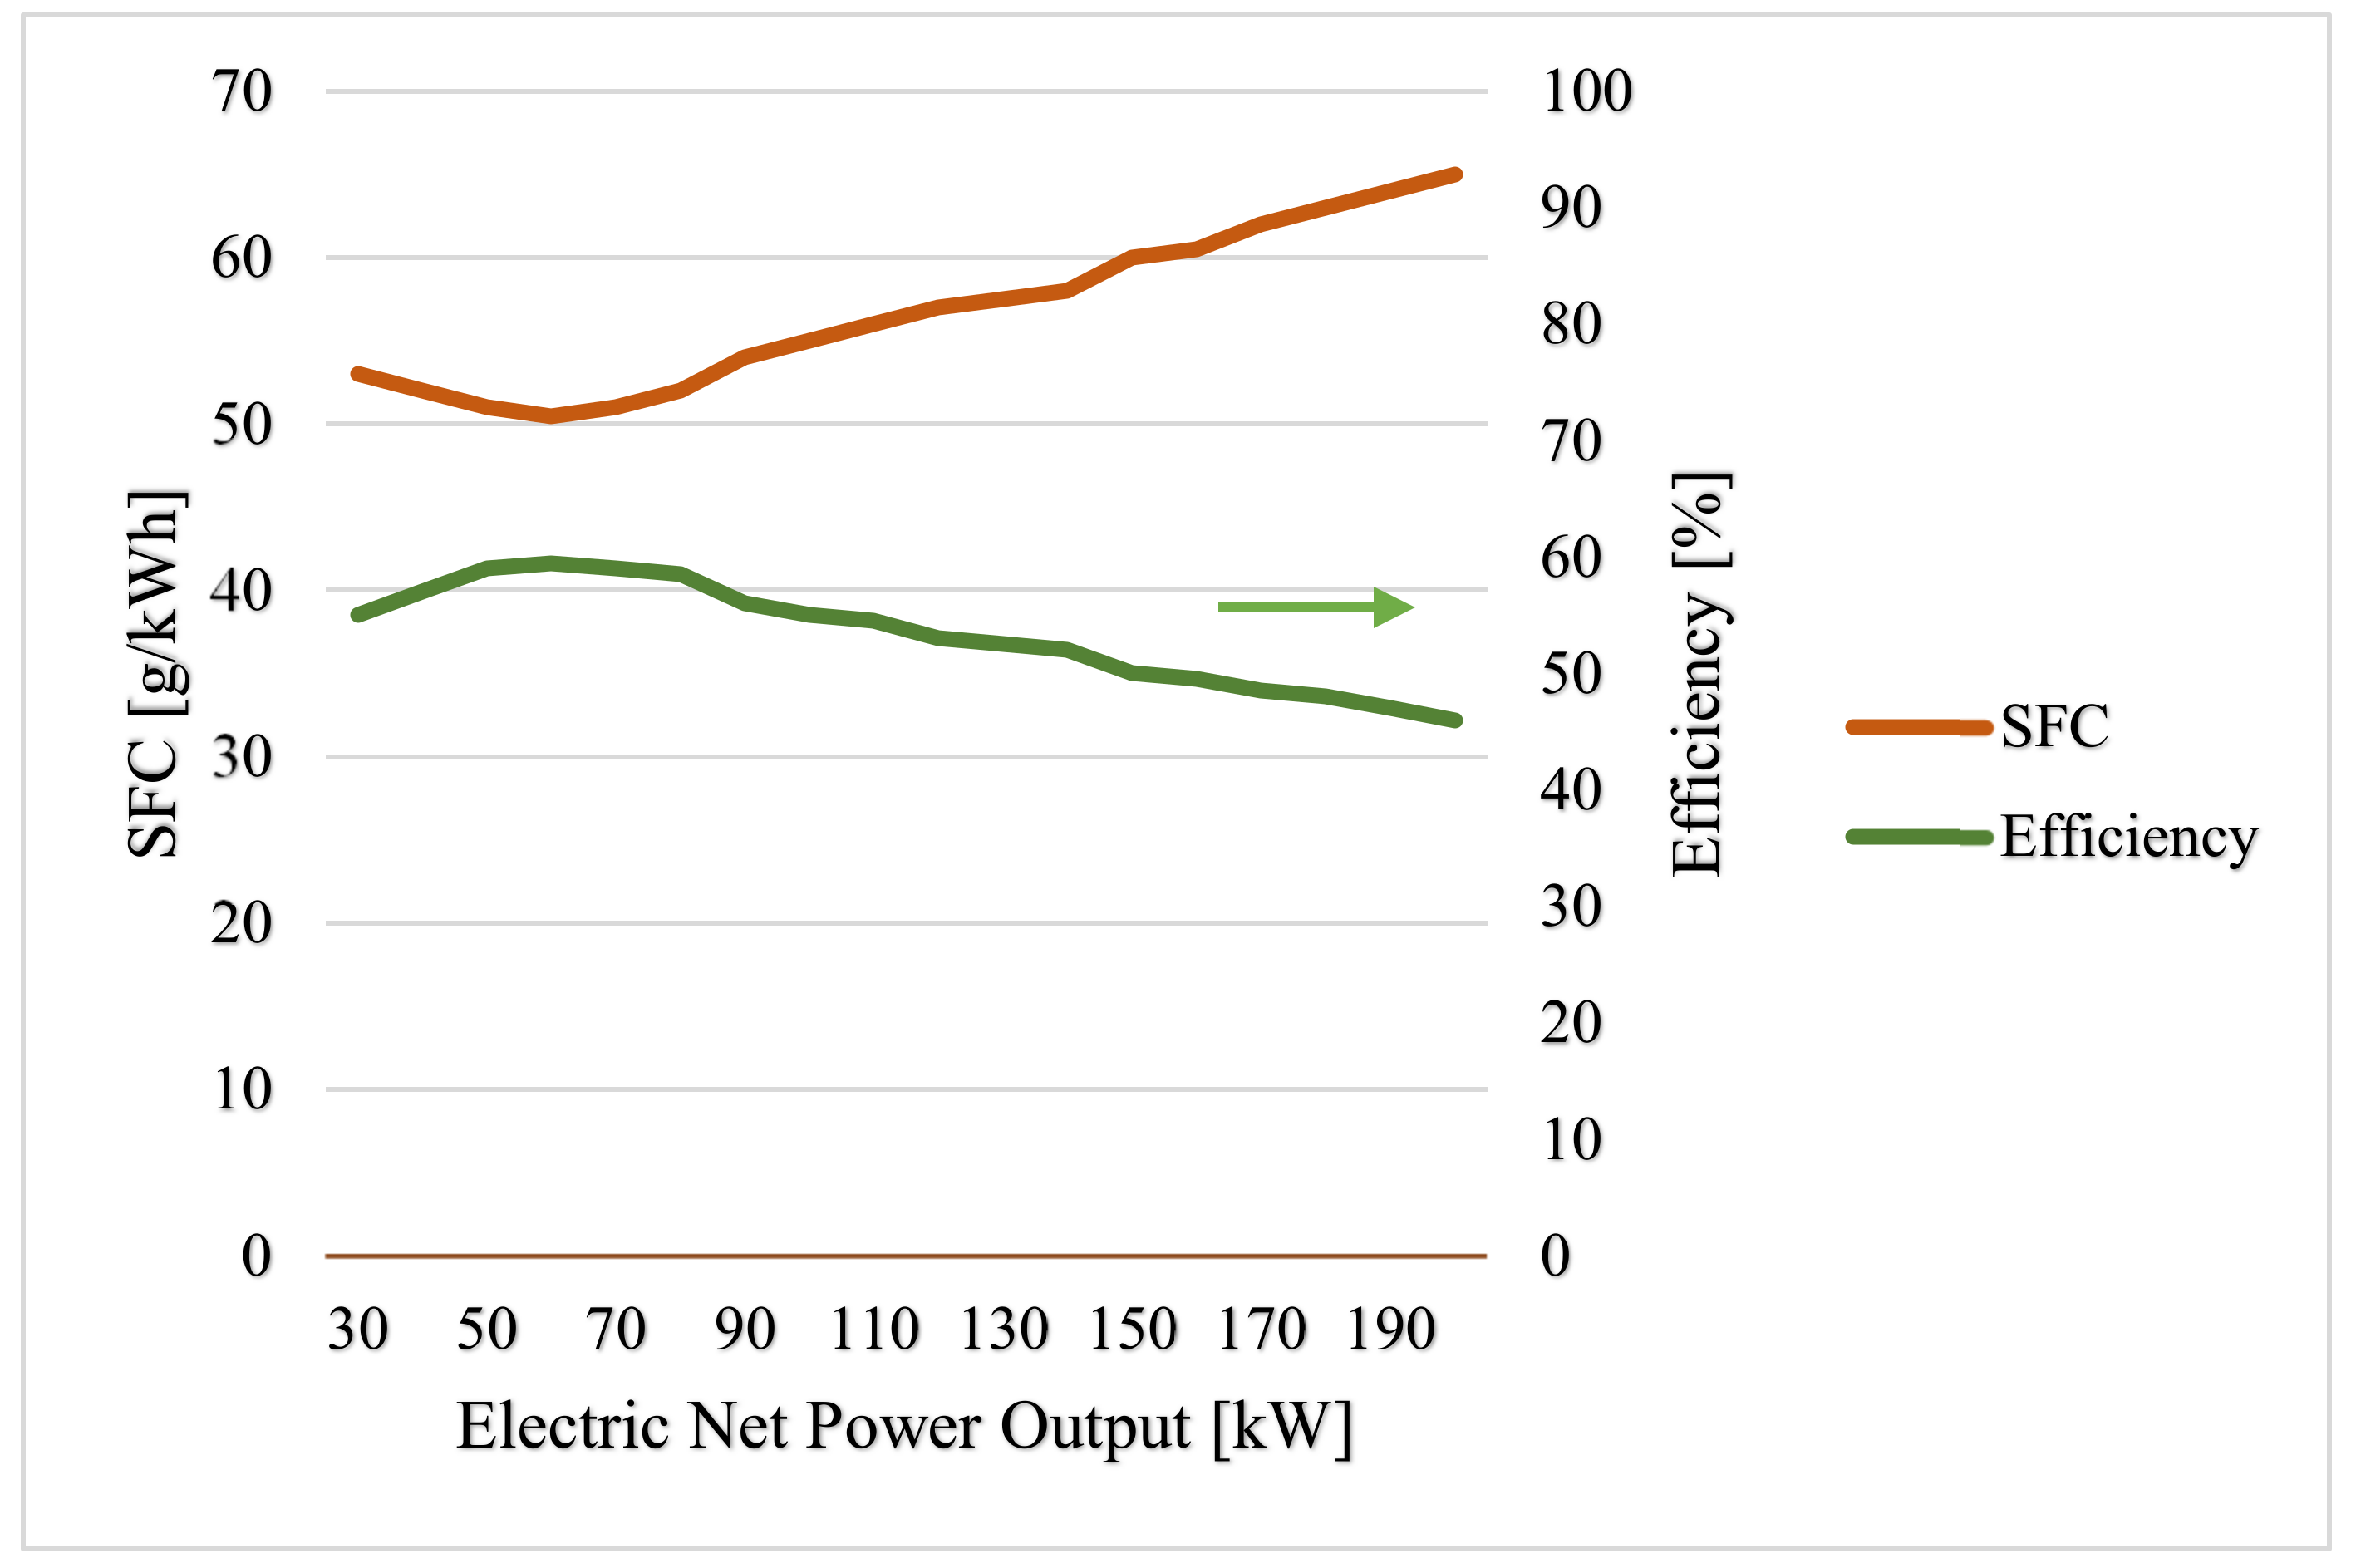
2.4. PEMFC Selection and Calculations

The case ship has two diesel generators with a maximum power of 220 kW each. However, according to the statement of the ship management company, the ship requires an average of 140 kW during voyages and port stays, and 85 kW during idle stays. That means that it can be considered that one of the two DGs is operated at 64% of engine load and 39% of engine load during voyages/port stays and idle stays, respectively. There is a variety of PEMFC units in the market with different maximum net power. The PEMFC unit that is assumed to be used in this study is the Marine 200 PEMFC unit of PowerCell Group (Gothenburg, Sweden). This is a marine-type fuel cell unit with a maximum net power of 200 kW, which is suitable for the case ship. The main characteristics of this PEMFC unit are given in Table 3. A configuration with two units of the Marine 200 PEMFC is adequate for the case ship, as one of them operates and the other one is in a standby position.
By using Equation (14) and Figure 3, it is calculated that the fuel consumption is 4.4 kg/h and 8.1 kg/h at 85 kW and 140 kW electrical load with 58% and 52% fuel cell efficiency, respectively. The voyage-based H2 consumption calculation of the PEMFC unit is carried out by using Equation (15).
η F C = W ˙ m H 2 ˙ × L H V H 2
F H 2 v o y = m H 2 v o y ˙ × 24 × D v o y + m H 2 p o r t ˙ × 24 × D p o r t s t a y + m H 2 i d l e ˙ × 24 × D i d l e s t a y
where P D G v o y p o r t is the required electrical power from the DG which is 140 kW/h during voyage and port stay conditions, D p o r t s t a y is the duration of the port stay in days, P D G i d l e is the required electrical power from the DG which is 85 kW/h during the idle stay condition, and D i d l e s t a y is the duration of the idle stay in days.
Another calculation is the H2 tank capacity calculation. It is calculated by using Equation (16).
V t a n k = F H 2 v o y ρ H 2 × c t a n k
where ρ H 2 is the density of compressed H2 at 350 bar, which is 23 kg/m3 [28], c t a n k is the ratio of external tank volume of 60 L/kg and internal tank volume of 44 L/kg [29], which is 1.364, and V t a n k is the required tank volume for each voyage. The calculation is also carried out to ascertain the required tank volume for MDO usage. The ρ M D O density is taken as 860 kg/m3 [30].

2.5. Economic Calculations

The economic calculations of the case study consist of system costs and fuel costs. The system costs are the PEMFC cost of PowerCell which is 1400 EUR/kW, the installation cost of 280 EUR/kW, the annual maintenance cost of 0.044 EUR/kWh [31], and the compressed H2 tank (350 bar) cost of 86 USD/kg [32] that equates to 1978 USD/m3. Since there is an existing DG and related systems on the case ship, the system costs are not calculated for the existing system. All EUR currency is converted to USD with an exchange rate of 1.06. Fuel cost is assumed to be 860 USD/ton [33] and 4000 USD/ton [34] for MDO and H2, respectively.

3. Case Study Results

This case study is conducted to analyze all aspects, including fuel consumption, emissions, compliance with the new CII regulation, tank space requirement, and costs, of using PEMFCs instead of DGs for the electricity requirement of the case ship.
The fuel consumption of the ME and DGs is calculated with the initial configuration. Figure 4 shows the voyage-based ME fuel consumption. The voyage-based fuel consumption varies between 8.5 tons and 39.9 tons depending on the ship’s average speed, voyage distance, and voyage duration. These data will be used during the calculation of voyage-based emissions.
The voyage-based DG fuel consumption is shown for each voyage in Figure 5. The graph shows fuel consumption both with PEMFCs and without PEMFCs in the place of DGs. The total consumption is the sum of fuel consumption during the voyage, port stay, and idle stay conditions. MDO consumption of the DGs varies between 3 tons and 20.8 tons depending on the voyage; on the other hand, H2 consumption of the PEMFCs varies between 0.8 tons and 5.4 tons. The reasons for the lower fuel consumption of PEMFCs are a higher lower heating value (LHV) of H2, at 120.1 MJ/kg [35], than MDO and a higher efficiency of chemical to electrical conversion of PEMFCs than the internal combustion engines, around 50% and 40%, respectively.
Emission calculations show that there is a significant reduction in emissions when H2 PEMFCs are used instead of DGs on the case ship. Although the main engine power and fuel consumption are higher than the power and fuel consumption of diesel generators, there has been a significant reduction in emissions based on total voyages. Figure 6 shows the total CO2, NOX, SOX, and PM emissions when the PEMFC is not used and when the PEMFC is used as an electric generator. As a result of the carbon-free structure of hydrogen fuel and the production of the electrical energy required for the ship in the form of a chemical reaction in the fuel cell, CO2, NOX, SOX, and PM emissions originating from the DGs do not occur. As a result of the reaction, only water is released as a product. By using hydrogen fuel cells instead of DGs, there is a 37.4% reduction in CO2 emissions, 32.5% in NOX emissions, 37.3% in SOX emissions, and 37.4% in PM emissions.
The CII regulation is a rule that came into force in January 2023 and gives an energy rating between A and E according to the annual voyage-based CO2 emission amount of a ship. Figure 7 shows the required CII values of the case ship, the A-E rating range values, and the attained CII values calculated when the ship uses and does not use fuel cells. According to the figure, if the PEMFC is not used in place of DGs, the considered ship will receive an A rating between 2023 and 2026, a B rating in 2027, a C rating in 2028–2029, and an E rating in 2030. According to the CII regulation, if a ship receives an E rating, the ship will not be able to sail until it improves its energy efficiency and achieves a higher rating. On the other hand, if the PEMFC is used in place of the case ship’s DGs, the ship will always remain at an A rating between 2023 and 2030.
Another important aspect of using hydrogen PEMFCs is the size of the compressed H2 tanks. The total fuel tank capacity of the case ship is 363 m3, which is taken from the general arrangement plan of the ship. After the calculations, voyage-based required tank volumes are found and are shown in Figure 8. The calculations comprise both ME and DG fuel consumption volume. If the PEMFC unit is applied to the case ship, the required tank volume is significantly higher than the existing tank volumes. The highest tank capacity requirement is 337.4 m3, which is below the total fuel tank capacity. The 298.7 m3 of this volume is the H2 volume. Therefore, it is required that the case ship has to undertake H2 bunkering at almost every port that she berths.
The last analysis of the case study is the economic analysis. Figure 9 shows the system costs in detail. The main part of the system costs is the PEMFC cost and H2 tank cost (300 m3), at USD 593,600 and USD 593,400, respectively. Installation and maintenance costs are relatively small portions of the system costs. The maintenance cost is the annual cost of the H2 PEMFC system. If it is assumed that the lifetime of the PEMFC is 15 years [31,36], the total maintenance cost is USD 2,470,320, which is the operating cost (OPEX) of the system. The capital cost (CAPEX) of the system includes the PEMFC, H2 tank, and installation costs which is equal to USD 1,305,720. The total lifetime cost of the system is USD 3,776,040. In addition to the system costs, fuel cost is an important part of the economic analysis because fuel expenses constitute 50–70% of the total management cost of a ship [16]. The total fuel expenses of eighteen voyages of the case ship are calculated both without PEMFCs and with PEMFCs. If the ship is retrofitted with PEMFCs, the fuel expenses are USD 260,981. In the existing condition, without PEMFCs, the fuel expenses are USD 206,435. The costs of the two cases are not far away from each other, so the fuel expenses do not trigger commercial concerns for the management companies. If the hydrogen ton price decreases by 21% while the MDO ton price remains at a similar level in the future, the fuel expenses will be the same both for MDO and hydrogen.
The hydrogen PEMFC is a carbon-free electricity generation option for ships. This study reveals that using H2 PEMFCs instead of DGs combusting fossil fuel decreases shipboard emissions and maintains the compliance of the ship with the new emission regulations at the highest standard. Despite the H2 PEMFC being an expensive system nowadays, the benefit of the system during the decarbonization of maritime transport and the intention to achieve zero-carbon shipping by 2050 cannot be disregarded. It is obvious that the system costs and fuel prices will be reduced in the near future by the initiatives and support given by the IMO.

4. Conclusions

This case study using real voyage data has shown that hydrogen PEMFCs being placed on the ship instead of diesel generators will result in the following:
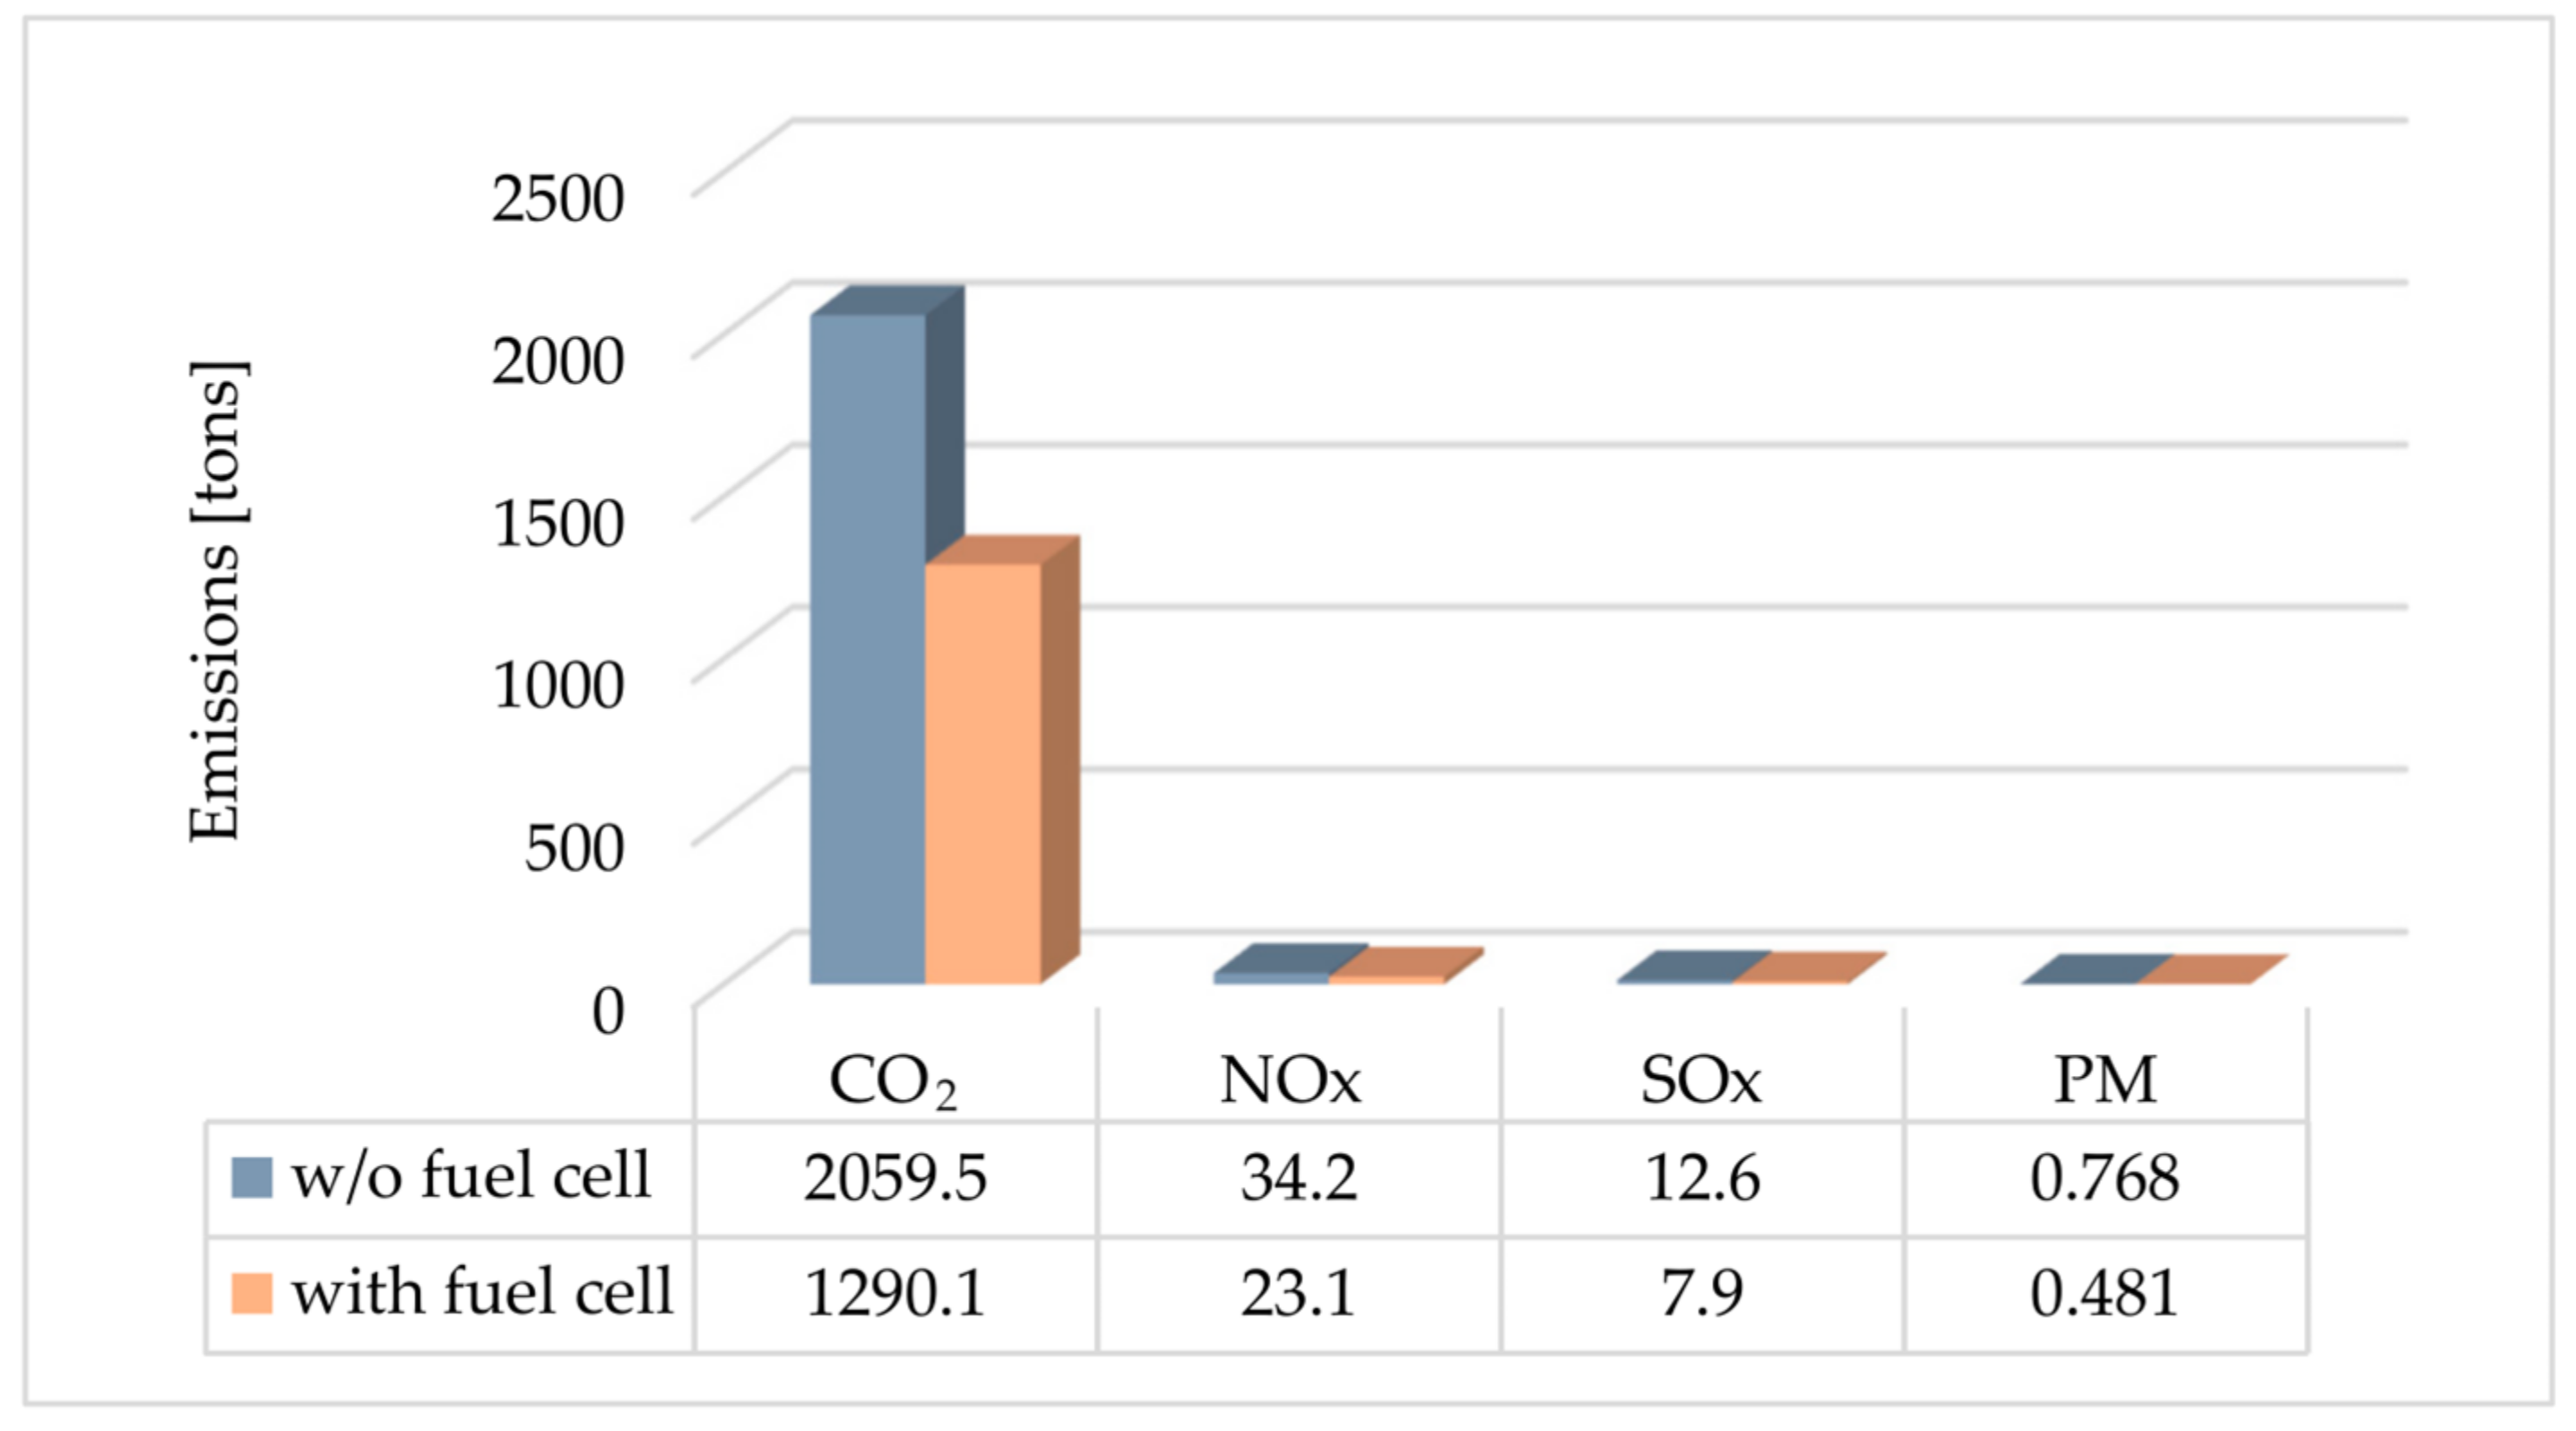
  • A 37.4% reduction in CO2 emissions, 32.5% reduction in NOX emissions, 37.3% reduction in SOX emissions, and 37.4% reduction in PM emissions.
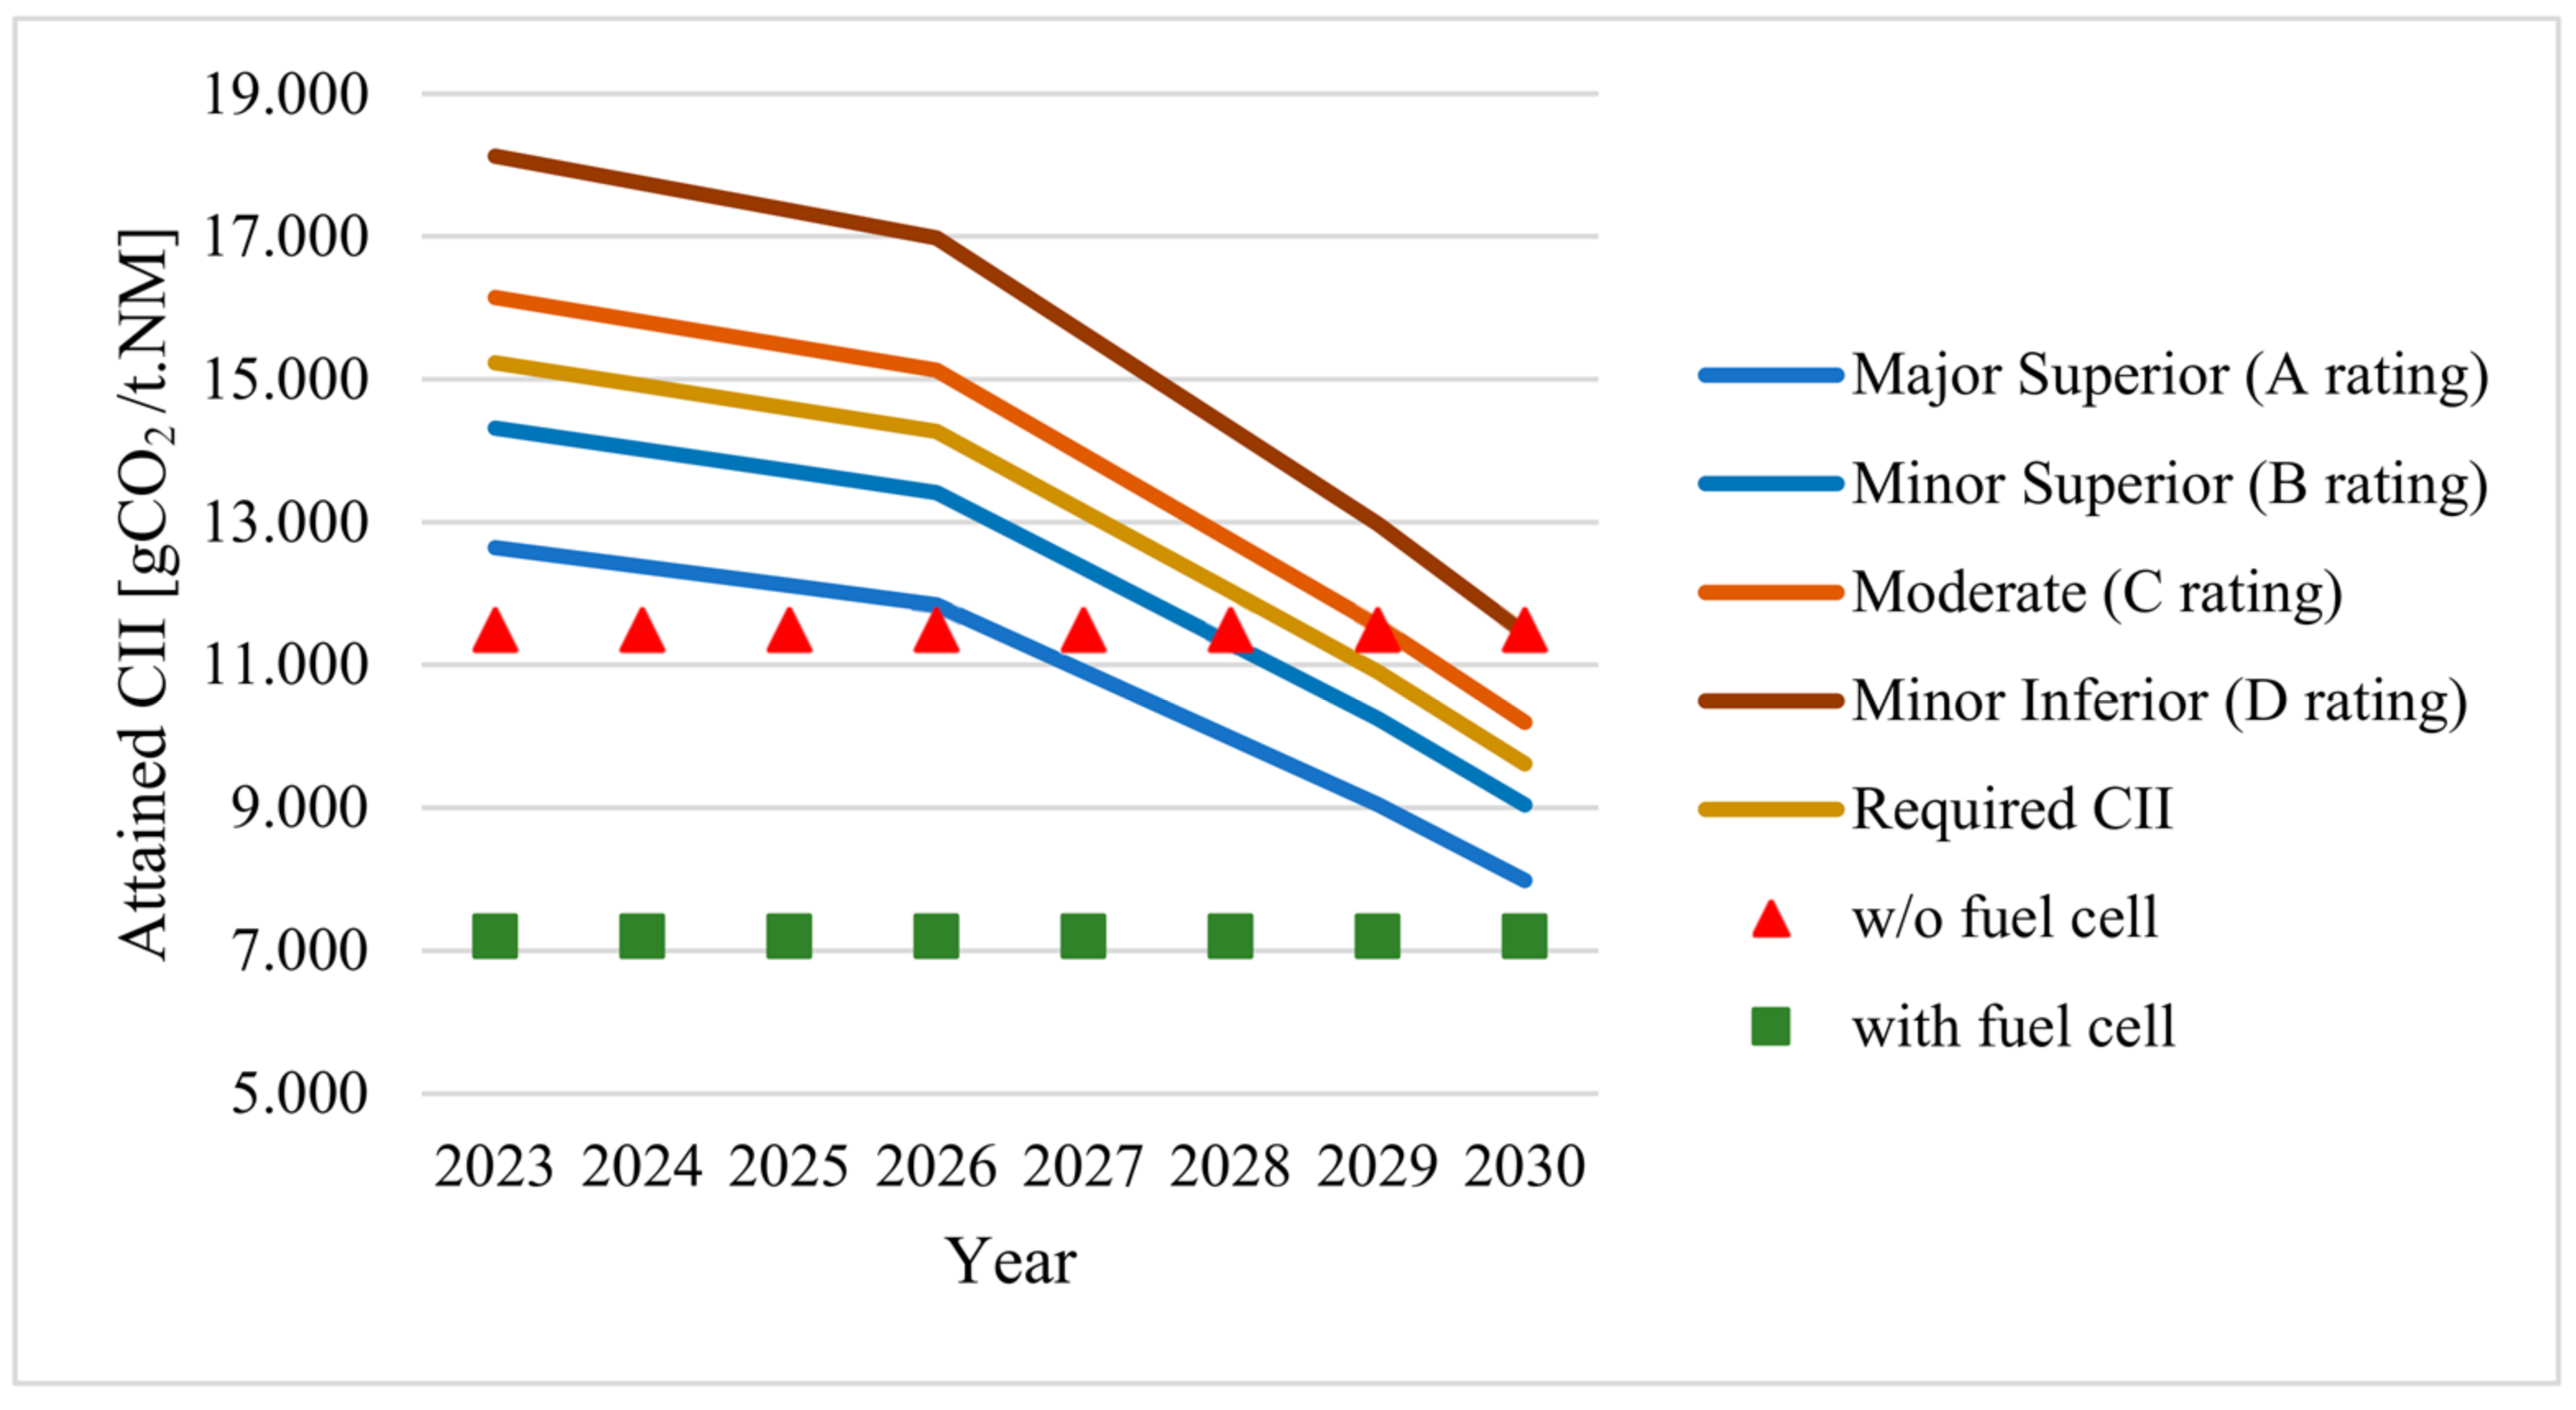
  • The case ship will remain at an A rating according to the CII regulation until 2030, which means the case ship can transport more valuable cargoes with the highest freight rate if the CII regulation is combined with market-based measures in the future.
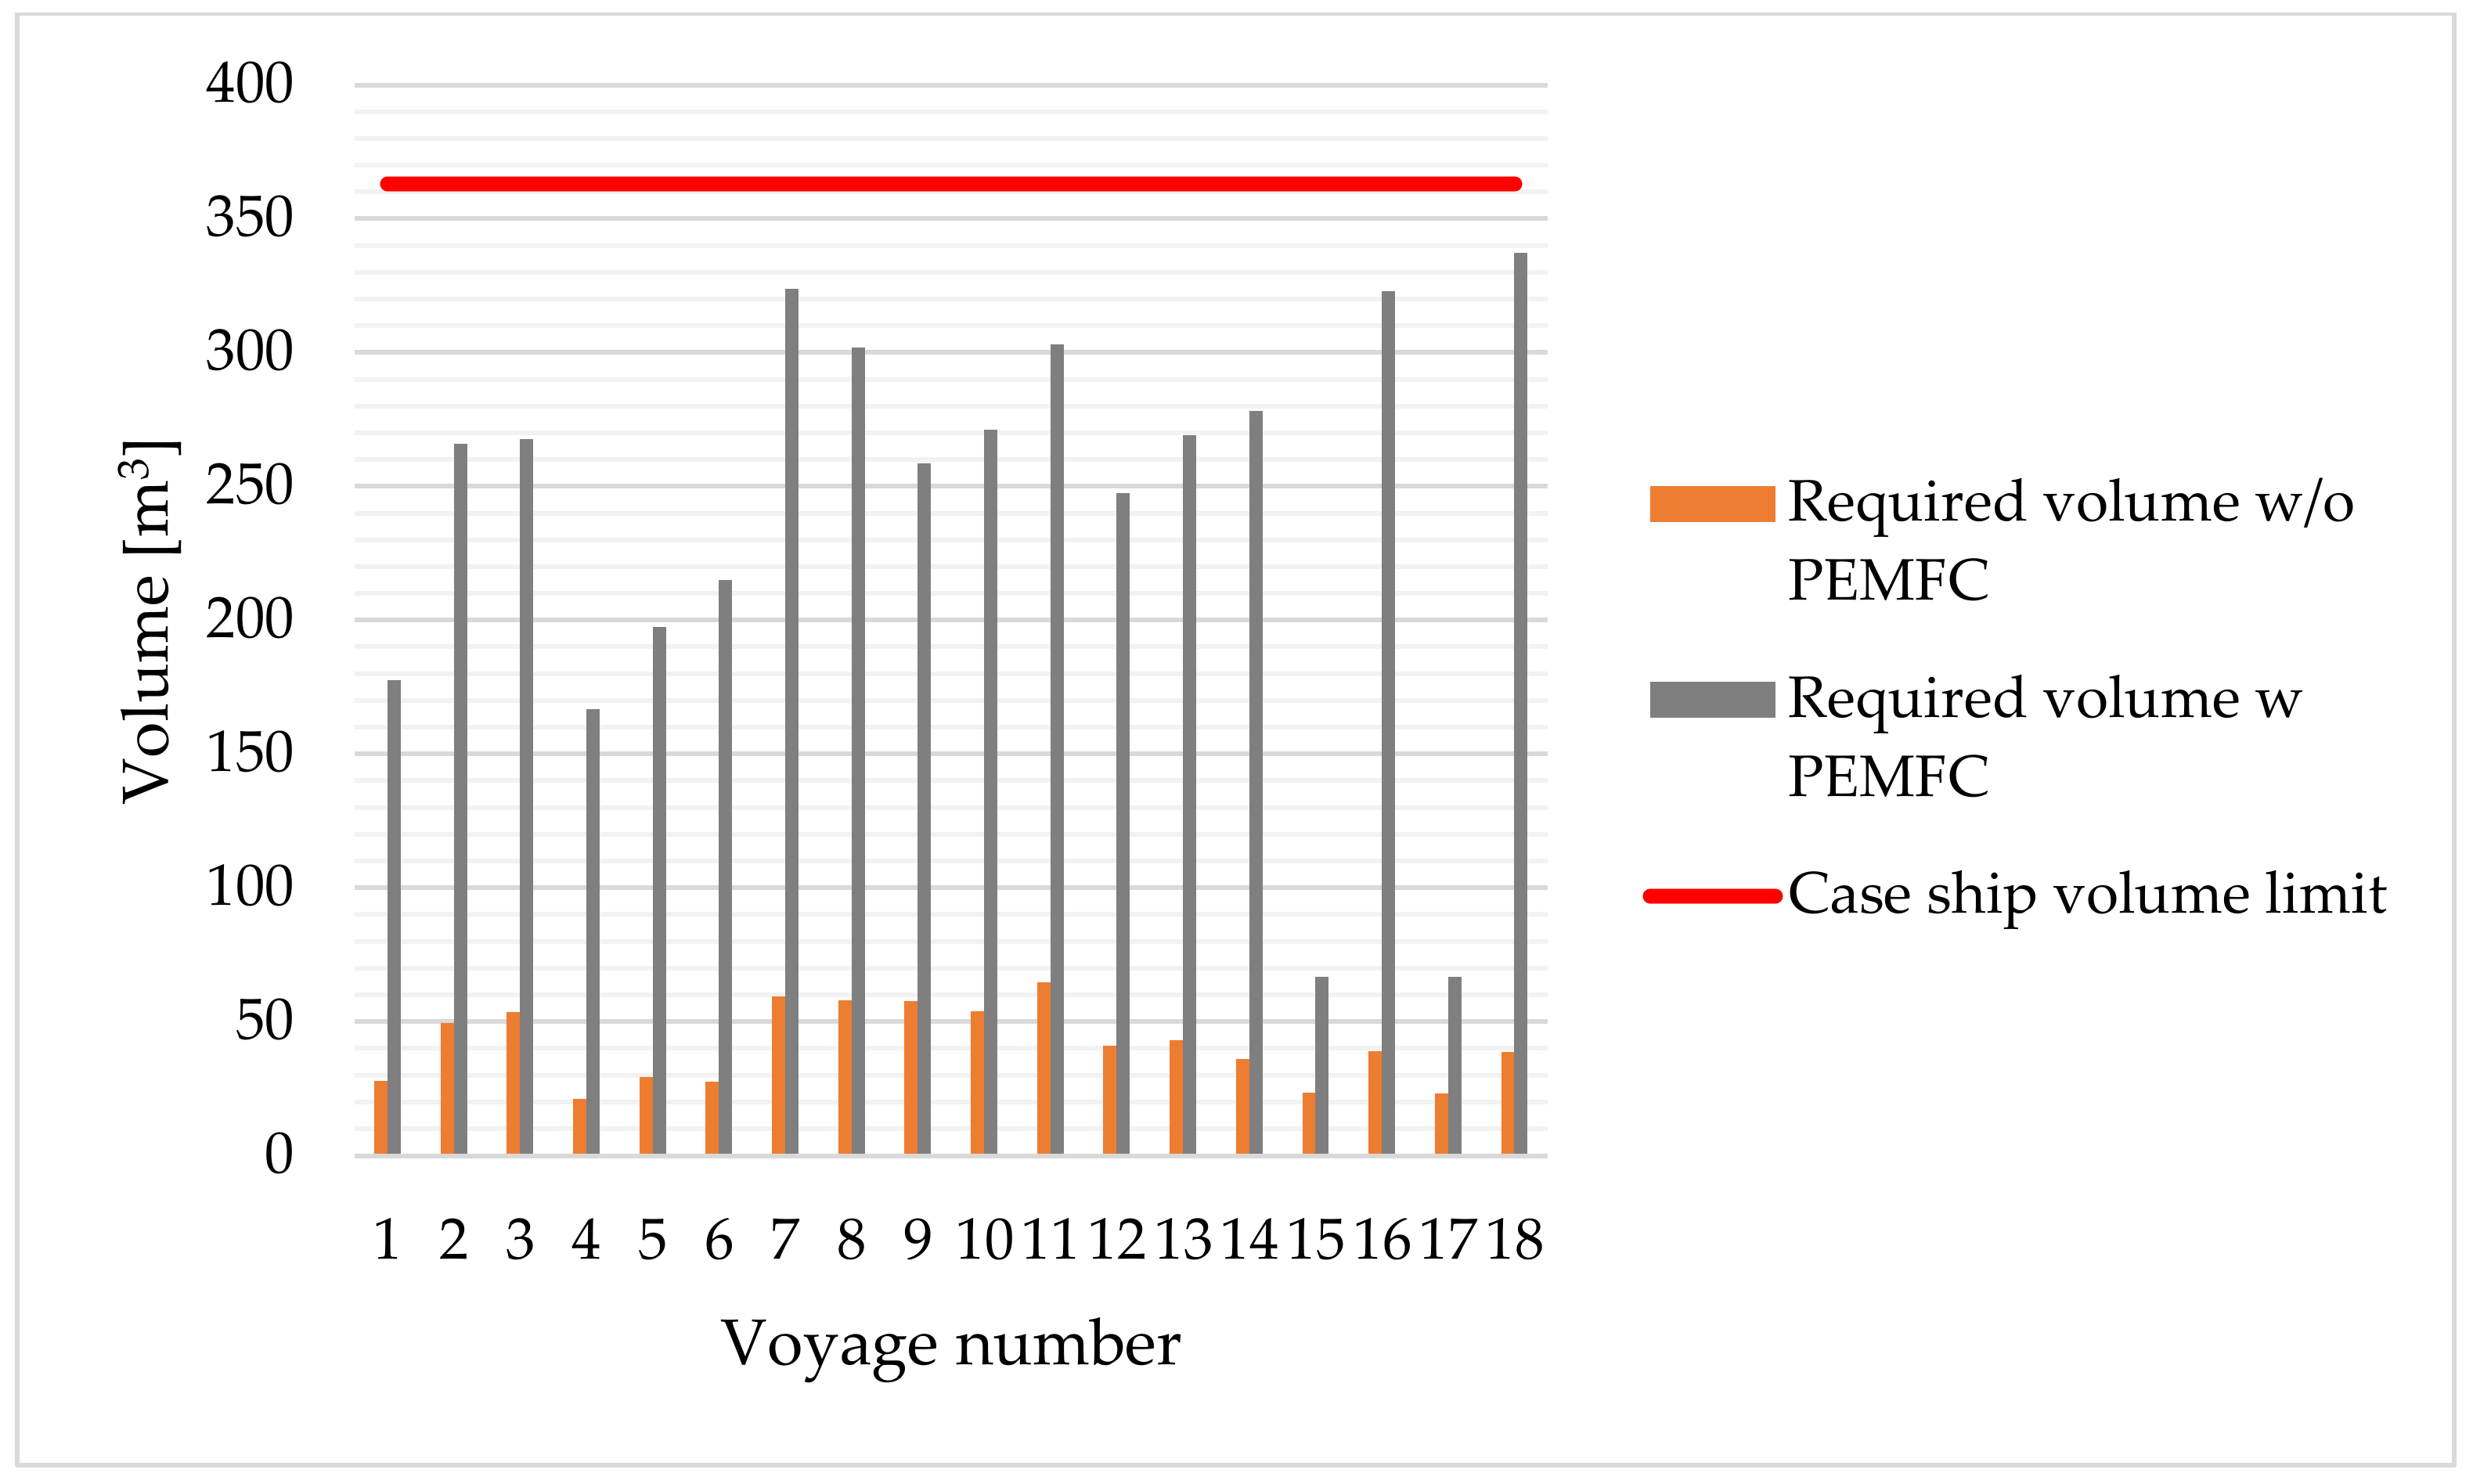
  • H2 fuel requires a larger tank capacity than conventional fuels, but the calculations of the case ship show that the largest fuel tank capacity requirement is 337.4 m3, which is lower than the maximum fuel tank capacity of 363 m3.
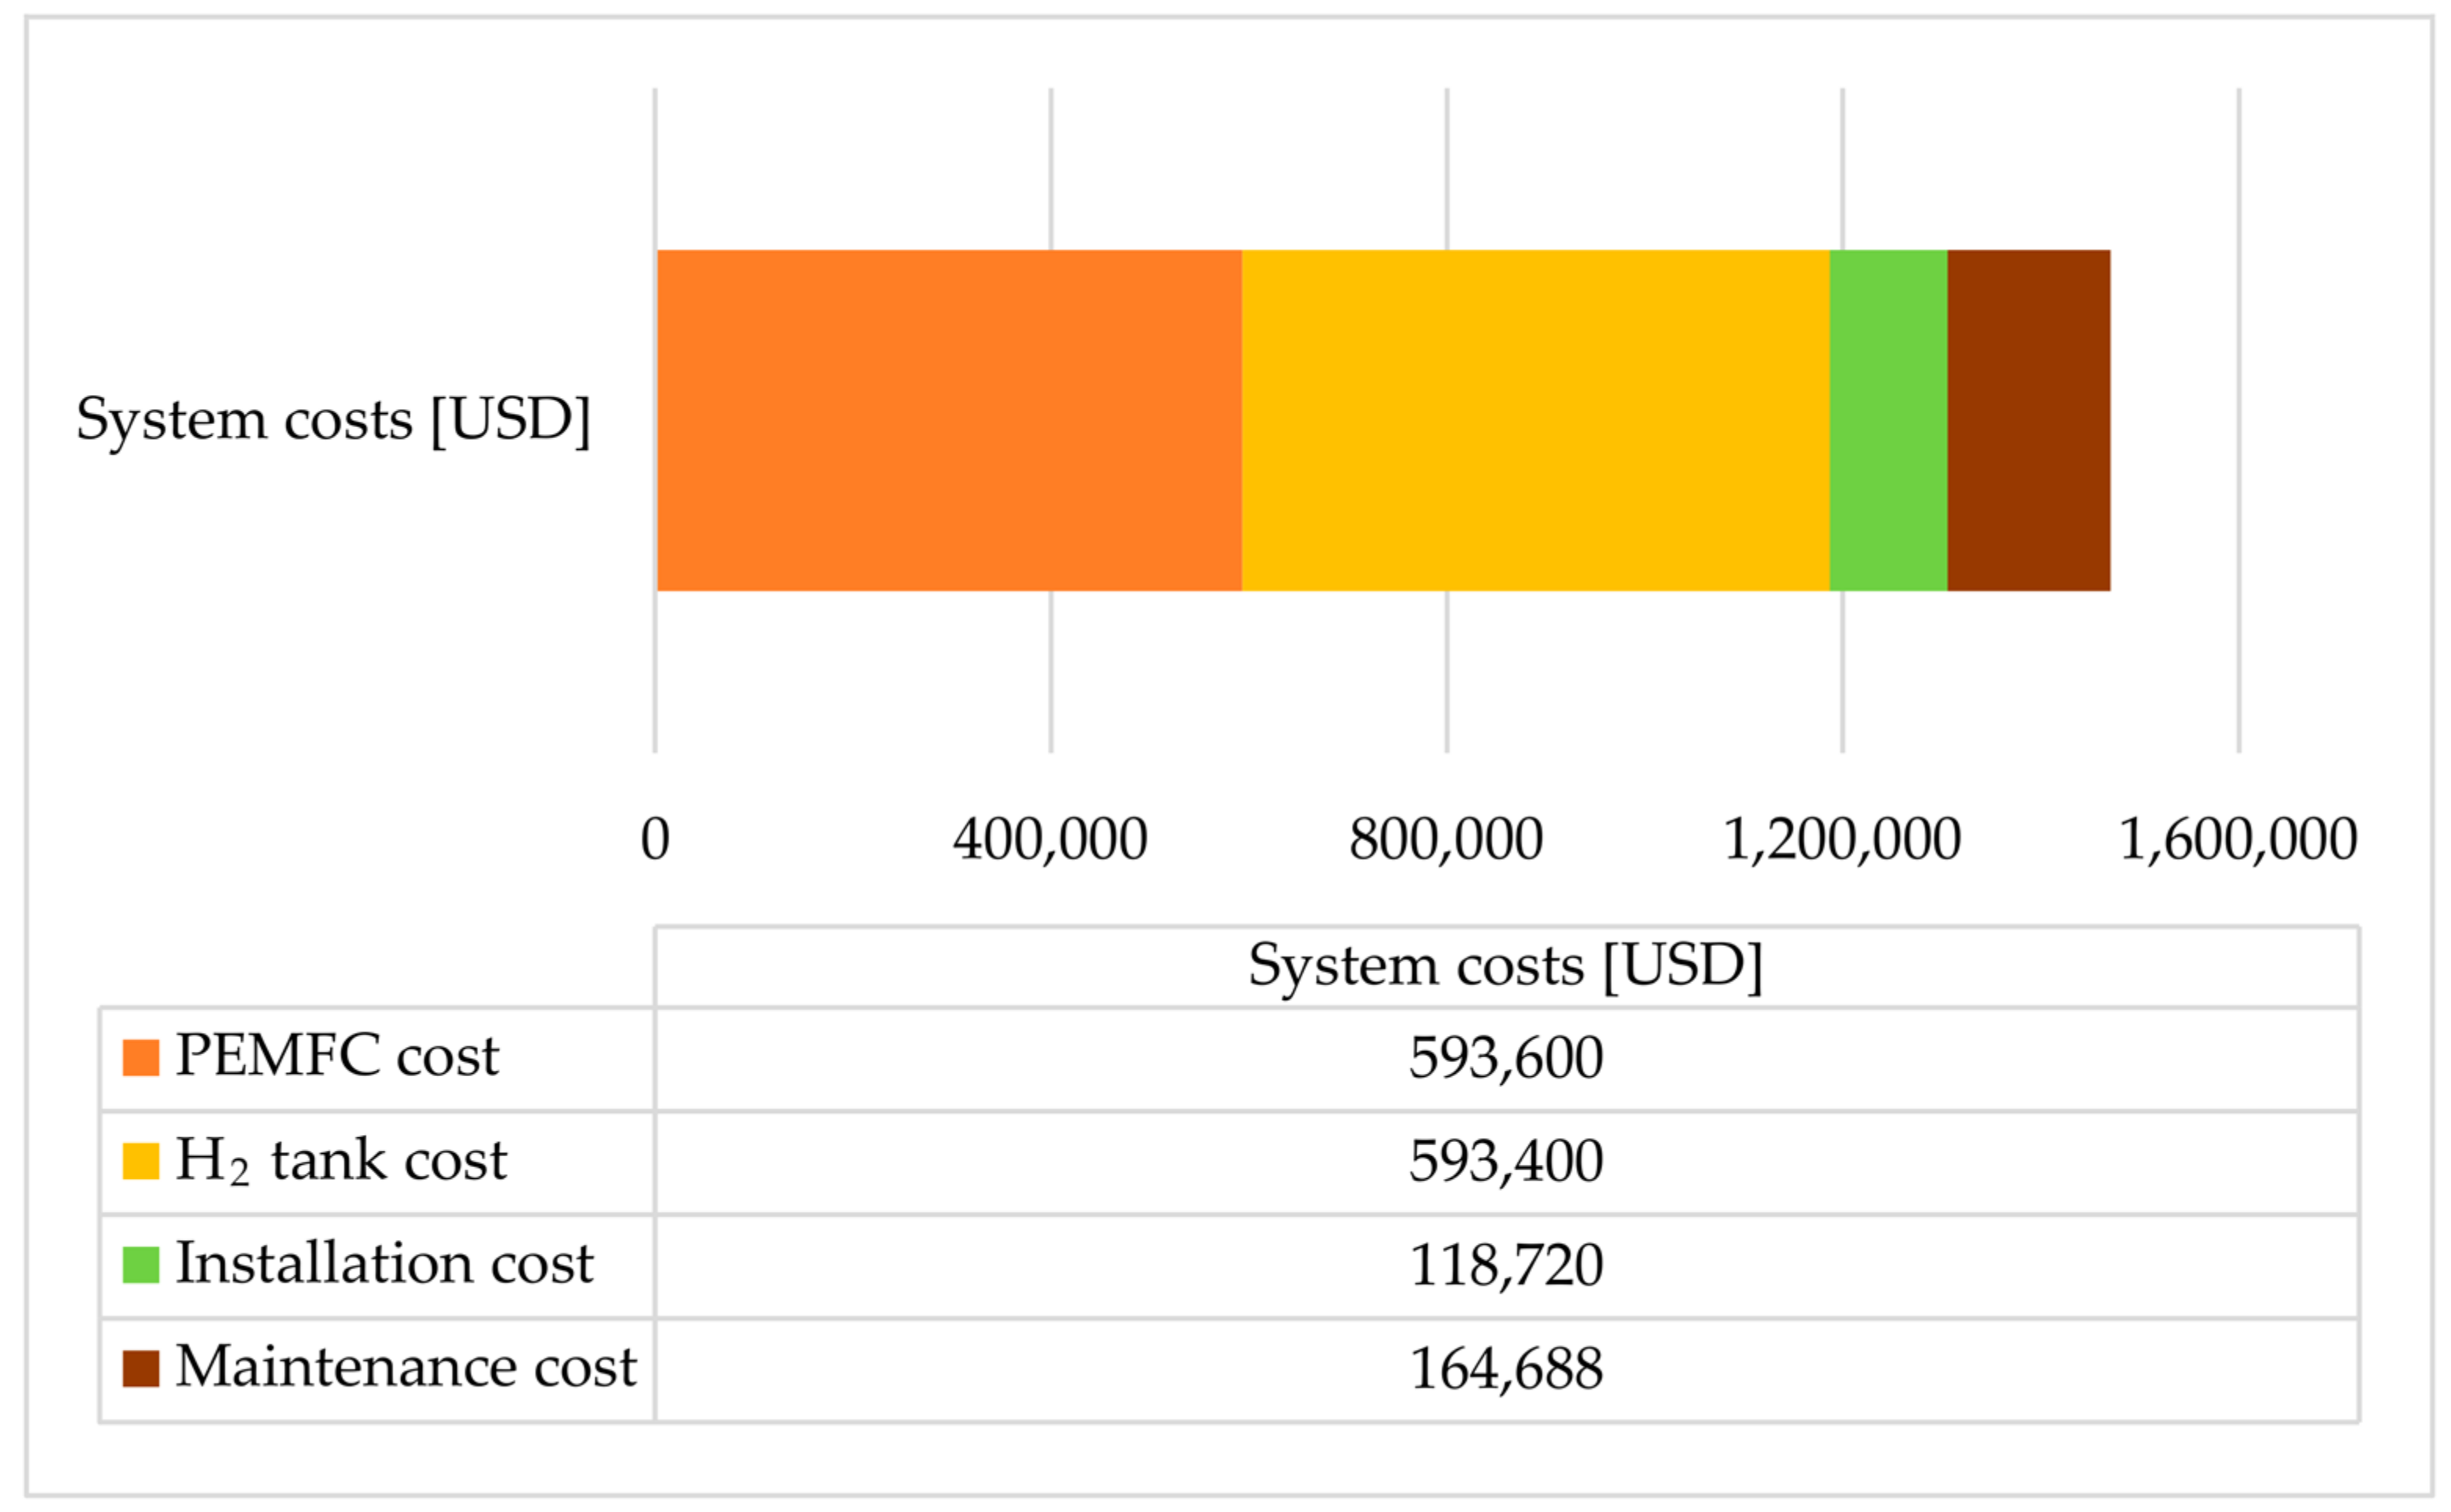
  • The CAPEX of the H2 PEMFC system is USD 1,305,720 and the OPEX is USD 2,470,320 for 15 years.
  • The fuel expenses of DGs with conventional MDO fuel are USD 206,435 and the H2 PEMFC fuel expenses are USD 260,981.
This study focuses on the use of H2 PEMFCs as a replacement for conventional DGs which use fossil fuel. Even though this study does not consider that the PEMFC stack overhauls an electrolyte change and it assumes a total fuel cell lifetime of 15 years, the results of this study are promising for the path of decarbonization of maritime transport. Nowadays, hydrogen and fuel cells are in demand both for academicians and ship owners/managers, and this interest will increase more in a few years. Future studies on hydrogen fuel cells for the replacement of the main engine of a ship or the comparison of various alternative-fueled fuel cell options will draw the attention of academicians and the industry in maritime transport.

Author Contributions

Conceptualization, O.B.I., B.Z., C.D. and J.-F.C.; methodology, B.Z.; data curation, B.Z.; writing—original draft preparation, O.B.I., B.Z. and C.D.; writing—review and editing, J.-F.C.; visualization, B.Z. and C.D. All authors have read and agreed to the published version of the manuscript.

Funding

This research received no external funding.

Institutional Review Board Statement

Not applicable.

Informed Consent Statement

Not applicable.

Data Availability Statement

Data are contained within the article.

Acknowledgments

The authors wish to thank Seahorse Shipping and Engineering Co., Ltd. for providing their ship data and voyage information for this study.

Conflicts of Interest

The authors declare no conflicts of interest.

References

  1. United Nations Conference on Trade and Development (UNCTAD). Review of Maritime Transport; UNCTAD: Geneva, Switzerland, 2020. [Google Scholar]
  2. Eide, M.S.; Longva, T.; Hoffmann, P.; Endresen, Ø.; Dalsøren, S.B. Future cost scenarios for reduction of ship CO2 emissions. Marit. Policy Manag. 2011, 38, 11–37. [Google Scholar] [CrossRef]
  3. European Environment Agency (EEA). Emissions of Air Pollutants from Transport. 2011. Available online: https://www.eea.europa.eu/data-and-maps/indicators/transport-emissions-of-air-pollutants-8/transport-emissions-of-air-pollutants-8 (accessed on 10 December 2023).
  4. Buonocore, J.J.; Luckow, P.; Norris, G.; Spengler, J.D.; Biewald, B.; Fisher, J.; Levy, J.I. Health and climate benefits of different energy-efficiency and renewable energy choices. Nat. Clim. Chang. 2016, 10, 100–105. [Google Scholar] [CrossRef]
  5. International Maritime Organization (IMO). The International Maritime Organization’s Initial Strategy on Reduction of Greenhouse Gas Emissions from Ships; IMO: London, UK, 2018. [Google Scholar]
  6. International Maritime Organization (IMO). Fourth Greenhouse Gas Study; IMO: London, UK, 2020. [Google Scholar]
  7. Inal, O.B.; Zincir, B.; Deniz, C. Investigation on the decarbonization of shipping: An approach to hydrogen and ammonia. Int. J. Hydrogen Energy 2022, 47, 19888–19900. [Google Scholar] [CrossRef]
  8. Schroer, M.; Panagakos, G.; Barfod, M.B. An evidence-based assessment of IMO’s short-term measures for decarbonizing container shipping. J. Clean. Prod. 2022, 363, 132441. [Google Scholar] [CrossRef]
  9. Marine Environmental Protection Committee (MEPC). Consideration and Adoption of Amendments to Mandatory Instruments-Draft Amendments to MARPOL Annex VI (No. MEPC 76/3); MEPC: London, UK, 2021. [Google Scholar]
  10. Wang, H.; Trivyza, N.L.; Mylonopoulos, F.; Boulougouris, E. Comparison of decarbonisation solutions for shipping: Hydrogen, ammonia and batteries. In Proceedings of the SNAME 14th International Marine Design Conference, Vancouver, BC, Canada, 26–30 June 2022. [Google Scholar]
  11. Inal, O.B.; Deniz, C. Assessment of fuel cell types for ships: Based on multi-criteria decision analysis. J. Clean. Prod. 2020, 265, 121734. [Google Scholar] [CrossRef]
  12. Zincir, B. Environmental and economic evaluation of ammonia as a fuel for short-sea shipping: A case study. Int. J. Hydrogen Energy 2022, 47, 18148–18168. [Google Scholar] [CrossRef]
  13. Zincir, B. Slow steaming application for short-sea shipping to comply with the CII regulation. Brodogradnja 2023, 74, 21–38. [Google Scholar] [CrossRef]
  14. Bouman, E.A.; Lindstad, E.; Rialland, A.I.; Strømman, A.H. State-of-the-art technologies, measures, and potential for reducing GHG emissions from shipping—A review. Transp. Res. Part D Transp. Environ. 2017, 52, 408–421. [Google Scholar] [CrossRef]
  15. Dere, C.; Deniz, C. Load optimization of central cooling system pumps of a container ship for the slow steaming conditions to enhance the energy efficiency. J. Clean. Prod. 2019, 222, 206–217. [Google Scholar] [CrossRef]
  16. Lee, H.; Jung, I.; Roh, G.; Na, Y.; Kang, H. Comparative analysis of on-board methane and methanol reforming systems combined with HT-PEM fuel cell and CO2 capture/liquefaction system for hydrogen fueled ship application. Energies 2020, 13, 224. [Google Scholar] [CrossRef]
  17. Zhu, M.; Yuen, K.F.; Ge, J.W.; Li, K.X. Impact of maritime emissions trading system on fleet deployment and mitigation of CO2 emission. Transp. Res. Part D Transp. Environ. 2018, 62, 474–488. [Google Scholar] [CrossRef]
  18. Gray, N.; McDonagh, S.; O’Shea, R.; Smyth, B.; Murphy, J.D. Decarbonizing ships, planes and trucks: An analysis of suitable low-carbon fuels for the maritime, aviation and haulage sector. Adv. Appl. Energy 2021, 1, 10008. [Google Scholar] [CrossRef]
  19. Netpas. Netpas Distance 4.0. Available online: https://www.netpas.net/ (accessed on 12 November 2023).
  20. Moreno-Gutierrez, J.; Calderay, F.; Saborido, N.; Boile, M.; Rodriguez Valero, R.; Duran-Grados, V. Methodologies for estimating shipping emissions and energy consumption: A comparative analysis of current methods. Energy 2015, 86, 603–616. [Google Scholar] [CrossRef]
  21. International Maritime Organization (IMO). Guidelines on the Operational Carbon Intensity Reduction Factors Relative to Reference Lines (CII Reduction Factors Guidelines, G3); IMO: London, UK, 2021. [Google Scholar]
  22. International Maritime Organization (IMO). Resolution MEPC.353(78)—2022 Guidelines on the Reference Lines for Use with Operational Carbon Intensity Indicators (CII Reference Lines Guidelines, G2); IMO: London, UK, 2022. [Google Scholar]
  23. International Maritime Organization (IMO). Resolution MEPC.352(78)—2022 Guidelines on Operational Carbon Intensity Indicators and the Calculation Methods (CII Reference Lines Guidelines, G1); IMO: London, UK, 2022. [Google Scholar]
  24. International Maritime Organization (IMO). Resolution MEPC.354(78)—2022 Guidelines on the Operational Carbon Intensity Rating of Ships (CII Rating Guidelines, G4); IMO: London, UK, 2022. [Google Scholar]
  25. PowerCell Group. Marine System 200. Available online: https://powercellgroup.com/segments/marine/ (accessed on 3 November 2023).
  26. ISO 14687:2019; Hydrogen Fuel Quality. ISO: Geneva, Switzerland, 2019.
  27. PowerCell Group. Marine System 200 Product Sheet. Available online: https://press.powercellgroup.com/en/data-sheet-marine-system-200 (accessed on 12 February 2024).
  28. Elberry, A.M.; Thakur, J.; Santasalo-Aarnio, A.; Larmi, M. Large-scale compressed hydrogen storage as part of renewable electricity storage systems. Int. J. Hydrogen Energy 2021, 46, 15671–15690. [Google Scholar] [CrossRef]
  29. Cheng, Q.; Zhang, R.; Shi, Z.; Lin, J. Review of common hydrogen storage tanks and current manufacturing methods for aluminium alloy tank liners. Lightweight Mater. Manuf. 2024, 7, 269–284. [Google Scholar] [CrossRef]
  30. Marine in Sight. A Guide to Marine Gas Oil and LSFO Used on Ships. Available online: https://www.marineinsight.com/guidelines/a-guide-to-marine-gas-oil-and-lsfo-used-on-ships/#:~:text=The%20density%20of%20MGO%20will,(at%2015%C2%B0C) (accessed on 19 December 2023).
  31. Jiven, K.; Parsmo, R.; Fridell, E.; Hansson, J.; Lundström, H.; Wimby, P.; Burgren, J.; Yum, K.K.; Stenersen, D. Concept Design and Environmental Analysis of a Fuel Cell RoPax Vessel. Report in the HOPE (Hydrogen Fuel Cells Solutions in Shipping in Relation to Other Low Carbon Options) Project. August 2023. Available online: https://www.ivl.se/download/18.14a84f6f18a262ab0322f508/1694067417890/C781%20Concept%20design%20and%20environmental%20analysis%20of%20a%20fuel%20cell%20RoPax%20vessel.pdf (accessed on 5 November 2023).
  32. Rivard, E.; Trudeau, M.; Zaghib, K. Hydrogen storage for mobility: A review. Materials 2019, 12, 1973. [Google Scholar] [CrossRef]
  33. Ship and Bunker. Global 20 Ports Average. Available online: https://shipandbunker.com/prices/emea/medabs/tr-ist-istanbul#MGO (accessed on 23 December 2023).
  34. SG H2 Energy. Economics. Available online: https://www.sgh2energy.com/economics (accessed on 23 December 2023).
  35. Inal, O.B.; Zincir, B.; Dere, C. Hydrogen as maritime transportation fuel: A pathway for decarbonization. In Greener and Scalable E-fuels for Decarbonization of Transport; Energy, Environment, and Sustainability; Springer: Singapore, 2022. [Google Scholar] [CrossRef]
  36. Kanchiralla, F.M.; Brynolf, S.; Malmgren, E.; Hansson, J.; Grahn, M. Life-cycle assessment and costing of fuels and propulsion systems in future fossil-free shipping. Environ. Sci. Technol. 2022, 56, 12517–12531. [Google Scholar] [CrossRef] [PubMed]
Figure 1. The specific fuel consumption/ship speed–ME engine load graph.
Jmse 12 00432 g001
Figure 2. The specific fuel consumption–DG load graph.
Jmse 12 00432 g002
Figure 3. The specific fuel consumption and efficiency of PEMFC [27].
Jmse 12 00432 g003
Figure 4. Voyage-based ME fuel consumption.
Jmse 12 00432 g004
Figure 5. Voyage-based DG fuel consumption.
Jmse 12 00432 g005
Figure 6. Total voyage emissions of the case ship with fuel cell and without fuel cell.
Jmse 12 00432 g006
Figure 7. Rating levels and attained CII values with fuel cell and without fuel cell.
Jmse 12 00432 g007
Figure 8. Voyage-based required tank volumes.
Jmse 12 00432 g008
Figure 9. System costs of the PEMFC.
Jmse 12 00432 g009
Table 1. The ship specifications of the case ship.
Ship Specifications
Ship typeGeneral cargo
Date of the keel laid 2004
Deadweight [tons]10,300
Gross tonnage (GRT)6177
Net tonnage (NRT)3680
Length overall (LOA) [m]128
Beam [m]18
Depth molded [m]9.7
Draught [m]7.6
Main engineS.X.D.—Daihatsu 8DKM-28
(Daihatsu: Ikeda, Japan)
2500 kW at 70 rpm
Diesel generator2 × 220 kW at 800 rpm
Design speed [knot]12.3
Fuel typeHFO/MDO
Fuel tank capacity [m3]363
Table 2. Voyage data of the case ship.
Voyage NoDepartureArrivalDistance
(nm)
Average Speed (Knots)Voyage
Duration (Days)
Port Stay
Duration (Days)
Idle Stay
Duration (Days)
01IstanbulBerdyansk5219.22.4103
02BerdyanskEl Dekheila12507.96.6123
03El DekheilaBerdyansk12508.85.9132
04BerdyanskTrabzon3857.82.1111
05TrabzonVarna5518.82.6122
06VarnaMariupol5277.62.9133
07MariupolSousse15727.68.6152
08SousseGalati13678.56.7152
09GalatiRavenna14718.57.2111
10RavennaGhazaouet14967.68.2112
11GhazaouetRijeka14849.26.7151
12RijekaSousse8698.64.2142
13SousseNemrut8588.94.0162
14NemrutHaifa6488.03.4166
15HaifaNemrut6489.13.002
16NemrutHaifa6487.63.61613
17HaifaNemrut6489.03.002
18NemrutHaifa6487.03.91615
Table 3. The specifications of the PEMFC unit [25].
Marine 200 PEMFC Unit Specifications
Max. net power [kW]200
Dimensions [m]0.7 × 0.9 × 2.0
Volume [L]1260
Weight [kg]700
Gross output (rated power) [V/A]600/380
Voltage output [VDC]500–1000
Current output [A]60–450
Fuel qualityHydrogen ISO 14687:2019 [26]
Fuel consumption [kg/h]13 at 200 kW
System efficiency at 200 kW output [%]46
Disclaimer/Publisher’s Note: The statements, opinions and data contained in all publications are solely those of the individual author(s) and contributor(s) and not of MDPI and/or the editor(s). MDPI and/or the editor(s) disclaim responsibility for any injury to people or property resulting from any ideas, methods, instructions or products referred to in the content.

