Abstract
Maintenance intervals and approaches for marine equipment have been the subject of numerous studies, focusing on previous failure patterns and associated risks. However, in vessels like drillships, operating under high reliability requirements and possessing significant redundancy, maintenance strategies have a critical impact on overall performance. This study investigates the influence of operational configurations on maintenance intervals and approaches for generator engine subcomponents onboard a drillship. Using data on injector failures onboard drillships, we employ the maintenance concept adjustment and design (MA-CAD) method to analyse and determine maintenance intervals across various operational configurations. Initially, we analyse the failure pattern of fuel injectors and propose a reduction in maintenance intervals through Weibull probability distribution fitting. Additionally, a risk analysis is conducted to assess the impact of operational configurations on risk indices related to fuel injector reliability and safety consequences. Our findings reveal that different operational configurations of the power generation plant can lead to changes in risk indices, shifting injector reliability status from unacceptable to undesirable limits. Consequently, maintenance intervals need to be adjusted as well to ensure optimal performance and safety. Furthermore, considering various engine subcomponents and their reliability under different operational configurations suggests the need for tailored maintenance approaches. This research provides insights into optimising maintenance strategies for drillship, ensuring reliability and safety across diverse operational scenarios.
1. Introduction
The maintenance of plants and machinery is an important activity that ensures the safe operation of machinery. This is especially important for specialised vessels, as the operational safety of the machinery is crucial for both the operation’s success and the crew’s safety. One such example is a drillship, which is built with a high degree of redundancy in order to achieve a high level of operational safety. In addition to their design, drillships are managed under High-Reliability Organisations arrangements (HRO). These organisations are defined as ones that prevent catastrophic losses in environments where accidents and mishaps are highly likely. This high risk is due to the complexity of operations and equipment involved in drillship activities [1,2,3,4]. The drillship’s equipment and propulsion systems rely entirely on electric power, making the reliability of its diesel generators crucial. Beyond structural performance, the diesel–electric system of the drillship offers various management options. These options enable different levels of redundancy, influencing the risk of potential catastrophic failures. The aim of the analysis performed in this research is to evaluate the influence of different forms of power plant management on generator engine failure impact and, consequently, on their maintenance interval and approach. Due to data availability, our research is based on engine injector failures data from the ship’s technical records (e.g., engine logbook) and aims to evaluate the maintenance intervals and approaches for the injectors. Additionally, it investigates how the different operating settings of the diesel–electric system impact its maintenance requirements. Extensive searches through academic journals and online resources yielded no analogous research studies that implemented a similar approach and that had considered different operational configuration and operational conditions when analysing the maintenance approach for the same subcomponents.
For the evaluation of maintenance requirements, a maintenance concept adjustment and design (MA-CAD) method is used. It is a strategic approach for designing and adjusting maintenance organisation systems in technical settings. It focuses on optimising cost efficiency while adhering to reliability standards [5]. This method involves analysing and reconfiguring the maintenance concept to reduce Life Cycle Costs (LCC) without compromising reliability [6]. The MA-CAD analysis includes evaluating the time between failures, maintenance duration, and the impact on performance characteristics, including derived metrics like reliability, accessibility, and maintainability. The calculation, interval adjustment, and maintenance approach changes based on the MA-CAD methodology are performed in several sequences:
- Operational data analysis—consists of identifying components and analysing their failure causes, i.e., creating a network of actors and Failure Mode Cause Combination (FMCC). Based on the available historical data of failures, the predictability of failures (p) is calculated based on the Weibull distribution and its parameters ratio (η), shape (β), and position (t0). The position parameter (t0) represents the minimum lifetime of the component, i.e., the so-called initial time, which is assumed to be 0 in our case because the occurrence of defects is possible immediately after the installation of the component. Therefore, the two-parameter Weibull distribution (W(η, β)) is used for the calculation.
- Risk analysis—in which the limits of the lower risk criterion (LRC), upper risk Criterion (URC) and the risk index (RI) are defined as the mathematical probability of occurrence and consequences of the event. This consequence of the event is expressed as the significance index parameter (SI) and the probability of occurrence is expressed as the Expected Life Failure Frequency (ELFF).
- The selection of the maintenance concept is based on the value of the obtained RI and the predictability, i.e., on the parameters of the shape and ratio of the Weibull distribution.
Vučinić [5] first presented the MA-CAD maintenance approach in his dissertation. Bukša [6] examined the 13-year failures of a specific ship in his dissertation and optimised the maintenance approach using the MA-CAD methodology. In addition to the adaptation of the maintenance concept for the mentioned ship, this part extends the MA-CAD method with a system for planning the quantity of spare parts. Further research on the adaptation of maintenance intervals of ship systems and equipment can be seen in Figure 1, and is described in several studies, e.g., Šegulja et al. [7], Bukša et al. [8], Stazić et al. [9].
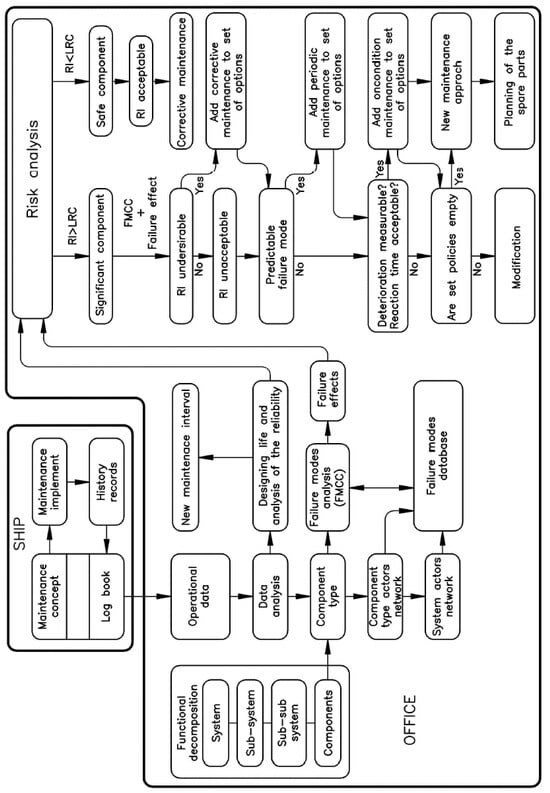
Figure 1.
Model of maintenance concept adjustment and design [7].
Different maintenance strategies and their effectiveness within HRO organisations are analysed by Andriulo et al. [10]. An additional overview of the impact of maintenance within HRO on the operational robustness and resilience and reliability of systems is provided by Okoh et al. [11,12] and Herrera et al. [13].
2. Methodology and Data Source
2.1. Data Source and Characteristics of the Drillship
The data source is based on extracts from the drillship’s engine room technical records [14]. These records contain, among others, records of repairs and maintenance work carried out on all equipment in the engine room. The period taken into consideration during this research is from May 2009 to December 2016.
The drillship mentioned in this research is a Samsung 12000 design capable of operating in water depths up to 12,000 ft. Its diesel–electric system is powered by six high-voltage diesel generators that are installed onboard. The power system is configured in three separate engine rooms (PS, CENT and STB), so that two diesel generators with all auxiliary systems are in each of these engine rooms (Figure 2). This structure of the power supply system provides high system redundancy and protection against potential threats to operations, equipment, and personnel.
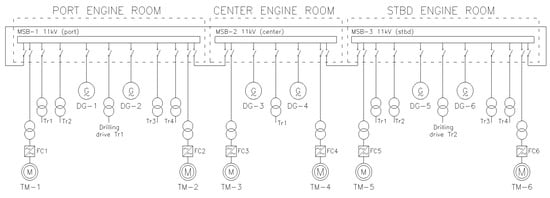
Figure 2.
Schematic of the propulsion diesel–electric plant of the drilling ship [15].
The generator’s drive engines are of the MAN 16V32/40 type and deliver 8000 kW at 100% MCR. The electrical system consists of three independent high-voltage switchboards with a voltage of 11 kV. Two high-voltage switchboards, located in the port and starboard engine rooms (PS and STB), supply all the equipment on board in addition to the equipment in the engine room of their location. The power supply to the individual drilling equipment is fully redundant; one unit is supplied from the port side switchboard (PS), while the other unit is supplied from the starboard high-voltage switchboard (STB). The third high-voltage switchboard (CENT) only supplies the equipment in the central engine room (CENT). The ship’s propulsion equipment is supplied by each individual high-voltage switchboard, so that two azimuth thrusters (one at the bow and one at the stern of the ship) are supplied from each panel. Therefore, a total of six azimuth thrusters (three at the bow and three at the stern) with a total output of 33 MW (6 × 5.5 MW) are installed.
The diesel–electric system can be operated in a closed circuit (“closed bus”) where all three high-voltage busbars are connected to form the single electrical system of the ship. Another setup operation mode is the open circuit concept, wherein the high-voltage switchboards are separated from each other in three independent electrical systems (“open bus”). The operation of diesel generators in an open circuit increases the safety of the electrical plant in terms of resistance to the effects of failures on operational safety, while reducing the redundancy of the available engines. Depending on the operating mode, the safety and operational risk change, which could have an impact on the maintenance approach.
2.2. Calculation Methodology
2.2.1. Operational Data Analysis
The frequency of failures (λ) is based on ISO 14224 [16] and is calculated according to model (1),
where (n) is the number of failures and (t) is the lifetime of the equipment.
According to the general definition in ISO 14224 [16], the Mean Time Between Failures (MTBF) is calculated using Formula (2).
However, the observed failures on the engine fuel injectors are compared with the Weibull distribution and the parameters ratio (η—scale parameter), shape (β—shape parameter) and position (t0—position parameter) are calculated. The position parameter (t0) represents the minimum lifetime of the component, i.e., the so-called initial time, which is assumed to be 0 in our case because the occurrence of defects is possible immediately after the component is installed. Therefore, the two-parameter Weibull distribution (W(η, β)) is used in the calculation, and the failures are compared with the distribution whose Probability Density Function (PDF) looks like the one presented in Figure 3a, according to Formula (3), as per Kizilersü et al. [17].
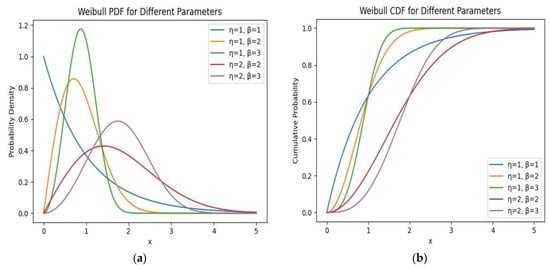
Figure 3.
Weibull functions for different values of ratio and shape parameters: (a) Weibull PDF function; (b) Weibull CDF function.
The Cumulative Distribution Function (CDF), Figure 3b, for the two-parameter Weibull distribution is calculated according to Weibull [18], as per Equation (4).
The Reliability function R(t) (RF) is known as the function of the expected failure. The reliability function for the two-parameter Weibull distribution is expressed by model (5), as per Weibull [18].
Therefore, the MTBF in our case is calculated based on the obtained parameters for the two-parameter Weibull distribution calculated for the observed engine according to Formula (6), as per Modarres et al. [19].
Predictability (p) indicates the ability to predict the expected Mean Time Between Two Failures (MTBF) and is then calculated according to Formula (7), as per Vučinić [5].
2.2.2. Risk Analysis
The probability of a ship loss F(L) due to a failure of the propulsion engine during its lifetime results from expression (8), Vučinić [5].
AFR stands for the Average Ship rift-off Rate and L for the lifetime of the vessel in years. Equation (9) are used to calculate the probability of certain fault with known other probability values by means of fault tree analysis, as per Vučinić [5].
The significance index (SI) is furthermore introduced to establish the consequence of the event and to calculate the risk criteria, and is represented in Table 1 [6].

Table 1.
Significance index with gradation of failure effects [6].
Expression (10) is used to calculate the Expected Life Failure Frequency (ELFF), as per Vučinić [5], which can be defined as the probability of occurrence.
where F(T) is the probability of failure during the maintenance period (T), L is the service life of the component, and R(t) is the reliability of the component. In the case that MTBF << L, as per Vučinić [5] we can write that:
URC is calculated according to expression (12), Vučinić [5].
3. Analysis Results
3.1. Adjustment of Maintenance Intervals Based on Operating Data Analysis
The injector failures recorded in the technical records of engine no. 1, i.e., engine PS1, are listed in Table 2. The failures were recorded in periods of 3000 operating hours, which correspond to the maintenance interval for the injectors according to the manufacturer’s instructions. The recorded injector failures occurred between 2009 and 2016.
Table 2.
Record of injector failures for PS1 diesel engine [14].
When handed over from the shipyard to the ship owner in May 2009, the engine had 127 operating hours, while on 31st December 2016 it had 20927 operating hours.
Based on the recorded data, the histogram of failures described in Table 2 is shown in Figure 4, i.e., and the diagram in Figure 5. The PDF probability density curve for the two-parameter Weibull distribution with parameters β = 1.46, η = 1446 and t0 = 0 is shown in Figure 6.
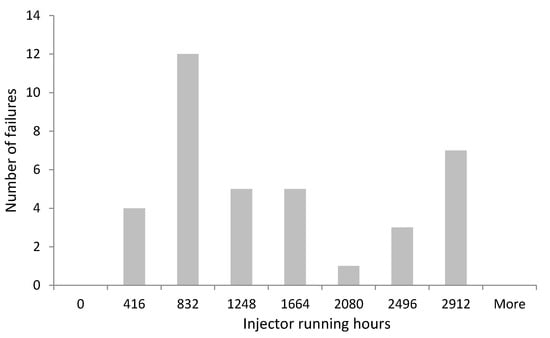
Figure 4.
Breakdown distribution of injector failures.
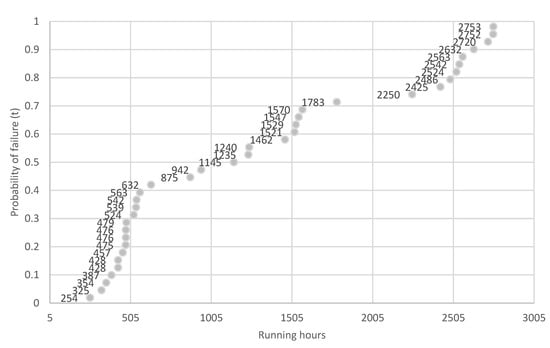
Figure 5.
Scatterplot for injector failures on PS1 engine according to Table 1.
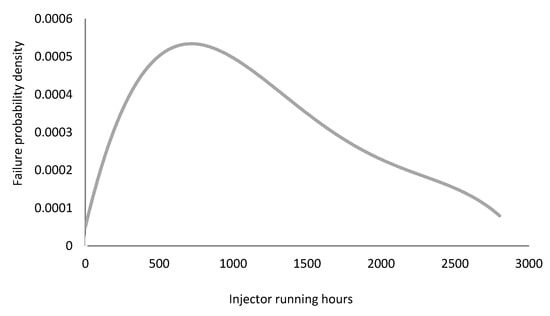
Figure 6.
PDF for injector failures (β = 1.46, η = 1446).
We compare the obtained histogram in Figure 4 with the Weibull distribution, and by calculating the parameters for the two-parameter Weibull distribution, we obtain the results shown in Table 3.
Table 3.
Calculated parameters of the two-parameter Weibull distribution.
Using the MTBF calculation Formula (6) and the predictability calculation Formula (7), we obtain the MTBF and p for the resulting Weibull distribution, which is shown in Table 4.
Table 4.
Calculated parameters for the injector failure pattern.
The ratio parameter η of the Weibull distribution represents the characteristic maintenance period. According to the analysis, the characteristic service life of the fuel injector is 1308 working hours. According to the manufacturer’s specifications [20] (remove all valves, check nozzle elements, and replace if necessary), it is scheduled every 3000 operating hours. Accordingly, the maintenance period should be reduced to every 1308 operating hours or alternatively, 1500 operating hours to better group the maintenance tasks.
3.2. Risk Analysis
Through further calculations, we determine the probability of a ship loss due to the failure of the propulsion engine during its lifetime according to Formula (8). The Average Ship rift-off Rate (AFR) as the average probability of occurrence of a dynamic positioning system event resulting in drift-off, which is the riskiest event on a drillship, is 0.01% according to [21]. The influence of the power generation system (engine and generator) is 9.8% according to [21]. The service life of a drillship in 2016 was 32 years [22].
The probability of falling, i.e., losing the position, is therefore 3.135 · 10−5 according to Equation (13). The aim is to use the tree to calculate the upper risk criterion (URC) for each Failure Mode Cause Combination (FMCC). For the fuel injection system of the MAN B&W 16V32/40 four-stroke diesel engine, the FMCC number is 5.
The considered engine (PS1) was in operation for 20,927 h during the period 05/2009–12/2016, (i.e., an average of 2757.5 working hours per year). The calculated intermittence of the engine operation was therefore 31%. Other engines onboard had intermittent operation as follows: PS2–38%, CENT1–33%, CENT2–27%, STB1–37%, STB2–47%.
The definition of the consequences of a vessel failure caused by engine operation can be very unclear due to possible interactions and other factors such as weather conditions. However, we assume here that a failure of three engines during closed-bus operation, i.e., a failure of two engines in the same engine room during open-bus operation, creates the conditions for the drift-off of the ship. Following the research of Varela et al. [18], probability values for the underlying causes of drift-off were calculated and based on these calculations, diagrams of failure trees for engine operation in closed and open circuits were created (Figure 7 and Figure 8).
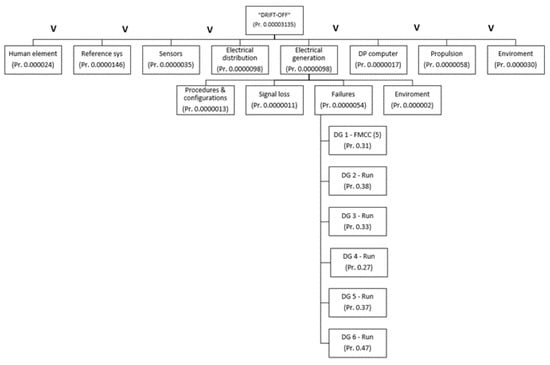
Figure 7.
Failure tree for closed bus operation. V—operator OR.
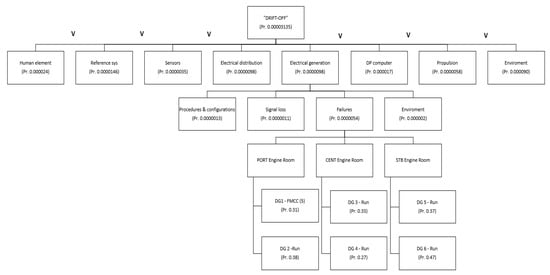
Figure 8.
Failure tree for open bus operation. V—operator OR.
The logical “AND” is calculated as the intersection of probabilities, while the “OR” is evaluated as the union of event probabilities (9). For parallel events, the “OR” terms corresponding to the intersection are not considered when estimating the error probability of the tree analysis because they are of small size. If these links are not considered, the result of the analysis gives a slightly higher value for the probability of the event in the catastrophe tree. The required value of ELFF for a catastrophic event (SI = 1) for the lower level is represented by the unknown X. For the operation of the engine in a closed circuit, the calculation of ELFF is determined by Formula (14).
i.e., for the operation of the motor in open circuit according to Formula (15).
Accordingly, we calculate the URC according to Formula (12) for engine operation in closed and open bus, and when the importance index SI = 1 is considered.
The result obtained shows that the critical FMCC must have an average failure rate of 0.0162 for the operation of the engine in closed bus or 0.00165 for the operation of the engine in open bus over a period of one year. If the SI = 0.0001 is used, i.e., minimal impact on operation and minimal impact on ship safety, the result is according to Formula (12):
That is, for the LRC we assume a 100 times higher reliability than URC, that is:
For the lifetime of the injector nozzle, we take the amount of 7500 working hours [20], and according to Formula (11), we can calculate that ELFF = 5.733 (22).
By comparing the values of the safety and operational risk indexes (RI(s) and RI(o)) presented in Table 5 with the corresponding LRC and URC values from Table 6, we can determine the range within which the ELFF value falls.
Table 5.
Calculated risk index for various significance index.
Table 6.
Calculated RI for operation in different configurations.
4. Results Review
The parameters β = 1.468 and η = 1446.01 were calculated for the sampling distribution of the drill ship injector failures and their fit to the Weibull distribution, on the basis of which is MTBF calculated, and the result was 1308. From this, we can conclude that the scheduled maintenance, which is performed every 3000 working hours, should be reduced to every 1308 working hours or every 1500 working hours and combined with other work from the engine maintenance program [17].
However, to make it easier to recognise the effects of injector failures on the operation of the ship’s propulsion system, a further risk analysis is carried out. How a diesel–electric power plant can work in two different operating states of the electrical system, by working out the fault tree that causes the ship to “drift-off”, both in open and in closed bus operation, the ELFF is calculated, which is 0.01627 and 0.00165, respectively. Accordingly, the URC is calculated for closed bus and open bus operation, which is 0.01627 and 0.00165, respectively. The lower risk criteria are set to 100 times smaller than the upper criteria. By comparing the expected failure frequency of the ELFF injector, which is 5.733, the risk indices for the fuel injector are also determined. They are compared with the URC and LRC, both in the closed bus and open bus circuit.
Therefore, the position of RI(s) and RI(o) relative to the URC and LRC limits changes depending on the bus configuration (closed or open bus).
For closed bus configuration, RI(o) is above the URC limit while RI(s) is between the URC and LRC limits (Figure 9a). This means that for closed bus operation at ELFF of 5.73, RI(o) indicates an operational risk that exceeds the URC limit, suggesting an unacceptable operating condition. RI(s) suggests a safety risk within the undesirable range, as it falls between the URC and LRC limits.
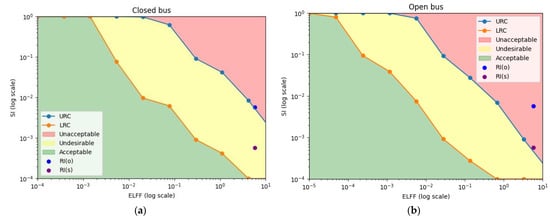
Figure 9.
Graphic survey of RI position: (a) Graphic survey of RI in closed bus operation; (b) graphic survey of RI in open bus operation.
For open bus configuration, both RI(o) and RI(s) are above the URC limits (Figure 9b). This means that for open bus operation at ELFF of 5.73, both RI(o) and RI(s) indicate that operational and safety risks exceed the URC limits, indicating an unacceptable operating condition.
As mentioned, a reduction in the maintenance interval calculated by Weibull distribution fit (Table 3.) to 1500 operating hours (rounded up from 1308 operating hours) is required. The predictability of the failure p > 0.5 (p = 0.68) shows a significantly large Increasing Failure Rate (IFR), and a periodic preventive maintenance approach can therefore be chosen for both operational configurations.
However, the key difference between closed and open bus configurations lies in the position of RI(o) and RI(s) relative to the URC and LRC limits. In the closed bus configuration, RI(o) exceeds the URC limit while RI(s) falls between the URC and LRC limits. In the open bus configuration, both RI(o) and RI(s) exceed the URC limits. This can be attributed to different vessel drift-off risks for operating in different operational setups.
The operational configuration of the ship’s power plant can significantly influence the maintenance strategy for engine components. Moreover, variations in conditions, such as ELFF or specific engine components, may result in risk factors RI(o) and RI(s) falling within acceptable, undesirable, or unacceptable ranges. The observation suggests that changes in operational conditions might have a certain influence on maintenance strategies. These findings have yet to be considered in the literature, which mostly reviews failure frequencies [23], Predictive Maintenance [24], and Risk-Based Maintenance Scheduling (RCM) [25,26], including failure mode and effects analysis (FMEA) [27,28].
Throughout this investigation, several limitations emerged that need some additional focus. The study’s scope was constrained by the availability of data, particularly regarding the source of injector subcomponents, manufacturers, and quality standards. Factors such as the origin of injector subcomponents and their associated quality standards were not considered, potentially impacting the reliability assessment and maintenance requirements. Further constraints lay within a lack of detailed data regarding specific maintenance tasks, including the timing and nature of fuel injector nozzle exchanges or services, which limited the depth of our analysis and understanding. Furthermore, while our focus on injector failures provided valuable insights, it may not fully capture the broader maintenance needs of the vessel, suggesting potential gaps in our understanding.
Based on the mentioned factors, several promising areas for future research present themselves. Investigating the influence of injector subcomponent suppliers and quality standards on failure rates and maintenance requirements could deepen our understanding of reliability in maritime installations. Further expanding data collection efforts to encompass a broader range of engine subcomponents and failure types would offer a more comprehensive understanding of maintenance needs and reliability challenges. Furthermore, as this methodology and approach can be utilised by any similar power plant, conducting comparative studies across different vessels or maritime installations with varying operational configurations could yield insights into generalisable maintenance strategies and best practices.
5. Conclusions
By reviewing MA-CAD methodology for an initial maintenance interval adjustment, an operational data analysis for drillship generator fuel injectors has been performed. Based on calculations derived from the data analysis fitted to parameters of the Weibull distribution, a reduction in maintenance interval for fuel injectors from 3000 operating hours to 1308 operating hours is proposed. For better management of the engine maintenance program and combining it with other work tasks, fuel injector maintenance every 1500 operating hours is proposed. Due to the significantly high predictability of failures (p = 0.68), a periodic preventive maintenance approach is chosen in both cases.
By comparing the risk index for fuel injector failure with the upper and lower risk criteria values for ship drift-off, we determine the risk area in which maintenance is currently being conducted. Consequently, for the operation of the engine in a closed bus system, the safety risk of fuel injector dispersion (RI(s)) according to the current maintenance system is situated in the risk area above the upper risk criterion (URC), i.e., in the unacceptable zone. The operational risk (RI(o)) is within the range of values between LRC and URC, i.e., in the undesirable zone. For engine operation in an open bus circuit, both safety risks (RI(s) and RI(o)) are in the unacceptable zone.
The specificity of this calculation lies in the fact that operational and safety risks (RI(s) and RI(o)) for the operation of the engine in an open bus are significantly above the upper limit values of URC (located in the unacceptable zone), while for the operation of the engine in a closed bus, this is not the case. Operational risk (RI(o)) for the operation of the engine in a closed circuit is in the undesirable zone, while safety risk (RI(s)) is in the unacceptable zone. This might lead us to conclude that the operating configurations of the power plant on the drilling ship might have an impact on the maintenance approach.
While our study has provided valuable insights into maintenance strategies for maritime installations, it is essential to recognise its limitations and pursue further research to address these constraints. By exploring the proposed avenues for future investigation, we can advance our understanding and improve maintenance practices onboard vessels with different operational pattern throughout whole maritime and offshore industry.
Author Contributions
Conceptualization, J.D.; methodology, J.D.; software, J.D.; validation, D.G., P.K. and V.P.; formal analysis, J.D.; investigation, J.D.; resources, J.D.; data curation, J.D.; writing—original draft preparation, J.D.; writing—review and editing, D.G., P.K. and V.P.; visualization, J.D.; supervision, P.K. and V.P.; project administration, P.K.; funding acquisition, P.K. All authors have read and agreed to the published version of the manuscript.
Funding
The APC was funded by Faculty of Maritime Studies, University of Rijeka.
Institutional Review Board Statement
Not applicable.
Informed Consent Statement
Not applicable.
Data Availability Statement
The data presented in this study are available on request from the corresponding author.
Conflicts of Interest
The authors declare no conflicts of interest.
References
- Roberts, K.H. Managing High Reliability Organizations. Calif. Manag. Rev. 1990, 32, 101–113. [Google Scholar] [CrossRef]
- Sullivan, J.; Beach, R. Understanding system development and operation in high reliability organizations: A conceptual model. In Proceedings of the First Security Conference, Richmond, VA, USA, 23 April 2003. [Google Scholar]
- North Highland. Principle of High Reliability Organizations. Available online: https://www.northhighland.com/sites/default/files/2020-01/WP_Principles_Of_High_Reliability_Orgs.pdf (accessed on 28 February 2022).
- Lower & Associates. Building High Reliability Organization. Available online: https://www.lowersrisk.com/lp/building-a-high-reliability-organization (accessed on 1 March 2022).
- Vučinić, B. MA-CAD Maintenance Concept Adjustment & Design. Ph.D. Thesis, Delft University of Technology, Delft, The Netherlands, 20 September 1994. [Google Scholar]
- Bukša, A. Modeliranje Održavanja Brodskog Porivnog Sustava. Ph.D. Thesis, Faculty of Maritime Studies, University of Rijeka, Rijeka, Croatia, 2005. [Google Scholar]
- Šegulja, I.; Bukša, A.; Tomas, V. Maintenance Interval Adjustment of Significant Ship Propulsion Components. Promet–Traffic–Traffico 2009, 21, 175–182. [Google Scholar] [CrossRef]
- Bukša, A.; Šegulja, I.; Tomas, V. Adjustment of Maintenance Approach for Improved Operability and Safety of Ship Navigation. Promet–Traffic–Traffico 2010, 22, 95–103. [Google Scholar] [CrossRef]
- Stazić, L.; Knežević, V.; Orović, J.; Mihanović, L. Maintenance Interval Adjustment Based on the Experience, Case Study of Marine Air Compressor System. Nase More 2019, 67, 146–152. [Google Scholar] [CrossRef]
- Andriulo, S.; Arleo, M.A.; de Carlo, F.; Gnoni, M.G.; Tucci, M. Effectivness of maintenance approaches for High Reliability Organiozations. IFAC-PapersOnline 2015, 48, 466–471. [Google Scholar] [CrossRef]
- Okoh, P.; Haugen, S. Improving the robustness and resilience properties on maintenance. Process Saf. Environ. Prot. 2015, 94, 212–226. [Google Scholar] [CrossRef]
- Okoh, P.; Haugen, S. The Effect of Maintenance Seen From Different Perspectives on Major Accident Risk. In Proceedings of the 2012 IEEE International Conference on Industrial Engineering and Engineering Management, Hong Kong, China, 10–13 December 2012. [Google Scholar]
- Herrera, I.A.; Hovden, J. Leading indicators applied to maintenance in the framework of resilience engineering: A conceptual approach. In Proceedings of the 3rd Resiliance Engineering Symposium, Antibes-Juan Les Pins, France, 28–30 October 2008. [Google Scholar]
- Engine Logbook extracts for drillship. Technical documentation, May 2009–December 2016.
- ABB Automation Technology Marine. Power Distribution Single Line Diagram 5500 kW Thrusters. Technical drawings, 2006.
- ISO 14224:2006; Petroleum, Petrochemical and Natural Gas Industries—Collection and Exchange of Reliability and Maintenance Data for Equipment. 2nd ed. International Organization for Standardization: Geneva, Switzerland, 2006.
- Kızılersü, A.; Kreer, M.; Thomas, A.W. The Weibull Distribution. Significance 2018, 15, 10–11. [Google Scholar] [CrossRef]
- Weibull, W. A Statistical Distribution Function of Wide Applicability. J. Appl. Mech. 1951, 18, 293–297. [Google Scholar] [CrossRef]
- Modarres, M.; Kaminskiy, M.P.; Krivtsov, V. Reliability Engineering and Risk Analysis: A Practical Guide, 3rd ed.; CRC Press: Boca Raton, FL, USA, 2016. [Google Scholar]
- MAN Diesel SE. Engine Operating Instruction, Engine 14V32/40; Technical documentation; MAN Diesel SE: Augsburg, Germany, 2002. [Google Scholar]
- Varela, Z.S.; Falces, D.B.; Barrena, J.L.L.; Solaeche, M.A.G. Risk Analysis of DP Incidents during Drilling Operations. Trans. Marit. Sci. 2021, 10, 84–100. [Google Scholar] [CrossRef]
- Journal of Petroleum Technology. Lifetime Revenue vs. Construction Cost—A Metric for Assessing Drillship Retirements. Available online: https://jpt.spe.org/lifetime-revenue-vs-construction-cost-metric-assessing-drillship-retirements#:~:text=The%209.2%2Dyear%20average%20attrition,for%20the%2016%20semisubmersible%20retirements.&text=The%20five%20drillships%20retired%20so,by%20Valaris%20and%20Noble%20Drilling (accessed on 15 March 2023).
- Knežević, V.; Stazić, L.; Orović, J.; Pavić, Z. Optimisation of Reliability and Maintenance Plan of the High-Pressure Fuel Pump System on Marine Engine. Pol. Marit. Res. 2022, 29, 97–104. [Google Scholar] [CrossRef]
- Altosole, M.; Balsamo, F.; Acanfora, M.; Mocerino, L.; Campora, U.; Perra, F. A digital twin approach to the diagnostic analysis of a marine diesel engine. In Proceedings of the 20th International Conference on Ships and Maritime Research, Genoa, Italy, 15–17 June 2022. [Google Scholar]
- Cullum, J.; Binns, J.; Lansdale, M.; Abbassi, R.; Garaniya, V. Risk-Based Maintenance Scheduling with application to naval vessels and ships. Ocean Eng. 2018, 148, 476–485. [Google Scholar] [CrossRef]
- Mishra, C.; Fanar, A.; Samson, A. Study of the causes of engine failure in ship and maintenance required to prevent engine failure. Int. J. Contemp. Res. Rev. 2017, 8, 20218–20241. [Google Scholar] [CrossRef] [PubMed]
- Alamri, T.O.; Mo, J.P.T. Optimisation of preventive maintenance regime based on failure mode system modelling considering reliability. Arab. J. Sci. Eng. 2022, 49, 3455–3477. [Google Scholar] [CrossRef]
- Cicek, K.; Celik, M. Application of failure modes and effects analysis to main engine crankcase explosion failure on-board ship. Saf. Sci. 2013, 51, 6–10. [Google Scholar] [CrossRef]
Disclaimer/Publisher’s Note: The statements, opinions and data contained in all publications are solely those of the individual author(s) and contributor(s) and not of MDPI and/or the editor(s). MDPI and/or the editor(s) disclaim responsibility for any injury to people or property resulting from any ideas, methods, instructions or products referred to in the content. |
© 2024 by the authors. Licensee MDPI, Basel, Switzerland. This article is an open access article distributed under the terms and conditions of the Creative Commons Attribution (CC BY) license (https://creativecommons.org/licenses/by/4.0/).