Abstract
The reclamation coral sand (CS) layer is the survival environment for island reef vegetation in the South China Sea. The root system within the CS bed draws water necessary for vegetation growth, implying that the water-retention capacity of CS plays a pivotal role in determining vegetation viability. Particle size distribution (PSD) significantly influences the water-retention capacity of geomaterials. This study examines the impact of PSD on the water-retention capacity of CS from both macro (soil–water characteristic curve, SWCC) and micro (pore water distribution) perspectives using the pressure plate test and nuclear magnetic resonance technique, and an F&X model was used to analyze the SWCC of CS. The findings indicated that the F&X model aptly describes the SWCC of CS with different PSDs. Both the air entry value and residual water content rise with an increased content of fine grains (d < 0.25 mm), suggesting that the presence of fine grains augments the water-retention capacity of CS. It is considered that a size range of d = 0.075–0.25 mm predominantly impacts the water-retention capacity of CS. The PSD primarily influences the water-retention capacity by affecting the pore size distribution of CS. The volume of small pores swells with the surge of fine-grain content, while the maximum pore size contracts with increasing fine-grain content. Limited pore connectivity in CS means macropores can retain water even under high suction, bolstering the water-retention capacity of CS. These findings offer theoretical guidance for selecting gradation parameters for the planting layer on island reefs.
1. Introduction
In recent years, China has completed numerous island reef hydraulic reclamation and infrastructure constructions in the South China Sea [1,2]. The primary geomaterial for reclamation and construction, coral sand (CS), is a deposit formed from the organic remnants of entities like corals, algae, and shells eroded by seawater. CS possesses distinct characteristics such as an irregular shape, high void ratio, rough surface, and abundant internal pores [3,4,5,6,7]. Research has validated CS’s exceptional mechanical properties [8,9,10], making it indispensable in island reef construction. Once the safety and stability of the island reef are assured, the challenge becomes transforming it into a habitable ecological island. The development of such an ecological island reef necessitates vegetation coverage. A survey revealed that the survival rate of vegetation transplanted onto the reclamation layer is notably low. A significant reason for this is the challenge vegetation roots face in absorbing adequate water from the reclamation layer. Currently, vegetation on island reefs is predominantly planted in the CS layer. The water essential for island reef vegetation primarily derives from atmospheric rainfall and groundwater, which is then discharged via surface evaporation and transpiration (Figure 1). To ensure vegetation’s survival, sufficient rainwater and groundwater must be retained in the CS layer; otherwise, the vegetation may perish from dehydration. In essence, the water-retention capacity of the CS layer, which is pivotal for vegetation, directly impacts the likelihood of vegetation survival. In addition, during island reef hydraulic reclamation, the grain weight and hydraulic sorting often result in notable particle size discrepancies in the CS within the reclamation layer [11,12,13]. Extensive studies have indicated that particle size profoundly affects the water-retention capacity of geomaterials [14,15]. Hence, examining the impact of particle size distribution (PSD) on the water-retention capacity of CS, and identifying beneficial gradation parameters for water storage in the CS layer, holds significant importance for the ecological construction of island reefs.
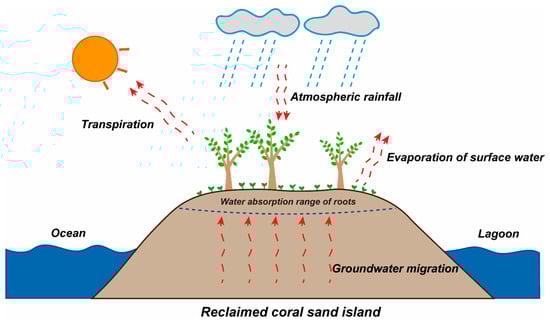
Figure 1.
Schematic diagram of water dissipation and supply of vegetation in reclaimed island.
The relationship between volumetric water content (θw = Vw/V) and matric suction (ψ = ua − uw), termed the soil–water characteristic curve (SWCC), serves as a crucial metric in assessing the water-retention capacity of geomaterials [16]. Established SWCC testing methodologies encompass the pressure plate, filter paper, saturated salt solution, and tensiometer methods [17]. The ψ ranges assessable by these techniques vary. The pressure plate and tensiometer methods are apt for testing in lower ψ ranges, while the filter paper and saturated salt solution methods are designed for higher ψ ranges [18]. Over the past several decades, significant advancements have been made in the research on the water-retention capacity of geomaterials, including numerous studies focused on how PSD influences this capacity. Gallage and Uchimura [19] conducted a study to examine the impact of dry density and grain size distribution on the SWCC. They found that coarse-grained soil exhibits a lower AEV and residual suction compared to fine-grained soil. Rahardjo et al.’s [20] research revealed that the particle sizes of gravels and the percentage of fine particles in soil mixtures have an influence on the saturated volumetric water content and the AEV of the SWCCs. Chen and Uchimura [21] demonstrated a linear decrease in AEV and residual matric suction with an increase in effective particle size, as observed on semilog coordinates. Guo et al. [22] highlighted the inverse relationship between matric suction and particle size at the same θw. They also noted that the amplitude of variation in matric suction decreases gradually with an increase in particle size and content of coarse particles during drying and wetting processes.
However, given that CS has grain characteristics and mineral compositions distinct from terrigenous geomaterials [23,24], one cannot directly infer the water-retention capacity of CS from the findings associated with terrigenous geomaterials. Only by delineating the correlation between gradation parameters and water-retention capacity specific to CS can suitable gradation parameters for the vegetation planting layer be chosen.
The intergranular pore plays a pivotal role in determining the water-retention capacity of geomaterials at the microscopic level. Previous researchers employed microscopic detection techniques to analyze the pore structure and examined the relationship between void ratio, pore size distribution (PoSD), and water-retention capacity [25,26,27,28,29,30]. PoSD strongly correlates with PSD [31]. Limited research examines the relationship among the PSD, PoSD, and water-retention capacity of CS [32]. By elucidating the influence of PSD on PoSD and understanding the mechanism through which PoSD impacts the water-retention capacity, PoSD serves as a crucial link between the PSD and water-retention capacity. This connection is vital for grasping the water-retention capacity of CS at the microscopic scale. In addition, water stored within the pores of geomaterials is termed pore water. Pore water is present between grains in various forms, influenced by the intensity of its interaction with grains. Water in macropores tends to be easily lost, whereas that in micropores is challenging to discharge [28]. Consequently, PoSD across different pore sizes impacts the water-retention capacity of geomaterials differently. As the moisture content varies under the influence of ψ, the retention of pore water in different pore sizes also differs, and this behavior is modulated by PSD.
In light of this, the current study aims to investigate the influence of PSD on the water-retention capacity of CS. At the macroscopic level, several pressure plate tests (drying) are conducted to derive the SWCC of CS with varying PSDs. The obtained data are then interpreted using the classical SWCC model. A relationship between the gradation parameter and water-retention characteristic value is discussed, providing a quantitative description of how PSD affects the water-retention capacity of CS. At the microscopic level, a nuclear magnetic resonance (NMR) test is sequentially performed along the ψ path of the drying process. This helps to elucidate the internal association between microscopic pore structures and macroscopic soil–water characteristics, shedding light on how PSD affects pore water distribution’s (PWD) evolution pattern during the drying process.
2. Materials and Methods
2.1. Material
CS obtained for this experiment originated from a reclaimed island reef in the South China Sea. CS grains are loosely arranged and not cemented, displaying a highly irregular shape. Different particle sizes of CS were secured through a sieve test (Figure 2a). The Scanning Electron Microscope (SEM) results revealed a rough surface of CS with numerous pores (Figure 2c), a distinguishing characteristic that differentiates CS from terrigenous sand (Figure 2d). Component analysis by way of X-ray Diffraction (XRD) indicated that the primary mineral composition of CS was CaCO3, complemented by a minor presence of MgCO3 (Figure 3).
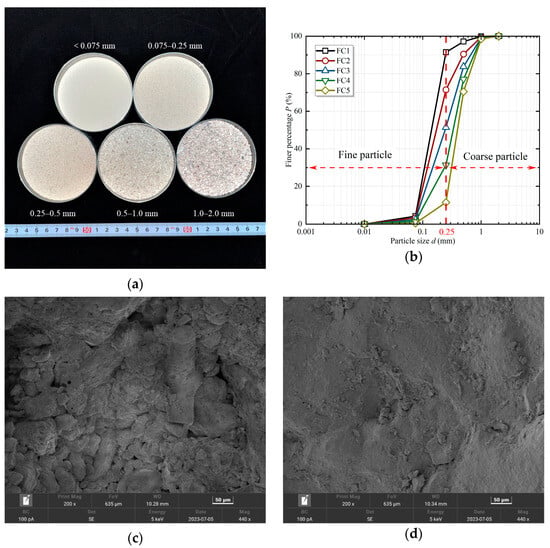
Figure 2.
Physical characteristic of coral sand: (a) a physical view; (b) particle gradation curve; (c) SEM of coral sand; (d) SEM of quartz sand.
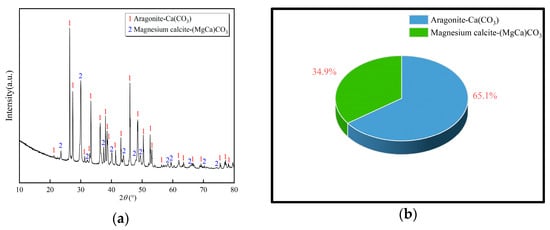
Figure 3.
XRD results of coral sand: (a) XRD pattern; (b) mineral composition proportion.
Based on traditional soil mechanics, d = 0.5 mm is the boundary standard separating coarse sand from medium–fine sand (Chinese National Standard of Soil Test Method (GB/T 50123–2019)). The unique physical attributes of CS, which include its irregular shape and elevated void ratio, profoundly impact its water-retention capacity based on particle size. CS with d ≥ 0.5 mm proves challenging for sampling at low compaction; the intergranular pore size is considerable and possesses high porosity, rendering CS less efficient at retaining water. Consequently, in this study, CS with d ≥ 0.25 mm was categorized as coarse grain, while that with d < 0.25 mm was identified as fine grain, see Figure 2b. This classification offers a more fitting description of the water-retention capabilities of CS. After discarding grains with d ≥ 2 mm, the gradation of in situ coral sand collected at the engineering site underwent testing, revealing that the fine-grain content (the mass ratio of fine grains to all particles) was 11.42% (FC5 in Figure 2b). To discern the influence of PSD on the water-retention capability of CS, five sample groups were arranged, each increasing the fine-grain content by a gradient of 20% on the basis of FC5. Table 1 details the physical property parameters for these groups. The uniformity coefficient (Cu) and curvature coefficient (Cc) indicate that the samples utilized in this test were all poorly graded.

Table 1.
Physical parameters of coral sand samples in this test.
2.2. Test Scheme
The CS void ratio is elevated [33], suggesting that the primary alteration stage of θw likely occurs within the low ψ range [32]. Therefore, a pressure plate test was administered to measure the SWCC of CS, ensuring test result accuracy. Five sample groups, based on PSD, were established to study the variances in the water-retention capacity of CS under assorted particle size ratios. The pressure plate test scheme is shown in Table 2. For the compacted dry density (ρd) setting, it was crucial to ensure the samples remained intact throughout the test, resulting in a measurement of 1.5 g/cm3 for this examination. The initial moisture content (wi) was standardized at 10%, providing the sample with adequate internal cohesion for preparation. Each sample measured 45 × 20 mm (diameter × height). The ψ path was determined as 0→5→10→20→40→70→120→200→300→450 (Unit: kPa). Additionally, an NMR test was executed on samples in equilibrium at varying ψ levels to uncover the intrinsic relationship between pore distribution and water-retention capacity and the evolution pattern of PWD during the drying process. For this study, pivotal testing points were 0, 5, 10, 70, and 300 kPa.
Table 2.
Pressure plate test scheme.
2.3. Apparatus and Procedure
The pressure plate test is an SWCC measuring method based on the axis-translation technique. The test apparatus consists of a pressure chamber and an air pressure control system (Figure 4a). The testable ψ range is 0–500 kPa. A saturated porous ceramic plate separates water from the air, permitting only water to pass. A water storage bottle is attached to the porous ceramic plate to collect water discharged by the sample. The procedure for the pressure plate test is as follows:
- (1)
- Sample preparation: Dry CS of the designated quality and water were weighed and mixed uniformly. The mixture was placed in a sealed bag and left for 48 h. Once the moisture in the sample became consistent, the sample was divided into three parts and placed into the mold, with each part being gently pressed down with a small spoon to make the surface smooth. After all the parts were filled, the sample was compacted to the predetermined dry density using a jack.
- (2)
- Saturation of samples and porous ceramic plate: The porous ceramic plate underwent evacuation for 4 h and was subsequently submerged in distilled water until half covered. It was then evacuated continuously for an additional 12 h. Afterward, the plate was fully submerged in distilled water and maintained under a vacuum for another 12 h. The method for sample saturation mirrored this procedure. Following a 4 h evacuation, it was submerged in distilled water, subjected to a 12 h vacuum, and removed.
- (3)
- Execution of the pressure plate test: The saturated porous ceramic plate was positioned within the pressure chamber. Specific air pressure was applied to clear any gas in the pipeline. Prepared samples were set on the porous ceramic plate, which was then sealed, and the anchor bolt tightened. Air pressure followed the designated ψ path. After applying the initial air pressure level, the water storage bottle’s weight was measured every 12 h. When consecutive weighing results aligned, the sample had reached an equilibrium state at that specific ψ level. The samples were subsequently removed and weighed. The sample’s θw can be determined using specific equations:where ml is the sample’s mass after each pressure level is applied; md is the mass of dry sand; and ρw is the density of water.
The NMR technique involves placing samples within a fixed magnetic field of a particular intensity. The hydrogen nuclei in the samples require a specific time to return to an equilibrium state after being disrupted by a radio frequency field and a process termed the relaxation process [34]. The T2 curve can be deduced from the observed relationship between the transverse magnetization vector and the relaxation time (T2), where the horizontal ordinate represents T2 and the vertical ordinate indicates the signal intensity corresponding to T2. The following equation defines the connection between T2 and pore radius R:
where α is the shape factor; ρ2 represents the transverse relaxation rate.
For specified geomaterials, the intensity and location of signals correspond to the content and distribution of pore water. Consequently, the NMR technique helps measure the pore water content and energy state distribution within samples. The NMR testing equipment used was the PQ001 Mini NMR analyzer (Figure 4b), a collaboration between the Wuhan Institute of Rock and Soil Mechanics, Chinese Academy of Sciences, and China Suzhou Niumag Analytical Instrument Co., Ltd., Suzhou, China. The apparatus primarily consists of five components: a permanent magnet, sample tube, radio frequency system, temperature control system, and data acquisition and analysis system. The permanent magnet had a magnetic field intensity of 0.52 T. The magnet’s temperature was maintained at (32 ± 0.01) °C to ensure field uniformity and stability. The effective testing range for the sample tube was 60 mm × 60 mm (diameter × height). During the drying phase, samples balanced at a specific ψ level were promptly sealed with plastic wrap and inserted into the sample tube. The pore structure characteristics and the distribution pattern of the pore water inside the sample were determined by processing these nuclear magnetic signals. Notably, the NMR is a non-destructive test, allowing samples to undergo subsequent pressure plate testing. It is essential to note that metals can distort nuclear magnetic signals; thus, the cutting ring in this experiment was fabricated from nylon.
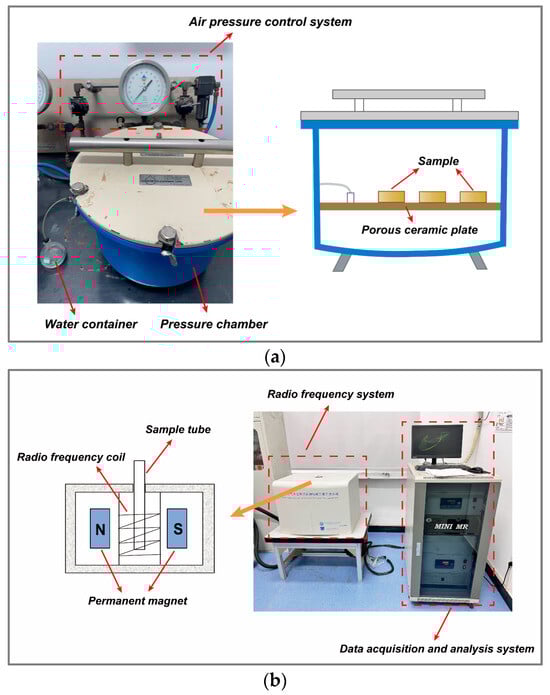
Figure 4.
Test apparatus: (a) pressure plate apparatus; (b) NMR test apparatus.
3. Pressure Plate Test Results and Analysis
3.1. SWCC of CS
In unsaturated theory, the drying process of geomaterials typically consists of three stages (Figure 5) [35]: (i) Boundary effect stage. During this stage, ψ is minimal and insufficient to induce a significant water loss in the samples. Consequently, θw remains relatively unchanged. (ii) Transition stage. Here, pore water starts to evaporate substantially under pressure, leading to a marked increase in the slope of the SWCC compared to the boundary effect stage. (iii) Residual stage. By this stage, the θw in the sample has already decreased considerably from its saturated state. As ψ continues to rise, the θw of the sample follows a declining trend, but the rate of decrease slows down significantly.
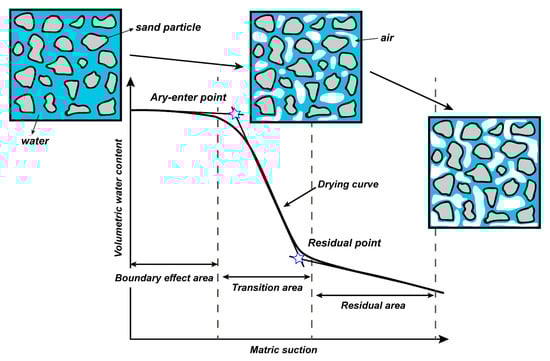
Figure 5.
Typical drying process of geomaterials.
Figure 6 presents the SWCC of CS samples with varied PSDs from this study. The data from Figure 6 indicate that the drying curve of CS is S-shaped and adheres to the aforementioned three-stage evolution. In the boundary effect stage, variations in the SWCC arise due to differences in PSD. The reductions in sample θw from FC1 to FC5 were 1.93%, 2.93%, 3.85%, 5.32%, and 8.1%, respectively, at pressures ranging from 0 to 5 kPa. During the transition stage, the sample SWCC displayed characteristics similar to those in the boundary effect stage at pressures between 5 and 10 kPa. However, in the residual stage, θw values across samples became consistent gradually, and the SWCCs appeared nearly parallel. For samples from FC1 to FC5, the retained θw under the termination condition was 8.01%, 7.16%, 6.67%, 6.11%, and 5.51%, respectively.
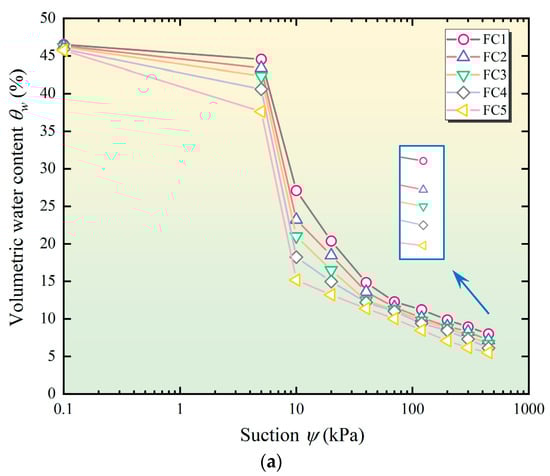
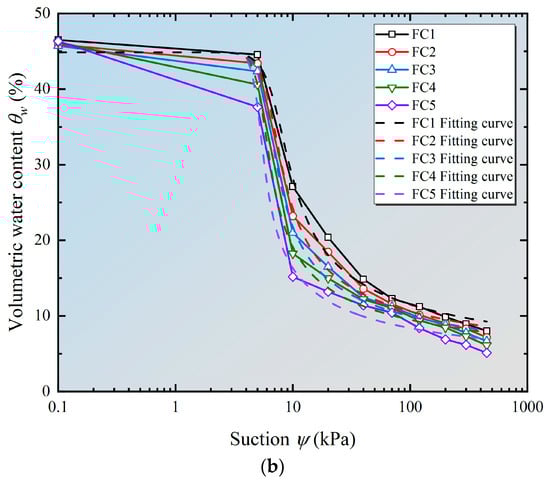
Figure 6.
Soil–water characteristic curves of coral sand sample with different PSDs: (a) measured curve; (b) the comparison between the measured curve and the fitting curve.
Numerous classic models exist in unsaturated soil studies that delineate the soil–water characteristics of geomaterials, including the BC model [36] and the VG model [37]. Fredlund and Xing (1994) [38] introduced the soil–water characteristic model (F&X Model), which has since gained widespread adoption in geotechnical engineering. Its formulation is as follows:
where ψr is the ψ corresponding to the residual volumetric water content (θr); θs is the saturated volumetric water content; a, b, and c are fitting parameters; and e is the natural constant.
When ψ is in the low suction range, the F&X model can be simplified as follows [39]:
Figure 6b and Table 3 show the F&X model fitting outcomes derived from the experimental findings. It indicates that the F&X model aptly characterizes the soil–water properties of CS during the drying process, considering varied PSDs. This study provides specific boundaries for coarse and fine grains when addressing PSD, allowing for the definition of a gradation parameter to signify the sample grain ratio. Then, a gradation parameter can be defined as follows:
where γ is the grain ratio coefficient; Pf is the content of fine particles in the sample; and Pc is the content of coarse grain in the sample, and Pc = 100 − Pf. Establish the relationship between γ and the F&X model parameters:
The functions a(γ), b(γ), and c(γ) signify the relationships between the parameters a, b, and c with γ, respectively. Thus, Equation (4) can be described as follows:
Equation (7) integrates the F&X model with the coarse-to-fine-grain ratio in CS. Using Equation (7), researchers can forecast the SWCC of CS given a known PSD. Equation (7) articulates the SWCC based on set sample parameters like compaction and starting moisture content. In addition, when employing Equation (7), the upper limit of the particle size of CS should be less than 2 mm.
Table 3.
F&X model parameters and water-retention characteristic values.
Table 3.
F&X model parameters and water-retention characteristic values.
| Model | Sample No. | a | b | c | R2 | AEV (kPa) | Θr (%) |
|---|---|---|---|---|---|---|---|
| FC1 | 6.244 | 4.862 | 0.537 | 0.994 | 4.654 | 11.206 | |
| FC2 | 5.697 | 6.025 | 0.518 | 0.994 | 4.497 | 10.584 | |
| FC3 | 5.386 | 7.030 | 0.508 | 0.996 | 4.399 | 10.088 | |
| FC4 | 5.024 | 9.318 | 0.477 | 0.994 | 4.299 | 9.807 | |
| FC5 | 4.751 | 12.348 | 0.466 | 0.993 | 4.237 | 8.862 |
3.2. Water-Retention Characteristic Value
As depicted in Figure 5, the drying curve presents two characteristic points: air entry and residual points. These are fundamental indices for evaluating the water-retention capacity of geomaterials. The air entry point signifies the initiation of gas penetration into the maximum pore of the sample, marking the transition from a saturated to a non-saturated state. The ψ at this juncture is termed the air entry value (AEV). The residual point, on the other hand, suggests that the water in the sample ceases to decrease significantly with an increase in ψ, and the moisture content at this point is termed the residual volumetric water content (θr). The AEV and θr are commonly determined using a graphical method: drawing a tangent to the SWCC at three distinct stages. The ψ that corresponds to the intersection of the tangent during the boundary effect and transition stages is the AEV, while the θw corresponding to the transition between the transition stage and residual stage is θr. However, this graphical approach is somewhat subjective and can lack precision. To this limitation, Zhai and Rahardio (2012) [40] introduced a mathematical method rooted in the F&X model, whereby the AEV can be computed using the provided equations:
where a, b, and c are the fitting parameters of the F&X model. The calculation method of θr is as follows:
where
where ψ′ is the ψ when the sample’s water content approaches stability, set at 1500 kPa; θ′ is the corresponding θw.
Based on Equations (8)–(10) and the F&X model parameters, the AEV and θr for CS at varying PSDs were tabulated (Table 3). Table 3 illustrates that both AEV and θr escalate with an increase in the content of fine grains. CS samples with a high content of fine grains are more resistant to air penetration and can retain more water at elevated ψ levels, indicating superior water-retention capabilities.
The geomaterials’ water-retention capacity is influenced by various factors, including mineral composition, grain structure, and surface properties. One can logically infer that the water-retention capacity of CS differs from that of terrigenous geomaterials. As such, specific research findings concerning the water-retention of terrigenous geomaterials were selected for comparison:
Figure 7a presents a comparison of AEV between CS and terrigenous geomaterials. As observed in Figure 7a, the AEV of CS is marginally greater than that of terrigenous sand, a difference attributed to the maximum pore size in samples. Terrigenous sand typically exhibits a sleek grain surface and minimal roughness. Conversely, the grain surface of CS is replete with indented pores, leading to pronounced roughness. The special particle characteristics of coral sand make it easier to form small pores in the interparticle structure. [41]; thus, the AEV of CS is generally superior to that of terrigenous sand. However, the pore structure, shaped by the unique grain structure of CS, expands the PoSD range of CS samples beyond that found in clay soil [41,42]. Consequently, higher pressure is required for air to infiltrate the pores of clay soil, rendering the AEV of clay materials greater than that of CS.
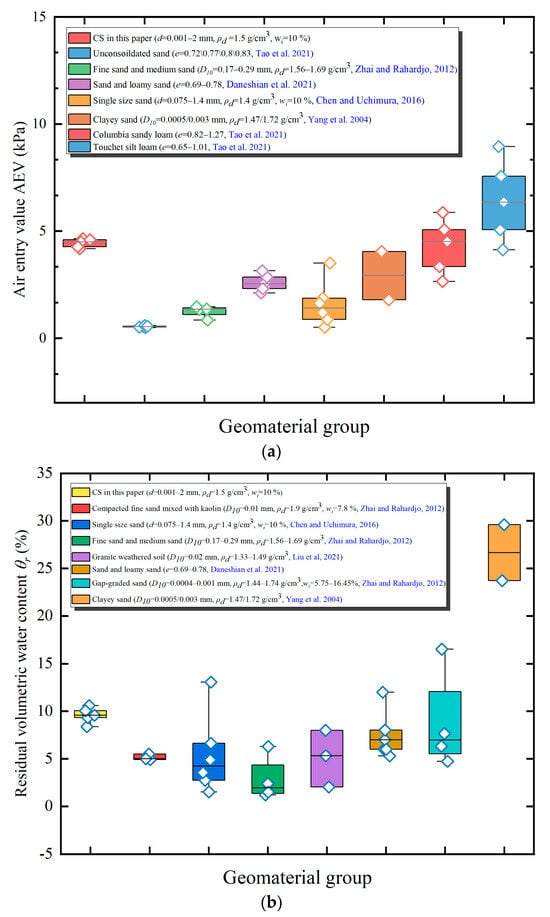
Figure 7.
Compassion of water-retention characteristic value between coral sand and other geomaterials: (a) AEV; (b) residual volumetric content; [21,40,44,45,46,47].
Figure 7b contrasts the θr between CS and terrigenous geomaterials. It shows that the θr for both CS and terrigenous geomaterials predominantly ranges between 2 and 10%. The θr of CS, as presented in this study, surpasses that of different terrigenous sands documented in earlier research, which is attributed to the abundance of the internal pores connected to the outside. The internal pore structure of coral sand particles is developed, and the internal porosity varies with the shape of the particles, and the internal porosity of cube-shaped particles is the highest, with an average of 20.19%. The bar-shaped particles are the second, and the flake-shaped particles are the smallest, while the internal structure of terrigenous sand particles is dense, and the influence of internal porosity can be ignored [43]. The water residing in these inner pores is typically challenging to expel, resulting in a higher θr for CS compared to terrigenous sand.
3.3. Relationship between Gradation Parameters and Water-Retention Characteristic
Figure 8 depicts the correlation between the grain gradation parameters and the water-retention characteristic value. Figure 8a,b indicate that the AEV (or θr) rises as gradation parameters d10, d30, d50, and d60 decrease. A reduction in these parameters indicates an increase in the fine-grain content in the samples, leading to a corresponding increase in AEV (or θr). This observation aligns with previous discussions. Specifically, d50 and d60 exhibit a closer association with AEV, as they account for over half of the grains and play a significant role in the formation of the maximum pore between grains. Conversely, d10 and d30 have a stronger relationship with θr and are indicative of fine-grain content. The presence of these fine grains is a key factor enabling samples to retain water under high ψ conditions. Figure 8c,d reveal that AEV (or θr) consistently increases with Cu at first and then diminishes. A greater Cu value indicates a more varied PSD and superior gradation. It can be inferred that the water-retention capacity of CS is not overtly tied to PSD uniformity. With Cc values ranging between 0.93 and 1.20, the corresponding lines in Figure 8c,d do not clearly delineate a relationship between Cc and the water-retention capacity of CS. Figure 9 presents the association between the water-retention characteristic value and γ. Figure 9 demonstrates that both AEV and θr amplify with an increase in γ, establishing a strong linear relationship. Figure 9 also organizes the correlation between γ and the water-retention characteristic value from prior research, illustrating that for terrigenous sand, both AEV and θr augment with a rise in fine-grain content. Nonetheless, no functional relationship exists between them, attributed to the non-uniform increase in fine-grain content in the samples used in this study. The above analysis indicates that the fine-grain content in samples bolsters the water-retention capacity of CS.
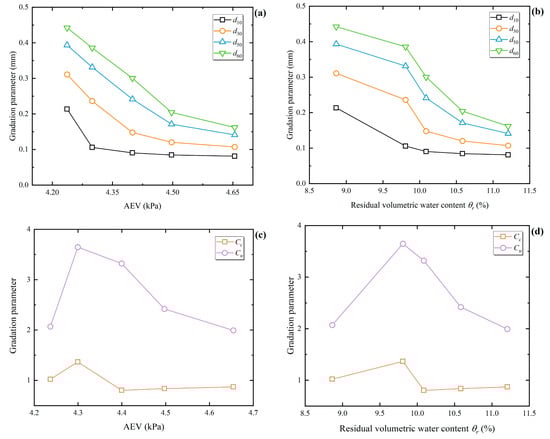
Figure 8.
Relationship between gradation parameter and water-retention characteristic value: (a) relationship between AEV and grain gradation parameter; (b) relationship between residual volumetric content and grain gradation parameter; (c) relationship between AEV and Cu/Cc; (d) relationship between residual volumetric and Cu/Cc.
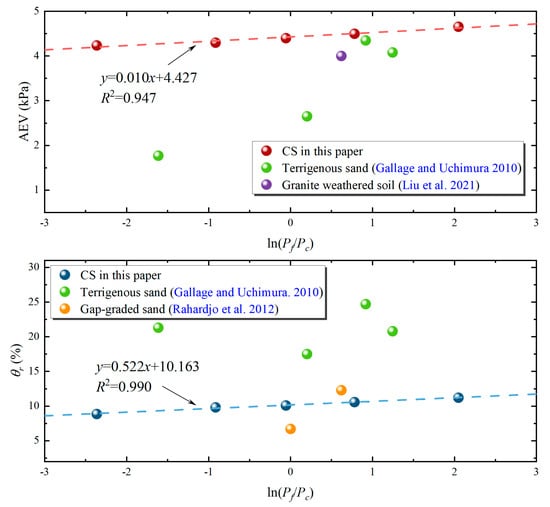
Figure 9.
Relationship between particle proportioning index and water-retention characteristic value; [19,20,45].
This study recommends adopting d = 0.25 mm as the delineation between coarse and fine grains when examining the water-retention capacity of CS. The primary PSD oscillates around the two sizes associated with 0.25 mm, specifically d = 0.25–0.5 mm and d = 0.075–0.25 mm. Concurrently, the water-retention capacity of samples varies in tandem with the alternating increases and decreases in the CS content of these two sizes. For instance, as the CS content within d = 0.075–0.25 mm grows from 10.9% to 87.23%, the water-retention capacity of samples consistently ascends. Thus, d = 0.075–0.25 mm is posited as a predominant size influencing the water-retention capacity of CS. Based on the related studies, one might deduce that CS with d < 0.075 mm (coral silt) would exhibit enhanced water-retention capacity [48]. However, due to its diminutive size, silt typically adheres to larger grain surfaces with minimal content or gets lost with flowing water through pore channels. In addition, in natural island reef environments with copious rainfall, silt’s propensities for easy displacement and hardening are inimical to plant growth. Thus, it is more reasonable to consider d = 0.075–0.25 mm as the principal size affecting the water-retention capacity of CS. By strategically increasing the CS content with d = 0.075–0.25 mm in the planning phase of the island reef planting layer, one can efficaciously enhance the water-retention capacity of the planting layer.
4. NMR Test Results and Analysis
4.1. Test Results
T2 represents the attenuation rate of nuclear magnetic signals. The larger the pores are, the more water there is, the slower the attenuation rate is, and the larger the T2 value is. As the strength of a nuclear magnetic signal is proportional to the number of protons (hydrogen nuclei) in a unit volume sample and given that the hydrogen nuclei in pore water have a strong signal, the size and quantity of pores in samples can be inferred by analyzing the T2 curve. Figure 10 depicts the changes in the T2 curve of the FC1 sample during the drying process. The area enclosed by the T2 curve and the X-axis is called the peak area, characterizing the quantity of pore water in the sample. The primary, secondary, and subsequent peaks can be sequentially identified from left to right. As observed in Figure 10, with an increasing value of ψ, the total peak area consistently diminishes, indicating a continuous loss of pore water. When ψ ranges between 0 and 5 kPa, the primary peak area is considerably smaller than the secondary peak area. However, when ψ ≥ 70 kPa, the difference between the primary and secondary peak areas significantly decreases. The shape of the T2 curve evolves with increasing ψ, suggesting that the PWD within the sample undergoes dynamic changes during the drying process.
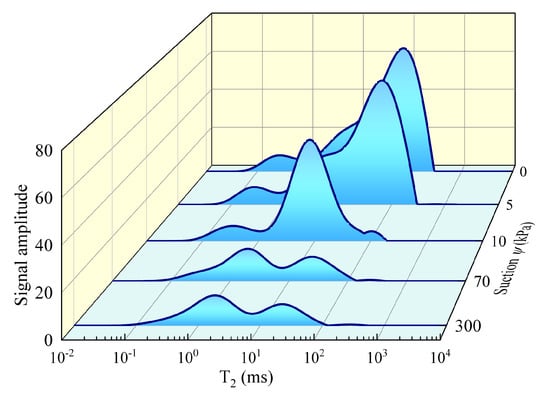
Figure 10.
T2 curve of FC1 sample under different suctions.
4.2. PoSD Analysis
An NMR test essentially detects the PWD inside the sample. Consequently, for saturated samples, the NMR test can provide a comprehensive portrayal of the PoSD within the sample. NMR test results at ψ = 0 kPa are chosen for analytical purposes. Figure 11 presents the NMR test outcomes for saturated CS samples with varying PSDs. From the results,
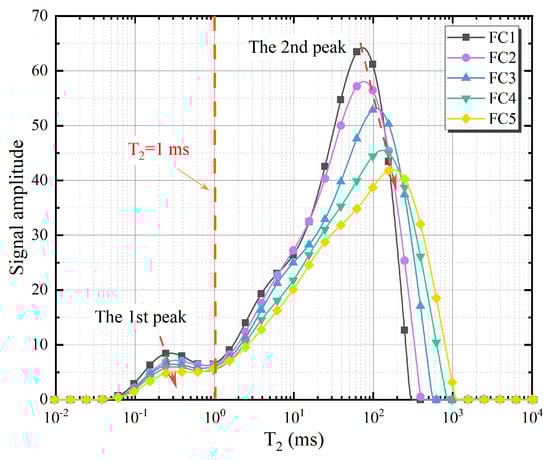
Figure 11.
T2 curves of saturated coral sand samples with different PSDs.
- (1)
- The entire area bounded by the T2 curve and the X-axis represents the total pore water volume in the sample. Given a consistent mass, CSs with different PSDs have the same volume ratio. However, the volume of pores of different sizes varies.
- (2)
- From FC1 to FC5, the maximum T2 values (T2 max) are 298, 411, 568, 861, and 1135 ms, respectively. These values indicate that the PSD influences the sample’s PoSD range. As the fine-grain content grows, the maximum pore size decreases. The structure is predominantly coarse grains in samples with a lower fine-grain content, forming larger pores between grains. This PoSD aligns with the previously mentioned observations: samples with elevated fine-grain content exhibit a larger AEV. Further analysis revealed that AEV and T2 max follow this relationship:
Equation (11) shows a clear functional relationship between AEV and T2 max. The T2 curve of the samples was obtained by NMR test to predict sample AEVs.
- (3)
- Drawing from pore classification criteria outlined in prior research [30] and factoring in the consistent T2 curve morphology for CS with differing PSDs in this study, pores with T2 ≤ 1 ms are categorized as micropores (linked to the first peak area), while those with T2 > 1 ms are classified as macropores (associated with the secondary peak area). Table 4 presents the statistics of the first and secondary peak areas. The increase in fine-grain content impacts the distribution of both macro and micro pores. The combined volume of macro and micro pores expands with the growth in fine-grain content. Specifically, the volume of macropores surges by 9.85%, double the increase observed in the micropore volume. A rise in fine-grain content leads to an increase in pore water that exhibits reduced mobility (or is subject to heightened capillary force) within micropores. A significant volume of mobile water dissipates under the continuous influence of ψ, while micropore water remains close to grains. Samples containing a higher fine grain concentration retain more pore water at elevated ψ values. This finding aligns with the observation that θr amplifies with an increase in fine-grain content. The first peak area is recorded as T2-A1, establishing the following relationship between θr and T2-A1:
Table 4.
Peak area of saturated coral sand samples.
Table 4.
Peak area of saturated coral sand samples.
| Sample No. | First Peak Area | Second Peak Aera |
|---|---|---|
| FC1 | 343.859 | 4060.817 |
| FC2 | 295.164 | 4028.902 |
| FC3 | 248.494 | 3945.579 |
| FC4 | 231.499 | 3743.532 |
| FC5 | 163.066 | 3696.536 |
4.3. Drying Process Analysis
Section 4.2 discussed the internal relationship between the CS soil–water characteristics and PoSD based on the T2 curve of samples under saturation conditions. As the drying process, the PWD within the sample changed continuously, and the T2 curve adjusted in response. The NMR patterns of drying shown in Figure 10 for sample FC1 are consistent with different PSDs. Consequently, this section analyzes FC1 as a representative example. Figure 12 presents the T2 curves of FC1 at different ψ values. For clarity, the T2 curves of FC1 at 0, 5, 10, 70, and 300 kPa are denoted as T2(0), T2(5), T2(10), T2(70), and T2(300), respectively. Observations from Figure 12 include:
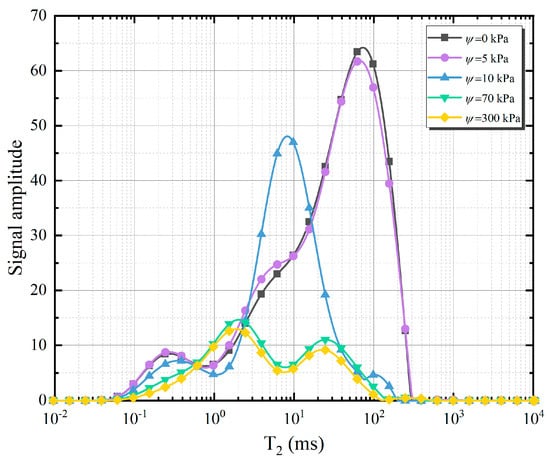
Figure 12.
T2 curves of FC1 under different suctions.
- (1)
- At ψ = 0–5 kPa, T2(0) and T2(5) are similar in shape. Compared to T2(0), the nuclear magnetic signals of T2(5) decrease slightly at T2 = 100 ms. The AEV of FC1 is 4.65 kPa. Only the largest pore in the sample discharges water at a ψ of 5 kPa, resulting in minimal attenuation of nuclear magnetic signals. The signal attenuation suggests that the pore water lost at this stage is predominantly free water.
- (2)
- At ψ = 5–10 kPa, the nuclear magnetic signals of the T2 curve decrease markedly in the T2 = 16.7–298 ms range. Signals also decrease slightly in the T2 = 0.1–2.4 ms range, suggesting that the primary water discharged from the sample at this phase is a mixture of free and capillary water in macropores. Notably, signals in the T2 = 2.4–16.7 ms range increase by 15–38%. Bird et al. (2005) [49] observed a similar phenomenon attributed to the effect of air in the sample and soil shrinkage. Tian et al. (2014) [48] postulated that an air–water interface emerges in the soil after air enters saturated samples. Pellicular water exists between this interface and the pore wall, causing a slight increase in T2.
- (3)
- At ψ = 10–70 kPa, nuclear magnetic signals primarily decrease in the T2 = 2–40 ms range. Signals in the T2 = 0.1–0.6 ms range also decline slightly, indicating that the predominant loss in the sample at this phase is capillary water in macropores and some micropores.
- (4)
- At ψ = 70–300 kPa, the nuclear magnetic signals of T2(70) and T2(300) are mostly within the 0.1–10 ms range, with a minor portion in the 10–100 ms range. This distribution suggests the persistence of macropore water in the sample during the final residual stage. The intricate pore structure of CS, characterized by poor media connectivity due to its rough surface [41], can explain this. Water finds it challenging to exit pores through the throat, enhancing the water-retention capacity of CS. In this phase, T2(70) overlaps with T2(300). Throughout the T2 curve, nuclear magnetic signals decrease, indicating simultaneous drainage from pores of various sizes.
4.4. Effect of PSD on Change of PWD
To discern the influence of PSD on PWD, T2 curves of samples under four representative ψ values with varied PSDs were chosen (Figure 13). Figure 13 exhibits that as ψ increases, the disparity in T2 curves among different samples lessens. At ψ = 70 kPa, T2 curves from samples with diverse PSDs begin to converge, aligning with pressure plate test outcomes. Further analysis indicates:
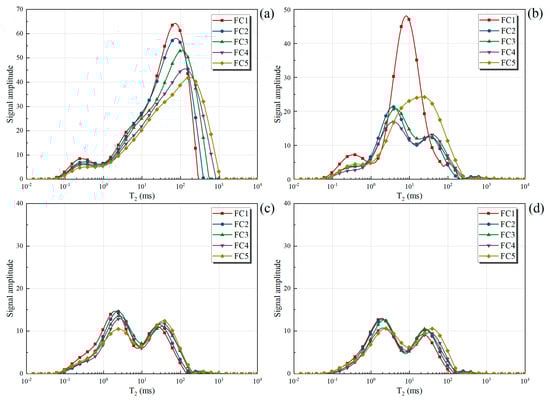
Figure 13.
T2 curves of samples with different PSDs under representative suction: (a) ψ = 0 kPa; (b) ψ = 10 kPa; (c) ψ = 70 kPa; (d) ψ = 300 kPa.
- (1)
- At ψ = 0–10 kPa, water loss varies among samples with different PSDs. FC5 experiences the most significant water loss, undergoing the most drastic change in its T2 curve shape, whereas FC1 loses the least amount of water, maintaining a relatively consistent T2 curve shape. The maximum T2 of various samples lies in the 200–300 ms range, suggesting that the maximum pore sizes for pore water across samples are comparable.
- (2)
- At ψ = 10–70 kPa, the variation in T2 curves across different samples narrows, and the curves begin to overlap. Most nuclear magnetic signals from various samples lie within the 0.1–100 ms range. With few exceptions, the T2 curve of samples with a high fine-grain content aligns with that of samples with a low fine-grain content.
- (3)
- At ψ = 70–300 kPa, T2 curves of different samples closely resemble each other, implying similar water content in this phase. During this phase, alongside the capillary water discussed in Section 4.3, which presents challenges in discharging the sample, there also exists a fraction of bound water associated with a small T2 value. However, due to the absence of charge on the sand surface, the bound water is unable to be adsorbed. Furthermore, the marginal difference in silt proportion between the adjacent graded samples is merely 0.92%, leading to comparable bound water content across the samples.
5. Conclusions
In order to explore the effect of PSD on the water-retention capacity of CS, both pressure plate tests and NMR tests are conducted on CS samples with varying PSDs. The primary conclusions of this study are as follows:
- (1)
- The transition stage predominantly accounts for pore water loss in CS samples. The F&X model adequately describes the SWCC of CS across different PSDs. As the content of fine grains increases, both the AEV and θr of the samples rise.
- (2)
- AEV and θr both show an increase with a decrease in d10, d30, d50, and d60 values, and they linearly rise with an increase in γ. These observations suggest that a higher fine-grain content enhances the water-retention capacity of CS. Based on the findings of this study, d = 0.075–0.25 mm is recommended as the dominant size for augmenting the water retention capacity of CS.
- (3)
- PSD primarily influences the water-retention capacity by affecting the PoSD of CS samples. An increase in the fine-grain content affects the volume of both large and small pores, but the total pore volume remains unchanged.. The maximum pore size diminishes as the content of fine particles rises.
- (4)
- During the drying process, the water discharged by CS samples varies across different drying stages. In the boundary effect stage, the water primarily discharged from samples is free water. In the transition stage, minimal amounts of free water and most of the capillary water in the macropores are released. In the residual stage, the primary discharge consists of capillary water and some weakly bound water in the micropores. At this point, some water within the macropores remains undischarged. This phenomenon is attributable to the suboptimal connectivity of the CS, complicating the flow of pore water out through the throat and subsequently enhancing the water-retention capacity of CS.
- (5)
- Throughout the drying process, the impact of PSD on the PWD varies under different suctions. When ψ < 10 kPa, the differences in the PWD of the samples are most pronounced. For ψ values ranging from 10 to 70 kPa, the T2 curves of the samples begin to show a trend of overlap in that the T2 curve associated with a high fine-grain content overlaps that of a lower fine-grain content. For ψ values between 70 and 300 kPa, T2 curves align across different samples, representing the lower content of silt in the samples.
Author Contributions
Conceptualization, H.W.; Methodology, H.W.; Formal analysis, X.L.; Investigation, X.C.; Writing—original draft preparation, H.W.; Writing—review and editing, X.W., T.M. and J.S.; Project administration, J.S. All authors have read and agreed to the published version of the manuscript.
Funding
This research was funded by the National Natural Science Foundation of China [42177151, and 41772336] and the National Key Technologies R&D Program of China [2022YFC3102101].
Institutional Review Board Statement
Not applicable.
Informed Consent Statement
Not applicable.
Data Availability Statement
The data presented in this study are available on request from the corresponding author.
Conflicts of Interest
The authors declare no conflicts of interest.
References
- Wang, X.; Weng, Y.; Wei, H.; Meng, Q.; Hu, M. Particle obstruction and crushing of dredged calcareous soil in the Nansha Islands, South China Sea. Eng. Geol. 2019, 261, 105274. [Google Scholar] [CrossRef]
- Yao, T.; Li, W. An Evaluation of Treatment Effectiveness for Reclaimed Coral Sand Foundation in the South China Sea. J. Mar. Sci. Eng. 2023, 11, 2288. [Google Scholar] [CrossRef]
- Coop, M.R.; Sorensen, K.K.; Bodas Freitas, T.; Georgoutsos, G. Particle breakage during shearing of a carbonate sand. Géotechnique 2004, 54, 157–163. [Google Scholar] [CrossRef]
- Gao, R.; Ye, J. Mechanical behaviors of coral sand and relationship between particle breakage and plastic work. Eng. Geol. 2023, 316, 107063. [Google Scholar] [CrossRef]
- Lv, Y.; Li, X.; Fan, C.; Su, Y. Effects of internal pores on the mechanical properties of marine calcareous sand particles. Acta Geotech. 2021, 16, 3209–3228. [Google Scholar] [CrossRef]
- Shen, J.; Chen, X.; Wang, X.; Wang, X.; Qin, Y.; Wu, H. Compression responses and particle breakage of calcareous granular material in reclaimed islands. Powder Technol. 2023, 418, 118277. [Google Scholar] [CrossRef]
- Wang, K.; Chen, Z.; Wang, Z.; Chen, Q.; Ma, D. Critical Dynamic Stress and Cumulative Plastic Deformation of Calcareous Sand Filler Based on Shakedown Theory. J. Mar. Sci. Eng. 2023, 11, 195. [Google Scholar] [CrossRef]
- Ata, A.; Salem, T.N.; Hassan, R. Geotechnical characterization of the calcareous sand in northern coast of Egypt. Ain Shams Eng. J. 2018, 9, 3381–3390. [Google Scholar] [CrossRef]
- He, S.; Ding, Z.; Xia, T.; Zhou, W.; Gan, X.; Chen, Y.; Xia, F. Long-term behaviour and degradation of calcareous sand under cyclic loading. Eng. Geol. 2020, 276, 105756. [Google Scholar] [CrossRef]
- Zhou, L.; Chen, J.; Zhuang, X. Undrained cyclic behaviors of fiber-reinforced calcareous sand under multidirectional simple shear stress path. Acta Geotech. 2023, 18, 2929–2943. [Google Scholar] [CrossRef]
- Wang, X.; Wang, X.; Jin, Z.; Zhu, C.; Wang, R.; Meng, Q. Investigation of engineering characteristics of calcareous soils from fringing reef. Ocean Eng. 2017, 134, 77–86. [Google Scholar] [CrossRef]
- Rezvani, R.; Nabizadeh, A.; Amin Tutunchian, M. The effect of particle size distribution on shearing response and particle breakage of two different calcareous soils. Eur. Phys. J. Plus 2021, 136, 1008. [Google Scholar] [CrossRef]
- Fredlund, M.D.; Wilson, G.W.; Fredlund, D.G. Use of the grain-size distribution for estimation of the soil-water characteristic curve. Can. Geotech. J. 2002, 39, 1103–1117. [Google Scholar] [CrossRef]
- Satyanaga, A.; Rahardjo, H.; Leong, E.C.; Wang, J.Y. Water characteristic curve of soil with bimodal grain-size distribution. Comput. Geotech. 2013, 48, 51–61. [Google Scholar] [CrossRef]
- Wang, L.; Zhang, W.; Chen, F. Bayesian approach for predicting soil-water characteristic curve from particle-size distribution data. Energies 2019, 12, 2992. [Google Scholar] [CrossRef]
- Bishop, A.W.; Blight, G.E. Some aspects of effective stress in saturated and partly saturated soils. Geotechnique 1963, 13, 177–197. [Google Scholar] [CrossRef]
- Lu, N.; Likos, W.J. Unsaturated Soil Mechanics; John Wiley & Sons: Hoboken, NJ, USA, 2004. [Google Scholar]
- Nam, S.; Gutierrez, M.; Diplas, P.; Petrie, J.; Wayllace, A.; Lu, N.; Muñoz, J.J. Comparison of testing techniques and models for establishing the SWCC of riverbank soils. Eng. Geol. 2010, 110, 1–10. [Google Scholar] [CrossRef]
- Gallage, C.P.K.; Uchimura, T. Effects of dry density and grain size distribution on soil-water characteristic curves of sandy soils. Soils Found. 2010, 50, 161–172. [Google Scholar] [CrossRef]
- Rahardjo, H.; Satyanaga, A.; D’Amore, G.A.; Leong, E.C. Soil–water characteristic curves of gap-graded soils. Eng. Geol. 2012, 125, 102–107. [Google Scholar] [CrossRef]
- Chen, Y.; Uchimura, T. Influence of particle size on water retention of soils. Chin. J. Rock Mech. Eng. 2016, 35, 1474–1482. [Google Scholar]
- Guo, Z.; Lai, Y.; Jin, J.; Zhou, J.; Sun, Z.; Zhao, K. Effect of particle size and solution leaching on water retention behavior of ion-absorbed rare earth. Geofluids 2020, 2020, 4921807. [Google Scholar] [CrossRef]
- Lu, Y.; Abuel-Naga, H.; Leong, E.C.; Jiao, W.; Wang, X. Characterisation of geomembrane and geotextile interface short-term creep behaviour in a dry condition. Geotext. Geomembr. 2022, 50, 312–322. [Google Scholar] [CrossRef]
- He, S.H.; Ding, Z.; Hu, H.B.; Gao, M. Effect of grain size on microscopic pore structure and fractal characteristics of carbonate-based sand and silicate-based sand. Fractal Fract. 2021, 5, 152. [Google Scholar] [CrossRef]
- Li, L.; Li, X.; Wang, L.; Hong, B.; Shi, J.; Sun, J. The effects of soil shrinkage during centrifuge tests on SWCC and soil microstructure measurements. Bull. Eng. Geol. Environ. 2020, 79, 3879–3895. [Google Scholar] [CrossRef]
- Romero, E.; Della, V.G.; Jommi, C. An insight into the water retention properties of compacted clayey soils. Géotechnique 2011, 61, 313–328. [Google Scholar] [CrossRef]
- Kido, R.; Higo, Y.; Takamura, F.; Morishita, R.; Khaddour, G.; Salager, S. Morphological transitions for pore water and pore air during drying and wetting processes in partially saturated sand. Acta Geotech. 2020, 15, 1745–1761. [Google Scholar] [CrossRef]
- Ma, T.; Wei, C.; Yao, C.; Yi, P. Microstructural evolution of expansive clay during drying–wetting cycle. Acta Geotech. 2020, 15, 2355–2366. [Google Scholar] [CrossRef]
- Wen, T.; Chen, X.; Luo, Y.; Shao, L.; Niu, G. Three-dimensional pore structure characteristics of granite residual soil and their relationship with hydraulic properties under different particle gradation by X-ray computed tomography. J. Hydrol. 2023, 618, 129230. [Google Scholar] [CrossRef]
- Novotny, E.H.; deAzevedo, E.R.; de Godoy, G.; Consalter, D.M.; Cooper, M. Determination of soil pore size distribution and water retention curve by internal magnetic field modulation at low field 1H NMR. Geoderma 2023, 431, 116363. [Google Scholar] [CrossRef]
- Chang, C.; Cheng, D.; Qiao, X. Improving estimation of pore size distribution to predict the soil water retention curve from its particle size distribution. Geoderma 2019, 340, 206–212. [Google Scholar] [CrossRef]
- Shen, J.; Hu, M.; Wang, X.; Zhang, C.; Xu, D. SWCC of calcareous silty sand under different fines contents and dry densities. Front. Environ. 2021, 9, 682907. [Google Scholar] [CrossRef]
- Ding, Z.; He, S.; Sun, Y.; Xia, T.; Zhang, Q. Comparative study on cyclic behavior of marine calcareous sand and terrigenous siliceous sand for transportation infrastructure applications. Constr. Build. Mater. 2021, 283, 122740. [Google Scholar] [CrossRef]
- Cheng, K.; Heidari, Z. Combined interpretation of NMR and TGA measurements to quantify the impact of relative humidity on hydration of clay minerals. Appl. Clay Sci. 2017, 143, 362–371. [Google Scholar] [CrossRef]
- Eyo, E.U.; Ng’ambi, S.; Abbey, S.J. An overview of soil–water characteristic curves of stabilised soils and their influential factors. J. King Saud Univ.-Eng. Sci. 2022, 34, 31–45. [Google Scholar] [CrossRef]
- Brooks, R.H.; Corey, A.T. Hydraulic Properties of Porous Media; Colorado State University: Fort Collins, CO, USA, 1964. [Google Scholar]
- Van Genuchten, M.T. A closed-form equation for predicting the hydraulic conductivity of unsaturated soils. Soil Sci. Soc. Am. J. 1980, 44, 892–898. [Google Scholar] [CrossRef]
- Fredlund, D.G.; Xing, A. Equations for the soil-water characteristic curve. Can. Geotech. J. 1994, 31, 521–532. [Google Scholar] [CrossRef]
- Leong, E.C.; Rahardjo, H. Review of soil-water characteristic curve equations. J. Geotech. Geoenvironmental Eng. 1997, 123, 1106–1117. [Google Scholar] [CrossRef]
- Zhai, Q.; Rahardjo, H. Determination of soil–water characteristic curve variables. Comput. Geotech. 2012, 42, 37–43. [Google Scholar] [CrossRef]
- Cui, X.; Hu, M.; Zhu, C.; Wang, R.; Wang, X.; Wang, T. Study on the microscopic characteristics of three-dimensional pores in coral sand. Rock Soil Mech. 2021, 41, 7. [Google Scholar]
- Benavides, F.; Leiderman, R.; Souza, A.; Carneiro, G.; de Vasconcellos Azeredo, R.B. Pore size distribution from NMR and image based methods: A comparative study. J. Pet. Sci. Eng. 2020, 184, 106321. [Google Scholar] [CrossRef]
- Ma, C.; Zhu, C.; Qu, R.; Liu, H.; Wang, T. Influence of the particle morphology and internal porosity characteristics of coral sand in the South China Sea on its limit void ratio. Powder Tech. 2023, 428, 118771. [Google Scholar] [CrossRef]
- Daneshian, B.; Habibagahi, G.; Nikooee, E. Determination of unsaturated hydraulic conductivity of sandy soils: A new pore network approach. Acta Geotech. 2021, 16, 449–466. [Google Scholar] [CrossRef]
- Liu, L.; Wu, Y.; Li, X.; Zhao, Y. Influence of compaction on hydraulic properties of widely-graded soil. Rock Soil Mech. 2021, 42, 2545–2555. [Google Scholar]
- Tao, G.; Wang, Q.; Chen, Q.; Nimbalkar, S.; Peng, Y.; Dong, H. Simple graphical prediction of relative permeability of unsaturated soils under deformations. Fractal Fract. 2021, 5, 153. [Google Scholar] [CrossRef]
- Yang, H.; Rahardjo, H.; Leong, E.; Fredlund, D. Factors affecting drying and wetting soil-water characteristic curves of sandy soils. Can. Geotech. J. 2004, 41, 908–920. [Google Scholar] [CrossRef]
- Tian, H.; Wei, C.; Wei, H.; Chen, P.; Cheng, F. A NMR-based analysis of drying processes of compacted clayey sands. Rock Soil Mech. 2014, 35, 2129–2136. [Google Scholar]
- Bird, N.R.A.; Preston, A.; Randall, E.; Whalley, W.; Whitmore, A. Measurement of the size distribution of water-filled pores at different matric potentials by stray field nuclear magnetic resonance. Eur. J. Soil Sci. 2005, 56, 135–143. [Google Scholar] [CrossRef]
Disclaimer/Publisher’s Note: The statements, opinions and data contained in all publications are solely those of the individual author(s) and contributor(s) and not of MDPI and/or the editor(s). MDPI and/or the editor(s) disclaim responsibility for any injury to people or property resulting from any ideas, methods, instructions or products referred to in the content. |
© 2024 by the authors. Licensee MDPI, Basel, Switzerland. This article is an open access article distributed under the terms and conditions of the Creative Commons Attribution (CC BY) license (https://creativecommons.org/licenses/by/4.0/).