1. Introduction
Primary productivity in the upper layer of the world’s oceans plays a major role in the global carbon cycle, primarily in the air–sea exchange of carbon [
1]. We still do not understand the functions of the major processes involved in regulating carbon fluxes that channel carbon from the air–sea interface to the deep oceans. The World’s oceans are the largest reservoir of dissolved organic carbon (DOC) in the biosphere. The amounts of this dissolved organic material correlate with the amounts of CO
2 in the atmosphere [
2]. Even though oceanic DOC has been studied in regard to a wide variety of aspects, its role in the global carbon cycle is still poorly understood.
The reported discrepancies in estimates and the interpretation of sinks and sources of carbon with depth [
3] are significant and emphasize the possibility of missing important sources and/or sinks of carbon when calculating budgets for the deep ocean or indicate problems with measurement methodologies.
Carbon flux studies require detailed knowledge of primary and secondary production, including an understanding of temporal and spatial scales of variation. The interpretation of the processes involved in measurement continues to be difficult [
3] since the incubation of samples does not permit the study of rapid variations in carbon assimilation. Further, the significance of Dissolved Organic Matter, or DOM, in primary production is gaining attention, as many autotrophic species are known to use organic substrates for growth, even in the dark [
4,
5,
6], and since a significant portion of DOM can be attributed to the active release of intracellular metabolites by microbial consortia [
7]. On the other hand, the major uncertainties in bacterial production measurements lie in the conversion factors used to calculate bacterial production (BP). For a given thymidine incorporation rate, estimates of BP can range by a factor of more than 20 [
8,
9]. Even though various new analytical tools have emerged [
10], the complex patterns of interactions within the microbial loop remain unknown.
Traditional
14C-POC strictly represents the primary production recovered in particulate form after the incubation time has elapsed, not accounting for DOC release or respiratory losses by the community [
11].
14C-POC probably underestimates net primary production (NPP), as the heterotrophic respiration of particulate primary productivity (PPP) consumed by microzooplankton grazers also affects
14C-POC. The measurement of
14C incorporation into total organic matter partially overcomes this problem through short incubation periods (15–30 min) and accounting for the
14C recovered in the DOC pool, which can be substantial [
12,
13]. Yet, this estimate of primary production falls short of accounting for respiratory losses, both by autotrophs and heterotrophs [
11].
Even though the
14C method for estimating primary productivity [
14] is generally accepted as a highly sensitive assay for estimating primary production, there is still a wide range of uncertainties related to errors introduced with the maintenance of temperature and irradiance during the incubation and manipulation of samples prior to and after the incubation step employed in this method. Furthermore, when comparing the
14C method results to those of other approaches such as the dark–light method (with a 24 h incubation time),
13C [
15],
18O [
11], or FRRF (fast-repetition-rate fluorometry) [
16], there can be very large differences between the methods, fueling continual discussion [
17].
Incubations for photosynthesis–irradiance measurements were introduced to provide insights into the photosynthetic characteristics of naturally occurring marine phytoplankton populations and their cultured isolates in different environmental conditions [
18]. Various “photosynthetrons” were designed for photosynthesis–irradiance incubations [
19,
20,
21] using different light sources and approaches to achieving light gradients.
The dependence of primary productivity on temperature and irradiance (attenuation) has been previously shown [
22]. The approaches to estimating in situ primary productivity used in previous studies involved different types of shipboard incubators, using attenuation coefficients of solar irradiance, or deriving “composite” P-I parameters from measurements of available data from irradiance and primary productivity measurements obtained using either in situ or simulated methods (e.g., [
22]). To overcome these problems, we used an approach consisting of precisely replicating an in situ irradiance spectrum (300–850 nm range) in a desk incubator.
For the above-mentioned reasons, developing a new, more precise and reliable approach is necessary to contribute to our limited understanding of the processes governing carbon fluxes in the ocean. This research introduces the MARINIX Ocean Tech AI-Light Spectrum Replicator (LSR) system, a groundbreaking prototype for simulating in situ measured HOCR light spectrum curves. Leveraging cutting-edge LED technologies with 12-channel full spectrum LEDs, the LSR allows for the independent control of irradiances in each of the 12 illuminated sample chambers. What sets this system apart from the others is its incorporation of Artificial Intelligence (AI) algorithms to precisely replicate in situ irradiance spectra and optimize the incubation process.
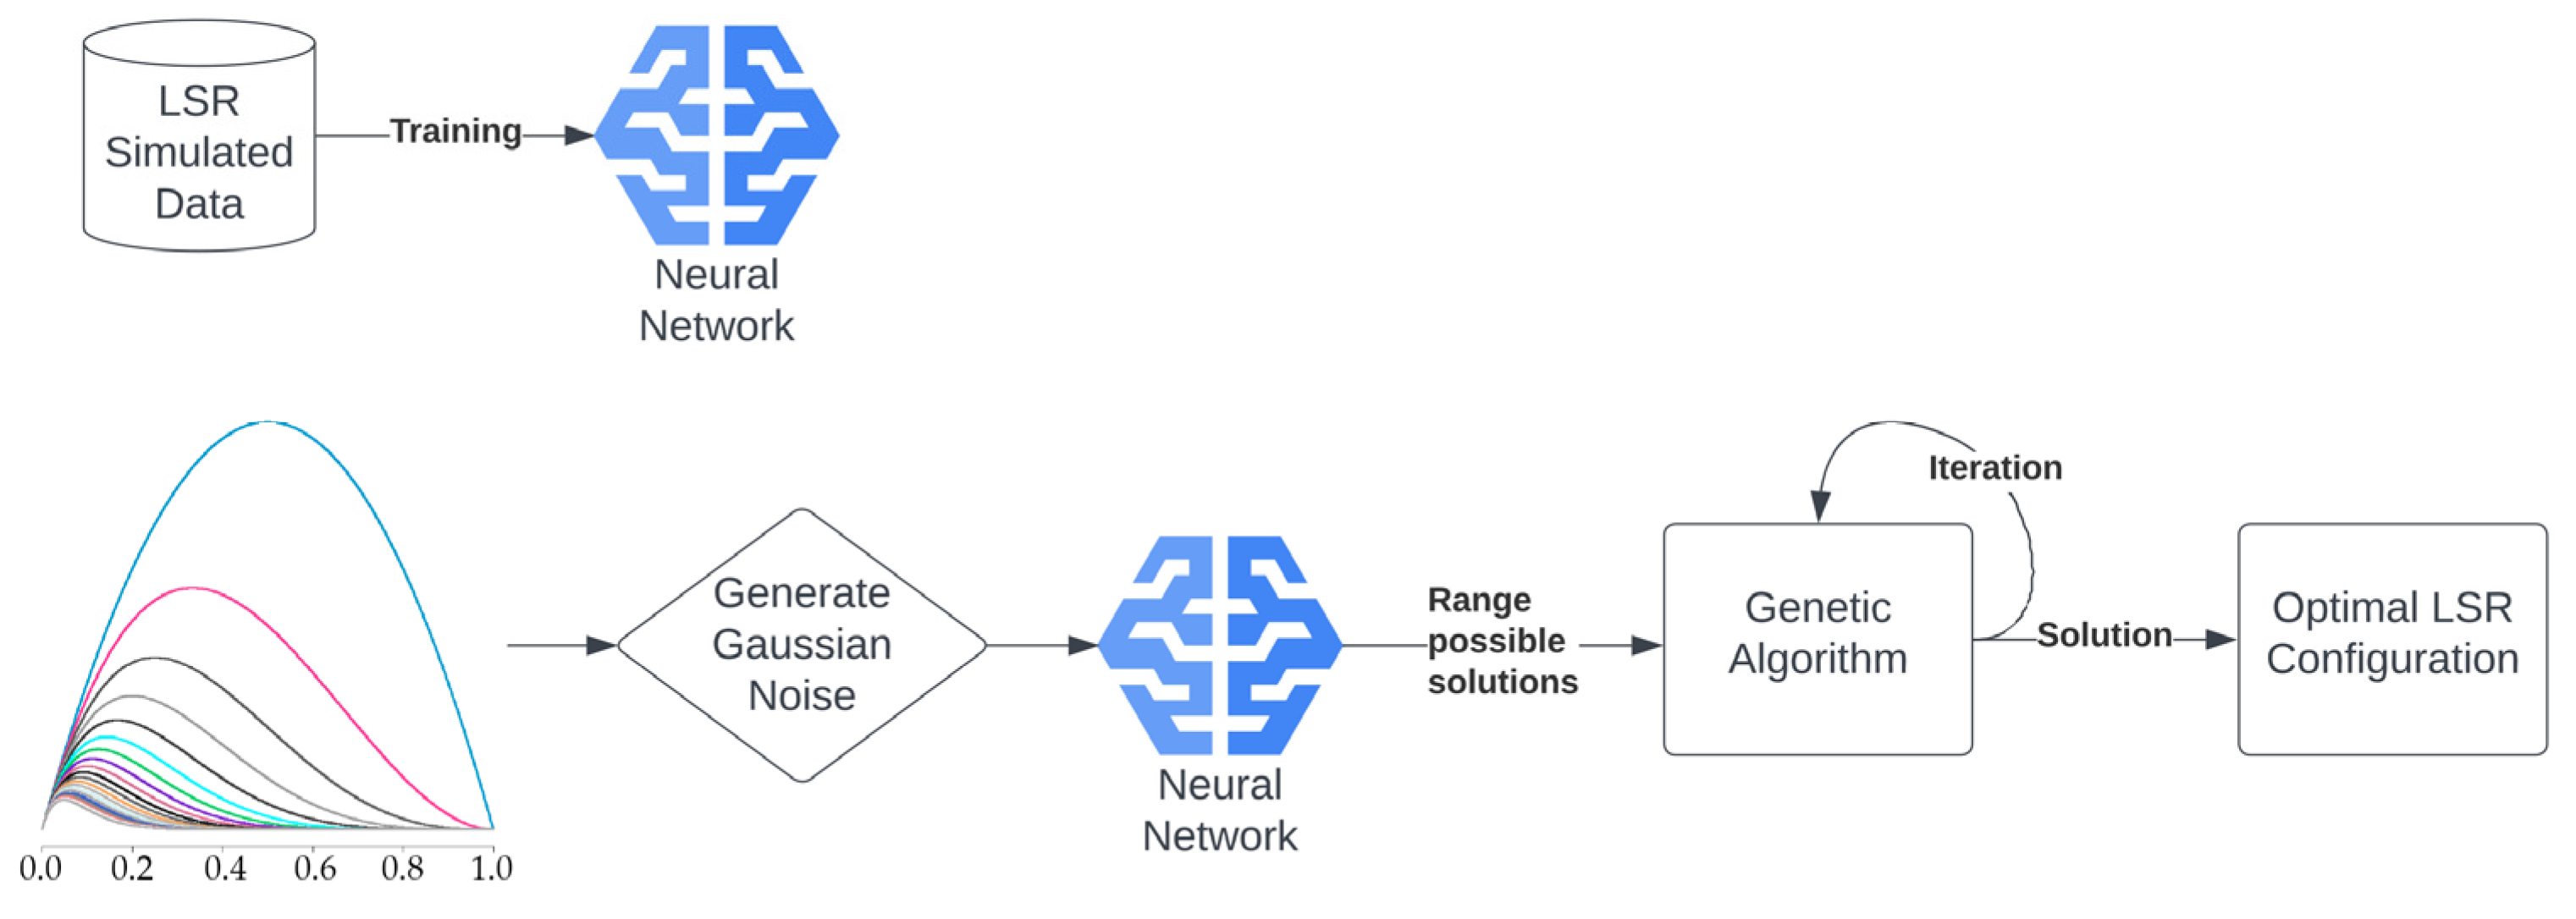
The LSR utilizes a sophisticated AI-driven dashboard that employs feed-forward neural networks and genetic algorithms. This approach involves constructing a database of simulated curves through randomizing LSR configurations. The AI model takes 10 numbers representing light spectrum curve peaks as an input and outputs 10 numbers representing an LSR configuration, with hidden linear layers and ReLU activation functions. The model’s training, implemented in the PyTorch framework, showcases the efficiency of AI in capturing complex patterns within the simulated light spectrum data.
To overcome challenges associated with predicting desired light-spectrum curves directly, the model was employed to find a set of possible LSR configurations by introducing Gaussian noise into the input. The AI-generated solution space was then iteratively refined using a genetic algorithm to find the optimal curve within 10 min. This two-way approach, integrating AI into the replication and optimization processes, enhances the accuracy and efficiency of simulating in situ irradiance spectra, providing researchers with a valuable tool for primary productivity studies.
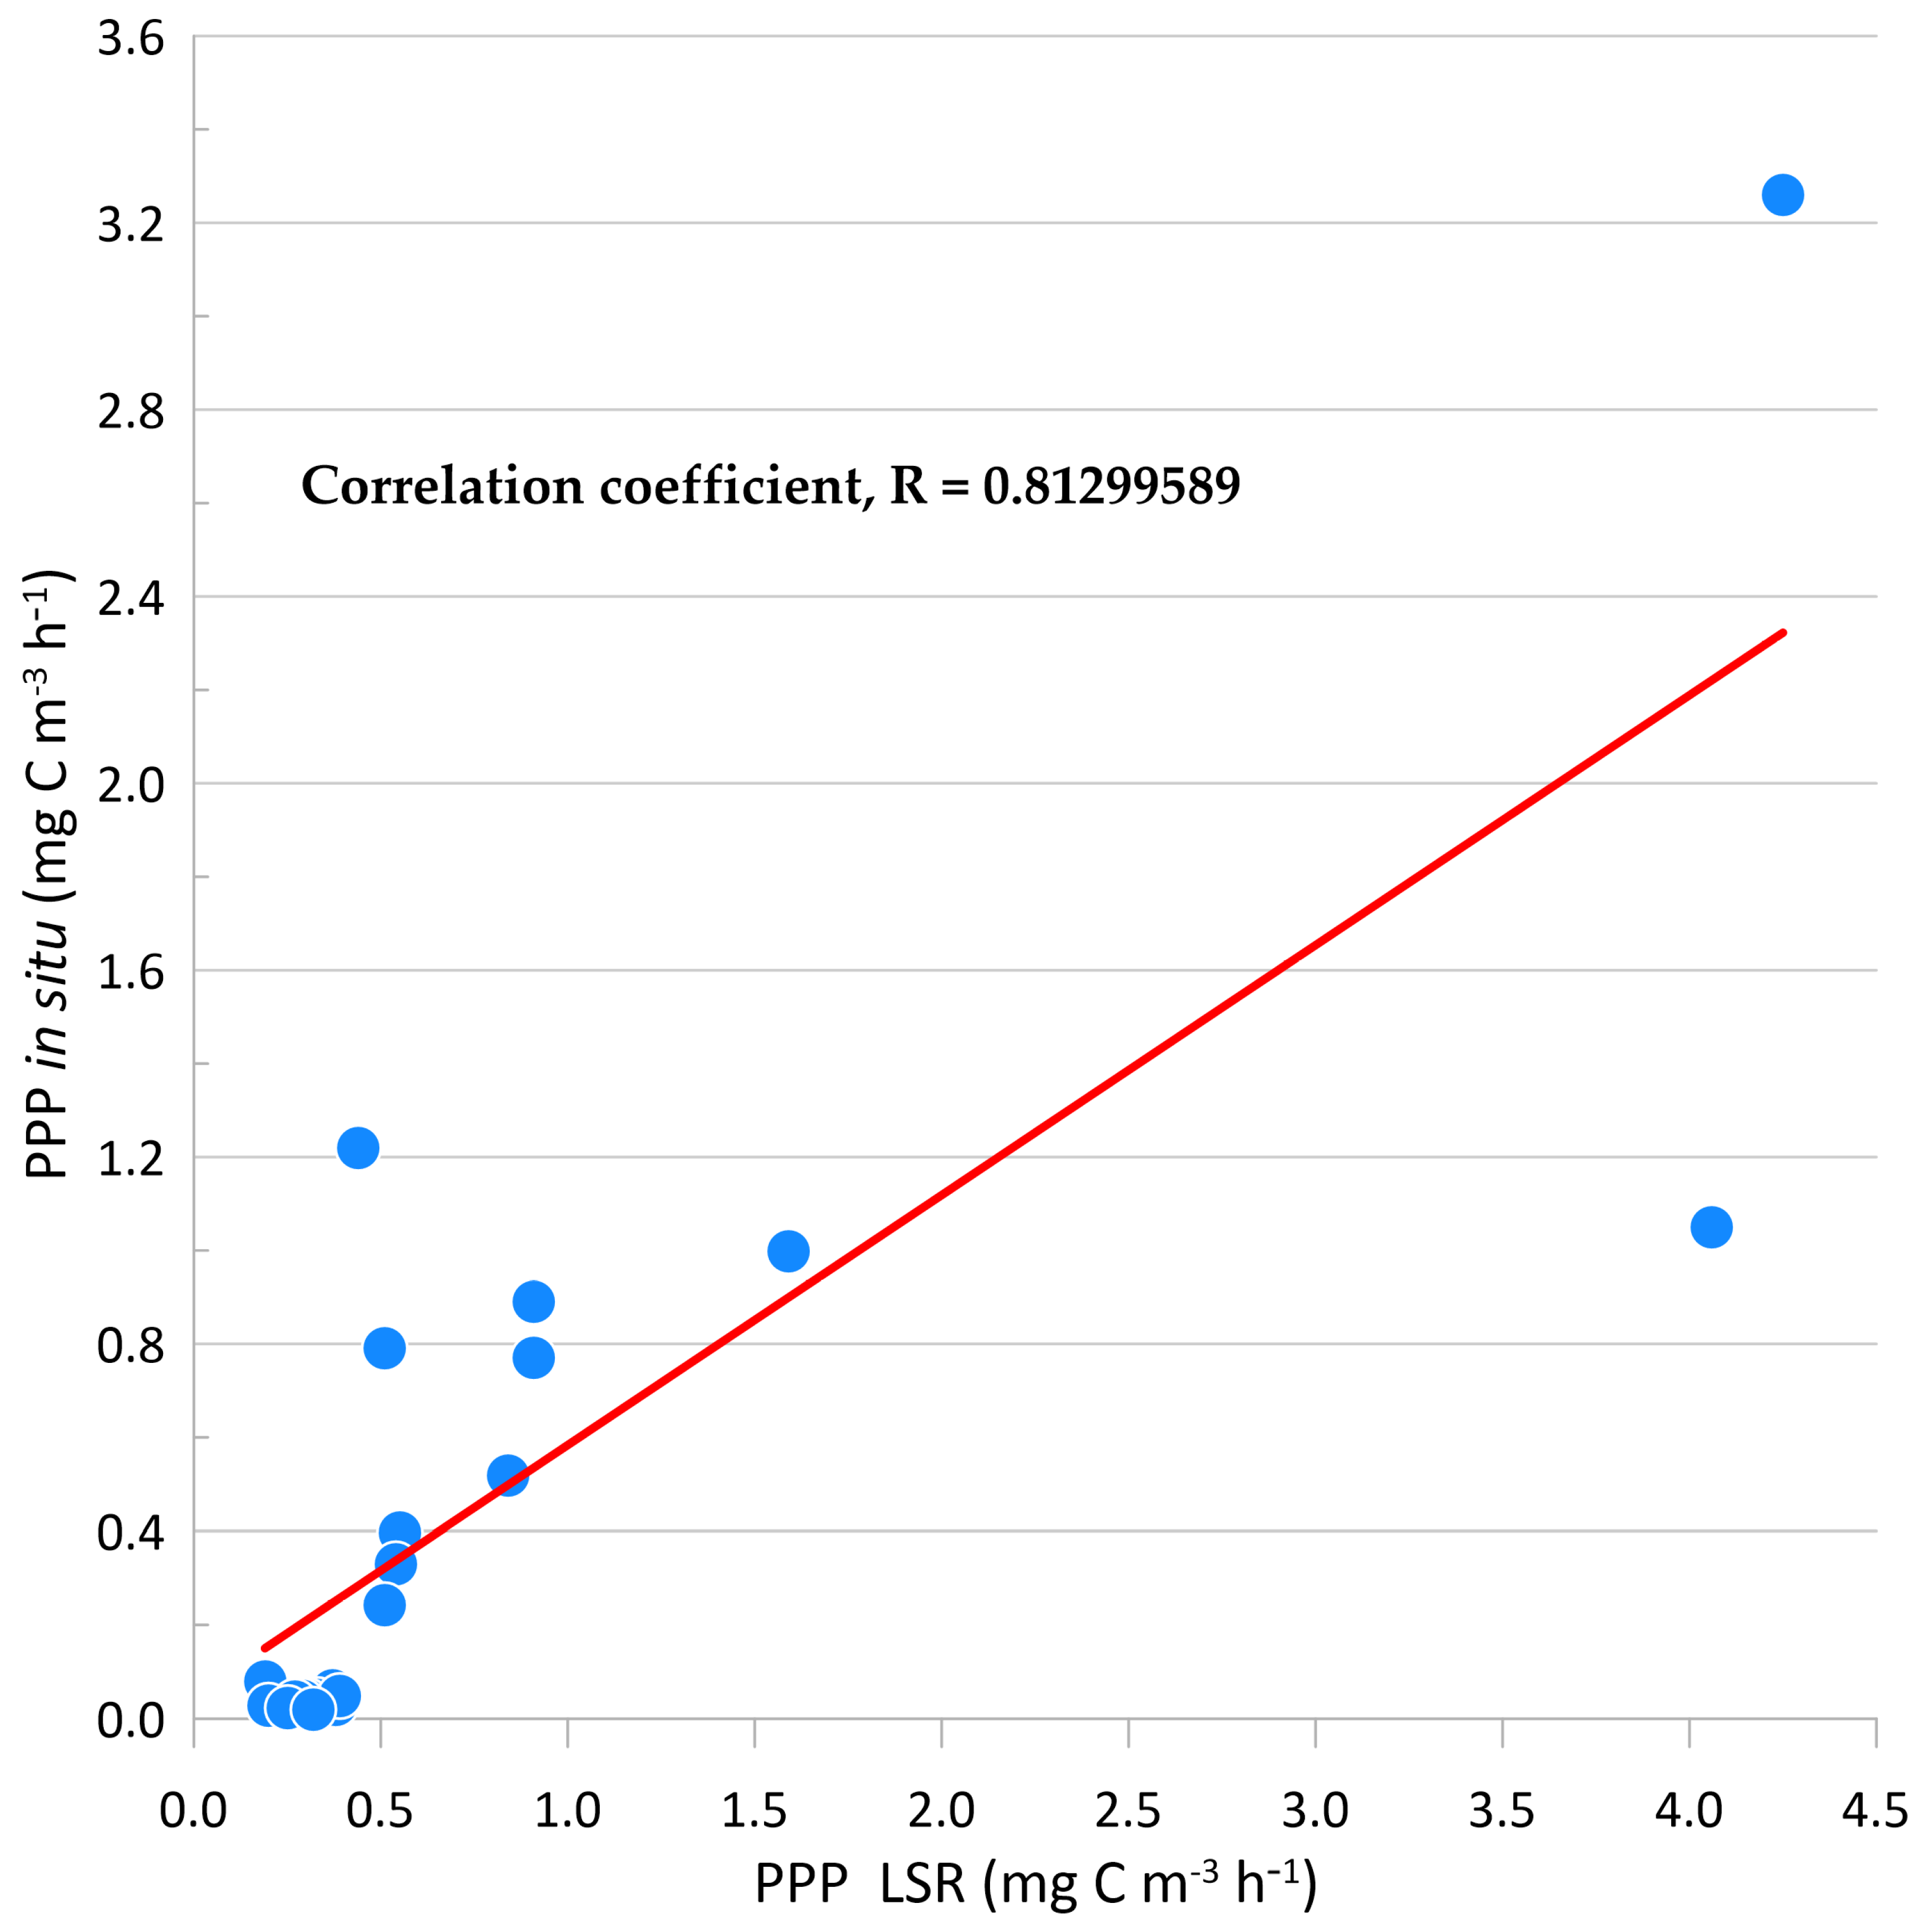
The primary objective of this study was to build and test the new prototype of the MARINIX Ocean Tech Light Spectrum Replicator (LSR) system for simulated in situ primary productivity measurements (particulate primary production—PPP) and compare the measurements with the traditional method for primary productivity measurements used by the Institute for Oceanography and Fisheries in Split, Croatia, for the past 30 years. To the best of our knowledge, our LSR incubator is the first attempt at simulating (replicating/mimicking) in situ irradiance in a ship incubator. We applied newly developed LED technology (12-channel full-spectrum LEDs) with which the irradiances in each of the 12 illuminated sample chambers can be independently set by the system software. Thus, we were able to incubate 12 samples at different irradiances (incubating each sample simultaneously in a range of irradiances from maximum brightness to dark).
2. Materials and Methods
2.1. Light Spectrum Replicator (LSR)
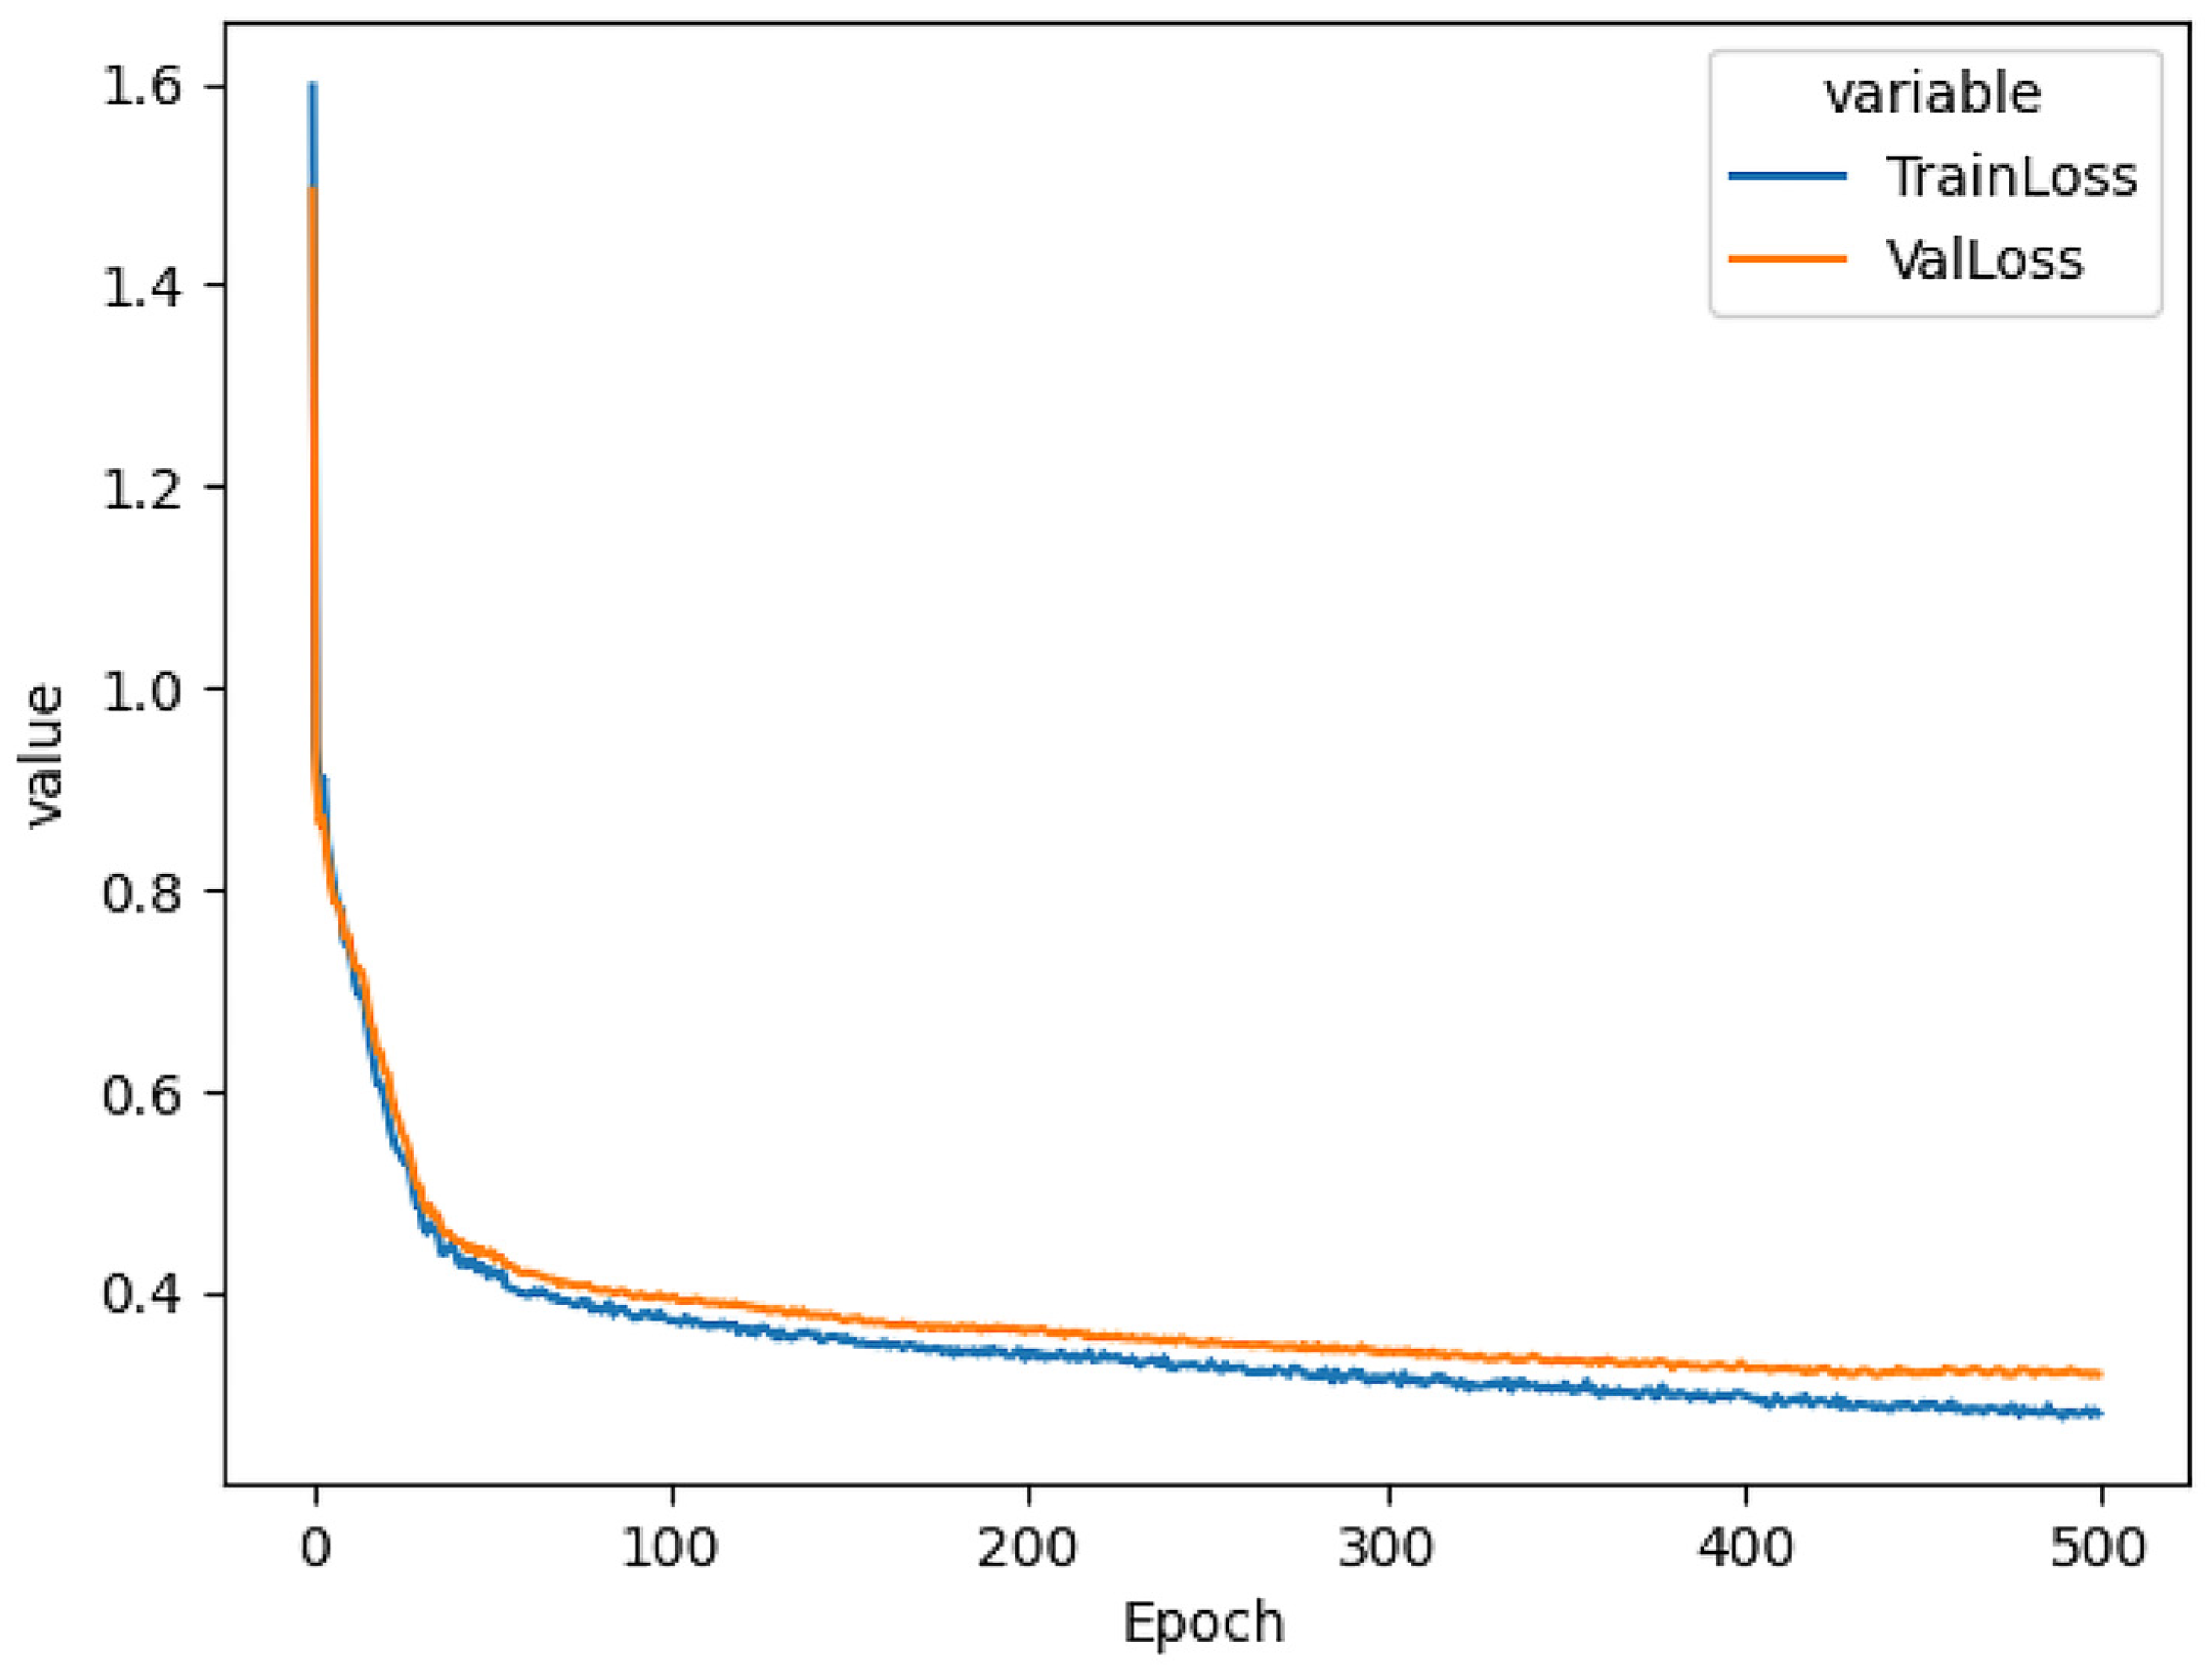
The LSR contains 12 sockets for simultaneous sample incubation using the customized light spectrum. The device’s firmware was developed by MARINIX Ocean Tech AS company (Kristiansand, Norway), and it allows communication with the LSR and computer via a USB cable (serial port). This allowed us to send commands to the LSR when reconstructing the light spectrum and setting the incubation temperature. The light replication process was carried out through the precise control of 10 LEDs (IHS, Intelligent Horticultural Solutions, 12 Die High-power Mixing Full Spectrum LEDs) located in each socket. Two infrared channels (>900 nm) were not used. To replicate the curve measured in the water column during the study, we built an LSR dashboard that utilized feed-forward neural networks and genetic algorithms. The first step consisted of constructing a database of simulated curves, and for this purpose, we created 10,000 randomized LSR configurations that resulted in 10,000 light spectrum curves. The LSR model’s input is defined as 10 numbers representing 10 light spectrum curve peaks, and the model’s output is defined as 10 numbers representing LSR configuration. The input and output layers were coupled with 3 hidden linear layers with ReLU activation functions. The training of the model was carried out using holdout cross-validation, wherein the data were randomly split into two parts: training data (75% of total data) and test data (25% of total data). Using the training data, we selected the following hyperparameters: learning rate = 0.5 × 10
−3, weight decay = 1 × 10
−4, and batch size = 32. The model was defined and trained in the PyTorch (version 1.13.1) framework and was run on the CPU of a standard computer using the Adagrad optimizer and standard mean squared error (MSE) loss function [
23]. When testing the model using the test data, the model achieved an MSE of 0.318 (
Figure 1). Refer to the Computational Requirements section for more details.
2.2. Simulating Light Curves in LSR
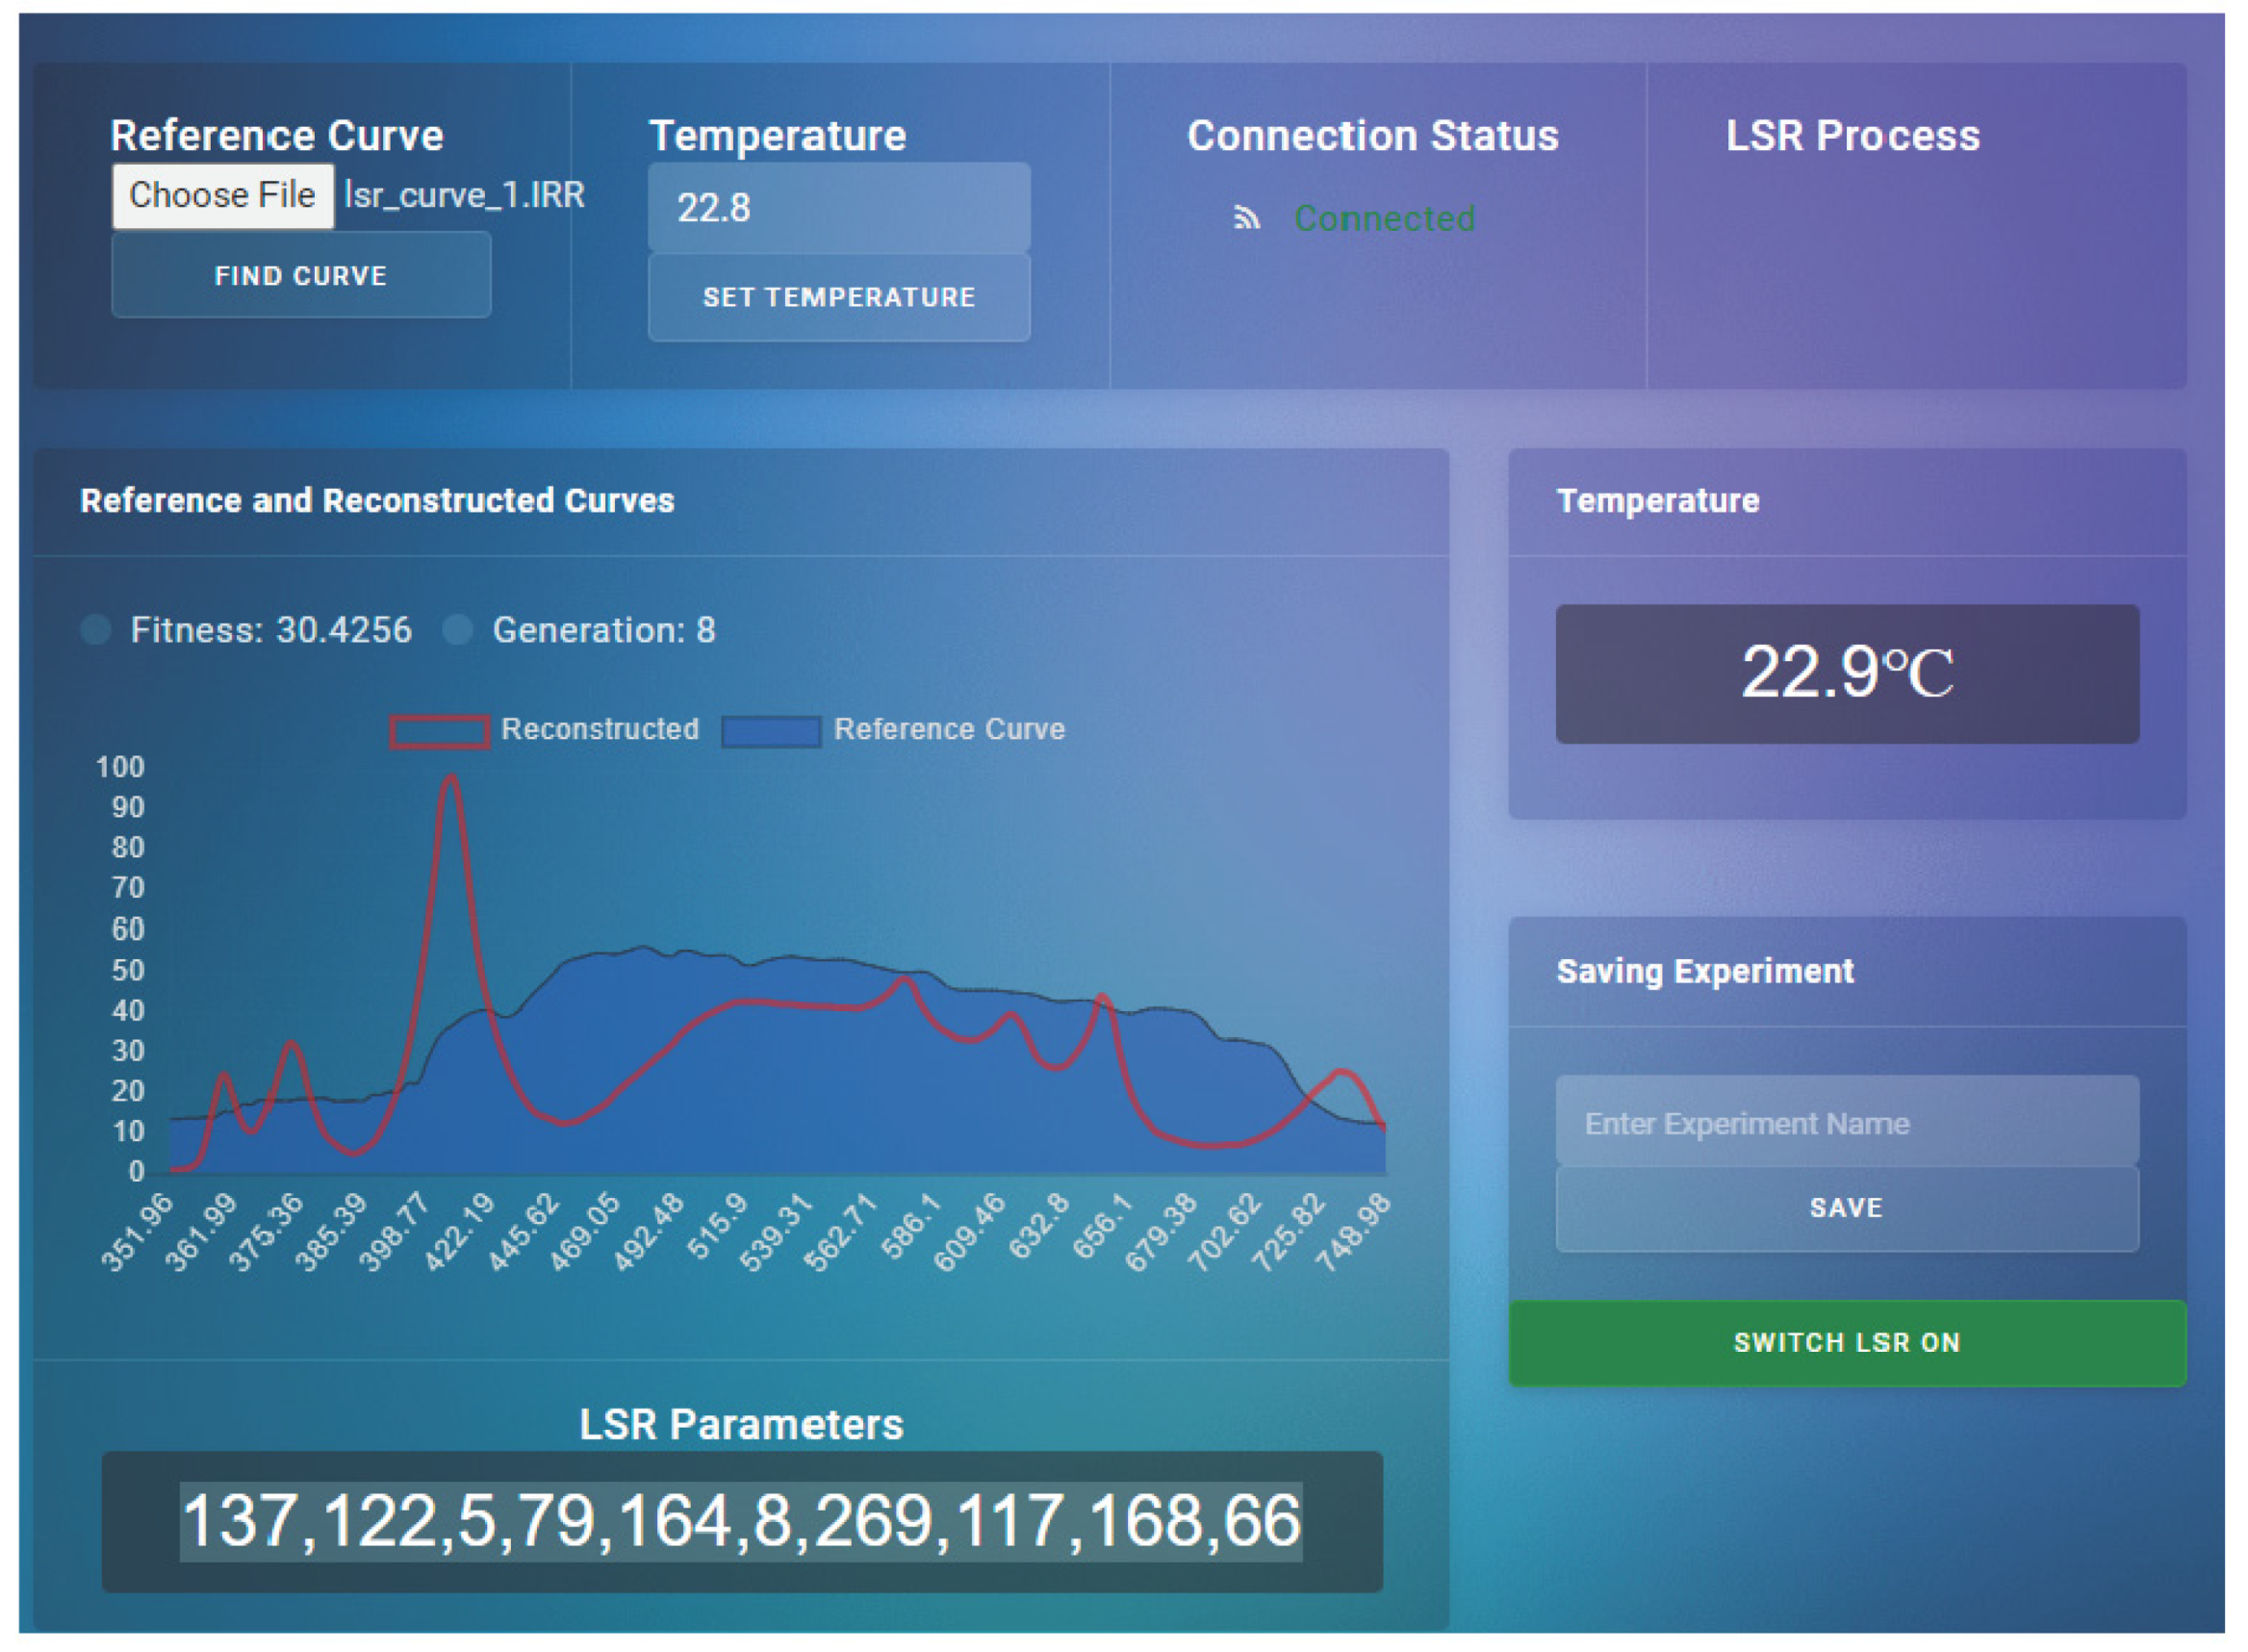
Since the model was built on simulated curves from LSR, it was not capable of predicting the desired light-spectrum curve directly. Therefore, we used the model to find a set of possible LSR configurations by adding Gaussian noise to the input multiple times (
Figure 2).
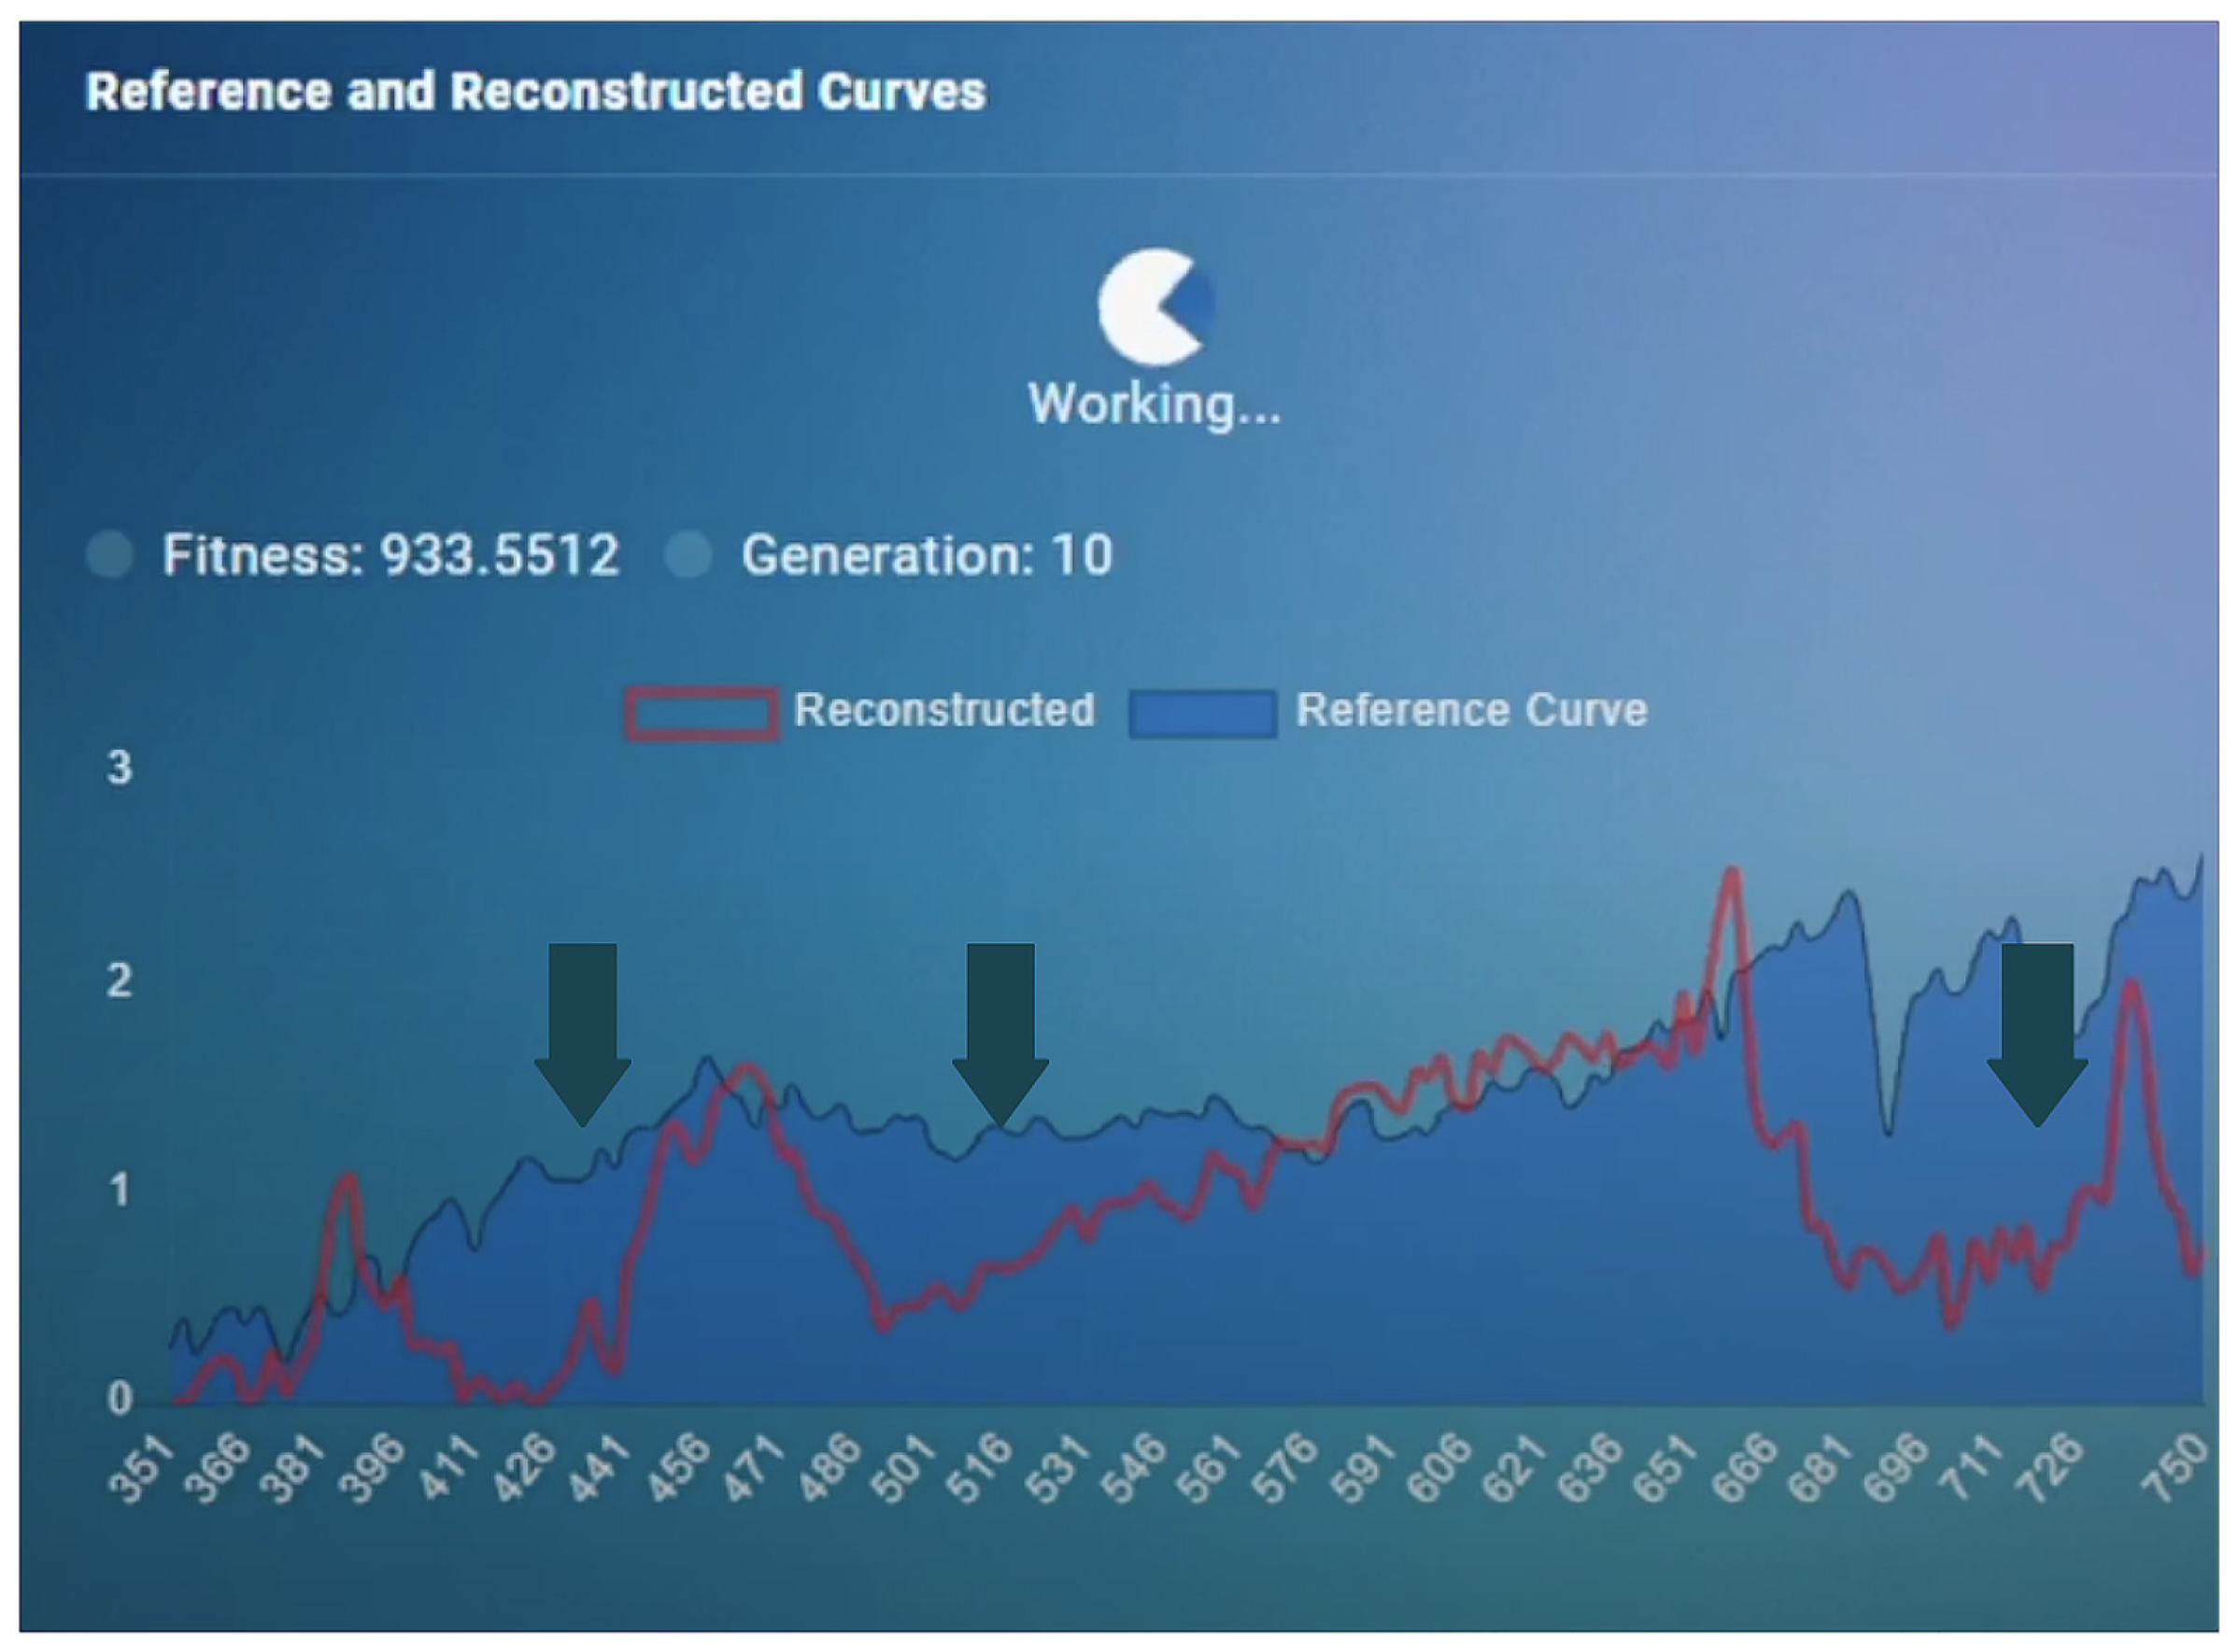
The output of the model represented a wide solution space for the LSR configuration. The solution space was then fed into the genetic algorithm in an iterative fashion to find the optimal solution (
Figure 2,
Figure 3 and
Figure 4). The genetic algorithm used the MSE as a fitness function and found the optimal curve within 10 min. It is important to note that the LSR was not equipped with LEDs covering the 426 nm, 516 nm, and 726 nm light-spectrum areas, which, however, resulted in satisfactory performance (
Figure 3).
The software compensated for the missing frequencies by increasing values in the neighboring areas, resulting in irradiance intensities that were the same as those measured in situ.
2.3. Solar Radiation, Temperature, and Depth Measurements
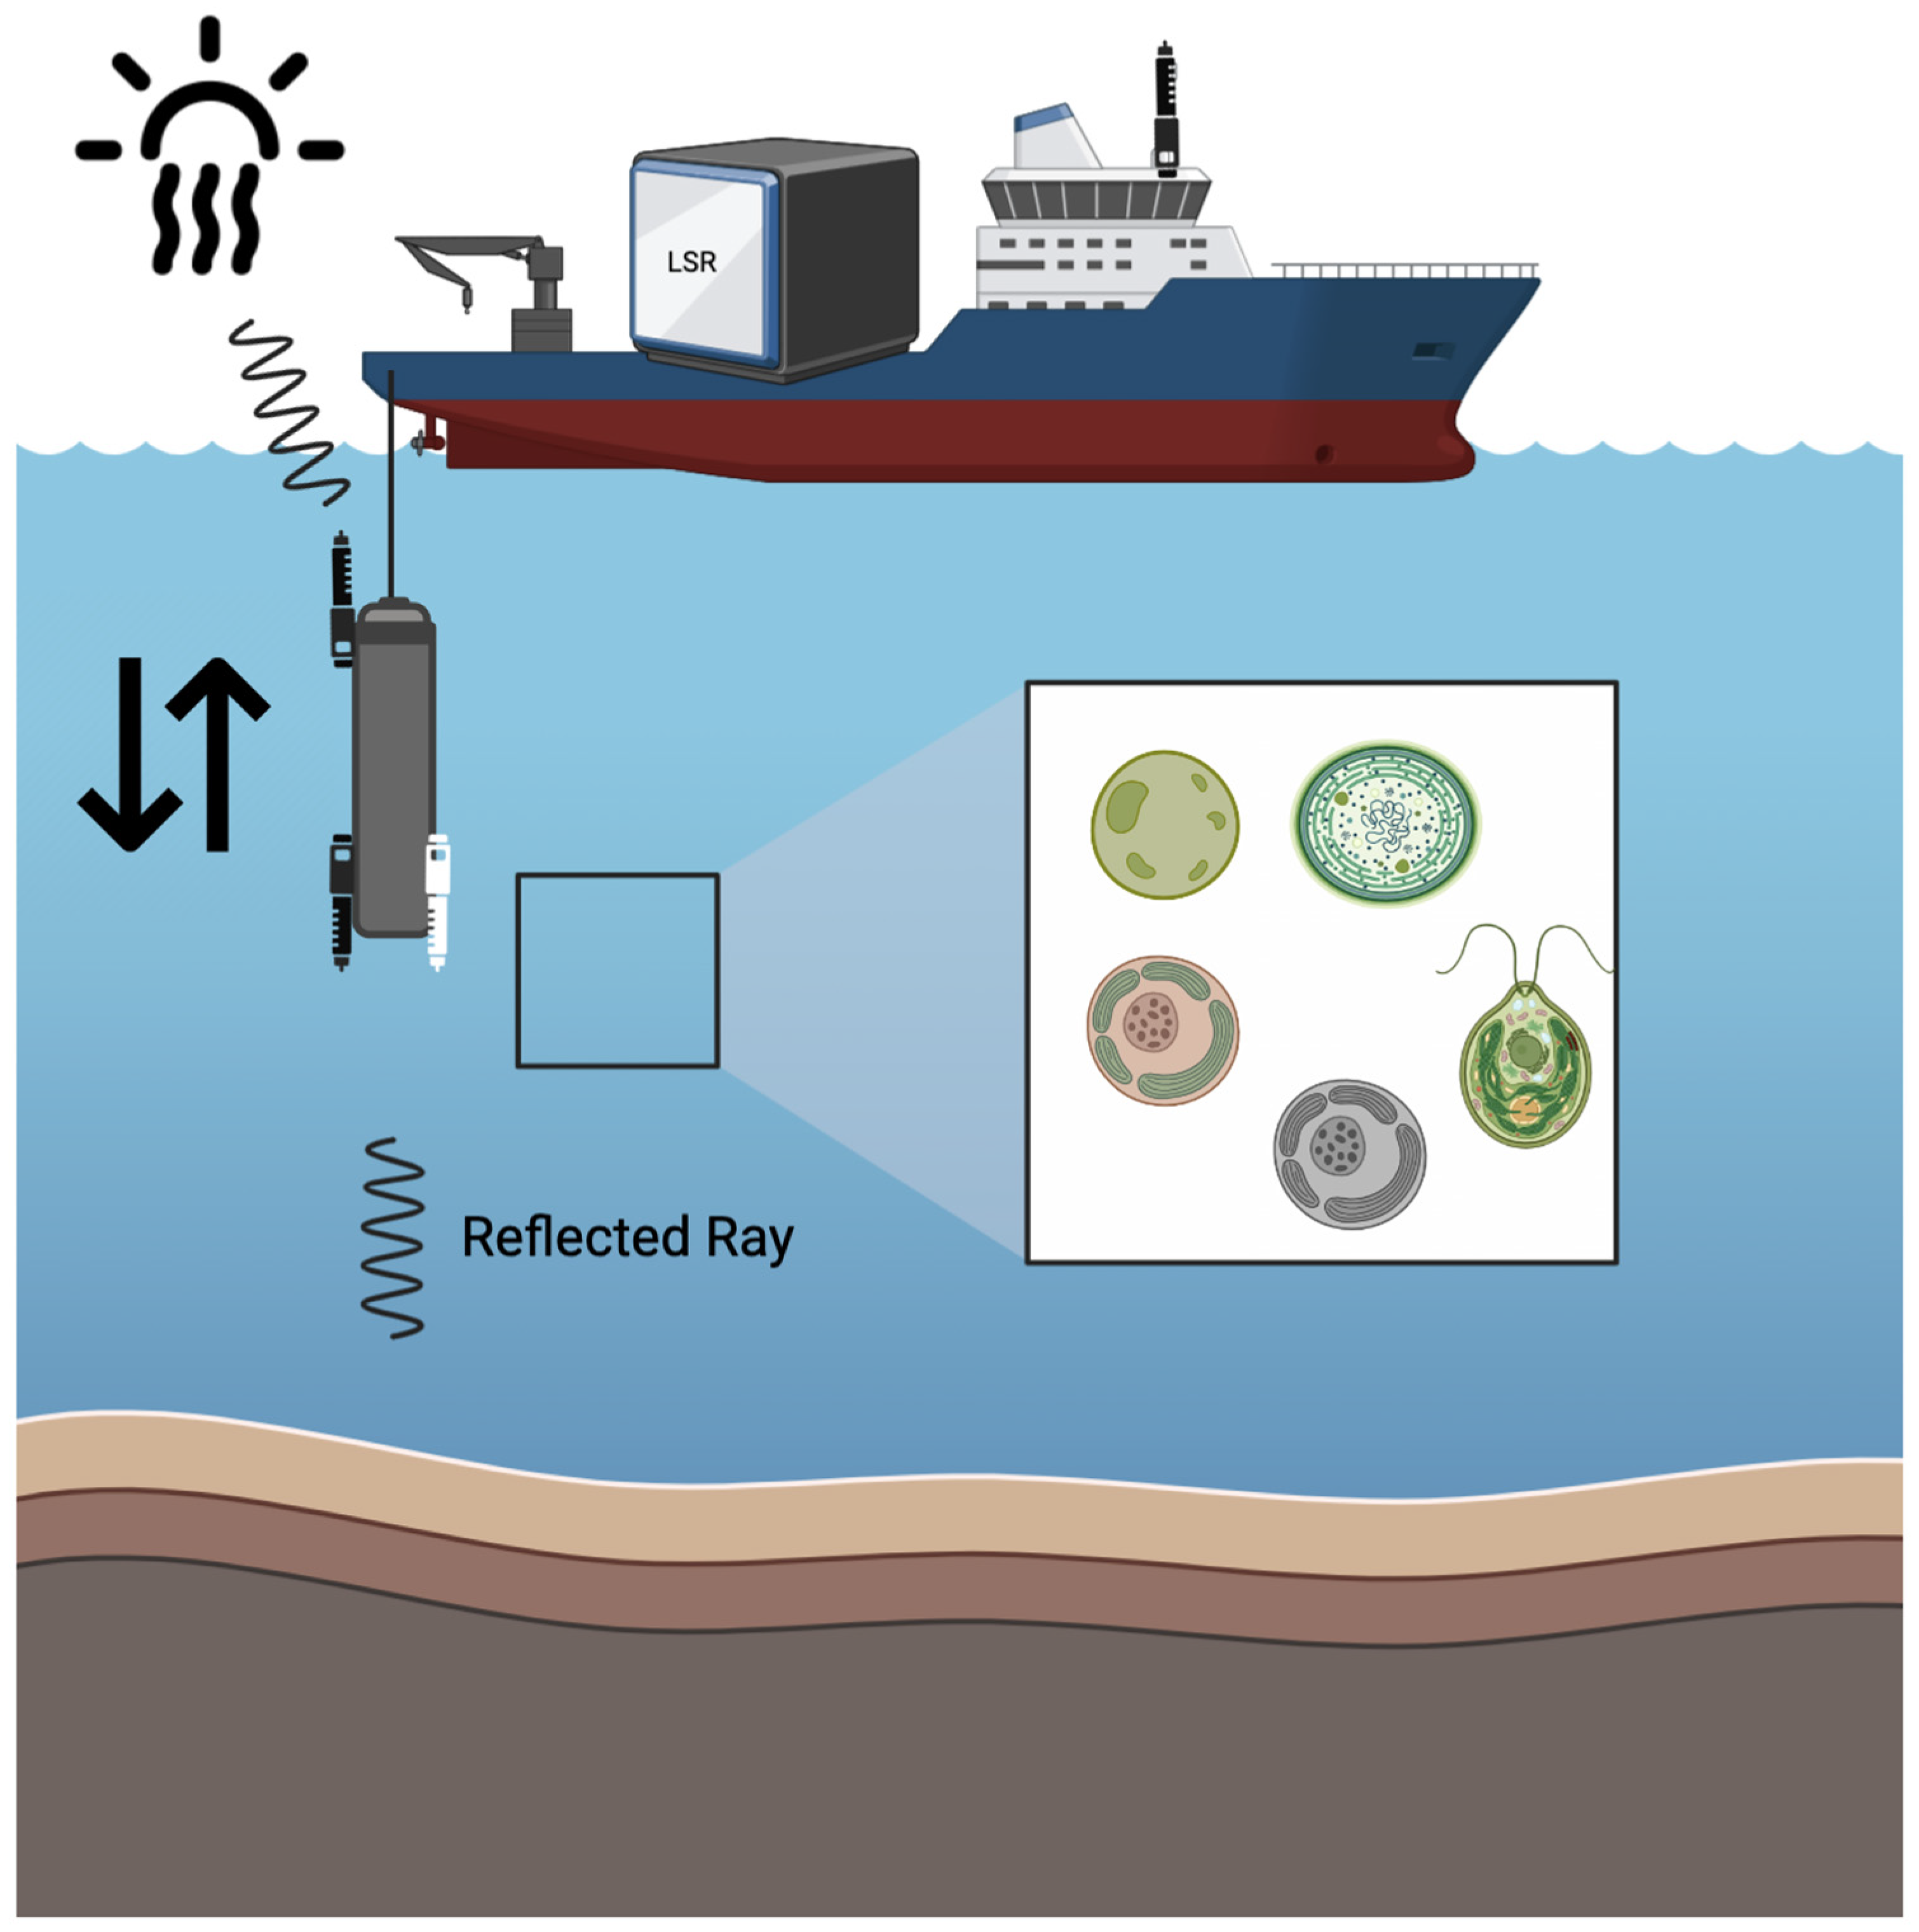
A custom-built vertical profiler was used to measure downward and upward irradiance profiles with two Hyperspectral Ocean Color Radiometer (HOCR) (Seabird) (EIVA, Skanderborg, Denmark) sensors calibrated for the measurement of downwelling and upwelling radiation with optical data in the range from 350 to 1200 nm (extended range). HOCR sensors were mounted on a frame equipped with an SBE 39plus (Seabird, EIVA, Skanderborg, Denmark) temperature (external thermistor), depth (100 m strain gauge pressure sensor), and time sensors. Measured data were recorded in a custom-built data logger built by MARINIX Ocean Tech (Kristiansand, Norway). The third part of this system was a hyperspectral color radiometer sensor (Apogee PS-200 (Apogee Instruments, Logan, UT, USA) laboratory hyperspectral radiometer with a 300–850 nm range and a sensitivity of 0.5 nm) that was installed on the highest point of the vessel, with the sensor pointed upwards to measure reference surface light spectra during the vertical profile calculation of the water column with HOCR (
Figure 5).
2.4. LSR Setup
The measured downward light radiation curve from the desired depth (in the range from 300 to 850 nm) was transferred to the LSR dashboard, the temperature was set, and light curve replication was initiated (
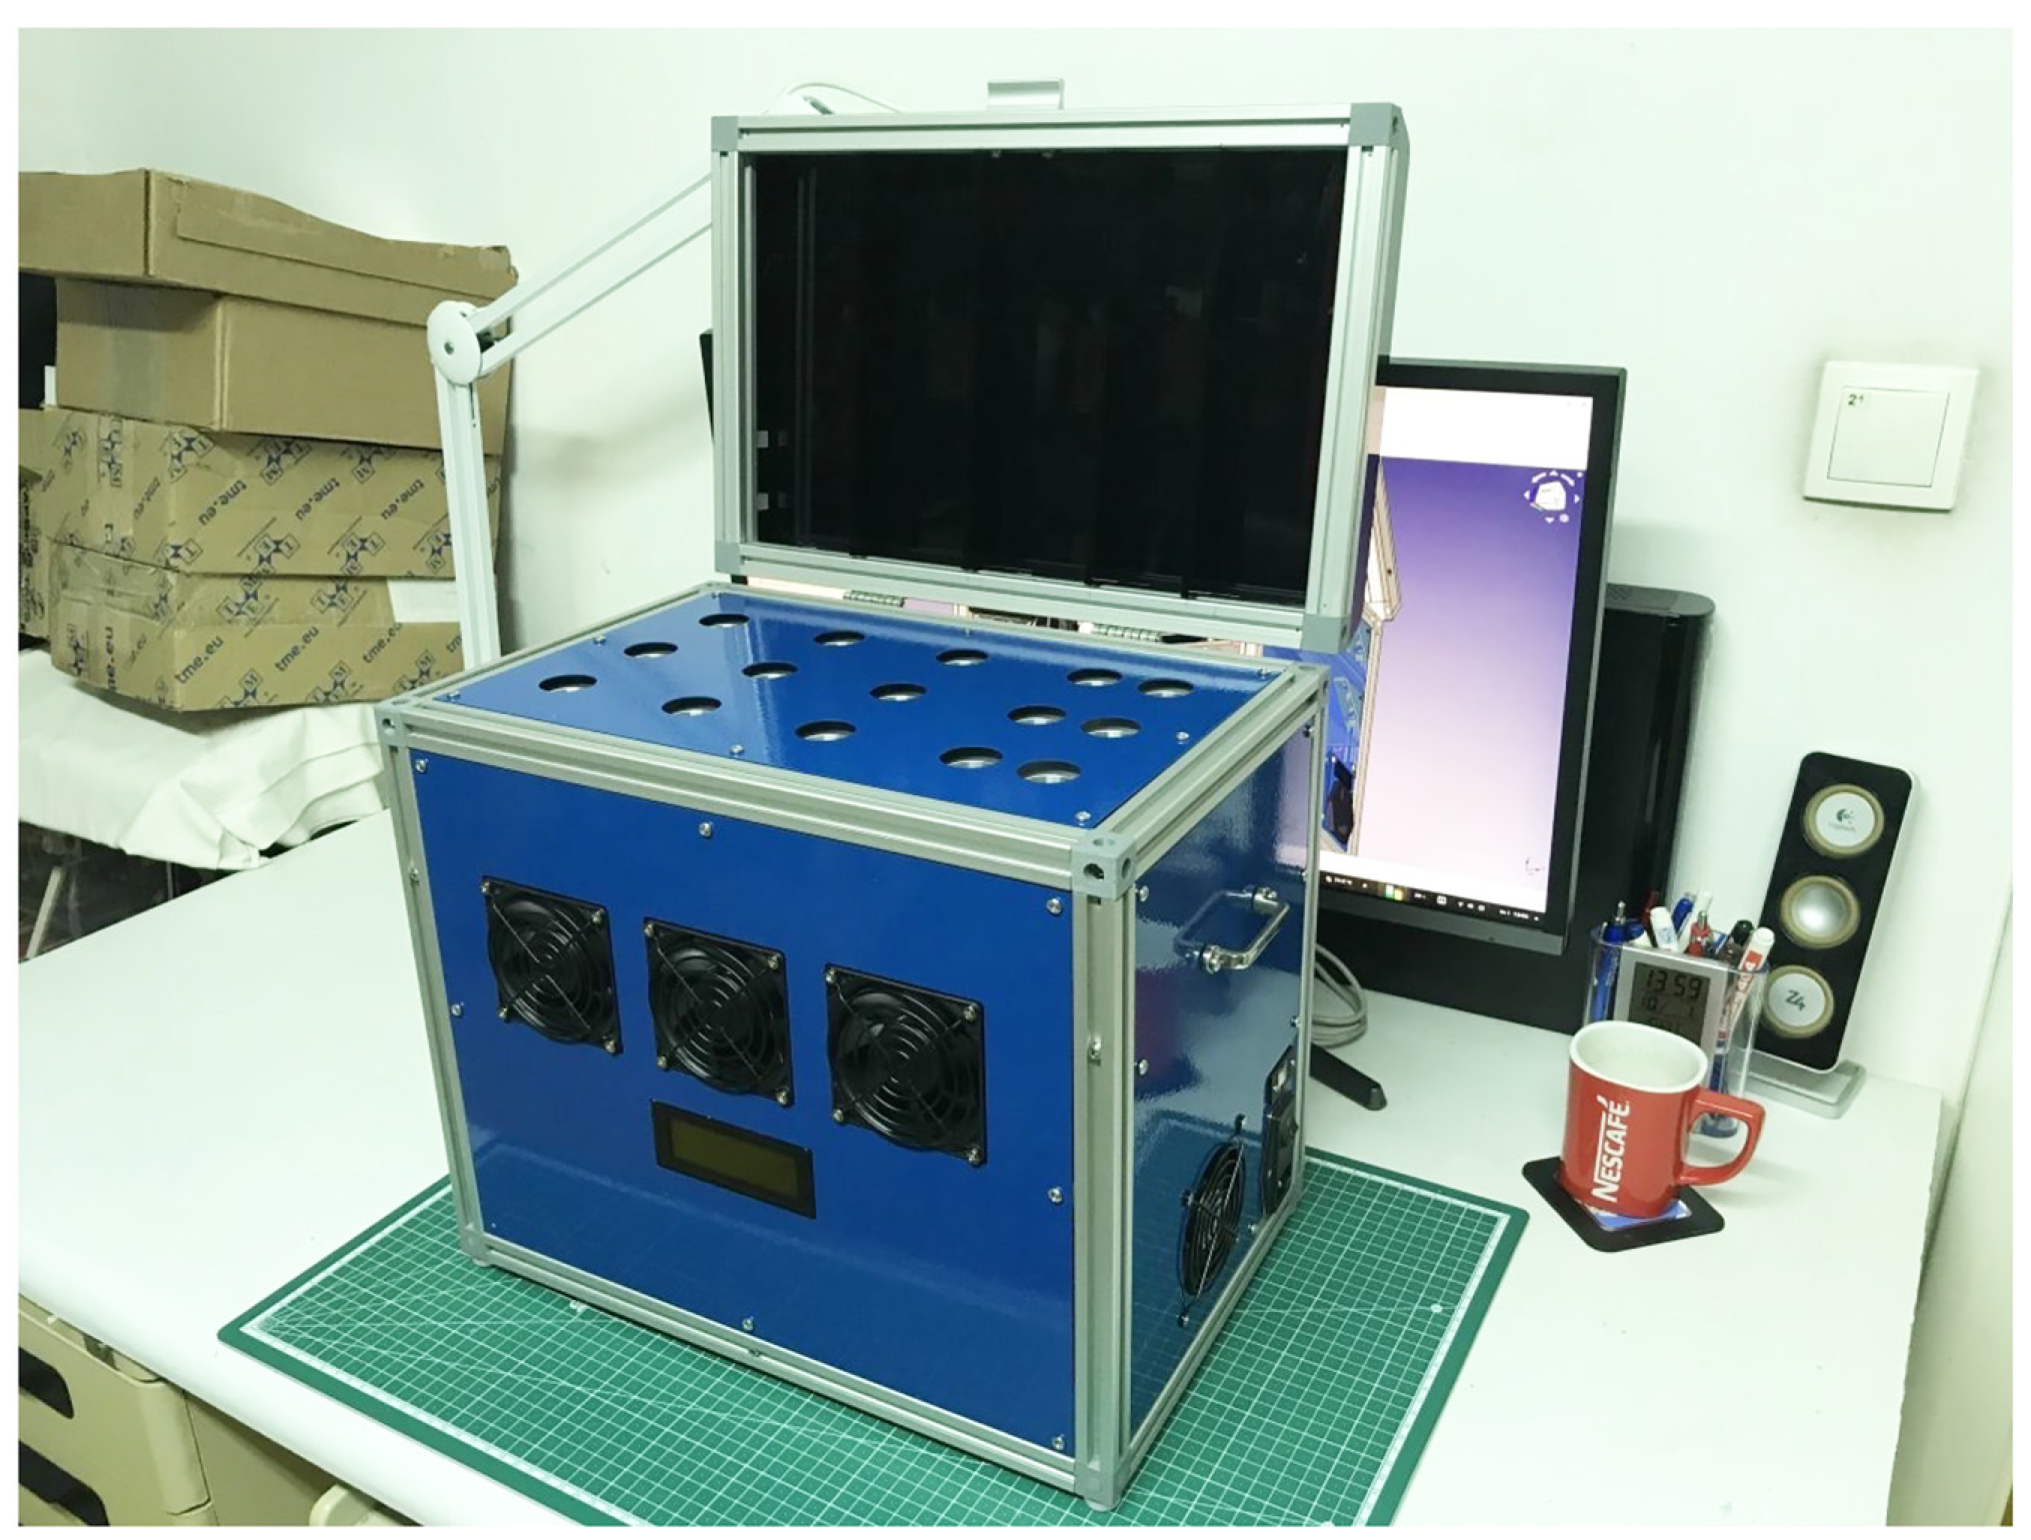
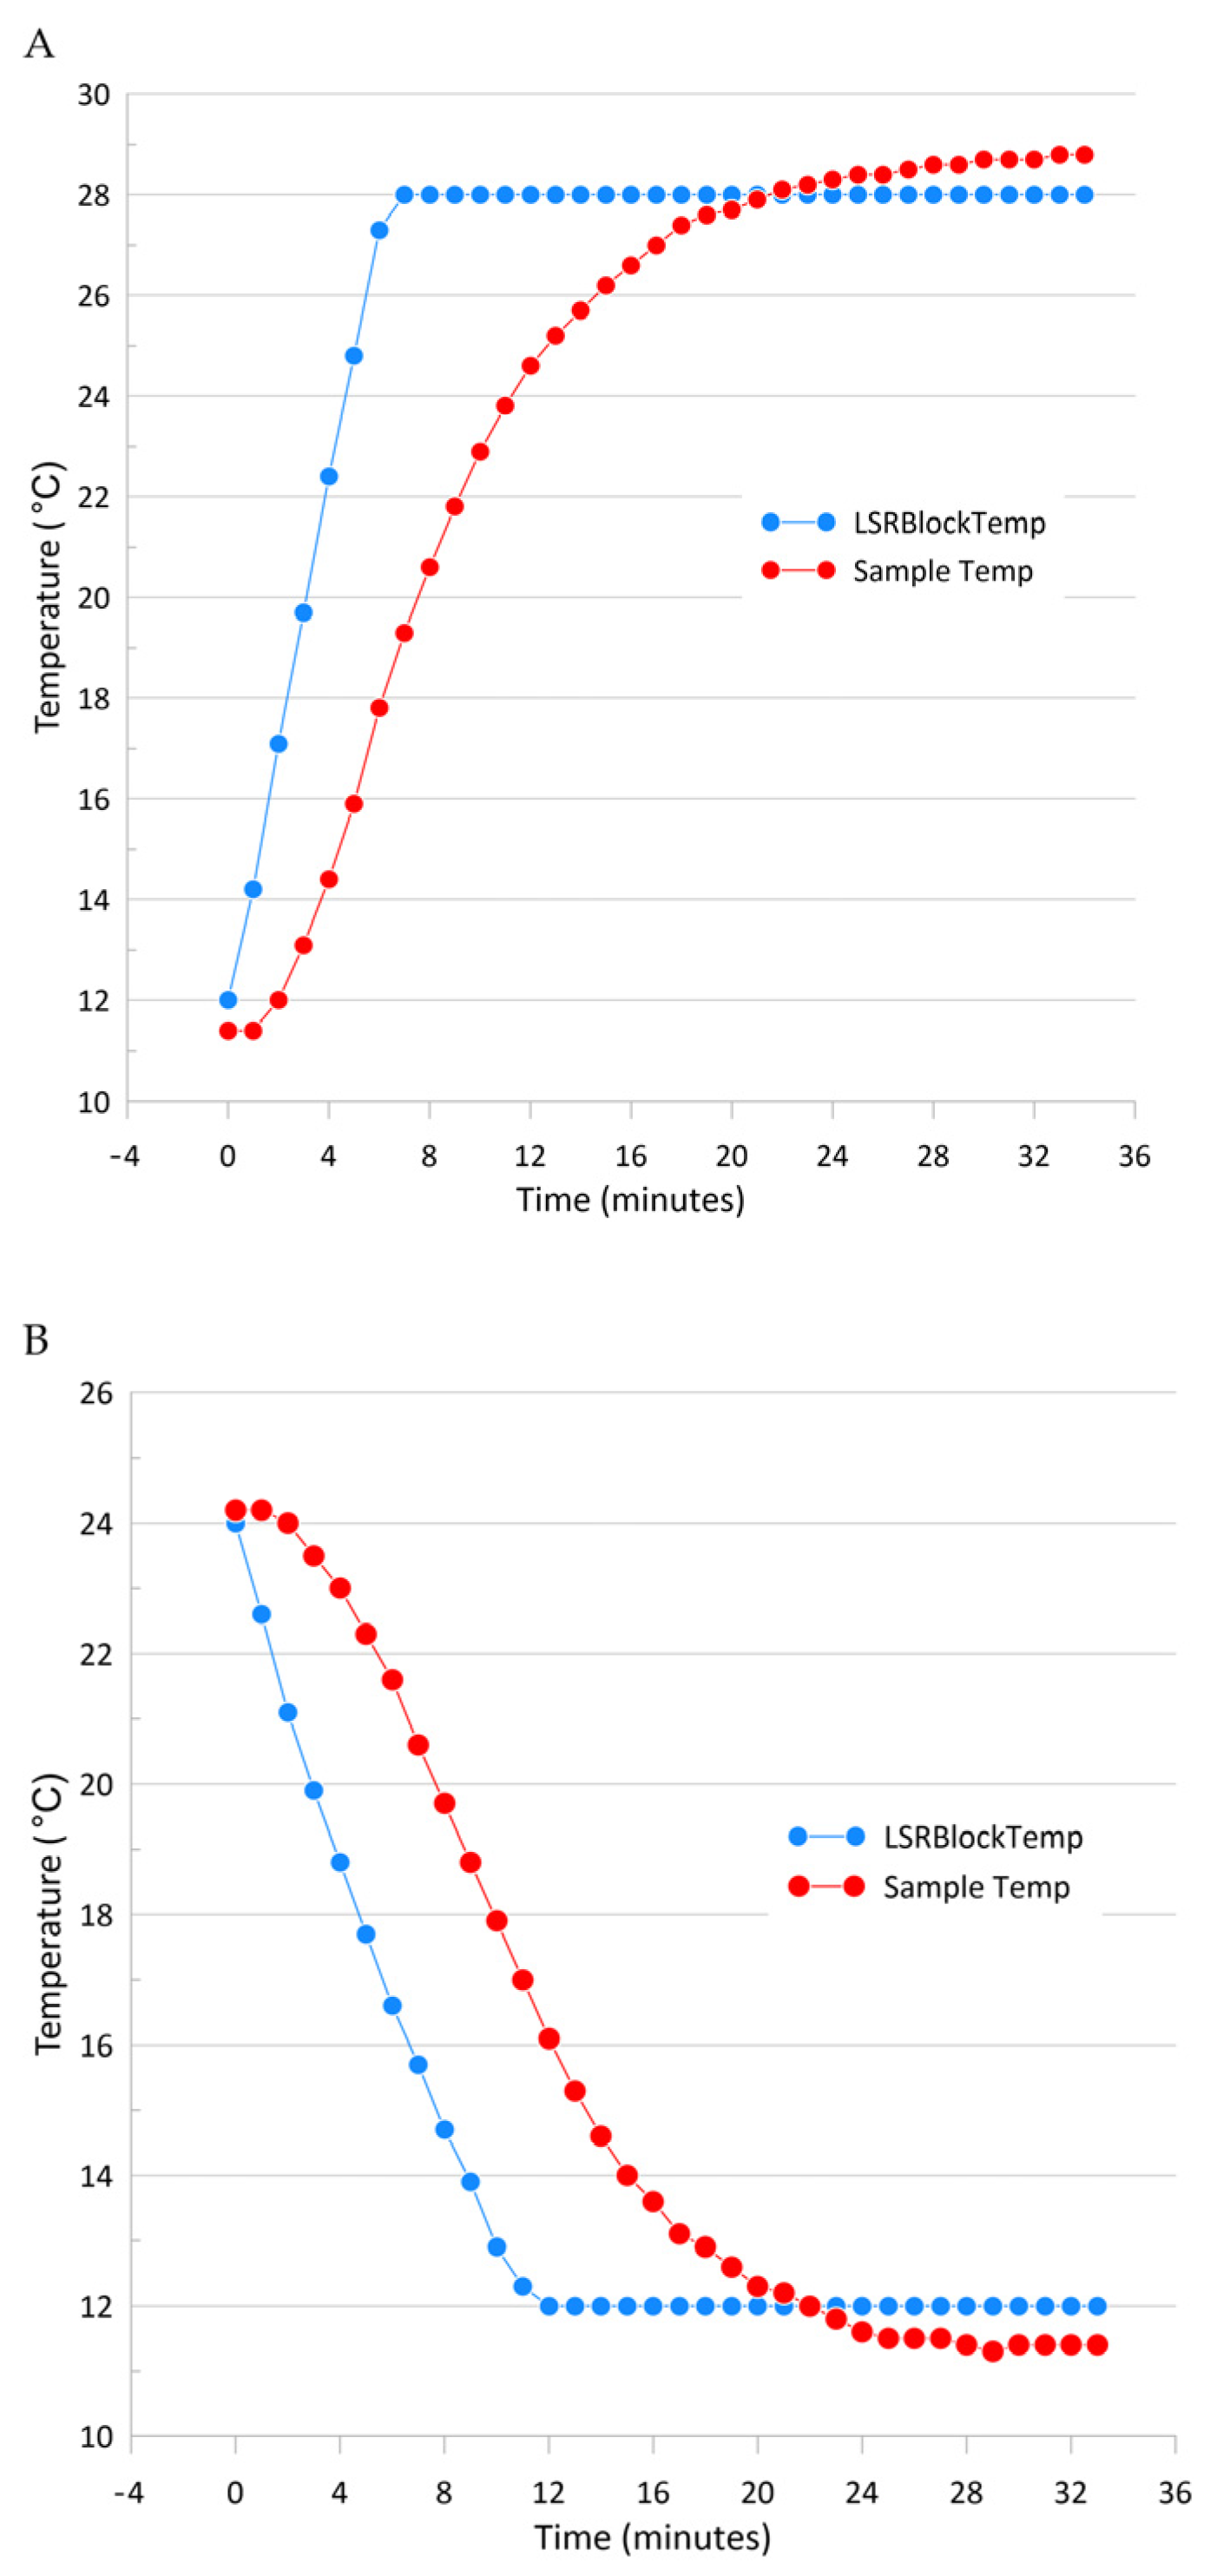
Figure 4). LSR stabilized the temperature, and the light curve was replicated within 10 min after the initiation of the procedure. Light intensities and spectral data were measured with an Apogee PS-200 hyperspectral radiometer (with a 300–850 nm range and a sensitivity of 0.5 nm). Ten incubation chambers in the LSR were placed 10 mm above IHS (Intelligent Horticultural Solutions) 12 Die High-power Mixing Full Spectrum LEDs mounted below an aluminum cooling sample holder with 15 holes for 20 mL glass vials. Three sockets were not illuminated, so these samples were incubated in the dark.
2.5. Sampling and Incubations
Test incubations (LSR and in situ) were conducted on 12 and 13 June 2023 in the central Adriatic Sea in the vicinity of Split and Vis, Croatia, at a site in Kaštela Bay (12 June; 43° 31′ 33.9″ N, 16° 23′ 17.6″ E; depth: 38.4 m) and near Stončica lighthouse on Vis Island (13 June; 43° 03′ 32.8″ N, 16° 17′ 19.7″ E; depth: 102.9 m). Sampling depths in Kaštela Bay were 0, 5, 10, 15, 20, 25, and 28 m, and at Stončica (Vis) station, the water column was sampled at 0, 5, 10, 20, 30, 50, and 100 m. Primary productivity incubations in the LSR were conducted at the Kaštela Bay location at 9:30, 11:00, 12:15, 14:45, 15:15, 16:07, and 17:44 h (at 0, 5, 10, 15, 20, 25, and 28 m, respectively) and at 8:30, 10:02, 11:30, 13:01, 14:34, 16:04, and 16:52 h (at 0, 5, 10, 20, 30, 50, and 100 m, respectively) at Stončica (Vis) location. In situ incubations were conducted with two transparent and one dark (“black”) 100 mL Winkler flasks attached to a moored line at each sampling depth and incubated from 9:00 to 15:00 h at Kaštela station and from 9:00 to 15:15 h at Vis station. All samples were taken at predetermined depths using a 5 L Niskin water sampler. Before subsampling, all bottles were rinsed three times with seawater from the sampler. For the LSR primary productivity measurements, a 250 mL subsample was taken in a 250 mL Winkler flask with a wide neck using a dark thermally insulated dark sleeve to block the light and prevent temperature shock.
2.6. Primary Productivity Measurements
Prior to each sampling and measurement, vertical profiles of downward and upward (reflected) solar radiation were measured in the water column using Seabird HyperOCR sensors “
https://www.seabird.com/hyperocr-radiometer/product?id=60762467730 (accessed on 12 February 2024). The measured downward light radiation curve from the desired depth (in the range of 300–850 nm) was transferred to the LSR dashboard, the temperature was set, and light curve replication was initiated (
Figure 5). LSR stabilized the temperature, and the light curve was replicated within 10 min after the initiation of the procedure. Light intensities and spectral data were measured with an Apogee PS-200 hyperspectral radiometer (with a range of 300–850 nm and a sensitivity of 0.5 nm). Ten incubation chambers in the LSR were placed 10 mm above IHS (Intelligent Horticultural Solutions) 12 Die High power Mixing Full Spectrum LEDs with an aluminum cooling sample holder (15 holes for 20 mL glass vials) and a temperature tolerance of 0.1 °C (
Figure 6 and
Figure 7A,B).
Photosynthetic uptake of carbon was measured as follows: 25.9 MBq of NaH
14CO
3 (2.146 GBq mmol; Perkin Elmer, Zagreb, Croatia) was added to a 62 mL aliquot of the sample. The sample was gently stirred, and two 100 μL aliquots were transferred to scintillation vials containing 8 mL of Insta-Gel Plus (Packard, Zagreb, Croatia) for total added radioactivity measurements. A PerkinElmer Tri-Carb 3180 TR/SL liquid scintillation counter (LSC) was used for all
14C measurements and corrected for quenching via an internal standard ratio using the direct counting method. Twelve 20 mL glass scintillation vials were placed in the LSR sample holder cooled to in situ temperature, and 5 mL aliquots were transferred to each vial and incubated for 30 min. Incubations were terminated by filtering onto Whatman glass-fiber filters (GF/F, 25 mm diameter) using 100 mm of mercury vacuum. The vials were rinsed with 10 mL of 0.2 μm filtered sea water, carefully avoiding exposure of the cells to air prior to the completion of the rinse. After desiccation, filters were exposed to concentrated HCl fumes for 10 min. Radioactivity associated with the filters was determined via liquid scintillation counting using 8 mL of Insta-Gel Plus (Packard) [
7].
2.7. Traditional In Situ Primary Productivity Method (IZOR)
The
14C-radiotracer method was used to measure the assimilation of dissolved inorganic carbon (DIC) by phytoplankton as an estimate of the rate of photosynthetic production of organic matter [
14]. Samples were incubated in 100 mL Winkler flasks. Each sample was incubated in two transparent and one “black” (dark) container. After the flasks had been rinsed three times and filled with seawater, 150 kBq (4 μCi) of NaH
14CO
3 was added to each container. Capped containers were fixed on a moored line on the sampling site and incubated in situ for 6 h. The incubations were terminated by filtering the samples onto 0.2 μm pore size Advantec 35 mm filters and carefully rinsed with 0.2 μm of filtered seawater, carefully avoiding exposure of the cells to air prior to completion of the rinse using a 100 mm mercury vacuum.
2.8. Computational Requirements
The processes constituting the entire computational workflow, including model training, genetic algorithm construction, and NMF, were carried out on a standard laptop with specifications detailed in the computational requirements section (Lenovo IdeaPad 3-17ITL6 laptop, type 82H9; 17-inch; 11th Generation Intel Core i5-1135G7; Intel iRIS graphics card; memory: 2× 8 GB DDR4-3200; hard drive: 512 GB SSD PCIe). The computational setup demonstrates the efficiency and accessibility of the proposed AI-driven approach, making it a practical solution for researchers with standard computing resources.
4. Discussion
Estimating temporal and spatial variations in marine primary production on a large scale remains a challenge when taking into consideration all the efforts undertaken so far. To start understanding the functions of carbon fluxes in the ocean, we need different approaches. Remote sensing seems to be the best candidate; however, validation and correlation with in situ conditions constitute a hurdle due to the lack of on-site data. It is simply impossible to overcome this gap using traditional methods. More and more sensors are being used and developed to collect more detailed data profiles in a shorter amount of time. The lack of information about the functioning of the largest reservoir of dissolved organic carbon (DOC) in the biosphere in the World’s oceans is among the greatest challenges [
10,
24]. Our understanding is still incomplete, lacking details about the kinetics of this complex system.
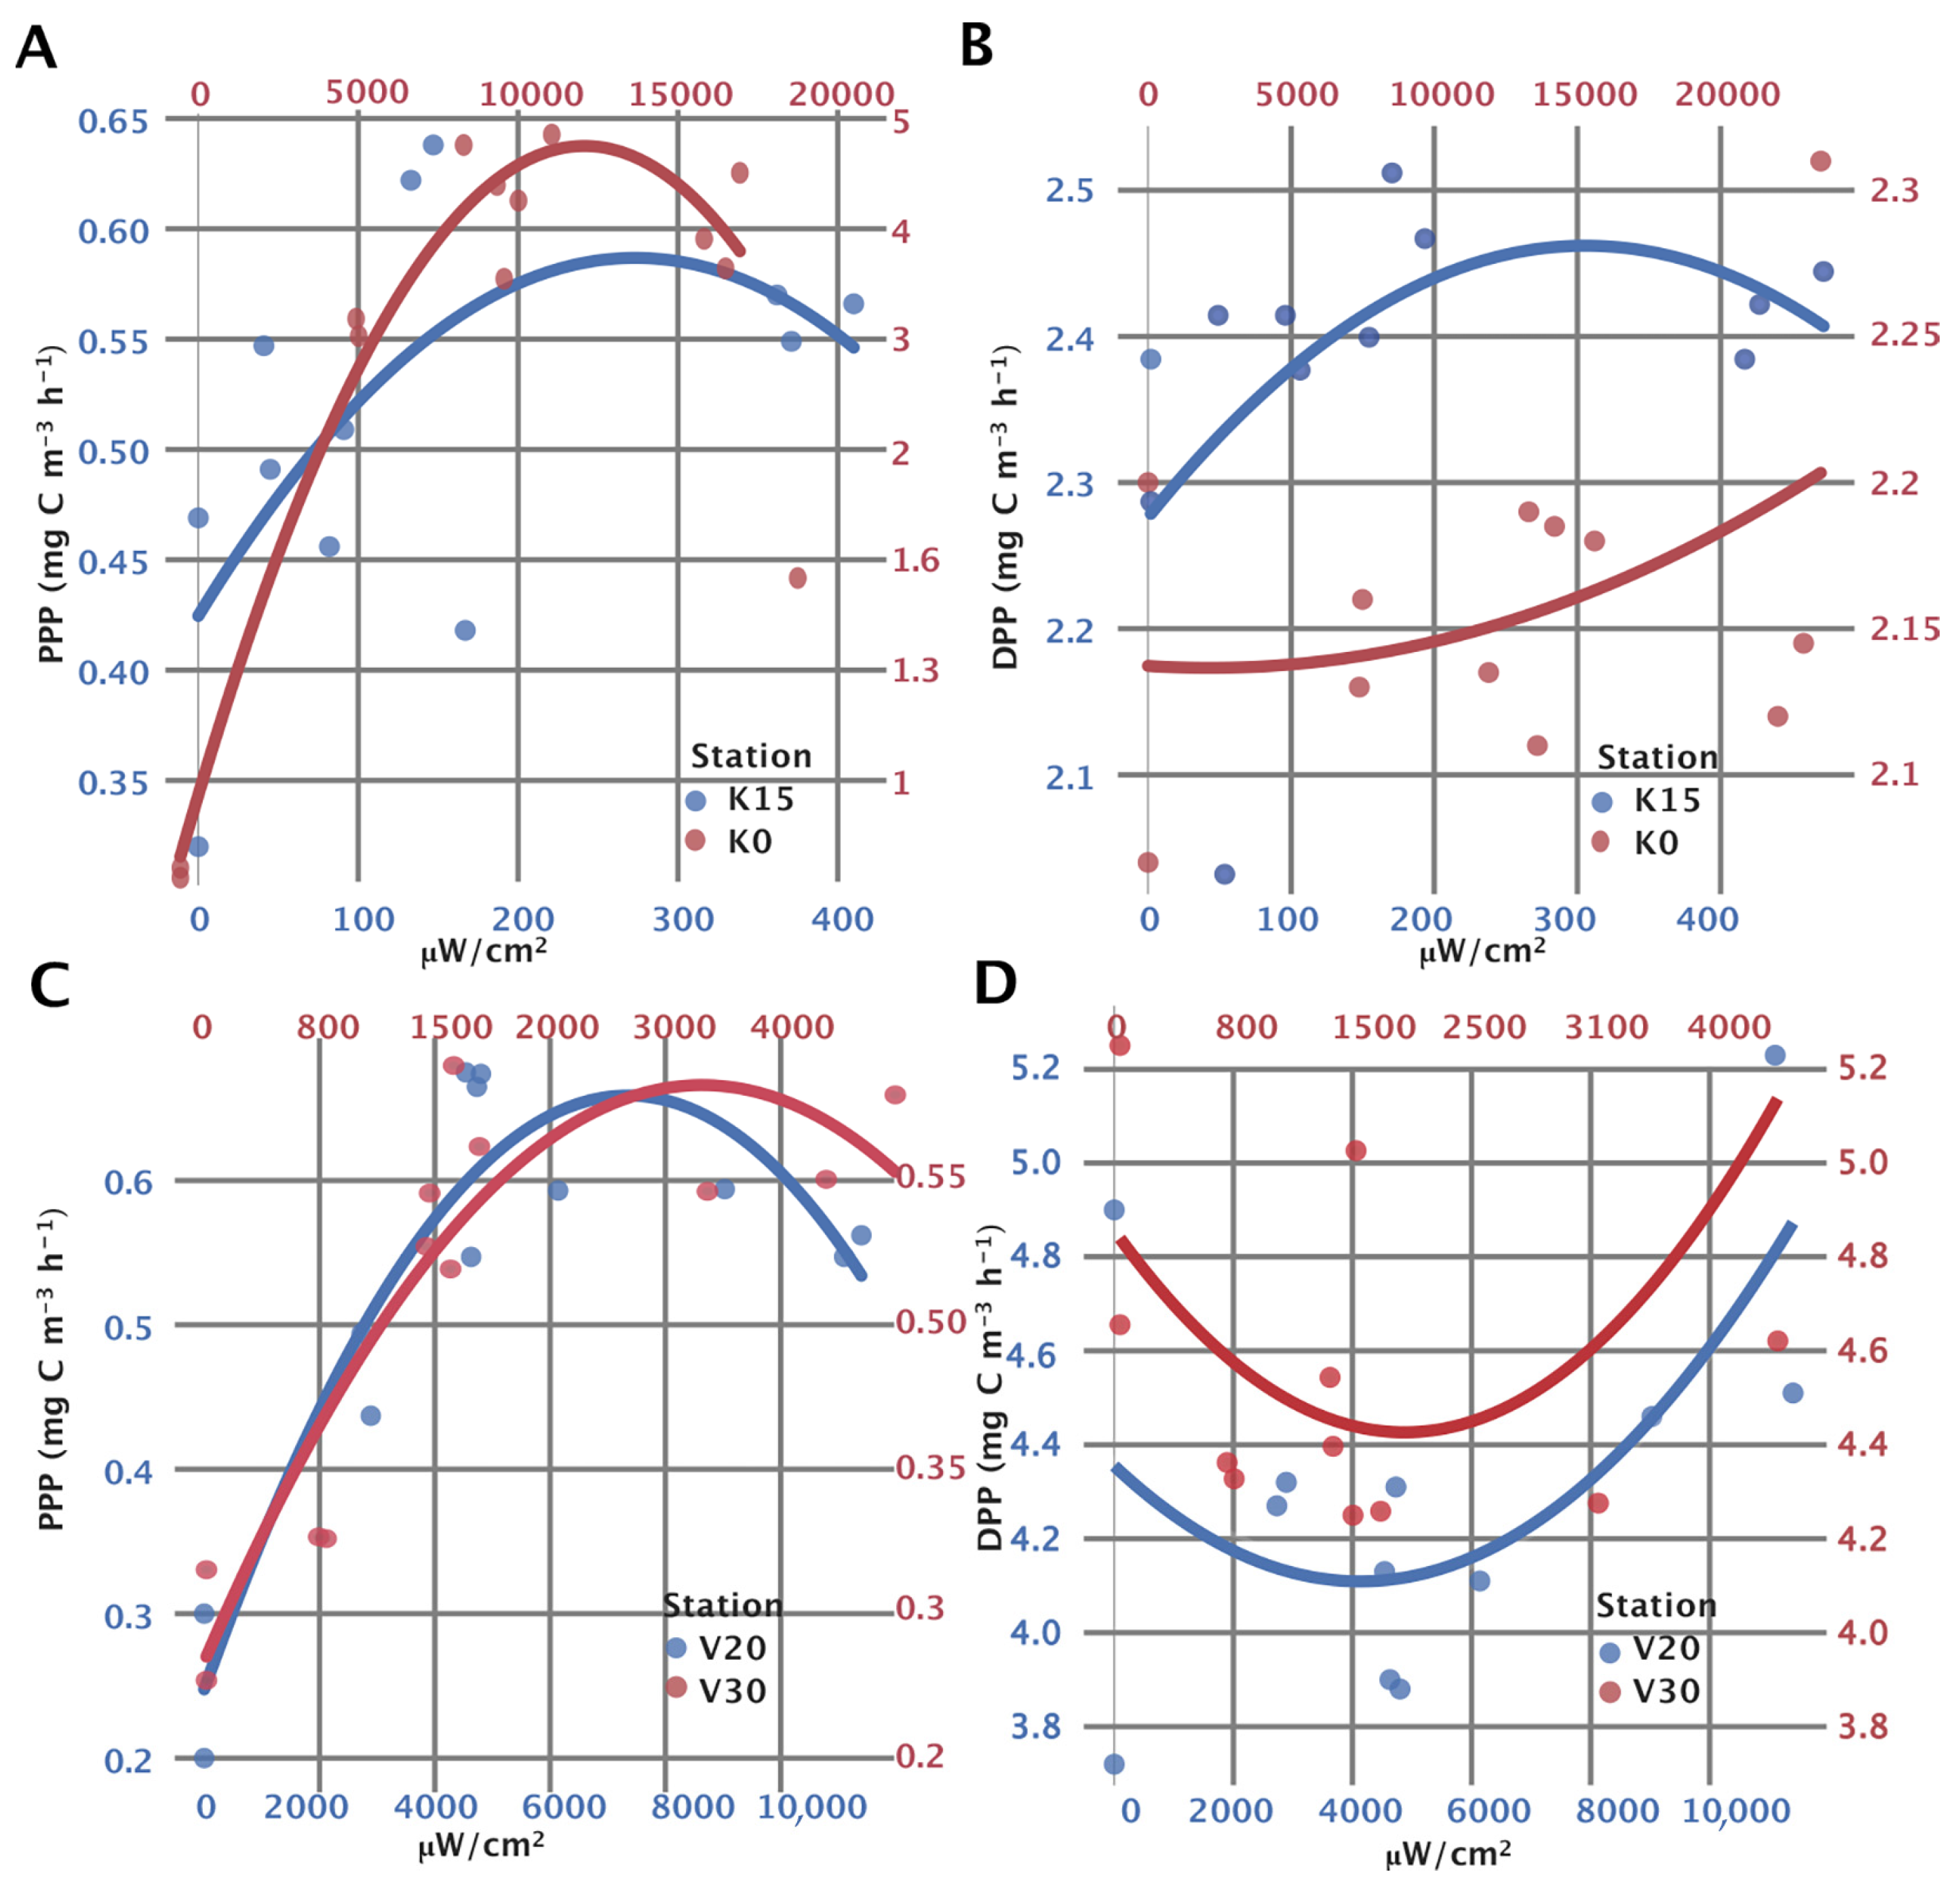
The introduction of the MARINIX Ocean Tech AS (Norway) Light Spectrum Replicator (LSR) system, coupled with AI-driven simulations, presents a pioneering contribution to the field of carbon flux studies. Within a short period of time, we can obtain very precise data on carbon uptake and the release of newly produced dissolved organic carbon by natural phytoplankton assemblages, plus valuable information about their physiological responses in varying environmental conditions, from photosynthesis–irradiance curves. Even though the data in
Figure 9 were not presented in
Section 3 because we could not compare them to in situ incubations and this issue was outside the scope of this communication,
Figure 9 shows an example of the photosynthesis–irradiance curves of particulate and dissolved primary production measurements obtained by our LSR prototype, indicating detailed effects of photoinhibition on both carbon uptake and the release of newly produced dissolved organic matter.
This approach might be particularly useful in the future calibration of new, more sensitive sensing equipment (e.g., fluorometers), especially in the realm of dissolved organic matter. We can acquire a better insight into the pathways of newly produced DOM within which many compounds are labile and short-lived (minutes to hours), as now we can only categorize it as “colored dissolved organic matter” (CDOM).
The integration of advanced technologies and computational methods enhances the precision and efficiency of simulated in situ primary productivity measurements, opening new avenues for research on aquatic ecosystems. The AI-driven approach, involving the replication of in situ irradiance spectra, addresses longstanding challenges in primary productivity estimation. By leveraging AI techniques, the LSR not only replicates measured light spectra but also optimizes the incubation process, enhancing the accuracy of primary productivity measurements. The genetic algorithm’s ability to find optimal LSR configurations within a short timeframe demonstrates the efficiency of the proposed AI-driven methodology. The availability of code and data on a public GitHub repository ensures transparency and reproducibility, allowing other researchers to validate and build upon the presented methodology. The computational requirements section further emphasizes the accessibility of the proposed AI-driven approach, making it a practical solution for researchers with standard computing resources. The integration of AI algorithms into the MARINIX Ocean Tech Light Spectrum Replicator (LSR) system constitutes a transformative step in advancing the precision, efficiency, and accessibility of in situ primary productivity measurements. The AI-driven methodology opens new horizons for researchers seeking to unravel complex patterns in carbon flux studies, ultimately contributing to a more comprehensive understanding of aquatic ecosystems and their intricate dynamics.
As shown in the results, the replicated light spectrum curves cannot be called perfect as they do not have the ability to fill the blue and cyan spectra and do not include infrared channels. The LSR was not equipped with LEDs covering the 426 nm, 516 nm, and 726 nm light spectrum areas. The software compensated for the missing frequencies by increasing values in the neighboring areas, resulting in irradiance intensities that were the same as those measured in situ. Therefore, future improvements to this LSR prototype should include custom building a composite LED with a minimum of 14 channels covering the missing frequencies plus incorporating infrared LEDs.
The higher PPP values measured in the LSR at low irradiance intensities (below 300 µW m−2) indicate that the incubation chambers “leaked” light from other chambers or ambient laterally, thus influencing the primary productivity measurements, resulting in higher values. Therefore, improvements will have to be made to prevent the lateral illumination (light “pollution”) of the incubated samples.
This incubator can be used in two different ways depending on the scope of the corresponding study. Originally, it was designed to provide conditions suitable for incubating one sample simultaneously on daily surface irradiances, ranging from dark to maximum irradiance. Such an approach can provide data for the calculation of daily primary production at a particular location. The other, more complex application is to incubate samples taken at different depths and incubate them on irradiances (ranging from dark to maximum brightness) as they appear in situ. To incubate multiple samples simultaneously, such an approach would require the use of multiple incubators and one assistant and one filtration system per incubator. In this study, we tested this approach with only one incubator; therefore, the incubations at different depths were conducted at different times throughout the day.
We highly recommend the use of the Millipore 1225 Sampling Manifold, which allows the simultaneous filtration of 12 samples and constitutes an easy way to collect sample filtrates for the estimation of dissolved primary productivity (pertaining to the extracellular release of dissolved organic carbon).


 ,
, 