Article

Modeling and Improvement Strategies for Safety Resilience in Maritime Hazardous Chemical Transportation System Based on Dissipative Structure Theory and System Dynamics

School of Maritime Economics and Management, Dalian Maritime University, Dalian 116026, China
*
Author to whom correspondence should be addressed.
J. Mar. Sci. Eng. 2024, 12(2), 340; https://doi.org/10.3390/jmse12020340
Submission received: 8 January 2024 / Revised: 28 January 2024 / Accepted: 13 February 2024 / Published: 16 February 2024
(This article belongs to the Section Ocean Engineering)

Abstract

:
Maritime hazardous chemical transportation accidents have the characteristics of strong suddenness, wide influence, and great harm. To analyze the ability of a maritime hazardous chemical transportation system (MHCTS) to cope with sudden disturbance events, “resilience” is introduced into MHCTS safety research. The key to studying resilience is modeling its evolutionary process. Based on the dissipative structure theory, this study analyzes the entropy flow mechanism of MHCTS safety resilience evolution. Through a statistical analysis of 197 investigation reports on maritime hazardous chemical transportation accidents, the factors influencing the safety resilience of the MHCTS were determined. The entropy value and weight of each influencing factor were calculated using the entropy method and entropy weight method, respectively. Based on this, an entropy model of the safety resilience evolution of the MHCTS was established. The evolution process falls under four categories of disturbance strengths, which were simulated using the system dynamics method. The degree of contribution of absorptive, adaptive, and restorative capacities to the improvement of system safety resilience under four disturbance conditions and the sensitivity of each influencing factor to the absorptive, adaptive, and restorative capacities were analyzed. Based on the analyses, targeted resilience improvement strategies are proposed. The research results provide a theoretical reference for the study of safety resilience mechanisms and resilience management in the MHCTS.

1. Introduction

The maritime hazardous chemical transportation system (MHCTS) is an open and complex dynamic system. Disturbance events occur frequently during transportation, and disasters caused by disturbances not only cause casualties and economic losses but also severely impact the marine environment. For example, on 6 January 2018, the Panamanian oil tanker “SANCHI” collided with the Chinese Hong Kong bulk carrier “CF CRYSTAL”, resulting in a continuous leakage of 111,300 tons of condensate oil. The ship caught fire and eventually sunk, killing all 32 crew members. On 27 April 2021, the Panamanian general cargo ship “SEA JUSTICE” collided with the Liberian oil tanker “A SYMPHONY”, and approximately 9400 tons of cargo oil leaked into the sea, making it a particularly serious ship pollution accident. Dealing with the occurrence of disturbance events and reducing the impact of disturbance events have become the keys to safety research on maritime hazardous chemical transportation. Resilience theory, a safety management method applicable to complex dynamic open systems that can control the safety state among system elements from a global and holistic perspective, provides a new thinking paradigm and method for the study of system behavior under disturbance scenarios. Therefore, the resilience theory was applied to the safety research of the MHCTS in this study. Safety resilience is defined as the ability of the MHCTS to absorb and adapt to the influence of disturbance events and recover to the normal state, so as to maintain the safety state of the system. Through modeling and simulation of the resilience evolution of the system, the safety resilience of the system was tested, and effective resilience improvement strategies were proposed.
System resilience undergoes a dynamic evolution process after the occurrence of disturbance events. The study of system resilience should first quantitatively characterize resilience and then model its evolution process. The three commonly used measurement methods for characterizing resilience are as follows: (1) System resilience is characterized by the area of the function curve. The resilience value is defined as the area of the resilience curve and two coordinate axes (the horizontal axis represents the time, and the vertical axis represents the system function) within a certain time range; the resilience level can be obtained by integration [1,2,3]. This method is simple and easy to implement; however, its linear recovery process is not suitable for certain systems and events. (2) System resilience is characterized by the functional state of the system. This method reflects changes in system resilience by comparing the functional state of the system before and after an event [4,5,6,7]. It considers the different stages of system resilience but does not consider the system composition structure to simplify the system performance and quantitatively evaluate the system safety resilience. (3) System resilience is characterized by system entropy. This method considers the system composition structure, and the change in system resilience is reflected by the change in the entropy value [8,9]. In most studies on the resilience of complex systems, the entropy value is used to characterize the system resilience, which is usually combined with the dissipative structure theory. The MHCTS is a dynamic open system far from the equilibrium state, which has typical dissipative structural characteristics. So, it is more suitable to use entropy to characterize the system resilience and reflect the dynamic change process of the system equilibrium state through the change in entropy value.
Based on the resilience characterization, it is also necessary to quantify the evolution process of resilience, that is, to establish a resilience evolution model. For the resilience evolution modeling of complex systems such as the MHCTS, the commonly used methods can be categorized into three types:
(1) Numerical modeling. Xu et al. established a numerical resilience model of an urban complex public space system and used the Monte Carlo method to simulate the resilience level under five different flood scenarios [4]. Considering the domino effect caused by disturbance events and the recovery of damaged facilities, Chen et al. proposed a dynamic stochastic method to study the storage resilience of hazardous materials quantitatively [10]. Ma et al. described the seismic resilience curve of an oil pipeline network system by constructing functions with resistive, adaptive, and recovery abilities [11]. A numerical model can clearly describe the relationship between variables; however, the establishment of the model requires the modeler to have high professional knowledge and practical experience, and the modeling process considers only a few influencing factors, which may lead to errors in dealing with practical problems.
(2) Bayesian probabilistic modeling, mainly using dynamic Bayesian networks (DBNs) and hidden Markov models (HMMs). Kammouh et al. used a DBN to model the evolution process of the transportation system resilience over time [12]. Jiang et al. used a DBN to describe the time-varying process of the resilience of computer networks under random- and centrality-based attacks [13]. Vario et al. used an HMM to describe and predict the evolution of the system state and focused on the reliability of the machine learning process of the HMM coupled with the Baum–Welsh algorithm [14]. A Bayesian probabilistic model considers the influence of time when studying uncertainty problems. It can be obtained through expert knowledge, dataset learning, or a combination of the two, making it widely used in the field of disaster resilience. However, there have been certain limitations in Bayesian probabilistic modeling. First, the construction and analysis of the model are inevitably affected by its subjectivity. Second, because a Bayesian network is a directed acyclic graph, it is difficult to model the nonlinear relationships and interactions between variables. Finally, it may be challenging to identify and determine the influence relationships and state transition matrices of the variables between different time slices.
(3) System dynamics (SD) modeling. To examine the resilience of China’s NG system under supply shortages, Ding et al. analyzed the system recovery process after a supply shortage using SD modeling [15]. Badr et al. developed a resilience-centric SD simulation model to estimate the dynamic resilience of hydropower dam systems in multi-hazard environments [16]. Li et al. developed an SD model of hospital functionality after an earthquake to simulate functional evolution and evaluate a hospital’s seismic resilience [17]. System dynamics can focus on the endogenous behavior of a system, enable a better understanding of the structure and behavior mechanism of a system, and are more suitable for modeling complex systems. Simultaneously, SD can be used to perform quantitative analysis and dynamic simulation of the model and provide a chart of the change in system behavior over time, which has significant advantages in the evolution modeling of system resilience.
Based on the statistical analysis of 197 investigation reports on maritime hazardous chemical transportation accidents in this study, it is found that about 49% of hazardous chemical ships cannot effectively mitigate or eliminate the impact of disturbance events by giving full play to the resilience of the system itself after the occurrence of disturbance events, resulting in the failure of the system to return to a stable state, which leads to more serious maritime accidents. This fully demonstrates that the safety resilience of the MHCTS is still at a low level, and improving the resilience of the system is an urgent problem to be solved, and the key to the study of resilience is to model the resilience evolution process. Therefore, this study established an entropy model of the MHCTS safety resilience evolution by analyzing the characteristics of the dissipative structure and studying the entropy flow mechanism of the system safety resilience evolution. The evolution of system safety resilience in the entire disturbance process was simulated using the SD method. The resilience evolution under different disturbance intensities was analyzed to improve the ability of the system to cope with disturbance events and to provide a theoretical basis for ensuring the safety of the MHCTS.

2. Analysis of Safety Resilience Evolution of MHCTS and Establishment of Entropy Model

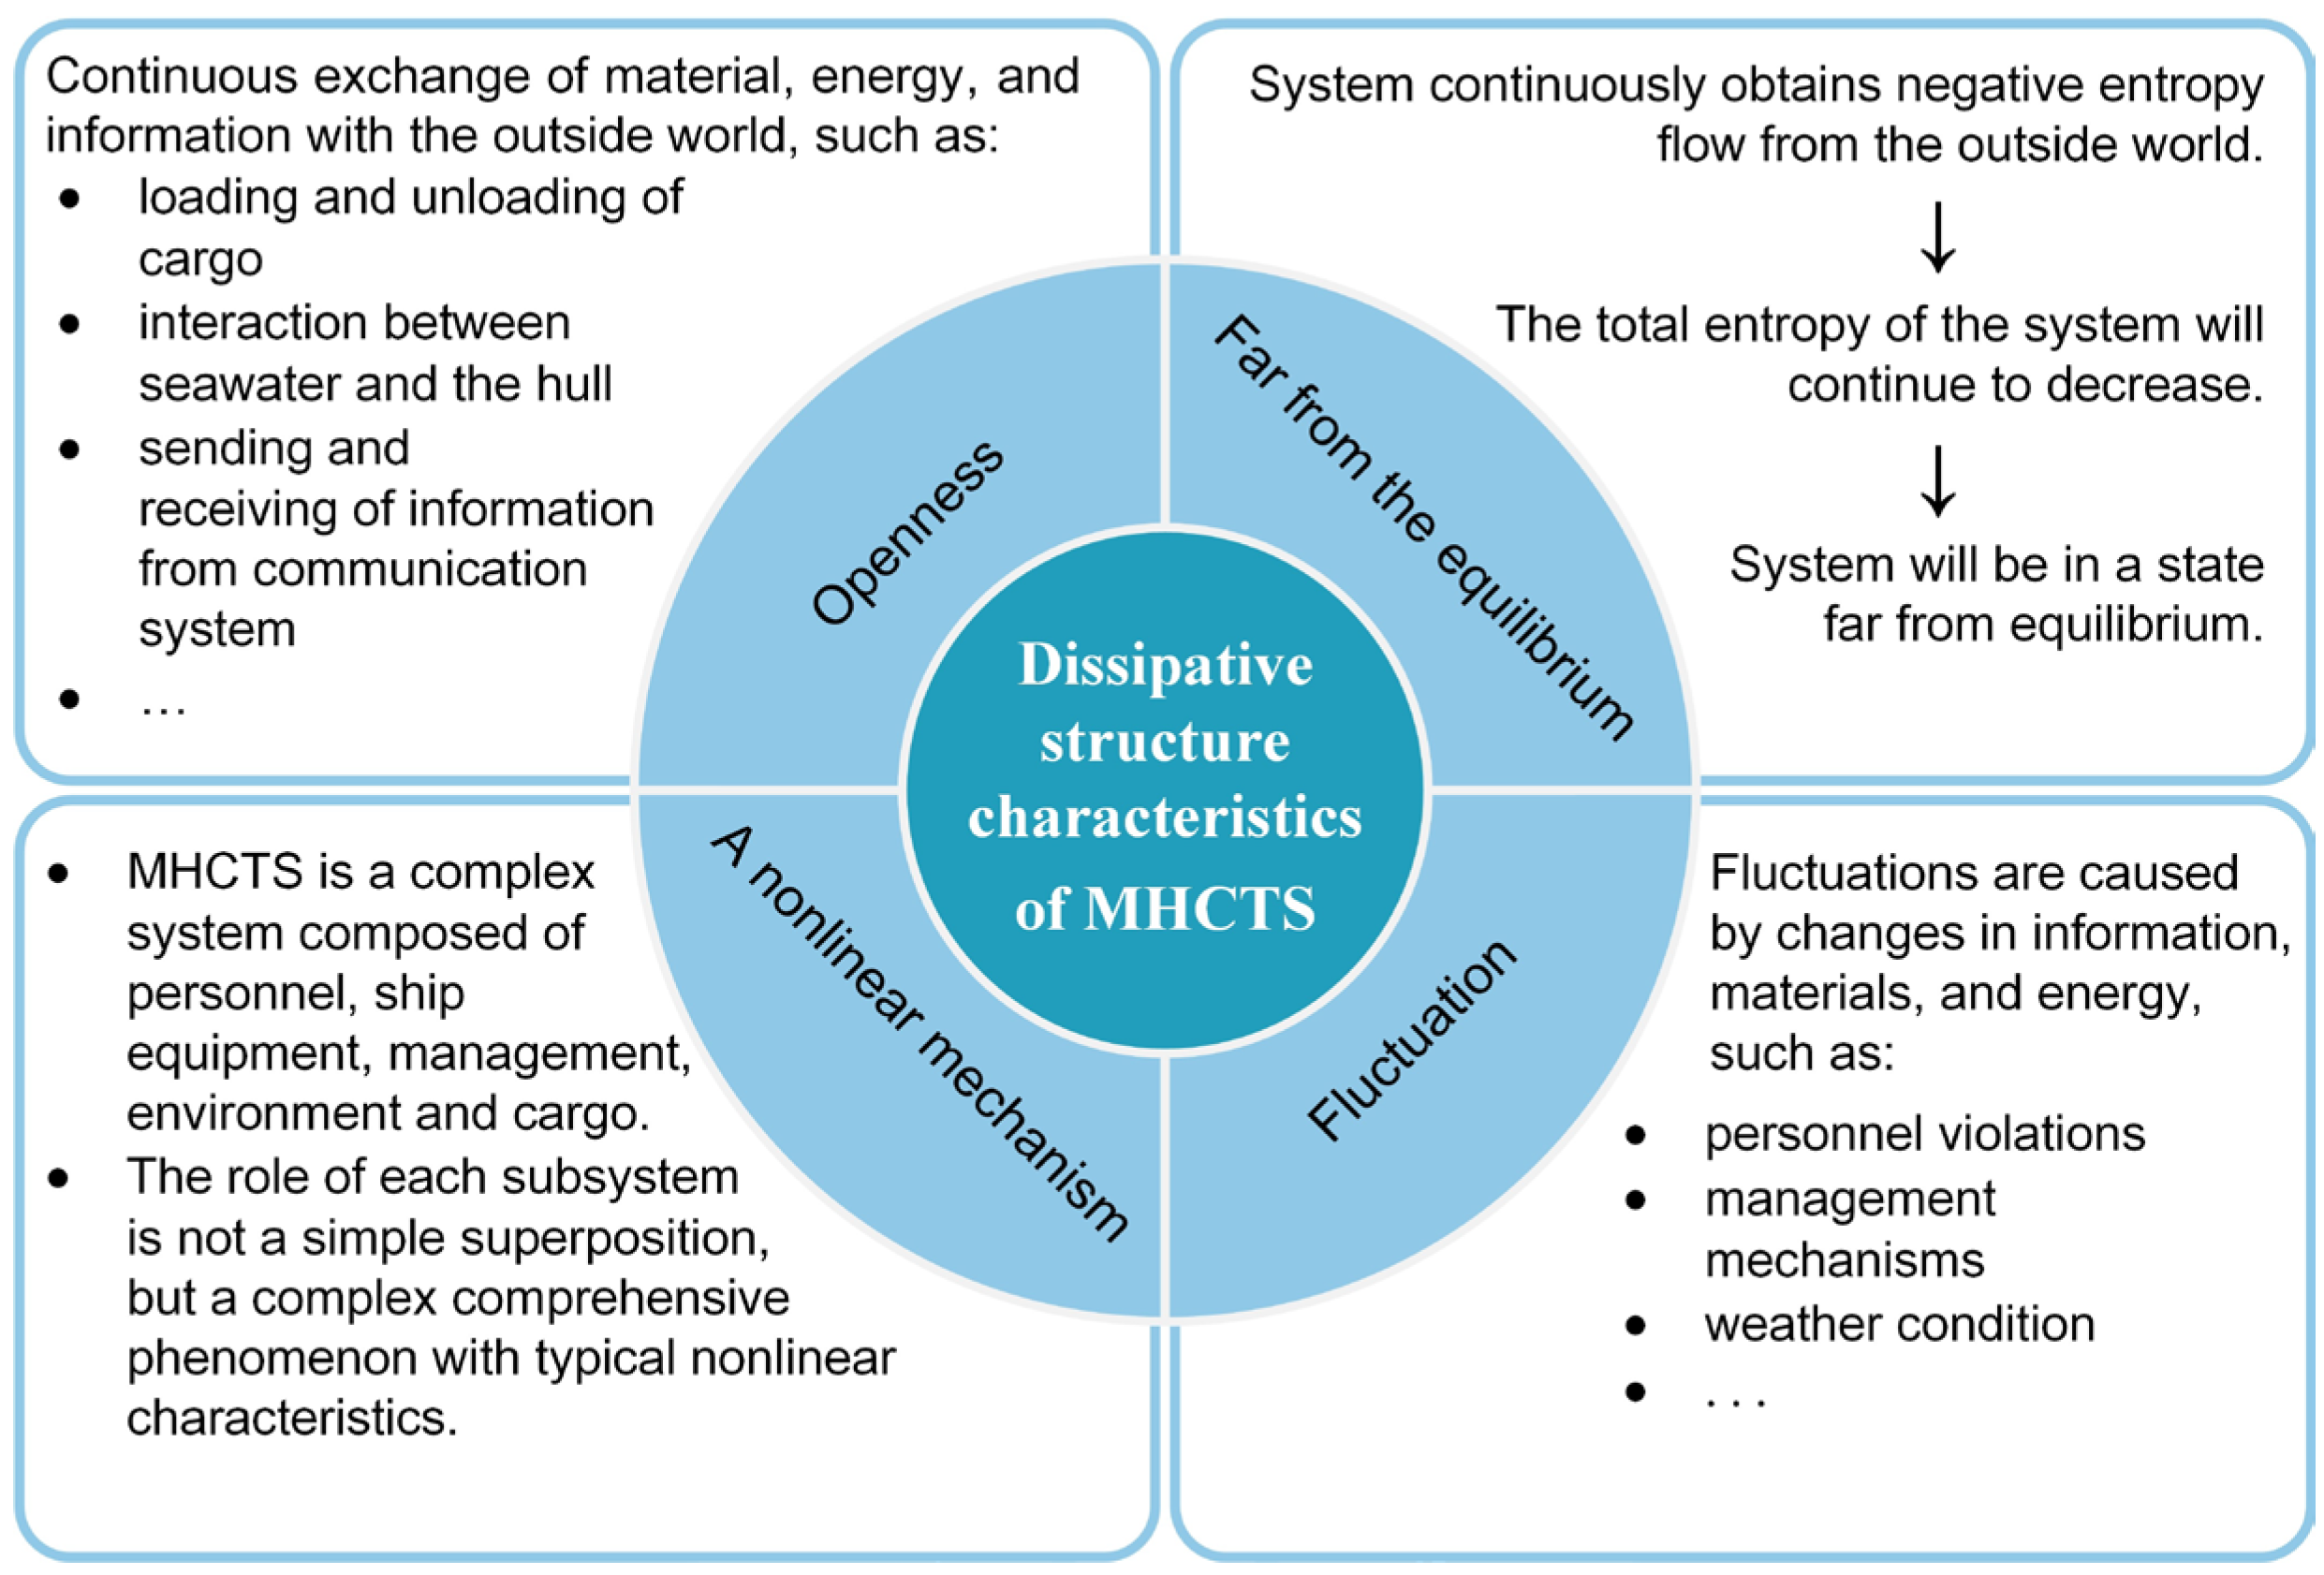
2.1. Analysis of Dissipative Structure Characteristics of MHCTS

The dissipative structure theory proposes that an open system far from the equilibrium state will constantly exchange matter and energy with the outside world. When it reaches a certain threshold, the self-organization phenomenon will be generated through internal action, and it will be transformed into a macro-ordered structure in time, space, and function. An ordered structure is the dissipative structure of a system.
Openness, far from the equilibrium state, a nonlinear mechanism, and system fluctuation are the four basic conditions for the formation of a dissipative structure. The MHCTS maintains a continuous exchange of material, energy, and information with the outside world, such as the loading and unloading of cargo, the interaction between seawater and the hull, and the sending and receiving of information from communication systems to satisfy the requirements of openness. Through openness, the system continuously obtains negative entropy flow from the outside world. The greater the entropy that can be offset, the more the total entropy of the system will continue to decrease, and finally, the system will be in a state far from equilibrium. An MHCTS is a complex system composed of personnel, ship equipment, management, environment, and cargo. The role of each subsystem is not a simple superposition but a complex comprehensive phenomenon with typical nonlinear characteristics. Fluctuations are caused by changes in information, materials, and energy, such as personnel violations, management mechanisms, and weather conditions [18,19,20]. In summary, the MHCTS has typical dissipative structural characteristics, as shown in Figure 1.

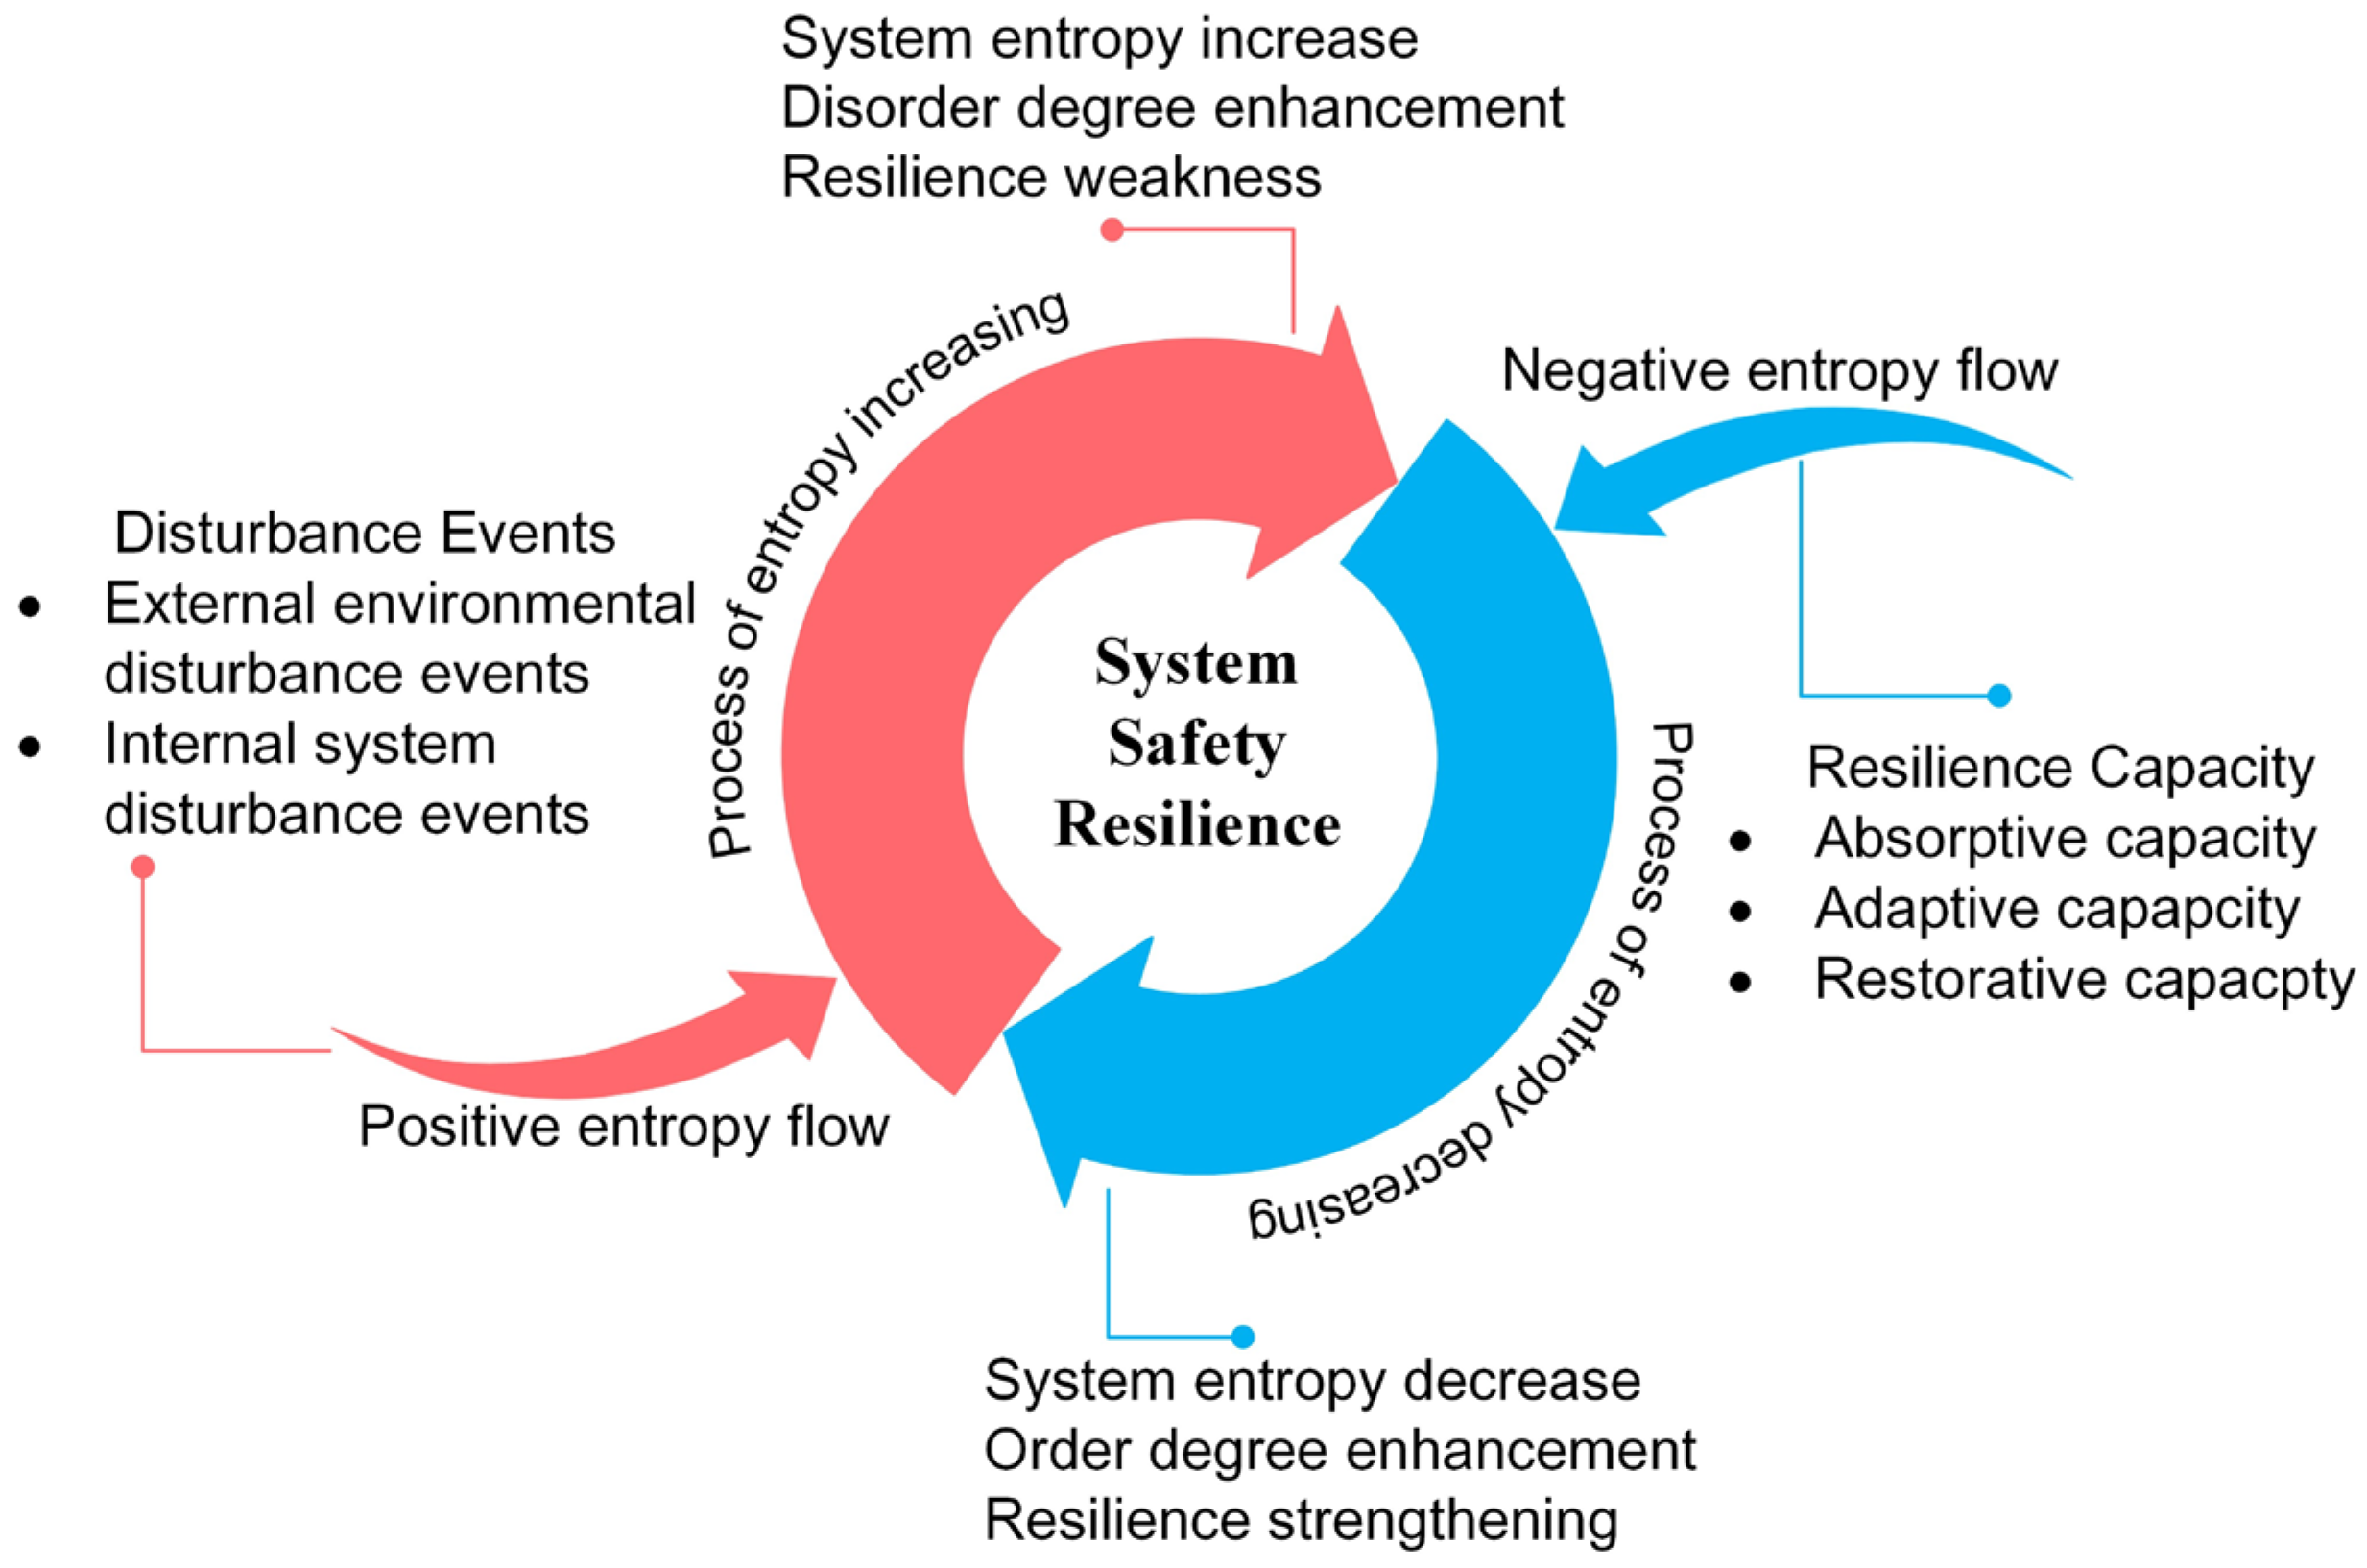
2.2. Entropy Flow Mechanism of Resilience Evolution for MHCTS

The safety resilience of an MHCTS is affected by both disturbance events and resilience capacity. The different sources of disturbance events can be classified into internal system and external environmental disturbance events. Resilience capacity can be subdivided into absorptive, adaptive, and recovery capacities [21]. Absorptive capacity refers to the ability of a system to absorb the impact of disturbance events and minimize system loss at minimum cost. Adaptive capacity refers to the ability of a system to adapt to disturbances, survive, and cope with abnormal or dangerous conditions. Restorative capacity refers to the ability of a system to recover from a disturbance event and return to a normal state.
Entropy is a measure of the degree of order of a system. The smaller the entropy, the higher the degree of order of the system. According to the non-equilibrium thermodynamic equation, the entropy change of an open system can be expressed by Equation (1).
d S = d S e + d S i
where dS is the total entropy change of the system; dSe is the entropy generated by the exchange of matter, energy, and information between the system and the outside world, which is called “entropy flow”, and dSe can be positive or negative, or equal to zero. Positive entropy flow promotes the degree of disorder of the system in the process of exchanging materials, energy, and information with the outside world. The accumulation of positive entropy flow enhances the degree of disorder in the system, eventually leading to its destruction; negative entropy flow refers to the entropy flow generated by factors that contribute to the degree of order of the system and promote its order. dSi is the entropy generated by the irreversible process inside the system, which is called “entropy production”, which can only be greater than or equal to zero according to the second law of thermodynamics.
During the transportation of hazardous maritime chemicals, the occurrence of disturbance events—such as unsafe behavior of the crew, damage to ship hardware facilities and equipment, bad weather conditions, and complex navigation environments—makes the MHCTS uncertain, and the system may face more consequences, such as an accident, a minor casualty, a serious casualty, or a very serious casualty. That is, these disturbance events introduce a positive entropy flow into the system, increase the entropy value, and reduce the degree of order of the system. This makes the system unstable and unsafe, finally causing transportation accidents. When disturbance events occur, if the system has resilience, certain effective measures can be taken, such as strong safety awareness, knowledge and skills of the crew, standby facilities and equipment, maintenance capabilities, and appropriate emergency rescue measures. This can mitigate or eliminate uncertainty about the consequences of the system; that is, the negative entropy flow is injected into the system to offset the impact of positive entropy flow so that the system is turned from disorder to order again, the system becomes safe and stable, and the normal function of the system is restored. The entropy flow mechanism diagram of the safety resilience evolution of the MHCTS is shown in Figure 2.
It can be seen from Figure 2 that using entropy to characterize the safety resilience of the MHCTS can not only make the concept of “resilience” more visualized but also intuitively reflect the change process of system resilience and safety state from the perspective of entropy flow change. The entropy flow mechanism provides a theoretical basis for the establishment of the entropy model of the safety resilience evolution of the MHCTS.

2.3. Entropy Model of Safety Resilience Evolution of MHCTS

2.3.1. Entropy and Weight Calculation of Influencing Factors of Safety Resilience

A total of 197 investigation reports on maritime hazardous chemical transportation accidents, including collision, grounding, stranding, fire, explosion, self-sinking, and wind disasters, and a total of 210 hazardous chemical ships, including oil tankers, liquefied gas tankers, and chemical tankers, were considered in this study [22,23,24,25,26,27]. Based on the statistical analysis of the accident causes in the accident investigation report and referring to relevant studies on MHCTS safety [20], the safety resilience of ship navigation [28], and the resilience of the MHCTS [29], the influencing factors of the safety resilience of the MHCTS were determined, as shown in Table 1.
Combined with the resilience-influencing factors proposed in Table 1, the occurrence probability of each factor in the considered accident investigation reports when a disturbance event occurred was statistically calculated as the prior probability. For example, if a total of 155 ships reported the crew’s unsafe behavior (E1) in the collected investigation report, then the occurrence probability of this factor is p ( E 1 1 ) = 155 / 210 0.738 , and conversely, the non-occurrence probability of this factor is p ( E 1 2 ) = 1 p ( E 1 1 ) 0.262 . Finally, the entropy value Si of each influencing factor was calculated using Equation (2). The prior probability and entropy calculation results for all the factors are listed in Table 2, and the values in the table are rounded.
S i = j = 1 n p   ( x j ) · ln p   ( x j )
where p(xj) is the probability of the jth state of influencing factor x, p(xj) > 0 and j = 1 n p ( x j ) = 1 .
The entropy weight method is used to calculate the influence degree of each factor on the superior factor (the “classification” factor in Table 1), that is, the weight. First, according to the prior probability of each factor obtained from accident investigation report statistics, the standard information entropy ei of each factor was calculated using Equation (3).
e i = 1 ln m j = 1 n p ( x j ) · ln p ( x j )
where p(xj) is the same as that in Equation (2), n is the total number of influencing factors, and m is the total number of influencing factor indicators. Then, the information utility value di is calculated by Equation (4).
d i = 1 e i
Finally, the information utility value is normalized by Equation (5) to obtain the weight Wi of each factor. The specific calculation results are shown in Table 3, and the values in the table are rounded.
W i = d i i = 1 n d i

2.3.2. Establishment of Entropy Model of Safety Resilience Evolution for MHCTS

Combined with the description of the entropy flow mechanism in Section 2.2, the influencing factors of the safety resilience determined by Table 1, and the calculation results in Table 2, SA(t), SB(t), SC(t), SD(t), and SE(t) are the entropy functions of the absorptive capacity, adaptive capacity, restorative capacity, external environmental disturbance events, and internal system disturbance events with time, and they are expressed as Equations (6)–(10), respectively.
S A t = f W A 1 S A 1 , W A 2 S A 2 , W A 3 S A 3 , W A 4 S A 4 , t
S B t = f W B 1 S B 1 , W B 2 S B 2 , W B 3 S B 3 , t
S C t = f W C 1 S C 1 , W C 2 S C 2 , W C 3 S C 3 , t
S D t = f W D 1 S D 1 , W D 2 S D 2 , W D 3 S D 3 , W D 4 S D 4 , W D 5 S D 5 , t
S E t = f W E 1 S E 1 , W E 2 S E 2 , W E 3 S E 3 , W E 4 S E 4 , t
where SA1, SA2, SA3, SA4, SB1, SB2, SB3, SC1, SC2, SC3, SD1, SD2, SD3, SD4, SD5, SE1, SE2, SE3, and SE4 are shown in Table 2; WA1, WA2, WA3, WA4, WB1, WB2, WB3, WC1, WC2, WC3, WD1, WD2, WD3, WD4, WD5, WE1, WE2, WE3, and WE4 are shown in Table 3; and t is time.
Furthermore, system safety resilience is a function of absorptive capacity, adaptive capacity, restorative capacity, external environmental disturbance events, and internal system disturbance events. The function SR(t) of its entropy with time can be expressed as Equation (11).
S R t = f W A S A t , W B S B t , W C S C t , W D S D t , W E S E t

3. Simulation and Modeling of Resilience Evolution Process Based on SD

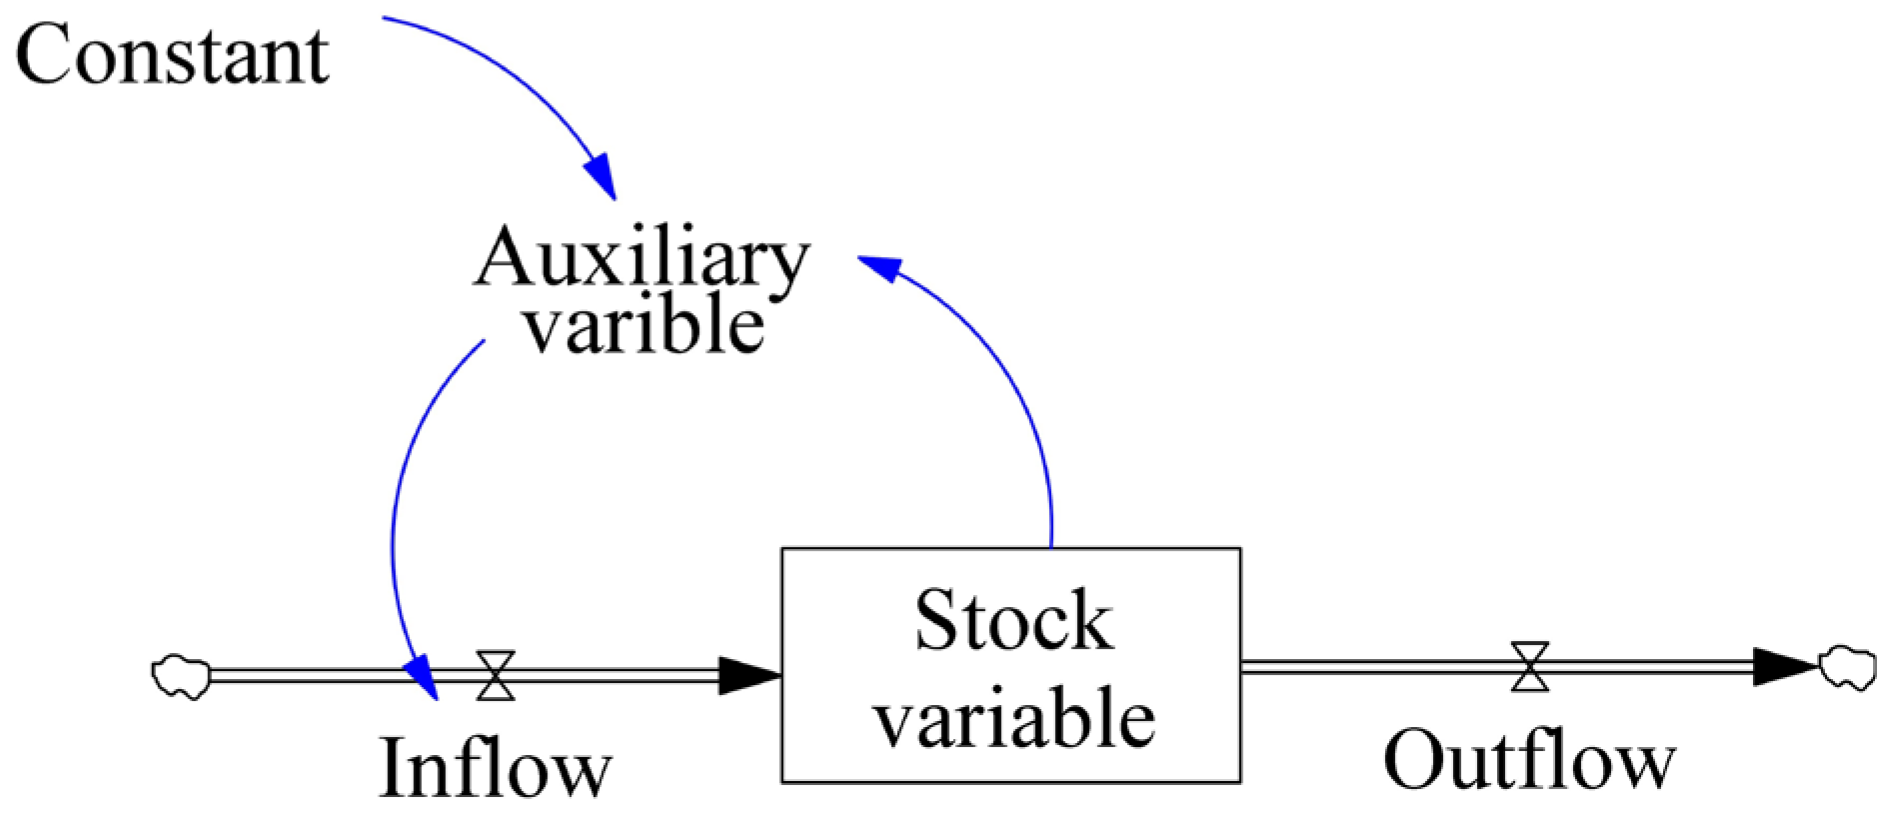
3.1. Basic Principles of SD

SD considers that the behavioral patterns and characteristics of a system mainly depend on its internal dynamic structure and feedback mechanism [30], which provides a new way of thinking for studying complex dynamic systems. A stock and flow diagram (refer to Figure 3) is an essential tool for quantitative research on complex dynamic systems using SD. A stock and flow diagram uses the functional relationships among stock variables, flow variables, constants, and auxiliary variables to reflect the dynamic behavior of complex systems. The stock variable, also called the level variable, is the accumulation of material that is used to characterize the state of the system and provide a reference for decision-making and action. The flow variable is the rate of change of the stock variable, and the difference between the inflow and outflow produces a stock variable over time. Constant refers to variables that changed little or remained relatively unchanged during the study period. The auxiliary variables change indirectly through changes in other variables.

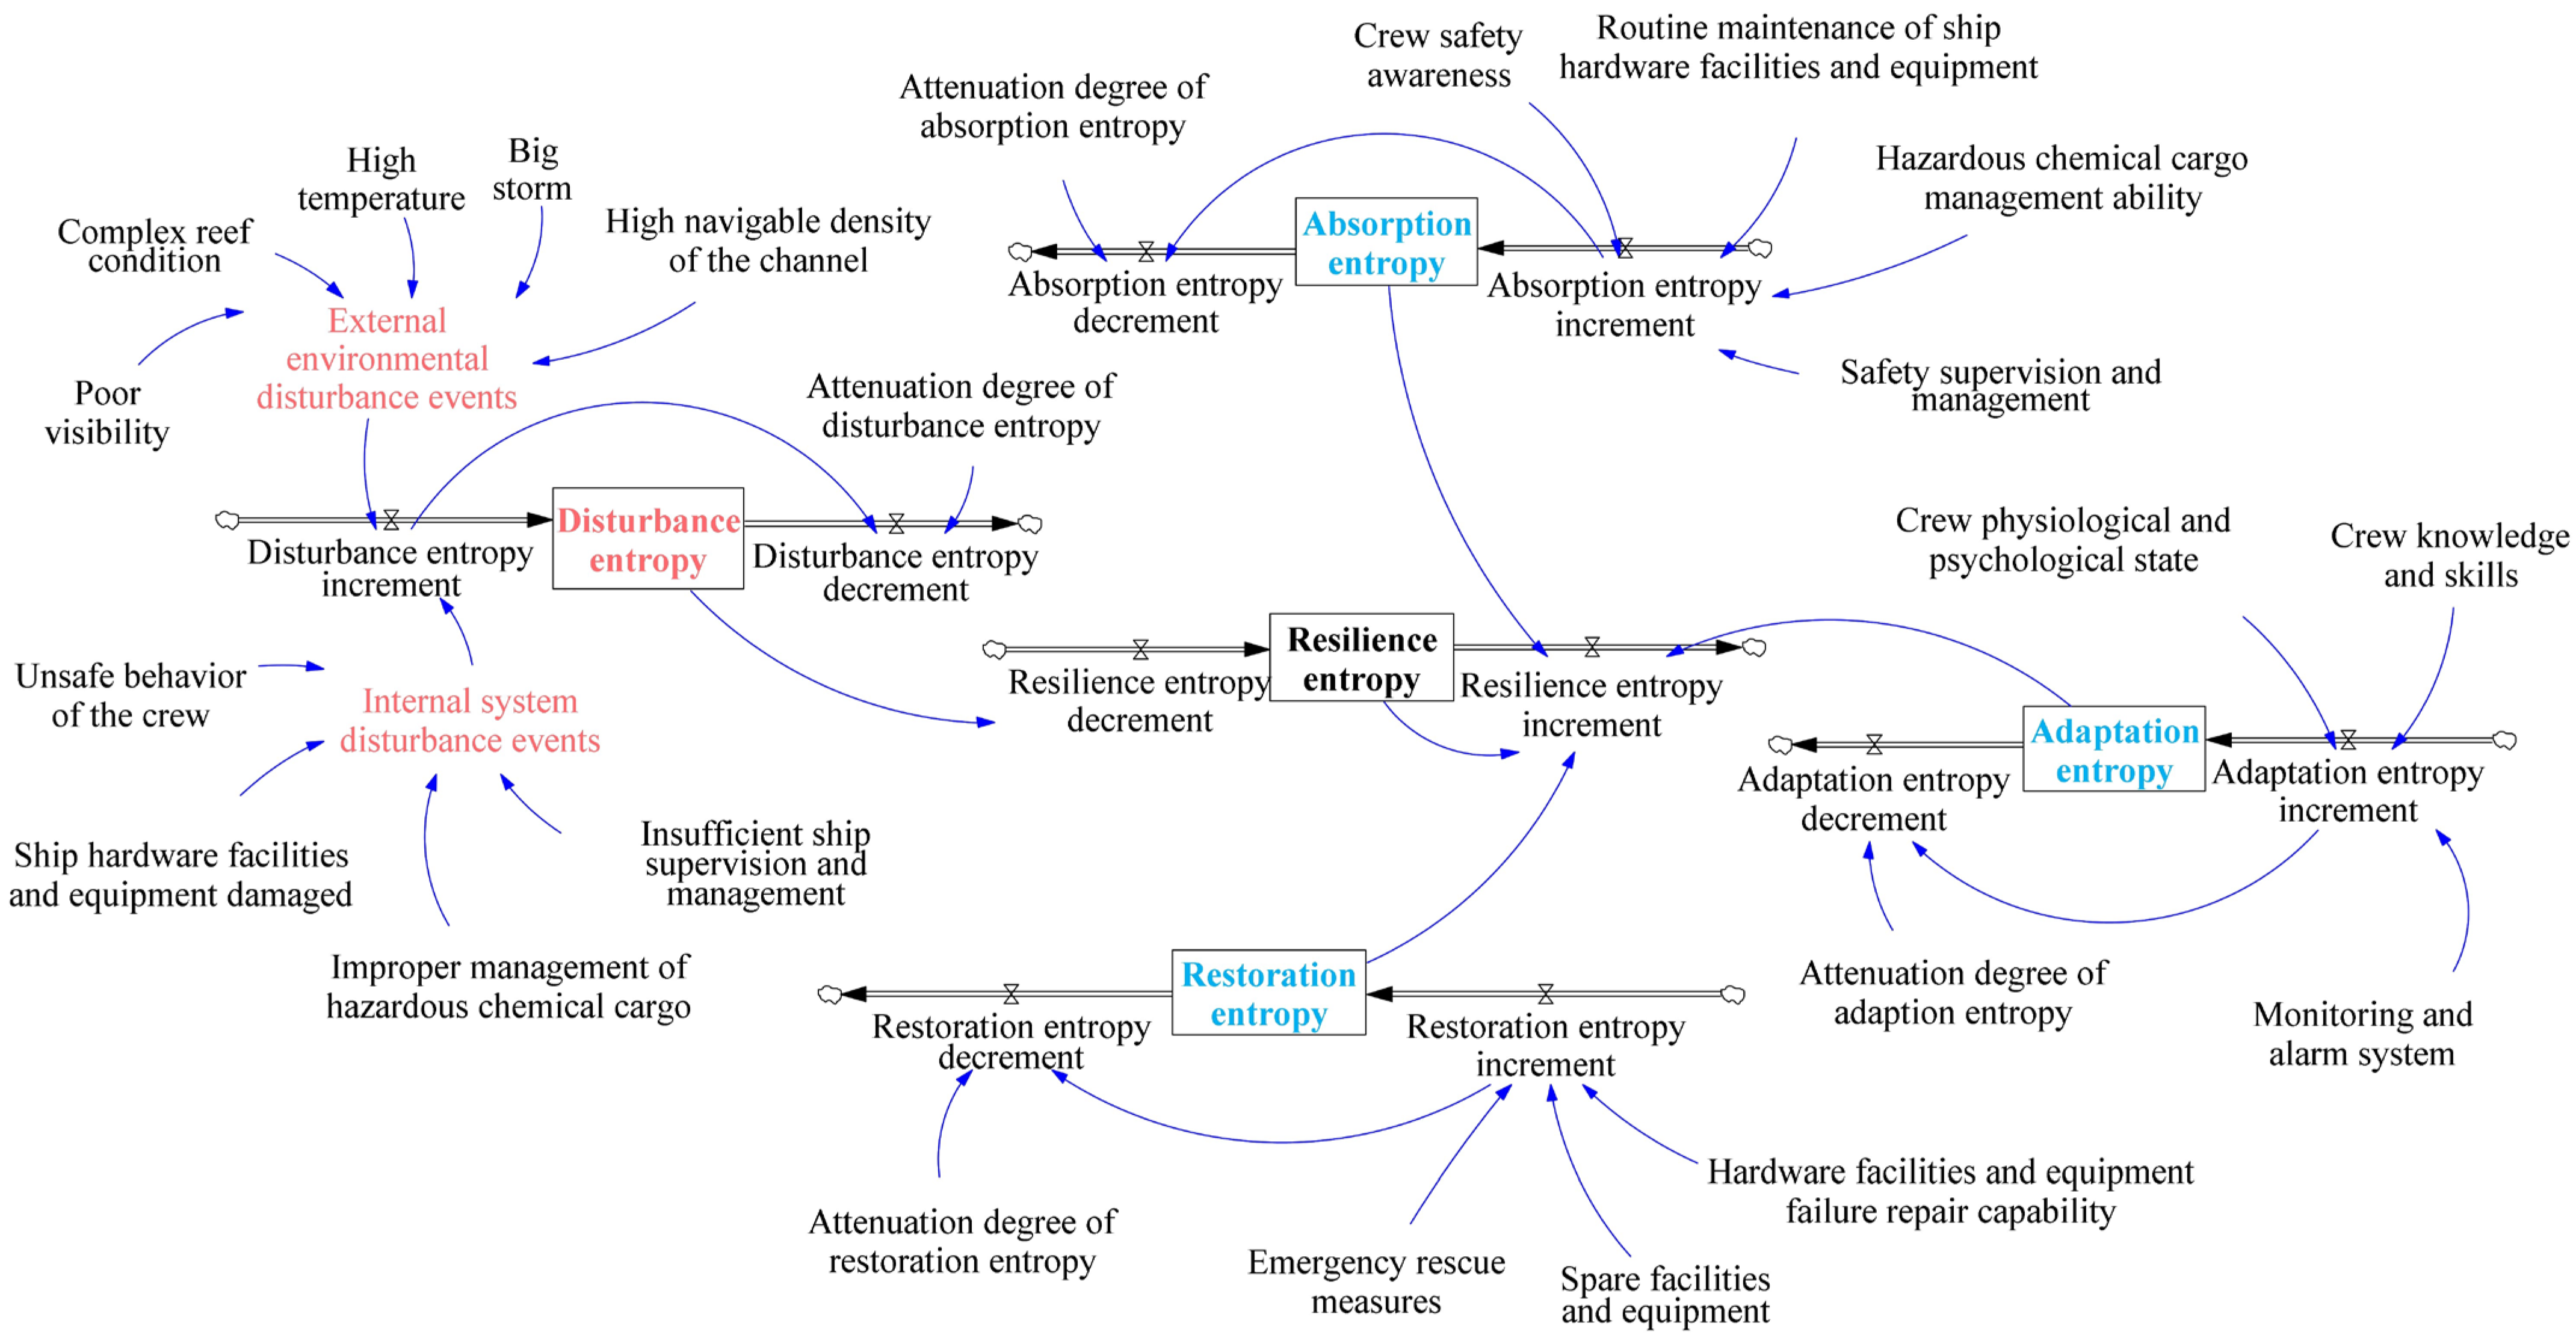
3.2. SD Model of Safety Resilience Evolution of MHCTS

The system safety resilience value is not fixed but dynamically changes at any time according to changes in resilience capacity and disturbance events. Based on the analysis of the entropy flow mechanism and the basic principles of SD, an SD model of the safety resilience evolution of the MHCTS was established, as shown in Figure 4. The absorptive, adaptive, and restorative capacities and the disturbance events affect system safety resilience in the form of absorption, adaptation, restoration, and disturbance entropies, respectively. System safety resilience is referred to as resilience entropy in Figure 4. The absorption, adaptation, restoration, disturbance, and resilience entropies were regarded as stock variables in the system dynamics model. The entropy increment and entropy decrement describe the entropy accumulation and entropy decrement, respectively, in the form of rate variables, whereas the other influencing factors are expressed by constants and auxiliary variables. From Figure 4, the entropy flow relationship between the resilience entropy and absorption, adaptation, restoration, and disturbance entropies, as well as the influence of each influencing factor and the corresponding entropy value, can be clearly seen. Therefore, by using the SD method to establish the relationship between these variables, the evolution process of safety resilience of the MHCTS can be clearly expressed.

3.3. SD Model Function of Safety Resilience Evolution of MHCTS

Vensim PLE Version 10.1.1 software was used to implement the proposed entropy model of the safety resilience evolution of the MHCTS in this study, and certain required built-in functions in the solution process are described in detail below.
(1) INTEG function
I N T E G   ( i n f l o w o u t f l o w )
The INTEG function calculates the change in stock using the integral method; inflow and outflow are the inflows and outflows of the stock, respectively. In the model, the positive and negative entropy flows act on the system safety resilience in the form of a flow, and the INTEG function is used to calculate the entropy changes caused by the accumulation and offset of positive and negative entropy flows in the system.
(2) IF THEN ELSE function
I F   T H E N   E L S E   ( { c o n d } ,   { o n t r u e } ,   { o n f a l s e } )
The IF THEN ELSE function is a process control function. When the condition cond is true, the ontrue statement is executed; otherwise, the onfalse statement is executed. It is used in the model to control the inflow of the negative entropy flow; that is, when the occurrence of disturbance events leads to the inflow of positive entropy into the system, it increases the entropy value of the system and decreases its degree of order of the system. Simultaneously, the negative entropy flow is injected to offset the influence of the positive entropy flow so that the system is restored to order.
(3) RANDOM UNIFORM function
R A N D O M   U N I F O R M   ( { m i n } ,   { m a x } ,   { s e e d } )
The RANDOM UNIFORM function was used to generate random numbers within the specified range; min is the lower limit of the specified range, max is the upper limit of the specified range, and seed is the random number seed, which is zero by default. In the model, the RANDOM UNIFORM function was used to simulate the randomness of disturbance events and the instability of the factors influencing resilience capacity.
(4) DELAY1I function
D E L A Y 1 I   ( { i n } ,   { d t i m e } ,   { i n i t } )
The DELAY1I function is a first-order delay function, where in is the input variable, dtime is the delay time, and init is the initial value of the variable, which is zero by default in this study. The delay function is used in the model to simulate the decay of the entropy flow, and it consumes a certain amount of time to play the role of the system’s adaptive and restorative capacities owing to the development of the situation and decision-making.
The specific equations in the SD model for the safety resilience evolution of the MHCTS are listed in Table 4.

4. Simulation Implementation and Result Analysis

4.1. Simulation Scenario Hypothesis

Referring to the definition and description of a resilience scenario by Brtis et al. [31], the simulation scenario hypothesis is explained as follows.
Disturbance events: Through statistical analysis of maritime hazardous chemical transportation accidents, it was found that serious accidents are often the result of the joint action of internal and external environmental disturbance events. Therefore, the co-occurrence of the high navigation density of the channel (D4) and unsafe behavior of the crew (E1) was selected as the study scenario. These two factors have the largest entropy according to Table 2; that is, they are the most unstable influencing factors in internal and external environmental disturbance events, respectively.
Constraints: To be more consistent with the actual scenario, the experiment does not exclude the interference of other influencing factors in disturbance events and the failure of the influencing factors in resilience capacity. In the simulation process, only the influence of disturbance events and resilience ability on the system’s entropy was considered; therefore, the initial value of the resilience entropy, that is, the system’s entropy value under the normal state, was set to zero.
Timeframe: The simulation step of the evolution model was set to be 1 h, and the time lasted for 48 h. The disturbance event occurred at 1 h, and the delay times of the adaptive and restorative capacities were set as 12 h and 24 h, respectively.
To explore the evolution process of the safety resilience of an MHCTS under different disturbance intensities, the following four experimental scenarios were set up as shown in Table 5.

4.2. Simulation Results and Analysis

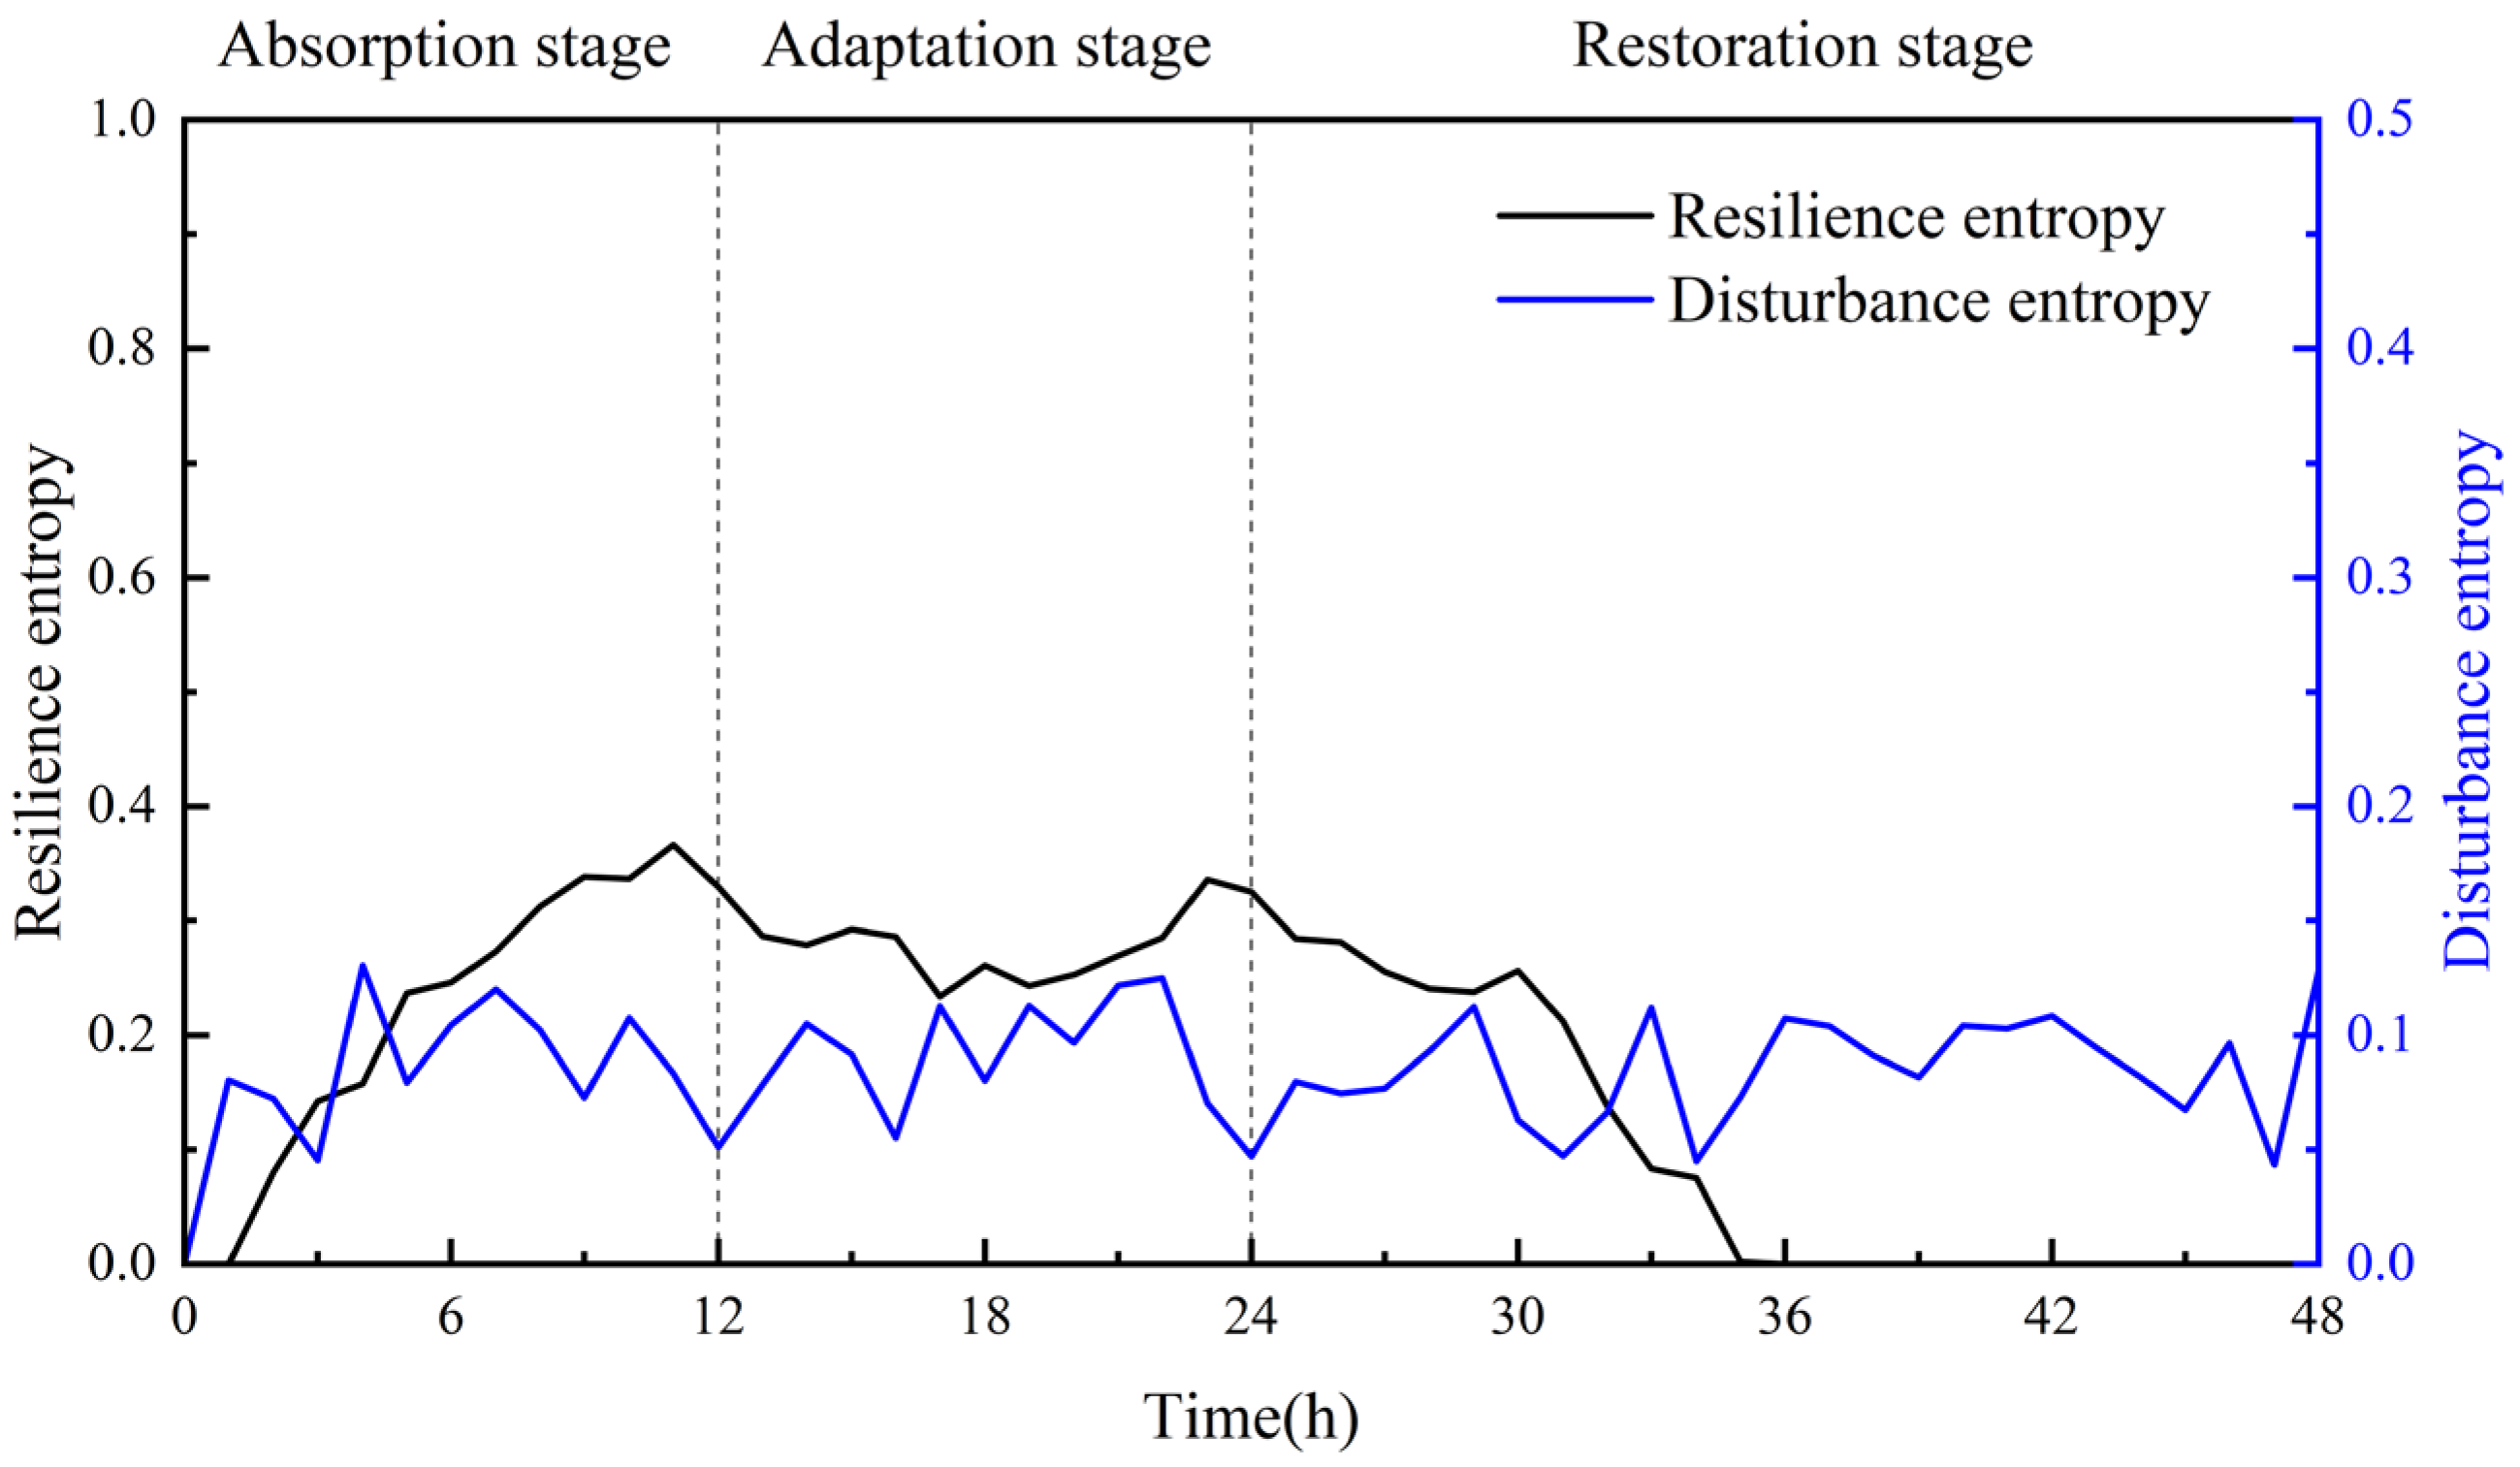
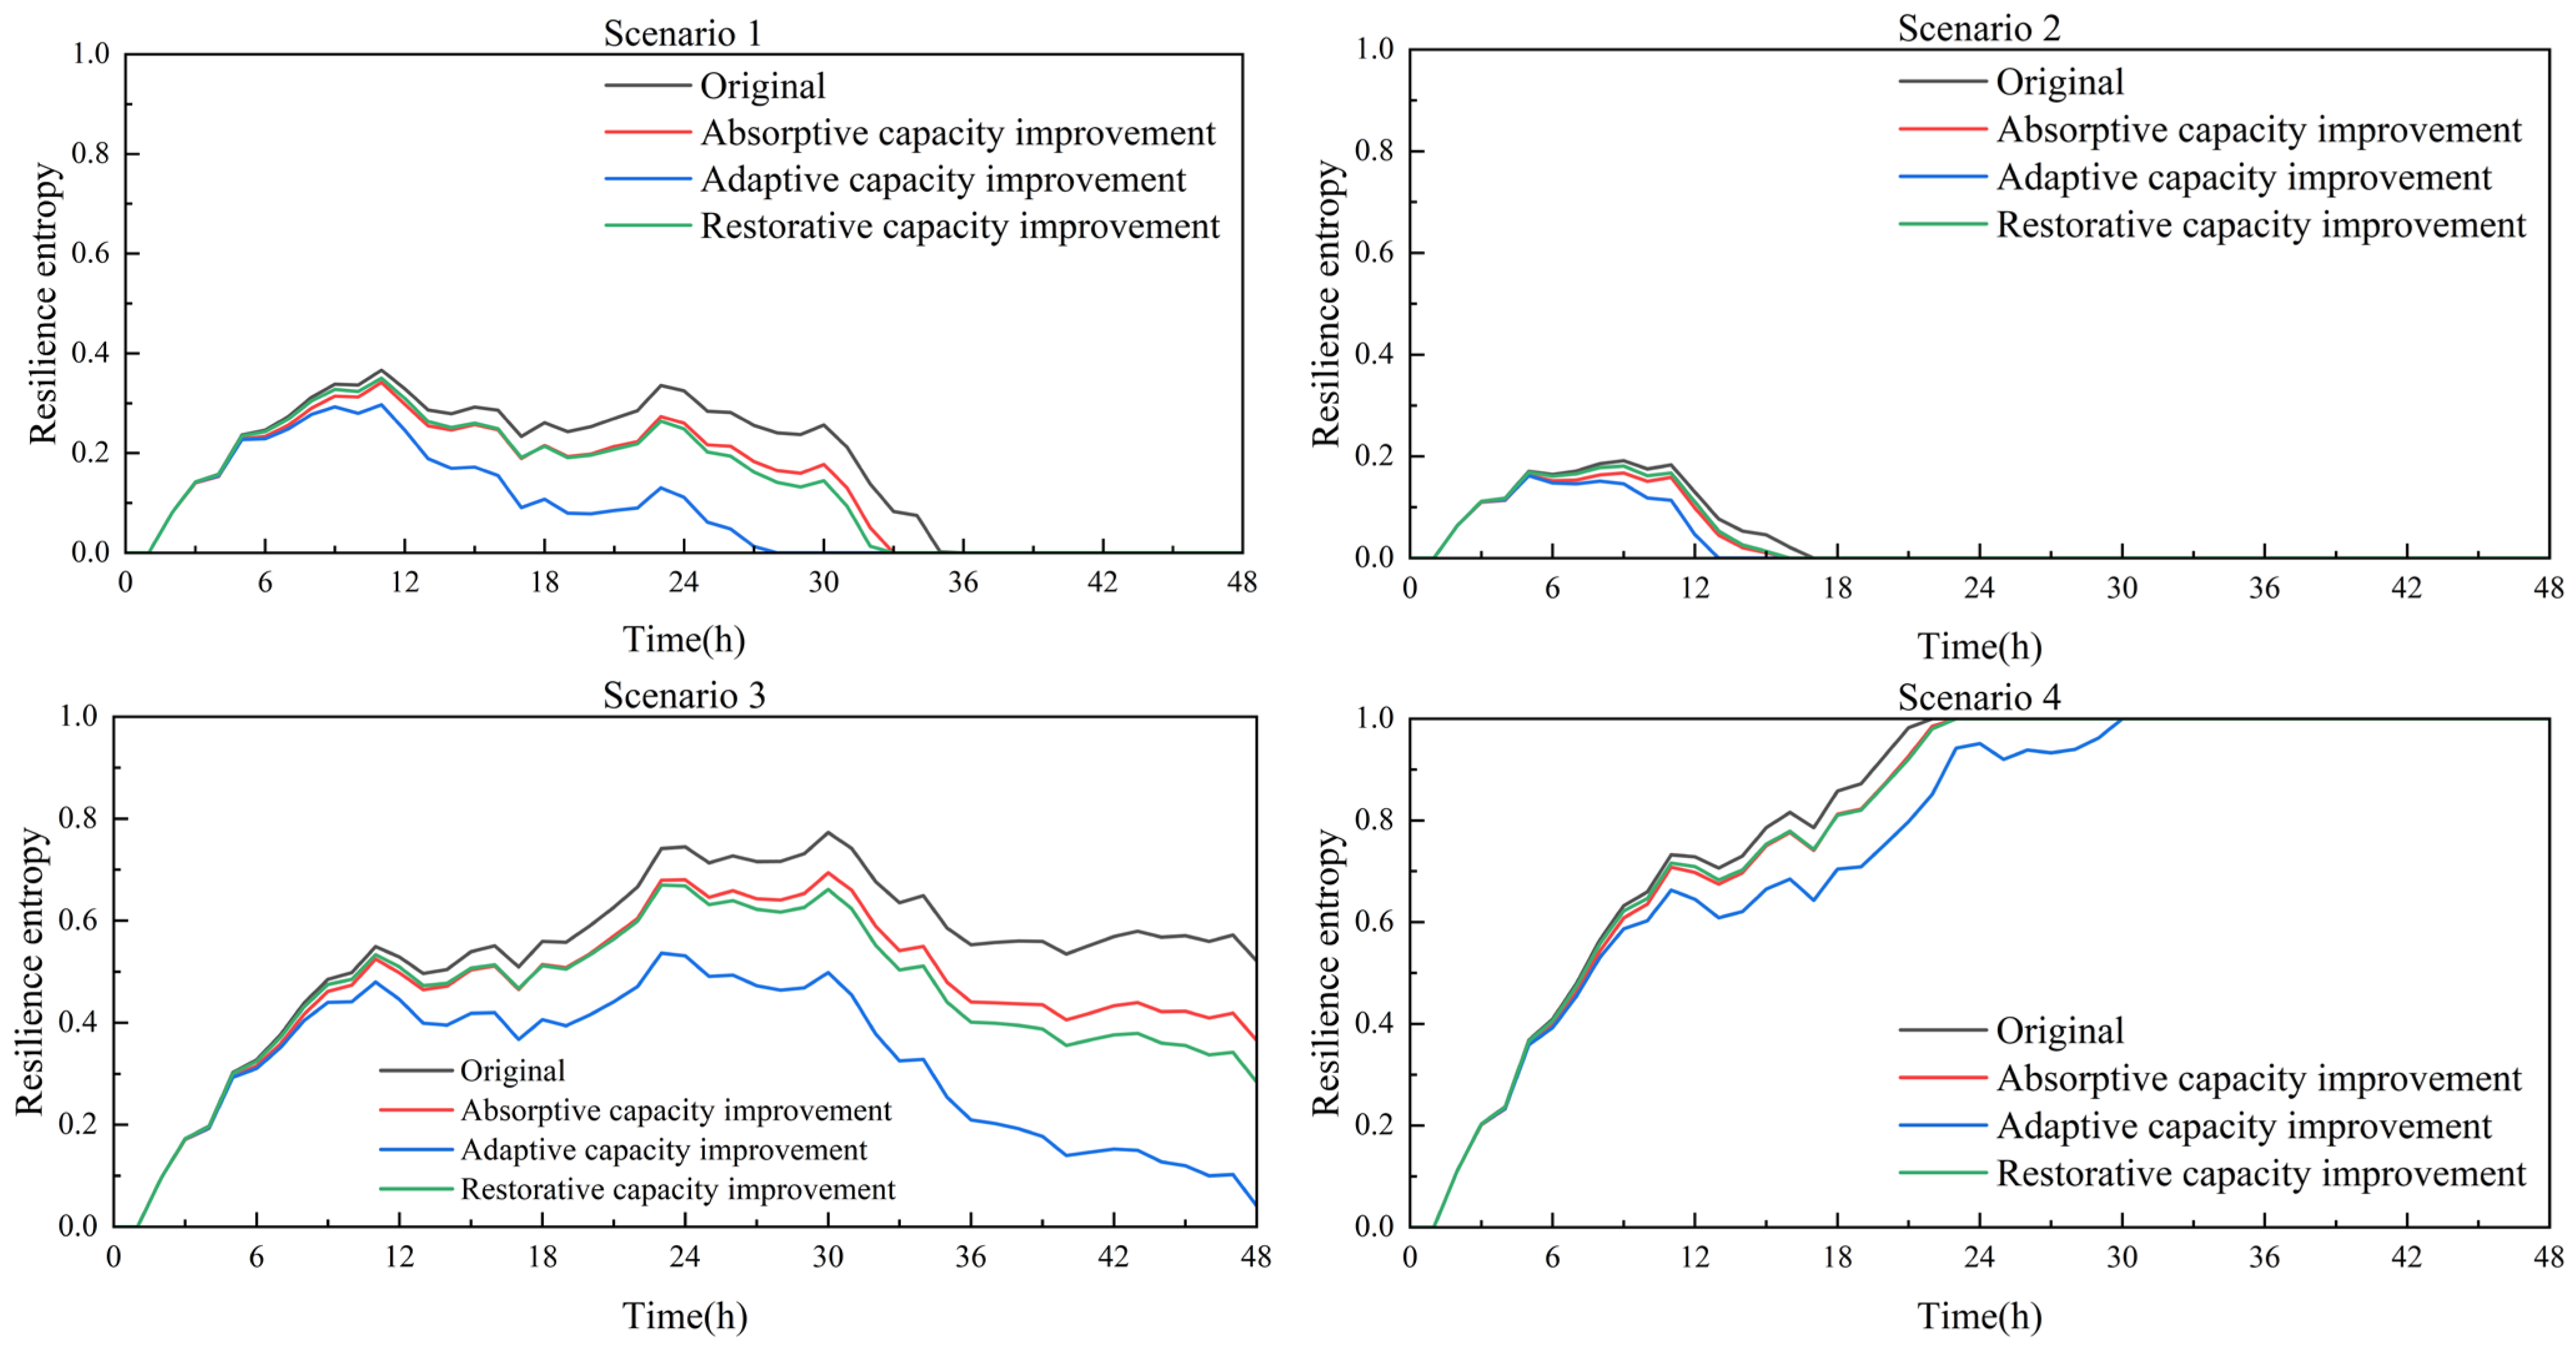
4.2.1. Simulation Results under Scenario 1

The specific SD equation values of the external environmental disturbance events SD(t) and internal system disturbance events SE(t) under Scenario 1 are shown in Equations (16) and (17), respectively.
S D ( t ) = R A N D O M   U N I F O R M   ( 0.073 ,   0.285 ,   0 )
S E ( t ) = R A N D O M   U N I F O R M   ( 0.116 ,   0.451 ,   0 )
These parameters were substituted into the SD model of the safety resilience evolution of the MHCTS, and the change curves of the resilience entropy and disturbance entropy with time (the values of “Resilience entropy” and “Disturbance entropy” of the SD model shown in Figure 4, similarly hereinafter) under the action of a basic disturbance are shown in Figure 5.
As shown in Figure 5, when a disturbance event occurs, the system entropy increases, and the negative entropy flow caused by the absorptive capacity cannot offset the influence of the positive entropy flow of the disturbance event. The entropy gradually increased and reached an extreme value at approximately 11 h, corresponding to the occurrence of accidents in the actual scene. Subsequently, owing to the influx of the negative entropy flow of the adaptive capacity, the entropy value remained relatively flat under the joint action of the two negative entropy flows and entered the adaptation stage. The system maintains the normal operation of certain functions in a dangerous or abnormal state. At 24 h, the addition of the negative entropy flow of the restorative capacity made the negative entropy flow in the system sufficient to offset the influence of the positive entropy flow introduced by disturbance events. The entropy value of the system decreases and tends to be ordered, and the system recovers to normal operation; however, the system still requires a long time to recover its normal state.

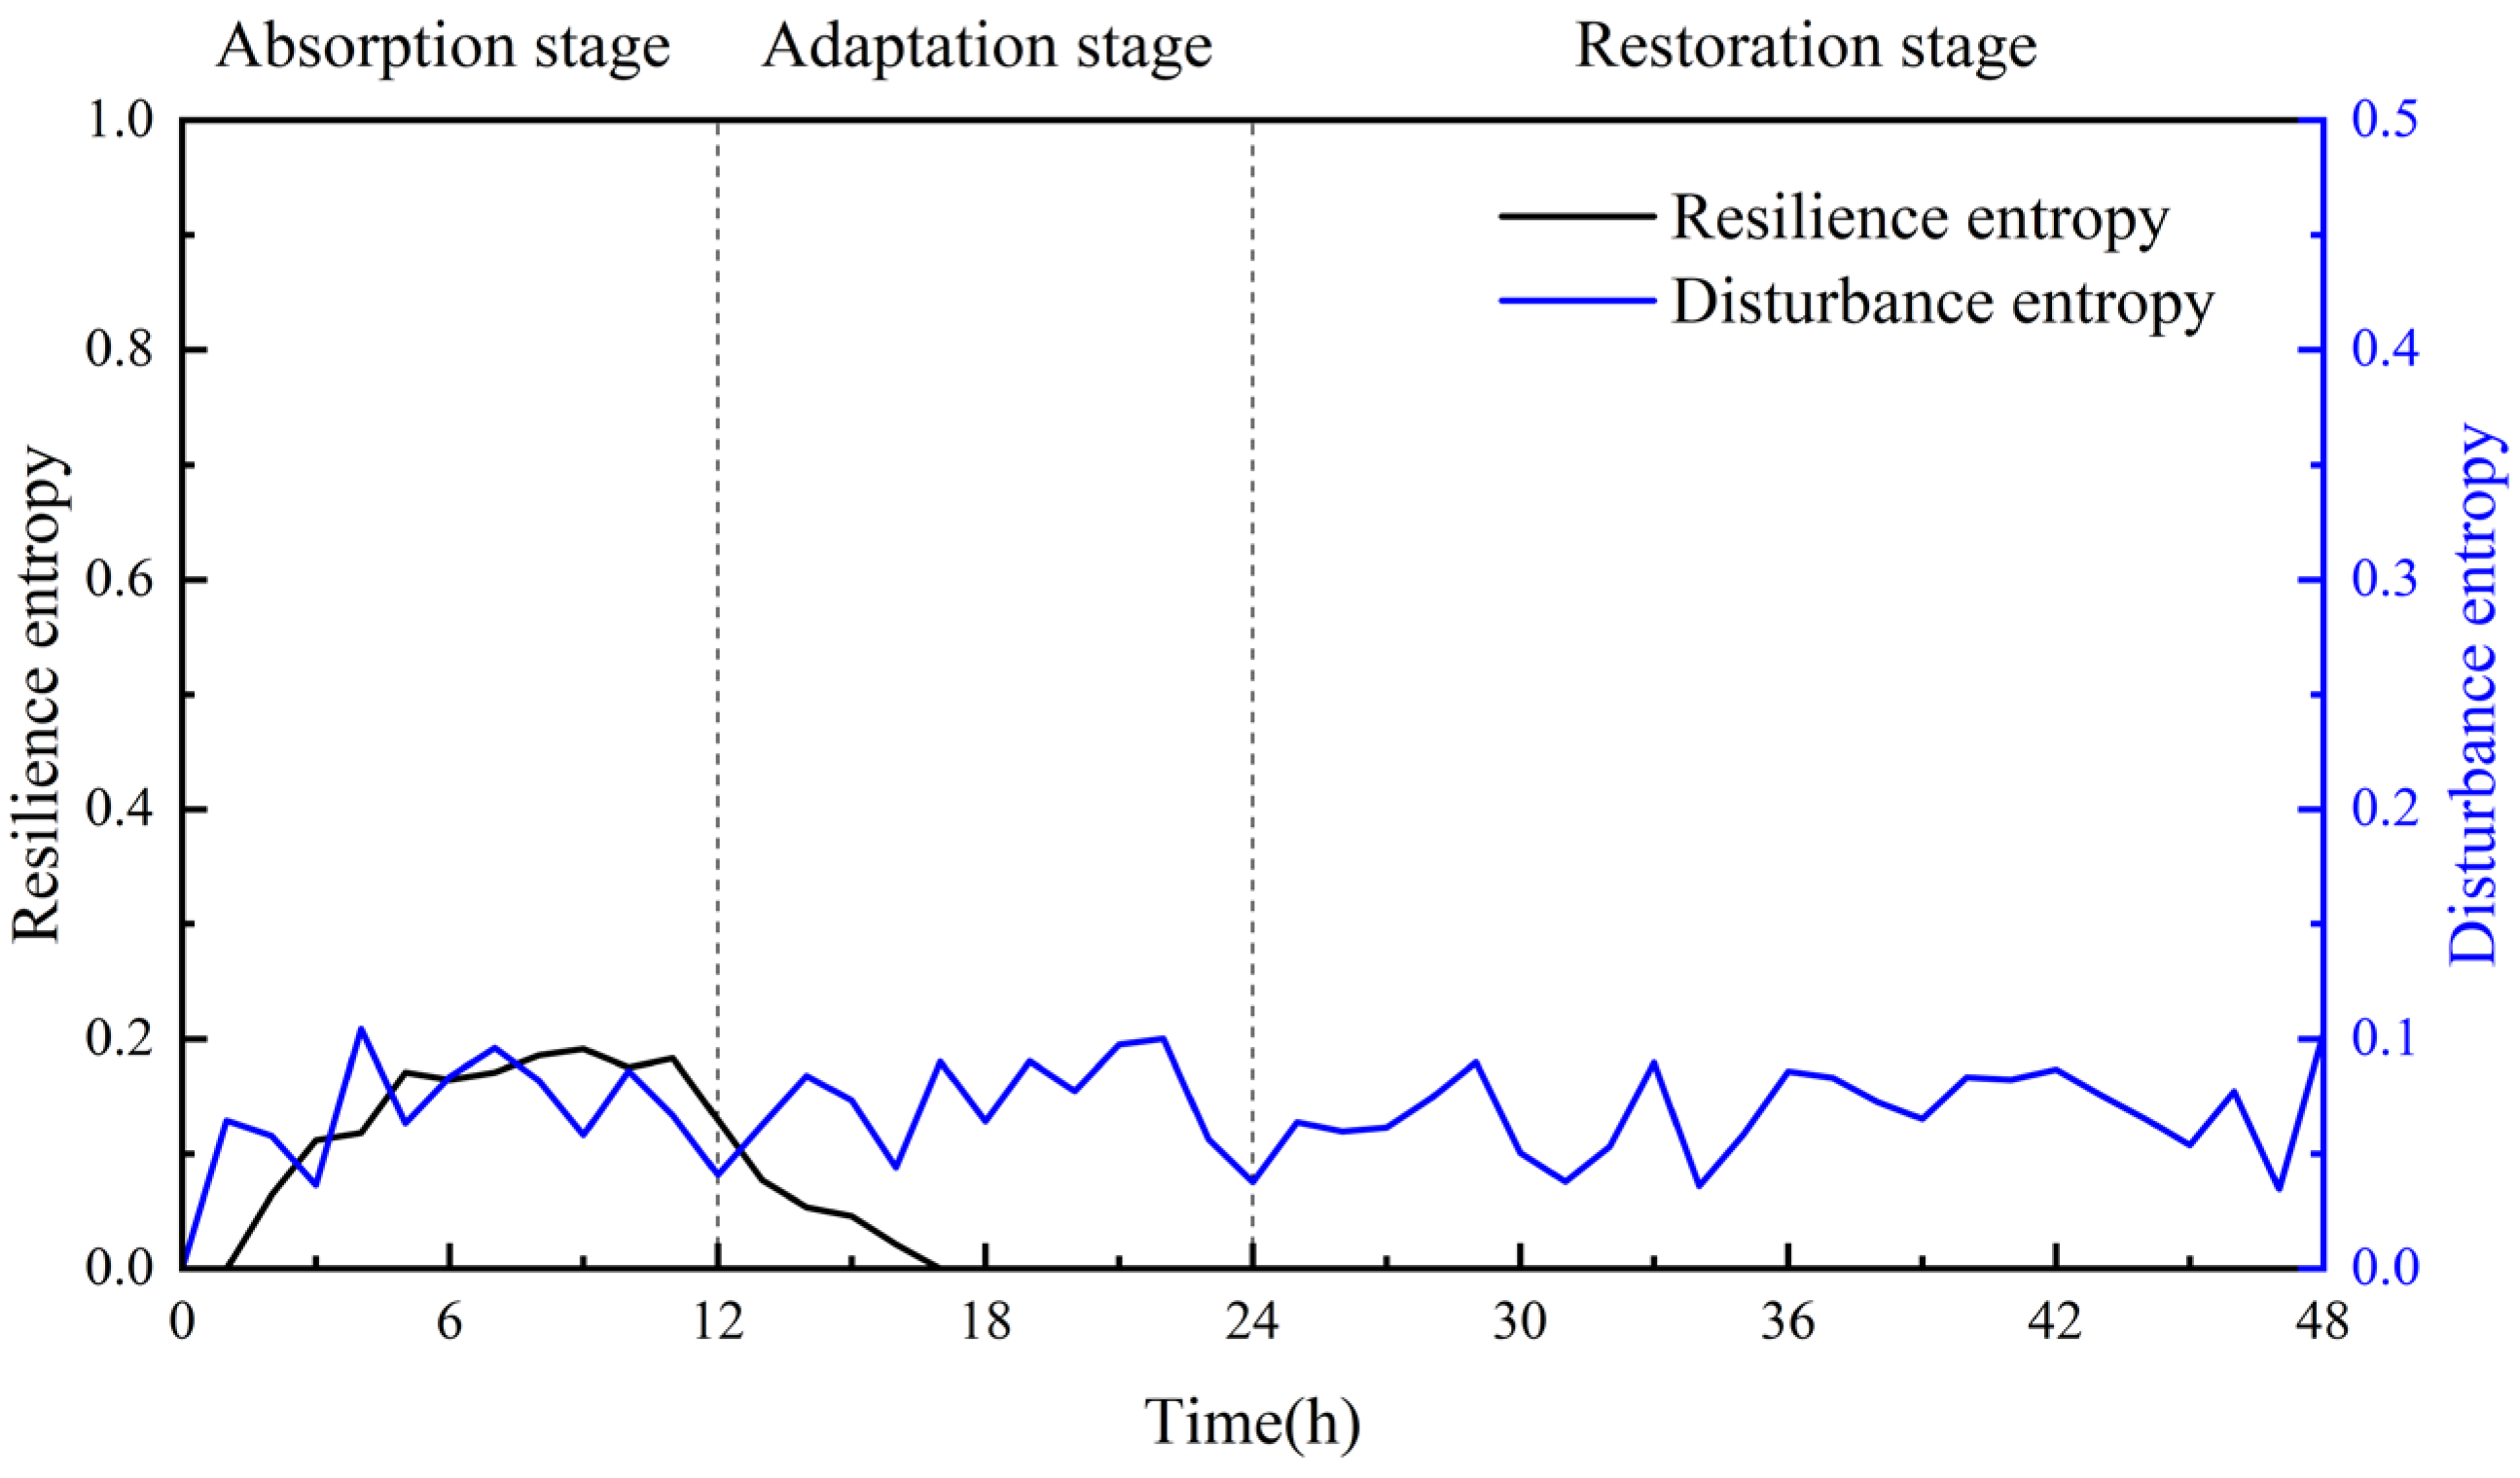
4.2.2. Simulation Results under Scenario 2

According to Scenario 2, the values of the external environmental and internal system disturbances are modified, and the modified equations are shown in Equations (18) and (19), respectively.
S D ( t ) = R A N D O M   U N I F O R M   ( 0.058 ,   0.228 ,   0 )
S E ( t ) = R A N D O M   U N I F O R M   ( 0.093 ,   0.361 ,   0 )
Under the action of a weak disturbance, the time-change curve of the resilience entropy and disturbance entropy simulated is shown in Figure 6.
As shown in Figure 6, for weak disturbance events, the absorptive capacity alone was sufficient to control the influence of the disturbance events within a small range. With the injection of negative entropy flow of the adaptive capacity, the system can quickly return to the normal state. In the actual scene, the crew’s navigation technology and safety awareness, as well as the ship’s hardware facilities and equipment, are sufficient to mitigate and eliminate the impact and loss caused by weak disturbance events on the MHCTS, and the normal operation is recovered.

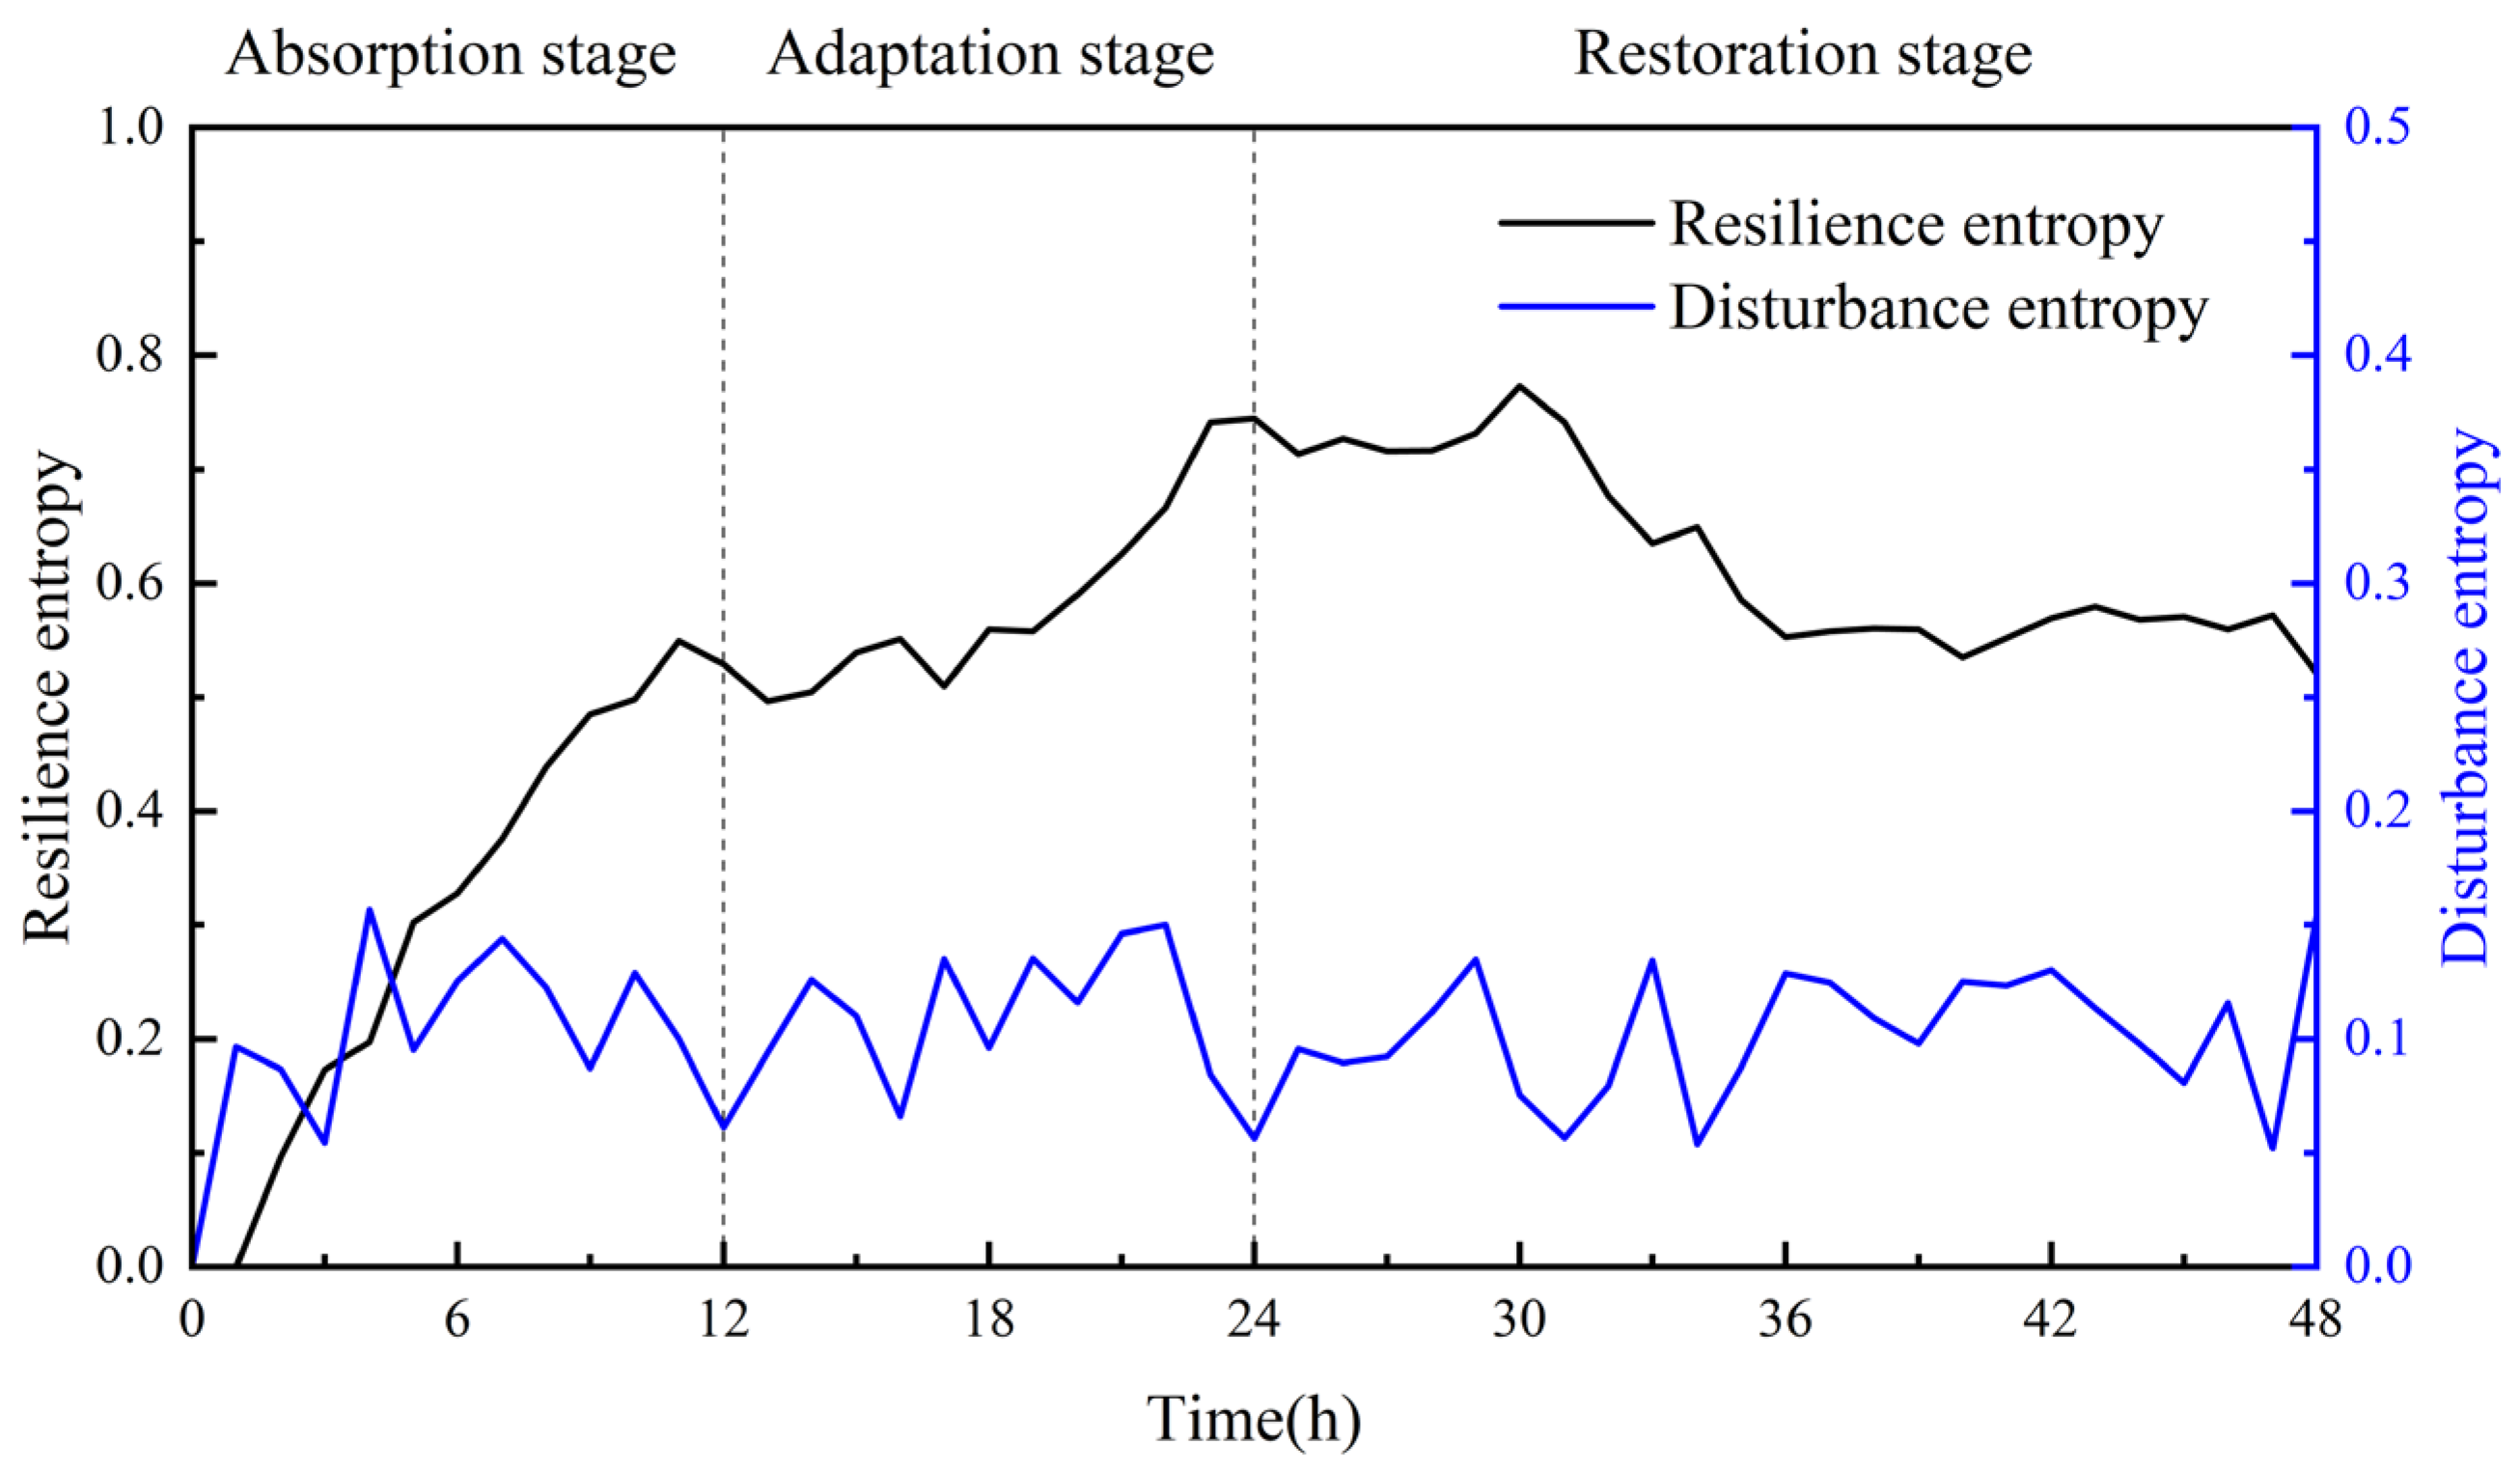
4.2.3. Simulation Results under Scenario 3

The values of the SD equation of the two types of disturbance events are shown in Equations (20) and (21).
S D ( t ) = R A N D O M   U N I F O R M   ( 0.087 ,   0.342 ,   0 )
S E ( t ) = R A N D O M   U N I F O R M   ( 0.139 ,   0.541 ,   0 )
Under the action of a strong disturbance, the change curve of the resilience entropy and disturbance entropy with time simulated is shown in Figure 7.
In Scenario 3, the intensity of the disturbance events increased, and a large number of positive entropies flowed into the system. Although the negative entropy flow of the absorptive capacity has a countereffect, the entropy value of the system increases rapidly. The influx of adaptive capacity slows down the entropy increase process until the addition of restorative capacity causes the negative entropy flow of the resilience capacity to offset the positive entropy flow of some of the disturbance events, and the entropy of the system slowly decreases. Finally, the entropy value of the system remained at approximately 0.55, and the system could not recover the normal state within the simulation time. Corresponding to the actual scene, the MHCTS is affected by the disturbance events, and some functions of the system are lost and cannot be restored to the operating state from before the disturbance events; examples include damage to the cargo hold and loss of power.

4.2.4. Simulation Results under Scenario 4

The equation values of the external environment disturbance events and internal system disturbance events under extremely strong disturbances were adjusted to Equations (22) and (23).
S D ( t ) = R A N D O M   U N I F O R M   ( 0.102 ,   0.399 ,   0 )
S E ( t ) = R A N D O M   U N I F O R M   ( 0.162 ,   0.631 ,   0 )
The adjusted values were substituted into the SD model of the safety resilience evolution of the MHCTS for the simulation, and the change curve of the resilience entropy and disturbance entropy with time was obtained, as shown in Figure 8.
As shown in Figure 8, a large amount of positive entropy flows rapidly into the system, resulting in a rapid increase in the system entropy. The maximum entropy value calculated in Equation (2) is 1; therefore, the system entropy value accumulated to 1 is regarded as system destruction. When the disturbance intensity encountered by the system is too strong, the effect of the resilience capacity can only slow down the speed of the entropy increase; the effect is not evident, and the system eventually tends to be destroyed; examples include ship fracture, capsizing, and sinking.

4.3. Analysis of Contribution Degree and Strategies for Improving Safety Resilience of MHCTS

4.3.1. Analysis of Contribution Degree and Strategy of Resilience Capacity for System Safety Resilience Improvement

To analyze the contribution degree of absorptive, adaptive, and restorative capacities to safety resilience improvement and propose reasonable resilience improvement strategies, the method of controlling single-factor variables is adopted to simulate the entire disturbance process; that is, the absorptive, adaptive, and restorative capacities are increased by 20% in the four experimental scenarios. The time-change curve of the system safety resilience entropy for the four scenarios under the three improvement strategies is shown in Figure 9.
It is evident from Figure 9 that under different intensity disturbance scenarios, the improvements in absorptive, adaptive, and restorative capacities all make positive contributions to the improvement in the safety resilience of the MHCTS. Among them, the improvement in adaptive capacity had the most significant effect on the safety resilience of the MHCTS. In terms of the absorptive capacity and restorative capacity, it can be observed that the improvement of absorptive capacity has an evident effect on the safety resilience of the MHCTS in the early stage of disturbance events, which is suitable for hazardous chemical transportation ships with frequent rapid disturbance events such as collisions, fires, and explosions. In contrast, improving the restorative capacity has a more evident and better effect on the improvement of system safety resilience in the later stage of disturbance events. It is more effective in hazardous chemical transportation ships dealing with long-duration accidents, such as stranding and reef collisions, caused by continuous bad weather and channel environments. According to the analysis of the contribution degree of resilience capacity to system safety resilience improvement, some suggestions are put forward for improving the safety resilience of the MHCTS from the aspects of technology, management, and operation:
(1) In terms of management, the ship company should formulate targeted safety training and drill activities to improve the safety awareness and emergency response ability of the crew and equip the ship with sufficient life-saving equipment and fire-fighting equipment to protect the lives and property of the crew, while reducing possible disasters and losses. This can effectively improve the absorptive, adaptive, and restorative capacities of the MHCTS.
(2) More advanced technologies, such as intelligent perception and data analysis, should be used to accurately detect and analyze the ship’s environment, conditions, and data and promptly detect and warn of potential dangers. This can better improve the absorptive and adaptive capacities of the MHCTS.
(3) In the daily operation, the crew must strictly abide by the relevant operating procedures, including navigation procedures, cargo handling procedures, and emergency procedures. This has a significant effect on the improvement of absorptive and restorative capacities of the MHCTS.

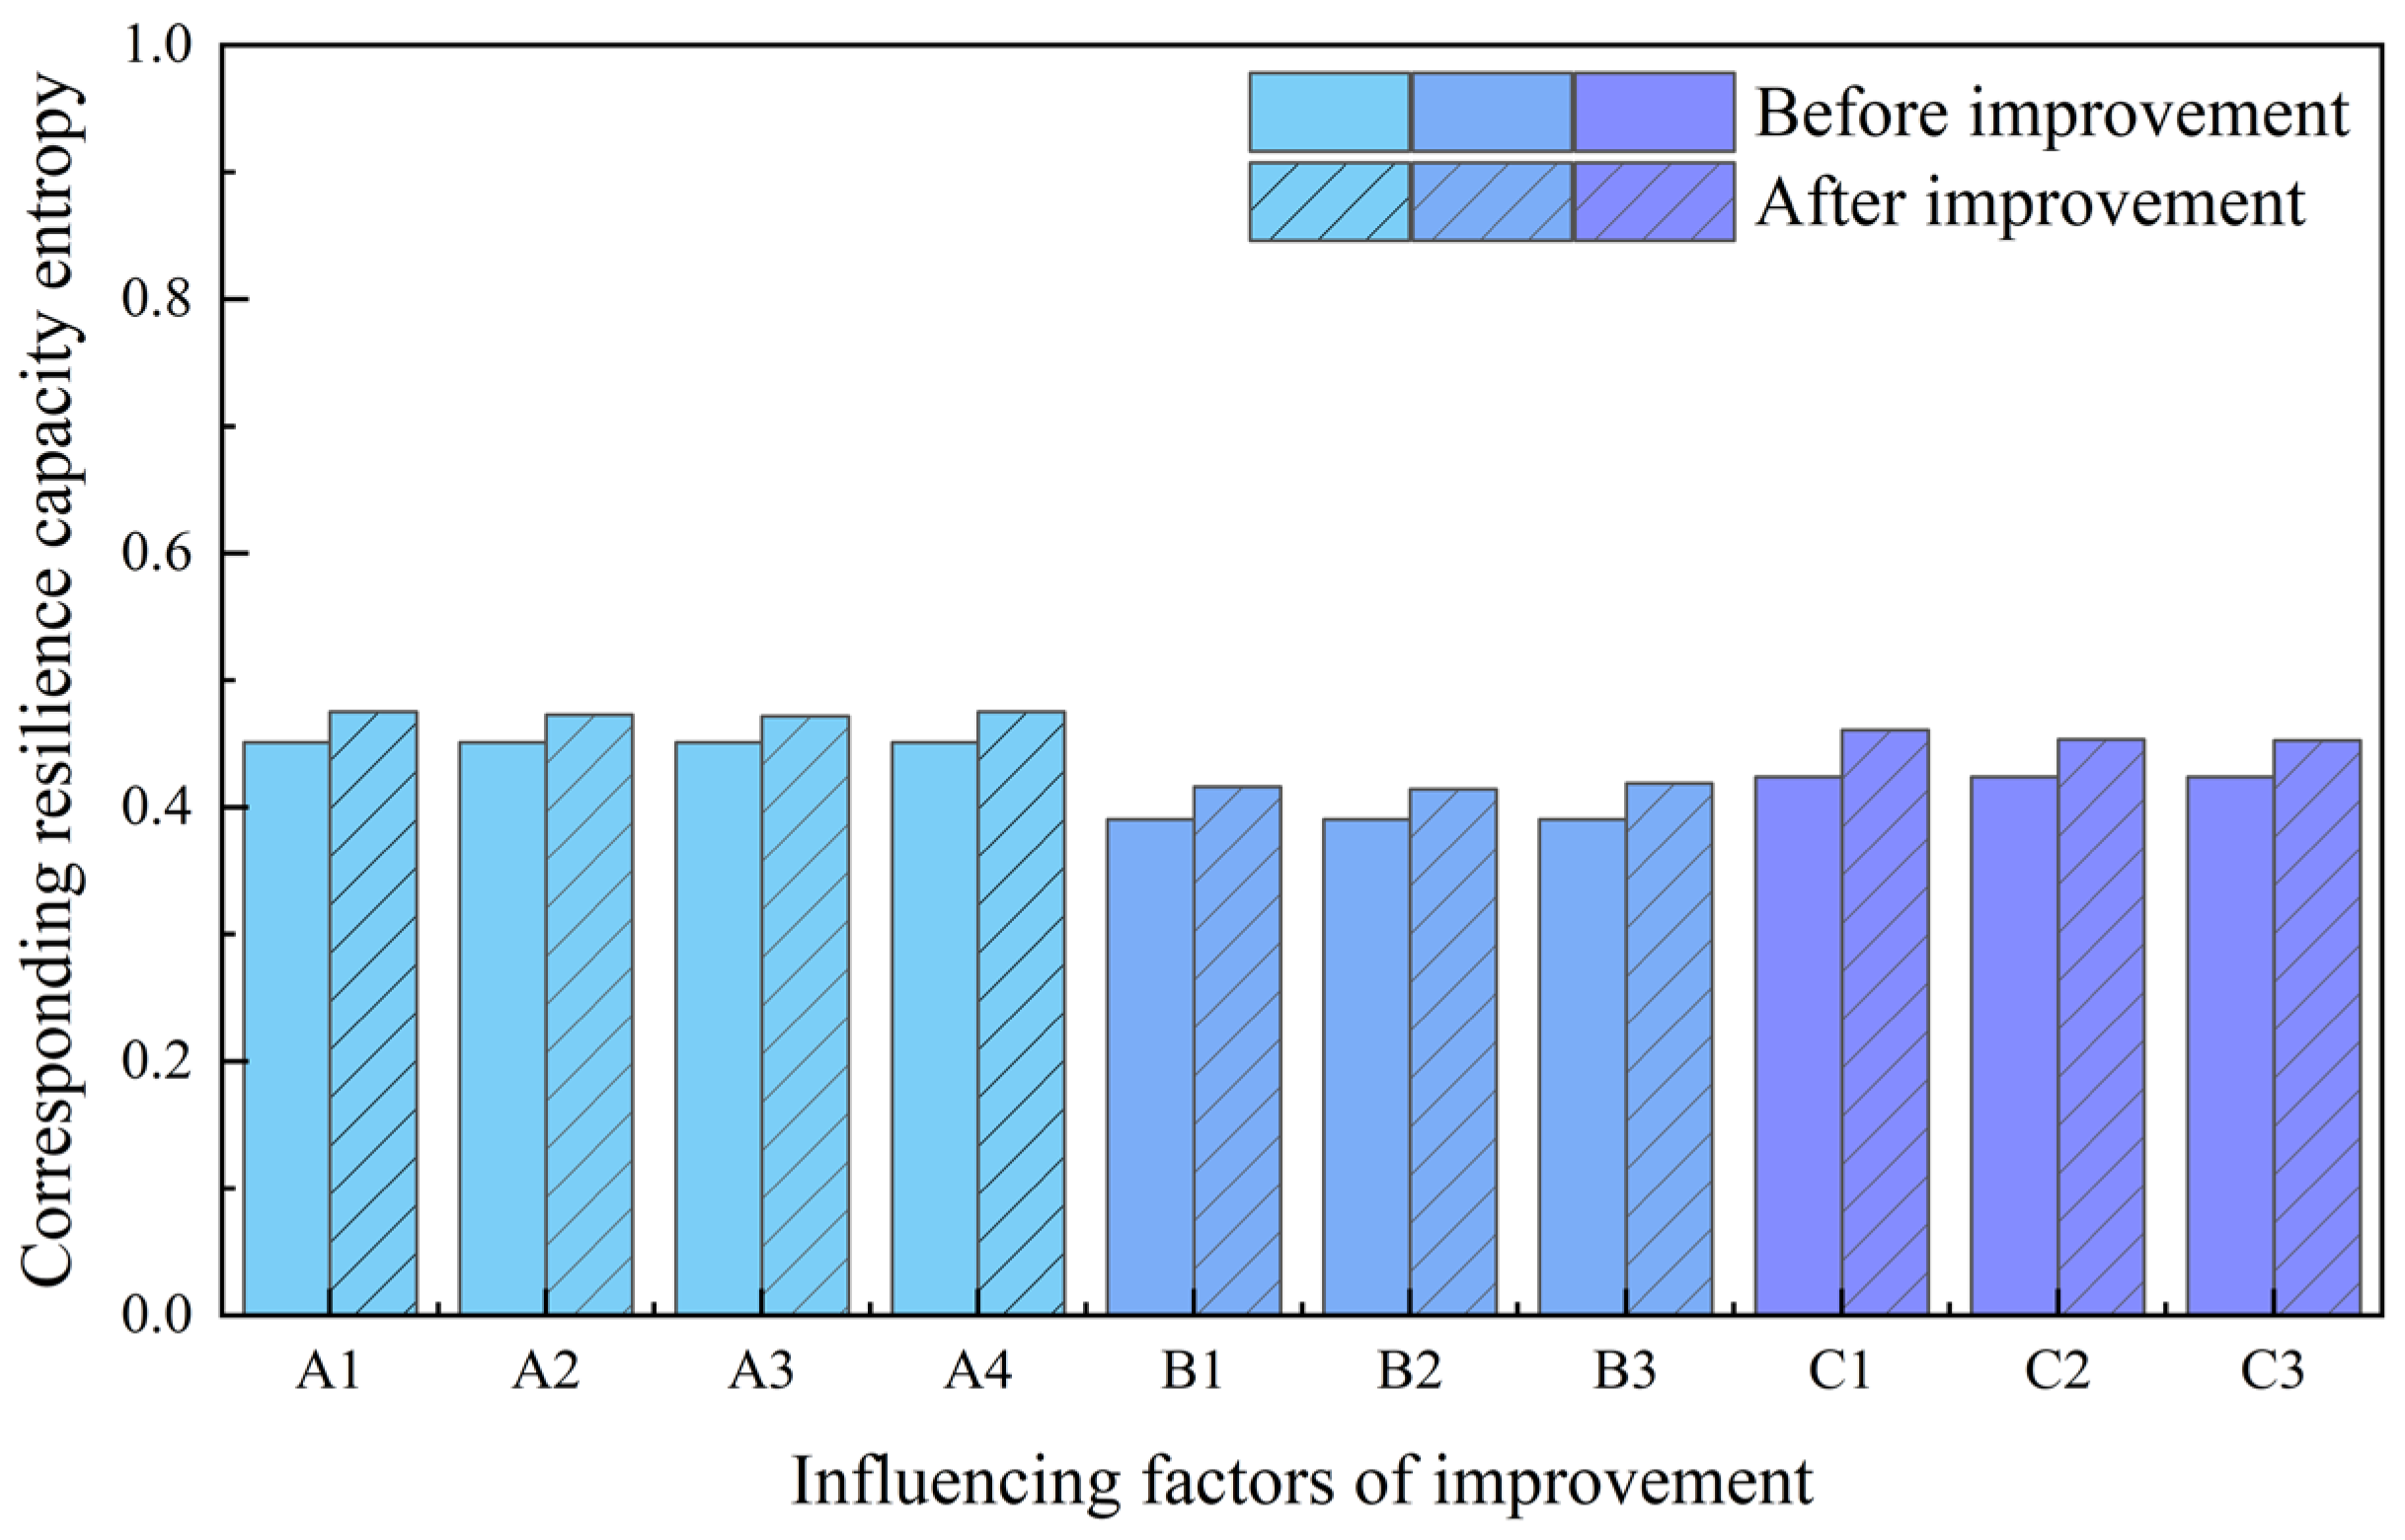
4.3.2. Analysis of Contribution Degree and Strategy of Influencing Factors for Resilience Capacity Improvement

To further analyze the sensitivity of different influencing factors to the absorptive, adaptive, and restorative capacities of resilience, the SD model of the safety resilience evolution of the MHCTS and the method of controlling single-factor variables were still used to change the values of each influencing factor under the three types of resilience capacity to obtain simulation results. After the entropy of each influencing factor was increased by 20%, a before and after comparison of the entropy of the three types of resilience capabilities was obtained by simulating the entire disturbance process, as shown in Figure 10. It is found from Figure 10 that the corresponding resilience capacity has little difference under different promotion strategies; therefore, the contribution degree was analyzed by calculating the corresponding improvement degree of the resilience capacity under different promotion strategies. The calculation results are listed in Table 6, and the values in the table are rounded.
As shown in Table 6, for the factors influencing absorptive capacity, the improvement of routine maintenance of ship hardware facilities and equipment (A1) and safety supervision and management (A4) have a more evident effect on the improvement of absorptive capacity, whereas the improvement of hazardous chemical cargo management ability (A3) has the least effect. In the actual transportation process, ship maintenance should be performed properly to eliminate potential safety hazards as soon as possible. Regulators should also strengthen safety supervision and management to ensure the safety and reliability of ship navigation and prevent situations that may lead to accidents in a timely manner.
Among the factors influencing adaptive capacity, the physiological and psychological states of the crew (B3) showed the highest degree of improvement. Paying attention to the physiological and psychological states of the crew can effectively reduce the occurrence of unsafe behaviors and help the crew make correct judgments in time and adopt appropriate measures to reduce accident losses after the occurrence of disturbance events. Spare facilities and equipment (C2) are the most important factors affecting the improvement effect of restorative capacity, which can supplement the loss of system function caused by disturbance events in a timely manner and is an effective way for the MHCTS to recover to a normal state from disturbance events.

5. Conclusions

In this study, based on the dissipative structure theory and SD, the safety resilience evolution of the MHCTS was modeled and simulated, and the resilience capacity under disturbance events with different intensities was quantitatively evaluated. Summarizing the research work, the following conclusions can be drawn:
The safety resilience of the MHCTS can be characterized by the entropy flow, and with the increase in the intensity of disturbance events, more positive entropy is injected into the system. As a result, the entropy growth rate of the system is accelerated in the absorption stage, the entropy value is kept at a high level in the adaptation stage, and the system needs more time to recover to a normal state, or even cannot recover to a normal state.
The resilience capacity of the MHCTS can reduce or offset the influence of positive entropy flow caused by disturbance events by introducing negative entropy flow, that is, strengthening the absorptive, adaptive, and restorative capacities and their influencing factors, into the system in time.
Different improvement strategies for safety resilience in the MHCTS have different effects. In terms of the three stages of resilience, the improvement in adaptive capacity has the most significant effect on safety resilience. From the perspective of the improvement degree of influencing factors on the resilience capacity of each stage, the physiological and psychological states of the crew (B3) have the most obvious improvement effect on the resilience capacity in its recovery stage.
The determination of the influencing factors and entropy calculation of system safety resilience are limited by data acquisition and existing theoretical research, which may affect the reliability and validity of the research results. In the future, factors influencing system safety resilience will be considered more comprehensively, and additional accident data on MHCTS will be incorporated. The improvement strategies for system safety resilience proposed in this study are general, and more accurate, detailed, and comprehensive enhancement strategies will be the focus of future research.

Author Contributions

Conceptualization, C.Y.; methodology, X.S.; software, X.S.; validation, C.Y., X.S., Q.Z., L.N. and S.M.; formal analysis, X.S.; investigation, X.S.; resources, C.Y.; data curation, L.N.; writing—original draft preparation, X.S.; writing—review and editing, C.Y., Q.Z. and S.M.; visualization, Q.Z.; supervision, C.Y.; project administration, C.Y.; funding acquisition, C.Y. All authors have read and agreed to the published version of the manuscript.

Funding

This research was funded by the National Natural Science Foundation of China under Grant 51404052, the Liaoning Economic and Social Development Research Project of 2024 under Grant 2024lslybkt-077, and the Liaoning Provincial Department of Education Scientific Research Fund Project (General Project) under Grant LJKZ0049.

Institutional Review Board Statement

Not applicable.

Informed Consent Statement

Not applicable.

Data Availability Statement

The data that support the findings of this study are available from the corresponding authors upon reasonable request.

Conflicts of Interest

The authors declare no conflicts of interest.

References

  1. Cimellaro, G.P.; Reinhorn, A.M.; Bruneau, M. Framework for analytical quantification of disaster resilience. Eng. Struct. 2010, 32, 3639–3649. [Google Scholar] [CrossRef]
  2. Xu, Y.T.; Fang, Y.M. Quantitative Analysis of seismic resilience of residential functions in urban areas. Urban Archit. 2021, 18, 157–162. [Google Scholar]
  3. Zhang, J.X.; Wang, H.M.; Huang, J.; Wang, Y.X.; Liu, G.F. A study on dynamic simulation and improvement strategies of flood resilience for urban road system. J. Environ. Manag. 2023, 344, 118770. [Google Scholar] [CrossRef] [PubMed]
  4. Xu, H.; Li, Y.; Deng, N.H.; Du, L. Resilience modelling of complex urban public space system. Syst. Eng. Theory Pract. 2022, 42, 1964–1978. [Google Scholar]
  5. Fang, Y.M. Research on Quantitative Analysis and Promotion Strategy of Seismic Resilience of Urban Regional Disaster Response System. Master’s Thesis, Wuhan University of Technology, Wuhan, China, 2021. [Google Scholar]
  6. Yang, Q.; Zhang, Y.N.; Zhou, Y.Q.; Bai, L.B. A review of complex network theory and its application in the resilience of public transportation systems. China J. Highw. Transp. 2022, 35, 215–229. [Google Scholar]
  7. Henry, D.; Ramirez-Marquez, J.E. Generic metrics and quantitative approaches for system resilience as a function of time. Reliab. Eng. Syst. Saf. 2012, 99, 114–122. [Google Scholar] [CrossRef]
  8. Zhu, W.; Zhao, P.X.; Wang, Y.F. Modeling on the quantitative resilience assessment of urban emerging community based on systematics. In Proceedings of the 4th ACM SIGSPATIAL International Workshop on Safety and Resilience, Seattle, WA, USA, 6–9 November 2018; pp. 1–8. [Google Scholar]
  9. Li, J.M.; Qi, J.; Zheng, Z.Y.; Li, H.X. Transportation system of dangerous chemicals at sea based on entropy and dissipative structure theory. J. Dalian Marit. Univ. 2013, 39, 85–88. [Google Scholar]
  10. Chen, C.; Yang, M.; Reniers, G. A dynamic stochastic methodology for quantifying HAZMAT storage resilience. Reliab. Eng. Syst. Saf. 2021, 215, 107909. [Google Scholar] [CrossRef]
  11. Ma, J.J.; Chen, G.H.; Zeng, T.; Zhou, L.X.; Zhao, J.; Zhao, Y.F. Methodology for resilience assessment of oil pipeline network system exposed to earthquake. Sustainability 2023, 15, 972. [Google Scholar] [CrossRef]
  12. Kammouh, O.; Gardoni, P.; Cimellaro, G.P. Probabilistic framework to evaluate the resilience of engineering systems using Bayesian and dynamic Bayesian networks. Reliab. Eng. Syst. Saf. 2020, 198, 106813. [Google Scholar] [CrossRef]
  13. Jiang, S.Q.; Yang, L.; Cheng, G.; Gao, X.M.; Feng, T.; Zhou, Y.Y. A quantitative framework for network resilience evaluation using Dynamic Bayesian Network. Comput. Commun. 2022, 194, 387–398. [Google Scholar] [CrossRef]
  14. Vairo, T.; Pettinato, M.; Reverberi, A.P.; Milazzo, M.F.; Fabiano, B. An approach towards the implementation of a reliable resilience model based on machine learning. Process Saf. Environ. Protect. 2023, 172, 632–641. [Google Scholar] [CrossRef]
  15. Ding, Y.T.; Chen, S.; Zheng, Y.L.; Chai, S.L.; Nie, R. Resilience assessment of China’s natural gas system under supply shortages: A system dynamics approach. Energy 2022, 247, 123518. [Google Scholar] [CrossRef]
  16. Badr, A.; Li, Z.; El-Dakhakhni, W. Dynamic resilience quantification of hydropower infrastructure in multihazard environments. J. Infrastruct. Syst. 2023, 29, 04023012. [Google Scholar] [CrossRef]
  17. Li, Z.S.; Li, N.; Cimellaro, G.P.; Fang, D.P. System dynamics modeling-based approach for assessing seismic resilience of hospitals: Methodology and a case in China. J. Manag. Eng. 2020, 36, 04020050. [Google Scholar] [CrossRef]
  18. Wang, H.Y. Research on Safety Evaluation of Hazardous Chemicals Terminal Operation System Based on Dissipation and Entropy Theory. Master’s Thesis, Shandong Jiaotong University, Jinan, China, 2018. [Google Scholar]
  19. Li, J.M.; Song, S.Z.; Diao, Y.L.; Guan, W.; Yan, H.R. Study on safety of dangerous chemical marine transportation system based on entropy theory. J. Shanghai Marit. Univ. 2015, 36, 8–14. [Google Scholar]
  20. Li, J.M. Study on the Safety of Maritime Dangerous Chemical Transportation Based on Dissipative Theory. Ph.D. Thesis, Dalian Maritime University, Dalian, China, 2014. [Google Scholar]
  21. Vugrin, E.D.; Warren, D.E.; Ehlen, M.A. A resilience assessment framework for infrastructure and economic systems: Quantitative and qualitative resilience analysis of petrochemical supply chains to a hurricane. Process. Saf. Prog. 2011, 30, 280–290. [Google Scholar] [CrossRef]
  22. Maritime Safety Administration of the People’s Republic of China. Accident Investigation Reports. Available online: https://www.msa.gov.cn/page/outter/shiguyufang.jsp (accessed on 13 March 2023).
  23. German Federal Bureau of Investigation for Maritime Accidents. Investigation Reports. Available online: https://www.bsu-bund.de/EN/Publications/Unfallberichte/Unfallberichte_node.html (accessed on 29 March 2023).
  24. UK Marine Accident Investigation Branch. Marine Accident Investigation Branch Reports. Available online: https://www.gov.uk/maib-reports (accessed on 10 April 2023).
  25. USA National Transportation Safety Board. Investigation Reports. Available online: https://www.ntsb.gov/investigations/AccidentReports/Pages/Reports.aspx (accessed on 20 April 2023).
  26. Japan Transportation Safety Board. Marine Accident/Incident Investigation Reports. Available online: https://www.mlit.go.jp/jtsb/marrep.html (accessed on 3 May 2023).
  27. French Marine Casualties Investigation Board. Reports Published. Available online: https://www.bea-mer.developpement-durable.gouv.fr/reports-published-a586.html?lang=fr (accessed on 6 May 2023).
  28. Hu, S.P.; Liu, W.H.; Han, B.; Wu, Z.D. Dynamics simulation on safety resilience for Ro-Pas ship navigating in strait considering factor mutations. J. Saf. Environ. 2023, 23, 3408–3418. [Google Scholar]
  29. Ma, D.H. Study on Resilience of Maritime Dangerous Chemicals Transportation System. Master’s Thesis, Dalian Maritime University, Dalian, China, 2022. [Google Scholar]
  30. Wang, Q.F. New progress in theory and methodology of system dynamics. J. Syst. Manag. 1995, 2, 6–12. [Google Scholar]
  31. Brtis, J.S.; McEvilley, M.A.; Pennock, M.J. Resilience requirements patterns. In Proceedings of the INCOSE 31st Annual International Symposium, Honolulu, HI, USA, 17–22 July 2021; Volume 31, pp. 570–584. [Google Scholar]
Figure 1. Dissipative structure characteristics of MHCTS.
Jmse 12 00340 g001
Figure 2. Entropy flow mechanism diagram of safety resilience evolution of MHCTS.
Jmse 12 00340 g002
Figure 3. Stock and flow diagram example.
Jmse 12 00340 g003
Figure 4. SD model of safety resilience evolution of MHCTS.
Jmse 12 00340 g004
Figure 5. Change curve of resilience entropy with time under Scenario 1.
Jmse 12 00340 g005
Figure 6. Change curve of resilience entropy with time under Scenario 2.
Jmse 12 00340 g006
Figure 7. Change curve of resilience entropy with time under Scenario 3.
Jmse 12 00340 g007
Figure 8. Change curve of resilience entropy with time under Scenario 4.
Jmse 12 00340 g008
Figure 9. Change curve of resilience entropy with time under three different improvement strategies in four scenarios.
Jmse 12 00340 g009
Figure 10. Comparison of entropy values of corresponding resilience capacity before and after improvement.
Jmse 12 00340 g010
Table 1. Influencing factors of safety resilience of MHCTS.
Target LayerClassificationInfluencing FactorsDescription
MHCTS’s safety
resilience (R)
Absorptive
capacity (A)
Routine maintenance of ship hardware facilities and equipment (A1)To ensure that the ship is in a good technical and seaworthy state, the crew should execute routine maintenance of the ship’s hardware facilities and equipment and eliminate various faults.
Crew safety awareness (A2)Crew should have the awareness of paying attention to safety guarantees, protecting themselves, others, and ship safety.
Hazardous chemical cargo management ability (A3)Crew of hazardous chemical transportation ships need to receive strict training and education, understand the characteristics and operation points of hazardous chemicals, and be familiar with various emergency treatment measures.
Safety supervision and management (A4)Relevant departments should execute safety supervision and management on ships to ensure the normal operation of the ship safety management system.
Adaptive
capacity (B)
Crew knowledge and skills (B1)Strong knowledge and skills can help crew deal with emergencies and make correct judgments and implement emergency measures in a timely manner.
Monitoring and alarm system (B2)The monitoring and alarm system can transmit the cargo hold situation to the on-duty personnel in time and promptly discover and report the accident.
Crew physiological and psychological state (B3)The crew’s physiological and psychological state has a great influence on the handling of maritime accidents, and a poor physiological and psychological state easily causes fatigue and slow response.
Restorative
capacity (C)
Hardware facilities and equipment failure repair capability (C1)The repair and upgrading of damaged ship hardware facilities and equipment is an important measure for system recovery.
Spare facilities and equipment (C2)The disturbance events may cause damage to facilities and equipment and affect system functions; hence, spare facilities and equipment can replace damaged facilities in time and quickly restore system functions.
Emergency rescue measures (C3)Take proper emergency rescue measures to reduce system losses and restore system functions.
External
environmental disturbance events (D)
Poor visibility (D1)Visibility is limited owing to rain, fog, haze, sandstorms, and other reasons, which makes it difficult for the ship to look out, locate, navigate, and judge.
Big storm (D2)When the ship is navigating in heavy wind and waves, the ship will shake, slow down, and have an unstable course and resultant handling difficulties.
High temperature (D3)High temperature will accelerate the evaporation, decomposition, oxidation, and spontaneous combustion of hazardous chemicals, which are prone to combustion and explosion accidents.
High navigable density of the channel (D4)During the navigation of a ship with hazardous chemicals, several other ships will be around; the distance between ships is close, and the maneuvers are frequent.
Complex reef condition (D5)The presence of the reefs on the route of the ship is complex, resulting in narrow and curved waterways, limited water depth, rapid tidal currents, and frequent accidents of stranding and reef collision.
Internal system disturbance events (E)Unsafe behavior of the crew (E1)The crew’s improper behavior violates laws and regulations or safety operation rules and regulations, thereby endangering the safety of the ship.
Ship hardware facilities and equipment damaged (E2)Damage of ship hardware facilities and equipment owing to technical failure, equipment aging, bad weather, etc.
Improper management of hazardous chemical cargo (E3)Improper storage of hazardous chemical cargo, illegal operations, and non-compliance with requirements during transportation.
Insufficient ship supervision and management (E4)Insufficient ship supervision and management by relevant departments caused insufficient staffing, unlicensed navigation, etc.
Table 2. Prior probability and entropy value of influencing factors of safety resilience of MHCTS.
Influencing FactorEntropy Codep(x1)p(x2)Entropy ValueInfluencing FactorEntropy Codep(x1)p(x2)Entropy Value
A1SA10.7950.2050.5069D1SD10.1100.8900.3455
A2SA20.3810.6190.6645D2SD20.1520.8480.4268
A3SA30.9100.0900.3036D3SD30.0100.9900.0538
A4SA40.8290.1710.4581D4SD40.1710.8290.4581
B1SB10.5290.4710.6915D5SD50.0860.9140.2925
B2SB20.9240.0760.2694E1SE10.7380.2620.5750
B3SB30.8710.1290.3837E2SE20.2330.7670.5433
C1SC10.5100.4900.6930E3SE30.0900.9100.3036
C2SC20.8760.1240.3744E4SE40.1760.8240.4656
C3SC30.8900.1100.3455
Table 3. Weight of influencing factors of safety resilience of MHCTS.
ClassificationWeight CodeWeightInfluencing FactorWeight CodeWeight
AWA0.0749A1WA10.2386
A2WA20.1623
A3WA30.3369
A4WA40.2622
BWB0.2659B1WB10.1863
B2WB20.4413
B3WB30.3723
CWC0.2252C1WC10.1935
C2WC20.3942
C3WC30.4124
DWD0.3357D1WD10.1912
D2WD20.1674
D3WD30.2764
D4WD40.1583
D5WD50.2067
EWE0.0983E1WE10.2012
E2WE20.2162
E3WE30.3296
E4WE40.2530
Table 4. Main variables and equations in the SD model of safety resilience evolution of MHCTS.
Variable NameVariable Equation
Absorption entropy I N T E G   ( A b s o r p t i o n   e n t r o p y   i n c r e m e n t A b s o r p t i o n   e n t r o p y   d e c r e m e n t )
Absorption entropy increment S A 1 W A 1 + S A 2 W A 2 + S A 3 W A 3 + S A 4 W A 4 - RANDOM   UNIFORM 0 ,   S A 1 W A 1 + S A 2 W A 2 + S A 3 W A 3 + S A 4 W A 4 ,   0
Absorption entropy decrement D E L A Y 1 I   ( A b s o r p t i o n   e n t r o p y   i n c r e m e n t     A t t e n u a t i o n   d e g r e e   o f   a b s o r p t i o n   e n t r o p y ,   1 ,   0 )
Adaptation entropy I N T E G   ( A d a p t i o n   e n t r o p y   i n c r e m e n t A d a p t i o n   e n t r o p y   d e c r e m e n t )
Adaptation entropy increment ( S B 1 W B 1 + S B 2 W B 2 + S B 3 W B 3 ) R A N D O M   U N I F O R M   ( 0 ,   S B 1 W B 1 + S B 2 W B 2 + S B 3 W B 3 ,   0 )
Adaptation entropy decrement D E L A Y 1 I   ( A d a p t i o n   e n t r o p y   i n c r e m e n t     A t t e n u a t i o n   d e g r e e   o f   a d a p t i o n   e n t r o p y ,   1 ,   0 )
Restoration entropy I N T E G   ( R e s t o r a t i o n   e n t r o p y   i n c r e m e n t     R e s t o r a t i o n   e n t r o p y   d e c r e m e n t )
Restoration entropy increment ( S C 1 W C 1 + S C 2 W C 2 + S C 3 W C 3 ) R A N D O M   U N I F O R M   ( 0 , S C 1 W C 1 + S C 2 W C 2 + S C 3 W C 3 ,   0 )
Restoration entropy decrement D E L A Y 1 I   ( R e s t o r a t i o n   e n t r o p y   i n c r e m e n t         A t t e n u a t i o n   d e g r e e   o f   r e s t o r a t i o n   e n t r o p y ,   1 ,   0 )
Disturbance entropy I N T E G   ( D i s t u r b a n c e   e n t r o p y   i n c r e m e n t     D i s t u r b a n c e   e n t r o p y   d e c r e m e n t )
External environmental disturbance events R A N D O M   U N I F O R M   ( 0 , S D 1 W D 1 + S D 2 W D 2 + S D 3 W D 3 + S D 4 W D 4 + S D 5 W D 5 ,   0 )
Internal system disturbance events R A N D O M   U N I F O R M   ( 0 ,   S E 1 W E 1 + S E 2 W E 2 + S E 3 W E 3 + S E 4 W E 4 ,   0 )
Disturbance entropy increment E x t e r n a l   e n v i r o n m e n t a l   d i s t u r b a n c e     e v e n t s     W D + i n t e r n a l   s y s t e m   d i s t u r b a n c e   e v e n t s     W E
Disturbance entropy decrement D E L A Y 1 I   ( D i s t u r b a n c e   e n t r o p y   i n c r e m e n t     A t t e n u a t i o n   d e g r e e   o f   d i s t u r b a n c e   e n t r o p y ,   1 ,   0 )
Resilience entropy I N T E G   ( R e s i l i e n c e   e n t r o p y   i n c r e m e n t R e s i l i e n c e   e n t r o p y   d e c r e m e n t )
Resilience entropy increment D i s t u r b a n c e   e n t r o p y
Resilience entropy decrement IF   THEN   ELSE   ( Resilience   entropy   >   0 ,   Absorption   entropy       W A + DELAY 1 I   ( Adaptation   entropy     W B ,
Adaptation   entropy   delay   time ,   0 ) + DELAY 1 I   ( Restoration   entropy     W C ,   Restoration   entropy   delay   time ,   0 ) ,   0 )
Table 5. The setting and description of four experimental scenarios.
Scenario KeyScenario NameScenario ValueScenario Description
Scenario 1Basic DisturbancesThe disturbance entropy is the function calculation result of the entropy of the influencing factors of the disturbance event calculated from the accident statistics in Table 2.Basic disturbance events will cause the functional level of ships with hazardous chemicals to decrease, but most ships can recover to the normal state by virtue of their own resilience, such as a grounding accident for which the ship floating can be helped by throwing cargo and wind disasters that can be resisted by mooring.
Scenario 2Weak DisturbancesBased on this basic disturbance, the disturbance entropy was reduced by 20%.Corresponding to the disturbance events that cause little or even negligible damage to the function of hazardous chemical transportation ships in an actual scene, it does not constitute personal casualties and property losses, such as navigation in heavy fog weather and collisions with small fishing boats.
Scenario 3Strong DisturbancesBased on the basic disturbance, the disturbance entropy increased by 20%.Disturbance events causing large casualties and property loss were simulated. In this situation, ships need to rely on external forces to cope with the disturbance, such as large-scale hazardous chemical cargo explosion accidents and power loss caused by engine failure.
Scenario 4Extremely Strong DisturbancesBased on the basic disturbance, the disturbance entropy increased by 20%.Disturbance events cause heavy casualties and property losses, such as ships experiencing cabin water and loss of buoyancy owing to external or unknown reasons, resulting in ship sinking, capsizing, and total loss.
Table 6. Improvement degree and ranking of influencing factors on the corresponding resilience capacity.
Influencing Factors of ImprovementEntropy Value of
Corresponding Resilience Capacity before
Improvement
Entropy Value of
Corresponding Resilience Capacity after
Improvement
Improvement DegreeRanking
A10.45120.47545.36%1
A20.47284.78%3
A30.47174.53%4
A40.47525.32%2
B10.39060.41646.60%2
B20.41446.09%3
B30.41927.31%1
C10.42410.46106.32%3
C20.45376.96%1
C30.45266.72%2
Disclaimer/Publisher’s Note: The statements, opinions and data contained in all publications are solely those of the individual author(s) and contributor(s) and not of MDPI and/or the editor(s). MDPI and/or the editor(s) disclaim responsibility for any injury to people or property resulting from any ideas, methods, instructions or products referred to in the content.

