Article

Study on the Sealing Performance of Flexible Pipe End-Fittings Considering the Creep Behavior of PVDF Material at Different Temperatures

1
State Key Laboratory of Structural Analysis for Industrial Equipment, School of Ocean Science and Technology, Dalian University of Technology, Panjin 124221, China
2
Ningbo Research Institute, Dalian University of Technology, Ningbo 315016, China
3
State Key Laboratory of Structural Analysis for Industrial Equipment, Department of Engineering Mechanics, Dalian University of Technology, Dalian 116024, China
*
Author to whom correspondence should be addressed.
J. Mar. Sci. Eng. 2024, 12(12), 2362; https://doi.org/10.3390/jmse12122362
Submission received: 22 November 2024 / Revised: 13 December 2024 / Accepted: 20 December 2024 / Published: 22 December 2024
(This article belongs to the Section Ocean Engineering)

Abstract

:
Current designs of sealing systems for non-adhesive flexible pipe end-fittings primarily address short-term loading conditions, often overlooking the creep behavior of polyvinylidene fluoride (PVDF) and the material used in the sealing layer. Over time, the creep of PVDF, particularly at elevated temperatures, can lead to excessive reduction in the sealing layer’s thickness, thereby compromising the sealing performance of the end-fittings. In this study, to address the creep-related issues in the sealing layer, the compression and compression creep tests of PVDF were conducted at different temperatures to establish the material’s elastic-plastic constitutive relationship and develop a creep constitutive model based on the time hardening model. Using the pressure penetration method within ABAQUS software, a two-dimensional axisymmetric finite element model of the end-fitting sealing system was constructed, incorporating the effects of internal fluid pressure. This model was employed to analyze the sealing performance while accounting for the materials’ creep behavior across varying temperature conditions. The results demonstrate that creep in the sealing layer occurs predominantly in the early stages post-installation. Furthermore, the API 17J standard, which stipulates that reduction in sealing layer thickness should not exceed 30%, is found to be conservative at high temperatures. In these conditions, although the thickness reduction exceeds 30% before the maximum contact pressure drops below the fluid pressure, no fluid leakage is observed. Thus, in the initial phase following installation, especially at elevated temperatures, monitoring for potential leakage is critical. This research is the first to quantify the long-term impact of PVDF creep behavior on the sealing performance of flexible pipe end-fittings through comprehensive experiments and simulation analysis. The findings provide both a theoretical foundation and practical guidance for enhancing the long-term sealing performance of flexible pipe end-fittings.

1. Introduction

In deep-sea oil and gas development, non-bonded flexible pipelines are extensively used to accommodate the relative motion between offshore floating structures and subsea equipment, as well as to withstand environmental loads induced by wind and wave currents [1]. These non-bonded flexible pipelines are connected to various structural layers of the pipeline through end-fittings. The carcass and compressive armor layers are fixed with equally spaced bolts, while the tensile armor layer is connected using epoxy adhesive. While maintaining the structural integrity of the connection, ensuring the sealing performance of the end-fitting becomes a critical design objective [2]. The sealing system of end-fitting operates by the extrusion of a wedge-shaped metal seal into the polymer material layer, generating contact pressure to achieve the sealing effect [3], as depicted in Figure 1. However, end-fittings are often subjected to prolonged in-situ operation, and as the temperature increases, the polymer material layer experiences creep deformation, leading to excessive thickness reduction. This, in turn, compromises the sealing performance of the end-fitting.
The research on the sealing problem of flexible pipe end-fittings has primarily focused on numerical analysis at this stage. Fernando and Karabelas conducted experimental modeling of the sealing system, using ultrasonic technology to measure the contact pressure. They established a finite element model to validate the effectiveness of the finite element method. However, their work only confirmed the model’s accuracy in calculating the contact pressure between two contacting surfaces, without considering the long-term effects of sustained loading on the contact pressure of polymer materials [5]. Li et al. developed a finite element model of the sealing system using the nonlinear finite element software ABAQUS 6.14. They adjusted key parameters, such as the degree of press-in and the angle of the end-fitting body, to analyze their effects on the sealing system [6]. Zhou et al. investigated the sealing performance of various seal ring shapes, finding that wedge-shaped rings outperformed O-rings by minimizing gaps in the grooves, thus enhancing the system’s sealing capability. The pressure distribution along the contact path becomes complex when the fluid inside the pipe comes into direct contact with the wedge-shaped seal [7]. Chen at al. established a two-dimensional axisymmetric finite element model of the sealing system in the end fitting, while taking into account fluid pressure inside the pipeline using a pressure penetration method. The impact of stress relaxation on the sealing performance was then discussed [8].
Persson et al. [9] and Lorenz et al. [10,11] combined the seepage theory and contact mechanics to explore the sealing performance of rubber seals influenced by fluid action and surface roughness. Nowadays, most commercial finite element software includes pressure penetration algorithms. Slee et al. applied the pressure penetration algorithm in the finite element software to examine high-pressure sealing end-fitting design [12] and Gorash et al. employed the algorithm to study how fluid pressure affects the sealing performance [13]. Building on this, Tang et al. used finite element software to investigate the sealing performance of different structural forms under internal fluid pressure [14]. Saneian, M, & Bai, Y. identified two potential leak paths: between the barrier seal and the polymer barrier, and between the barrier seal and the body. To enhance the performance of metal seal rings under high pressure, sufficient compression on the polymer barrier is required [15].
Many previous studies have overlooked the viscoelastic properties of sealing layer materials, which are particularly significant in their creep behavior. Shen et al. investigated the effects of fluid temperature on the creep behavior of polymer layers in unbonded flexible pipes, noting that creep in polymer materials is time-dependent and often involves large nonlinear deformations [16]. De Lima et al. proposed an intrinsic formula for the creep aging of PA11, relating creep behavior to temperature, stress level, and Corrected Intrinsic Viscosity (CIV) and conducted a series of material tests to validate the formula [17]. Zhang et al. examined the creep mechanism in polymer liner layers through theoretical modeling and finite element simulation to understand the nonlinear mechanical behavior of the liner’s viscoelastic properties, though no compression creep tests were performed [18]. Amjadi et al. used the Findley power law and the time-stress superposition principle (TSS) to model nonlinear viscoelastic creep curves and conducted longer-term creep tests to verify the accuracy of short-term creep life predictions [19]. Spathis et al. presented a theoretical approach for predicting the creep rupture time of polymers and composites, considering viscoelastic behavior at small strains and viscoplastic behavior at higher stresses [20]. Lai et al. performed tensile creep tests on high-density polyethylene (HDPE) at different stress levels under ambient conditions, analyzing the effects of stress and physical aging on creep compliance [21]. Dargahi et al. focused on the nonlinear creep characteristics of extruded Poly (vinylidene fluoride-co-hexafluoropropylene) (PVDF-HFP) dominated by fl-phase polymorphs. The comparisons between the measured and modeled data conveyed the model effectiveness in describing the nonlinear creep characteristics of the polymer over the measured temperature and stress levels. Time temperature compliance master curves were consequently constructed using the developed generalized model, which in combination with the critical strain failure criterion provided the essential design data including the maximum allowable ranges of stress and temperature for achievement of 20 years creep life [22]. Zheng et al. used a finite element model, with modified Kachanov Rabotnov creep damage constitutive formulas, based on tests and numerical simulations. The relationship between the creep strain from uniaxial creep tests versus creep deflection from SPC tests and the stress applied in uniaxial creep tests versus the loads applied in SPC tests were established in this paper. Creep lives were evaluated using Larson-Miller parameter (LMP) for uniaxial creep tests and SPC tests. Very good agreement between the LPM of uniaxial creep tests and SPC tests was found [23].
Although previous research has elucidated the mechanism of polymer material behavior, it has not fully addressed how compression affects the mechanical properties of these materials over time. Additionally, these studies have largely focused on individual material parameters, without directly addressing the impact of creep on the sealing performance of flexible pipe end-fittings. In this study, we focus on the creep behavior of polymers, analyzing how their properties change under different conditions. By combining numerical simulations with a comprehensive study of the end-fitting sealing system, we draw conclusions that offer new insights and methodologies for the design of marine flexible pipe and cable end-fittings, with significant practical implications.
In summary, this study conducted compression and compression creep tests of PVDF materials at various temperatures to establish the material’s elastic plastic constitutive relationship and develop a creep constitutive model based on the time hardening model. Using ABAQUS software and the pressure penetration method to account for internal fluid pressure, we created a two-dimensional axisymmetric finite element model of the end-fitting sealing system. The study includes stress analysis, thickness reduction analysis, and sealing performance evaluation at different temperatures, considering the creep behavior of the sealing layer material.

2. Materials and Methods

Currently, the sealing layers of most flexible pipe end-fittings are made from polyvinylidene fluoride (PVDF), a polymer material known for its exceptional chemical stability, corrosion resistance, high-temperature tolerance, and electrical insulation properties. However, PVDF also exhibits a relatively obvious creep characteristic, undergoing continuous deformation under prolonged loading conditions. This behavior can compromise the sealing performance of the end-fitting, potentially leading to system failure and leakage. During operation, the sealing layer of the end-fitting is primarily subjected to compressive loads. Consequently, constitutive models derived from tensile tests are not sufficiently accurate for this application. Compression testing, therefore, provides a more accurate representation of the stress conditions experienced by the sealing layer in service.

2.1. PVDF Compression Test

The compression test uses a 30 t universal testing machine, as shown in Figure 2. The key mechanical parameters of the sealing layer material used in the flexible pipe end-fitting, as analyzed in this study, are presented in Table 1. Compression tests were conducted on PVDF material at various temperatures in accordance with the national standard “GB/T 1041-2008: Plastics—Determination of Compression Properties” [24]. These tests produced stress strain curves for PVDF, which are illustrated in Figure 3.

2.2. PVDF Compression Creep Test

The compression creep test uses an electronic creep rupture tester with a high temperature test chamber, as shown in Figure 4. The creep curve of PVDF was further evaluated following the national standard “GB/T 11546-2008: Determination of Creep Properties of Plastics” [25]. Tests were conducted at temperatures of 25 °C, 40 °C, and 55 °C, with a relative humidity of 51% RH. Standard samples, as specified in the plastic compression performance determination guidelines, were used for the experiments. Three different groups of compressive stress—35 MPa, 50 MPa, and 65 MPa—were applied, and the test duration was 24 h. During the testing process, an electronic creep rupture tester with a range of 50 KN and an accuracy of 0.5 was employed, as illustrated in Figure 5.
Using the aforementioned creep test method, the strain time variation curves (ε-t) of the PVDF material under different compressive loads were obtained. The results are presented in Figure 6. As time increases, the strain gradually increases and the increase gradually decreases and tends to be gentle. From the beginning of the experiment, the strain is recorded until the strain is almost no longer increased.
The macroscopic morphology of the compression creep specimens under varying loads is displayed in Figure 7. At a constant temperature of 55 °C, it is evident that as the applied stress increases, the bearing surface area of the compression creep specimens expands. This is accompanied by an increase in the cross-sectional area of the specimens and a corresponding rise in creep deformation. Summarily, the macroscopic morphology of the specimens at different temperatures is shown in Figure 8. Under a constant load of 65 MPa, the bearing surface area of the specimens increases with rising temperature, and this increase is more significant than the changes observed at different stress levels at the same temperature. With increasing temperature under the same stress conditions, the degree of softening intensifies, leading to greater deformation of the specimens.

3. Results and Discussion

3.1. Time Hardening Model
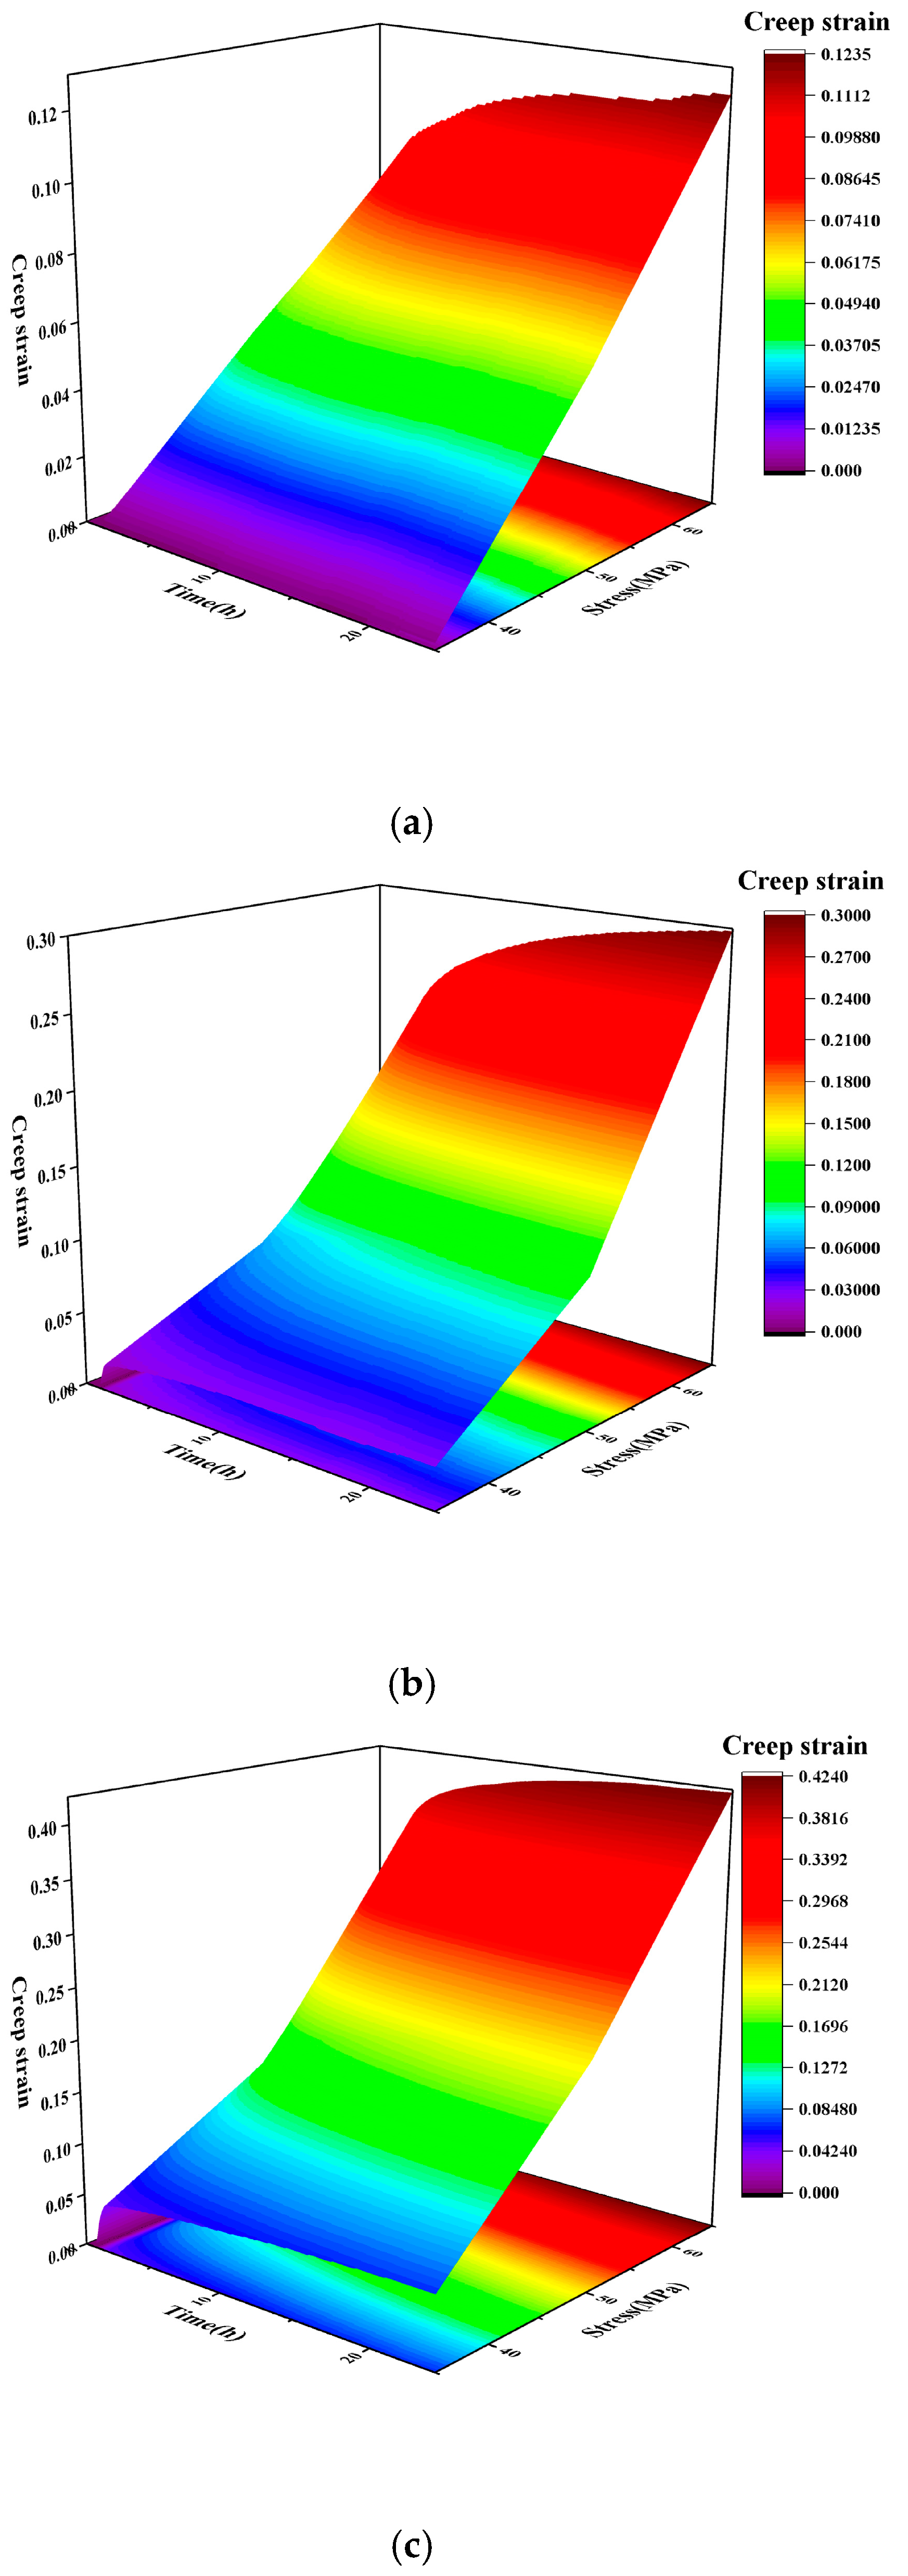
The creep models available in ABAQUS software include hyperbolic sine model, the strain hardening model, and the age hardening model. The selection of an appropriate creep model depends on the specific conditions under which it will be applied. Under constant temperature and load conditions, the age hardening model is typically more suitable.
It is important to note that the strain hardening model is generally applicable to short-term tests, as its creep deformation is independent of time. However, for equipment such as flexible pipe end-fittings, which are required to operate underwater for extended periods and have service lives exceeding 20 years, time has become the primary factor influencing structural creep. Therefore, the time hardening model is a more appropriate choice for structural creep analysis in such long-term operational scenarios. This model is particularly well-suited for applications requiring extended service life, providing more reliable and accurate predictions of creep behavior.
When selecting a creep model, it is essential to carefully consider factors such as temperature, load conditions, and the time span required for analysis. For end-fittings that must operate in underwater environments over long periods, employing the age hardening model offers a more reasonable and precise approach to structural creep analysis, aiding in design optimization and performance enhancement.
The formula of aging hardening theory can be expressed as: when the external temperature remains constant, the state function of the three parameters—strain ε, stress σ, and time t of the material is:
Φ ε · c , σ , t = 0
In the formula, ε c ˙ represents the strain rate at which the strain changes with time.
During the creep stage, the creep behavior is influenced by factors such as aging, diffusion, and recovery. Given the geometric similarity observed in the creep curve during the primary and secondary stages, the Formula (1) can be simplified to the following Formula (2):
ε c = f 1 ( σ ) f 2 ( t ) ,
in which f1(σ) represents the stress function and f2(t) is the time response function.
The stress function f1(σ) follows a power law, which can be expressed as:
f 1 ( σ ) = σ n
In the formula, n represents the exponential in the stress power function.
And the time response function f2(t) is expressed by Ω(t) function as follows:
f 2 ( t ) = Ω ( t ) = A m + 1 t m + 1
In the formula, A and m are the coefficients and exponential parameters of the time power function, respectively.
By substituting Formula (3) and Formula (4) into Formula (2), the mathematical expression for creep strain under the age hardening model can be derived as follows:
ε c = A m + 1 σ n t m + 1
In this context, εc is the creep strain.
Utilizing the compression creep test data and the stress strain curve of the material compression, the creep strain curve of the material can be calculated using Formula (6), as illustrated in Figure 9.
ε = ε e + ε c
In this formula, ε represents the total strain of the material, while εe denotes the elastic plastic strain of the material.
The data were grouped according to different stress levels at the same temperature, and a nonlinear surface fitting function module in Origin was employed for fitting calculations, as depicted in Figure 10. The R-square values of the fitting parameter results were 0.93, 0.90, and 0.94 (>0.8), respectively, indicating a satisfactory fitting performance. The constitutive model parameters for each group are presented in Table 2.

3.2. Creep Analysis

A typical sealing structure for non-adhesive flexible pipe end-fittings is illustrated in Figure 11. In this configuration, the thickness of the PVDF sealing layer is 14 mm. The material parameters for the metal sealing ring are provided in Table 3.
The Arbitrary Lagrangian Eulerian (ALE) adaptive grid method is employed, utilizing the axisymmetric quadrilateral element CAX4R, with a total of 10,553 elements and a refined mesh at the contact interface. To ensure the accuracy of the results, it is crucial that the meshing of the cross-sectional model maintains coordination in grid quality and displacement, thereby avoiding the formation of narrow and elongated units. Taking the third case as an example, the number of elements and the density of the mesh were evaluated for convergence, as shown in Figure 12. When the mesh density was doubled, the variation in the mechanical performance analysis results remained within 5%, demonstrating that the current meshing configuration meets the requirements for engineering analysis. Consequently, this meshing strategy will be utilized in the subsequent finite element analyses.
In the model, universal contact is defined across all contact surfaces. Hard contact simulates normal behavior between parts, while “penalty” friction models tangential behavior. Two static analysis steps, Initial and Step 1, are followed by a Visco analysis step (Step 2). In Initial, boundary conditions are applied, full fixing the flange and the carcass layer. In Step 1, the installation condition is simulated by compressing the end-fitting body onto the sealing ring. In Step 2, fluid pressure of 65 MPa is applied to simulate operational conditions, and the internal pipeline pressure acts on the sacrificial layer, also at 65 MPa, which plays a supporting role.
This analysis step also accounts for the creep characteristics of the PVDF sealing layer material using the above time hardening model. The Abaqus/Explicit algorithm is employed for calculations, where the model evolves according to the set time increment. If the increment exceeds the established maximum, non-convergence may occur, a phenomenon referred to as the stability limit in the algorithm, which prevents surpassing this limit. Although no precise method exists for calculating the stability limit, it is typically estimated. Thus, controlling the time increment appropriately is crucial when using the Abaqus/Explicit algorithm for static loading analysis [26].
For the individual elements in the model, the stability limit can be defined by the following formula:
Δ t s t a b l e = L e C d
In the formula, Le represents the length of element, while Cd denotes the wave velocity of the material. From this relationship, it is evident that a smaller element length Le results in a lower stability limit value Δtstable. The wave velocity Cd is determined by the material properties, and its relationship can be expressed as follows:
C d = E ρ
In the formula, E represents the elastic modulus of the material and ρ denotes the density of the material. The wave velocity Cd of the material increases with the elastic modulus, leading to a decrease in the stability limit Δtstable. Thus, this stability limit can be predicted to estimate the step size for the analysis.
The simulated creep duration for the analysis is set to 20 years, equivalent to 6.30 × 10⁸ s. Based on calculations, the maximum increment step is 1000, the initial increment step is 1, the minimum increment step is 0.0063, the maximum increment step is 107, and the strain tolerance is 10−6.
In summary, the sealing failure of flexible pipe end-fittings can be categorized into stress failure of the sealing layer and fluid leakage; therefore, it is essential to analyze both the stress and contact pressure within the sealing layer. Additionally, the reduction in the thickness of the sealing layer thickness will have an impact on the sealing performance of the end-fitting.

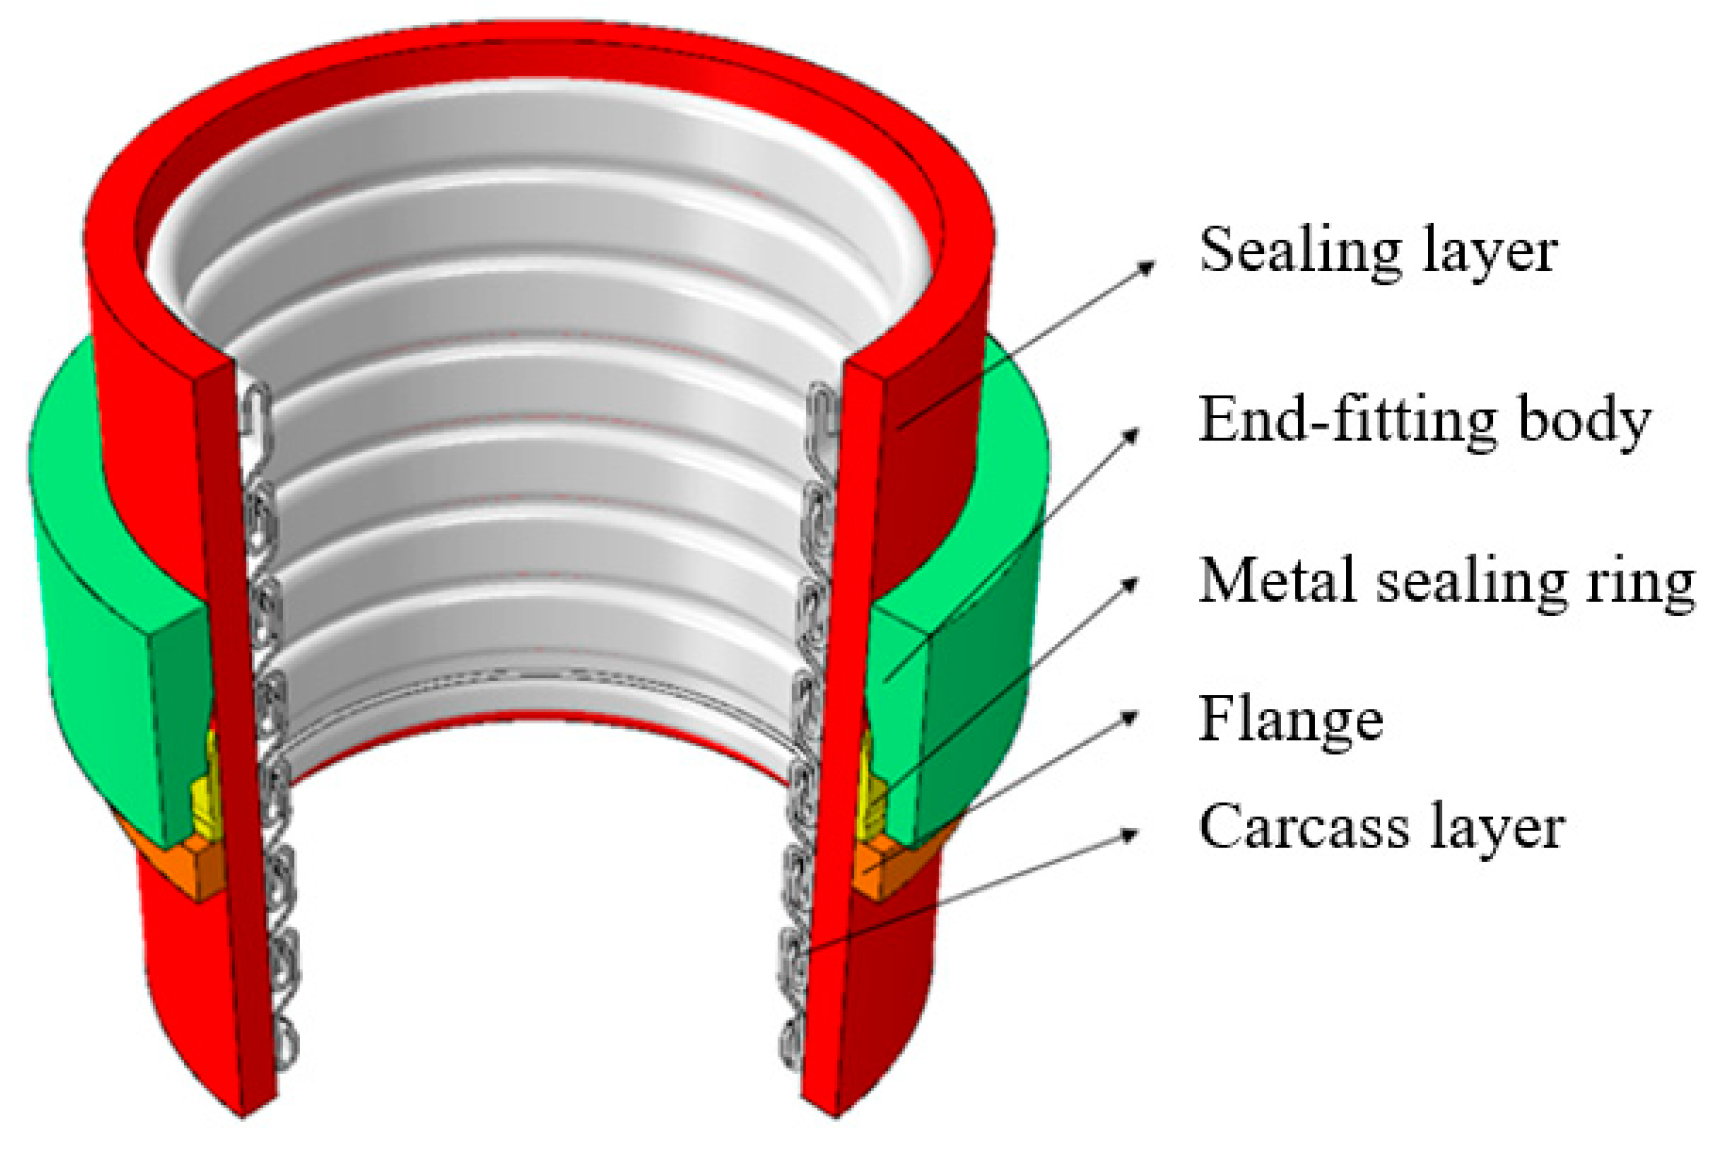
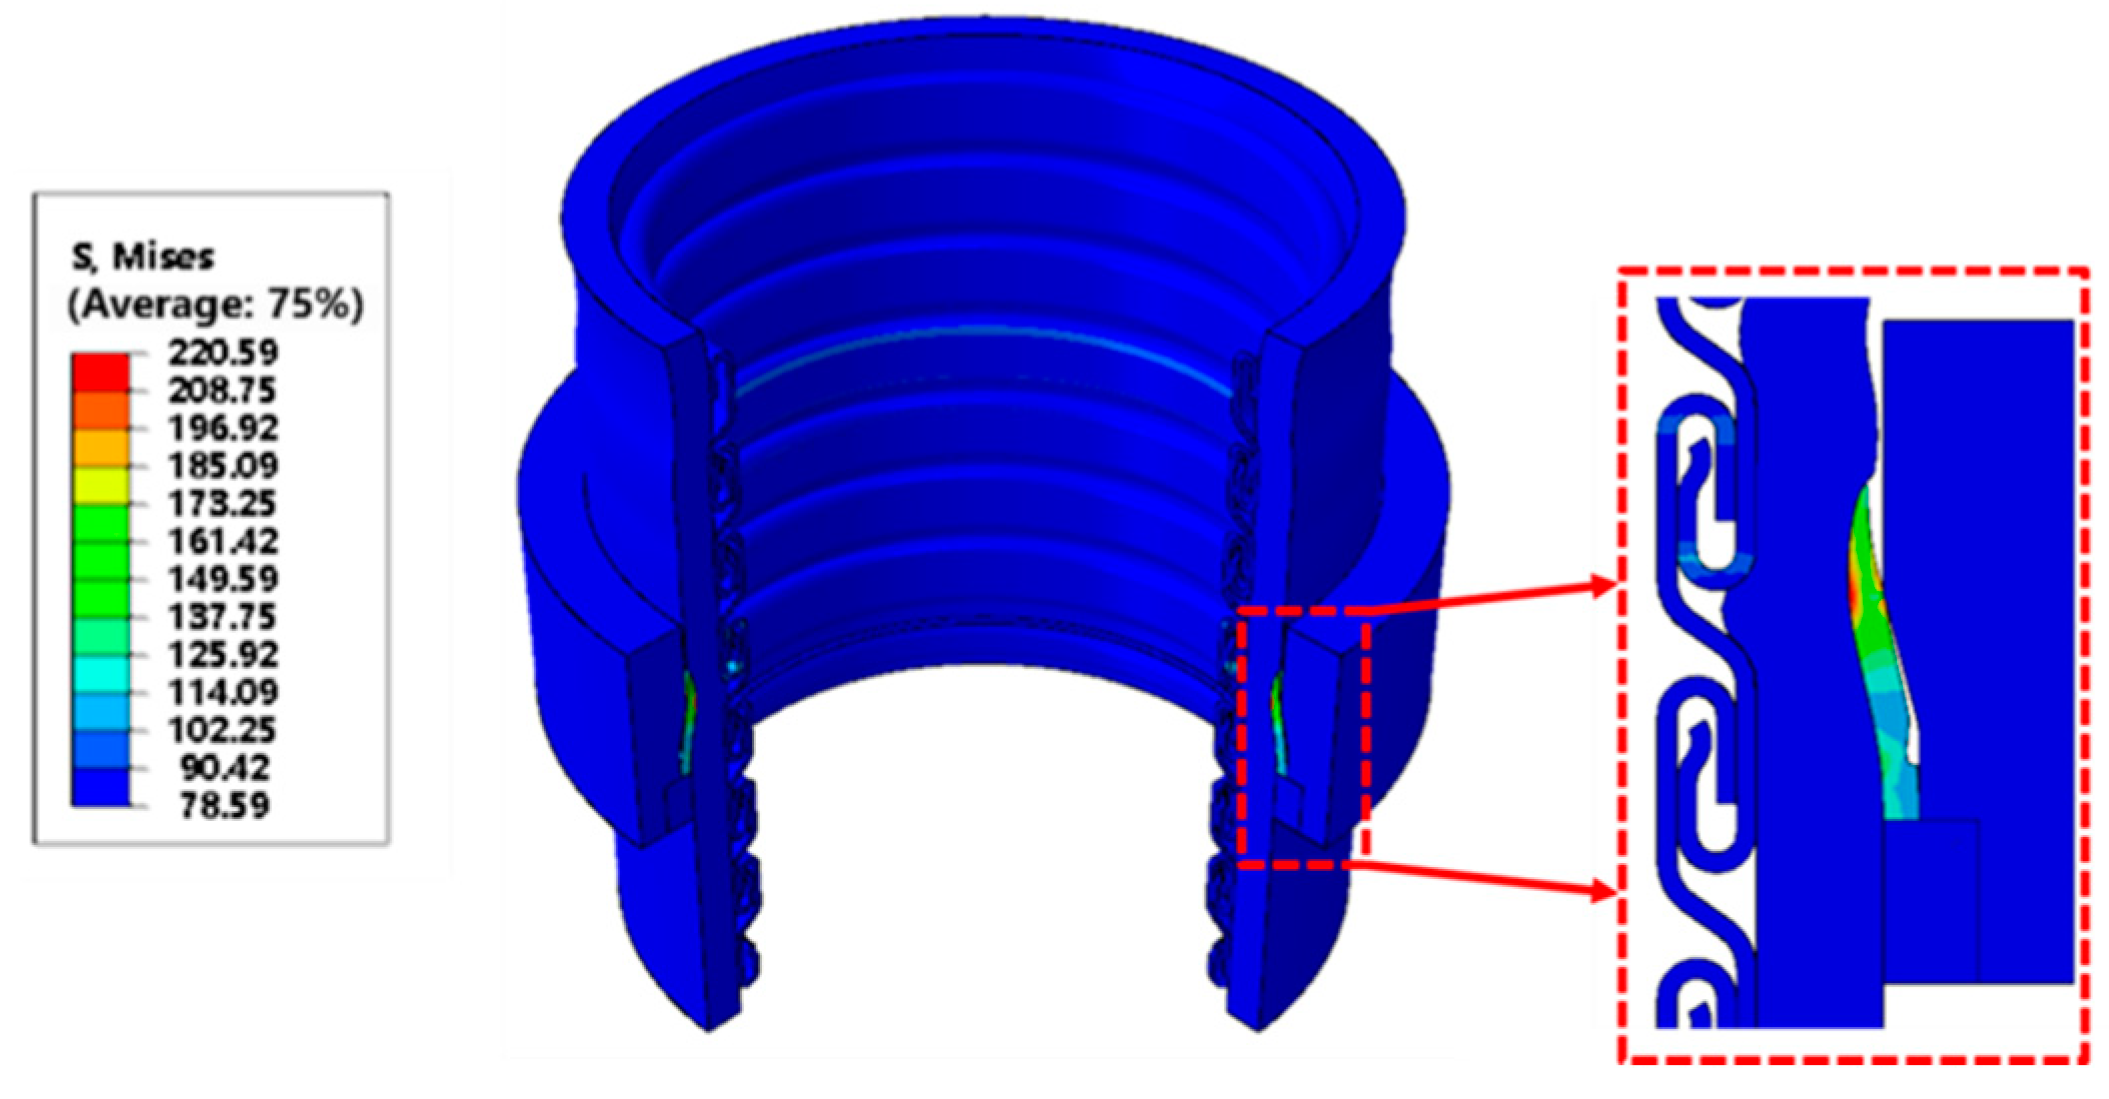
3.2.1. Sealing Layer Stress Analysis

Using the established numerical analysis model, the creep of the end-fitting sealing structure over 20 years has been analyzed. The resulting static analysis stress cloud diagram for the end-fitting sealing structure is presented in Figure 13.
The maximum stress of the sealing layer will change with the increase in creep time. The curves depicting the maximum stress over time at three different temperature levels are shown in Figure 14. It is evident that the maximum stress in the sealing layer decreases over time, becoming increasingly stable as time progresses. Specifically, at 25 °C, the long-term load over 20 years resulted in a maximum stress reduction of 42.96%, with an initial decrease of 11.12% occurring within the first year. At 40 °C, the maximum stress levels were reduced by 44.54% after 20 years, with a 12.73% decrease in the first year. Similarly, at 55 °C, the maximum stress decreased by 44.44% over 20 years, with an 11.11% reduction in the first year. Notably, under the long-term load of 20 years, the maximum stress decreased by 35.06% when the temperature was raised from 25 °C to 55 °C.

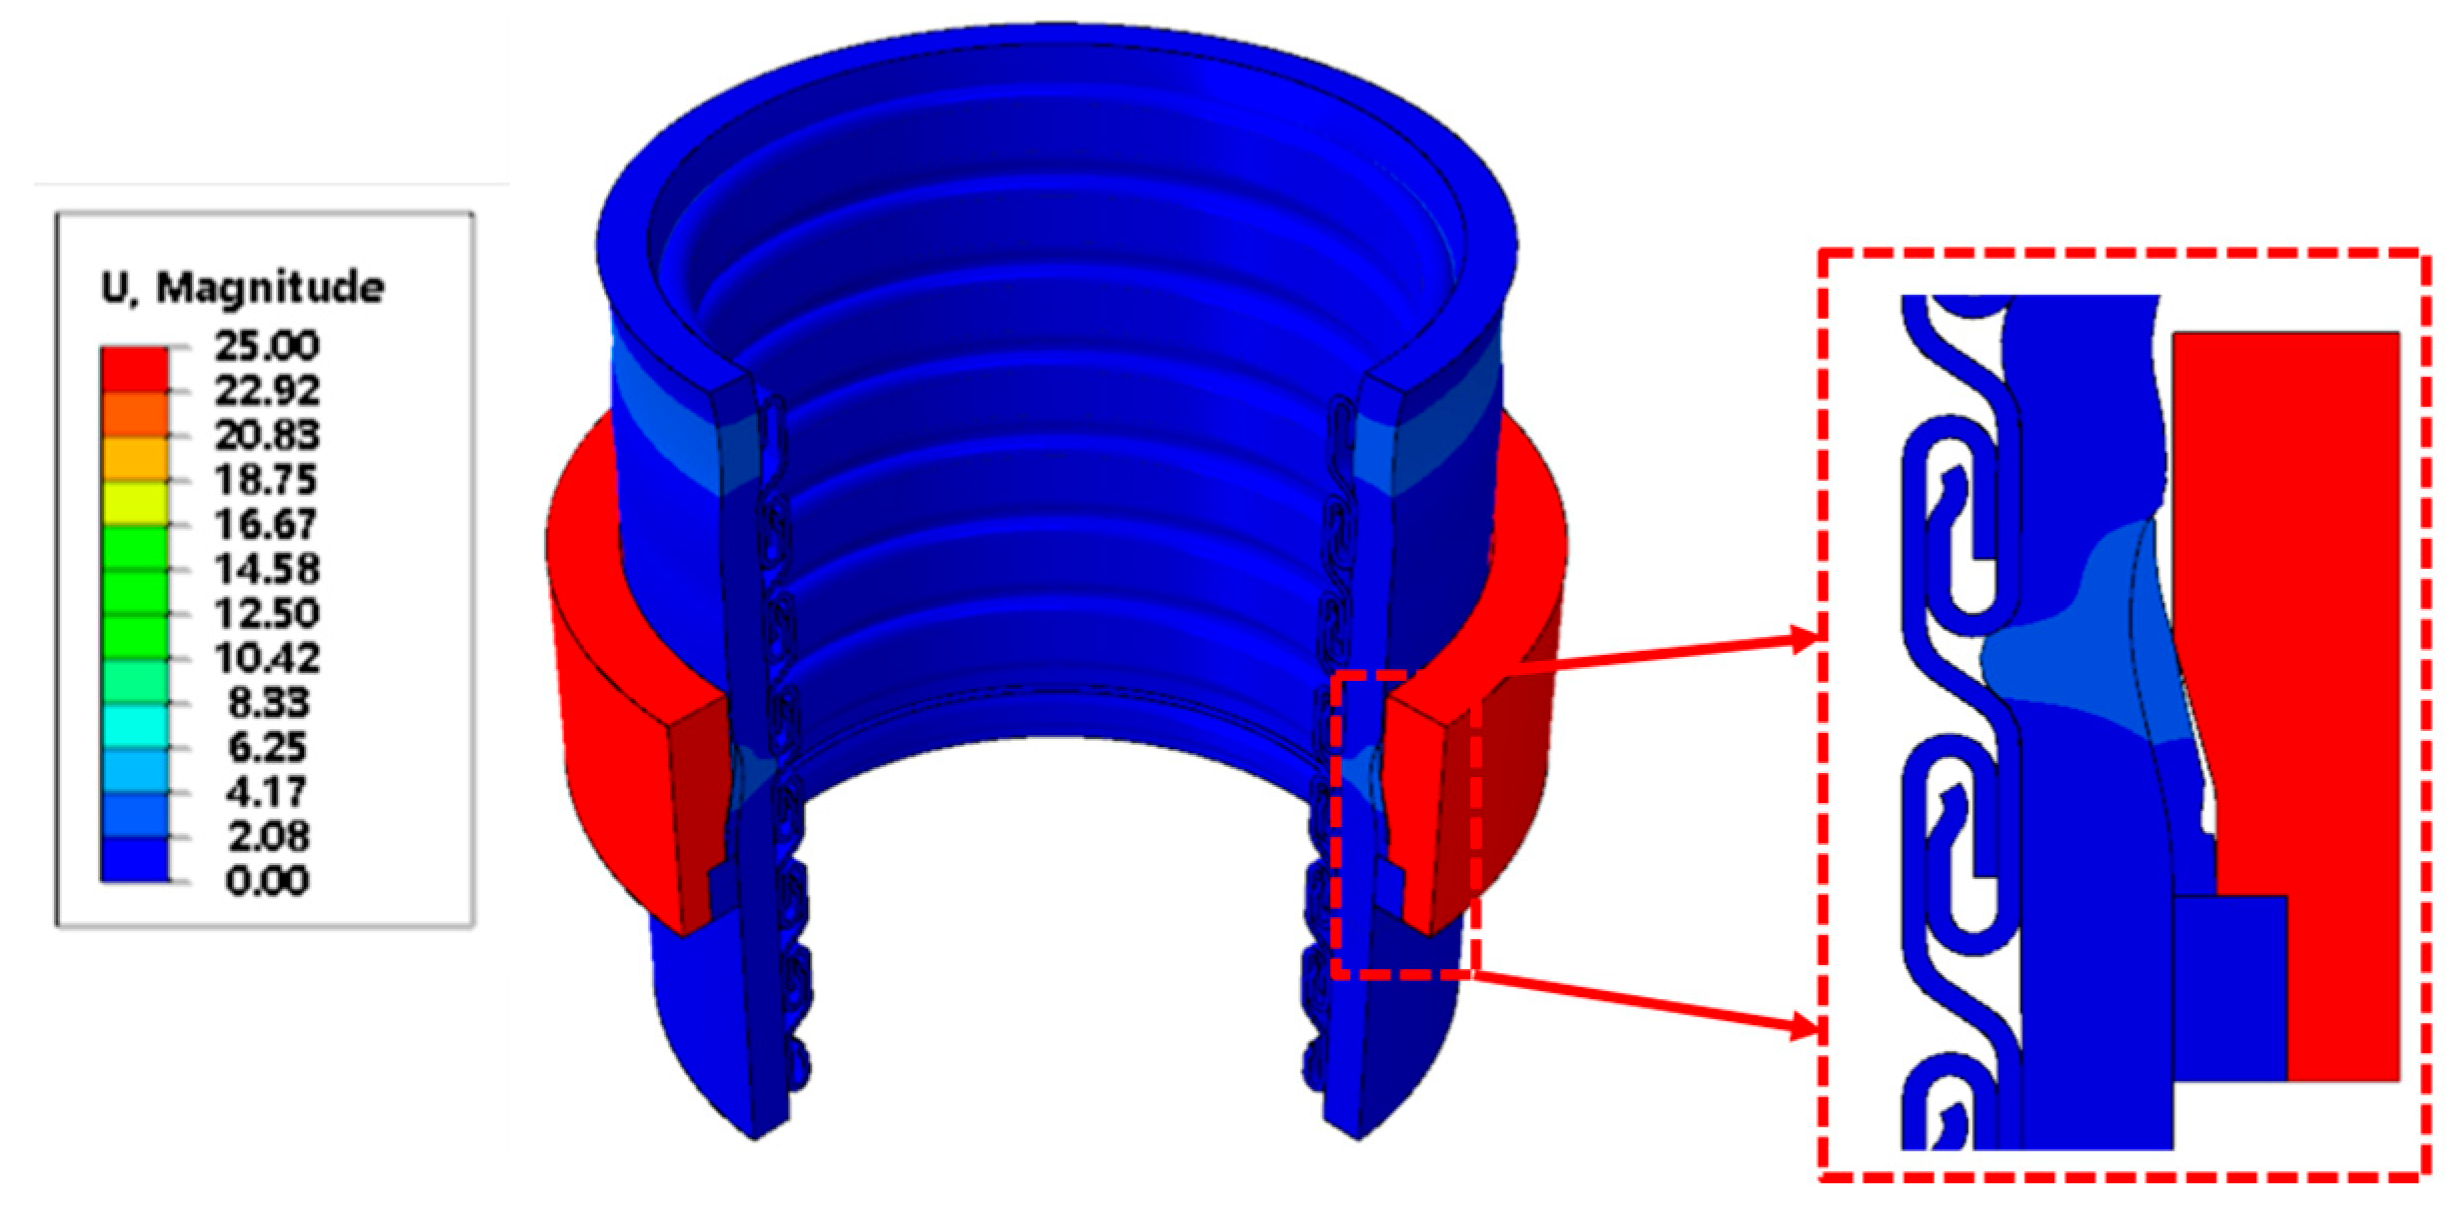
3.2.2. Analysis of Thickness Reduction of Sealing Layer

The static analysis displacement cloud diagram of the end-fitting sealing structure is presented in Figure 15. With the increase in time, the thickness of the sealing layer will be thinned, and the contact pressure between the sealing layer and the sealing ring will be reduced. Figure 16 illustrates the curve of thickness reduction in the sealing layer over time at various temperatures. It is evident that the thickness reduction of the sealing layer increases with time, becoming progressively stable. At 55 °C, the long-term load over 20 years resulted in a thickness reduction of 19.61%, with the most significant increase occurring in the first year at 3.36%.
According to the design standards of composite flexible hoses set forth by the American Petroleum Institute (API) standard API 17J [27], the thickness reduction of the sealing layer material must remain below 30% throughout its service life, considering various external factors (Thickness thinning criterion). At 25 °C, the thickness of the sealing layer exceeded 30% reduction by the 10.9th years, reaching a total reduction of 31% after 20 years. At 40 °C, the thickness reduction surpassed 30% by the 3.2th years, culminating in a 34% reduction after 20 years. At 55 °C, the sealing layer thickness exceeded the 30% threshold within just 1.5 years, with a total reduction of 36% after 20 years.

3.2.3. Sealing Performance Analysis of End-Fitting

The leakage paths on both sides of the metal sealing ring are illustrated in Figure 17. Leakage Path 1 represents the metal metal leakage route between the metal sealing ring and the metal end-fitting body, while Leakage Path 2 indicates the metal polymer leakage route between the metal sealing ring and the polymer sealing layer. Effective sealing is confirmed when the maximum contact pressure across these two leakage paths exceeds the fluid pressure, as expressed in Formula (9). If the maximum contact pressure is less than or equal to the fluid pressure, leakage will occur (Critical pressure criterion).
C P R E S S max > P
In the formula, CPRESSmax is the maximum contact pressure, and P is the fluid pressure.
The leakage paths from 1 year to 20 years of load are illustrated in Figure 18, showing the variation of contact pressure with node position.
The analysis reveals that the maximum contact pressure remains greater than the fluid pressure across all three temperatures when subjected to loads ranging from 1 year to 20 years. This finding confirms that no fluid leakage occurs, indicating that the seal is effective throughout this period.
Additionally, it is observed that as the temperature increases, the contact pressure exhibits a downward trend. However, both the load duration and temperature have minimal impact on the contact pressure along this path.
The curves representing the variation of contact pressure with node position from 1 year to 20 years of load for leakage path 2 are depicted in Figure 19. Analysis of these curves indicates that, at 25 °C, the maximum contact pressure remains greater than the fluid pressure for loads ranging from 1 to 10 years. This confirms that no fluid leakage occurs during this period, indicating effective sealing. However, between 15 and 20 years, the maximum contact pressure falls below the fluid pressure, resulting in leakage and subsequent seal failure. At 40 °C, seal failure occurs between 10 and 15 years, while at 55 °C, seal failure is observed between 5 and 10 years. Furthermore, it is evident that as the temperature increases, the contact pressure exhibits a downward trend, which emphasizes the impact of elevated temperatures on sealing performance.
The curves illustrating the maximum contact pressure of leakage path 2 over time at three different temperature levels are presented in Figure 20.
The analysis reveals that the maximum contact pressure decreases with time, stabilizing as the duration of loading increases.
At 25 °C: The maximum contact pressure is reduced by 34.94% over 20 years, with a notable reduction of 8.80% occurring within the first year.
At 40 °C: The maximum contact pressure experiences a decrease of 35.03% over 20 years, with a first-year reduction of 9.12%.
At 55 °C: The maximum contact pressure is reduced by 35.14% over 20 years, with the initial year’s reduction being 9.46%.
Notably, under the long-term loading conditions spanning 20 years, the maximum contact pressure decreases by 12.5% when the temperature rises from 25 °C to 55 °C.
According to the standard of 30% thickness reduction in API 17J, which stipulates a maximum allowable thickness reduction of 30% for sealing materials, the analysis reveals the following findings:
At 25 °C:
The sealing layer thickness is reduced by more than 30% in the 10.9th years.
Leakage occurs in 6.4 years when the maximum contact pressure falls below the fluid pressure.
At 40 °C:
The thickness of the sealing layer is reduced by more than 30% in the 3.2th years.
Leakage occurs in the 4.9 years as the maximum contact pressure drops below the fluid pressure.
At 55 °C:
The sealing layer thickness exceeds the 30% reduction threshold in the 1.5th years.
Leakage is observed in the 3rd year when the maximum contact pressure is less than the fluid pressure.
Therefore, the main findings can be summarized as follows:
At 25 °C, leakage occurs prior to reaching a 30% thickness reduction, indicating a critical failure point linked to contact pressure.
At 40 °C and 55 °C, leakage occurs only after the 30% thickness reduction is surpassed, suggesting that the API 17J standard is more conservative for these conditions, as shown in Table 4.
Consequently, during the early stages of operation, particularly with increasing temperatures, it is crucial to monitor for leaks, even before reaching the 30% thickness reduction threshold. At high temperatures (>40 °C), the critical pressure criterion should be used preferentially to determine whether the seal layer fails.

4. Conclusions

This paper establishes a comprehensive understanding of the sealing layer material PVDF in the end-fitting sealing structure through extensive compression and creep experiments. A creep constitutive model has been developed, and a numerical model was created using ABAQUS software to analyze the end-fitting sealing structure considering the creep behavior of the sealing layer material. The analysis of a typical sealing structure has led to several significant conclusions:
(a) Constitutive Relationships: The compressive elastic plastic constitutive relationship and mechanical properties of PVDF at various temperatures were determined, leading to the formulation of a time hardening model to accurately describe the creep behavior of PVDF.
(b) Creep Phenomenon: It was observed that the creep of the sealing layer in flexible pipe end-fittings primarily occurs shortly after installation under long-term loading conditions.
(c) Thickness Reduction Standards: The findings indicate that the API 17J standard, which mandates a thickness reduction of less than 30%, is conservative at elevated temperatures. It was found that even when the thickness reduction exceeds 30%, leakage does not necessarily occur until the maximum contact pressure falls below the fluid pressure.
These conclusions provide a novel perspective and methodology for the design of non-adhesive flexible pipe end-fitting sealing systems. Additionally, they offer a scientific basis for predicting long-term performance and informing maintenance practices in related engineering applications, underscoring their theoretical and practical significance.

Author Contributions

Conceptualization, Q.L. and S.X.; methodology, Q.L.; software, S.X.; validation, Y.Y., H.L. and J.Y.; formal analysis, T.Z.; investigation, T.Z.; resources, Q.L.; data curation, S.X.; writing—original draft preparation, S.X.; writing—review and editing, Q.L.; visualization, S.X.; supervision, T.Z.; project administration, Y.Y.; funding acquisition, J.Y. All authors have read and agreed to the published version of the manuscript.

Funding

This research was funded by Department of Science and Technology of Liaoning Province, grant number 2023JH2/101800022, National Natural Science Foundation of China, grant number 52201312, 52301315 and the Development of a New Type of Fully Flexible Mineral and Power Integrated Mixed-transport Composite Cable System, grant number 2021YFC2801602. And The APC was funded by Department of Science and Technology of Liaoning Province.

Institutional Review Board Statement

Excluding this statement.

Informed Consent Statement

Excluding this statement.

Data Availability Statement

No data set link has been created.

Conflicts of Interest

The authors declare no conflict of interest.

References

  1. Lu, H.L.; Vaz, M.A.; Caire, M. A finite element model for unbonded flexible pipe under combined axisymmetric and bending loads. Mar. Struct. 2020, 74, 102826. [Google Scholar] [CrossRef]
  2. Dahl, C.S.; Andersen, B.; Groenne, M. Developments in Managing Flexible Risers and pipelines, a Supplier’s Perspective. In Offshore Technology Conference; OTC: Houston, TX, USA, 2011. [Google Scholar]
  3. Fernando, P.; Nott, G.; Graham, E.; Roberts, A.; Sheldrake, T.; Brunskill, H.; Zhou, L.; Lewis, R. Experimental Evaluation of the Metal-Tometal Seal Design For High-Pressure Flexible Pipes. In Offshore Technology Conference; OTC: Houston, TX, USA, 2012. [Google Scholar]
  4. Zhang, T.; Lu, Q.Z.; Yan, J.; Wang, S.C.; Yue, Q.J.; Wu, S.H.; Lu, H.L.; Chen, J.L. Numerical Study on Flexible Pipe End Fitting Progressive Failure Behavior Based on Cohesive Zone Model. J. Mar. Sci. Eng. 2023, 11, 116. [Google Scholar] [CrossRef]
  5. Fernando, U.S.; Karabelas, G. Analysis of End fitting Barrier Seal Performance in High Pressure Unbonded Flexible Pipes. In Proceedings of the 33rd ASME International Conference on Ocean, Offshore and Arctic Engineering, San Francisco, CA, USA, 8–13 June 2014. [Google Scholar]
  6. Li, X.; Du, X.; Wan, J.; Xiao, H. Structure analysis of flexible pipe end fitting seal system. In Proceedings of the International Conference on Offshore Mechanics and Arctic Engineering, St. John’s, NL, Canada, 11–16 July 1999. [Google Scholar]
  7. Zhou, C.L.; Zheng, J.Y.; Gu, C.H.; Zhao, Y.Z.; Liu, P.F. Sealing performance analysis of rubber O-ring in high-pressure gaseous hydrogen based on finite element method. Int. J. Hydrogen Energy 2017, 42, 11996–12004. [Google Scholar] [CrossRef]
  8. Chen, K.; Zhang, M.; Fu, S.; Zhao, B.; Luo, C. A numerical model for stress relaxation analysis of sealing systems in nonbonded pipe end fittings. J. Ocean. Eng. Sci. 2023;  in press. [Google Scholar] [CrossRef]
  9. Persson, B.; Yang, C. Theory of the leak-rate of seals. J. Phys. Condens. Matter. 2008, 20, 315011. [Google Scholar] [CrossRef]
  10. Lorenz, B.; Persson, B. Leak rate of seals: Comparison of theory with experiment. Europhys. Lett. 2009, 86, 44006. [Google Scholar] [CrossRef]
  11. Lorenz, B.; Persson, B. Leak rate of seals: Effective-medium theory and comparison with experiment. Phys. J. E 2010, 31, 159–167. [Google Scholar] [CrossRef] [PubMed]
  12. Slee, A.J.; Stobbart, J.; Gethin, D.T.; Hardy, S.J. Case Study on a Complex Seal Design for a High Pressure Vessel Application. In Proceedings of the ASME Pressure Vessels and Piping Conference, Anaheim, CA, USA, 20–24 July 2014. [Google Scholar]
  13. Gorash, Y.; Dempster, W.; Nicholls, W.D.; Hamilton, R. Fluid pressure penetration for advanced FEA of metal-to-metal seals. Proc. Appl. Math. Mech. 2015. [Google Scholar] [CrossRef]
  14. Tang, L.; He, W.; Zhu, X.; Zhou, Y. Sealing Performance of the End Fitting of a Marine Unbonded Flexible Pipe under Pressure Penetration. J. Appl. Comput. Mech. 2020, 6, 543–553. [Google Scholar]
  15. Saneian, M.; Bai, Y. Evaluation of the Inner Liner in Unbounded Flexible Pipelines in the Sealing System of End-Fitting. In Proceedings of the ASME 2024 43rd International Conference on Ocean, Offshore and Arctic Engineering, Singapore, 9–14 June 2024. [Google Scholar]
  16. Shen, Y.; Zhao, J.; Tan, Z.; Sheldrake, T. Analysis of the Creep Behaviour of the Polymer Barrier Layer in Unbonded Flexible Pipes Under Different Fluid Temperatures. In Proceedings of the ASME 2012 31st International Conference on Ocean, Offshore and Arctic Engineering, Rio de Janeiro, Brazil, 1–6 July 2012. [Google Scholar]
  17. de Lima, H.F.; Vaz, M.A.; da Costa, M.F.; Gomez, A.A.; de Oliveira, G.L. Creep behavior of in-service flexible flowline polyamide 11. Polym. Test. 2020, 81, 106205. [Google Scholar] [CrossRef]
  18. Zhang, J. Creep Behavior Analysis of Unbonded Flexible Riser Lining; China University of Petroleum: Beijing, China, 2023. [Google Scholar]
  19. Amjadi, M.; Fatemi, A. Creep behavior and modeling of high-density polyethylene (HDPE). Polym. Test. 2021, 94, 107031. [Google Scholar] [CrossRef]
  20. Spathis, G.; Kontou, E. Creep failure time prediction of polymers and polymer composites. Compos. Sci. Technol. 2012, 72, 959–964. [Google Scholar] [CrossRef]
  21. Lai, J.; Bakker, A. Analysis of the non-linear creep of high-density polyethylene. Polymer 1995, 36, 93–99. [Google Scholar] [CrossRef]
  22. Dargahi, A.; Schultz, R.; Runka, J.; Ashrafizadeh, H.; Xu, B.; Naguib, H.E. Nonlinear creep characteristics of extruded Poly (vinylidene fluoride-co-hexafluoropropylene) with high β-phase content under extreme conditions: Design, characterization, and modeling. Mater. Des. 2023, 232, 112124. [Google Scholar] [CrossRef]
  23. Zheng, Y.Y.; Zhou, J.X.; Ling, X.; Yang, Z.; Yang, S.S.; Wang, Y.N. Creep Property Assessment of Type 304 by Small Punch Creep Test. In Proceedings of the 2nd International Conference SSTT on Determinational of Mechanical Properties of Materials by Small Punch and other Miniature Testing Techniques, Ostrava, Czech Republic, 2–4 October 2012. [Google Scholar]
  24. GB/T 1041-2008; Determination of Compression Properties of Plastics. China Standard Press: Beijing, China, 2008.
  25. GB/T 11546-2008; Determination of Creep Properties of Plastics. China Standard Press: Beijing, China, 2008.
  26. Zhao, Y.; Ji, H.; An, X.; Li, Y. Numerical simulation of creep and stress relaxation of smooth specimens was carried out by ABAQUS. J. Chin. People ’s Armed Police Acad. Eng. 2001, 17, 14–15. [Google Scholar]
  27. American Petroleum Institute. In API SPEC 17J Specification for Unbonded Flexible Pipe; American Petroleum Institute: Washington, DC, USA, 2014.
Figure 1. Typical flexible pipe end-fitting structure [4].
Jmse 12 02362 g001
Figure 2. 30 t universal testing machine.
Jmse 12 02362 g002
Figure 3. PVDF compression stress strain curves at different temperatures.
Jmse 12 02362 g003
Figure 4. Electronic creep rupture tester.
Jmse 12 02362 g004
Figure 5. PVDF compression creep test.
Jmse 12 02362 g005
Figure 6. Strain time curves. (a) 25 °C. (b) 40 °C. (c) 55 °C.
Jmse 12 02362 g006
Figure 7. Macroscopic morphology of compression creep specimens under different loads.
Jmse 12 02362 g007
Figure 8. Macroscopic morphology of compression creep specimens at different temperatures.
Jmse 12 02362 g008
Figure 9. Creep strain time curves. (a) 25 °C. (b) 40 °C. (c) 55 °C.
Jmse 12 02362 g009
Figure 10. Creep strain time and stress surfaces. (a) 25 °C. (b) 40 °C. (c) 55 °C.
Jmse 12 02362 g010
Figure 11. Sealing structure of non-adhesive flexible pipe end-fitting.
Jmse 12 02362 g011
Figure 12. Discussion on grid convergence.
Jmse 12 02362 g012
Figure 13. Static analysis stress cloud diagram of end-fitting sealing structure.
Jmse 12 02362 g013
Figure 14. The maximum stress time curve of sealing layer.
Jmse 12 02362 g014
Figure 15. Static analysis displacement cloud of end-fitting sealing structure.
Jmse 12 02362 g015
Figure 16. Sealing layer thickness reduction time curve.
Jmse 12 02362 g016
Figure 17. Leakage paths 1 and 2.
Jmse 12 02362 g017
Figure 18. The contact pressure node position curves of leakage path 1. (a) 25 °C. (b) 40 °C. (c) 55 °C.
Jmse 12 02362 g018
Figure 19. The contact pressure node position curves of leakage path 2. (a) 25 °C. (b) 40 °C. (c) 55 °C.
Jmse 12 02362 g019
Figure 20. Maximum contact pressure time curve.
Jmse 12 02362 g020
Table 1. Compression mechanical property parameters of PVDF.
ParameterValueUnit
25 °C40 °C55 °C
Modulus of elasticity870680550MPa
Compression Deformation Rate>3>3>3%
Yield strength1108870MPa
Compressive strength160130105MPa
Table 2. Parameters of PVDF creep time hardening model.
T/°CAmn
251.58 × 10⁻¹¹−0.761.13
401.72 × 10⁻⁹−0.831.20
553.21 × 10⁻⁷−0.931.42
Table 3. Material parameters of metal sealing ring.
ParameterValueUnit
Elastic modulus210GPa
Yield strength400MPa
Table 4. Comparison of two failure criteria.
Failure CriteriaThickness Thinning Criterion/yearCritical Pressure Criterion/year
T/°C
2510.9th6.4th
403.2th4.9th
551.5th3.0rd
Disclaimer/Publisher’s Note: The statements, opinions and data contained in all publications are solely those of the individual author(s) and contributor(s) and not of MDPI and/or the editor(s). MDPI and/or the editor(s) disclaim responsibility for any injury to people or property resulting from any ideas, methods, instructions or products referred to in the content.

