1. Introduction
Inland water transportation, a vital element of global trade, significantly impacts both the efficiency and stability of the global economy. The complex shipping network connecting major ports ensures the continuous flow of goods and services [
1,
2]. As globalization intensifies, the reliability of inland water transportation networks has attracted increasing attention from academia and industry alike [
3,
4]. Multiple uncertainties, including weather conditions, port congestion, piracy, and geopolitical tensions, present significant challenges to the robustness and resilience of inland water transportation networks [
5].
Prior studies have thoroughly examined the structural characteristics of inland water transportation networks and their effects on network reliability. Research grounded in complex network theory has been particularly prominent. Scholars have analyzed the topological structures of shipping networks to identify critical nodes and key routes essential for network stability. Ducruet studied global shipping networks, highlighting the importance of port connectivity as critical nodes for overall network stability [
6]. Kaluza et al. demonstrated the critical role of shipping routes in the global transportation system through their study of maritime routes [
7]. However, despite offering in-depth analyses of static network characteristics, the dynamic responses of networks to random failures or malicious attacks remain insufficiently explored. To fill these gaps, researchers have begun incorporating more dynamic and sophisticated analytical approaches. Recently, risk assessment and disaster management models have been increasingly applied to maritime transport networks to more accurately assess the impacts of potential risks on network reliability. Pant et al. developed a risk model to evaluate threats to port connectivity posed by natural disasters, such as earthquakes [
8]. These studies highlight the significant impact of natural disasters and extreme events on the reliability of maritime transport networks. Nevertheless, despite advances in risk assessment, these models still rely heavily on historical data and pre-existing assumptions, limiting their ability to uncover the underlying mechanisms and response patterns of networks during sudden events. Percolation theory, a fundamental tool in network science, provides a fresh perspective for examining the connectivity and robustness of complex networks under various disruption scenarios. By simulating the progressive failure of nodes or links, percolation theory reveals network behavior and critical thresholds under random or targeted attacks [
9]. Although widely applied in transportation, energy, and communication networks, its application to maritime transport networks remains underexplored. Several studies have attempted to apply percolation theory to the analysis of maritime networks [
10,
11,
12,
13]. Sohn investigated the effects of key node failures on the connectivity of the Korean shipping network [
14]. However, these studies primarily focus on individual countries or regions and lack a comprehensive analysis of global or large-scale shipping networks.
This study aims to perform a systematic empirical analysis of the Yangtze River transportation network’s reliability using percolation theory. The Yangtze River, one of the busiest inland waterways globally, plays a critical role in China’s economic development and has significant implications for global trade flows. Through detailed network structure analysis, this study demonstrates how connectivity shifts under different percolation scenarios and identifies key vulnerabilities and resilience factors. Additionally, this research explores potential links between incidents and environmental changes, offering scientific insights for the design and management of inland water transportation networks. This study extends the application of percolation theory to inland water transportation and provides novel insights and methods to enhance the safety and efficiency of global shipping systems.
This study addresses a gap in the resilience analysis of the Inland Water Transportation Complex Network (IWTCN) using percolation theory. While previous studies have used percolation theory to examine the robustness of transportation networks, most have focused on single network structures or the impact of specific nodes. The novelty of our approach lies in its comprehensive analysis of network resilience, which not only considers the overall network structure but also explores the load-bearing capacity of key nodes and their influence on failure propagation. This integrated approach provides a more thorough evaluation of network performance under multiple failure scenarios, especially in complex cases involving multiple node failures. Additionally, the research differentiates itself from previous works by incorporating geographical distribution and dynamic factors. This provides a more nuanced perspective on inland water transportation network resilience, enabling us to assess the network’s vulnerability in real-world scenarios, such as when multiple nodes are affected simultaneously.
The structure of the paper is as follows:
Section 2 reviews previous research in the field.
Section 3 presents the methodology and data used in this study.
Section 4 discusses the findings related to the characteristics of inland water transportation in the Yangtze River. Finally,
Section 5 provides the conclusions.
2. Literature Review
Transportation networks are generally regarded as complex systems comprising nodes (e.g., ports, airports, rail stations) and edges (e.g., roads, railways, maritime routes) that form diverse structures. These networks frequently exhibit small-world and scale-free characteristics. In small-world networks, most nodes are connected by relatively short paths, ensuring high connectivity efficiency throughout the system. On the other hand, scale-free networks indicate that a few nodes (hubs) possess numerous connections, which are crucial for the overall performance of the network [
15,
16,
17,
18]. Although these properties provide some redundancy, the failure of critical hubs can lead to cascading failures [
19,
20,
21].
When analyzing transportation systems, network models primarily focus on node centrality, clustering coefficients, and path efficiency to identify weak links and optimize designs, thereby enhancing system robustness [
22,
23]. Barrat et al. examined the architecture of complex weighted networks, emphasizing the dynamic behavior of transportation systems under varying traffic intensities and network densities [
24]. Further studies used these models to analyze maritime flows and network diversity, stressing the significance of dynamic structures in transportation networks [
25]. In temporal networks, nodes and edges are time-dependent, adding an extra layer of complexity. Holme and Saramäki examined how temporal factors influence network stability and reliability, particularly in relation to traffic flow changes and performance under different conditions [
26].
Reliability analysis of transportation networks focuses on assessing system performance during node or edge failures. Many studies examine the robustness of transportation networks under both random failures and targeted attacks. Albert et al. studied the fault tolerance of complex networks, revealing that scale-free networks (common in transportation systems) are highly resistant to random failures but very susceptible to targeted hub attacks [
10]. This weakness is particularly evident in maritime networks, where a small number of critical ports handle most traffic flows. To enhance reliability, game theory methods have been used to simulate transportation systems during failure conditions. Bell introduced a game theory framework to assess network performance under uncertainty and optimize route selection [
27]. Sun analyzed the robustness of transportation networks under interference, showing that even minor disruptions to key nodes can cause cascading failures, reducing overall system efficiency [
28]. Additionally, vulnerability assessments provide crucial insights for identifying potential risks in transportation systems and help develop mitigation strategies.
Percolation theory is an essential tool for analyzing network connectivity changes when nodes or edges fail. Initially designed to study fluid flow in porous media, percolation theory has since been applied to network theory to understand connectivity and functionality in large-scale systems, such as transportation networks. Callaway et al. were the first to apply percolation theory to complex networks, demonstrating that critical node failures can collapse network connectivity. In transportation networks, percolation models simulate disruptions such as accidents, natural disasters, or targeted attacks [
11]. Cohen et al. applied percolation theory to study internet robustness and compared it to failure patterns in transportation systems [
29]. Some researchers extended this theory to scale-free networks, demonstrating that when hub nodes fail, the network fragments and becomes inefficient [
30,
31]. In transportation systems, the percolation threshold is a critical measure for evaluating network breakdown points. Newman and Pastor-Satorras used percolation theory to simulate epidemic spread, a model that is also applicable to analyzing failure propagation in transportation systems. These models offer valuable tools for planners to identify critical thresholds and strengthen infrastructure to prevent catastrophic failures [
32,
33].
Despite significant theoretical advancements, there are still several limitations in practical applications. First, most complex network and percolation theory models assume a static network topology, while real-world transportation networks are dynamic in both time and space. This assumption neglects the effects of traffic flow, seasonal variations, climate, and political factors on transportation system performance [
26,
34]. Consequently, these models offer limited predictive and guiding power under dynamic conditions. Additionally, although complex network theory effectively explains topological features, it often lacks adequate physical explanations for node failure triggers like natural disasters or equipment malfunctions [
10,
35]. Current research tends to emphasize network structural characteristics, paying less attention to control and monitoring mechanisms in real-world traffic management. Another limitation is that applying percolation theory to transportation networks is often based on theoretical assumptions and lacks adequate validation using real-world data. Many studies on percolation models focus on the global impact of node failures, with insufficient consideration of improving local system reliability through targeted measures [
29,
36]. Such studies may fail to fully capture the unique characteristics of specific regions when applied to particular areas.
To better understand the key findings and methods from these studies, we have summarized the most relevant research in
Table 1. This table presents a comparative overview of the major studies that have shaped our understanding of transportation network reliability, including their focus areas, key findings, methods used, and the primary insights gained from each. The studies discussed in the table highlight the different approaches and methodologies applied to the study of transportation networks, offering a clearer view of the field’s development.
This study focuses on the reliability of the Yangtze River shipping network through an empirical analysis grounded in percolation theory. Despite the growing body of research on network reliability, much of the existing literature on inland water transportation networks has either examined isolated network structures or focused solely on specific nodes without considering the overall resilience of the entire system. While percolation theory has been applied to study transportation network robustness, there is a significant gap in understanding how key nodes’ load-bearing capacities and their role in failure propagation affect overall network resilience, especially in complex and large-scale maritime networks. This study fills that gap by integrating the analysis of both network structure and dynamic load-bearing capacities to assess resilience under multiple failure scenarios.
The motivation for focusing on the Yangtze River shipping network stems from its critical role in China’s inland transportation system. As one of the world’s busiest and most vital inland waterway routes, the Yangtze River network serves as a key artery for both domestic and international trade. The disruptions in this network can have severe economic and logistical consequences, which makes it an ideal case study for understanding the resilience of large-scale inland water transportation networks. By using real data from this network, this study aims to provide a detailed empirical validation of the Yangtze River network’s connectivity and robustness.
The findings from this research are particularly relevant not only for the Yangtze River but also for other maritime and inland waterways. The insights into network resilience, failure thresholds, and load-bearing capacities can be generalized to similar large-scale transportation systems, including key maritime networks in other regions. This study offers a methodology that can be applied to assess resilience across different geographical regions, thus providing actionable insights for enhancing the robustness of maritime transportation systems worldwide.
3. Method
3.1. Dataset
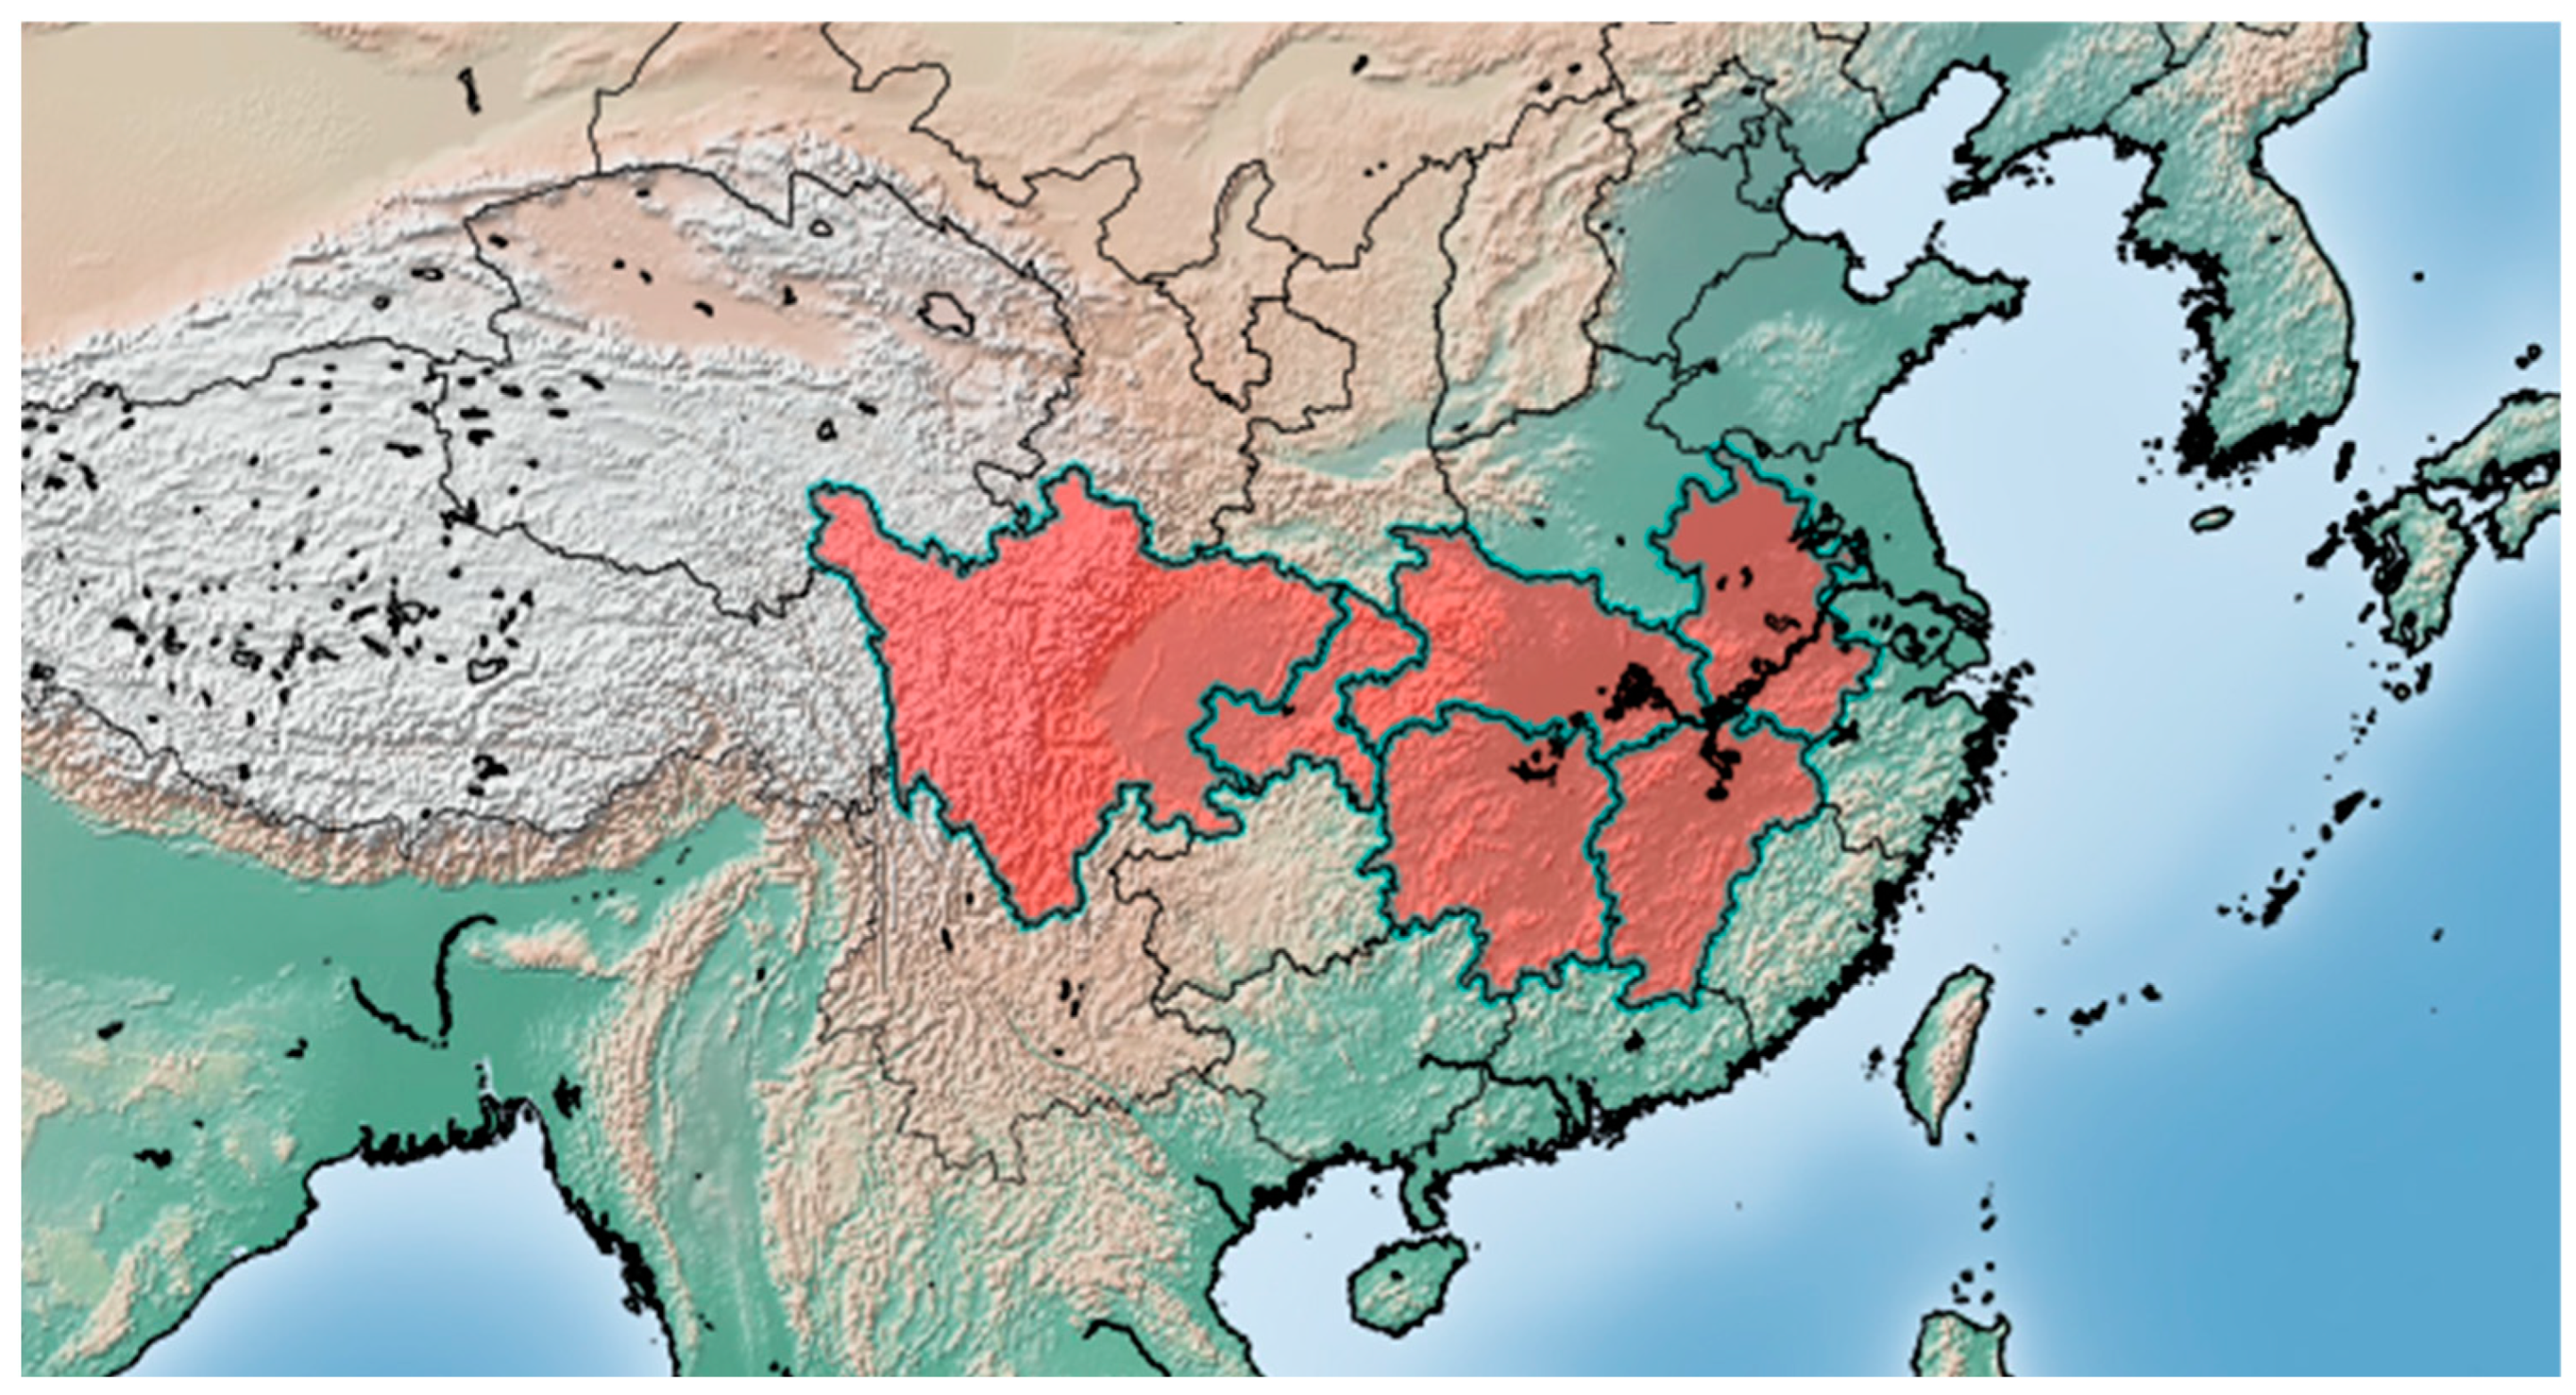
The Yangtze River, often referred to as the golden waterway, is the largest river flowing through both eastern and western China, serving as a crucial route for travel and commercial trade. The study area in this research focuses on the stretch of the Yangtze River from Sichuan to Anhui, as shown in
Figure 1. This region is an important part of the Yangtze River Economic Belt, covering several economically developed provinces. It has high shipping traffic and a complex waterway transportation network, and it is representative, making it well-suited to reflect the characteristics of transportation in the upper and middle reaches of the Yangtze River. The transportation network in the Jiangsu section is closely connected to inland water transportation, with distinct characteristics of seaports. However, this study focuses on inland waterway transportation networks. To maintain the study’s focus and consistency, only regions closely related to inland shipping were selected for analysis. Therefore, the Jiangsu section was excluded from the study due to its specific maritime attributes.
In recent years, ship voyage data have emerged as a crucial resource for analyzing navigation patterns. The dataset employed in this study consists of ship voyage information. Under current maritime regulations, ships are required to submit detailed voyage records, including the vessel’s name, type, the maritime authority at the point of departure, time of departure, the maritime authority at the destination, time of arrival, number of crew members, and other relevant information. This research focuses on ship voyage data from the Yangtze River for the year 2019, with vessels operating solely within port areas excluded from consideration. The data used in this research were supplied by the Changjiang River Administration of Navigational Affairs, which operates under the Ministry of Transport of China. A sample of these data can be found in
Table 2.
3.2. Modelling IWTCN and Topological Properties
The theory of complex networks has found extensive applications in transportation research, especially in maritime systems. In maritime transport, global networks typically model shipping routes as edges and ports as nodes, which is in line with complex network theory. While these networks are commonly used to analyze global systems, the IWTCN was specifically designed to explore the unique characteristics of the Yangtze River transport system.
In order to construct the IWTCN model, the maritime departments (MD) of the ships’ origin and destination points in the dataset were determined. Each MD in the study area was mapped as a node, with routes between MDs defining the edges. As a result, the network consists of 63 MDs and their corresponding connections. Details of the MDs are provided in
Table 3. The IWTCN model for the Yangtze River comprises 63 nodes and 3110 edges. Notably, the network has no isolated nodes, indicating that all variables in the spatial correlation network are interconnected.
Several variables commonly used in complex network analysis, including cumulative degree distribution, vertex strength, average path length, clustering coefficient, and betweenness centrality, are chosen to examine the overall structure of the IWTCN. The IWTCN can be represented by an adjacency matrix , where signifies that MDs i and j form an OD pair. Otherwise, . Additionally, N represents the total count of nodes in the IWTCN.
- (1)
Cumulative degree distribution (CDD).
The degree of node
i, indicating the number of edges it connects to, can be determined using the following formula:
One common way to quantify a node’s connectivity within a network is by using the concept of degree. In the analysis network, higher-degree nodes provide easier access to more MDs. In the IWTCN, the CDD represents the probability of randomly selecting a node with a degree of at least
k, and it is calculated as follows:
The CDD plays a key role in identifying various network behaviors in actual transportation systems, such as the spread of traffic flow and the robustness of the network.
- (2)
Vertex strength (VS).
The total of a node’s edge weights is known as its VS. The average VS is defined as follows.
where
is the average VS of a network,
is the vertex strength of node
i,
is the weight of the edge between node
i and node
j,
is the set of adjacent points of node
i.
- (3)
Average path length (APL).
The formula below is applied to calculate the APL, representing the mean of the shortest number of edges between any randomly selected pair of nodes in the IWTCN.
where
is the fewest number of edges that connect nodes
i to
j.
- (4)
Clustering coefficient (CC).
The CC quantifies how many nodes in a graph are inclined to form clusters. In real-world networks, nodes often form closely connected groups with a higher density of links. The CC is defined by the following equation:
where
denotes the local CC of node
i,
indicates the number of realized connections among the neighbors of node
i, while
refers to the total number of potential connections among those neighbors.
- (5)
Betweenness centrality (BC).
BC quantifies how much a node influences the shortest paths between all node pairs and is frequently used to illustrate transitivity within transportation networks. A higher value of
indicates a more important role for transfer MD
i. The betweenness of node
i is determined by the fraction of shortest paths that pass through it:
where
indicates the total number of shortest paths from
s to node
t, and
refers to the count of those shortest paths in
that pass through node
i.
3.3. Percolation Model on Complex Network
Percolation theory is one of the simplest models explaining systemic phase transition phenomena, describing the transition process between locally connected states and globally connected states within a system [
37]. Many real-life problems can be explained by percolation theory, such as the minimum proportion of nodes that need to be removed to cause system collapse, the minimum proportion of trees that need to be cut down to prevent the spread of forest fires, and the minimum population size that needs to be vaccinated to prevent the widespread transmission of diseases [
38,
39,
40].
- (1)
Determination of percolation threshold.
In the percolation process, the critical value at which the network undergoes a phase transition is obtained by computing the variation in the size of the largest connected cluster and the size of the second largest connected cluster with respect to the node (or edge) occupancy rate . When is less than , the size of the largest connected cluster is relatively small, indicating the absence of a connected cluster containing the majority of nodes in the network. Conversely, when exceeds , the size of the largest connected cluster is comparable to the size of the network’s nodes. For transportation networks, at this point, traffic flow can reach the majority of nodes in the network. According to percolation theory, in practical applications, the occupancy rate at which the size of the second largest connected cluster reaches its peak is considered the percolation threshold. The calculation process of is as follows:
Step 1: Initialize a network with N nodes and corresponding edges.
Step 2: Gradually increase the occupancy rate p, activating nodes or edges randomly.
Step 3: For each p, calculate the sizes G (largest connected cluster) and SG (second-largest connected cluster).
Step 4: Plot the relationship between p and G or SG. The p value at which SG reaches its maximum is taken as the percolation threshold .
- (2)
Relative size of the giant cluster .
The order parameter
is defined as shown in Equation 8, where
represents the relative size of the largest connected cluster
. Before the network reaches the percolation threshold, there is no giant cluster present in the network, and the value of
is 0. After the network reaches the percolation threshold, the order parameter
represents the proportion of nodes in the largest connected cluster to all nodes in the network, and this value increases continuously as the node occupancy rate
increases. The relative size of the giant cluster is often considered an important indicator when describing the percolation process of the network.
- (3)
Size distribution of finite connected clusters.
At the percolation threshold
, besides the giant cluster (i.e., the largest connected cluster), the network also contains several relatively small connected clusters. By statistically analyzing the sizes of these connected clusters, it is observed that their distribution follows a power-law distribution. The formula is as follows:
where
represents the number of clusters containing
nodes, and
represents the Zipf exponent.
3.4. Reliability Indicators of IWTCN Based on Percolation
The reliability of the transportation system, as defined in this study, is derived from reliability theory. It is characterized by the system’s ability to transport people or goods from one designated location to another within the time estimated by travelers, even when internal or external disruptions are encountered. Fragility is measured by the structural robustness of the network when facing such disturbances. A structural reliability metric for transportation networks is introduced through the application of the percolation process at the critical point of percolation. The focus is placed on interpreting the significance of the “giant component” and “critical point” within the percolation parameters. In a transportation network, a connected sub-cluster, referred to as the “giant component”, is understood as the representation of ports within this sub-cluster being connected through transportation routes. The existence of a giant component is taken to indicate that a majority of MD within the network are interconnected, signifying that the network’s connectivity and accessibility are robust.
In this section, the process of node removal within the network is treated as a percolation process, with the structural robustness of the network under internal and external disturbances being assessed from the perspective of fragility. The network’s structural reliability metric is proposed at the percolation critical point based on the proportion of nodes removed. Initially, the sequence of node removal is selected, as different sequences are expected to have varying impacts on the network’s reliability. Following each node removal, the size of the largest connected component and the second-largest connected component within the network are calculated, with the variations in the sizes of these two components being tracked as the proportion of removed nodes increases. The percolation critical point is then identified by analyzing the changes in the component sizes and the node removal proportion at this critical point is defined as the structural reliability metric for the transportation network. When is equal to 0, no nodes have been removed, resulting in the network being in a fully connected state, where the size of the largest connected component corresponds to the total number of nodes. As increases, nodes and certain subcomponents are progressively separated from the largest connected component, leading to a decrease in the size of and an increase in the size of . The node removal proportion at which reaches its maximum is identified as the critical node removal proportion , which is subsequently defined as the structural reliability metric for the transportation network.
According to percolation theory, the critical node removal proportion is understood to represent the critical point at which a transportation network transitions from global to local connectivity. When the node removal proportion is below , the network is considered to maintain global connectivity, allowing most MDs within the network to establish connections via transportation routes. However, when the node removal proportion exceeds , the transport of people or goods becomes restricted to local regions, and routes are no longer able to traverse the entire network. Consequently, the critical node removal proportion is proposed as a structural reliability metric for the transportation network, reflecting its capacity to withstand internal and external disruptions. A smaller suggests that the network is likely to become paralyzed following the removal of relatively few nodes, indicating weaker structural resilience to such attacks and, therefore, lower reliability. In contrast, a larger implies that the network structure is able to maintain global connectivity even after the removal of a significant number of nodes, demonstrating greater resilience and higher reliability.
4. Results
4.1. Analysis of Topological Characteristics of IWTCN
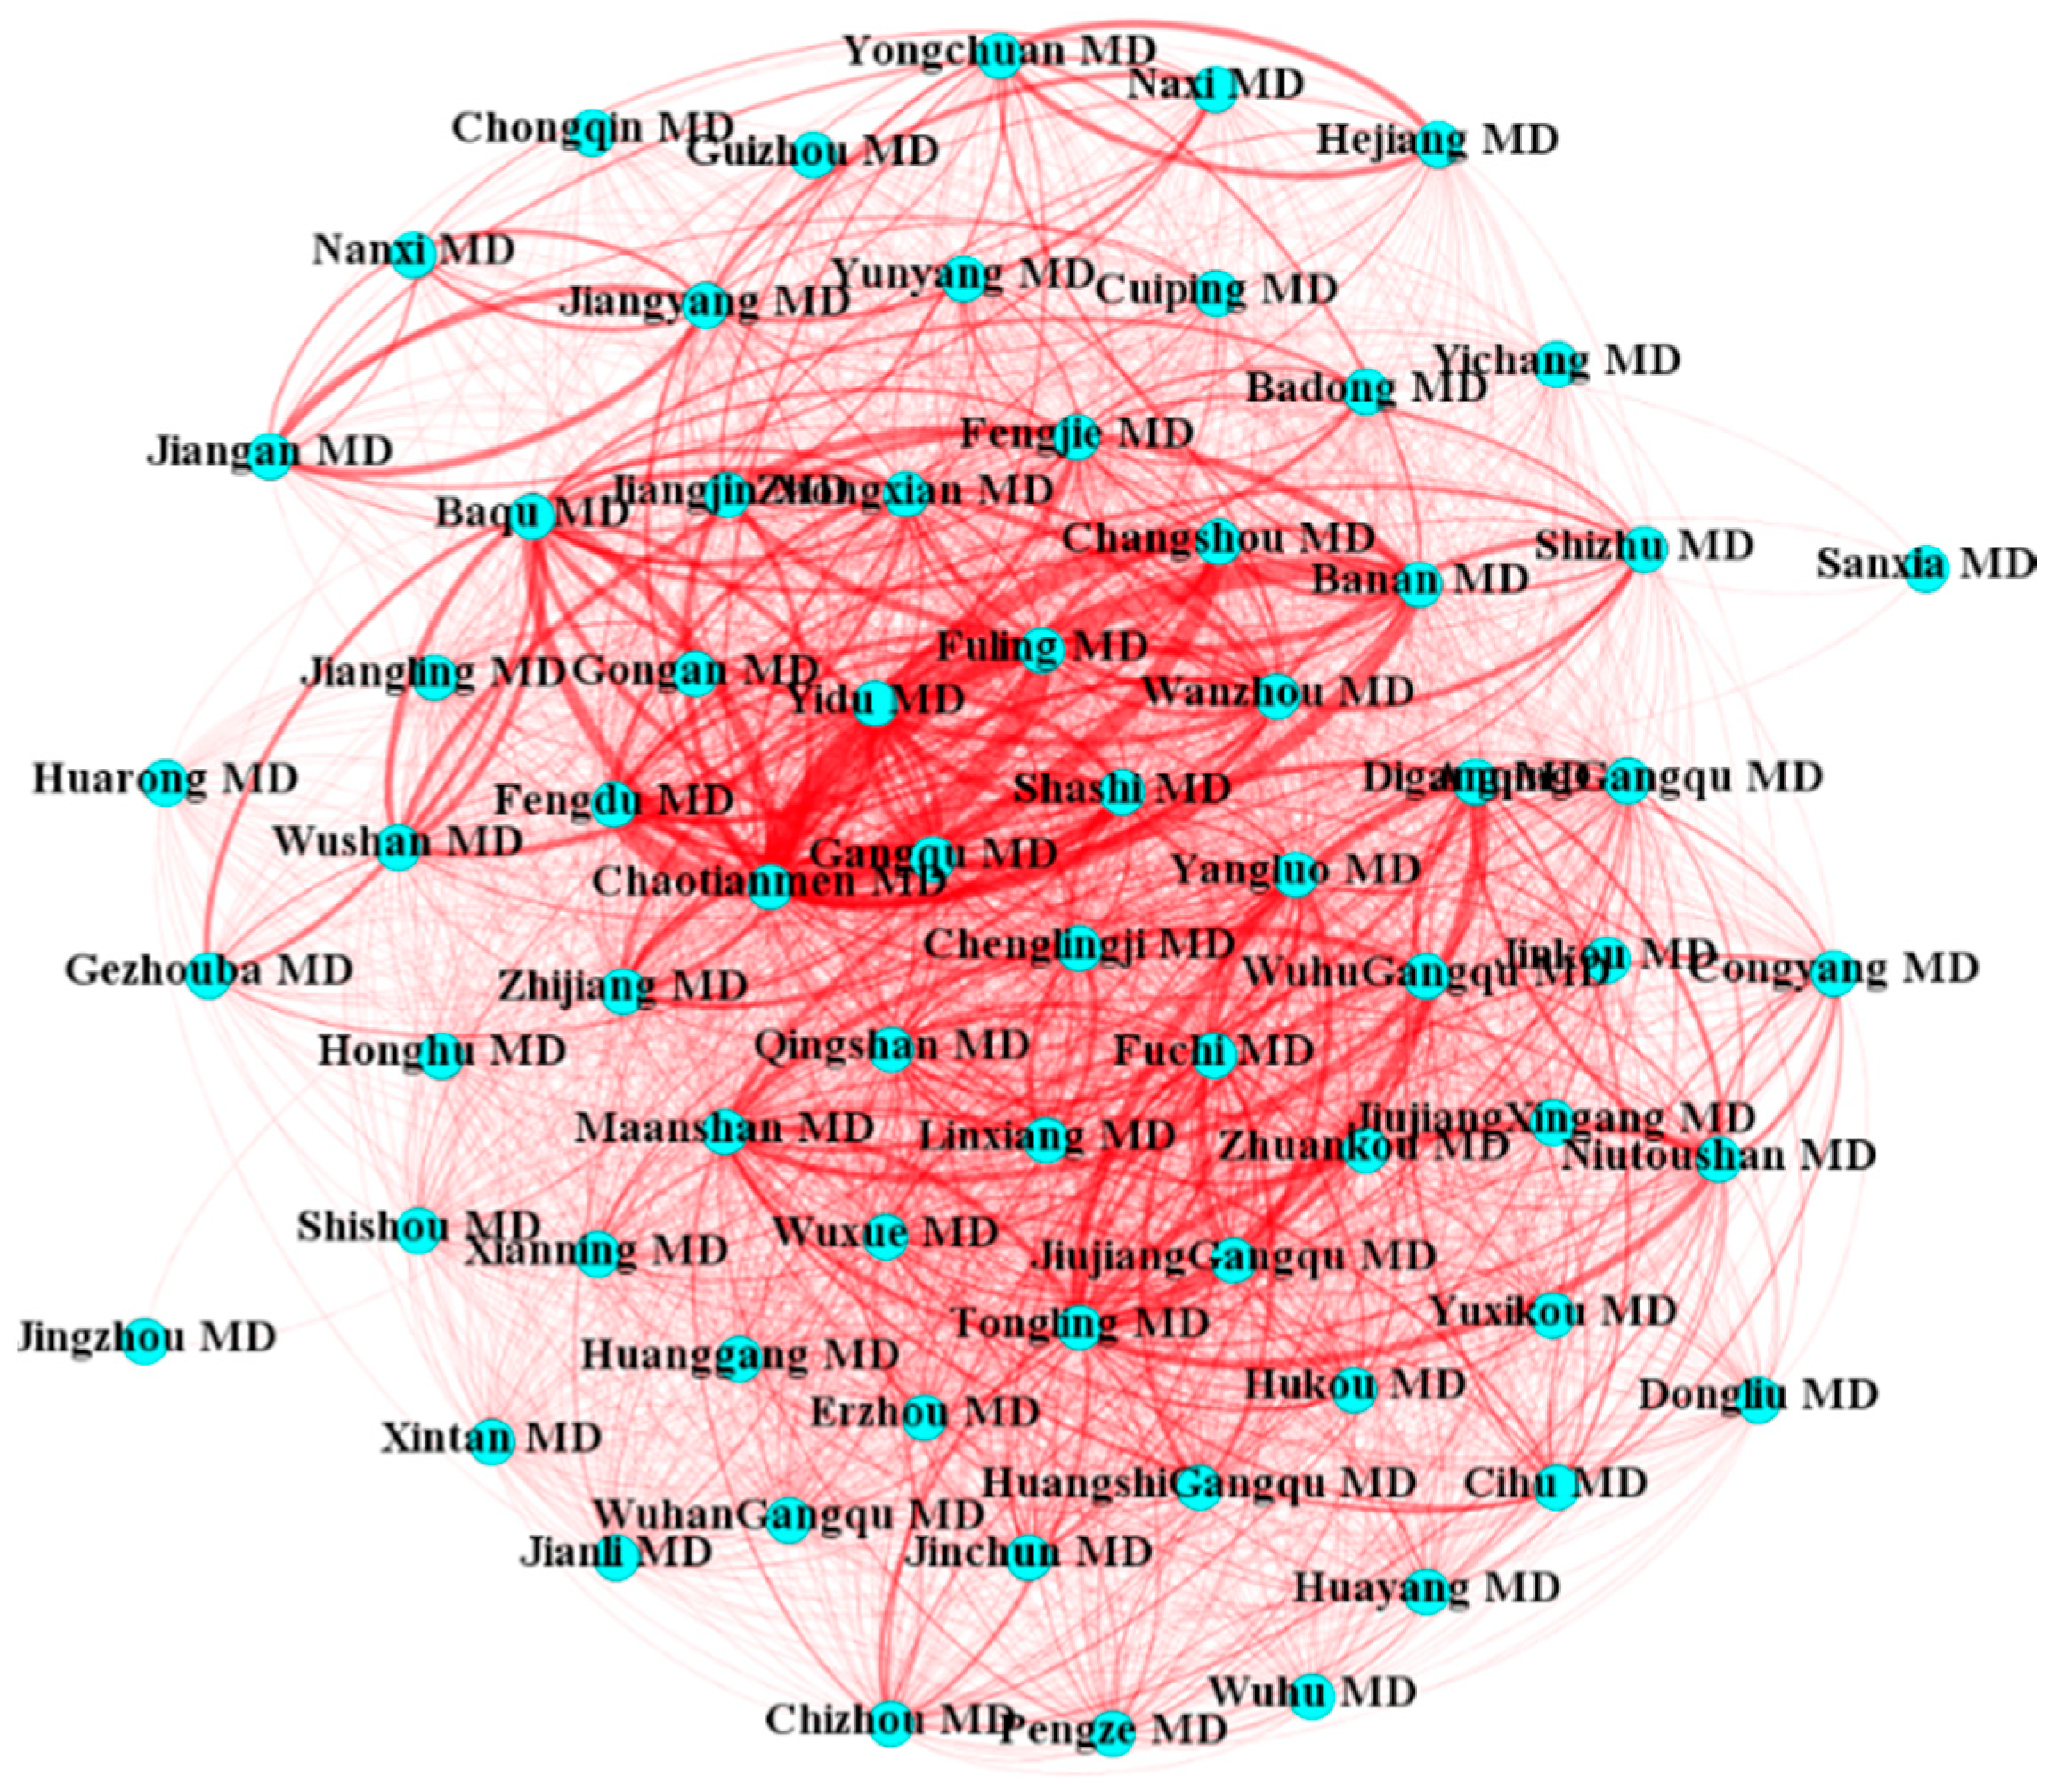
The structure of the IWTCN in the Yangtze River is shown in
Figure 2.
Table 4 presents the fundamental topological characteristics of IWTCN. The average in-degree of IWTCN is approximately 45.07. The top five MDs with the highest in-degree are Chaotianmen (67), Shashi (66), Yidu (66), Chenglingji (66), and Fuling (64). The average out-degree of IWTCN is 46.04. The five MDs with the highest out-degrees are Fuling (65), Chaotianmen (64), Shashi (64), Yidu (64), and Wanzhou (62). The out-degree reflects the traffic volume managed by each MD. The network has a diameter of 3, with an average shortest path length of 1.34. Furthermore, the average clustering coefficient of the network is 0.796. Due to its short path lengths and high clustering, the IWTCN can be classified as a small-world network.
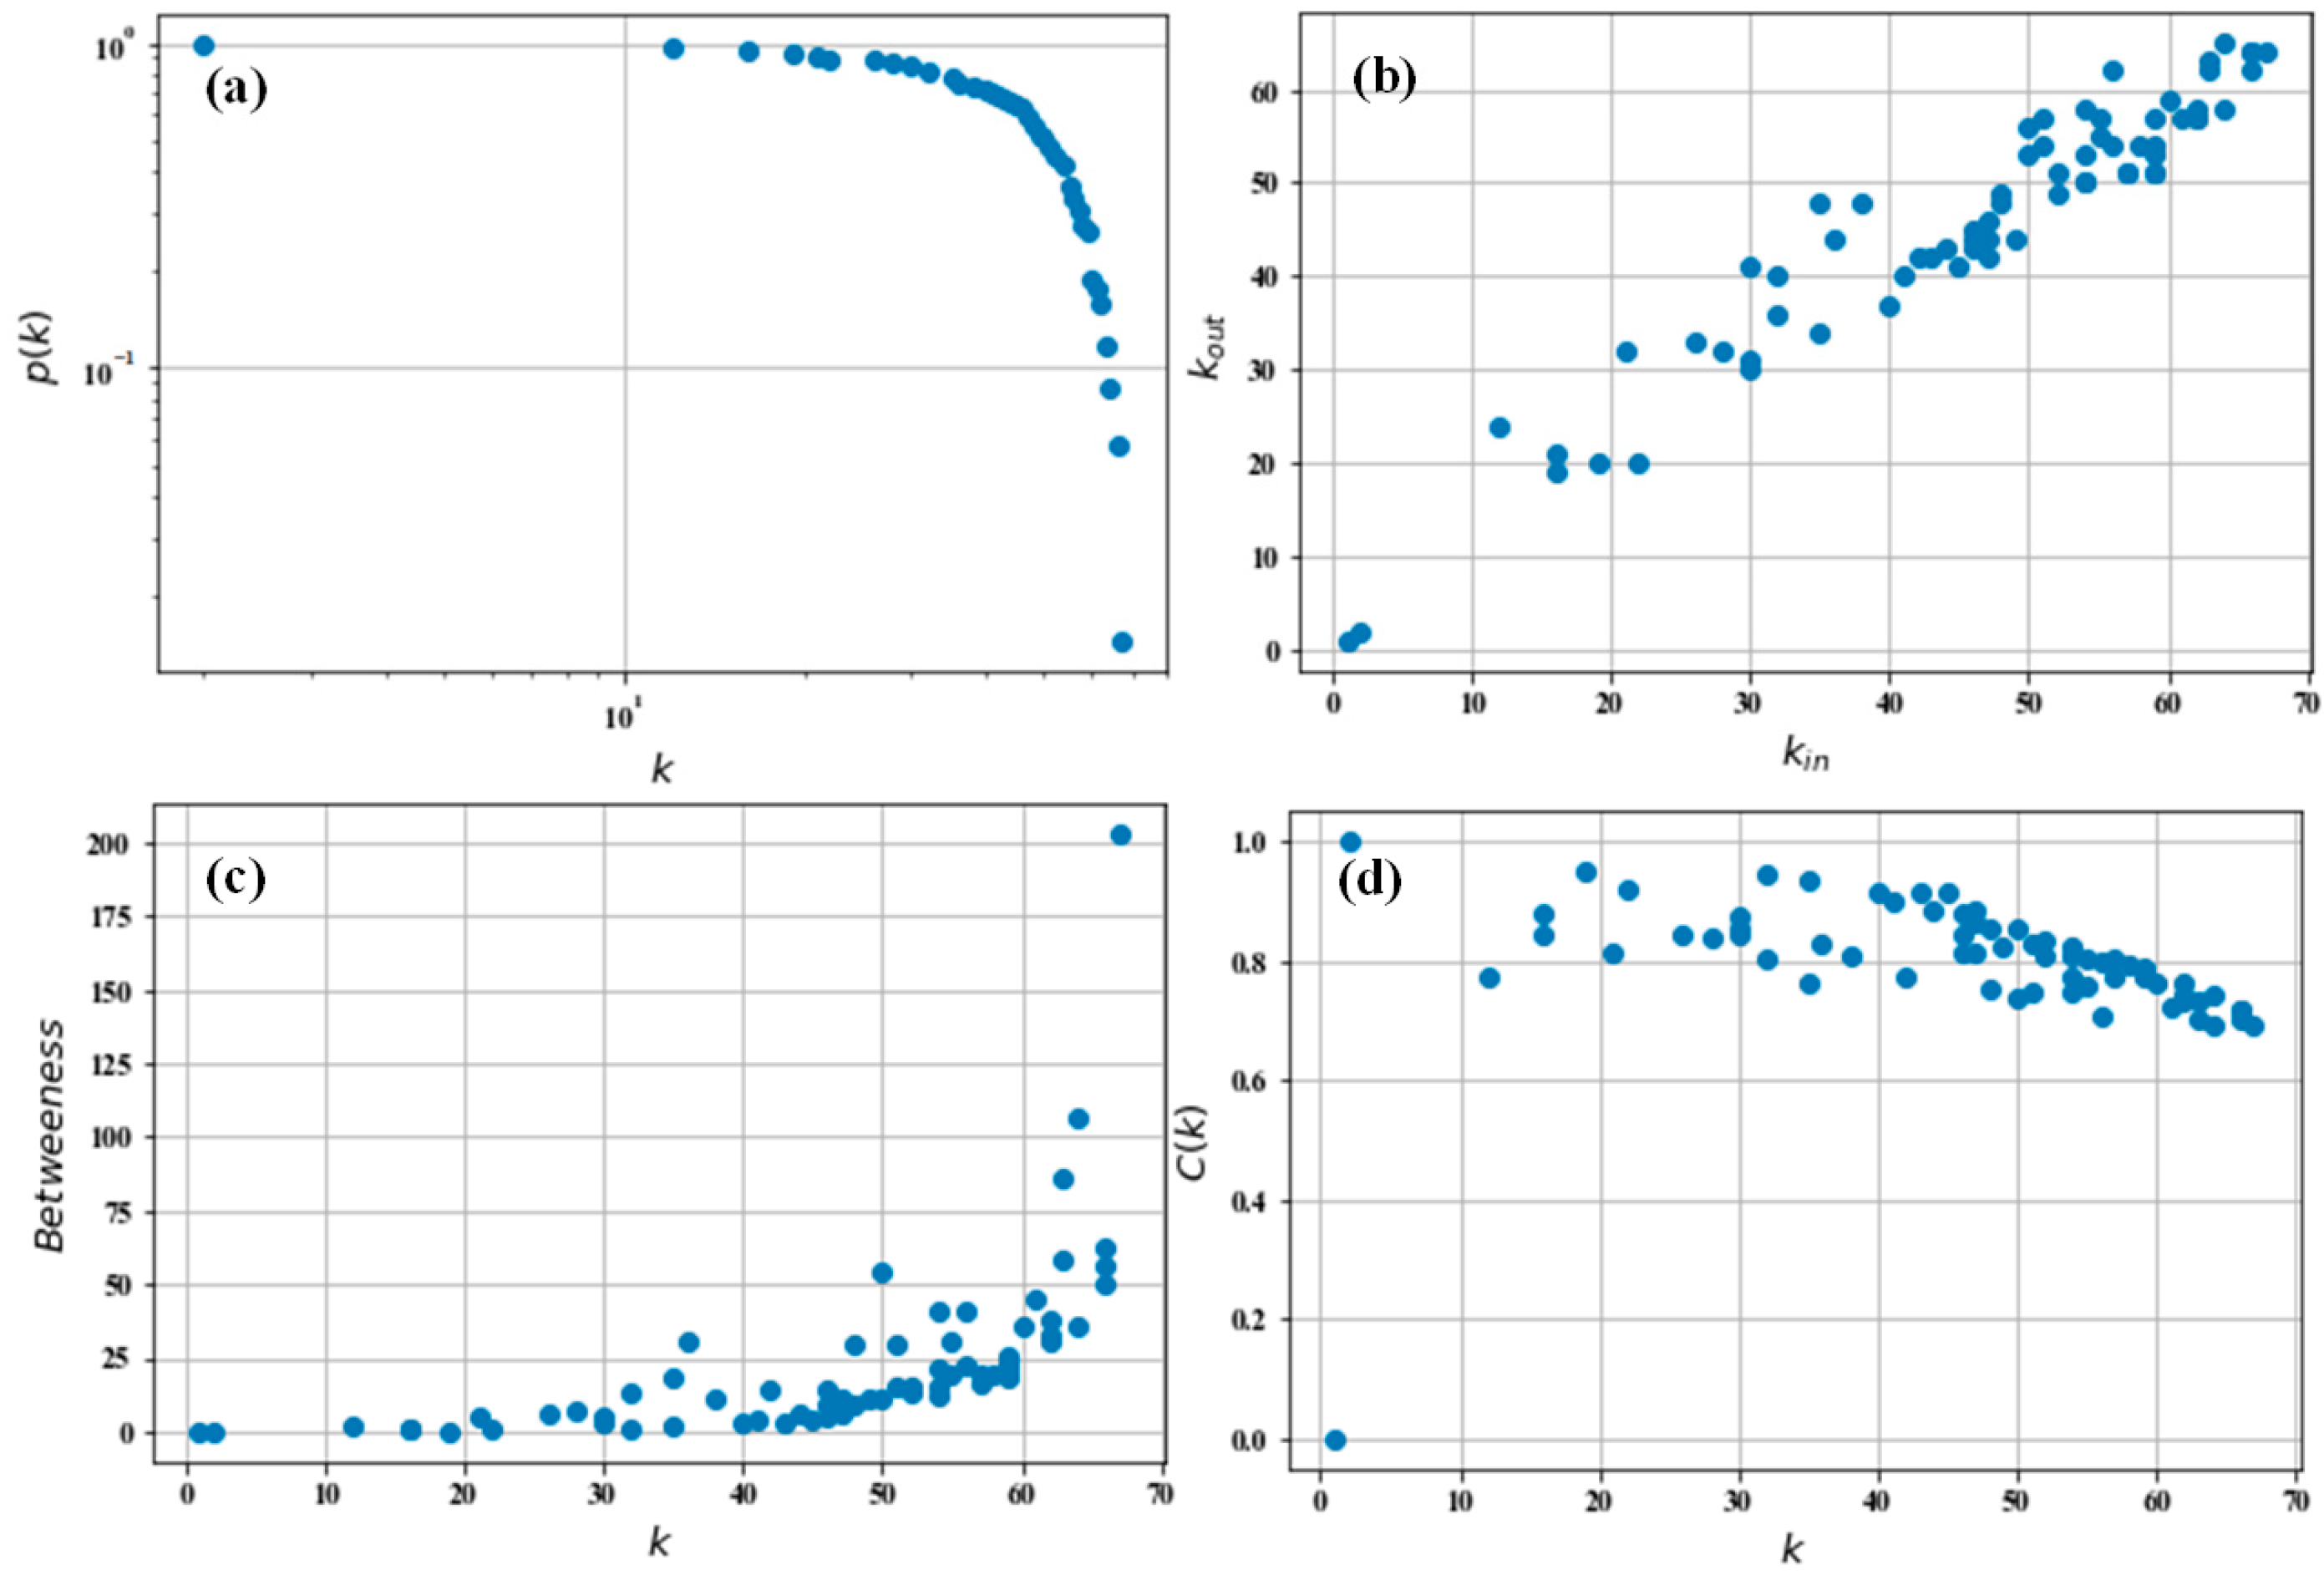
Figure 3 illustrates the distributions of various topological features.
The degree distribution reveals the structure of the IWTCN and its relevance in network analysis. As depicted in
Figure 3a, IWTCN follows a power-law degree distribution. In the directed IWTCN, the cumulative in-degree distribution,
, and cumulative out-degree distribution,
, closely align with the distribution
observed in the undirected network. The relationship between in-degree (
) and out-degree (
) is shown in
Figure 3b. The strong correlation between
and
suggests that IWTCN is a symmetrical network, implying that if a shipping route exists from MD
to MD
, there is a high likelihood of a route in the opposite direction as well. To assess the importance of nodes in the transitivity of the IWTCN, the correlation between degree and betweenness centrality was examined. As shown in
Figure 3c, nodes with higher degrees tend to handle more transfer operations. The relationship between node degree and clustering coefficient is presented in
Figure 3d. It can be observed that while high-degree MDs are densely connected, several low-degree MDs remain sparsely connected. This results in higher clustering coefficients for the low-degree nodes.
Overall, the topological analysis indicates that IWTCN is a small-world network, distinguished by a power-law degree distribution and a superlinear correlation between betweenness and degree.
4.2. Percolation Process on IWTCN for Reliability Analysis
The structural reliability metric was applied to assess the IWTCN. Three types of percolation processes were analyzed: random node deletion, degree-based node deletion, and betweenness centrality-based node deletion.
Random deletion refers to the process where each node has an equal probability (1/63) of being removed from the network. Intentional deletion involves two scenarios: removing nodes in descending order of either degree centrality or betweenness centrality.
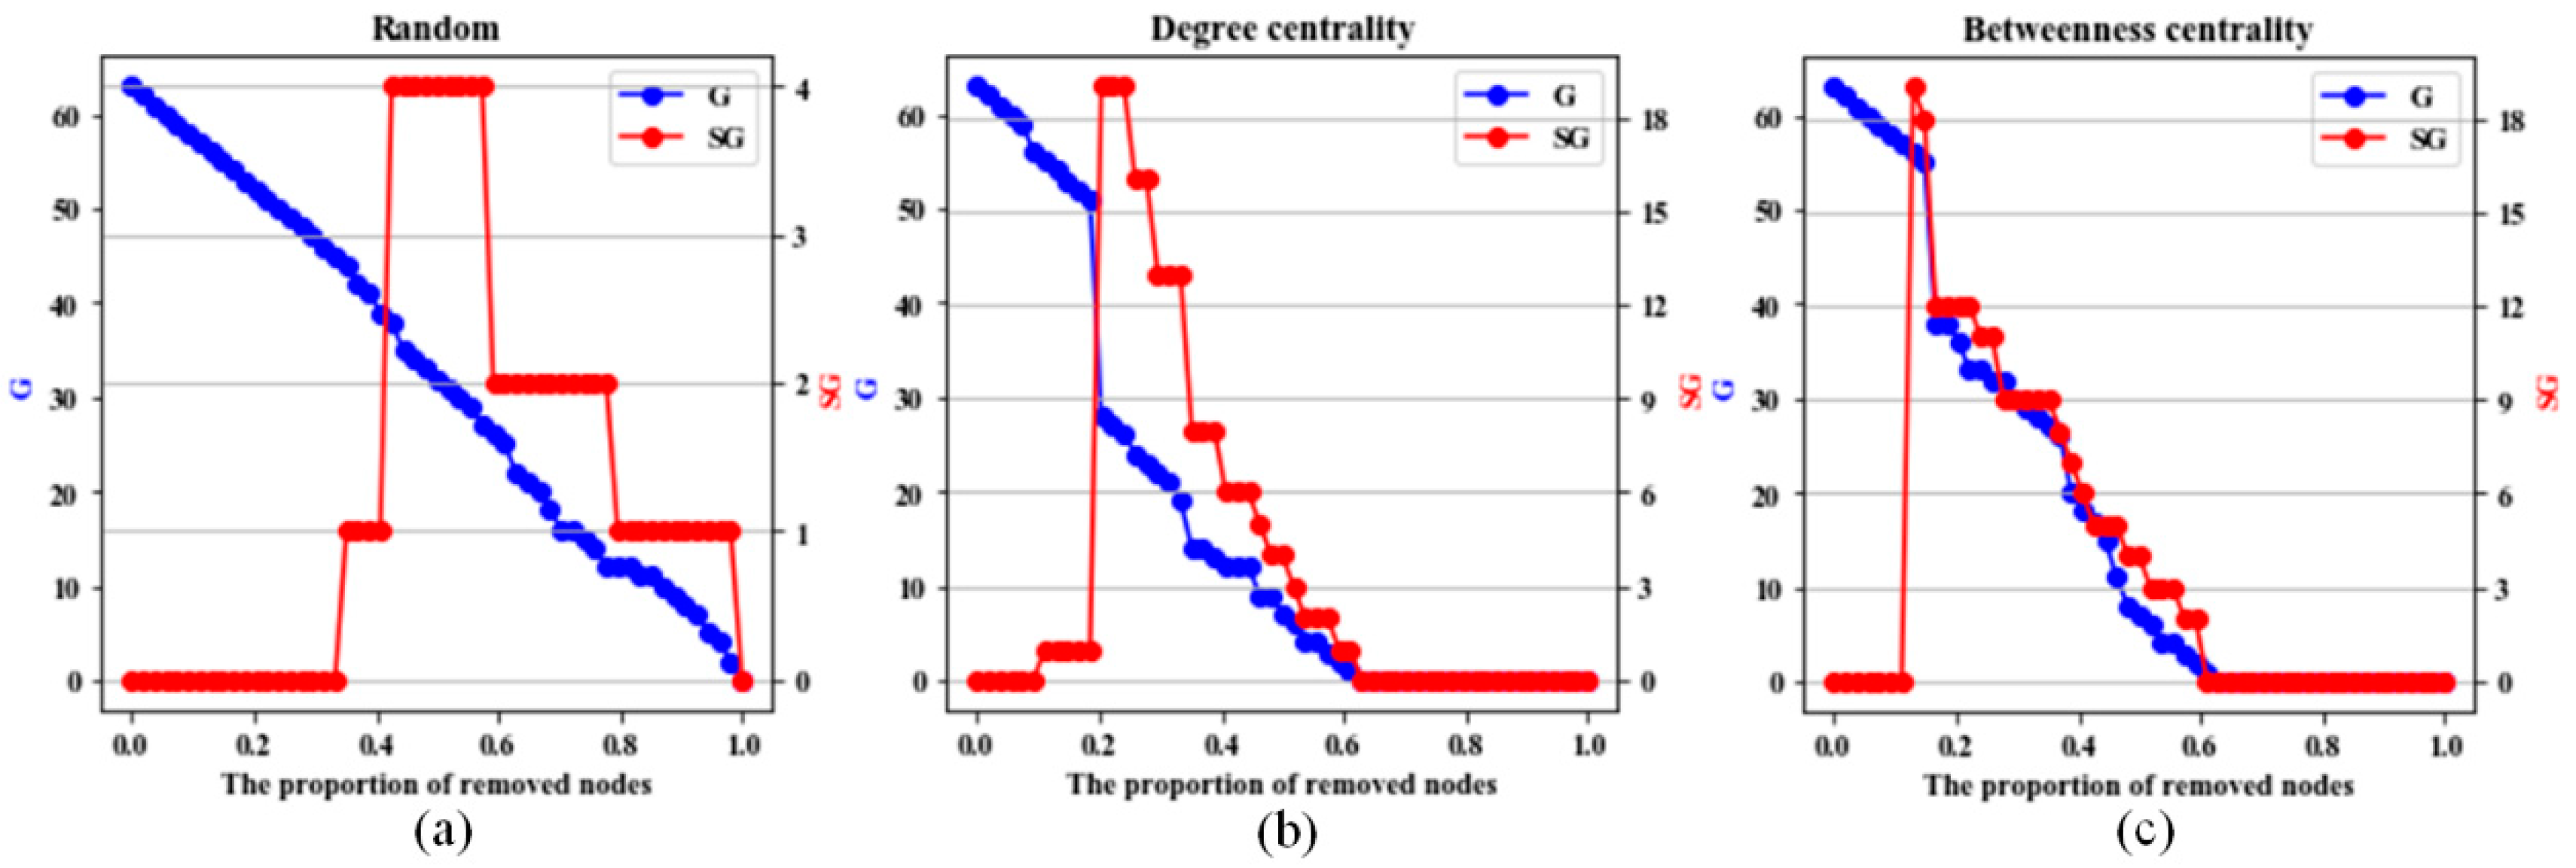
Figure 4 illustrates the changes in the size of the
G and the
SG as the number of removed nodes increases across three scenarios: random deletion, degree centrality-based deletion, and betweenness centrality-based deletion.
A comparison of
Figure 4a–c reveals that the decline in
G is more gradual during random deletion compared to intentional deletion. When 18 nodes (approximately 28% of the total) are removed,
G in the random deletion scenario remains at 45, suggesting that global connectivity is preserved. However, in the intentional deletion scenarios,
G is reduced to 23 and 29, respectively, both falling to less than half of the total number of nodes. At this stage, the network is reduced to local connectivity, significantly impairing its functionality.
These results imply that under random deletion, the decline in G is primarily caused by node removal, leading to the nodes’ separation from the largest connected component. Conversely, under intentional deletion, the removal of high-centrality nodes causes specific subcomponents to detach from the largest connected component, accelerating network fragmentation.
4.3. Identification of Critical Nodes During Percolation Process
The percolation process indicates that the IWTCN has relatively low reliability when subjected to deliberate attacks. The failure of a few local nodes can disrupt the entire network’s connectivity, halting the transportation of goods and hindering normal system operations. The network loses global connectivity when 21% of nodes are removed based on degree centrality and 17% based on betweenness centrality. These local nodes should be regarded as key nodes in the transportation system and prioritized for protection. In actual operations, when a node fails, goods are often rerouted to nearby nodes, which may cause those nodes to fail due to insufficient capacity. Therefore, once key nodes are identified, their influence scope should be determined, and proactive measures should be implemented to prevent further failure spread.
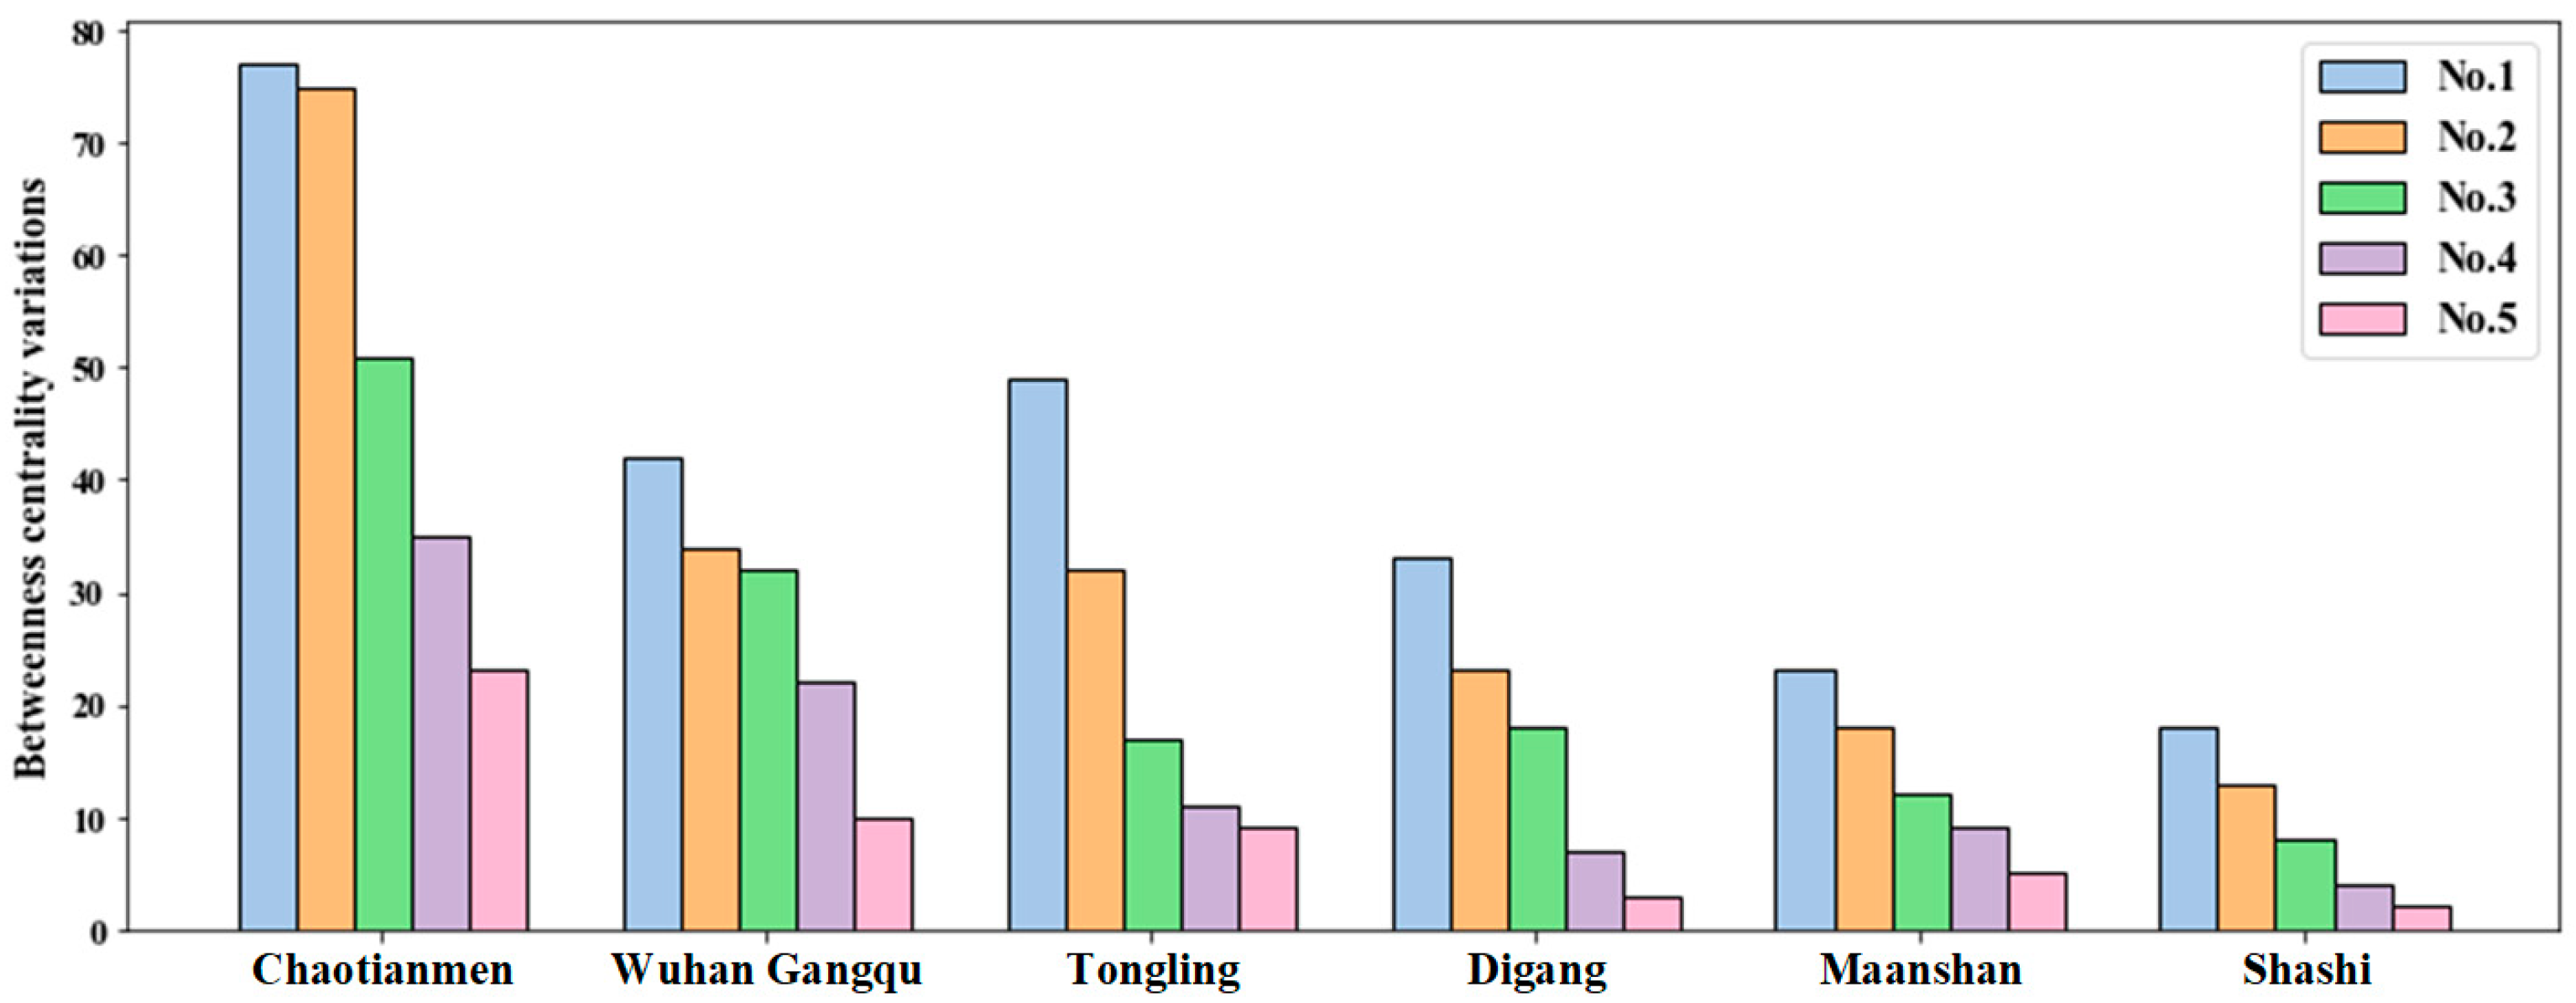
First, key nodes are identified, particularly those removed during global connectivity loss from two types of deliberate attacks. Further analysis shows that under betweenness centrality-based removal, the critical nodes that fail are Chaotianmen (CTM), Wuhan Gangqu (WHGQ), Tongling (TL), Maanshan (MAS), and Shashi (SS). When removing based on degree centrality, the critical nodes that fail are Chaotianmen (CTM), Tongling (TL), Wuhan Gangqu (WHGQ), Digang (DG), and Maanshan (MAS). Next, the influence scope of a key node is determined by observing the increase in betweenness of remaining nodes after its failure. The change in a node’s betweenness reflects its structural impact, and this metric is widely used across various fields. The five nodes with the largest variation in betweenness after a key node fails are considered its influence scope. The results are presented in
Table 5,
Figure 5 and
Figure 6.
Figure 5 illustrates the degree of impact based on betweenness incremental values, which quantify the influence of port failures on the overall transportation network. The results show that the impact degrees of various key port failures differ significantly according to their betweenness incremental values. For instance, Chaotianmen’s (CTM) failure has the greatest impact, with betweenness incremental values exceeding 20 for five ports within its influence range. As a crucial hub, Wuhan Gangqu’s (WHGQ) failure also causes a substantial disruption to the network, particularly in the middle and upper reaches of the Yangtze River. This concentration of impact can be attributed to the geographical distribution constraints of these key ports, where failures at strategic locations can ripple through the entire network, severely affecting regional transport and economic activities.
In the context of the current transportation challenges, this finding is particularly relevant as it underscores the vulnerability of key hubs in critical river networks like the Yangtze. For example, the impact of Chaotianmen’s (CTM) failure demonstrates a situation where a seemingly isolated incident could affect a broad section of the transport system, potentially leading to cascading failures across the region. This highlights the need for enhanced risk management strategies and targeted infrastructure improvements in such key nodes to ensure system resilience.
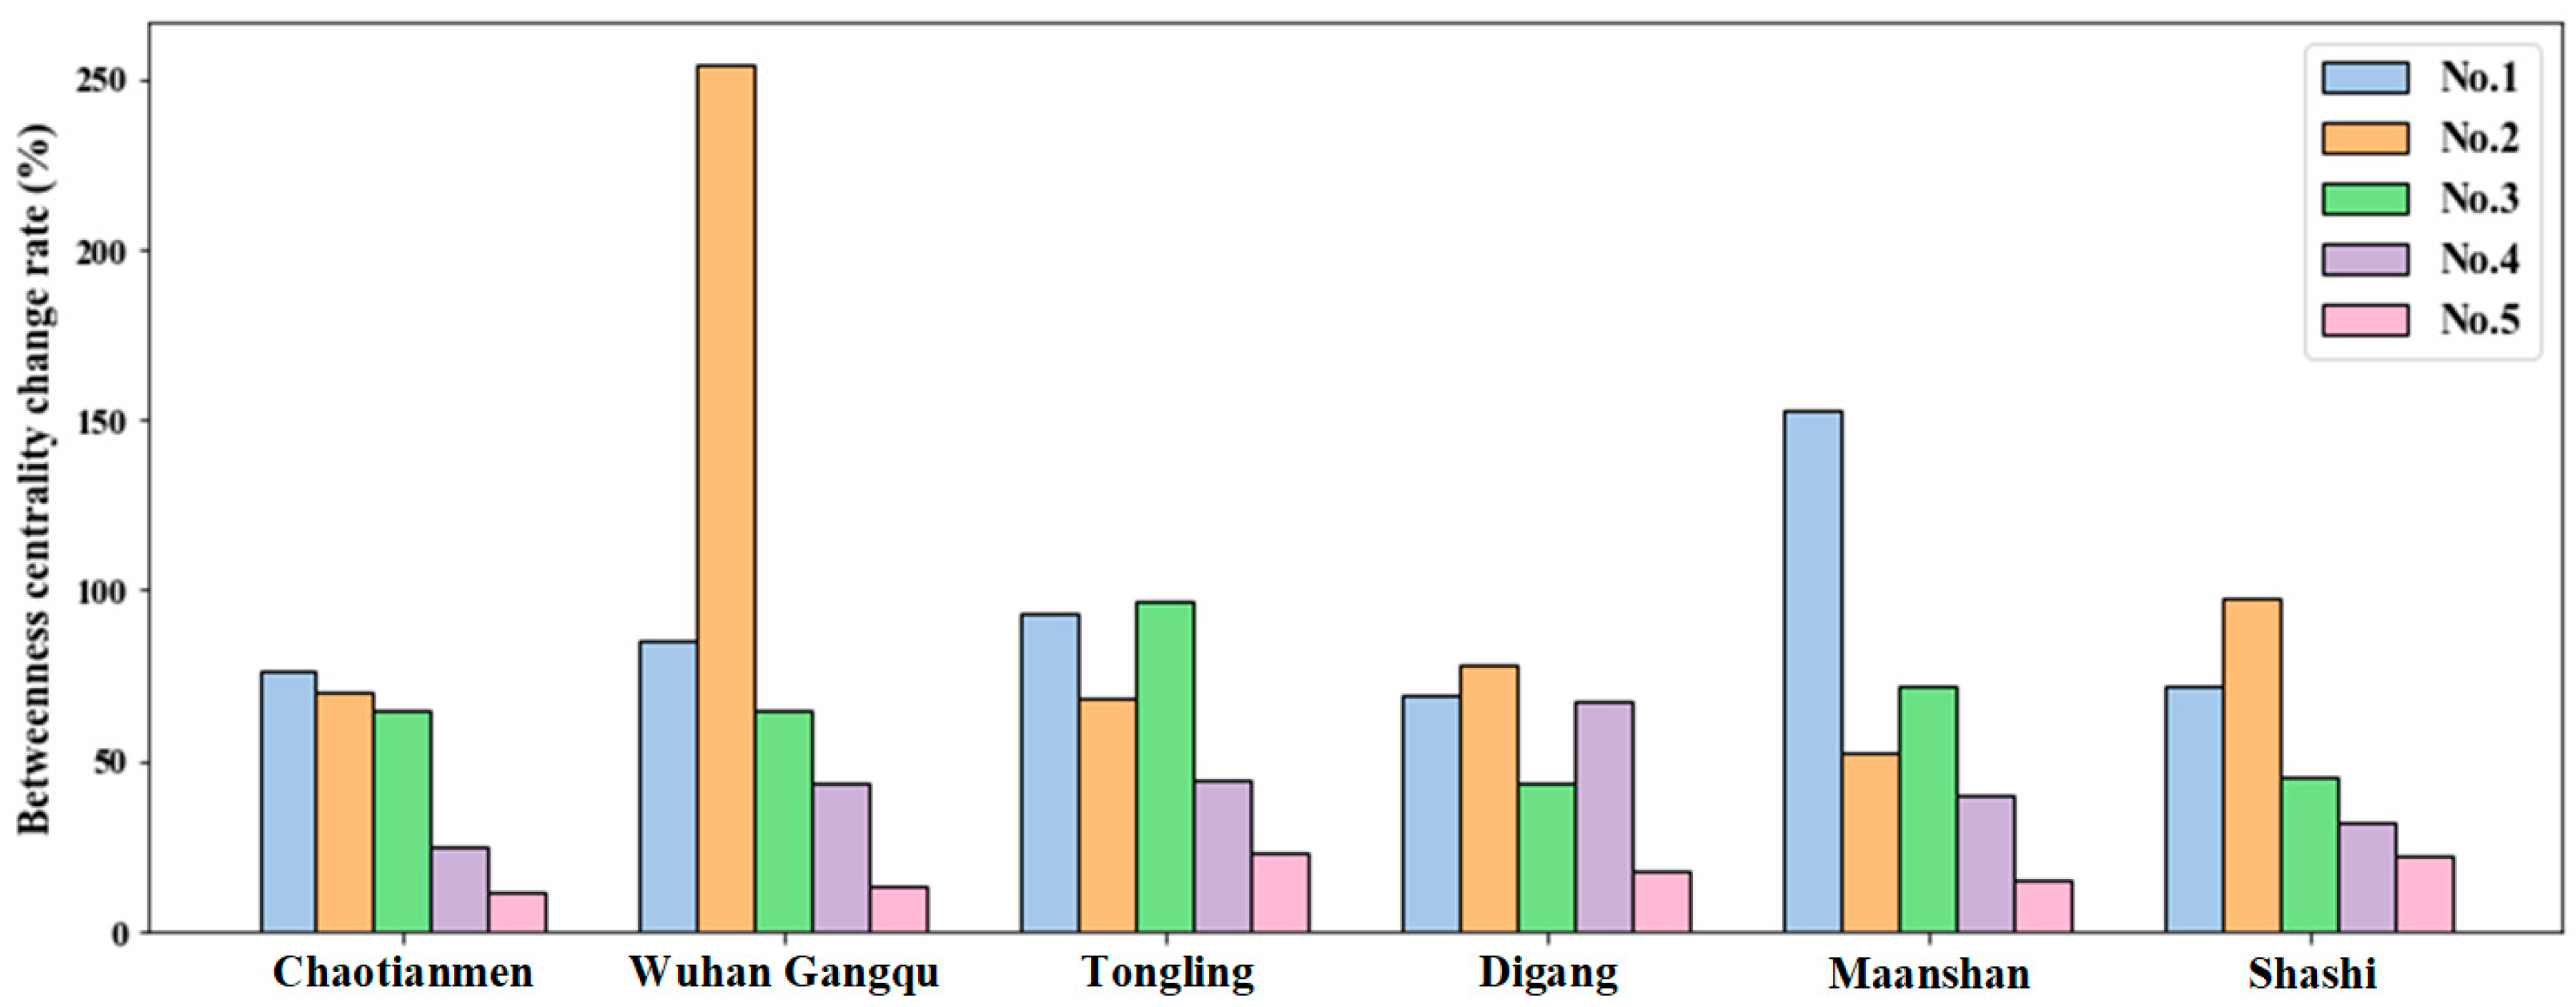
However,
Figure 6 reveals that the changes in betweenness incremental rates differ significantly from those in betweenness incremental values. The betweenness incremental rate is a more nuanced metric, as it accounts for the load-bearing capacity of the nodes. Specifically, it reflects how much additional load a node can handle before its failure leads to widespread disruption. For a given betweenness incremental value, a higher betweenness incremental rate indicates a greater capacity required to absorb additional load. For example, following Wuhan Gangqu’s (WHGQ) failure, the betweenness incremental values of Chaotianmen (CTM) and Chenglingji (CLJ) are similar, suggesting that both are similarly impacted in terms of the overall flow of goods and services. However, Chaotianmen’s (CTM) betweenness incremental rate is 85%, while Yidu (YD)’s exceeds 254%. This discrepancy indicates that Yidu (YD), despite having a similar betweenness incremental value, has a much lower capacity to handle the additional traffic load caused by Wuhan Gangqu’s (WHGQ) failure. Therefore, Yidu (YD) must be better prepared to mitigate the consequences of Wuhan Gangqu’s (WHGQ) failure, including reinforcing its infrastructure and optimizing traffic management to prevent further fault propagation across the network.
These findings directly relate to the practical problem of ensuring robust and resilient transportation networks, particularly in regions with critical hubs like the Yangtze River. The research demonstrates the importance of not only identifying key nodes with high betweenness but also evaluating their load-bearing capacity to better allocate resources for infrastructure improvement. Specifically, high-betweenness nodes with low incremental rates, such as Yidu (YD), should be prioritized for reinforcement to avoid cascading failures in the event of neighboring node failures. This insight has important implications for disaster preparedness, infrastructure planning, and network optimization in real-world transportation systems. Moreover, these findings highlight the importance of proactive measures to protect critical nodes. In real-world maritime operations, when a critical node fails, rerouting traffic to nearby nodes may lead to their overload, causing additional failures. Therefore, identifying key nodes and understanding their influence on the network’s structure allows for better decision-making in infrastructure planning and disaster response, ensuring the resilience and sustainability of transportation systems.
5. Conclusions
This study used percolation theory to assess the reliability and robustness of the IWTCN in the Yangtze River. Key vulnerabilities affecting network connectivity under different node removal scenarios were identified through an in-depth analysis of the structural characteristics of this complex network. Certain nodes, especially those with high degree and betweenness centrality, were found to play a critical role in maintaining global connectivity. The importance of protecting strategic nodes to prevent cascading network failures was emphasized. This research provides valuable insights into improving waterborne transportation systems, particularly by enhancing the resilience of critical waterway infrastructures. Simulations of targeted disruptions and random failures showed that the IWTCN in the Yangtze River has low reliability under deliberate attacks, especially when high-centrality nodes are compromised. These findings can guide future traffic management strategies, particularly in optimizing emergency response systems and mitigating potential disruptions caused by natural disasters, accidents, or malicious actions. This research provides theoretical support for emergency response while ensuring smooth waterway operations.
This study provides important decision-making support for maritime policymakers. The findings highlight the vulnerabilities of critical ports and transportation hubs, particularly those with high betweenness centrality. Policymakers should focus on these nodes’ vulnerabilities and implement targeted protective measures to prevent global network disruptions caused by node failures. Additionally, as global trade evolves and climate change introduces uncertainty, policymakers can use the framework provided in this study to assess and strengthen the resilience of key maritime routes and ports, ensuring that connectivity in the transportation network remains intact during extreme weather events, port congestion, or unforeseen incidents. For port authorities and network operators, the study emphasizes the necessity of strengthening the protection of key nodes in infrastructure planning and daily operations. Ports and major transport hubs, given their central role in the transportation network, should be prioritized for infrastructure reinforcement and risk management. By implementing real-time monitoring and emergency response systems, port authorities can respond more effectively to potential failures and mitigate the economic and social impacts of transportation disruptions. The study also indicates that dynamic simulations based on percolation theory can help operators develop more flexible emergency plans, particularly when facing extreme weather or sudden transportation disruptions, enhancing their response capabilities.
The percolation theory model used in this study can also help assess the resilience of other river systems in the face of node failures. For example, river systems like the Amazon, Rhine, and Mississippi are key trade and regional logistics channels, similar to the Yangtze River. By applying similar analyses to these rivers, we can reveal their vulnerabilities during peak transportation periods or when facing natural disasters, providing valuable insights for their management and protection. The results show that maintaining key nodes in these river systems—particularly transportation hubs, ports, and river junctions—can significantly enhance network stability and prevent transportation disruptions from causing major economic impacts. This study is not limited to analyzing a single region’s network but provides a framework that can be extended to global maritime networks. As a critical infrastructure supporting international trade, the connectivity of global maritime networks directly affects the global economy. The study indicates that by identifying and protecting key nodes in the global maritime network, the overall system’s resilience can be improved, reducing the impact of natural disasters, accidents, or malicious actions on global shipping. To address the rapid changes in global trade, policymakers should use this study’s framework to assess the vulnerabilities of major global shipping lanes and ports and formulate more forward-looking maritime policies to enhance the resilience of the maritime transportation system.
As intelligent and automated technologies are gradually implemented in waterway management, this study’s results can also serve as a theoretical foundation for optimizing intelligent transportation systems. Real-time data analysis combined with network optimization allows dynamic adjustments to shipping schedules, improving transport efficiency and reducing environmental and economic losses. By identifying high-risk nodes, future intelligent shipping systems can automatically reroute or divert, ensuring the smooth operation of IWTCN even under high loads or sudden incidents.
While this study provides valuable insights into the reliability and resilience of transportation networks, there are several limitations to consider. (i) Many of the models used in this study assume a static network topology. However, transportation networks are dynamic and subject to changes over time due to factors such as seasonality, political conditions, and infrastructure changes. These dynamic elements are not fully captured in this analysis, which may affect the study’s applicability to systems that experience frequent changes in traffic flow or network structure. (ii) The study primarily focuses on networks like the Yangtze River system. While the findings are valuable for this context, their applicability to other geographical regions with different network configurations, infrastructures, or socio-political contexts may be limited. Further studies should explore how the conclusions can be extended to other transportation systems, both inland and maritime. (iii) The study assumes that node failures are binary (i.e., nodes either fail or remain operational) and does not account for more complex scenarios, such as partial failures or gradual degradation of performance. More advanced failure models could offer a more realistic representation of how transportation networks operate under stress. (iv) While the study examines the impact of node failures based on static conditions, it does not fully incorporate temporal factors, such as traffic flow changes over time or the influence of seasonal disruptions. Temporal variations in traffic, economic conditions, and environmental factors are important to consider, as they can significantly influence the resilience of the network. Despite these limitations, the study provides a foundation for understanding the robustness of transportation networks and offers a framework for future research aimed at improving network resilience and disaster preparedness.


