1. Introduction
As a new type of multifunctional structural material, composite materials are highly valued for their light weight and high strength. Compared with traditional metal materials, composite materials have significant advantages in reducing a ship’s weight, enhancing structural strength, and improving corrosion resistance, showing great potential in the maritime industry [
1,
2].
Composite materials were first applied in U.S. Navy vessels and rapidly expanded in use [
2]. In 1992, France utilized composite sandwich panels in the superstructure of the frigate “La Fayette”, significantly lowering the ship’s center of gravity [
3]. The superstructure of the U.S. Navy’s latest Zumwalt-class (DDG-1000) destroyer also adopted composite and integrated structural forms [
4].
Although composite materials surpass traditional metal materials in many aspects, the fatigue issues of composite ship structures under long-term complex loading conditions still face great challenges. Their fatigue behavior under prolonged loading and complex environments remains unclear. The high costs of ship construction and maintenance make extending structural fatigue life and reducing maintenance expenses a critical task in the design phase. Therefore, it is crucial to establish a fatigue evaluation method and study the fatigue degradation mechanisms of composite ships.
The issue of fatigue in composite materials used in ship structures can be traced back to the 2002 project on the Royal Australian Navy Adelaide-class frigate, led by the Australian Defence Science and Technology Organisation [
5]. This project first introduced the concept of fatigue issues in composite ship structures and explored the feasibility of composite bonding technology to enhance the ship superstructure. The research addressed the problem of fatigue-induced cracks in aluminum superstructures by reinforcing vulnerable areas of the frigate with carbon fiber-reinforced composite materials. The study demonstrated that carbon fiber-reinforced polymer (CFRP) materials effectively reduced stress in areas of high stress concentration through bonding with the aluminum alloy structure.
In the following decades, numerous scholars conducted in-depth studies on the fatigue performance of marine composites. Soni et al. [
6] designed a series of fatigue tests to investigate the fatigue behavior of foam-core carbon fiber/epoxy and glass fiber/epoxy sandwich beams. Zhang et al. [
7] studied the fatigue behavior of bonded Pi-joint in woven composites under tensile–tensile cyclic loading. Through fatigue and monotonic loading tests, they examined the durability of these bonded joints and found that the filled area and the tip area of the joint were potential weak spots. Altunsaray et al. [
8] studied the fatigue behavior of E-glass fiber-reinforced polyester composites in seawater environments, exploring the effects of different thicknesses and fiber orientations on fatigue characteristics. Alila et al. [
9] developed a new testing geometry to better simulate the fatigue life of composite sandwich structures in real-world conditions. Karr et al. [
10] further validated the application of composite patches in ship hull crack repairs through physical experiments, focusing on the impact of bonding techniques and patch geometry on fatigue performance.
Currently, research on the fatigue behavior of marine composites has progressed to analysis at the hull joint. Carvajal et al. [
11] conducted an impact fatigue study on composite structures of high-speed ships, investigating the durability of bonded joints and crack propagation behavior during periodic contact of high-speed hulls with the water surface. Guo et al. [
12] conducted experiments and numerical simulations on T-shaped joints in sandwich structures, exploring the failure mechanisms and crack propagation process under tensile loads by reinforcing the joints with composite fasteners. Meanwhile, in 2022, Li et al. [
13] conducted experimental research on the fatigue characteristics of L-shaped joints in sandwich composites, revealing the failure modes under different fatigue loading conditions and proposing a displacement-based fatigue life prediction model through numerical analysis.
Though significant progress has been made in researching the fatigue performance of marine composite materials, the exploration of fatigue assessment methods for ship structures remains at an early stage. Guo et al. [
12] analyzed typical joints of composite hulls; however, their research was limited to fitting load-fatigue life curves of test specimens, which presents limitations for fatigue life evaluation of ships. Moreover, most studies focused on material-level performance tests. While these studies accumulated extensive data, an effective link between this data and the fatigue life assessment of real hull structures has yet to be established. Therefore, transforming existing composite fatigue performance data into practical applications for hull structure fatigue evaluation and developing a practical fatigue life assessment method have become critical issues that urgently need to be addressed.
A fatigue calculation method for composite hull structures based on the combination of material stiffness degradation and spectral analysis is proposed in this research. Through standard fatigue tests of composite materials, the stiffness degradation model parameters of the target ship material under tension–compression loading were obtained. A finite element model of the target ship structure was established, and the fatigue evaluation of four typical hotspots was completed by combining the stiffness degradation and spectral fatigue analysis methods.
2. The Basic Theory of Fatigue Analysis for Composite Ships
In the marine environment, composite ship structures endure long-term exposure to complex random wave loads, which exacerbates fatigue accumulation effects. Under such fatigue loads, stiffness, as a measurable macroscopic parameter, effectively describes the entire fatigue failure process of the material. Although the traditional S–N curve method is widely used for fatigue life prediction, it is based on the statistical relationship between cyclic stress and life, making it challenging to capture the progressive damage and sudden failure behavior occurring during material fatigue. By introducing a stiffness degradation model under random loads and integrating it with the spectral analysis method of hull structures, the nonlinear process of gradual and sudden stiffness degradation can be dynamically characterized, enabling more accurate fatigue life predictions of hull structures under different sea conditions.
2.1. The Degradation Pattern of Material Stiffness Under Random Loading Conditions
Under the action of fatigue loads, stiffness, as a macroscopic measurable parameter of the material, can be used to describe the entire process of fatigue failure. It is necessary to establish a corresponding stiffness degradation model for the material. For constant amplitude fatigue tests, the normalized model for residual stiffness can be expressed in the following form [
14].
In Equation (1),
E(
n)/
E(0) is the stiffness ratio of the material after
n cycles relative to the initial stiffness
E(0), and
N is the fatigue life of the specimen, as measured in fatigue tests. The parameter υ is a function of the applied stress
S, denoted as υ(
S). It can be expressed by the following equation. The parameters
P1 and
P2 can be determined from experimental data.
The failure stiffness
E(
N) cannot be measured until the specimen fails. However, we can establish the ratio of initial stiffness to failure stiffness by applying a failure strain criterion [
15]. It is assumed that specimen failure occurs when the fatigue strain reaches the ultimate tensile strain. Thus, the relationship between the applied stress,
S, and the ultimate strength,
, can be represented using the stiffness ratio.
The stress response of a ship structure in waves is not of a single magnitude. This paper references the stiffness degradation model under random loading proposed by Wu et al. [
16] based on the correlation between stiffness parameters and fatigue loading. Equation (1) can be used to estimate the residual stiffness variation under any stress level. The differential equation for stiffness degradation is determined under the given applied stress,
, as follows:
Using Equation (1), the ratio of cycle number to fatigue life for applied stress
can be written as
By substituting Equations (3) and (5) into Equation (4), the final expression for the rate of stiffness variation in relation to the stress level can be obtained as follows:
So far, the degradation process of material stiffness degradation in relation to applied stress has been obtained. In the random fatigue damage process based on the frequency domain, the number of cycles dn corresponding to each stress level (stress amplitude or stress peak) needs to be obtained through spectral analysis.
2.2. Fatigue Spectral Analysis Method
In ocean engineering, accurately simulating the irregularity of ocean waves is crucial for predicting the structural response of ships and offshore platforms. One of the most commonly used methods to describe the ocean surface in spectral fatigue analysis is through the wave spectrum, which approximately represents the energy distribution of waves at different frequencies [
17,
18]. The most commonly used wave spectrum is the two-parameter Pierson–Moskowitz (PM) spectrum,
, which is expressed as:
where
HS is a significant wave height,
TZ is the zero-crossing period, and ω is the wave frequency.
In the analysis, the actual response frequency should be the encounter frequency
ωe, which is related to the wave frequency
ω, heading angle
θ, and ship speed
as follows:
Accordingly, the input wave spectrum
should be converted into a wave spectrum
, expressed in terms of the encounter frequency and related to the wave heading angle
θ. This can be achieved by applying the energy conservation relationship for the differential elements of the corresponding wave frequency.
According to Equation (9), the wave spectrum expressed in terms of the encounter frequency can be obtained as:
Under the assumption that the ship structure is a linear system, the stress energy spectrum
can be obtained from the following:
where
is the stress transfer function.
Then, the nth-order spectral moment of the response process for a given heading can be described as follows:
Assuming that the stress variation in the ship structure caused by waves under specific sea conditions is a narrow-band Gaussian random process, the probability density function of the stress peaks follows a Rayleigh distribution [
19]. The short-term probability density function of the stress range can be expressed as:
To obtain the number of stress cycles within a given time, the mean zero-crossing rate
of the alternating stress process must be provided, which represents the average number of times the process crosses the zero mean with a positive slope per unit time. Its expression is:
The long-term distribution of the stress range is obtained by combining the short-term distributions provided above with the distribution of various sea states that may be encountered during operation. This is represented as a weighted combination of the short-term distributions, and its Weibull distribution function is:
Thus, the
in the stiffness degradation in Equation (6) mentioned above can be expressed as:
By substituting Equation (16) into Equation (6) and integrating with respect to stress
S, the final expression for the residual stiffness degradation of the ship structure under random fatigue loading can be obtained as:
3. Fatigue of Composite Laminate
To ensure the accuracy of subsequent fatigue assessments of the hull structure, it is essential to conduct fatigue performance tests on the target ship composite materials and obtain their fatigue performance parameters. The fatigue tests in this study were designed according to the American Society for Testing and Materials Standards of composite material fatigue testing [
20,
21]. Through the fatigue test data, the stiffness degradation parameters of the material under different stress range levels in Equation (17) can be obtained.
3.1. Fatigue Experiments of Composite Laminate
In order to investigate the fatigue stiffness degradation behavior of E-glass fiber-ethylene resin laminates at room temperature, fatigue tests for the material were designed for this section. The laminates were first pressed using a hot-press molding process to obtain composite panels measuring 1000 mm × 1000 mm, which were then cut into rectangular standard fatigue specimens.
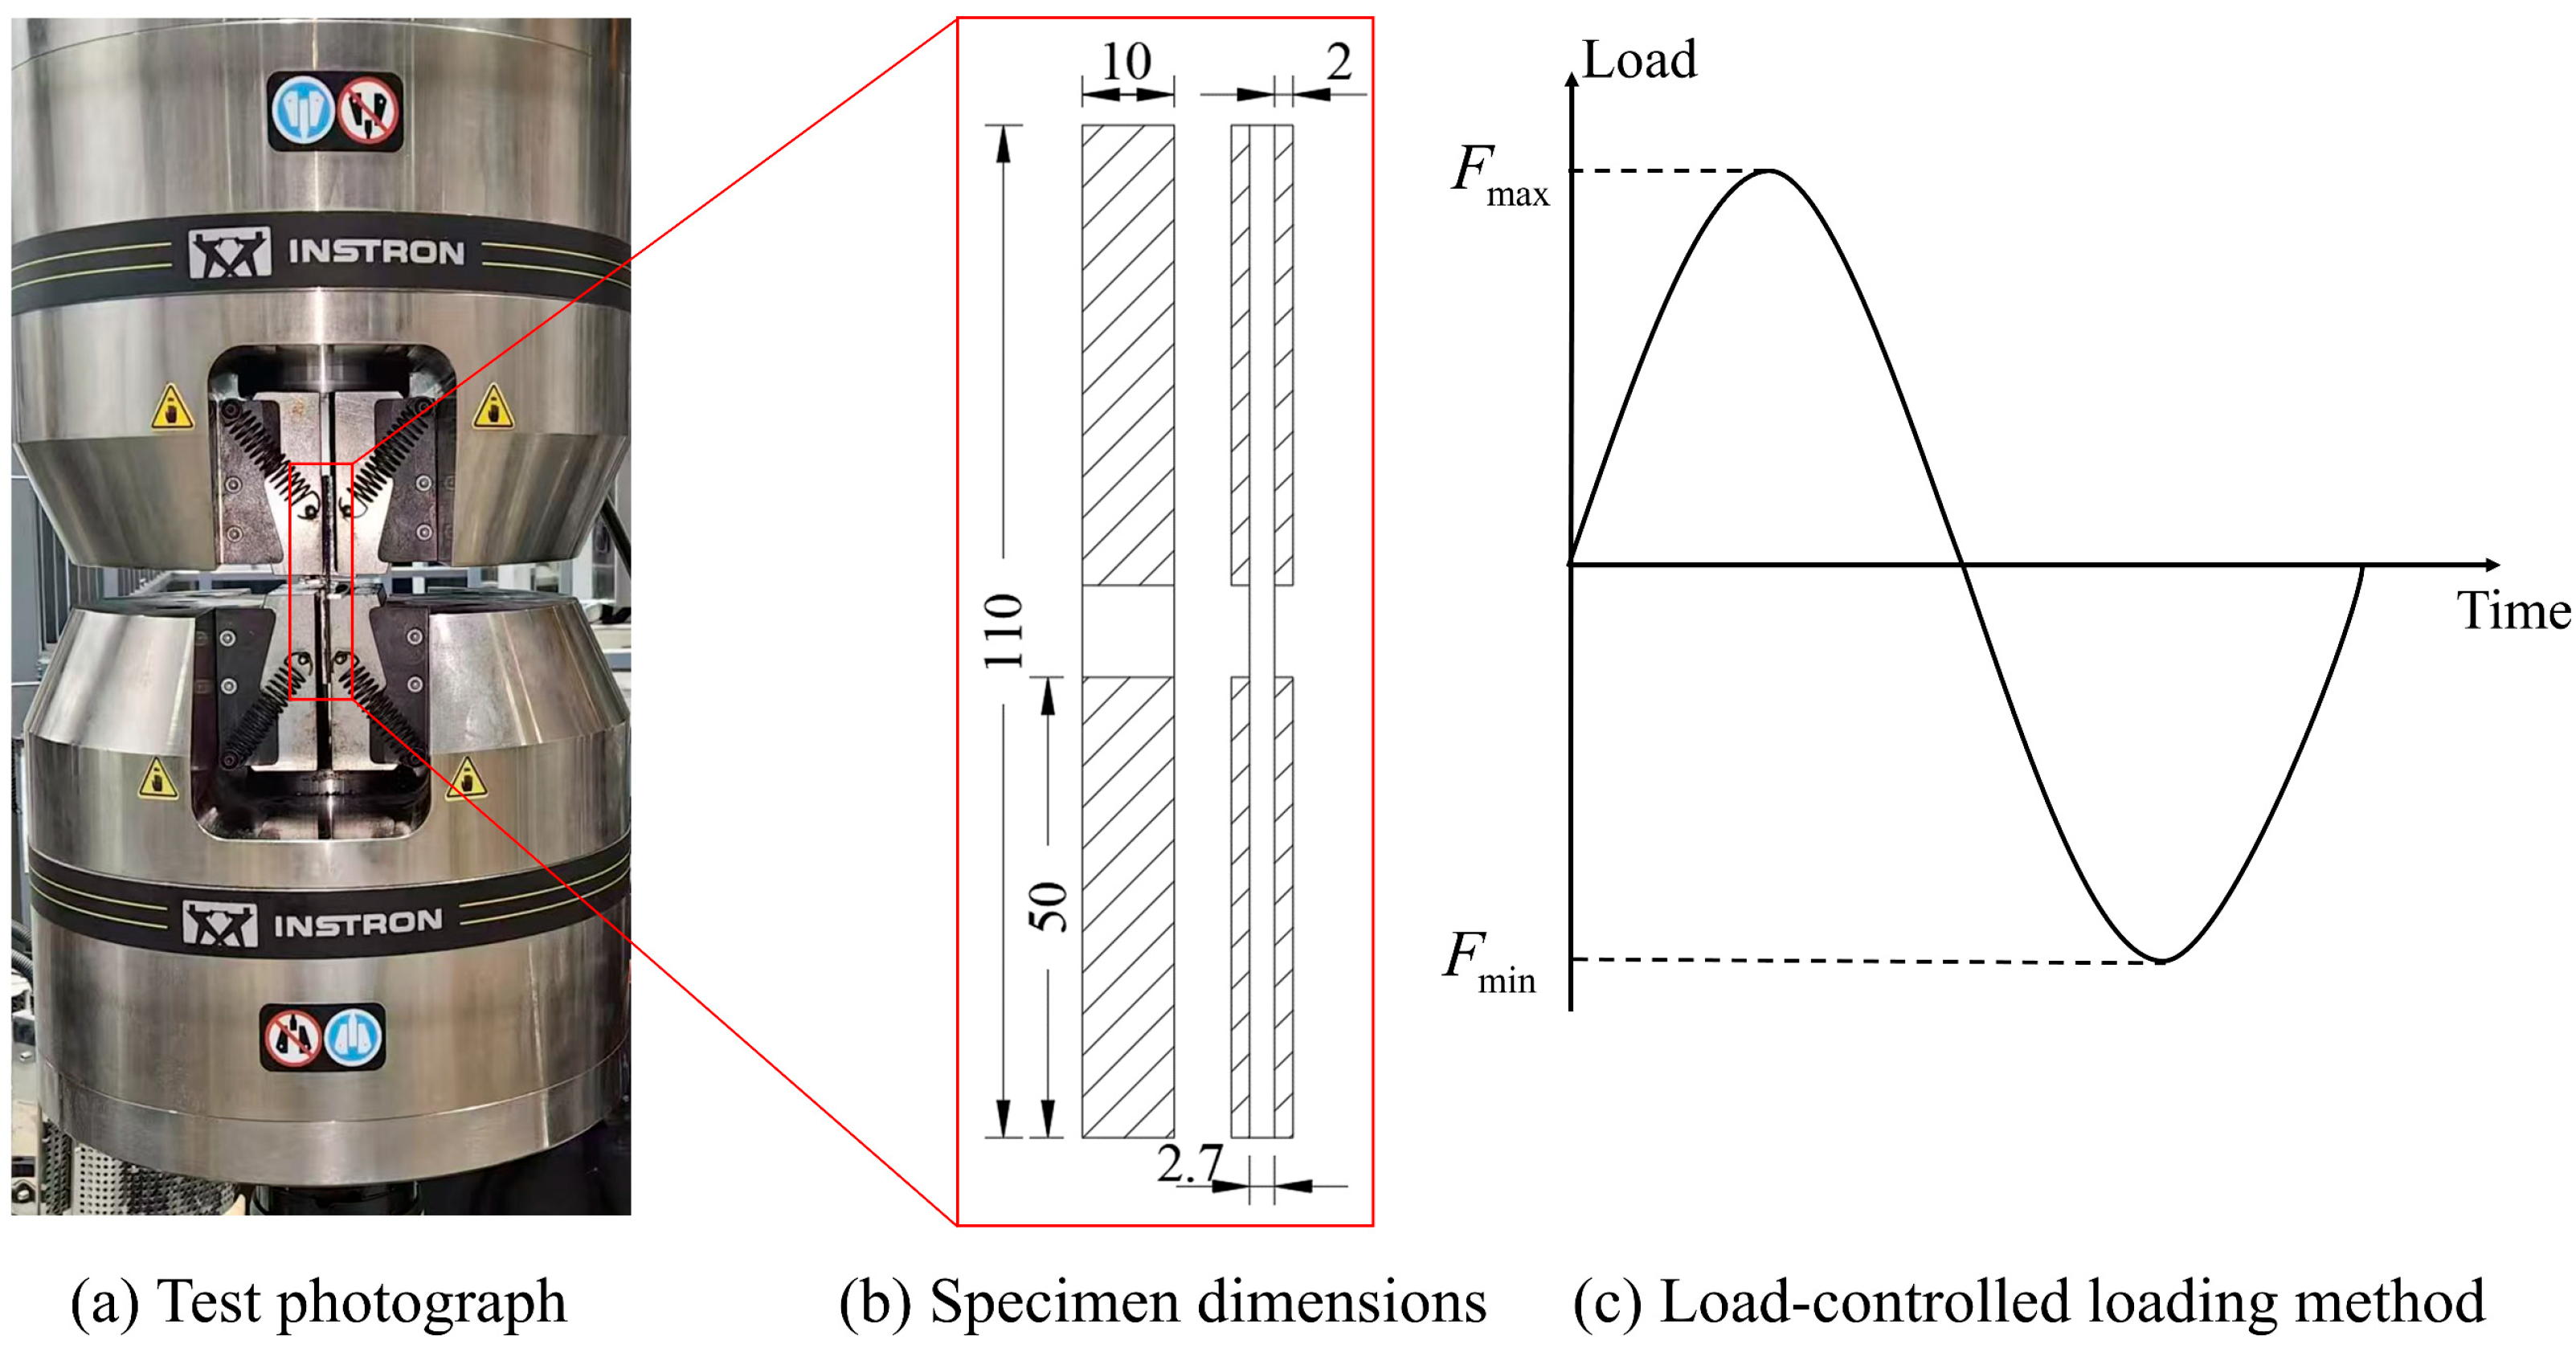
The ply orientation of the standard fatigue specimens was [0/45/90/-45/0/-45/90/45/0]
3. The specimen dimensions were designed according to the ASTM-D 3410 standard of the American Society of Mechanical Engineers, and aluminum reinforcement tabs were bonded to the clamping ends of the specimens [
20]. The fatigue test used a sinusoidal loading mode and load-controlled method following the ASTM-D 7791 standard [
21]. The specimen dimensions, loading method, and experimental photo are shown in
Figure 1.
Hull structures exhibit two phenomena under wave loading: hogging and sagging. In the hogging state, the area above the neutral axis is subjected to tensile loads, while the area below the neutral axis is subjected to compressive loads. Conversely, in the sagging state, the opposite occurs. As hogging and sagging alternate, the structure experiences combined tension–compression loading. Based on this, this study designed a tension–compression fatigue test.
Due to their anisotropy and complex internal structure, composite materials typically exhibit inconsistencies between tensile strength and compressive strength [
22]. The overall tensile strength
XT and compressive strength
XC of the E-glass fiber-ethylene resin composite material studied in this paper are provided in
Table 1. Under tensile loading, fibers along the loading direction more readily withstand tensile stress, resulting in higher overall tensile strength for the material. Under compressive loading, however, microscopic failures, such as fiber buckling and matrix cracking, are more likely to occur between the composite matrix and fibers, leading to an overall compressive strength lower than the tensile strength.
Considering the differences in tensile and compressive strength characteristics of composite materials, this study designated the tensile strength as the ultimate strength of the material for fatigue testing and subsequent fatigue evaluation. In the fatigue tests, four stress levels were set based on SU, corresponding to 25%, 30%, 40%, and 50% of the tensile strength.
All tests were conducted under tension–compression cyclic loading with a stress ratio
R = −1 to investigate fatigue behavior at different stress levels. For each stress level, three sets of repeated experiments were performed. To shorten the fatigue testing duration, a frequency of 10 Hz was selected, ensuring it would not affect the test results [
23]. During the test, the peak loading force
, the minimum loading force
, the peak displacement
, and the minimum displacement
for each cycle were recorded.
3.2. Fatigue Test Results
The fracture mode of the standard fatigue specimens is shown in
Figure 2. The results of the fatigue tests indicate that the specimens failed in the form of tensile failure. This phenomenon suggests that during the tension–compression cycling, the compressive load did not significantly cause macroscopic fractures but primarily induced microscopic damage to the material, thereby affecting its overall fatigue behavior. The compressive phase stress may lead to debonding between the fibers and the matrix, as well as the initiation and propagation of matrix microcracks [
16]. When transitioning to the tensile phase, since the fibers are more sensitive to tensile loads, the microscopic damage within the material further accumulates and propagates, ultimately resulting in macroscopic tensile fracture.
Figure 2.
Fracture mode of the standard fatigue specimen.
Figure 2.
Fracture mode of the standard fatigue specimen.
After the constant amplitude fatigue test of the standard specimens was completed, the test data were processed and the fitting of the stiffness degradation curve was performed. The stiffness E(n)/E(0) is defined as the ratio of the load range ΔF to the displacement variation Δx when the number of cycles is n. By using the dimensionless stiffness ratio E(n)/E(0) as the vertical axis and the dimensionless cycle count n/N as the horizontal axis, fitting to Equation (1) yielded the material fatigue stiffness degradation curve.
To improve the accuracy of the fitting results, the fitting parameters were obtained from the three repeated tests at a single stress level. The nonlinear fitting module in Origin (2018) software (OriginPro 2018C SR1 (b9.5.1.195)) was used to perform the fitting. The variation in the residual stiffness rate with the number of cycles at a single stress level is shown in
Figure 3.
Obviously, the predictions obtained by the proposed residual stiffness model were in good agreement with the experimental values. This indicates that the stiffness degradation model used in this study is highly applicable to E-glass fiber/vinyl resin materials. In addition, the stiffness degradation model is also applicable to other materials, such as when Yang [
14] validated the applicability of this model to graphite/epoxy laminates while Wu [
16] demonstrated its effectiveness for C/SiC materials.
The number of cycles
N at which fatigue specimens fractured under various stress levels is provided in
Table 2.
The stiffness degradation parameters
E(
N)/
E(0) and ν at different stress levels, obtained by fitting Equation (1), are shown in
Table 3. The results showed that the residual stiffness at the point of specimen failure was significantly higher under a high-stress level compared to a low-stress level. This indicates that at a low-stress level, the microscopic damage within the material developed more fully, leading to a significant reduction in overall stiffness and ultimately resulting in failure with a lower residual stiffness. On the other hand, at a high-stress level, the specimen experienced greater external loads and failure occurred before the microscopic damage fully accumulated, thus retaining relatively higher stiffness at the point of failure. This phenomenon reflects the sudden nature of loading under a high-stress level, where the strong forces cause rapid failure before sufficient degradation of the microscopic damage can occur.
As shown in
Table 3, there was a strong correlation among the failure stiffness ratio
E(
N)/
E(0), the power-law parameter υ, and the stress level
S/
SU. By fitting υ with
SU according to Equation (2), the constants
P1 and
P2 can be obtained. Similarly, by fitting
E(
N)/
E(0) with
SU according to Equation (3), the constants
C1 and
C2 can be derived. The fitting results for the four constants are presented in
Table 4.
At this point, based on the constant amplitude fatigue tests of the material, the fatigue parameter fitting for the resin-based glass fiber material was completed. The stiffness degradation parameters in Equations (6) and (17) were all determined.
By fitting the fatigue performance parameters of the material, the fatigue stiffness degradation model for the hull base material was established. Wang et al. [
24] conducted constant-amplitude fatigue tests on a more complex hull joint, demonstrating the feasibility of this model in real ship structures. Based on this foundation, this study proceeded with the fatigue life calculations of actual hull structures under random loading conditions.
4. Spectral Fatigue Analysis and Fatigue Life Calculation of Composite Ship
To effectively evaluate the fatigue performance of the target hull under actual working conditions, a mesh division of the main structural components was conducted using Hypermesh software (Altair HyperWorks Version 2022), and ABAQUS (Abaqus/CAE 2022) was introduced for subsequent numerical simulations. A refined mesh division of the fatigue hotspots was performed to accurately capture stress gradient variations. Subsequently, the calculation process of the structural stress transfer function was carried out, and the influence of wave characteristics on fatigue damage was analyzed. Finally, by calculating the fatigue life of the hotspots, the fatigue performance of different components was evaluated.
4.1. Finite Element Modeling and Fatigue Hotspot Identification
The target vessel for the fatigue analysis in this study had a designed waterline length of 93.78 m, a displacement of 1435.45 t, and a standard cruising speed of 18 knots. The finite element model of the vessel was constructed using the commercial software Hypermesh 2022, with the entire model created using 2D shell elements.
To ensure the accuracy of the subsequent finite element response calculations for the ship structure, all major longitudinal components, such as the deck, longitudinal box beams, and bulkheads, were represented using quadrilateral shell elements (S4R). Non-primary load-bearing structures were represented using a combination of quadrilateral shell elements and triangular shell elements (S3R), while secondary stiffeners were modeled with equivalent beam elements. The 0D mass point element was used to simulate the weight distribution under actual loading conditions.
After completing the finite element meshing, the model was imported into ABAQUS 2022. The composite layup feature provided by the software was used to design the laminate layup, with the specific layup method being the same as that of the standard specimen mentioned earlier. Subsequent calculations were conducted using the 2D Hashin constitutive model for numerical simulations. The material properties of the laminate are shown in
Table 5 [
25].
The selection of fatigue hotspots was based on the relevant regulations of the China Classification Society [
26]. Since the midsection of the hull experiences the greatest wave-induced bending moments, the focus was mainly on stress concentration areas in the midsection of the ship. Four structural locations were ultimately selected for fatigue check calculations. The specific hotspot locations are as follows: the connection between the bulkhead stiffener and the inner bottom plate (Hotspot 1); the junction of the longitudinal bulkhead, transverse bulkhead, and deck (Hotspot 2); the junction of the longitudinal girder and transverse beam (Hotspot 3); and the connection between the longitudinal girder and the transverse bulkhead (Hotspot 4).
In addition, the finite element mesh near the fatigue hotspots should be sufficiently refined to capture the stress gradient variations. The following rules were followed when refining the mesh around the fatigue hotspots in this study: The mesh size should not exceed the thickness t of the structural component at the hotspot. The refined mesh region should extend in all directions from the hotspot by at least 10 t. The transition between the refined mesh and the coarse mesh regions should ensure a smooth gradient in mesh density. In the refined mesh region, four-node elements were used, and the use of triangular elements was avoided as much as possible [
27]. The results of the mesh refinement are shown in
Figure 4.
4.2. Calculation of Stress Transfer Function
The significant wave height is a key factor affecting the strength of ship structures. Fatigue damage is not only related to the significant wave height
Hs, but also to the zero-crossing period
Tz, the probability of different sea states, and other factors. Therefore, fatigue damage is highly sensitive to scatter diagrams. Considering the ship operating area, wave scatter data from the coastal regions of China were selected for calculating the structural stress response transfer function [
27]. The probability distribution of waves under different periods and wave heights is shown in
Figure 5.
In the structural spectral fatigue analysis, 12 wave directions were selected with an interval of 30° and the occurrence probability of each wave direction was set to 1/12. The calculated original frequencies ranged from 0.1 radian per second (rad/s) to 2.0 rad/s, with an interval of 0.1 rad/s, totaling 20 frequencies. Hydrodynamic calculations were performed using the COMPASS-WALCS wave load software (COMPASS-WALCS-BASIC v1.0) developed by the China Classification Society, yielding the pressure corresponding to each element of the ship’s wetted surface under unit wave amplitude. In ABAQUS 2022, water pressure was applied, and the structural response was calculated using the inertia release method.
Due to the significant and nonlinear stress gradient variations at the fatigue hotspots, the Lagrange interpolation method was used for a more accurate determination of hotspot stress. Four elements near the hotspot were selected, using the integration points at the center of these elements as extrapolation reference points, and the stress values at these locations were extracted. As shown in
Figure 6, the distances from the integration points to the hotspot were used as the horizontal axis, and the stresses at the integration points were used as the vertical axis. Lagrange interpolation was then performed to calculate the stress value at the hotspot.
The results of the stress response transfer function under unit wave amplitude are shown in
Figure 7. In the stress response transfer function calculations for the four fatigue hotspots in this study, the stress peaks occurred under specific wave directions and wave frequency conditions. Hotspots 1, 3, and 4 all reached their maximum stress values at a wave direction of 120° and a wave frequency of 1.5 rad/s. This is because Hotspot 2 was located at the connection between the bulkhead and the deck, while Hotspots 1, 3, and 4 were all located at the junctions of longitudinal girders with other structures, showing structural similarities.
From the stress responses shown in
Figure 7, it can be observed that the stress responses at Hotspots 1, 3, and 4 exhibited a bimodal distribution, with relatively large, enclosed areas. In contrast, the stress response at Hotspot 2 had a unimodal distribution, with a smaller area enclosed by the curve and the coordinate axis. The maximum stress responses at Hotspots 3 and 4 both exceeded 35 MPa.
4.3. Fatigue Life Calculation of Hotspots
After obtaining the stress response transfer function, by combining Equation (11) with Equation (13), the probability density function for the short-term distribution of the stress range under a single wave direction can be derived. By refitting the stress ranges across all wave directions, the long-term distribution of the stress range was ultimately fitted to a Weibull distribution probability density function. The scale parameter
, shape parameter λ for the long-term distribution, and the mean zero-crossing rate
of the waves are presented in
Table 6.
The Weibull distribution probability density function curves for the four hotspots are shown in
Figure 8. From this figure, it can be observed that the stress distribution at the fatigue hotspots fell within the range of 0–25 MPa, indicating that it belonged to the high-cycle fatigue range at low-stress levels.
Table 6.
Weibull distribution scale factor, shape factor, and the mean zero-crossing rate of the waves.
Table 6.
Weibull distribution scale factor, shape factor, and the mean zero-crossing rate of the waves.
| Hotspot | Hotspot 1 | Hotspot 2 | Hotspot 3 | Hotspot 4 |
|---|
| 1.25 | 1.31 | 1.36 | 1.24 |
| λ | 6.34 | 5.82 | 6.31 | 5.68 |
| /Hz | 0.17 | 0.17 | 0.18 | 0.18 |
Since the failure stiffness ratio is related to the fatigue stress level, the failure stiffness of the material under random loading is not a fixed value but depends on the composition of various stress levels within the random load. To determine the critical failure stiffness ratio under random loading, the data in
Table 3 were fitted using Equation (3), with stress level as the horizontal axis and failure stiffness ratio as the vertical axis, resulting in
Figure 9.
Analyzing the trend in
Figure 9 reveals that the critical failure stiffness ratio of glass fiber composites was positively correlated with the fatigue stress level. At a 50% stress level, the failure stiffness ratio was 0.693. To ensure the high-cycle fatigue safety of composite ships under low-stress levels, it was necessary to adopt a higher critical failure stiffness ratio. Therefore, the subsequent fatigue life calculations in this study used a critical failure stiffness ratio
E(
N)/
E(0) of 0.7. Under this condition, even if the wave load reaches 50% of the ultimate strength, the material will not fail due to stiffness degradation.
By substituting the dimensionless stiffness degradation parameters from
Table 3 and the wave load probability density parameters from
Table 6 into Equation (17), the fatigue life calculation for the hotspots in the composite ship structure can be completed. Plotting the stiffness ratio at the fatigue hotspots as a function of time yielded the curve shown in
Figure 10.
Observing
Figure 10, it is found that the stiffness degradation patterns of the four fatigue hotspots all exhibited an obvious initial rapid drop in stiffness over a short period, followed by a gradual decline phase, consistent with the material stiffness degradation behavior. This result indicates that the stiffness degradation fatigue assessment method under random loading provides accurate calculations and effectively reflects the gradual damage process of the structure under long-term fatigue loading. The fatigue life of the four hotspots when the stiffness ratio degrades to 0.7 is shown in
Table 7.
Further analysis, combining
Figure 10 and the fatigue life table, revealed that Hotspot 1 experienced the fastest stiffness degradation, with a lifespan of only 13.4 years, while Hotspot 2 had the longest fatigue life, reaching 28.7 years. The fatigue lifespans of Hotspots 3 and 4 were 23.1 years and 21.8 years, respectively, with their stiffness degradation rates falling between those of Hotspot 1 and Hotspot 2. These fatigue life calculation results align with the stress response patterns: The stress response at Hotspot 2 enclosed the smallest area with the coordinate axis, corresponding to the lowest spectral energy, resulting in the longest calculated fatigue life. In contrast, Hotspot 1 exhibited a bimodal distribution with both peaks being relatively high, leading to the highest spectral energy and the shortest calculated fatigue life.
4.4. Optimization of the Fatigue Hotspot
In the fatigue optimization design of hull structures, optimizing dimensions for all loading conditions is highly time-consuming and inefficient. Spectral analysis involves multiple wave headings and frequency scenarios, which increases the complexity. To address this, a simplified optimization method is necessary. Increasing the thickness per layer, without changing the material layup, can improve overall stiffness. This increase in stiffness generally leads to a proportional reduction in stress responses across various conditions. Based on this, a unified scaling factor is introduced to uniformly scale down all stress response transfer functions, until the calculated fatigue life meets the design life requirements.
The design service life of the target ship structure is 20 years. By reducing the stress response transfer function, the reduction ratio required to meet the service life, the optimized fatigue life, and the maximum stress response at this point are calculated, as shown in
Table 8.
The maximum stress response at Hotspot 1 occurred under the combined condition of a wave heading of 150° and a wave frequency of 1.5 rad/s. In the subsequent optimization process, this condition was used as the basis for optimizing two parameters: the web thickness of the bulkhead stiffener
t1 and the panel thickness
t2. The schematic diagram of the three optimization parameters is shown in
Figure 11a.
This study adopted a combined computation method using ABAQUS and Isight 2020 (Version 10.0) to perform size optimization for the target hotspot. The specific optimization process is shown in
Figure 11b. During the calculation, stress was set as a constraint, requiring the optimized stress to meet the condition of not exceeding the target stress. With the objective of minimizing the hull structure weight, iterative computations were conducted by adjusting two design variables until the minimum structural weight was achieved under the stress constraint. Ultimately, the two optimized design variables were determined as the optimal solution.
The optimal solutions for the three design variables obtained through optimization are shown in
Table 9. At this point, the fatigue life of Hotspot 1 was 24.5 years, as listed in
Table 8.
5. Conclusions
A fatigue life assessment method suitable for composite naval structures is proposed, based on the stiffness degradation theory under random loading and spectral fatigue analysis theory. The applicability of the stiffness degradation theory to E-glass fiber/vinyl resin materials was validated through standard fatigue tests. Combined with the findings of other studies, it is believed that the fatigue assessment method proposed in this study is also applicable to hull structures made of other types of composite materials. This method was applied to assess the fatigue of the target ship structure, demonstrating its feasibility and practical value. The specific conclusions are as follows:
- 1.
A stiffness degradation model for the composite material was established through a standard fatigue test, revealing the stiffness degradation characteristics of the composite material under fatigue loading. The results indicate that the critical stiffness failure ratio is positively correlated with the fatigue stress level; that is, as the external load level increases, the critical stiffness failure ratio at material failure also increases.
- 2.
Standard fatigue specimens primarily show tensile failure under tension–compression loading. This indicates that, during the tension–compression cycle, compressive loading does not cause significant macroscopic damage to the material but induces microscopic damage, thereby affecting the overall fatigue behavior of the material.
- 3.
Under random loading, the critical failure stiffness ratio of the material is not a fixed value. Based on an analysis of data from standard fatigue tests, it is found that the critical failure stiffness ratio at stress levels of 25–50% are all less than 0.7. In subsequent fatigue assessments of resin-based glass fiber composite hull structures, it is recommended that the critical failure stiffness ratio be set to at least 0.7.
- 4.
Among the four hotspots, the connection between the longitudinal bulkhead, transverse bulkhead, and deck (Hotspot 2) exhibits the highest fatigue life, reaching 28.7 years. In contrast, the connection between the bulkhead stiffener and the inner bottom (Hotspot 1) has the lowest fatigue life, at only 13.4 years. In the actual design of composite ship structures, special attention should be given to this region.
This research did not consider the effects of temperature variations and chemical exposure on the fatigue performance of composite hull structures that could significantly influence fatigue behavior under actual service conditions. Moreover, the fatigue assessment in this study primarily focuses on typical hotspots subjected to tension–compression loads, which may pose limitations for hull structures subjected only to compressive loads (longitudinal and transverse bulkheads). Therefore, future research should focus on the impact of temperature and chemical environments on the fatigue behavior of composites and conduct systematic tests on the compression–compression fatigue performance of the materials. This will further refine the fatigue assessment methods for composite hull structures and provide more comprehensive theoretical support for practical engineering applications.


