Article

Mechanical Behavior of Marine Soft Soil with Different Water Contents Under Cyclic Loading

School of Civil Engineering, Shandong University, Jinan 250061, China
*
Author to whom correspondence should be addressed.
J. Mar. Sci. Eng. 2024, 12(12), 2307; https://doi.org/10.3390/jmse12122307
Submission received: 29 November 2024 / Revised: 11 December 2024 / Accepted: 12 December 2024 / Published: 15 December 2024

Abstract

:
This study integrates macroscopic dynamic triaxial tests with microscopic discrete element simulations to comprehensively examine the dynamic deformation characteristics of marine soft soils under cyclic loading. Unlike previous research that typically focuses solely on experimental or numerical methods, this approach combines both techniques to enable a holistic analysis of soil behavior. The dynamic triaxial tests assessed macroscopic responses, including strain evolution and energy dissipation, under varying dynamic stress ratios, confining pressures, and water contents. Concurrently, discrete element simulations uncovered the microscopic mechanisms driving these behaviors, such as particle rearrangement, porosity variations, and shear zone development. The results show that (1) The strain range of marine soft soils increases significantly with higher dynamic stress ratios, confining pressures, and water contents; (2) Cumulative dynamic strain and particle displacement intensify at water contents of 50% and 55%. However, at a water content of 60%, the samples exhibit significant damage characterized by the formation of shear bands throughout the entire specimen; (3) As water content increases, energy dissipation in marine soft soils accelerates under lower confining pressures but increases more gradually under higher confining pressures. This behavior is attributed to enhanced particle packing and reduced pore space at elevated confining pressures. This integrated methodology not only enhances analytical capabilities but also provides valuable engineering insights into the dynamic response of marine soft soils. The findings offer essential guidance for the design and stabilization of marine soft soil infrastructure in coastal urban areas.

1. Introduction

Engineers and builders face unique challenges when developing underground spaces and constructing rail transit systems in coastal cities. Marine soft soils, commonly found in these regions, pose significant obstacles to underground engineering due to their distinctive properties, such as low shear strength, high compressibility, and high sensitivity to moisture [1,2]. The construction of subways on these soft soil foundations is particularly vulnerable to issues such as foundation instability and structural damage, raising serious concerns about the safety and reliability of such projects. Therefore, a comprehensive understanding of the dynamic deformation characteristics of marine soft soils under cyclic loading [3], along with the mechanisms driving changes in soil properties, is crucial for effectively managing the dynamic behavior of these soils [4].
Currently, dynamic triaxial test analysis is widely used to study the dynamic characteristics of marine soft soil. In dynamic triaxial testing, cyclic or vibrating loads are applied to soil samples to simulate the effects of dynamic loads, such as those generated by earthquakes and traffic vibrations [5,6]. Additionally, numerical simulation methods are frequently employed to analyze the stress–strain behavior of marine soft soils. Dynamic triaxial testing is particularly useful for evaluating soil behavior under cyclic loading, allowing investigation into responses such as strength and stiffness reduction, principal stress rotation, excess pore water pressure generation, and deformation accumulation in marine soft clays [7]. A series of undrained triaxial tests under low-frequency cyclic loading reveal that marine soft clay accumulates plastic deformation and pore pressure under cyclic loads, with higher deformation and pore pressure observed under conditions of elevated confining pressure and stress ratio [8]. Dynamic triaxial tests have also been employed to examine the properties of freeze–thaw soils under cyclic loading, with scanning electron microscopy (SEM) analyses illustrating the weakening effects of freeze–thaw cycles and dynamic loading on soft soils [9]. Using numerical simulations with the “cyclic flow (CM) model”—an elasto-plastic constitutive model—and a coupled soil–water finite element–finite difference (FE–FD) code called DBLEAVES, cyclic triaxial tests of marine soft clays were simulated to assess soil behavior under cyclic conditions [10]. In another study, the variable confining pressure (VCP) mechanical behavior of marine soft clay was examined under long-term traffic loading (50,000 cycles) through two series of monotonic shear tests. Post-cycling stress paths, pore water pressures, and shear strengths were compared with those from standard monotonic shear tests without cyclic loading history [11]. To develop a more accurate stiffness degradation model for marine soft clay, dynamic triaxial tests were conducted at varying stress levels, and cumulative displacement and stiffness degradation were modeled in ABAQUS using the USDFLD subroutine [12]. For more realistic assessment of cyclic triaxial behavior in saturated soils, a series of bidirectional cyclic triaxial tests were designed to account for drainage conditions and variable confining pressures during cyclic and intermittent loading phases [13]. Large-scale interfacial shear tests and numerical simulations were also conducted, showing that the pile-soil interfacial shear strength exhibits a hardening–stabilizing behavior with peak strength and slightly elevated stabilized strength under cyclic loading [14]. Triaxial tests on marine clay have demonstrated how the cyclic stress ratio (CSR) and initial confining pressure (p’(0)) influence the dynamic properties of marine soft soil [15]. Additionally, microstructural evolution during loading and unloading in natural marine clays was studied using undrained triaxial tests, with mercury intrusion porosimetry (MIP) and field-emission scanning electron microscopy (FESEM) used to examine pore distribution and the arrangement of soil particles and aggregates [16]. Based on 2-D PFC, non-circular particle with direction was constructed and specimens with different distribution of long axis orientation were established. Loads were applied in vertical direction. Changes in fabric such as the long axis orientation, particle contact direction, and particle contact force in the process of loading were analyzed [17]. Based on PFC3D 5.0 software and theory, combined with the indoor triaxial test results to calibrate the basic micro parameters of numerical simulation, and the conventional triaxial numerical simulation of loess numerical samples under 200 kPa confining pressure was conducted [18]. Using the PFC numerical simulation method, the particle contact model was modified by considering the particle interaction and low gravity effect, and the research on the microscopic parameters of the particle contact model of the lunar soil and its macroscopic mechanical properties was carried out [19].
In conclusion, dynamic triaxial testing is widely regarded as one of the most effective methods for studying the mechanical properties of marine soft soils. Many researchers have employed this method to investigate the macroscopic mechanical behavior of marine soft soils under cyclic loading. However, it has limitations in capturing microscopic phenomena, such as particle collisions and rolling interactions. While numerical simulations are commonly used to model macroscopic behavior, microstructural changes in marine soft soils are often analyzed using techniques like scanning electron microscopy, revealing a gap in integrating macroscopic and microscopic analyses. Particle flow analysis, a numerical technique, offers significant advantages for studying the micromechanical behavior of geotechnical materials by simulating particle interactions and their effects on complex system behavior. Despite its potential, this method has not been extensively applied to marine soft soils. To address this gap, the present study integrates dynamic triaxial testing with particle flow analysis to explore the dynamic behavior of marine soft soils under varying water content conditions. This combined approach provides a comprehensive understanding of marine soft soil behavior under cyclic loading from both macroscopic and microscopic perspectives, highlighting the utility of particle flow analysis in capturing the evolution of particle deformation under dynamic conditions. The findings offer valuable theoretical and technical insights for marine geotechnical engineering research and design.

2. Analysis Methods

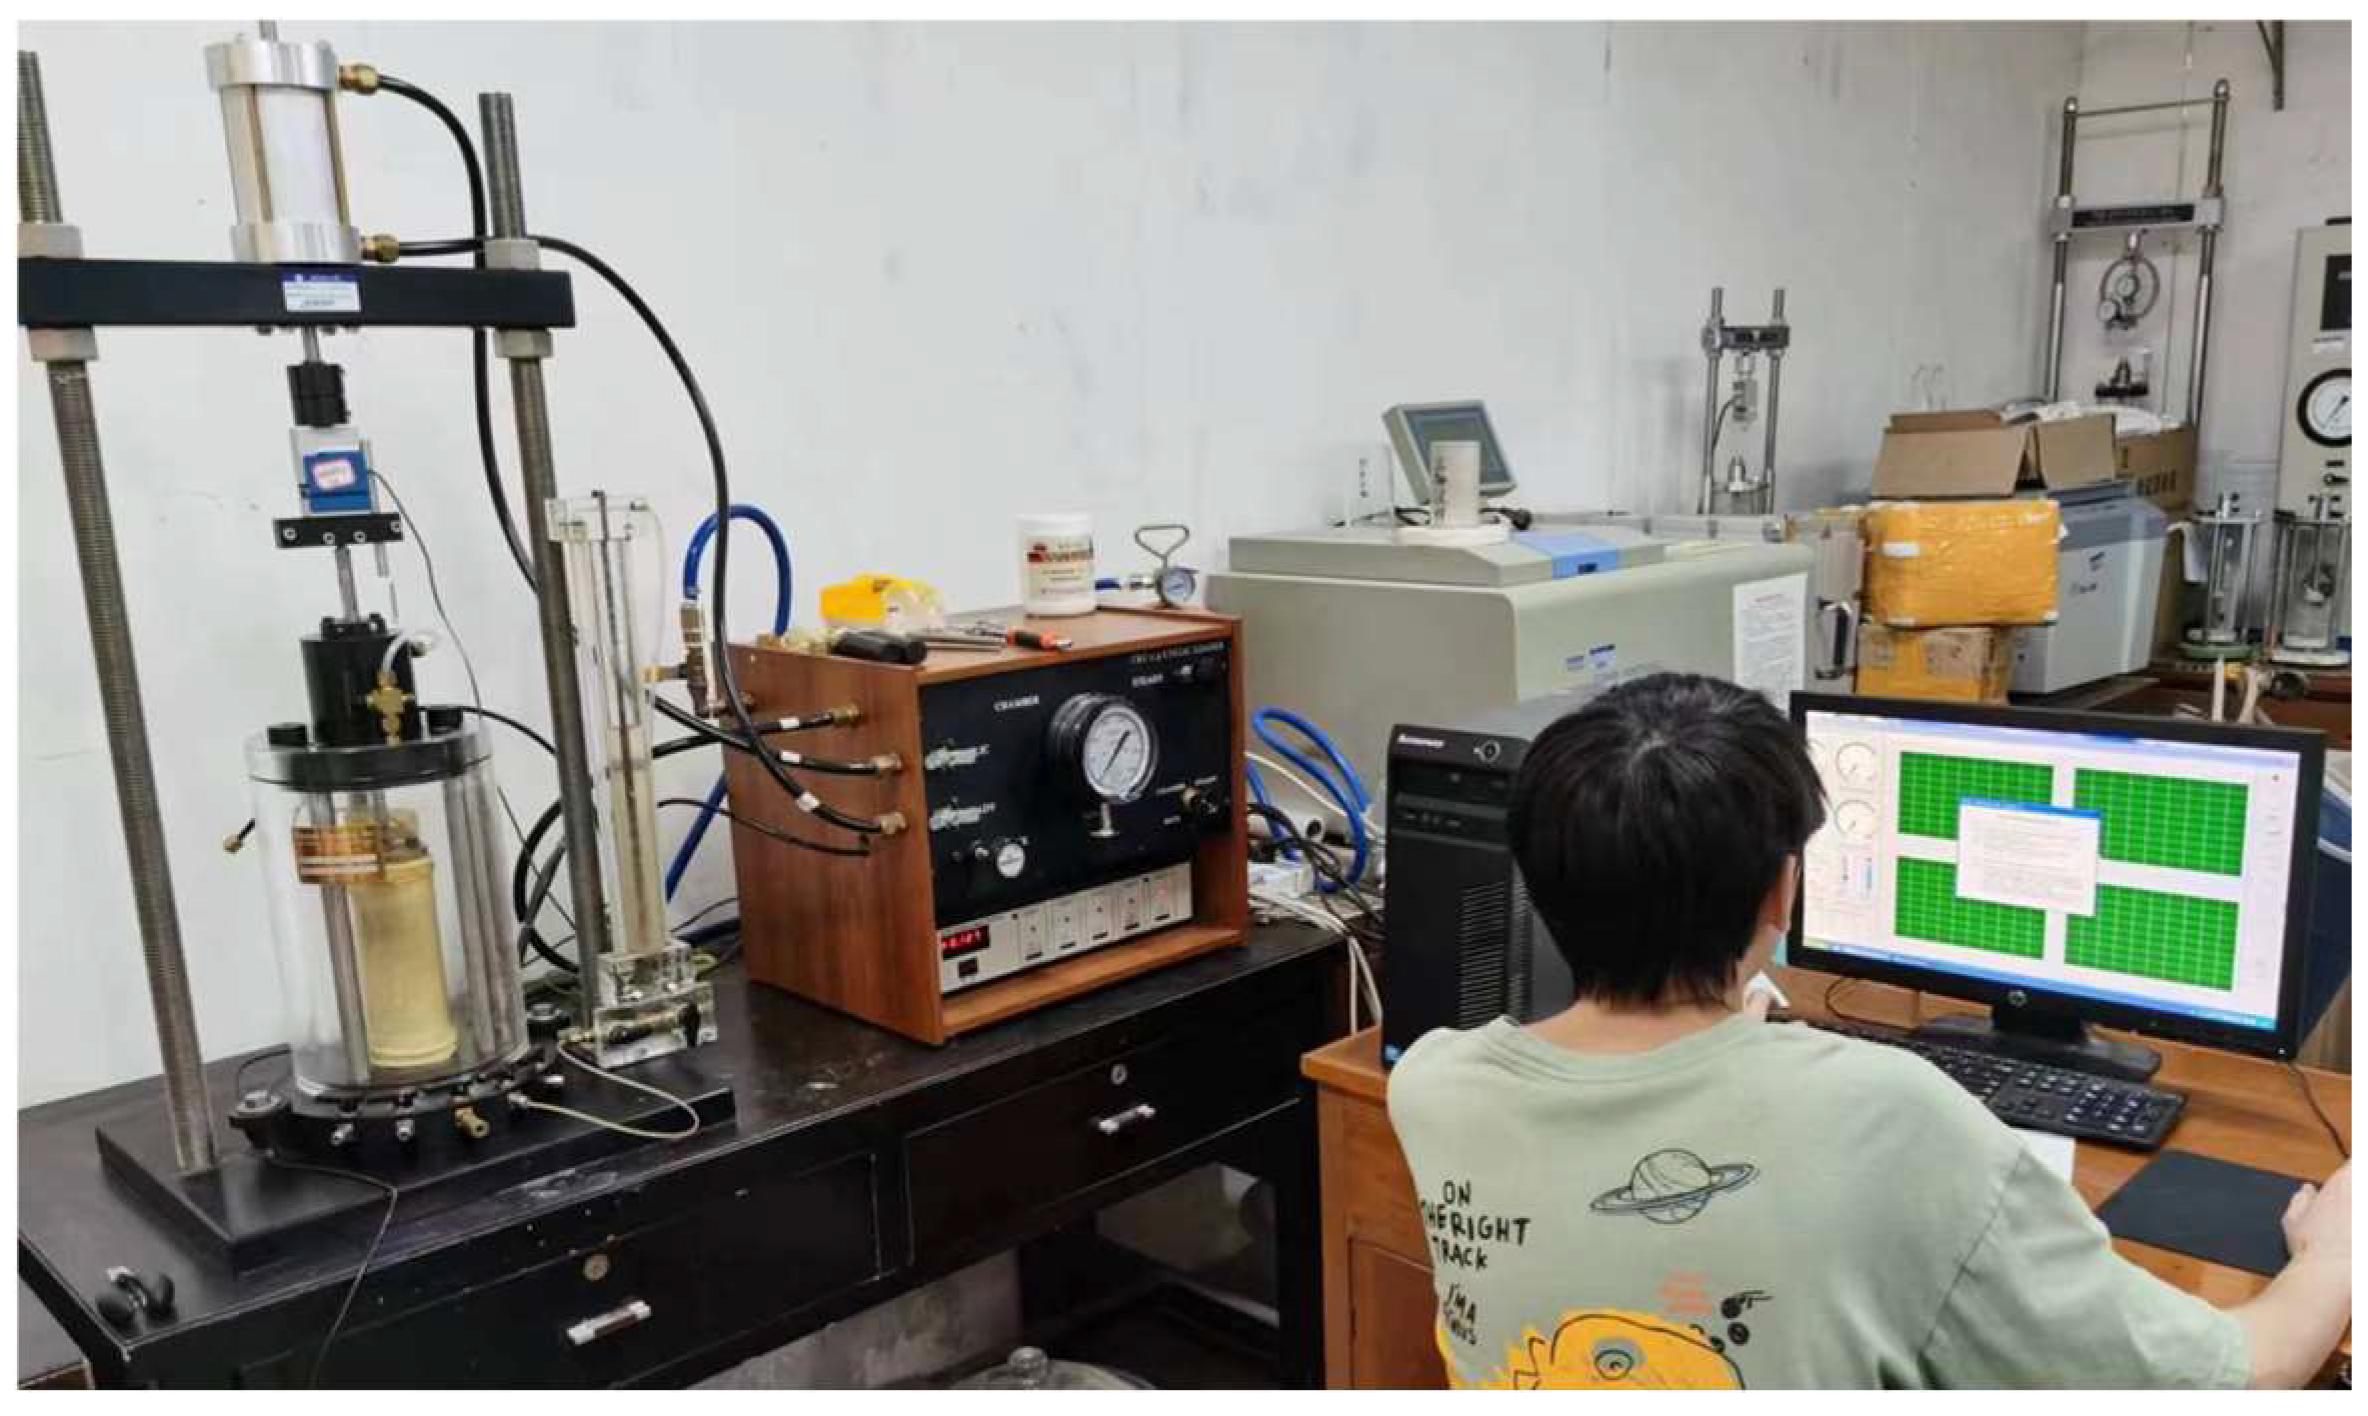
2.1. Geotechnical Dynamic Triaxial Test Analysis Method

The dynamic triaxial test is a method used to evaluate the dynamic properties of soils by simulating the stress conditions that soils experience in their natural environment. This test applies controlled vertical and horizontal stresses to soil samples, allowing cyclic or vibratory loads to replicate the effects of dynamic forces such as earthquakes and traffic vibrations. The dynamic triaxial test is particularly effective for assessing soil behavior under dynamic loading, including characteristics of the stress–strain hysteresis curve. Key factors such as water content, confining pressure, and dynamic stress ratio directly influence the dynamic behavior of marine soft soil. Consequently, this study utilizes the dynamic triaxial test as a macro-scale analysis method to investigate the mechanical behavior of marine soft soil under cyclic loading, focusing on the morphology of the stress–strain hysteresis curve across varying water content, confining pressure, and dynamic stress conditions.
The testing equipment used in this study is a fully digital, pneumatic, closed-loop repetitive loading triaxial apparatus, as shown in Figure 1. This computer-controlled system allows for precise control over stress or strain rate loading tests, with test frequency and loading magnitude carefully managed to ensure accuracy. The triaxial chamber accommodates specimens with diameters of 1.4 inches and 2.8 inches, with maximum pressures of 100 kPa in the inner chamber and 200 kPa in the outer chamber.
Shenzhen, located in the Pearl River Delta region of Guangdong Province, China, is characterized by extensive distributions of marine soft soils, which pose significant challenges to local engineering and construction projects. This type of soil is particularly prevalent in the construction of rail transit systems within the Shenzhen area. For this study, marine soft soil specimens were collected from the shield section of the tunnel between Left Battery Station and Prince Bay Station along Shenzhen Urban Rail Transit Line 12. The fundamental hysico-mechanical properties of these specimens are summarized in Table 1.
The tests were conducted in accordance with China’s Geotechnical Laboratory Test Regulations (GB/T 50123-1999) [20] and the United States’ Standard Test Method for Consolidated Drained Triaxial Compression Test for Soils (ASTM D7181-11) [21]. The specimen preparation process involves the following steps: (1) soil sample collection and air drying: Soil samples are collected and placed in a well-ventilated area to air dry. The purpose of air drying is to remove excess moisture to prevent its influence on the soil’s properties. (2) Crushing and sieving: Once air-dried, the soil is placed on a rubber sheet, crushed using a wooden mallet, and sieved through a 2 mm aperture sieve. This ensures uniformity of soil particles, which is critical for maintaining consistency across tests. (3) Water content adjustment: The water content of the air-dried soil is measured, and the required amount of water is calculated based on the target design water contents (e.g., 40%, 45%, 50%, 55%, 60%). Water is evenly sprayed onto the soil, ensuring uniform moisture distribution. The soil is then placed in a sealed plastic bag to equilibrate for 24 h. (4) Specimen preparation: The soil is compacted to 95% of its maximum dry density. Five specimens are prepared for each water content level, yielding a total of 25 specimens. The mass error for each specimen is carefully controlled within ±2 g. (5) Preservation: The prepared specimens are immediately wrapped in plastic wrap to prevent moisture loss, ensuring stable water content throughout the testing process.
To investigate the dynamic properties of marine soft soils, parameters such as water content, dynamic stress ratio, and confining pressure were systematically varied and analyzed. The water content was adjusted to specific levels, and cylindrical specimens measuring 140 mm in height and 70 mm in diameter were prepared accordingly. Prior to testing, each specimen was subjected to K₀-consolidation with K0 = 0.7 for 24 h to simulate the in situ stress conditions, and confining pressure was maintained at a constant throughout loading. The test utilized moisture contents of 40%, 45%, 50%, 55%, and 60%; confining pressures of 50, 100, and 200 kPa; and cyclic stress ratios of 0.15, 0.25, and 0.35.
A stress-controlled loading method was employed, wherein axial dynamic loads were applied in a sinusoidal pattern and precisely monitored through computer control to ensure accuracy and consistency. Before initiating the test, a static bias stress σs was applied to each specimen for bias consolidation. After consolidation, loading proceeded according to the test program, with sinusoidal dynamic stress applied to simulate tunnel traffic loading. Test termination was governed by the number of load cycles: for specimens that remained intact during loading, testing ceased after 1000 cycles; for specimens that failed during loading, testing stopped upon failure. The test was conducted at a load frequency of 0.1 Hz. The dynamic stress ratio, defined as the ratio of dynamic stress to confining pressure, was halved due to the double-amplitude loading method. The test program is outlined in Table 2 [22].
The dynamic properties of marine soft soil are investigated by analyzing key factors such as water content, confining pressure, and dynamic stress ratio. The relevant parameters are defined as follows: static bias stress σs, representing the initial static stress applied to the specimen; static bias stress ratio η, defined as the ratio of static stress components; dynamic stress σd, referring to the cyclic or dynamic stress applied; water content w, indicating the moisture level in the soil; confining pressure σc, representing the surrounding compressive stress; dynamic stress ratio ηd, defined as the ratio of dynamic to static stress; and the vibration number N, representing the number of load cycles applied. For this test, the failure criterion is defined as an axial strain of 5%, meaning a specimen is considered to have failed when its axial strain reaches or exceeds 5%.

2.2. Energy Loss Analysis Method

The dynamic response of the soil mass is characterized not only by changes in displacement and stress but also by energy dissipation. The extent of energy loss provides insights into the soil’s adaptability and hysteresis under dynamic loading. Consequently, the study of energy dissipation is crucial for evaluating the long-term stability of marine soft soil under cyclic loading, as it helps determine whether the soil experiences plastic deformation or damage. In the stress–strain behavior of marine soft soil subjected to cyclic loading, the area of the hysteresis loop corresponds to the energy dissipated during each loading cycle. Energy dissipation is typically quantified using two primary methods:
(1) Calculation of hysteresis loop area
Energy dissipation is quantified as the area enclosed by the hysteresis loop in a single loading cycle. This area represents the energy lost due to internal friction and material dissipation within the soil sample during each loading and unloading cycle.:
W = σ d ε
where σ is the stress during cyclic loading; ε is the corresponding strain;   is the closed integral of the hysteresis loop.
(2) Discrete calculation methods
When the stress–strain curve is represented as discrete data points, energy dissipation can be calculated through approximate integration methods:
W i = 1 n ( σ i + σ i + 1 ) 2 · ( ε i + 1 ε i )
The experimentally obtained (σ, ε) data were input into the equation to calculate the energy dissipation for each loading cycle.
Based on the stress–strain hysteresis curve of marine soft soil, the discrete calculation method was applied, and a Python 3.11 was developed to calculate energy dissipation. This approach allows for the generation of characteristic energy loss curves under varying water content conditions, which can be used to assess the stability of marine soft soil.

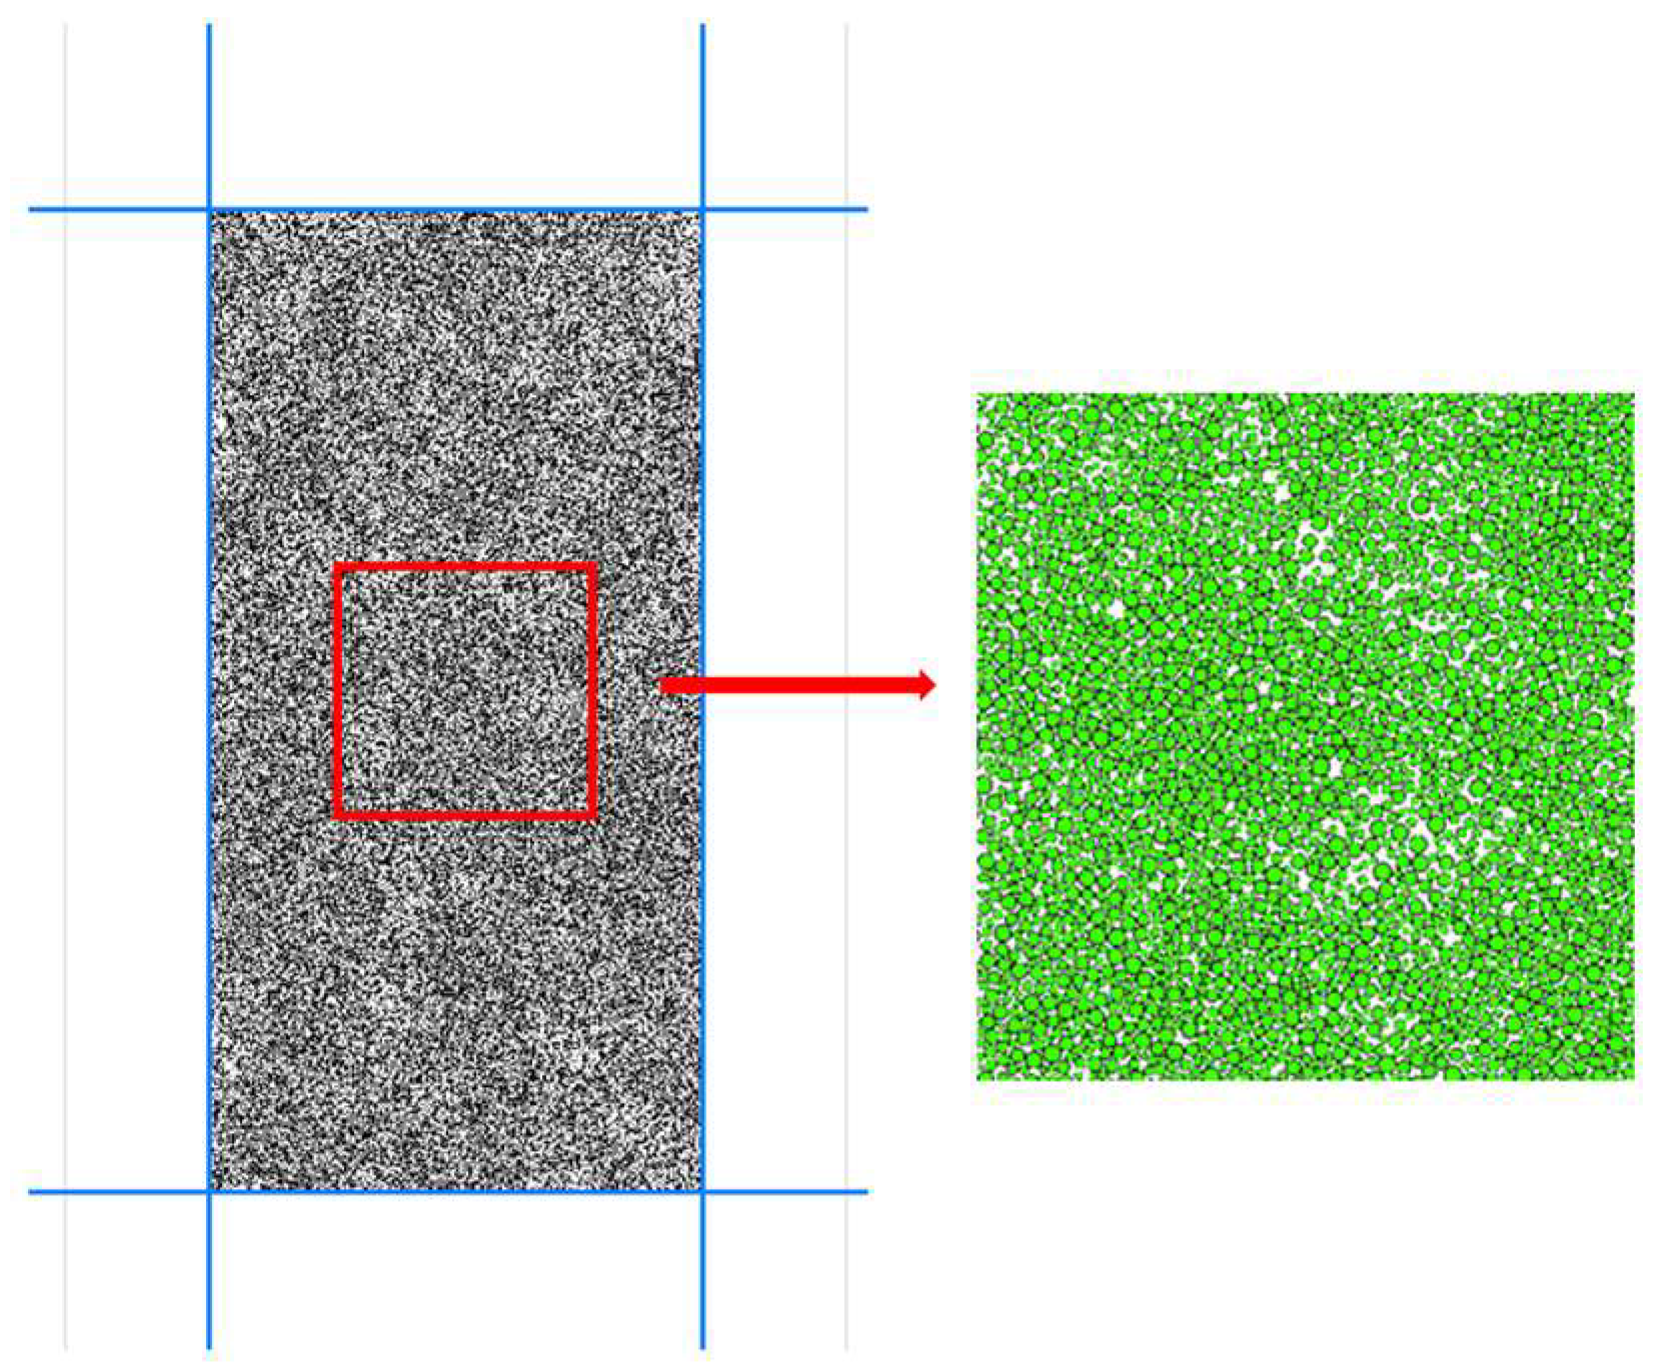
2.3. Discrete Particle Flow Analysis Method

Particle flow code (PFC) is a widely used simulation software based on the discrete element method (DEM), designed to accurately predict the physical behavior of particle systems under various conditions, such as flow, compression, separation, and mixing. PFC models the interactions between particles and their motion laws, enabling detailed simulations of complex particle systems [23,24]. In this study, PFC was employed to investigate the mechanical behavior of marine soft soil under dynamic loading from a microscopic perspective.
The study commenced with a comprehensive analysis of both macroscopic and microscopic mechanical properties of marine soft soils, focusing on key parameters such as particle size distribution, mineral composition, and porosity. The findings from this analysis are extensively discussed in the literature [5]. The paper also presents the particle distribution characteristics of the specimens used in the dynamic triaxial tests, as detailed in Table 1. By integrating data from the literature [5] with the information in Table 1, and referencing the microstructural characteristics of marine soft soils outlined in the study by [20], a particle flow calculation model for marine soft soil was developed using DEM.
The specimen in the dynamic triaxial test measures 70 mm in diameter and 140 mm in height, and a two-dimensional numerical model of the same size was established for simulation. Wall units were used to define the triaxial tester boundaries, with rigid boundaries applied to create the model structure. Four walls were generated in the simulation: the top and bottom walls represent the axial loading plates, while the left and right walls simulate the rubber sleeve surrounding the specimen. To replicate the rubber sleeve effect, the top and bottom walls were assigned higher stiffness values, while the left and right walls were assigned lower stiffness values.
The study is based on the following assumed conditions: (1) marine soft soil exhibits homogeneity in particle distribution and mineralogy; (2) the behavior of marine soft soil is isotropic; and (3) the particle distribution is characterized using the particle coordination number, which serves as a key parameter for evaluating the structural stability of particle assemblies and the strength of inter-particle interactions. In the context of marine soft soil research, the coordination number not only reflects the physical contacts between particles but also has a direct correlation with the macroscopic mechanical properties of the material, such as compressibility, shear strength, and permeability. By integrating these methodologies and assumptions, the micromechanical characterization of marine soft soils is effectively realized.
In constructing the model, the radius expansion method was applied, initially generating smaller particles within the model range and then enlarging them to meet initial porosity requirements. A direct replication of particle gradation from the physical test would involve millions of particles, significantly impacting computational efficiency. Thus, the radius expansion method was optimized to produce 22,440 particles with an initial porosity of 0.25, a particle diameter range of 0.3–1 mm, and a density of 1.69 g/cm³. This is shown in Figure 2.
In the PFC particle flow model, particle unit parameters cannot be directly assigned to replicate the macroscopic properties of soil. Instead, a calibration process is required to establish a correspondence between the model’s microscopic parameters and the actual physical and mechanical properties of the soil. This involves iterative adjustment of the model’s microscopic parameters to ensure that the numerical simulation results align with the soil’s macroscopic physical and mechanical behavior, a process known as macro–micro parameter calibration.
Key microscopic parameters in the linear contact bond model include friction coefficient, linear contact effective modulus Ec, the ratio of normal to tangential contact stiffness between particles, normal bond strength σc, and tangential bond strength τc. By fine-tuning these parameters, the numerical results can more closely match those obtained from laboratory tests. The calibration of fine-scale parameters is crucial for accurately simulating the mechanical properties of materials in numerical models. However, this process can be complex and requires adjustments to different models based on actual working conditions. Both domestic and international scholars have conducted extensive research on fine-scale parameter calibration, identifying key principles that can serve as guidelines. In this study, we follow the calibration principles outlined in the literature [23,24] and perform the calibration of fine-scale parameters for marine soft soil using the functional relationship between fine-scale and macro-mechanical parameters proposed in [25]. Based on the basic properties of marine soft soils presented in reference [5], the calibrated micro-parameter values for marine soft soils are provided in Table 3, corresponding to the macro-mechanical properties obtained from reference [22].
In PFC, axial loading of the specimen is simulated by applying velocity to the upper and lower walls [26]. Since the walls in PFC are massless entities to which Newton’s second law does not apply, it is not possible to apply force directly to them. In this study, an axial stress control method is used, where sinusoidal stress is converted into velocity, which is then applied to the walls. This conversion is achieved through a servo mechanism, as detailed below:
v = G ( σ r e q + σ z )
where σ r e q is the axial stress; σ z is between the particle and the upper and lower walls.
Axial loading stress:
σ r e q = q s i n ( 2 π f t ) + σ
where q is the stress amplitude; f is the loading frequency; t is the loading time; σ is circumferential pressure.
In the simulation, the sinusoidal stresses were set to match those used in the laboratory tests, with a loading frequency of 10 Hz applied to improve computational efficiency. After generating the specimen particles, they were pressurized using a servo-mechanism programmed in the FISH language, and each specimen underwent bias consolidation with K0 = 0.7 before cyclic loading. The perimeter pressure was maintained constant throughout the loading process. Parameters of the cyclic loading, including frequency, amplitude (in terms of force or displacement), loading form (unidirectional or bidirectional), and the number of cycles, were specified via programming scripts (e.g., FISH language) or through the software’s built-in functions. Once bias consolidation was complete, a sinusoidal load matching the magnitude of the laboratory test was applied to the specimen, with the loading process concluding after 200 cycles. The specimen’s response—including particle displacement, deformation, stress, and strain—was recorded in real time using PFC’s monitoring tools.

2.4. Analytical Method Validation

To verify the consistency between the macroscopic test results and the microscopic particle flow analysis, axial deformation curves for varying water contents were obtained using both methods under the conditions of σc = 100 kPa and ηd = 0.15. This is shown in Figure 3.The results from both approaches indicate that the strain in marine soft soil increases rapidly at the initial stage of loading, followed by a gradual reduction in the growth rate until stabilization, and eventually exhibits a slow linear increase. The cumulative strain changes observed in the discrete element simulations closely align with those from the experimental tests, with an error margin within 7%, demonstrating the reliability of the discrete element numerical simulation method. These findings confirm that the discrete element numerical model developed in this study is suitable for simulating dynamic triaxial tests of marine soft soil and for advancing research into its micromechanical properties.

3. Results

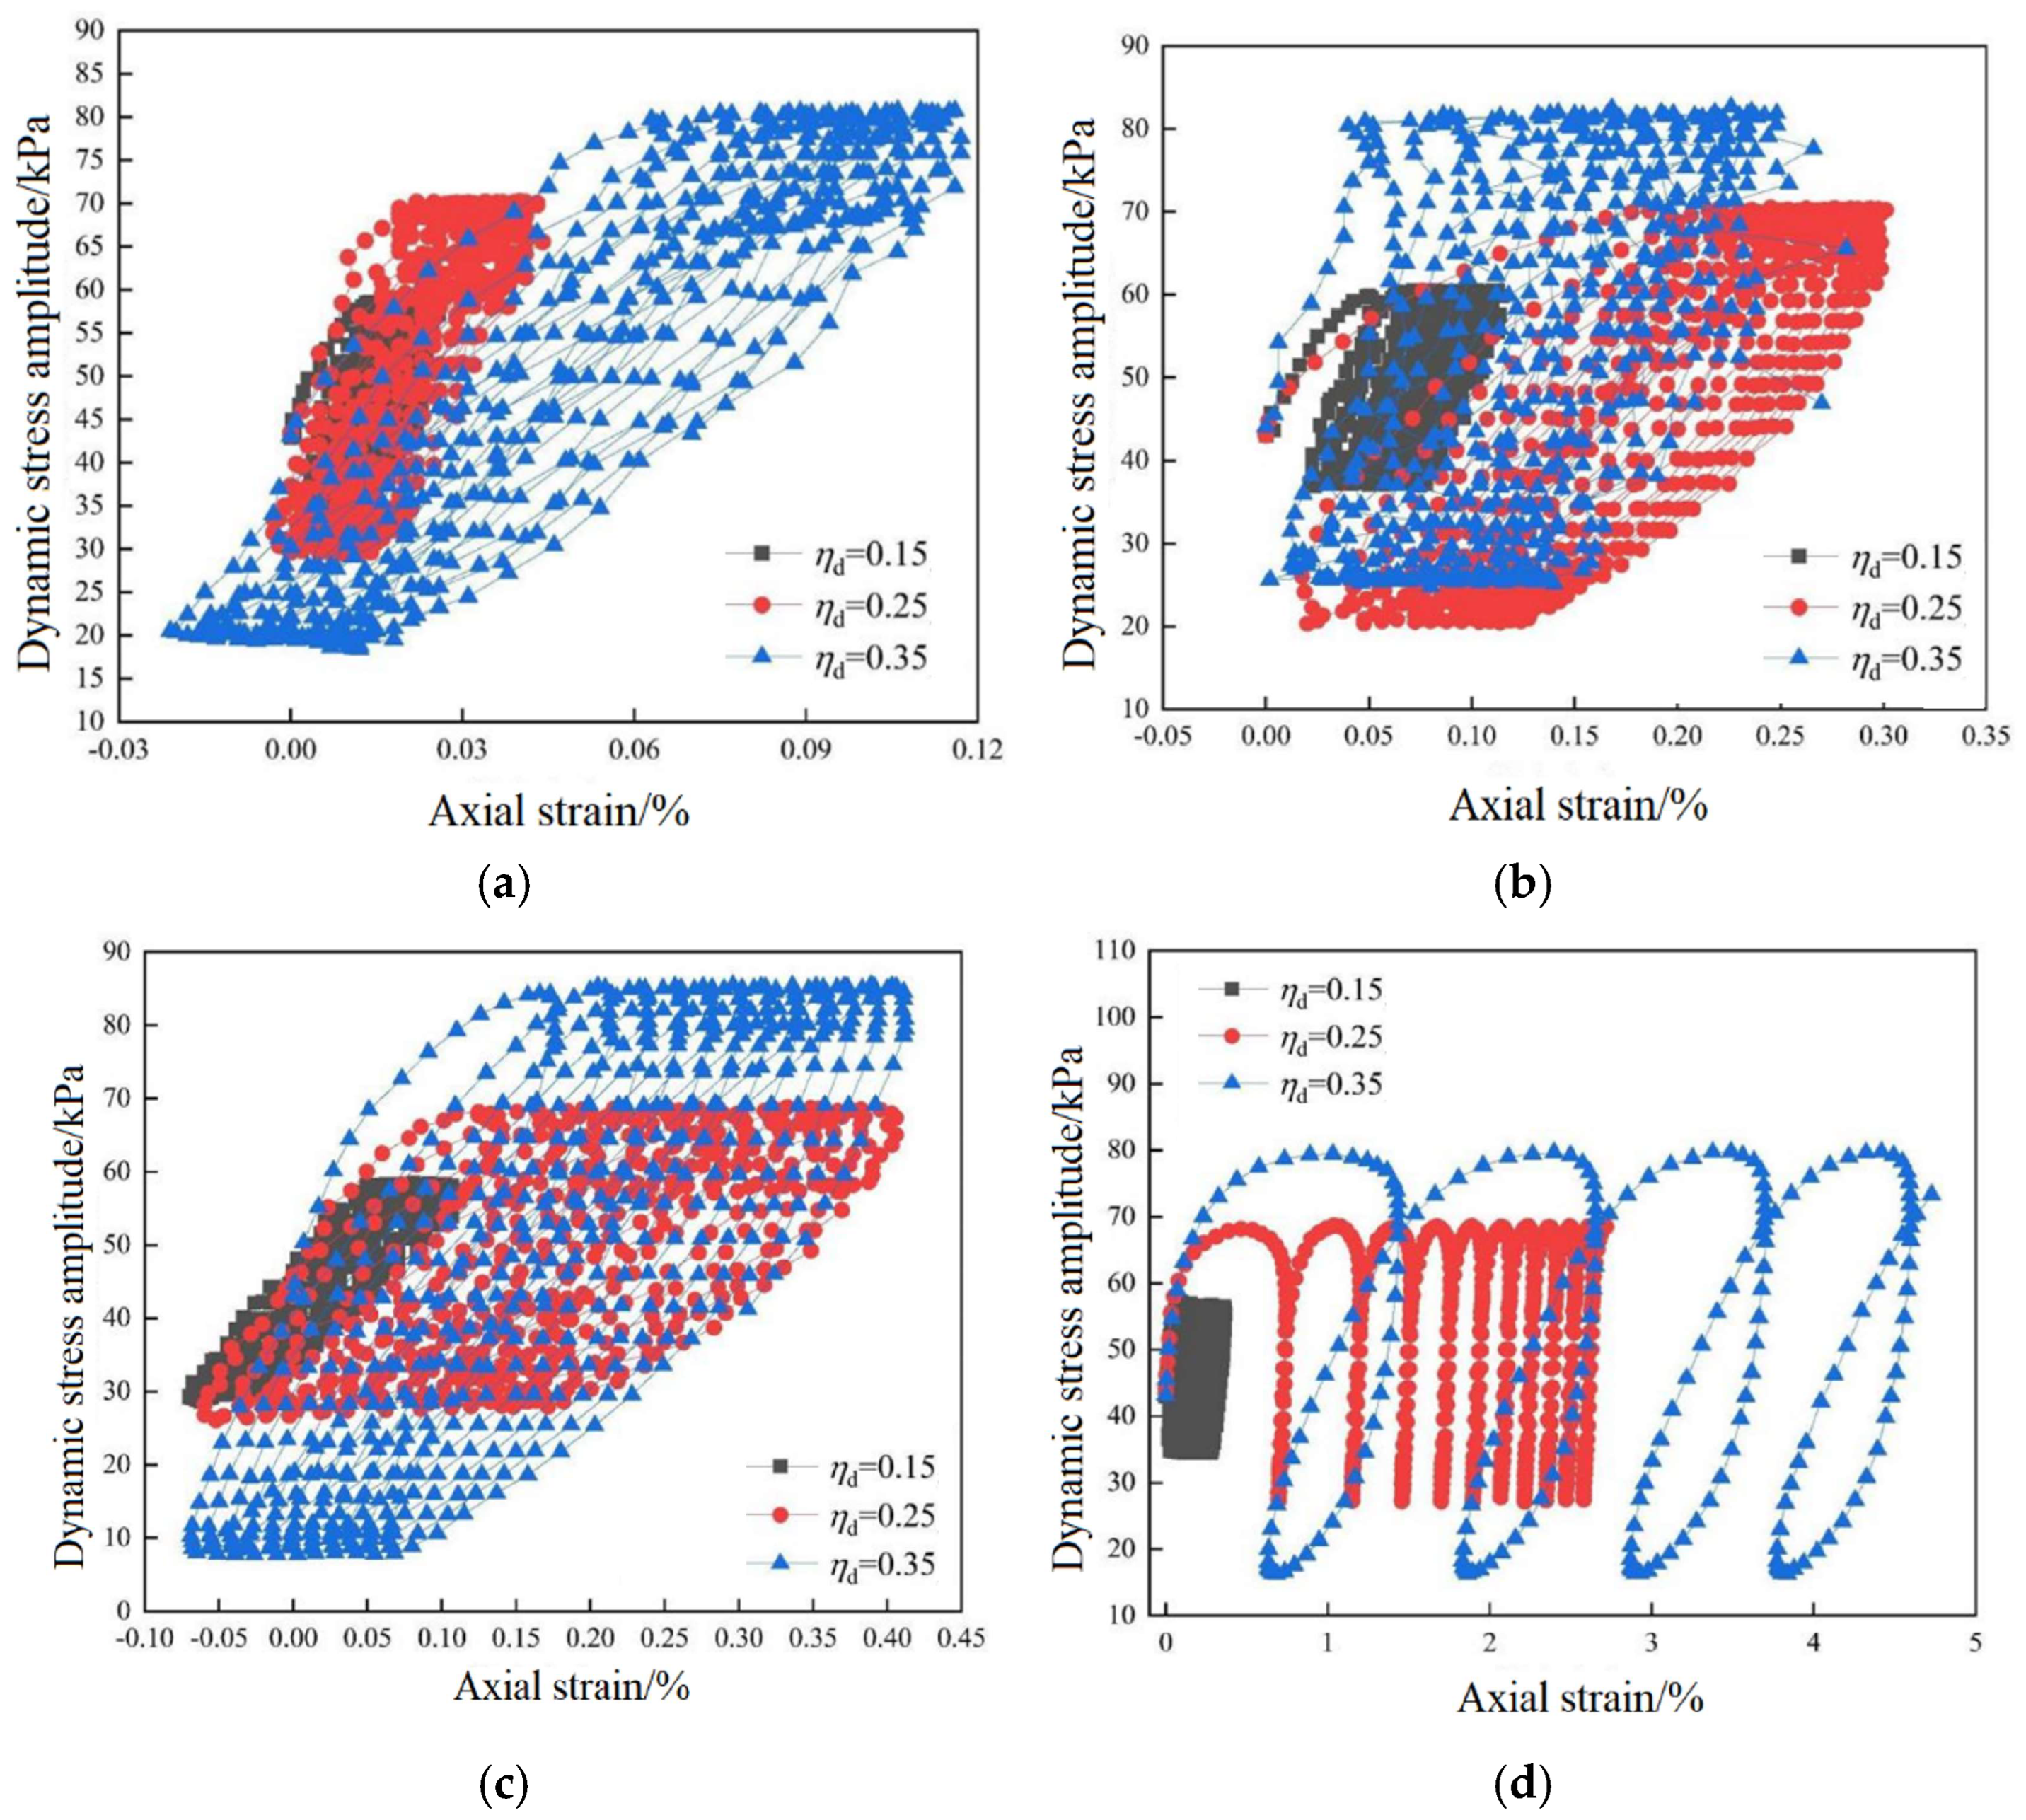
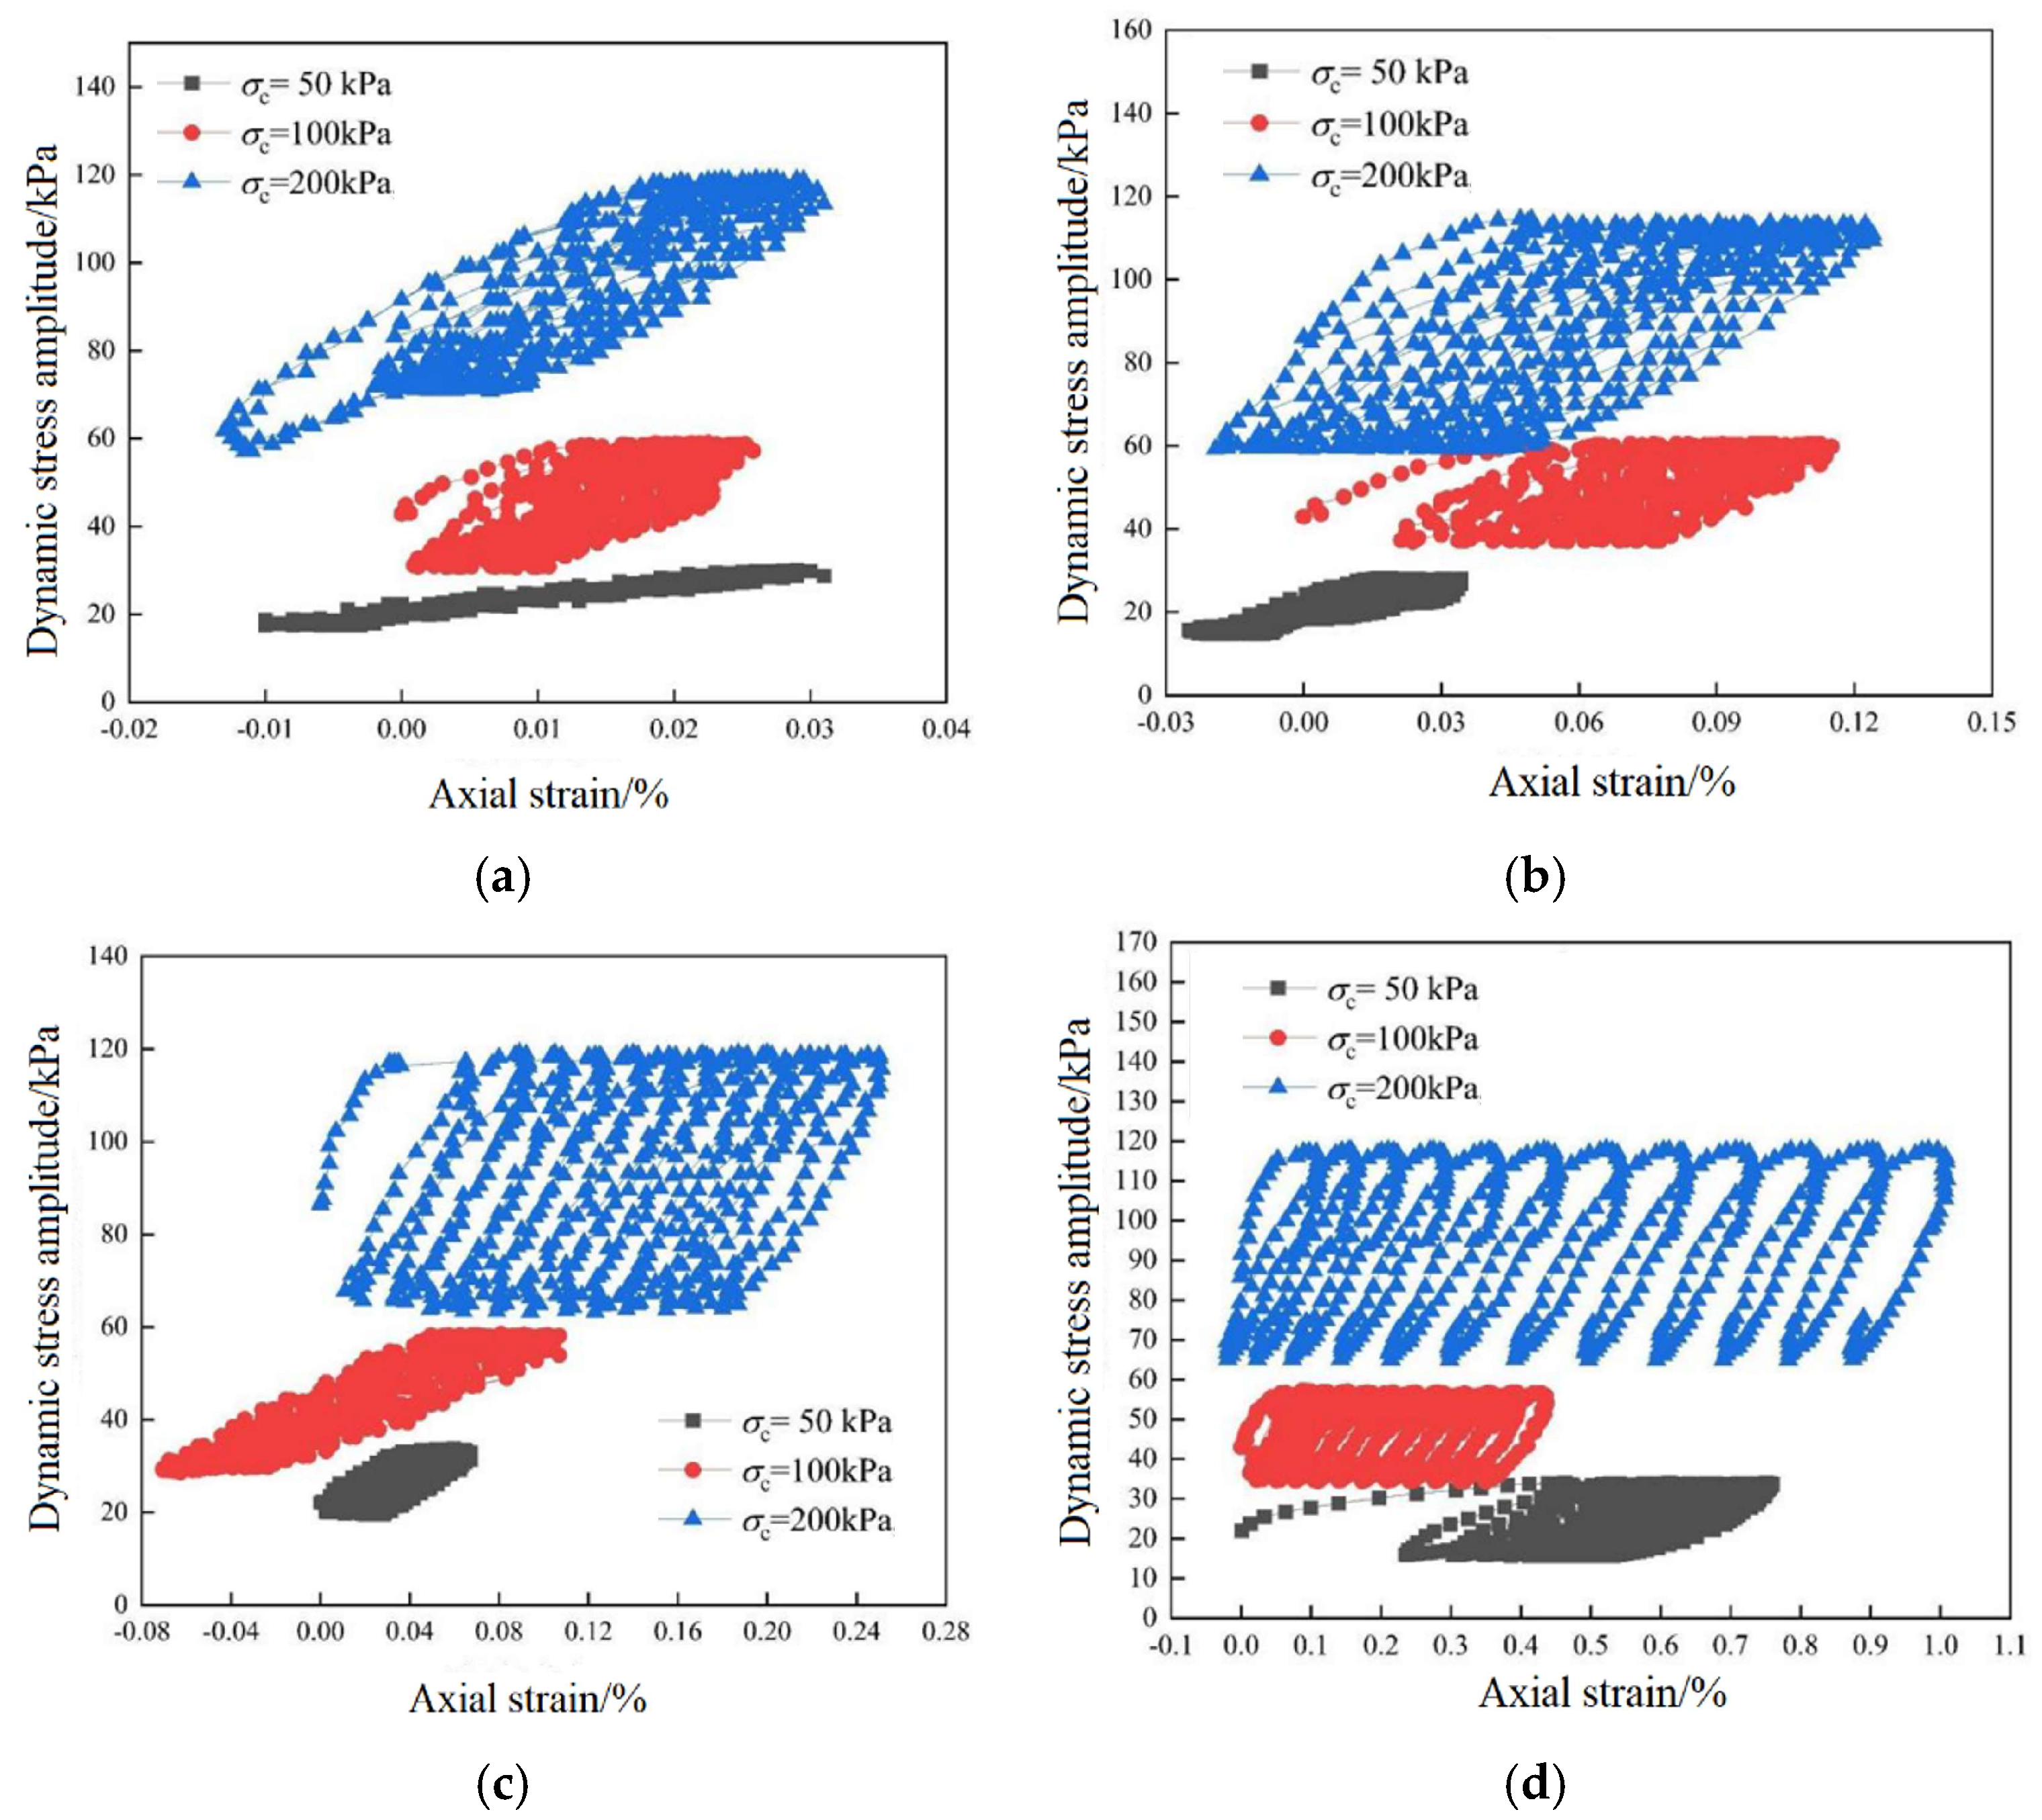
3.1. Morphological Characteristics of Stress–Strain Hysteresis Curves in Marine Soft Soils

The stress–strain hysteresis curve is a cyclic loading and unloading development curve that illustrates the relationship between dynamic stress and dynamic strain at each point during cyclic loading. In dynamic triaxial tests of marine soft soils, the initial cycles reveal the soil’s initial stiffness—its fundamental capacity to resist deformation under dynamic loading—and provide early indicators of nonlinear behavior, such as strain softening or hardening. These initial cycles also elucidate the soil’s energy dissipation mechanisms, offering valuable insights into its behavior and stability under dynamic conditions. This analysis can further identify early signs of soil damage, providing a basis for implementing timely preventive measures. Accordingly, this study analyzes the first 10 cycles of the hysteresis curve to gain a deeper understanding of soil behavior in the early stages of dynamic loading, offering critical theoretical support for developing soil dynamics models and predicting soil performance in engineering applications.
Water contents of w = 40%, w = 45%, and w = 50% were selected for testing, with confining pressures of σc = 50 kPa, σc = 100 kPa, and σc = 200 kPa, and dynamic stress ratios of ηd = 0.15, ηd = 0.25, and ηd = 0.35. Figure 4 illustrates the stress–strain hysteresis curves for the specimens during the first 10 cycles under these test conditions. The results indicate that the hysteresis curves for all specimens exhibit a progression from loose to tight as the number of cycles increases. Notably, the strain range of the specimens expanded significantly with increased water content, and the hysteresis loops lengthened and tilted toward the axial strain direction, suggesting that higher water content intensified soil softening. Additionally, the area of the hysteresis loop increased with each cycle, further highlighting the soil’s enhanced energy dissipation capacity under high water content conditions, which, in turn, amplified the degree of softening.
The water content w was varied from 40% to 60%, with a confining pressure of σc = 100  kPa and dynamic stress ratios ηd of 0.15, 0.25, and 0.35. Figure 5 shows the stress–strain hysteresis curves for the specimens over the first 10 cycles under these test conditions. At a given water content, the hysteresis curves displayed a progression from loose to tight as the dynamic stress ratio increased, leading to a significant expansion of the strain range and an increase in the area of the hysteresis loop per cycle. This indicates that higher dynamic stress ratios amplify the degree of softening in the soil. Additionally, as water content increased, the hysteresis curves shifted to the right, with maximum strain values of 0.12%, 0.25%, 0.41%, and 4.5% observed in specimens subjected to 10 cycles of vibration at a dynamic stress ratio of 0.35 across different water contents. The cumulative strain over the 10 cycles increased with rising water content, making the softening effect on the soil more pronounced.
The water content w was selected as 40%, 45%, 50%, 55%, and 60%, with confining pressures σc of 50 kPa, 100 kPa, and 200 kPa, and a dynamic stress ratio ηd = 0.15. Figure 6 shows the stress–strain hysteresis curves of the specimens over the first 10 cycles under these conditions. At a constant dynamic stress ratio, a higher confining pressure corresponds to a greater applied dynamic stress. The development of stress–strain hysteresis loops under different confining pressures follows a sparse-to-dense-to-compact pattern over 10 cycles. As accumulated plastic strain increases, the hysteresis loop gradually becomes denser. Higher confining pressures yield larger hysteresis loop areas, broader strain ranges, and enhanced energy dissipation capacity, indicating that absorbed and dissipated energy increase with confining pressure. Furthermore, as water content rises, the hysteresis curves shift to the right, with maximum strain values of 0.03%, 0.12%, 0.24%, and 1.0% observed for specimens at 200 kPa across different water contents after 10 cycles. The cumulative strain over 10 cycles also increases with higher water content, making the soil softening effect more pronounced.

3.2. Characterization of Energy Loss in Marine Soft Soil

Figure 7 presents a schematic diagram illustrating the relationship between energy dissipation in marine soft soil under a dynamic stress ratio of 0.15, as influenced by changes in water content and perimeter pressure. From the figure, the following observations can be made:
(1)
Effect of water content on energy loss: At low water content, friction and particle contact in the marine soft soil are stronger, leading to higher energy dissipation and greater soil stiffness, with energy loss primarily occurring through friction between soil particles. As water content increases to a medium level, the water gradually fills the pore spaces within the soil, enhancing the lubricating effect and causing the energy dissipation mechanism to shift toward viscous dissipation. At high water content, the soil becomes softer, and the proportion of water increases, potentially reaching a higher level of energy loss. In this condition, the soil may exhibit behavior akin to liquefaction, and the energy dissipation mechanism becomes more complex. However, the energy loss may decrease as the deformation mode becomes more water-dominated, reducing friction and, thus, frictional dissipation.
(2)
Effect of perimeter pressure on energy loss: When the perimeter pressure is 50 kPa, the larger pore spaces in the soil result in more noticeable water effects, leading to more significant soil deformation and higher energy dissipation. As water content increases, energy loss rises more gradually, but water content still plays an important role. At 100 kPa perimeter pressure, the soil is more compacted, enhancing particle contact and increasing stiffness, which reduces energy loss. The stronger contact force and higher stiffness limit soil deformation, leading to more efficient energy transfer but less energy dissipation compared to lower perimeter pressures. For soil with medium water content, the effect of perimeter pressure on energy dissipation becomes more pronounced. At 200 kPa perimeter pressure, the soil becomes denser, and particle contact reaches its maximum, resulting in increased stiffness and significantly reduced energy dissipation. At this point, energy is primarily transferred through elastic deformation, with minimal energy loss, particularly at higher water content.
In summary, at lower perimeter pressures (50 kPa), energy dissipation increases more noticeably with water content, as the soil is more prone to deformation and the energy dissipation mechanism shifts. At higher perimeter pressures (200 kPa), the effect of water content on energy dissipation is less significant, as the soil becomes more compact and the stronger particle contact reduces sensitivity to changes in water content. The curve at 100 kPa perimeter pressure lies between these extremes, showing a smoother change in energy dissipation.
Figure 8 presents a schematic diagram showing the relationship between energy dissipation, water content, and dynamic stress ratio for marine soft soil under a perimeter pressure of 100 kPa. From the figure, it can be observed that when the dynamic stress ratio is 0.15, the increase in energy dissipation with water content is relatively gradual, primarily driven by friction and viscous dissipation. At a dynamic stress ratio of 0.25, the energy dissipation curve rises smoothly, likely representing an intermediate case. However, when the dynamic stress ratio is 0.23, the energy dissipation increases rapidly with rising water content, which is closely related to the larger dynamic stress and corresponding soil deformation. In summary, higher dynamic stress ratios lead to more significant energy loss. At higher stress ratios, soil deformation is more pronounced, and increased water content results in a rapid rise in energy dissipation. At lower dynamic stress ratios, energy dissipation increases more slowly, primarily influenced by the soil’s stiffness and the lubricating effect of water. The overall trend is that energy dissipation intensifies with increasing water content, especially at higher dynamic stress ratios.

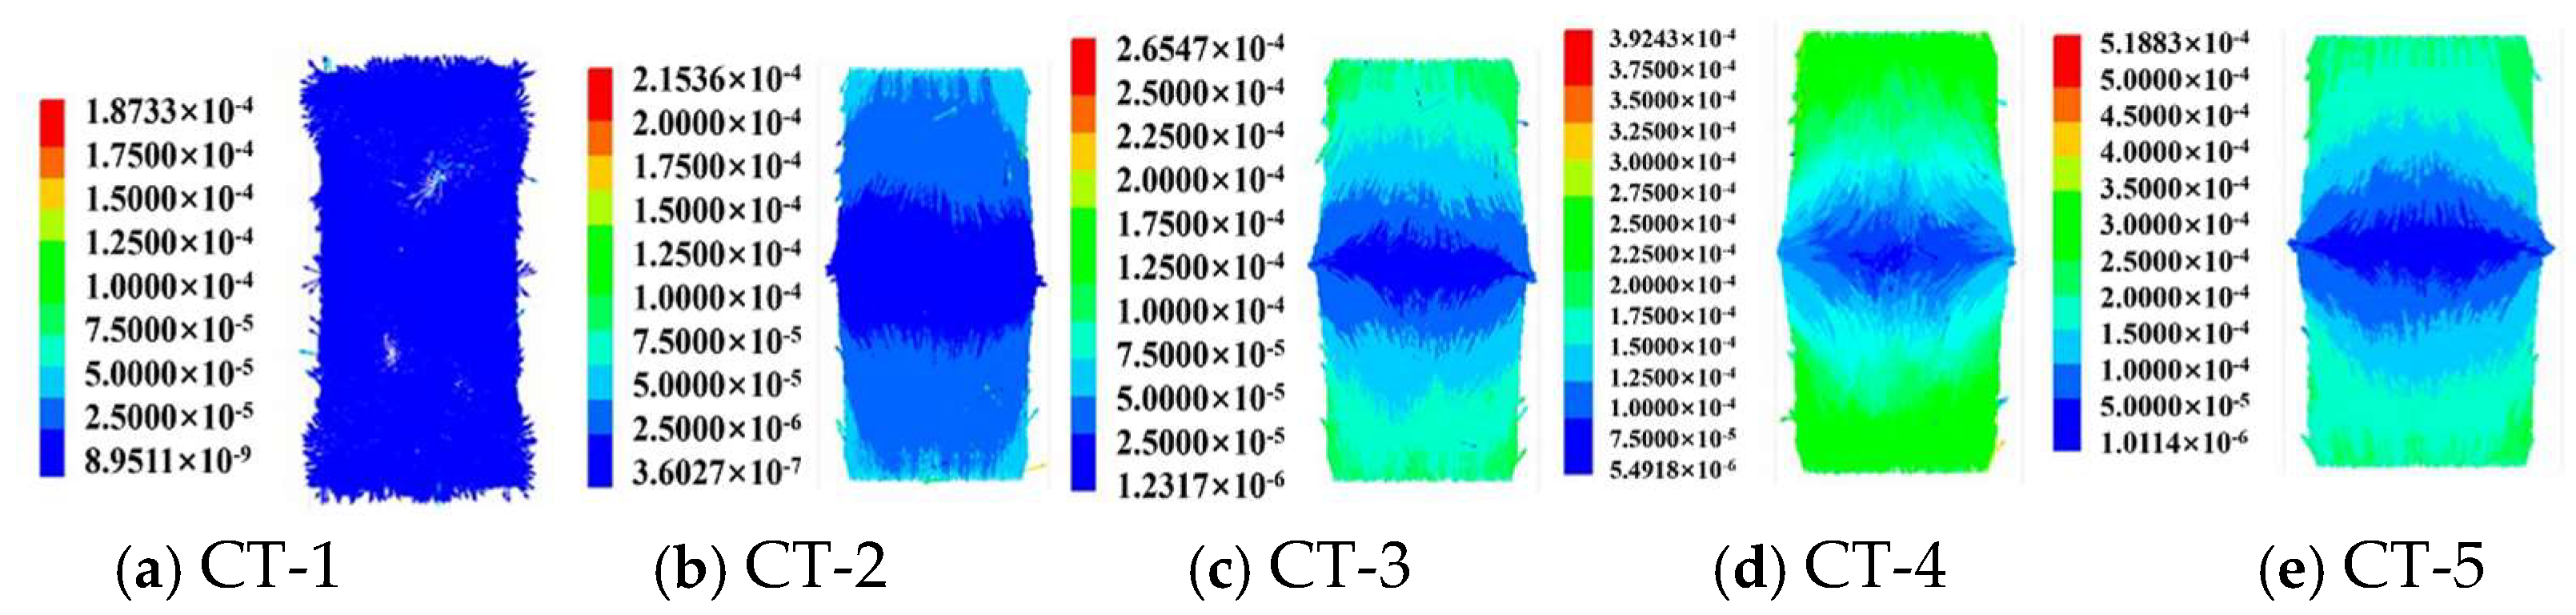
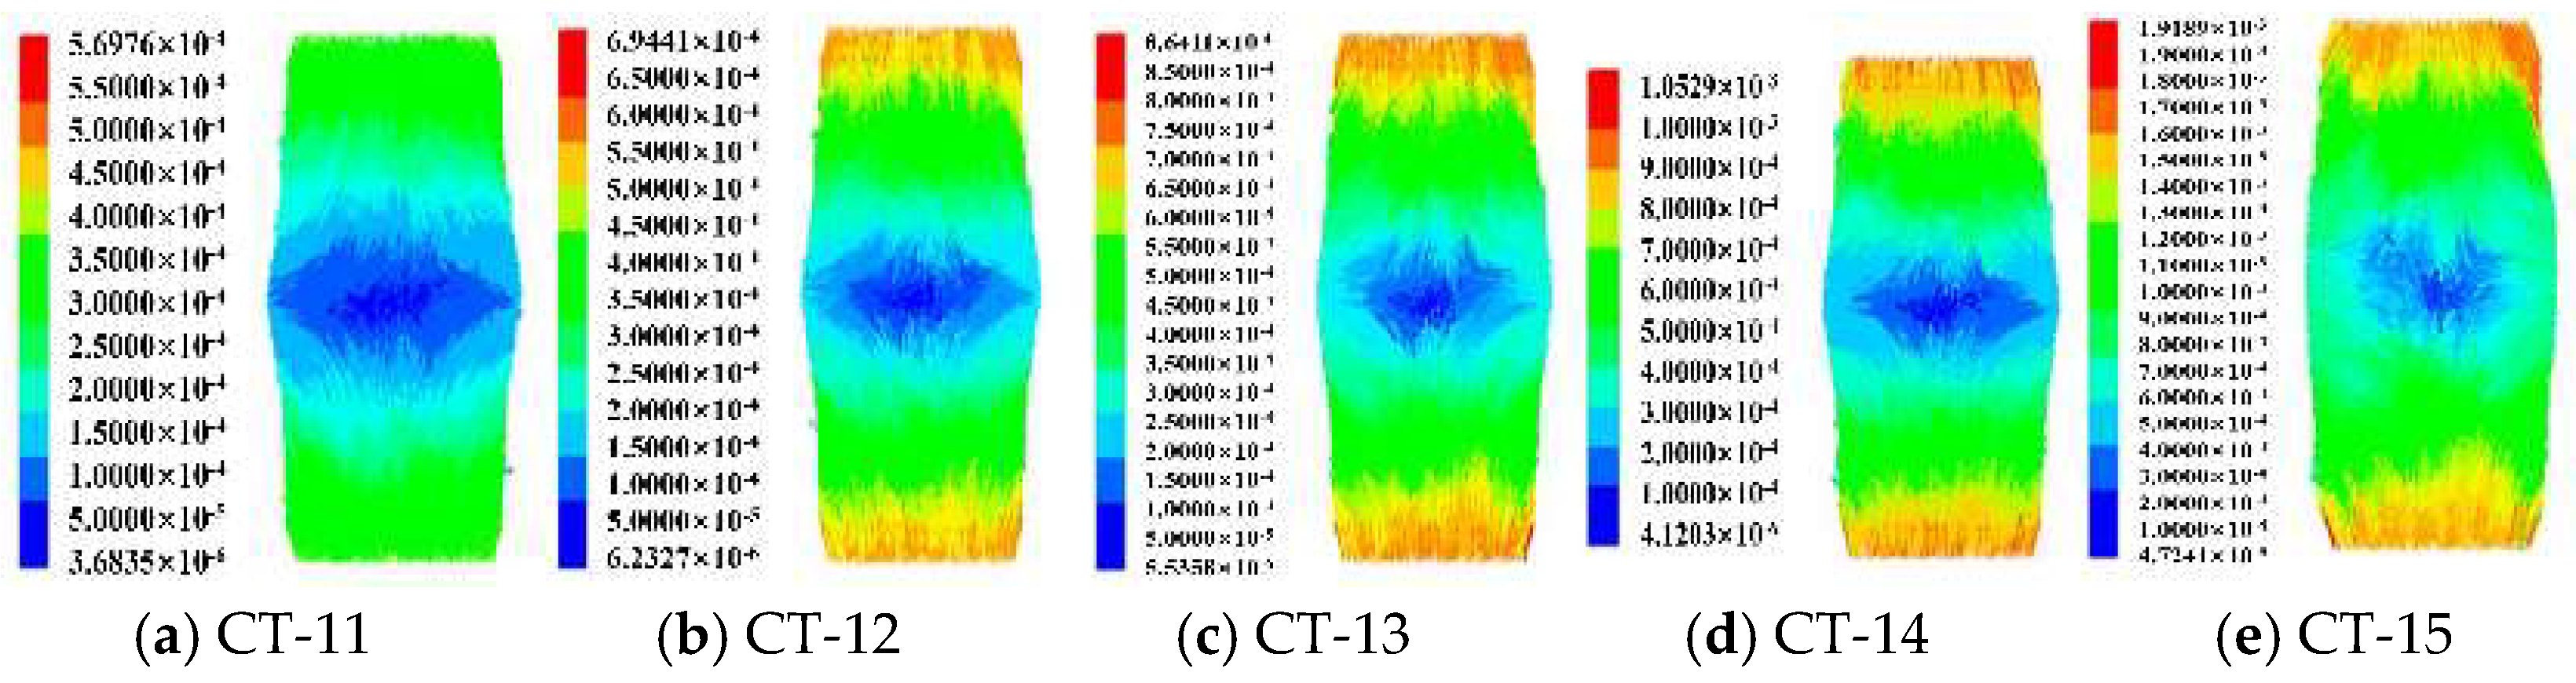
3.3. Displacement Fields

PFC 5.0 software can monitor particle motion, plot displacement vectors, and observe the initiation and development of damage and shear zone formation within the specimen. Figure 9, Figure 10 and Figure 11 show the particle displacement vector distribution in marine soft soil specimens. The displacement field trends and their responses under different conditions reveal the complex behavior of granular materials, particularly marine soft soils, under cyclic loading.
At lower water contents, specimens exhibit limited accumulated dynamic strain, and particle motion is more random. As water content increases, especially at 50% and 55%, cumulative dynamic strain grows, particle displacement becomes more apparent, and initial shear zones start to form within the specimen, which remains intact. At a water content of 60%, however, the specimen shows significant damage, with the shear zone running through its entirety. At low water content, the lack of lubrication between particles restricts movement, resulting in minimal accumulated dynamic strain and preventing the formation of effective shear bands. As water content rises, the lubrication between particles increases, facilitating displacement and rearrangement, which supports shear band formation. Once particles begin relative motion and accumulate dynamic strain, localized stress concentration occurs between particles, leading to shear band formation. As water content continues to increase, particles slip more easily, creating more prominent shear bands that eventually extend throughout the specimen. Additionally, as the dynamic stress ratio rises, the shear band becomes increasingly visible, eventually spanning the entire specimen, with its inclination angle shifting from 0° to 45° and its width expanding. This increase in dynamic stress amplitude imposes greater cyclic loading on the specimen, promoting shear zone development and expansion. The gradual tilt of the shear band to 45° suggests that, under dynamic loading, the shear zone aligns with the direction of maximum shear stress, while the widening of the shear zone indicates the expansion of the damage region. Increased particle displacement under rising confining pressure shows that higher circumferential pressure significantly enhances relative particle movement. However, this increase in displacement is not accompanied by prominent shear band development, as high confining pressure suppresses shear band formation. The heightened peripheral pressure raises inter-particle contact forces, which facilitate relative displacement but also stabilize the sample as a whole, resulting in more uniform particle interaction. This uniform interaction reduces localized shear stress concentrations, hindering shear band formation. Under high circumferential pressure, particles undergo more deformation, absorbing shear deformation through particle rearrangement, which weakens the localized characteristics of shear bands. This particle deformation and rearrangement mechanism promotes an even distribution of particle displacement, further inhibiting concentrated shear zone development under high confining pressure.

3.4. Porosity Evolution

Using the macroscopic dynamic triaxial test method, this study investigated the porosity evolution characteristics of marine soft soil under varying conditions of water content, dynamic stress ratio, and confining pressure. Figure 12 shows the porosity variation curves with respect to the number of cycles across different water content levels. As loading progresses, porosity within the specimen generally reaches a dynamic equilibrium state after an initial adjustment period, remaining relatively stable as the number of cycles increases. This indicates that particle interactions and arrangements tend toward a stable structural configuration following rapid adaptation in the early stages, leading to minimal porosity changes during subsequent cyclic loading.
Further analysis of the effect of water content on porosity revealed that as moisture content increased from 40% to 60%, the porosity of the samples gradually decreased, with the magnitude of this decrease becoming more pronounced at higher moisture levels. This trend underscores the critical role of water in granular materials, particularly through its lubricating effects and the enhancement of capillary water bridging. These mechanisms facilitate tighter particle packing, thereby reducing porosity. The basis for this analysis lies in the behavior of the thin water film that forms on the surface of marine soft soil particles as water content begins to increase. This film enhances lubrication between particles, reducing direct friction and facilitating closer particle packing. However, as water content continues to rise, excess water reduces effective particle-to-particle contact. Under cyclic loading, particle rearrangement tends to result in tighter packing at lower water content levels. In contrast, at higher water content, excessive lubrication between particles and the weakening of capillary water bridging effects hinder effective rearrangement and packing.
Figure 13 presents the deformation curve of porosity with respect to the number of cycles. The curve indicates that porosity within the specimen shows a relatively stable, fluctuating downward trend during continuous cyclic loading, suggesting that the particle structure reaches a dynamic equilibrium after an initial phase of rapid adaptation. Notably, the effect of increasing dynamic stress ratio on porosity does not follow a uniform trend under the same confining pressure conditions. Specifically, at a water content of 40%, porosity gradually decreased with increasing dynamic stress ratio. However, at a water content of 45%, while porosity decreased across all dynamic stress ratios, the magnitude of this decrease diminished as the dynamic stress ratio increased.
In particular, at a dynamic stress ratio of 0.35, the porosity was observed to be higher than that of specimens with a dynamic stress ratio of 0.15 in the later stages of cyclic loading. This difference became more pronounced as water content increased, ultimately resulting in consistently higher porosity in specimens with a dynamic stress ratio of 0.35 compared to those with a ratio of 0.15 throughout the cyclic loading process. This phenomenon may be attributed to the more frequent and intense interactions between particles at higher dynamic stress ratios, leading to a saturation of particle rearrangement and structural adjustments, which limits further reductions in porosity.
At higher moisture contents, the presence of water significantly enhances lubrication between particles, reducing inter-particle friction and preventing close particle packing, thereby influencing porosity trends. As the dynamic stress ratio increases, the lubrication layer formed by moisture between particles intensifies due to more frequent interactions and collisions, particularly under high moisture conditions. This reduces direct contact and close packing, thus maintaining or even increasing porosity to some extent.
Figure 14 presents the variation curves of porosity with the number of cycles under different dynamic stress ratios. During continuous cyclic loading, although the porosity within the specimen exhibited a slight fluctuating downward trend, it remained relatively stable overall. This suggests that the internal structure of the granular material gradually adapted to the effects of cyclic loading, reaching a dynamic equilibrium state after an initial phase of rapid adjustment. The gradual decrease in porosity with increasing confining pressure can be explained by two mechanisms: enhanced contact pressure between particles and particle rearrangement leading to densification. Higher confining pressure directly increases the inter-particle pressure, promoting closer packing and thereby reducing porosity. Additionally, particle rearrangement under higher confining pressure further optimizes the stress transfer path between particles, achieving a more compact structure. Under consistent dynamic stress ratios and confining pressure, porosity was observed to decrease progressively with increasing water content, with higher water contents resulting in greater reductions in porosity. This trend is primarily attributed to the enhanced lubrication effect between particles as water content increases. A thicker water film forms on particle surfaces with higher moisture, reducing direct contact and friction, thus facilitating particle rearrangement and tighter packing during loading, which ultimately decreases porosity.

4. Conclusions

In coastal cities, engineers and builders face significant challenges due to the presence of marine soft soils when developing underground spaces and constructing rail transit systems. Understanding the mechanical behavior of marine soft soils under dynamic loading is essential for reinforcing these specialized formations or designing structures with enhanced durability in such conditions. This study investigates the morphological characteristics of stress–strain hysteresis curves in marine soft soil under cyclic loading, employing a combination of macroscopic dynamic triaxial testing and microscopic particle flow analysis. The research highlights particle displacement patterns and porosity evolution in marine soft soil under varying conditions of water content, dynamic stress ratio, and confining pressure. Key findings include:
(1)
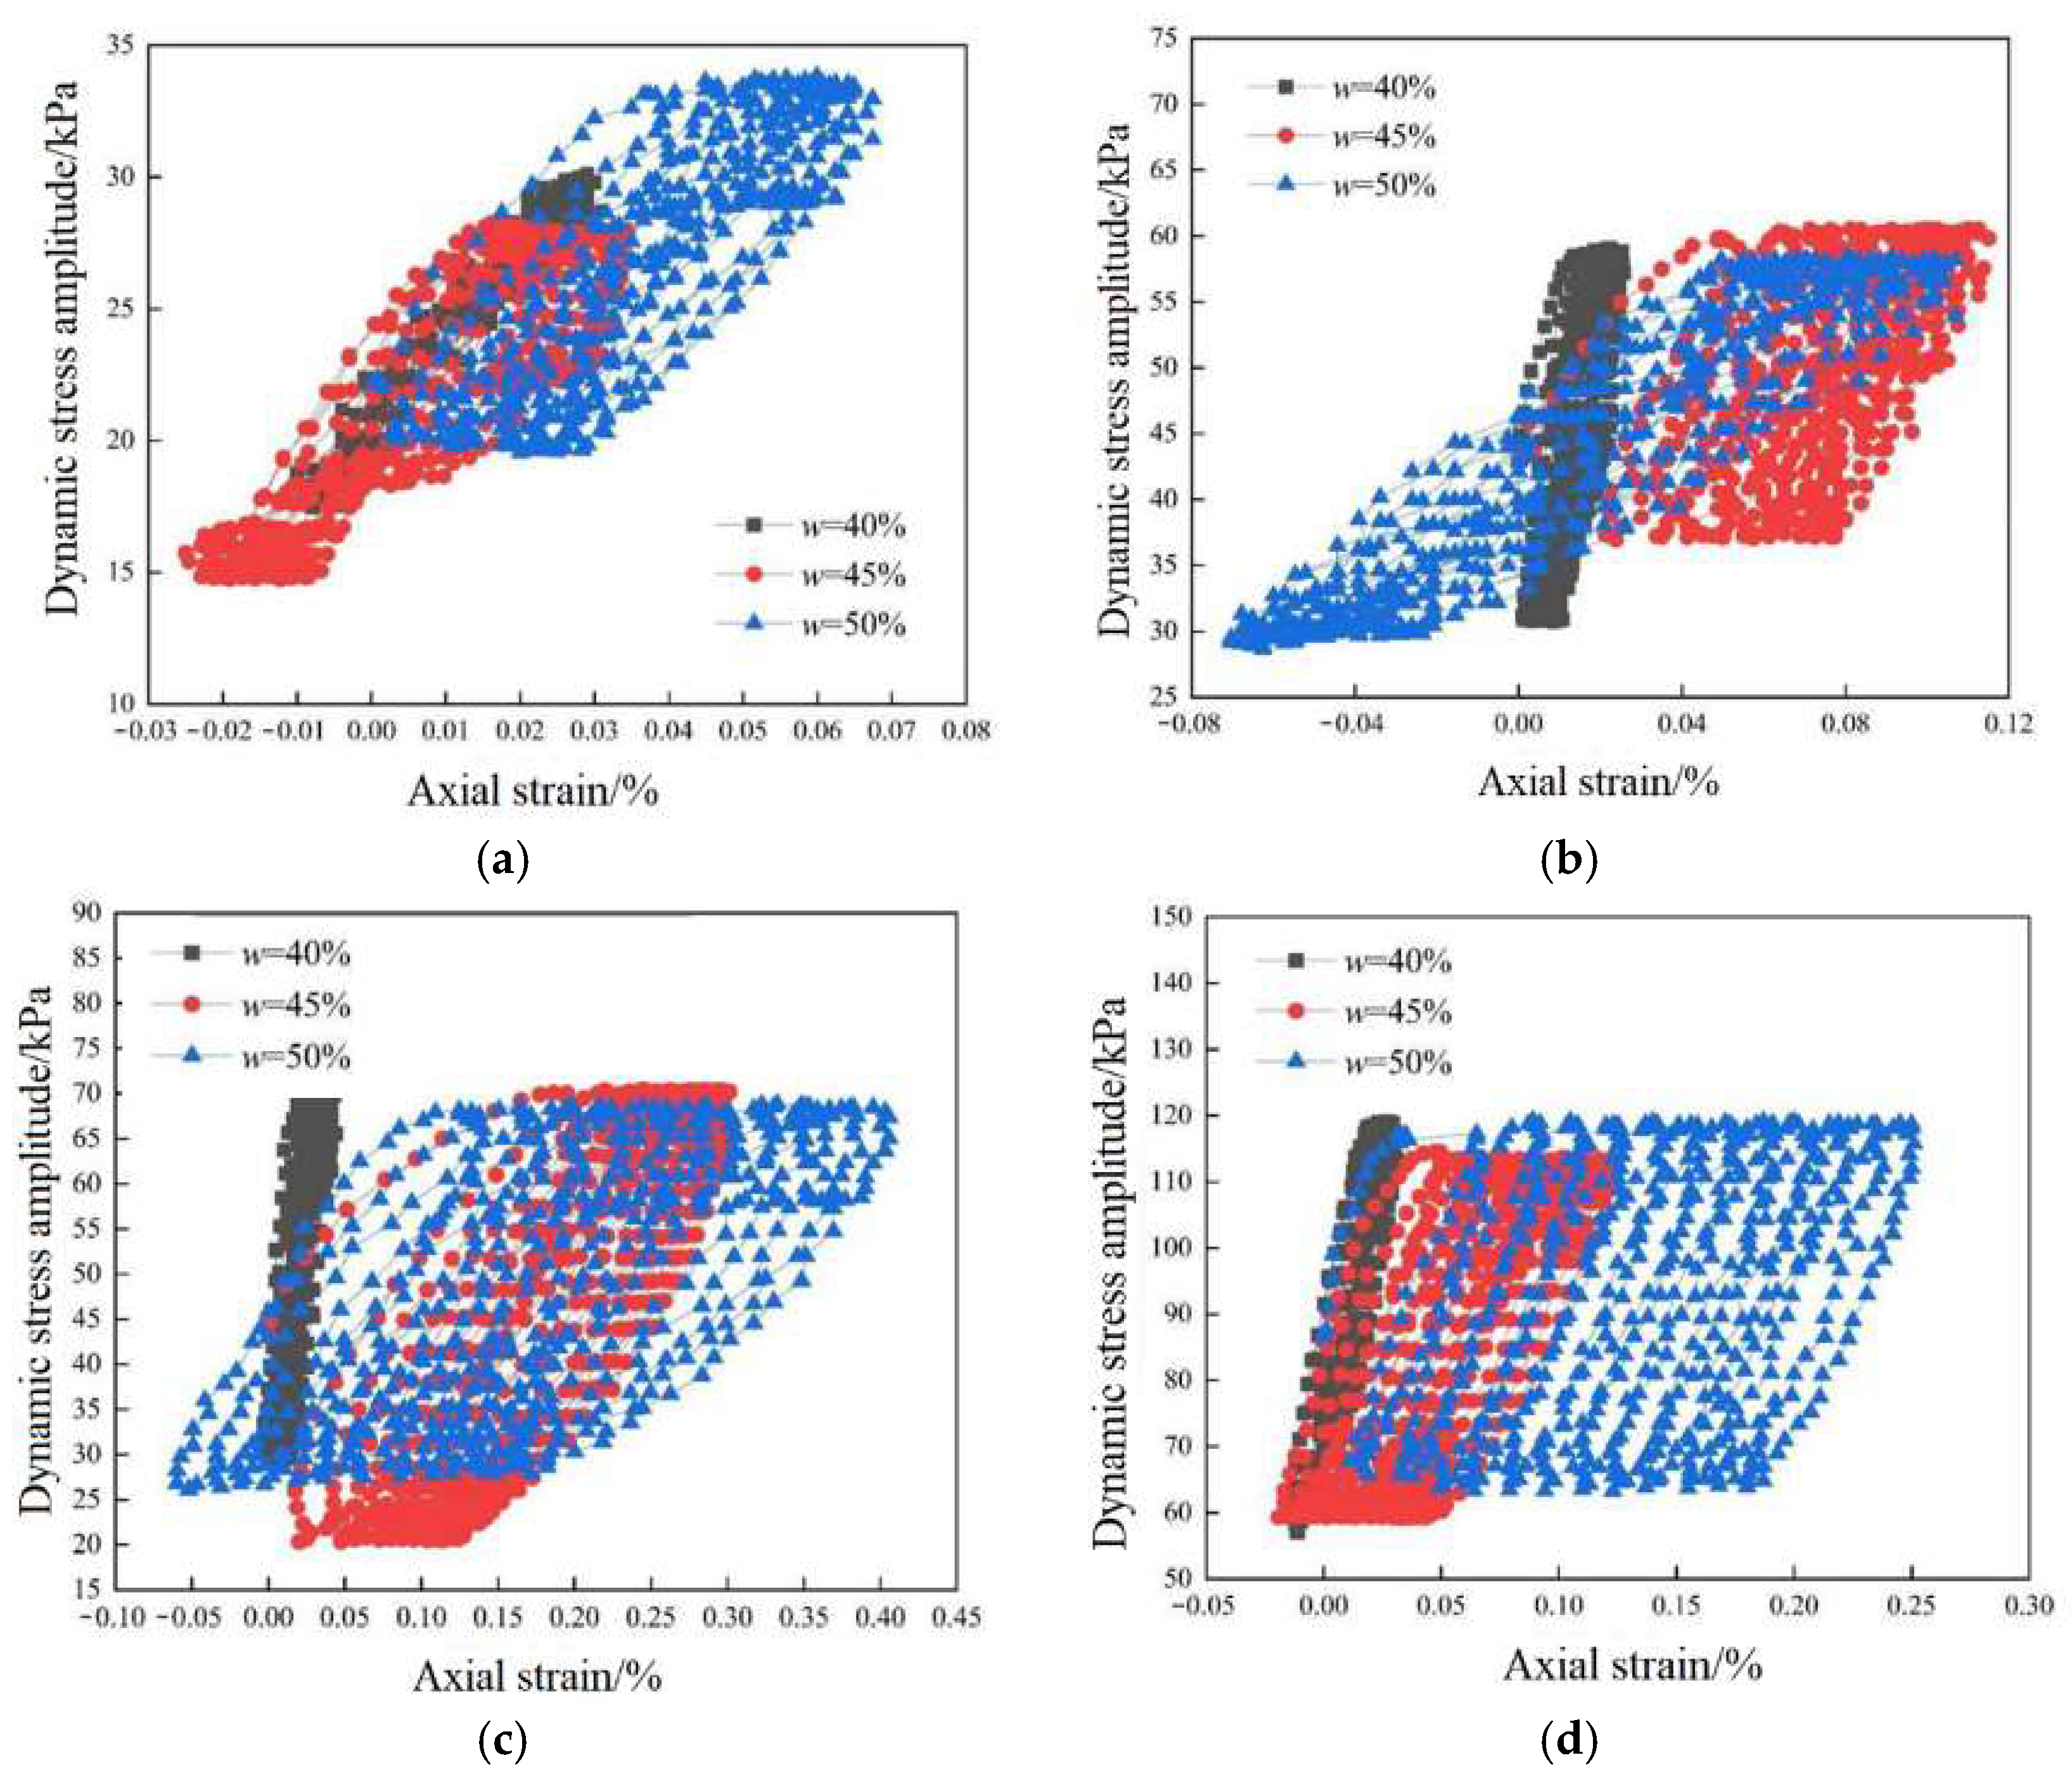
Strain behavior and energy dissipation: A detailed analysis of the first 10 cycles of the hysteresis curve reveals that the strain range of the specimen increases significantly with higher dynamic stress ratios, confining pressures, and water content. The hysteresis loop extends and tilts toward the axial strain direction, with a corresponding increase in the overall loop area, indicating enhanced energy dissipation. This trend suggests that higher dynamic stress ratios, confining pressures, and water content exacerbate strain softening in marine soft soil during the initial cycles.
(2)
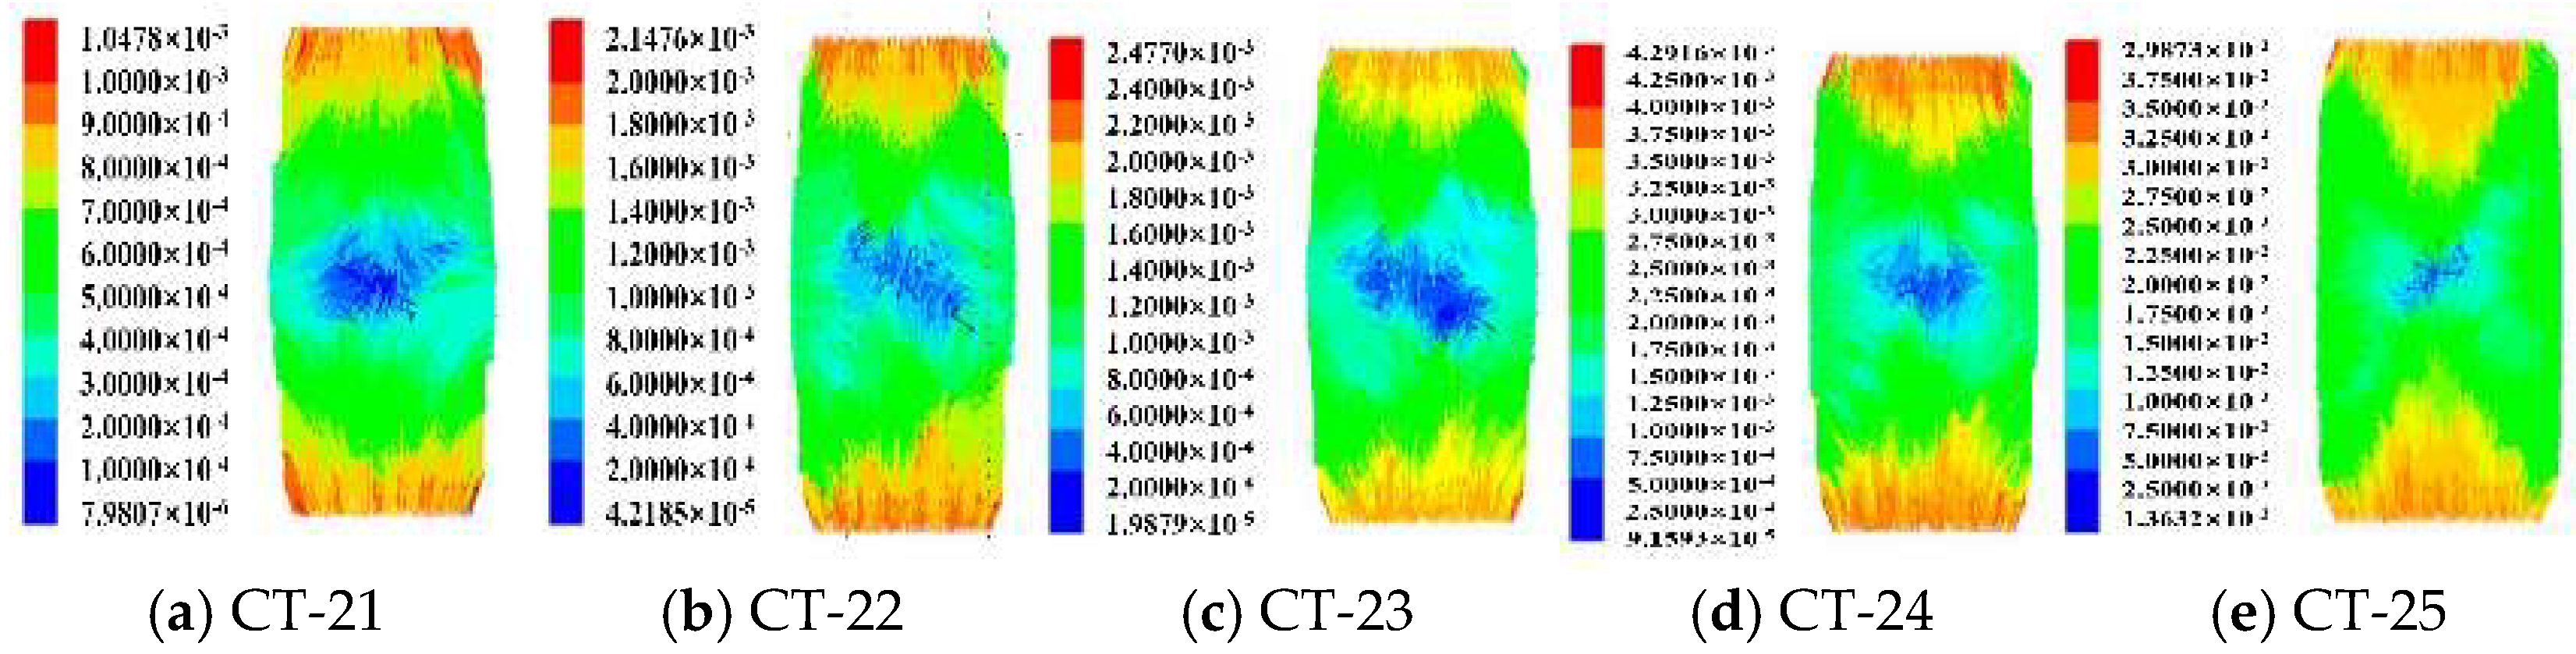
Particle displacement and shear band formation: At lower water contents, increased dynamic stress ratios lead to greater particle displacement but do not result in significant shear band formation. However, as water content increases to 50%, particle displacement becomes more pronounced, and initial shear bands begin to form, indicating that moderate water content provides sufficient lubrication while facilitating orderly particle movement. Further increases in water content to 60% result in wider and more pronounced shear zones, signifying extensive specimen damage. Although higher confining pressure enhances particle displacement, it does not lead to marked shear band formation, likely due to the stabilizing effect of high confining pressure, which promotes more uniform stress distribution and suppresses shear band development.
(3)
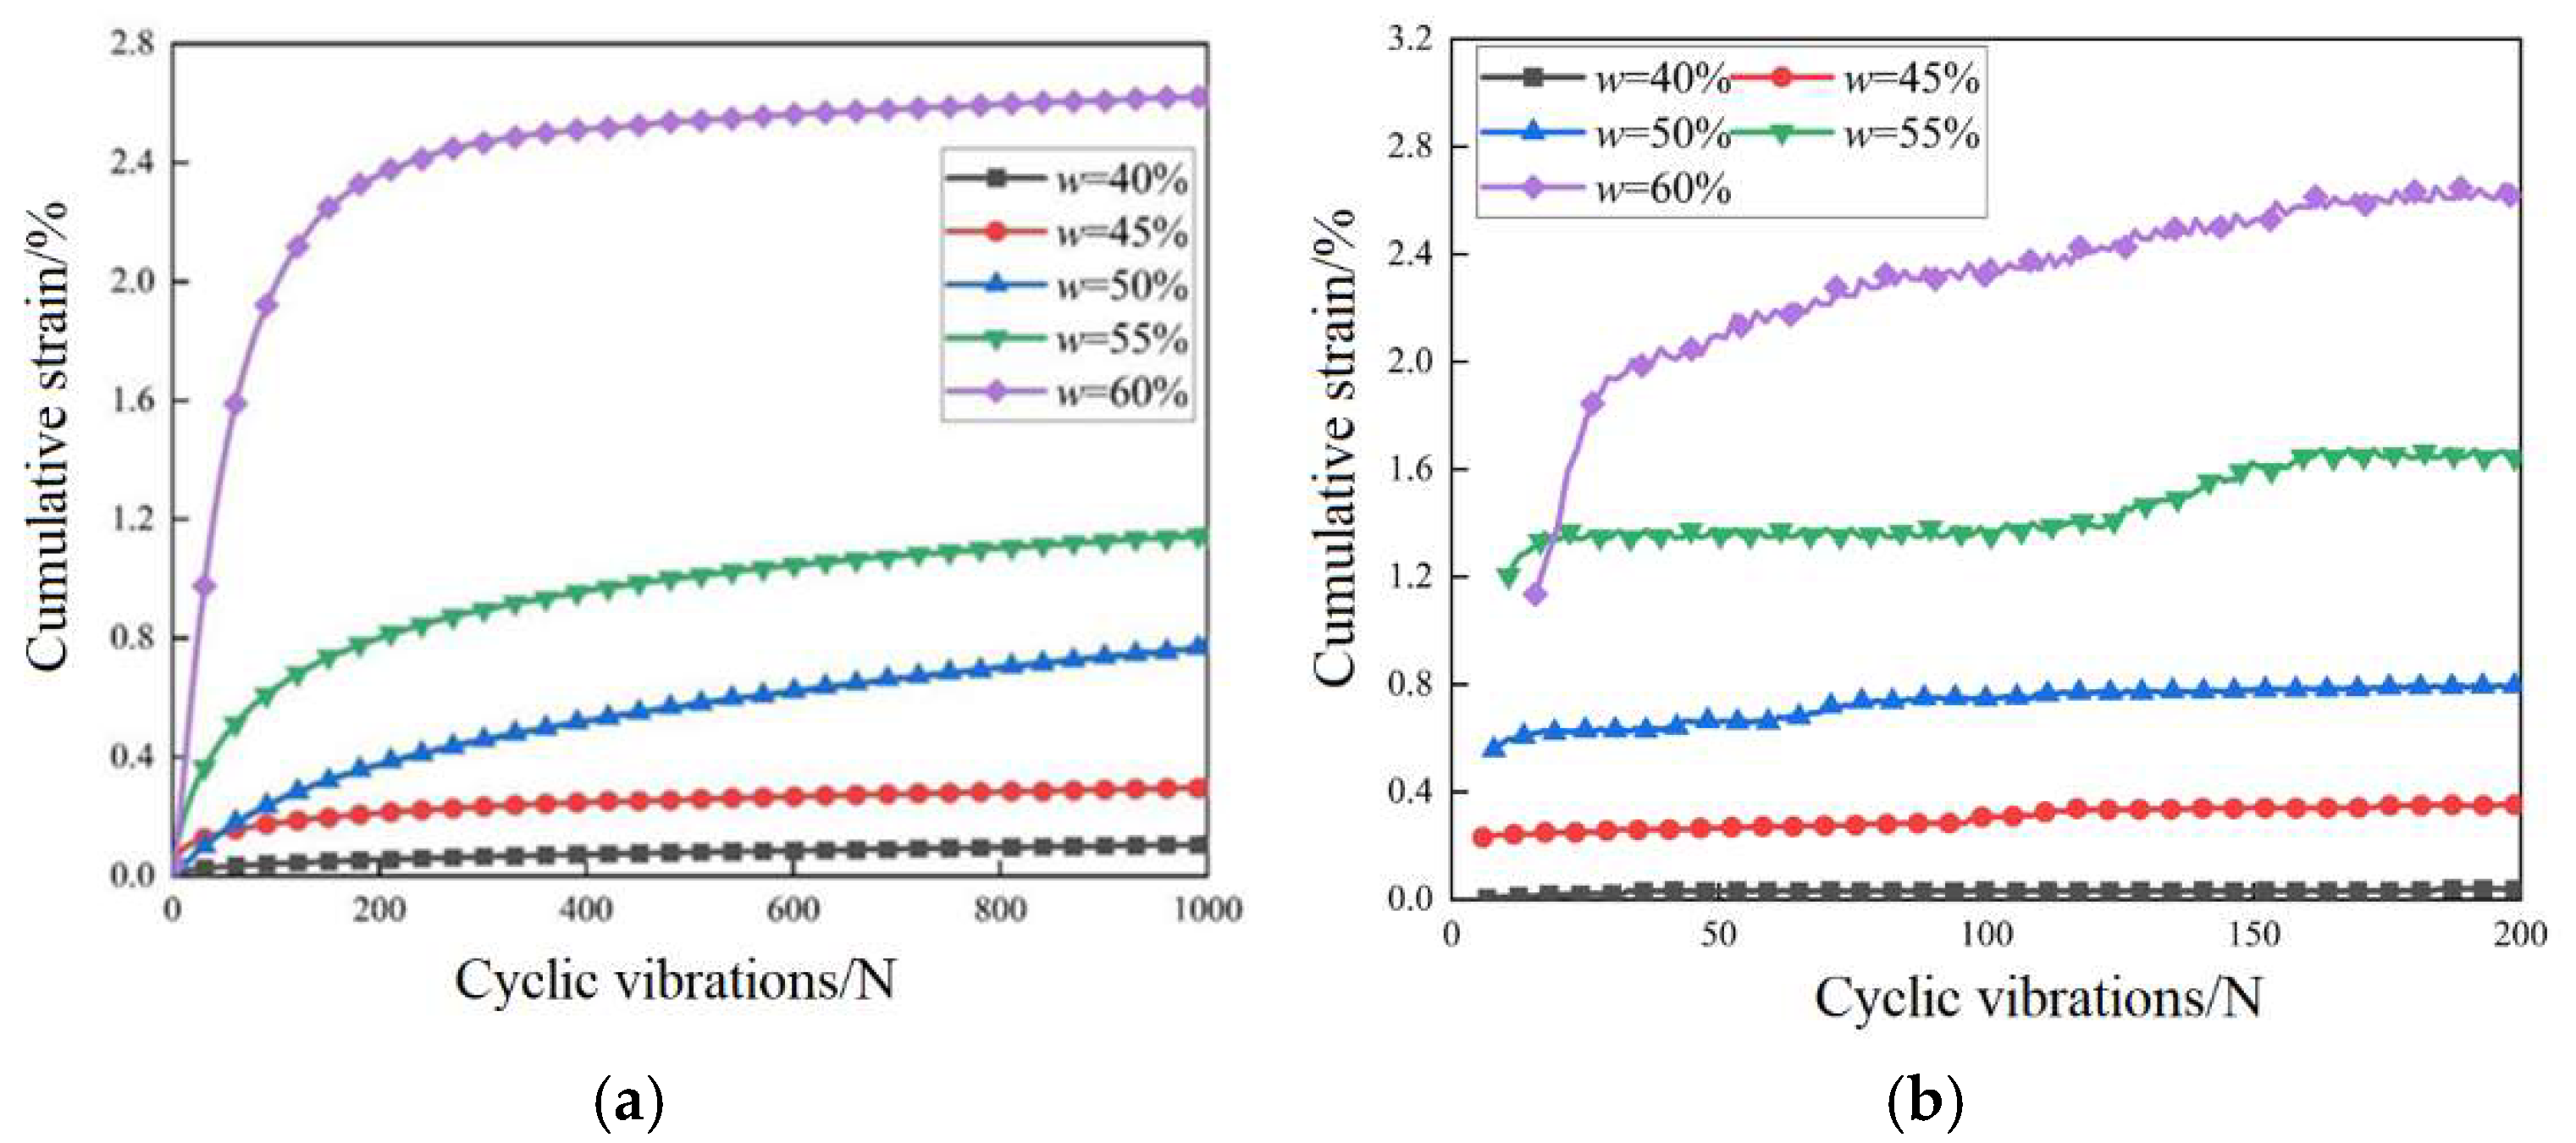
Energy dissipation: As water content increases, energy dissipation in marine soft soil accelerates at lower confining pressures but increases more gradually at higher confining pressures. At higher perimeter pressures, energy dissipation stabilizes, and the influence of water content on energy loss diminishes. Comparison of curves at different pressures shows that at lower pressures, energy dissipation increases more significantly, whereas at higher pressures, the rate of energy loss levels off. Additionally, higher dynamic stress ratios lead to greater energy dissipation in marine soft soils.
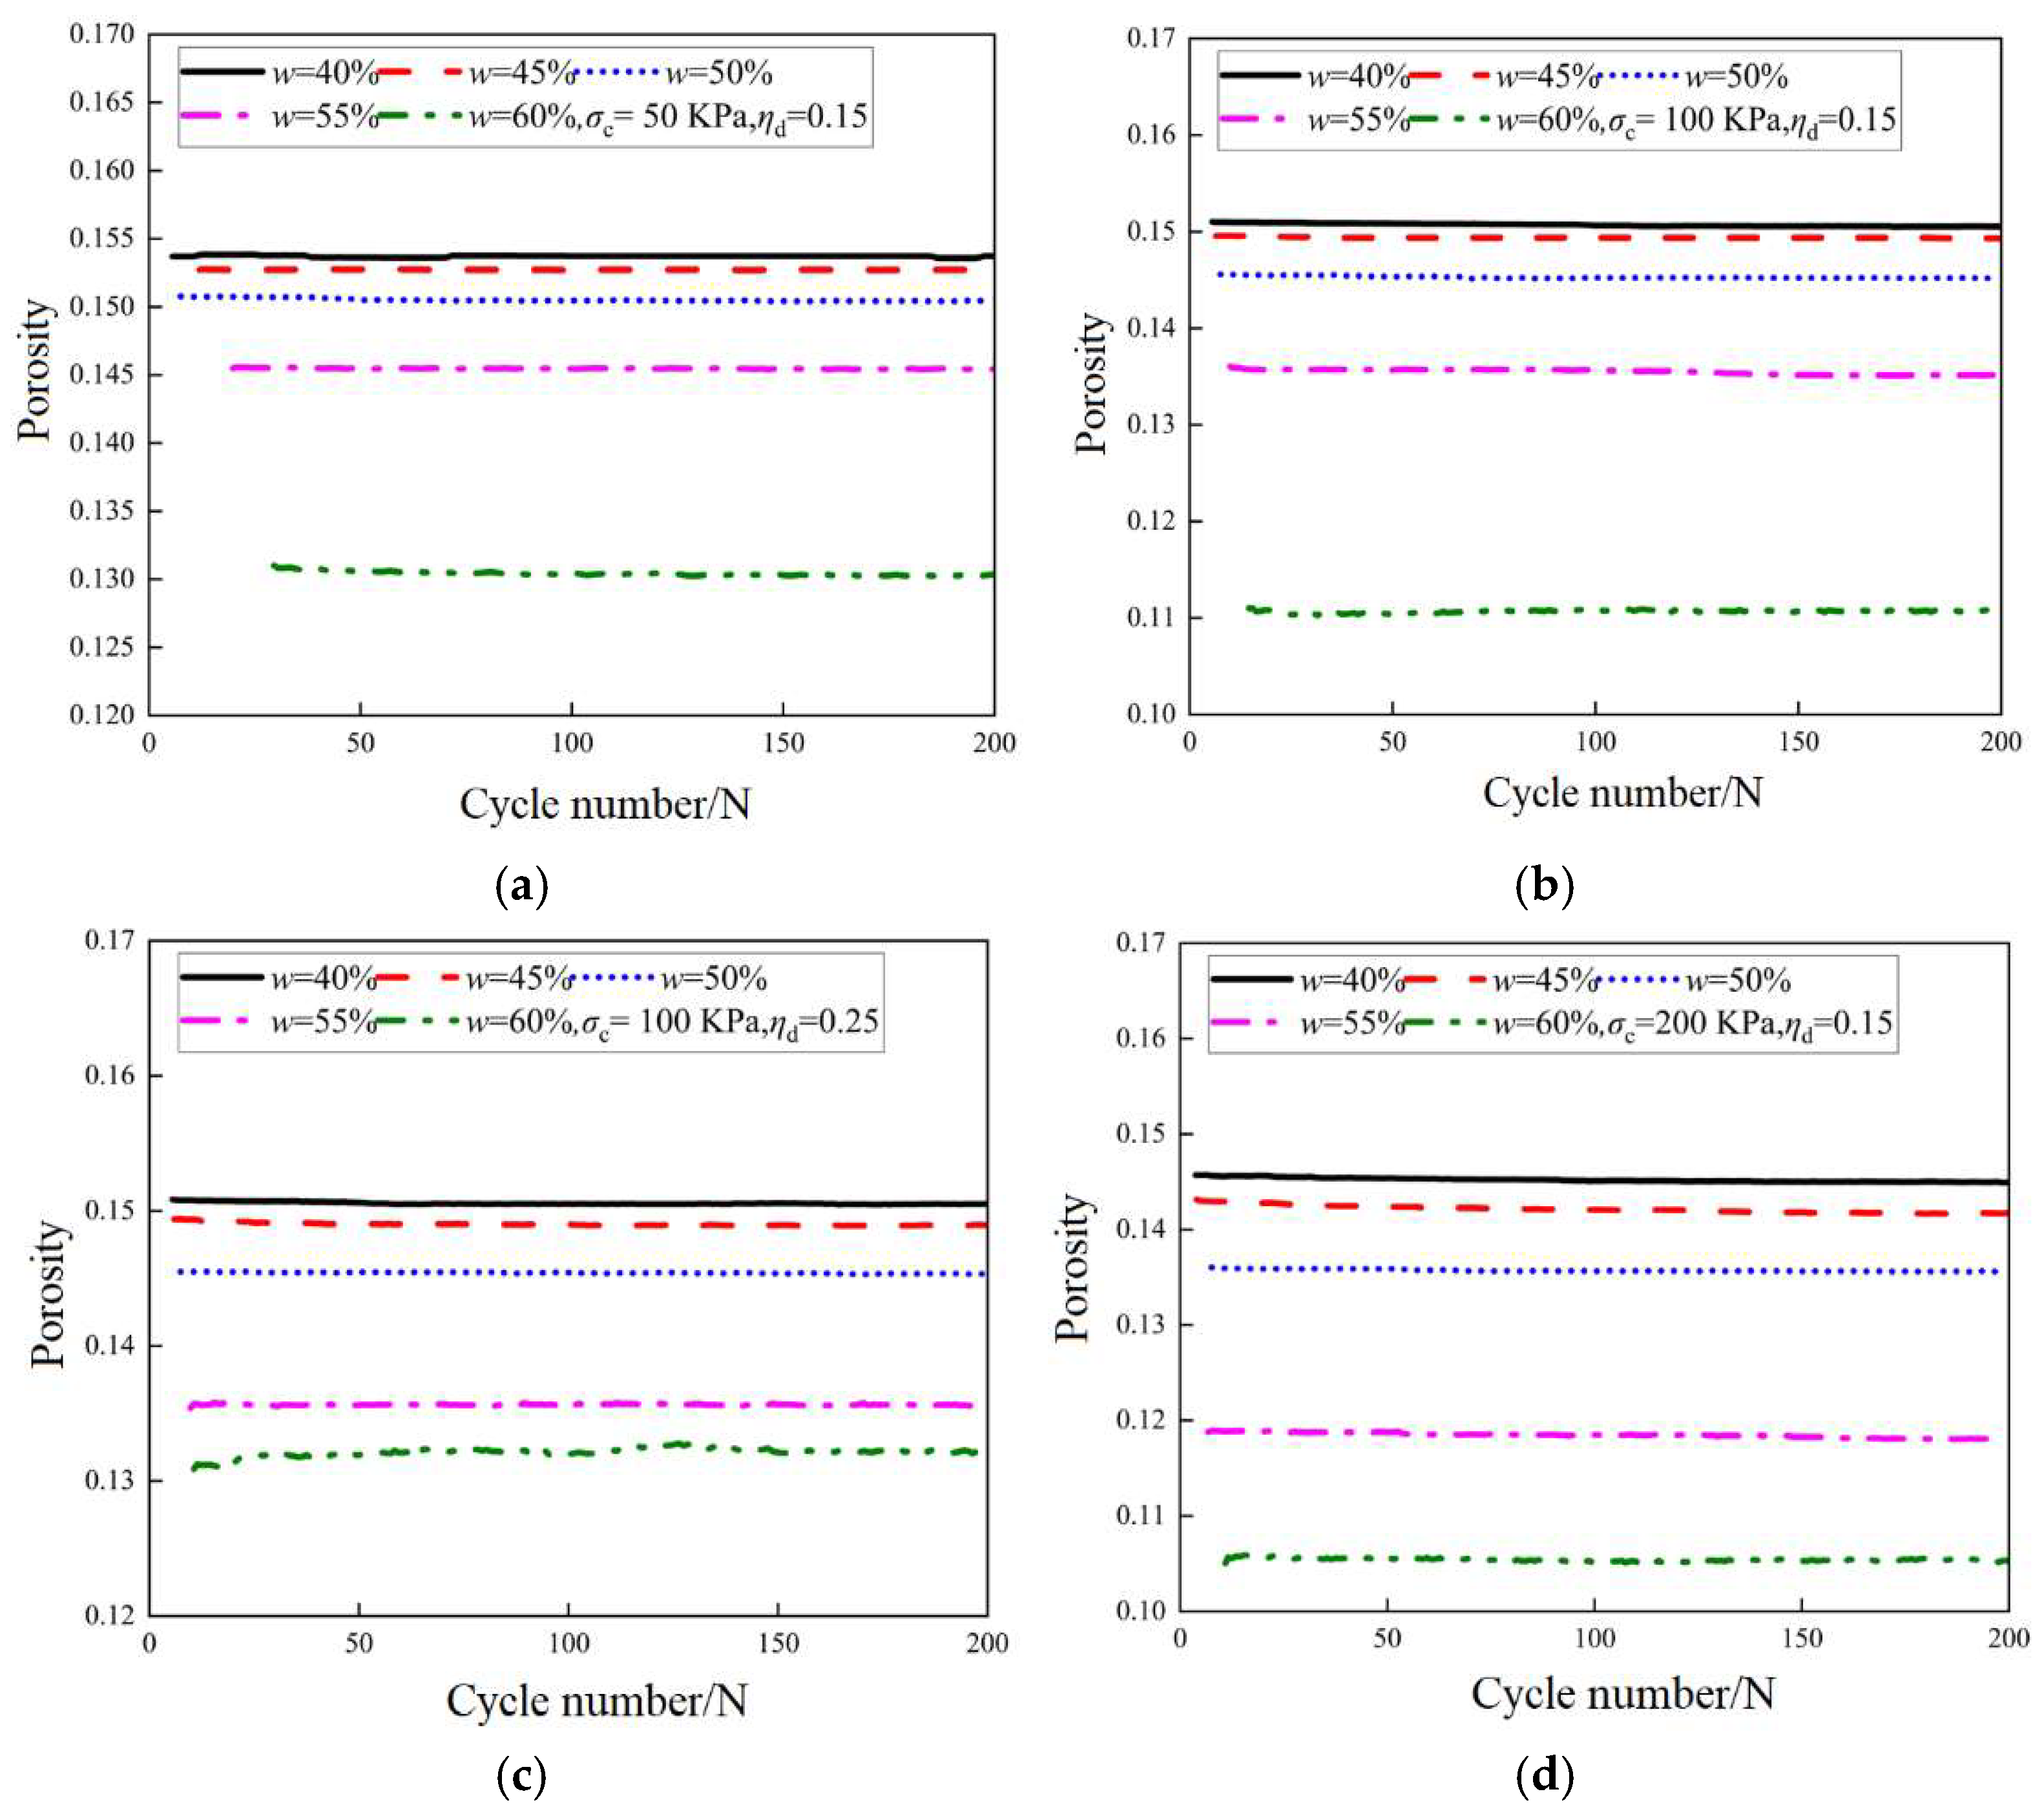
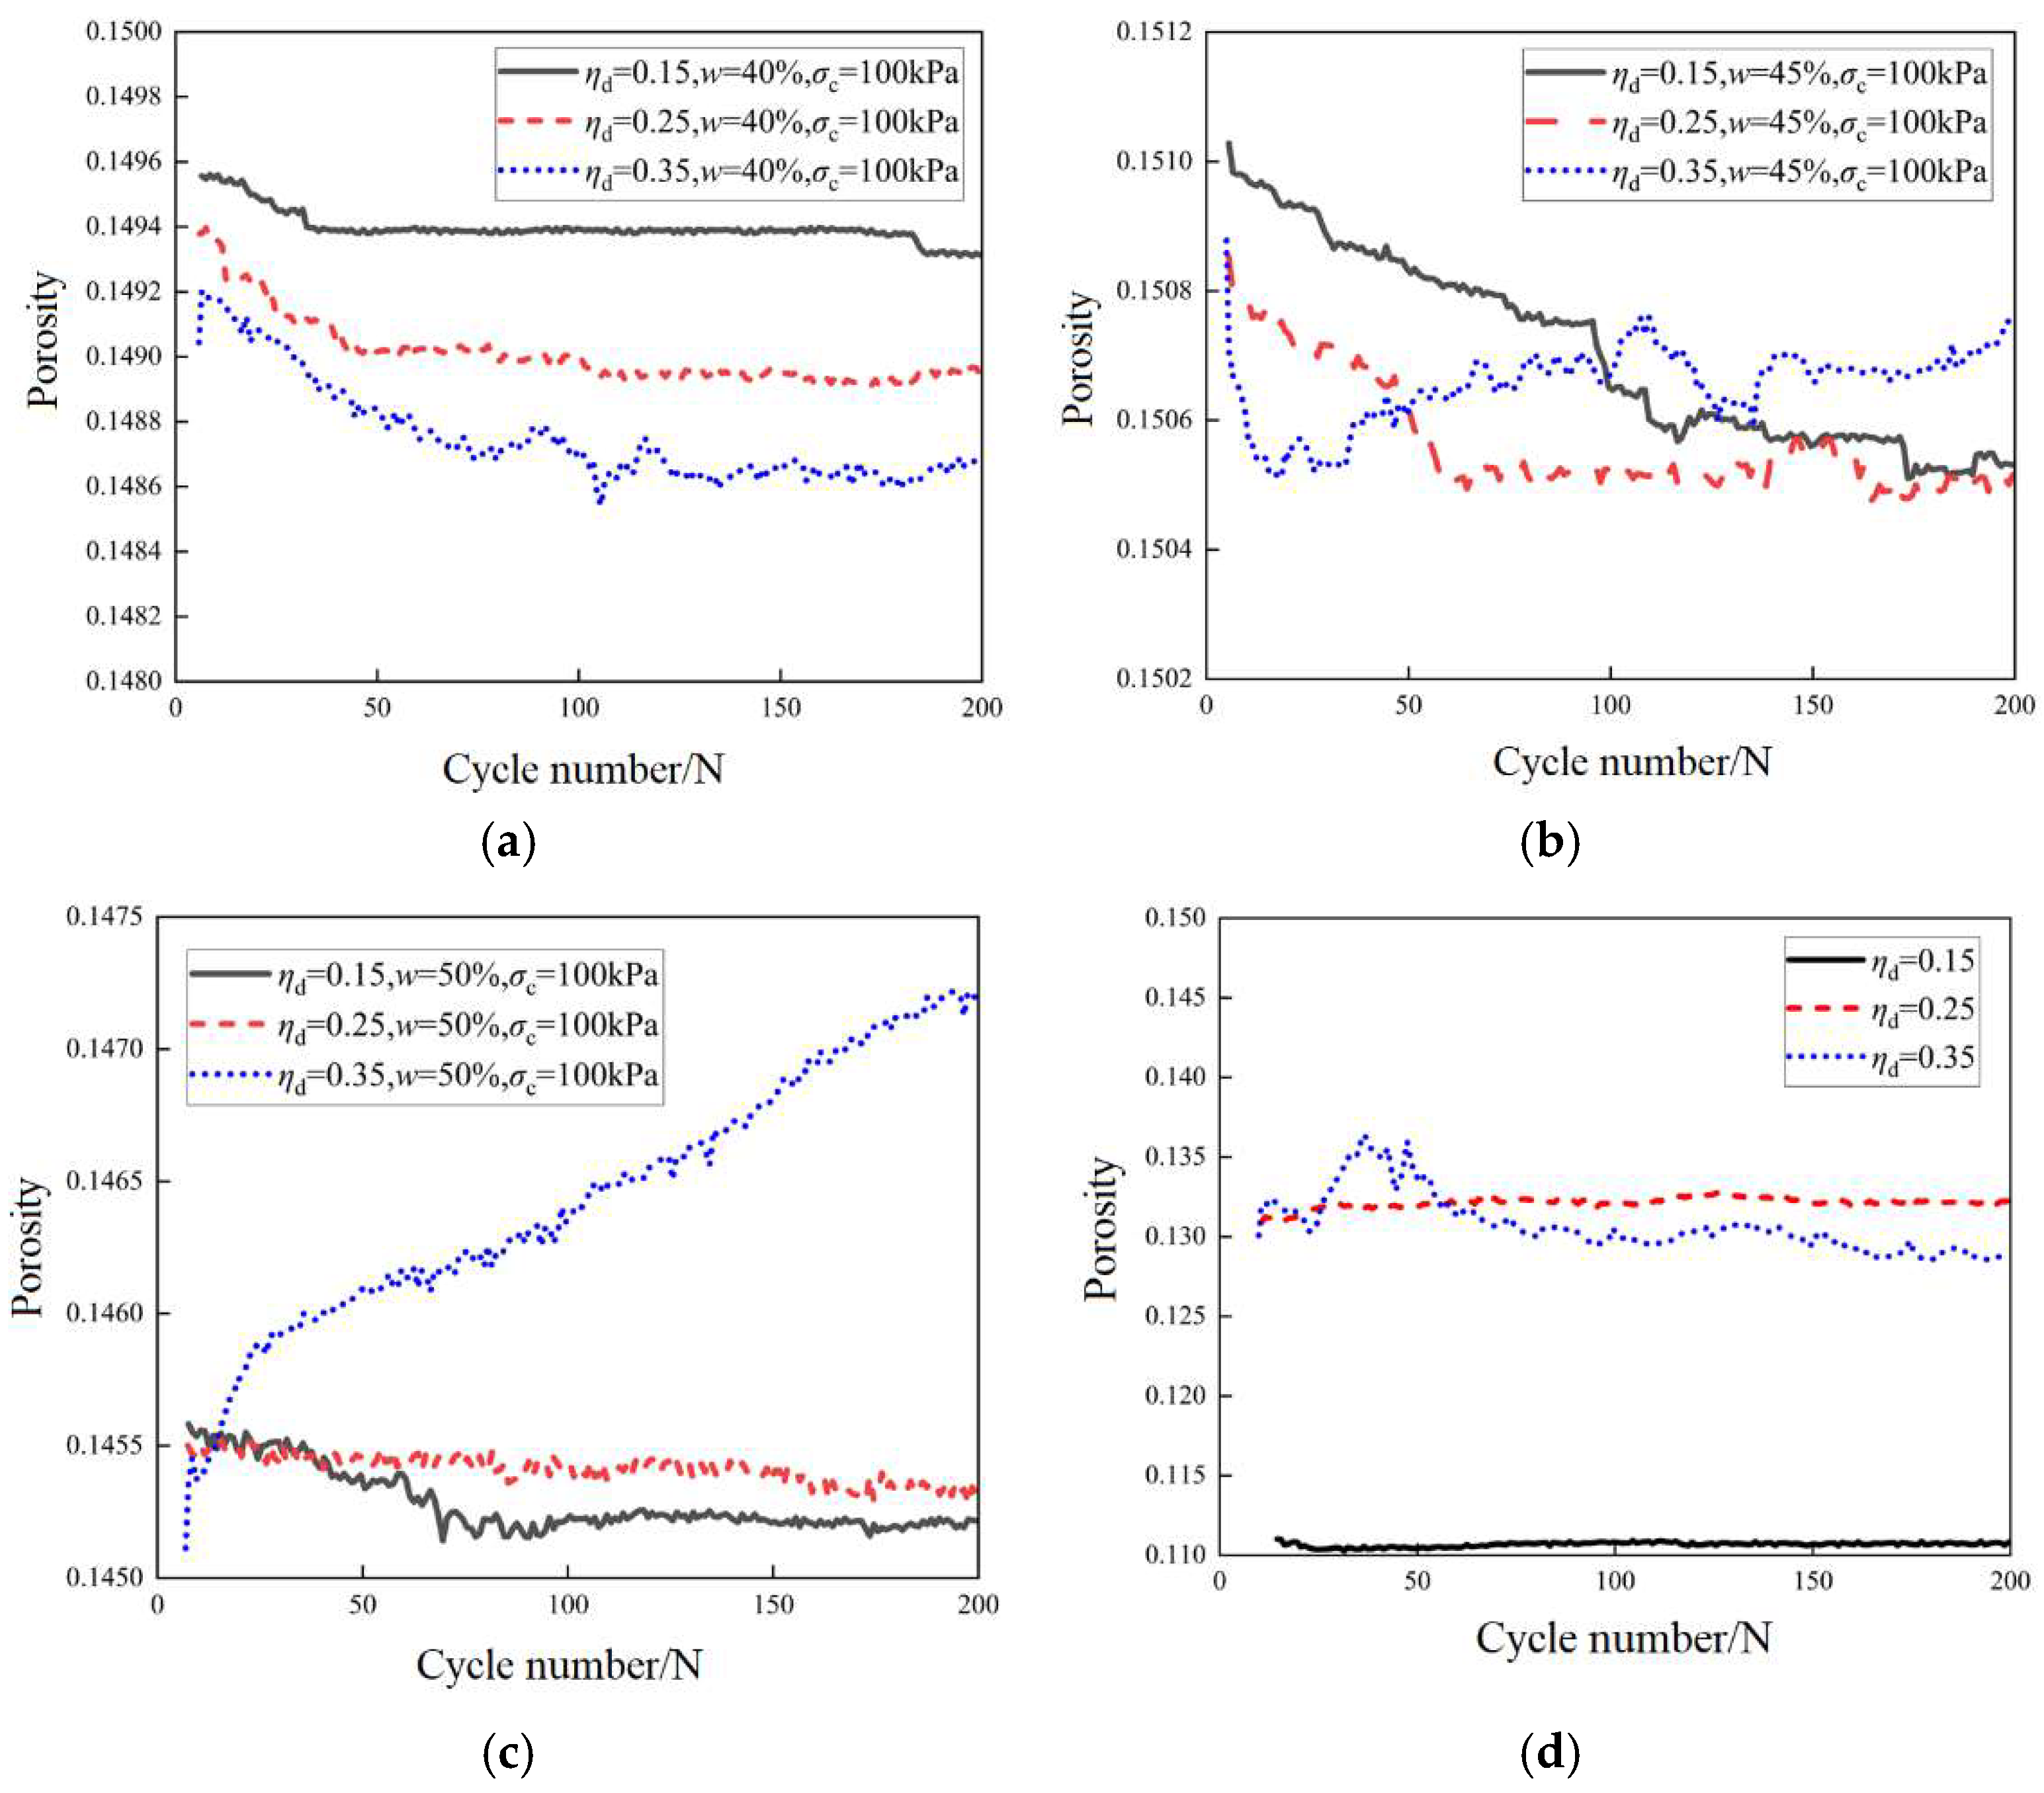
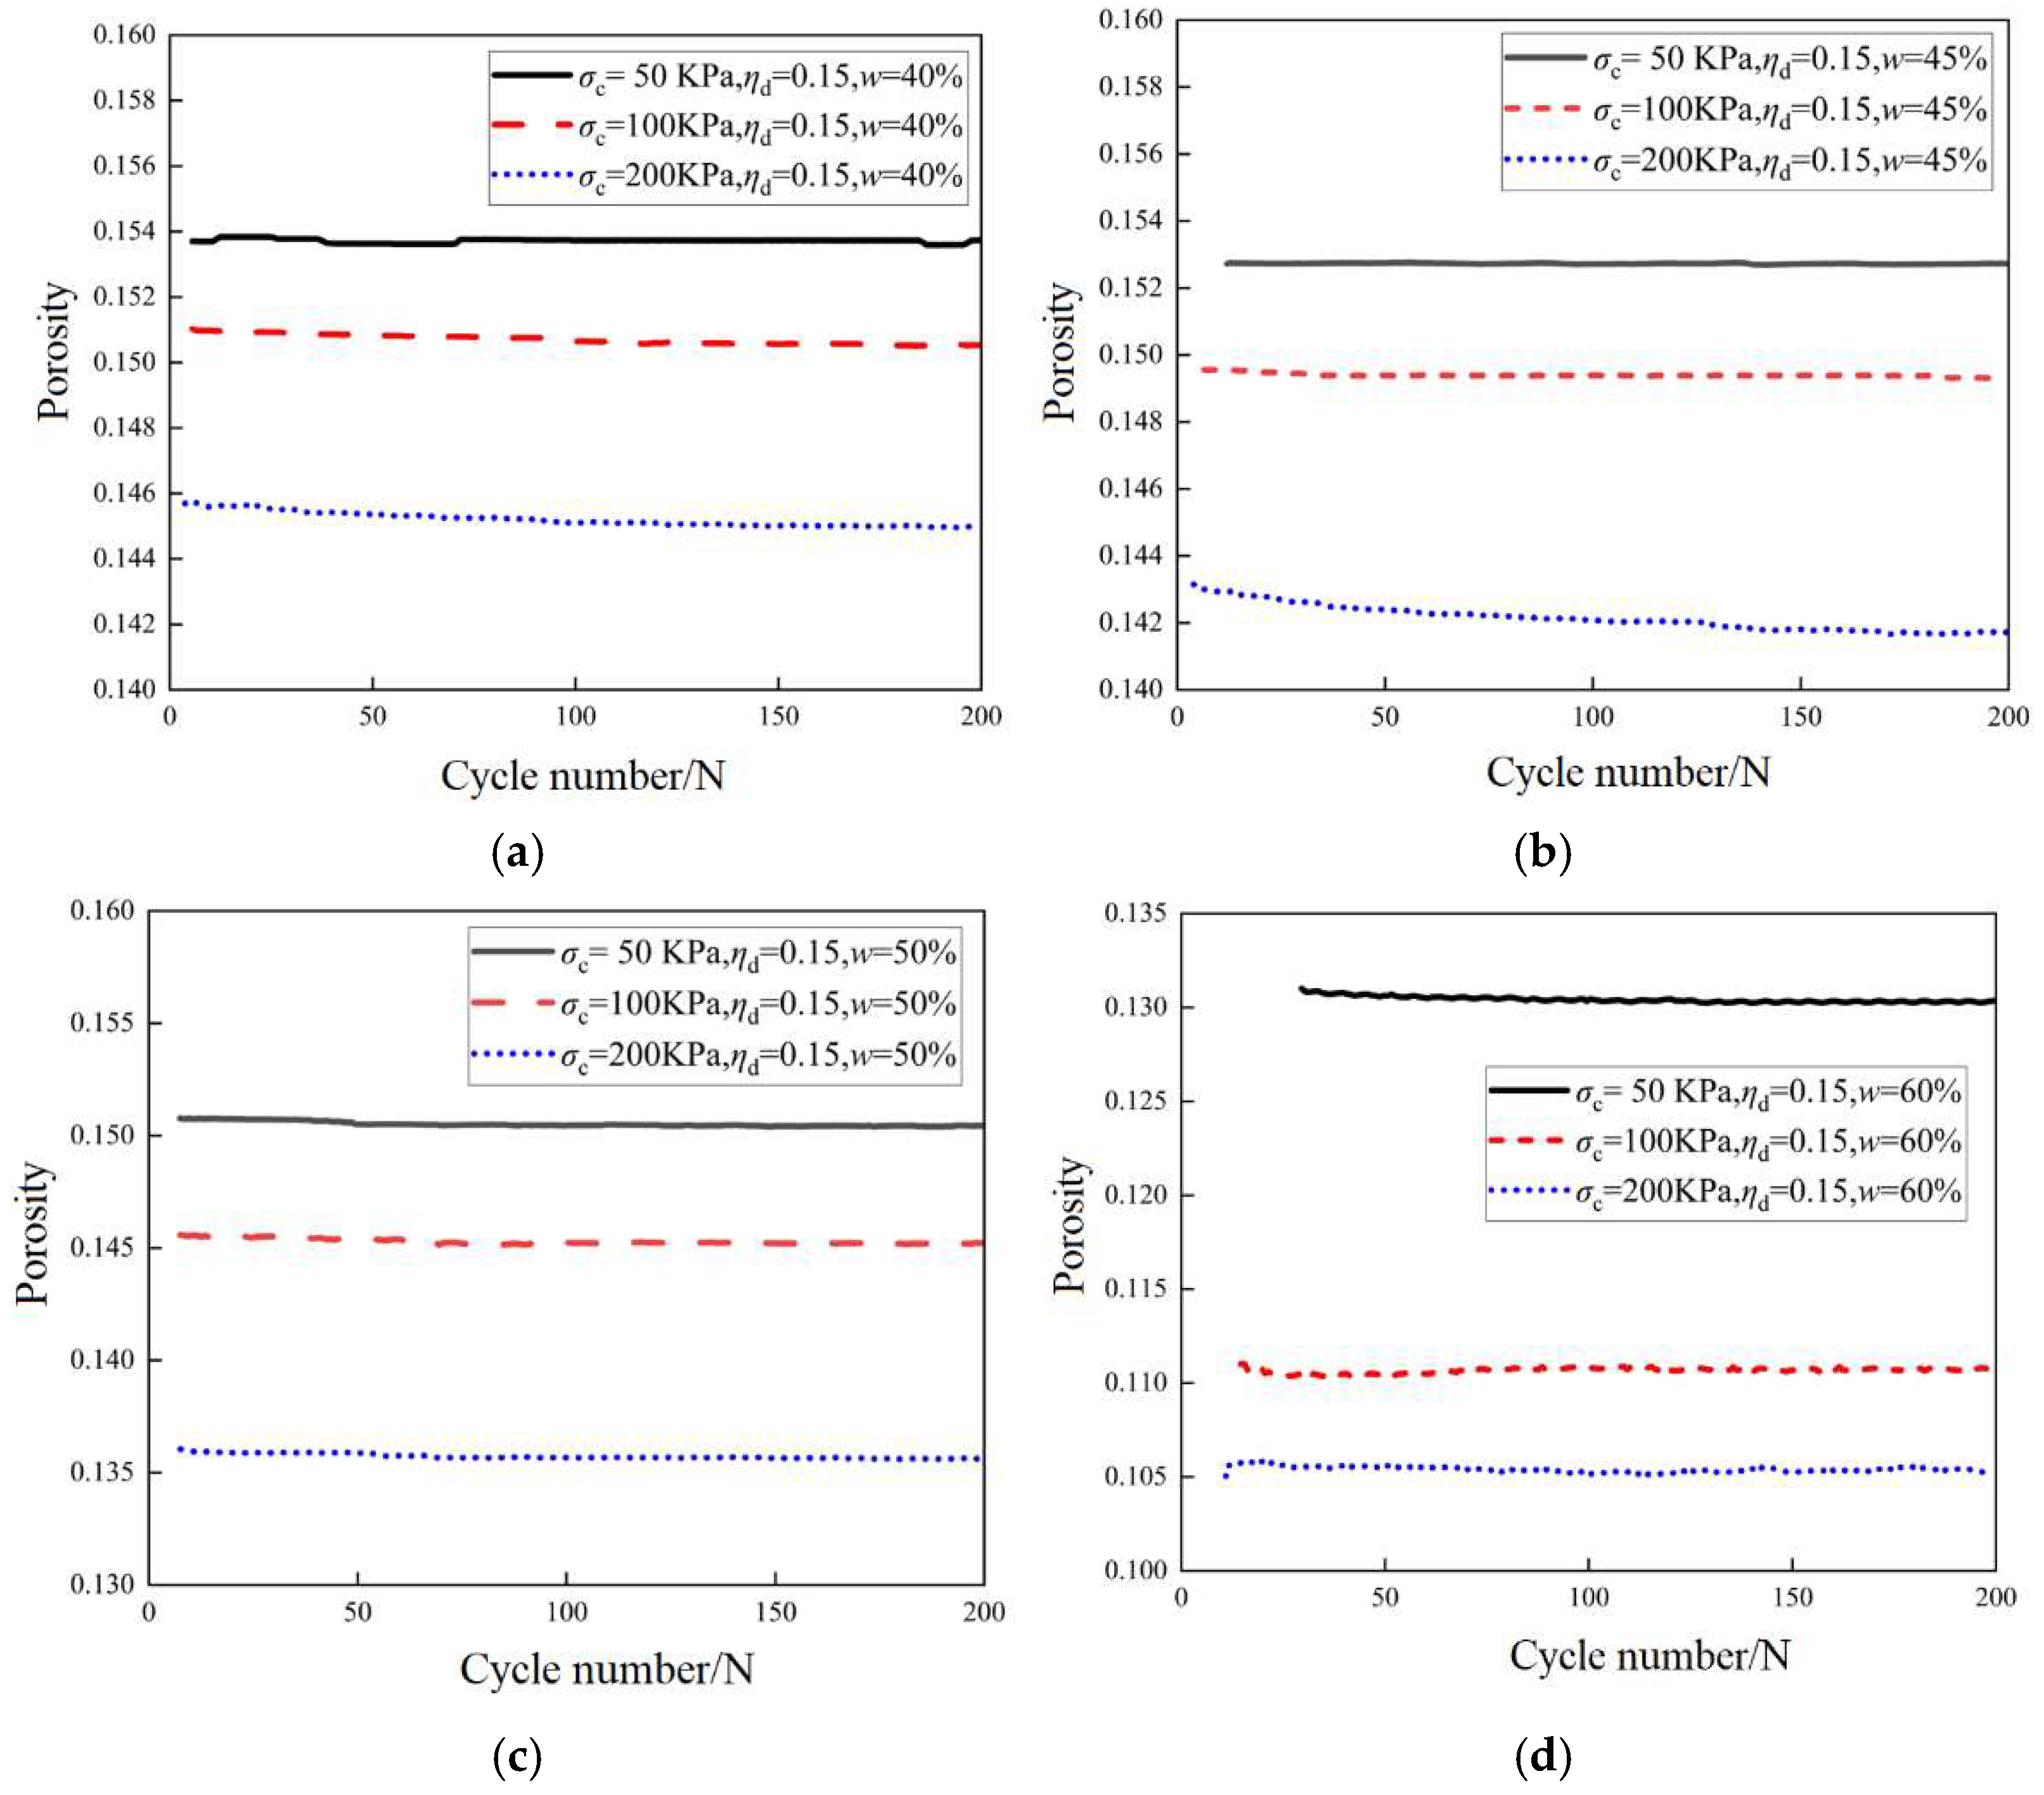
(4)
Porosity and moisture content: At low moisture content, porosity is minimally affected by the dynamic stress ratio, indicating that insufficient moisture prevents substantial changes in particle interactions. As moisture content reaches moderate levels, however, porosity becomes more responsive to changes in dynamic stress ratio, likely due to moisture-induced lubrication that reduces direct particle contact and promotes pore formation. At high moisture content, porosity change becomes more pronounced, especially with increasing dynamic stress ratio. This is due to increased lubrication between particles, which reduces friction and expands pore spaces. Conversely, higher confining pressure typically reduces porosity by promoting tighter particle packing and reducing pore space.
In practical applications, marine soft soil is subjected to complex environmental conditions and construction-induced disturbances, leading to greater variations in load amplitude, increased surrounding pressures, and other influencing factors. These conditions significantly complicate its mechanical behavior under dynamic loading, making the stress–strain state more prone to instability and failure. While this study simplifies external loading conditions to examine the mechanical characteristics of marine soft soil under cyclic loading, the findings effectively capture the soil’s mechanical response and particle transport mechanisms under dynamic conditions. These results provide valuable theoretical parameters and practical insights for the design and construction of engineering projects involving marine soft soil.

Author Contributions

Conceptualization, investigation, resources, K.W.; methodology, writing—original draft preparation, Y.L.; software, writing—review and editing, W.X.; validation, formal analysis, data curation, H.Z.; writing—review and editing, Y.S. All authors have read and agreed to the published version of the manuscript.

Funding

This work was supported by National Natural Science Foundation of China (52179106).

Institutional Review Board Statement

Not applicable.

Informed Consent Statement

Informed consent was obtained from all subjects involved in the study.

Data Availability Statement

The data presented in this study are available on request from the corresponding author.

Conflicts of Interest

The authors declare no conflict of interest.

References

  1. Kim, A.R.; Chang, I.; Cho, G.C.; Shim, S.H. Strength and Dynamic Properties of Cement-Mixed Korean Marine Clays. KSCE J. Civ. Eng. 2018, 22, 1150–1161. [Google Scholar] [CrossRef]
  2. Huancollo, H.J.M.; Saboya, F.; Tibana, S.; McCartney, J.S.; Borges, R.G. Thermal Triaxial Tests to Evaluate Improvement of Soft Marine Clay through Thermal Consolidation. Geotech. Test. J. 2023, 46, 579–597. [Google Scholar] [CrossRef]
  3. Emmanuel, E.; Anggraini, V.; Raghunandan, M.E.; Asadi, A.; Bouazza, A. Improving the engineering properties of a soft marine clay with forsteritic olivine. Eur. J. Environ. Civ. Eng. 2019, 26, 519–546. [Google Scholar] [CrossRef]
  4. Nguyen, T.N.; Nguyen, T.D.; Bui, T.S. Geotechnical Properties of Soft Marine Soil at Chan May Port, Vietnam. Inz. Miner.-J. Pol. Miner. Eng. Soc. 2021, 2, 207–215. [Google Scholar] [CrossRef]
  5. Wu, K.; Xu, W.; Liu, Y.; Liu, D.; Dou, Z.; Liu, Z.; Chen, R.; Hao, D. Mechanical properties of marine soft soil and its influence on urban underground track transport engineering. J. Water Resour. Archit. Eng. 2024, 22, 122–131. [Google Scholar]
  6. Viens, L.; Bonilla, L.F.; Spica, Z.J.; Nishida, K.; Yamada, T.; Shinohara, M. Nonlinear earthquake response of marine sediments with distributed acoustic sensing. Geophys. Res. Lett. 2022, 49, e2022GL100122. [Google Scholar] [CrossRef]
  7. Lu, Y.; Fu, W.; Xue, D. Deformation Characteristics of Soft Marine Soil Tested under Cyclic Loading with Low Frequency. Adv. Civ. Eng. 2020, 2020, 8875315. [Google Scholar] [CrossRef]
  8. Qiao, F.; Bo, J.S.; Qi, W.H.; Wang, L.; Chang, C.Y.; Zhang, Z.P.; Wang, J. Study on the dynamic characteristics of soft soil. RSC Adv. 2020, 10, 4630–4639. [Google Scholar] [CrossRef] [PubMed]
  9. Ding, Z.; Kong, B.W.; Wei, X.J.; Zhang, M.Y.; Xu, B.L.; Zhao, F.J. Laboratory Testing to Research the Micro-Structure and Dynamic Characteristics of Frozen-Thawed Marine Soft Soil. J. Mar. Sci. Eng. 2019, 7, 85. [Google Scholar] [CrossRef]
  10. Cai, H.; Zhang, Q.; Ye, G.L. Numerical simulation on undrained cylic triaxial test of soft marine clay considering end restrictions of soil specimen. Ocean Eng. 2021, 216, 108100. [Google Scholar] [CrossRef]
  11. Tong, J.H.; Wang, Q.; Zhang, W.K.; Guo, L.; Ni, D.Y.; Zhai, J.L.; Yuan, D.Y.; Wang, H.Z. Post-cyclic undrained behavior of marine soft clay subjected to partially drained cyclic loading. Mar. Georesources Geotechnol. 2023, 42, 898–911. [Google Scholar] [CrossRef]
  12. Wang, Y.; Qi, Z.; Wei, T.Z.; Bao, J.J.; Zhang, X.; Zhou, Y.S. Numerical Study on the Responses of Suction Pile Foundations under Horizontal Cyclic Loading Considering the Soil Stiffness Degradation. J. Mar. Sci. Eng. 2023, 11, 2336. [Google Scholar] [CrossRef]
  13. Yang, J.Q.; Cui, Z.D.; Xi, B.L.; Song, W.L. Experimental study on cyclic triaxial behaviors of saturated soft soil considering time intermittent and variable confining pressure. Soil Dyn. Earthq. Eng. 2024, 179, 108508. [Google Scholar] [CrossRef]
  14. Zhou, J.; Liu, C.J.; Zhu, K.F.; Shen, P.P. Macroscopic behaviour and mesoscopic mechanism of shear strength characteristics of pile-soil interface under cyclic loading. Ocean Eng. 2024, 297, 116998. [Google Scholar] [CrossRef]
  15. Zhao, L.Y.; Shan, Z.G.; Wang, M.Y.; Ni, W.D.; Jin, H.X.; Shi, L. Undrained deformation behavior of marine clay under two-way cyclic loading. Mar. Georesources Geotechnol. 2023, 42, 465–474. [Google Scholar] [CrossRef]
  16. Wang, X.Y.; Sun, H.; Niu, F.J. Microstructure study of natural marine clay in loading and unloading processes. Eng. Geol. 2023, 327, 107363. [Google Scholar] [CrossRef]
  17. Li, F.; Zhang, K.Y.; Luo, X.J. Micro-study of soil’s inherent anisotropy with PFC simulation. Appl. Mech. Mater. 2013, 275–277, 383–386. [Google Scholar]
  18. Cao, B. Sensitivity analysis of loess triaxial mesoscopic parameters based on PFC3D. In Proceedings of the 6th International Conference on Energy Science and Chemical Engineering, Dali, China, 17–19 July 2020; Volume 565, p. 012070. [Google Scholar]
  19. Lin, C.-X.; Ling, D.-S.; Zhong, S.-Y. Application of particle flow code numerical simulation in research of geotechnical behavior of lunar soil. J. Zhejiang Univ. (Eng. Sci.) 2015, 49, 1679–1691. [Google Scholar]
  20. GB/T50123-2019; Standard for Geotechnical Testing Method. National Standard of the People’s Republic of China: Beijing, China, 2019.
  21. ASTM D7181-11; Method for Consolidated Drained Triaxial Compression Test for Soils. American Society for Testing and Materials: Conshohocken, PA, USA, 2011.
  22. Xiao, W.; Wu, K.; Xu, W.; Liu, Y.; Lu, H.; Chen, R. Experiment and analysis on dynamic characteristics of marine soft clay. Mar. Georesources Geotechnol. 2024, 5, 1–22. [Google Scholar] [CrossRef]
  23. Ni, X.; Yin, X.; Cai, Z. Study on the meso-mechanism of consolidation of soft soil based on PFC-COMSOL. J. Hebei Univ. Eng. (Nat. Sci. Ed.) 2017, 34, 30–36. [Google Scholar]
  24. Ji, S.T.; Karlovsek, J. Optimized differential evolution algorithm for solving DEM material calibration problem. Eng. Comput. 2023, 39, 2001–2016. [Google Scholar] [CrossRef]
  25. Geng, X. Analysis of Microscopic Damage Mechanism of Marine Silt Cement-solidified Soil Based on PFC3D. Master’s Thesis, Wuhan University of Engineering, Wuhan, China, 2022. [Google Scholar]
  26. Tang, Y.; Chen, H.J.; Xiong, L.X.; Xu, Z.Y. Conventional triaxial loading and unloading test and PFC numerical simulation of rock with single fracture. Arch. Civ. Eng. 2024, 70, 233–254. [Google Scholar] [CrossRef]
Figure 1. Triaxial apparatus.
Jmse 12 02307 g001
Figure 2. Numerical simulation model sample.
Jmse 12 02307 g002
Figure 3. The curve between strain and number of cycles obtained from triaxial specimen and discrete element analysis. (a) Test results. (b) Discrete element analysis results.
Jmse 12 02307 g003
Figure 4. Stress–strain curves of the first 10 cycles under different moisture content conditions. (a) σc = 50 kPa, ηd = 0.15. (b) σc = 100 kPa, ηd = 0.15. (c) σc = 100 kPa, ηd = 0.25. (d) σc = 200 kPa, ηd = 0.15.
Jmse 12 02307 g004
Figure 5. Stress–strain curves of the first 10 cycles under different dynamic stress ratios. (a) σc = 50 kPa, w = 40%. (b) σc = 100 kPa, w = 45%. (c) σc = 100 kPa, w = 50%. (d) σc = 200 kPa, w = 60%.
Jmse 12 02307 g005
Figure 6. Stress–strain curves of the first 10 cycles under different confining pressures. (a) w = 40%, ηd = 0.15. (b) w = 45%, ηd = 0.15. (c) w = 50%, ηd = 0.25. (d) w = 45%, ηd = 0.15.
Jmse 12 02307 g006
Figure 7. Schematic diagram of energy dissipation in marine soft soil under a dynamic stress ratio of 0.15.
Jmse 12 02307 g007
Figure 8. Schematic diagram of energy dissipation in marine soft soil at 100 kPa perimeter pressure condition.
Jmse 12 02307 g008
Figure 9. Particle displacement distribution of samples with a moisture content of 40.
Jmse 12 02307 g009
Figure 10. Particle displacement distribution of samples with a moisture content of 50.
Jmse 12 02307 g010
Figure 11. Particle displacement distribution of samples with a moisture content of 60.
Jmse 12 02307 g011
Figure 12. Deformation curve of porosity with cycle times under different water content conditions. (a) σc = 50 kPa, ηd = 0.15. (b) σc = 100 kPa, ηd = 0.15. (c) σc = 100 kPa, ηd = 0.25. (d) σc = 200 kPa, ηd = 0.15.
Jmse 12 02307 g012
Figure 13. Deformation curve of porosity with number of cycles under different dynamic stress ratios. (a) w = 40%, σc = 100 kPa. (b) w = 45%, σc = 100 kPa. (c) w = 50%, σc = 100 kPa. (d) w = 60%, σc = 100 kPa.
Jmse 12 02307 g013
Figure 14. Deformation curve of porosity with number of cycles. (a) w = 40%, ηd = 0.15. (b) w = 45%, ηd = 0.15. (c) w = 50%, ηd = 0.15. (d) w = 60%, ηd = 0.15.
Jmse 12 02307 g014
Table 1. Basic Physical and Mechanical Indicators of Soil.
Liquid Limit (%)Plastic Limit (%)Plasticity Index (%)Specific Gravity (kg/m3)Particle Composition (%)
Sand Grains (0.02–2 mm)Powder Grain (0.002–0.02 mm)Clay Grain (<0.002 mm)
63.6237.3726.251.6918.8%58.5%22.7%
Table 2. Experimental plan and control parameters.
Specimen NumberWater Content (%)Surrounding Pressure (kPa)Deviator Stress (kPa)Dynamic Stress (kPa)Dynamic Stress Ratio
CT-1405022150.15
CT-210043300.15
CT-310043500.25
CT-410043700.35
CT-520086600.15
CT-6455022150.15
CT-710043300.15
CT-810043500.25
CT-910043700.35
CT-1020086600.15
CT-11505022150.15
CT-1210043300.15
CT-1310043500.25
CT-1410043700.35
CT-1520086600.15
CT-16555022150.15
CT-1710043300.15
CT-1810043500.25
CT-1910043700.35
CT-2020086600.15
CT-21605022150.15
CT-2210043300.15
CT-2310043500.25
CT-2410043700.35
CT-2520086600.15
Table 3. Calibration results of microscopic parameters.
Water ContentCoefficient of FrictionLinear Contact Effective Modulus (MPa)Stiffness RatioNormal Bond Strength (kPa)Tangential Bond Strength (kPa)
40%0.175023030
45%0.154022525
50%0.142022020
55%0.131021010
60%0.118211
Disclaimer/Publisher’s Note: The statements, opinions and data contained in all publications are solely those of the individual author(s) and contributor(s) and not of MDPI and/or the editor(s). MDPI and/or the editor(s) disclaim responsibility for any injury to people or property resulting from any ideas, methods, instructions or products referred to in the content.

