1. Introduction
The ship propulsion system is one of the main sources of ship vibrations [
1]. To avoid resonance phenomena, it is crucial to determine the natural frequencies of the system and its components. Vibrations caused by the shaft line can be transmitted throughout the entire ship’s volume [
2]. Therefore, shaft line angular velocity must significantly differ from the natural frequencies. In addition, mechanical vibrations generate harmful acoustic fields, which is particularly important for warships, where minimizing these vibrations is a priority [
3].
Shaft vibrations can be caused by residual unbalance or misalignment. The unbalance of the shaft lines during rotation is the main cause of vibrations, and the amount of unbalance, which is always non-zero, affects vibration amplitudes. It is worth noting that misalignment may cause the shaft line to operate under unbalanced conditions, even though individual shaft sections have been correctly statically and dynamically balanced before installation [
3,
4]. It is estimated that over 50% of damage to rotating machines, including marine propulsion units, can be attributed to misalignment [
5]. Therefore, an essential issue in the operation of marine propulsion units is the appropriate selection of shaft line alignment monitoring techniques [
6,
7]. It should be emphasized here that damage to shaft line elements involves not only deviation from concentricity but also the cracking of their elements, including bearings [
8,
9]. Readers can find interesting works in this field in publications [
10,
11].
The lack of the required coaxiality often leads to a shift in the center of gravity of the rotating elements relative to the rotation axis, which generates a statically or dynamically unbalanced centrifugal force [
12,
13]. As a result, the pressure force increases in the drive system components, such as bearings, couplings and gear connections, leading to various forms of tribological wear and increased assembly clearances. The diagnostic symptom of this condition is a vibration amplitude increase in the characteristic structural nodes of the mechanical system. In the event of significant shaft misalignment or deflection, vibrations may also occur in the axial direction. Therefore, vibration monitoring and the maintenance of appropriate shaft line alignment parameters are crucial to ensure the safety and efficiency of the ship’s propulsion system [
3,
14].
The operational diagnosis of ship propulsion shafts, based on measurements of mechanical vibrations, involves the analysis of specific physical quantities that characterize the vibrations of selected elements of the drive line. These quantities include vibration displacement, velocity and acceleration. For each of these quantities, it is possible to measure instantaneous, average or peak values.
Measurements of average values, often expressed as the root mean square of vibration velocity, are performed to obtain general information on the amount of useful energy dissipated by the generated vibrations. This type of measurement is beneficial for the immediate assessment of technical suitability, e.g., in bearing assembly. Instantaneous values provide more detailed data, allowing a more precise analysis of dynamic processes in the drive system. Therefore, diagnostics based on vibration measurements is an effective method for the monitoring and maintenance of marine shaft line performance and safety [
15].
Despite years of research in the field of operational diagnostics for shaft alignment deviations, there are still many doubts and uncertainties in this area, as shown by numerous current papers published worldwide [
2,
4,
12,
16]. These studies are concerned with increasingly new signal analysis methods [
16,
17,
18] as well as with identifying diagnostic symptoms in new types of drive systems [
19]. Machine diagnostic methods are increasingly supported by prior modeling, including modeling using finite element methods (FEMs) [
20,
21]. These allow for a rapid and multi-variant analysis of the strength of critical structures such as power transmission systems in critical machines [
22,
23]. Based on the developed models, signals are generated to facilitate the identification of a potentially sensitive parameter, enabling the identification of individual damages. Although the FEM is a particularly valued tool in the design and optimization of powertrain components, often providing meaningful and correct results, it always requires verification. This is due to the relatively easy propagation of vibration signals from other devices around the test object, which are very difficult to model [
21].
As part of the study, a virtual model of the station housed in the laboratory of the Faculty of Maritime Studies in Split was developed using the available documentation. The simulation results were subsequently compared with empirical data obtained through measurements of vibration parameters at the operational station.
2. Object of Research
Reliable propulsion system design and efficient vibration control are essential for the safe navigation of ships at sea. During operation, the ship shaft line is subjected to various types of loading, namely, torque and bending moments, alongside the axial thrust force. Altering shaft balance can increase the load on propulsion system components, bearings in particular, thus significantly impacting the fatigue behavior and lifespan of the shaft line. These factors increase the risk of propulsion system failures, thereby compromising the ship’s overall operational reliability. Consequently, for this research, the decision was made to utilize the available shaft test rig at the Faculty of Maritime Studies, Split, Croatia. For a few years, the so-called TEMPO Lab—the Testing of Engineering Materials and Products Lab of the Faculty of Maritime Studies—has been involved in the design, installation and testing of the bearings and the related components of an instrumented shaft test rig, shown in
Figure 1. The primary task of the test rig is to validate the data obtained in theoretical simulations [
24]. These are relevant in determining the behavior of marine shaft bearings and proving the veracity of analytical or numerical models. In addition, the bearing test rig enables users to create diagrams that can be compared with data obtained by other means.
The instrumented test rig was designed for the conducting of scientific research related to radial and axial plain bearings used in the marine industry. The test rig was developed to allow users to test the load capacity of plain bearings of different sizes, construction shapes and dimensions operating under various load conditions and positions of the shaft journals in relation to the bearing itself [
25]. These bearings should be able to operate under both pure hydrodynamic and mixed (transient) lubrication conditions. The testing process includes the elastic properties of the bearing material, resulting in elastohydrodynamic lubrication conditions.
The test rig also enables the testing of several bearing materials and lubricants with different properties. In addition, the test rig makes it possible to expose the bearings to different operating conditions and to investigate the effects of bearing materials and lubrication systems on the environment.
An essential function of the test rig is the ability to set various geometric deviations of bearings, journals and shafts. This makes the rig a comprehensive tool that enables extensive research and analysis of the performance, durability and environmental impact of bearings used in marine propulsion systems [
26]. The design and construction of the test rig are shown in
Figure 2.
With consideration of the above, it was decided to determine how shaft misalignment affects the change in vibration frequency. The initial phase of the work consisted of analyzing the measurement results and FEM calculations of the shaft line position for a balanced shaft and an unbalanced shaft (offset by 2 and 3 mm). Finally, vibration measurements were carried out for an alignment shaft using a measurement station at the University of Split Maritime Faculty. The radial module was then shifted horizontally, and the effect of the misalignment on the shaft vibration parameters was verified.
3. Measurements
The measurement of vibration parameters was conducted using a combination of measuring devices and a B&K Pulse measurement system. The equipment included four accelerometer sensors and a six-channel measuring cassette (Brüel & Kjær, Nærum, Denmark). The data were recorded with the PULSE Time Data Recorder v.21.0 software, which includes extensions for exporting the recorded data to other programs for further analysis.
The sensors used were of type 4514-B from the DeltaTron family (Brüel & Kjær, Nærum, Denmark). These piezoelectric accelerometers offer a wide frequency range, a low signal-to-noise ratio, and a 1 mV/ ms−2 sensitivity, making them suitable for various environmental conditions. The B version of 4514-type sensors differs from its predecessors, incorporating a Transducer Electronic Data Sheet (TEDS), which contains application-specific information. The transducers have an insulated base and are tightly sealed. Each transducer was individually calibrated using state-of-the-art random Sparse Fast Fourier Transform (SFFT) technology, which enables high-resolution 800-point calibration. This ensured unique transducer characteristics and consistency in vibration measurements. For example, the measurement of sensor sensitivity at 159.2 Hz resulted in a confidence factor of 96.3%. The resonance frequency was 27.9 kHz, while the filter cut-off frequency ranged from 0.15 Hz to 29 kHz, effectively filtering out values outside this range.
The B&K 3050-A-060 (Brüel & Kjær, Nærum, Denmark) measuring cassette of the LAN-XI series is a plug-and-play device featuring a front panel with 6 output channels and an input range from 0 to 51.2 Hz per channel. These channels enable the connection of suitable vibration transducers and have an LED backlight to indicate faulty signal conditioning or channel status. The input signals can be sampled at frequencies of up to 131 kHz. During the measurements, the sampling rate of 32,768 Hz was used, along with a 24-bit analog-to-digital converter for high resolution. The nominal operation covers an input voltage range of 10 V
peak with protection up to 60 V
peak to prevent damage to the module. The accuracy of the transmitted amplitude values for the range from 0 to 160 dB in the 1 kHz band is from ±0.5 to ±1 dB. It can be powered by direct or alternating current, by batteries or via Ethernet (PoE—Power over Ethernet), while its design without a fan ensures silent operation [
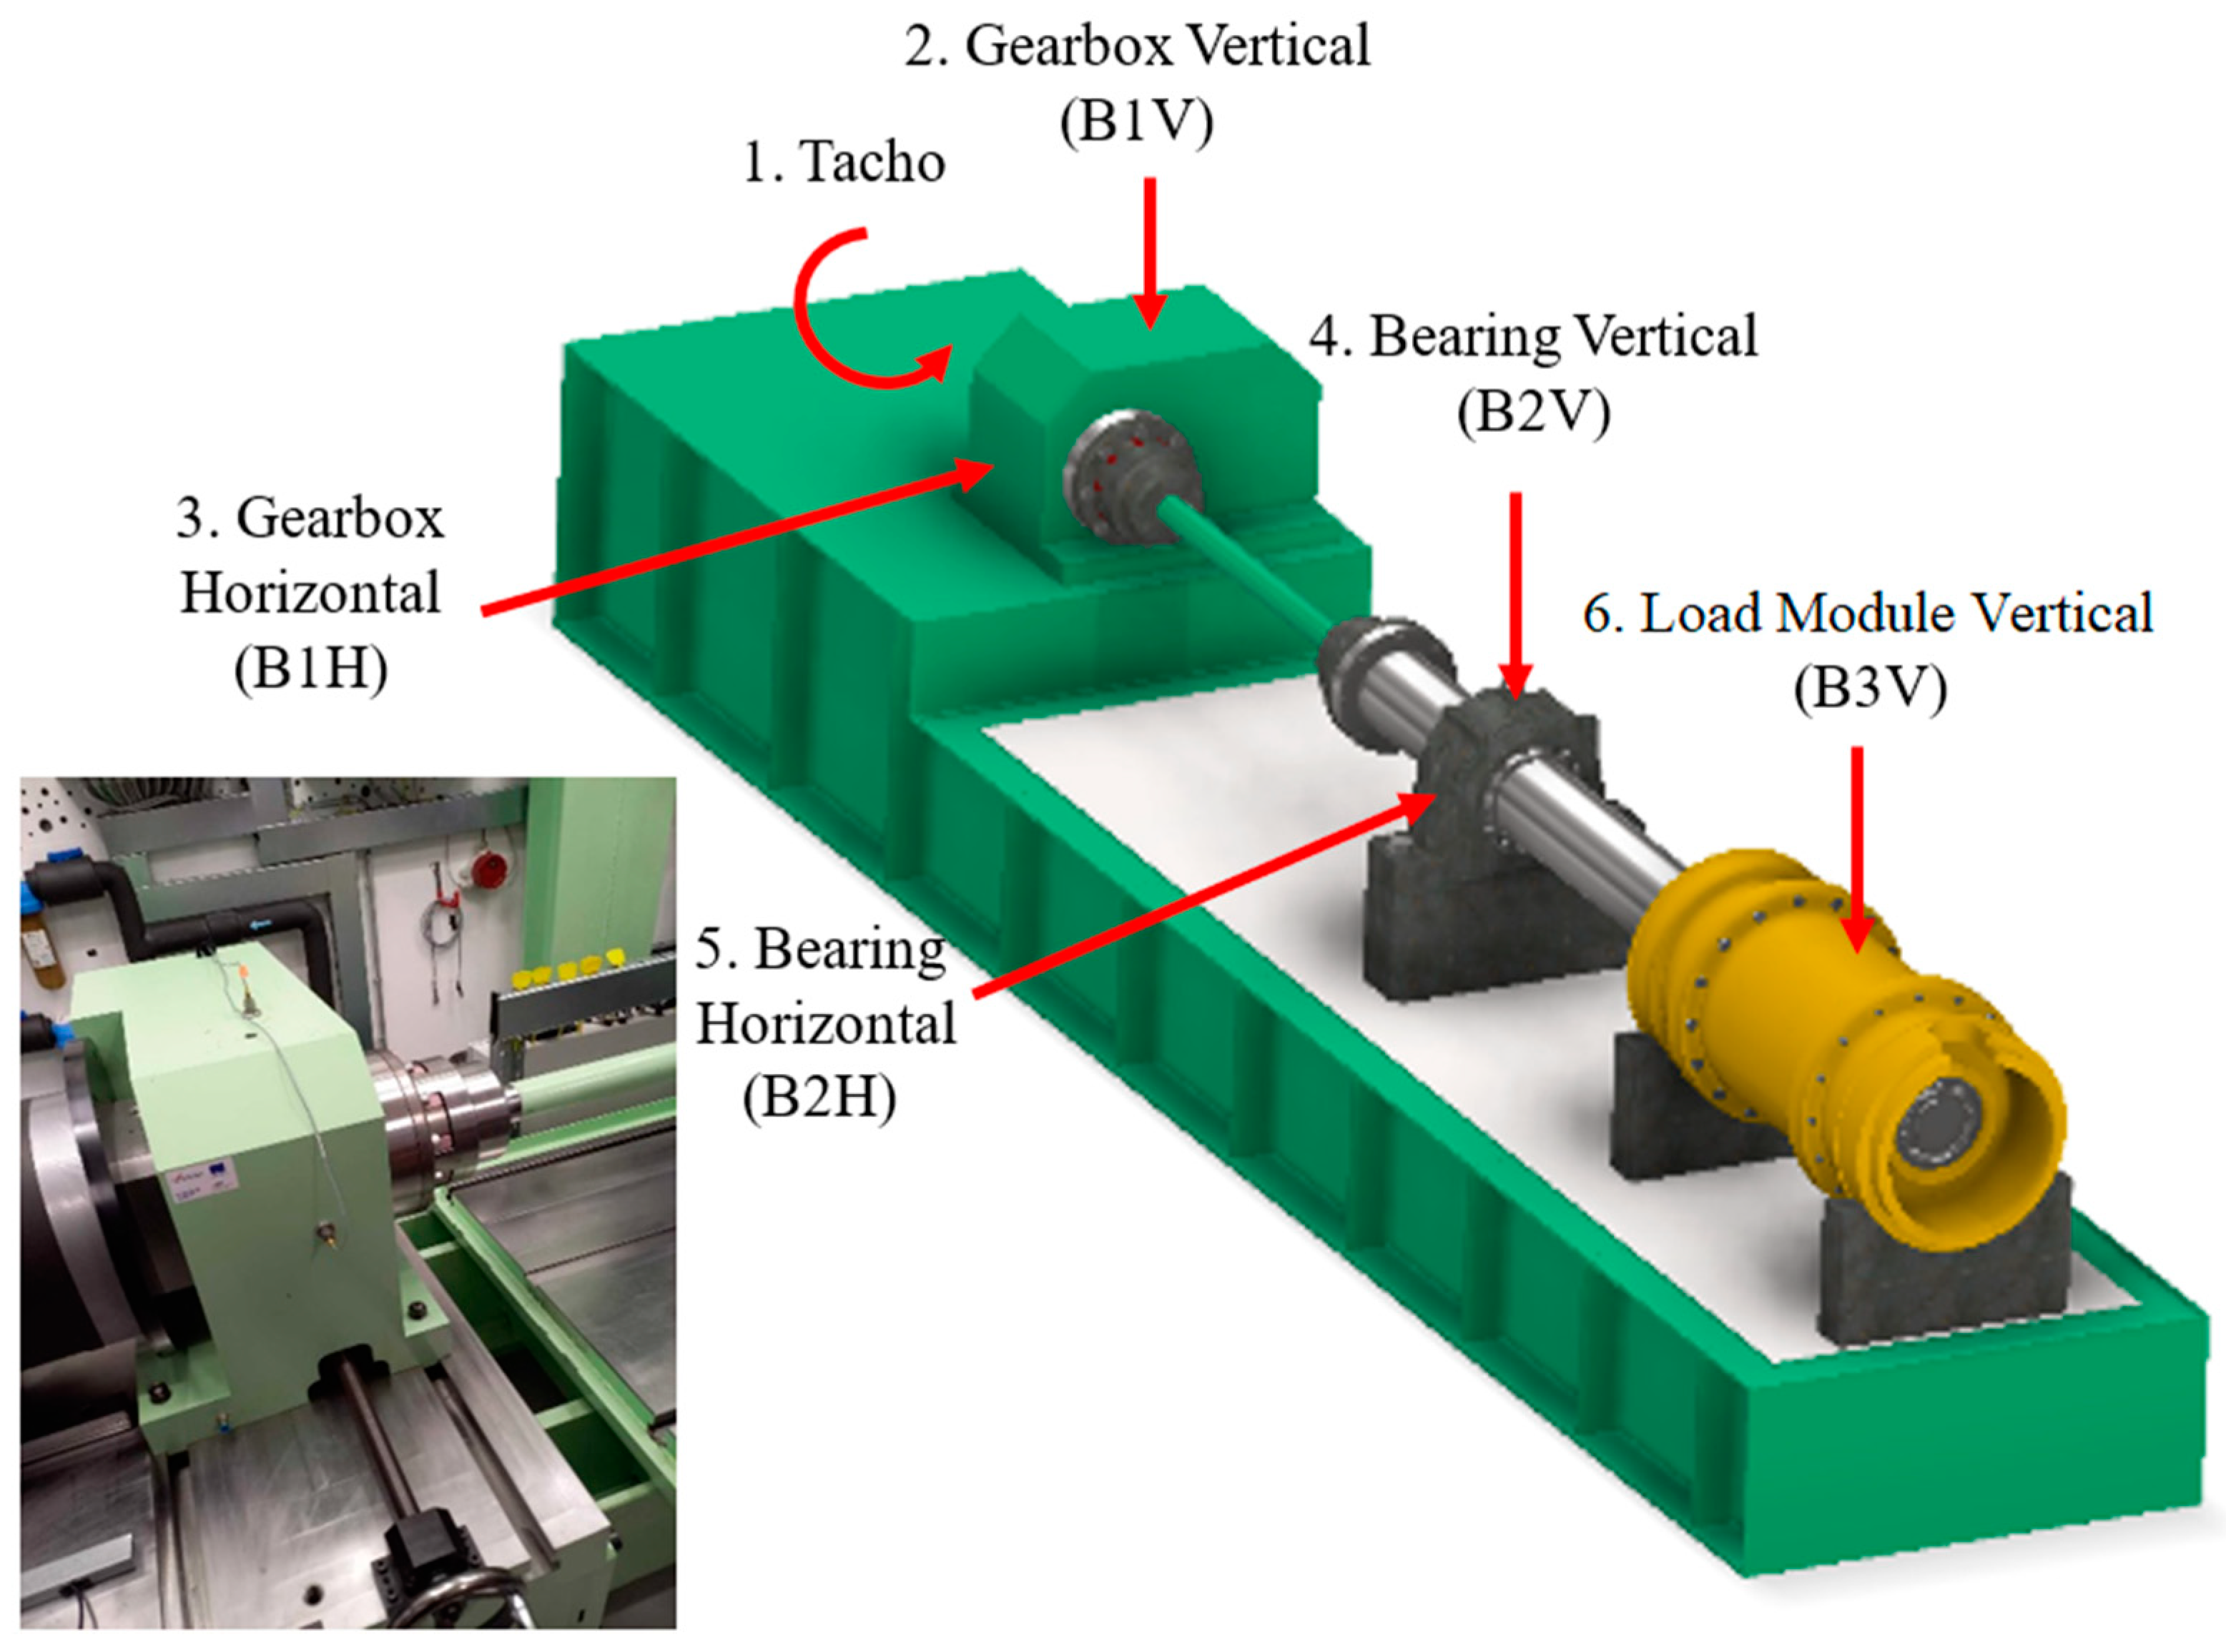
27]. During the measurements, vibration accelerations were simultaneously recorded at five points, as shown in
Figure 3. In addition, the rotational speed of the shaft was also recorded using an optical tachometer, which operated in conjunction with the aforementioned measurement system.
The sensors were mounted with epoxy glue. The tests were performed after the operating parameters of the test rig had stabilized. According to the manufacturer’s specifications, the maximum permissible rotational speed of the test rig under normal operating conditions is 300 rpm when using a 7:1 gearbox ratio. However, due to the deliberate introduction of 2 mm and 3 mm misalignments, the test rig was operated at a reduced speed of no more than 200 rpm to ensure safety. Measurements began with the recording of vibration accelerations from 200 to 0 rpm during test rig runouts. Then, measurements were carried out at constant rotational speeds of the shaft: 120, 140, 160, 180 and 200 rpm. For each of these speeds, measurements were carried out in the following three states of rig alignment:
Correct alignment of shaft line;
Shifting of the B2 bearing by 2 mm in the direction of shaft rotation;
Shifting of the B2 bearing by 3 mm in the direction of shaft rotation.
4. Analysis of Research Results
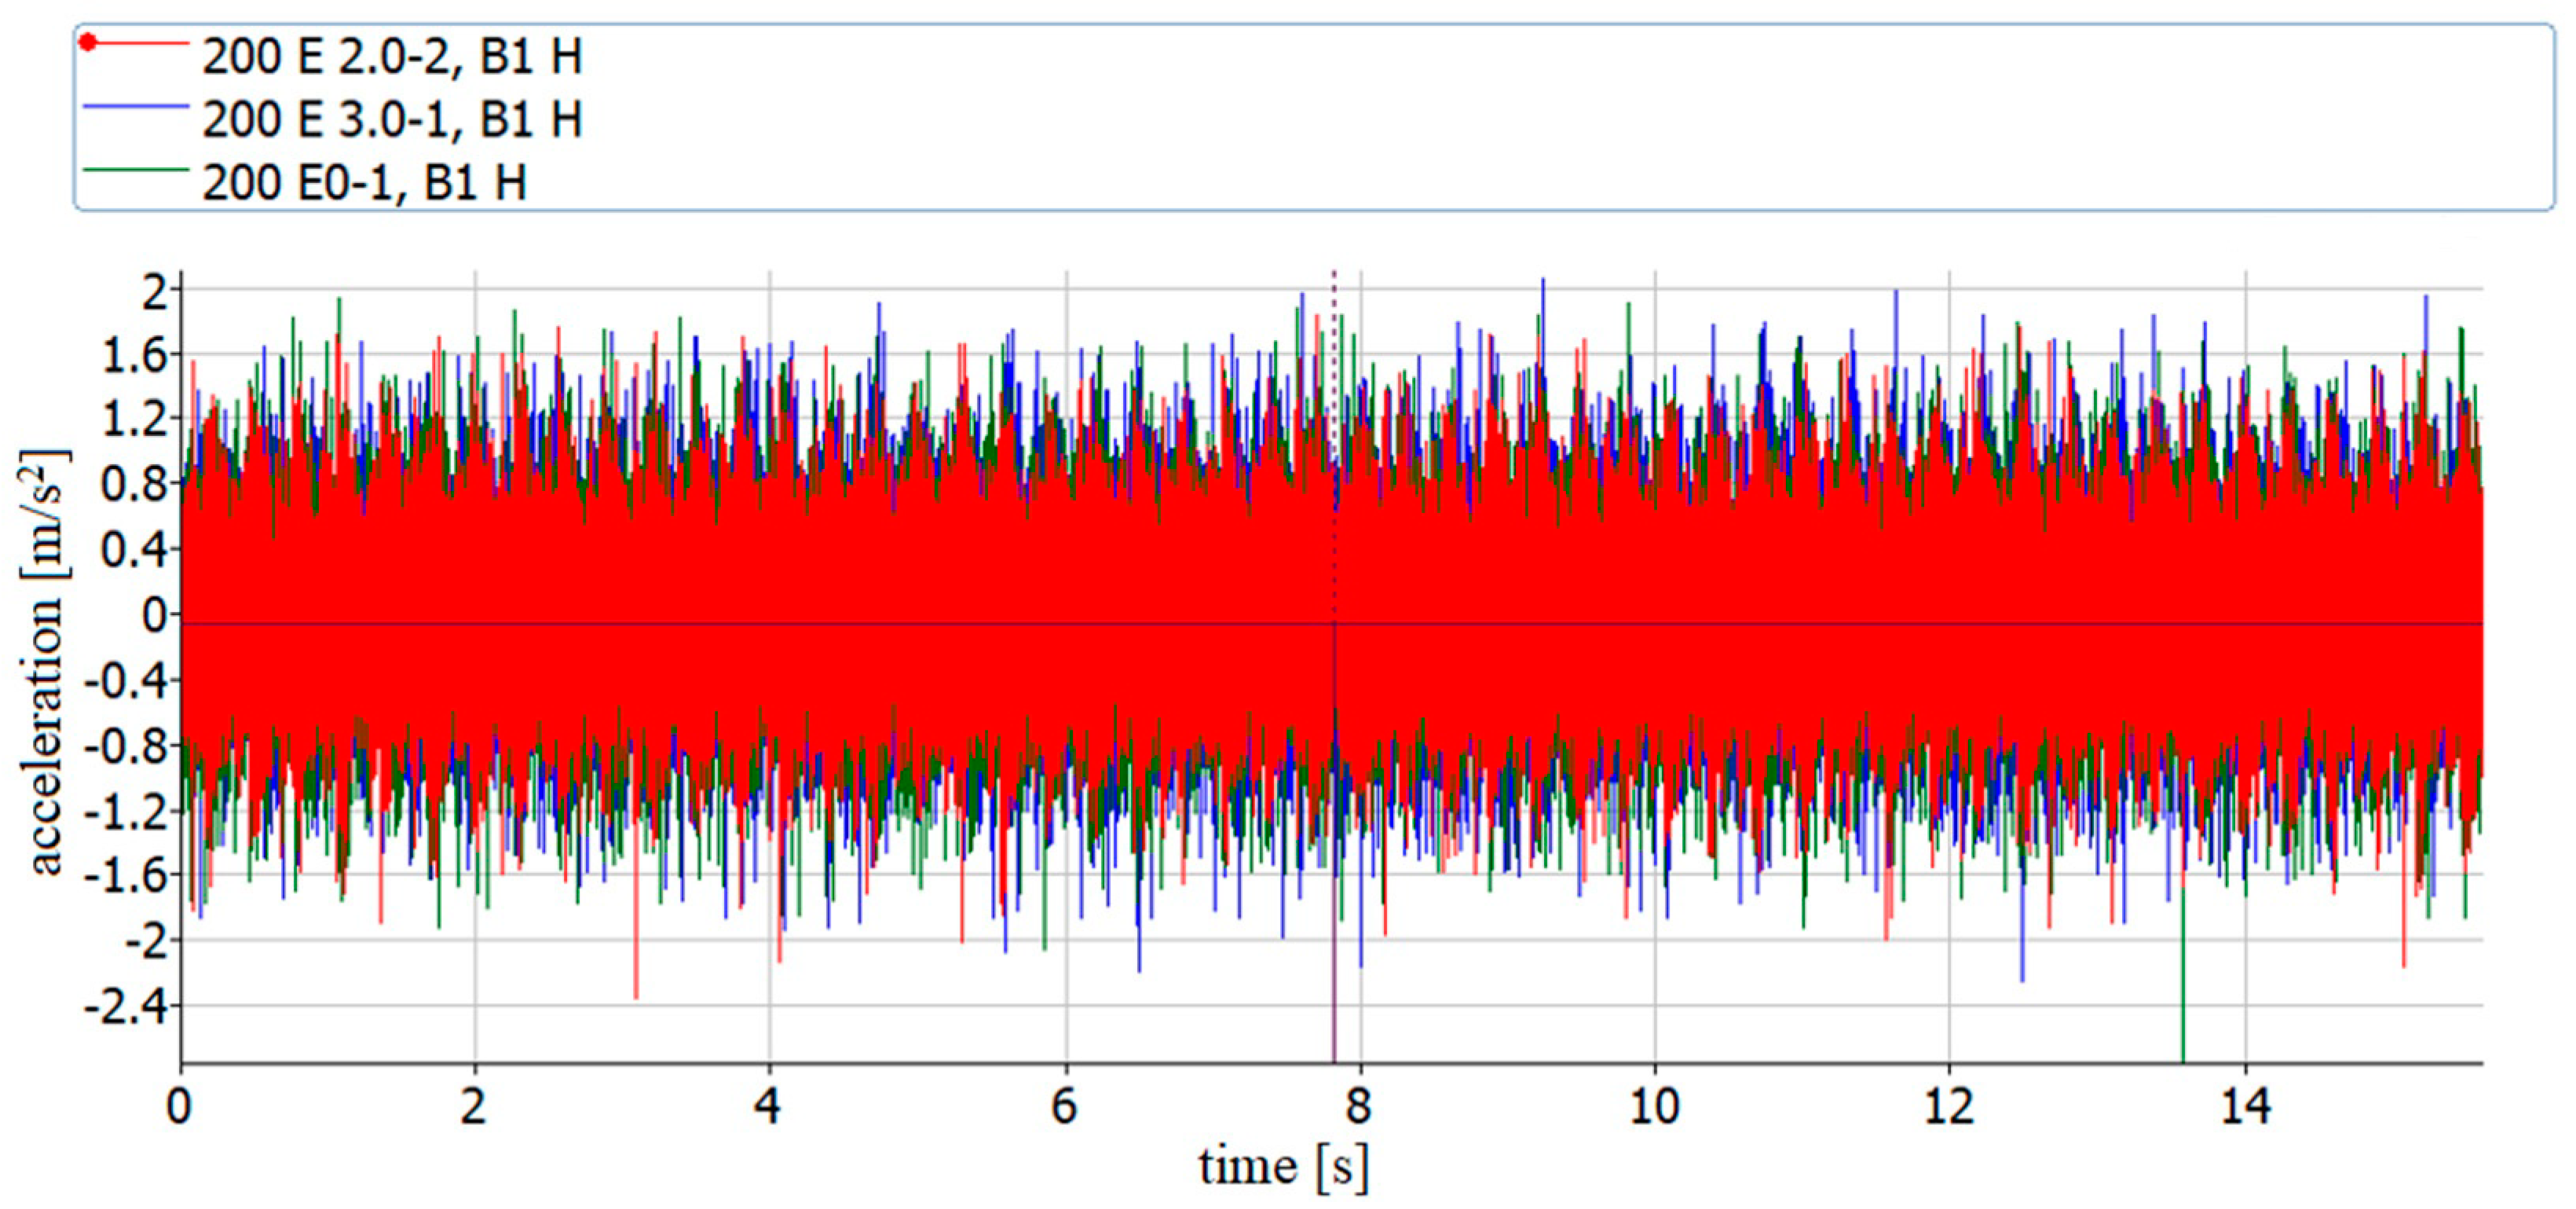
The time histories of vibration accelerations recorded during the measurements were subjected to a multi-stage analysis to determine the possibility of detecting deviations in shaft line alignment using vibration parameters. Examples of vibration acceleration waveforms recorded at the same point (B1H) and under the same operating conditions for three different alignment conditions are shown in
Figure 4.
The data analysis in
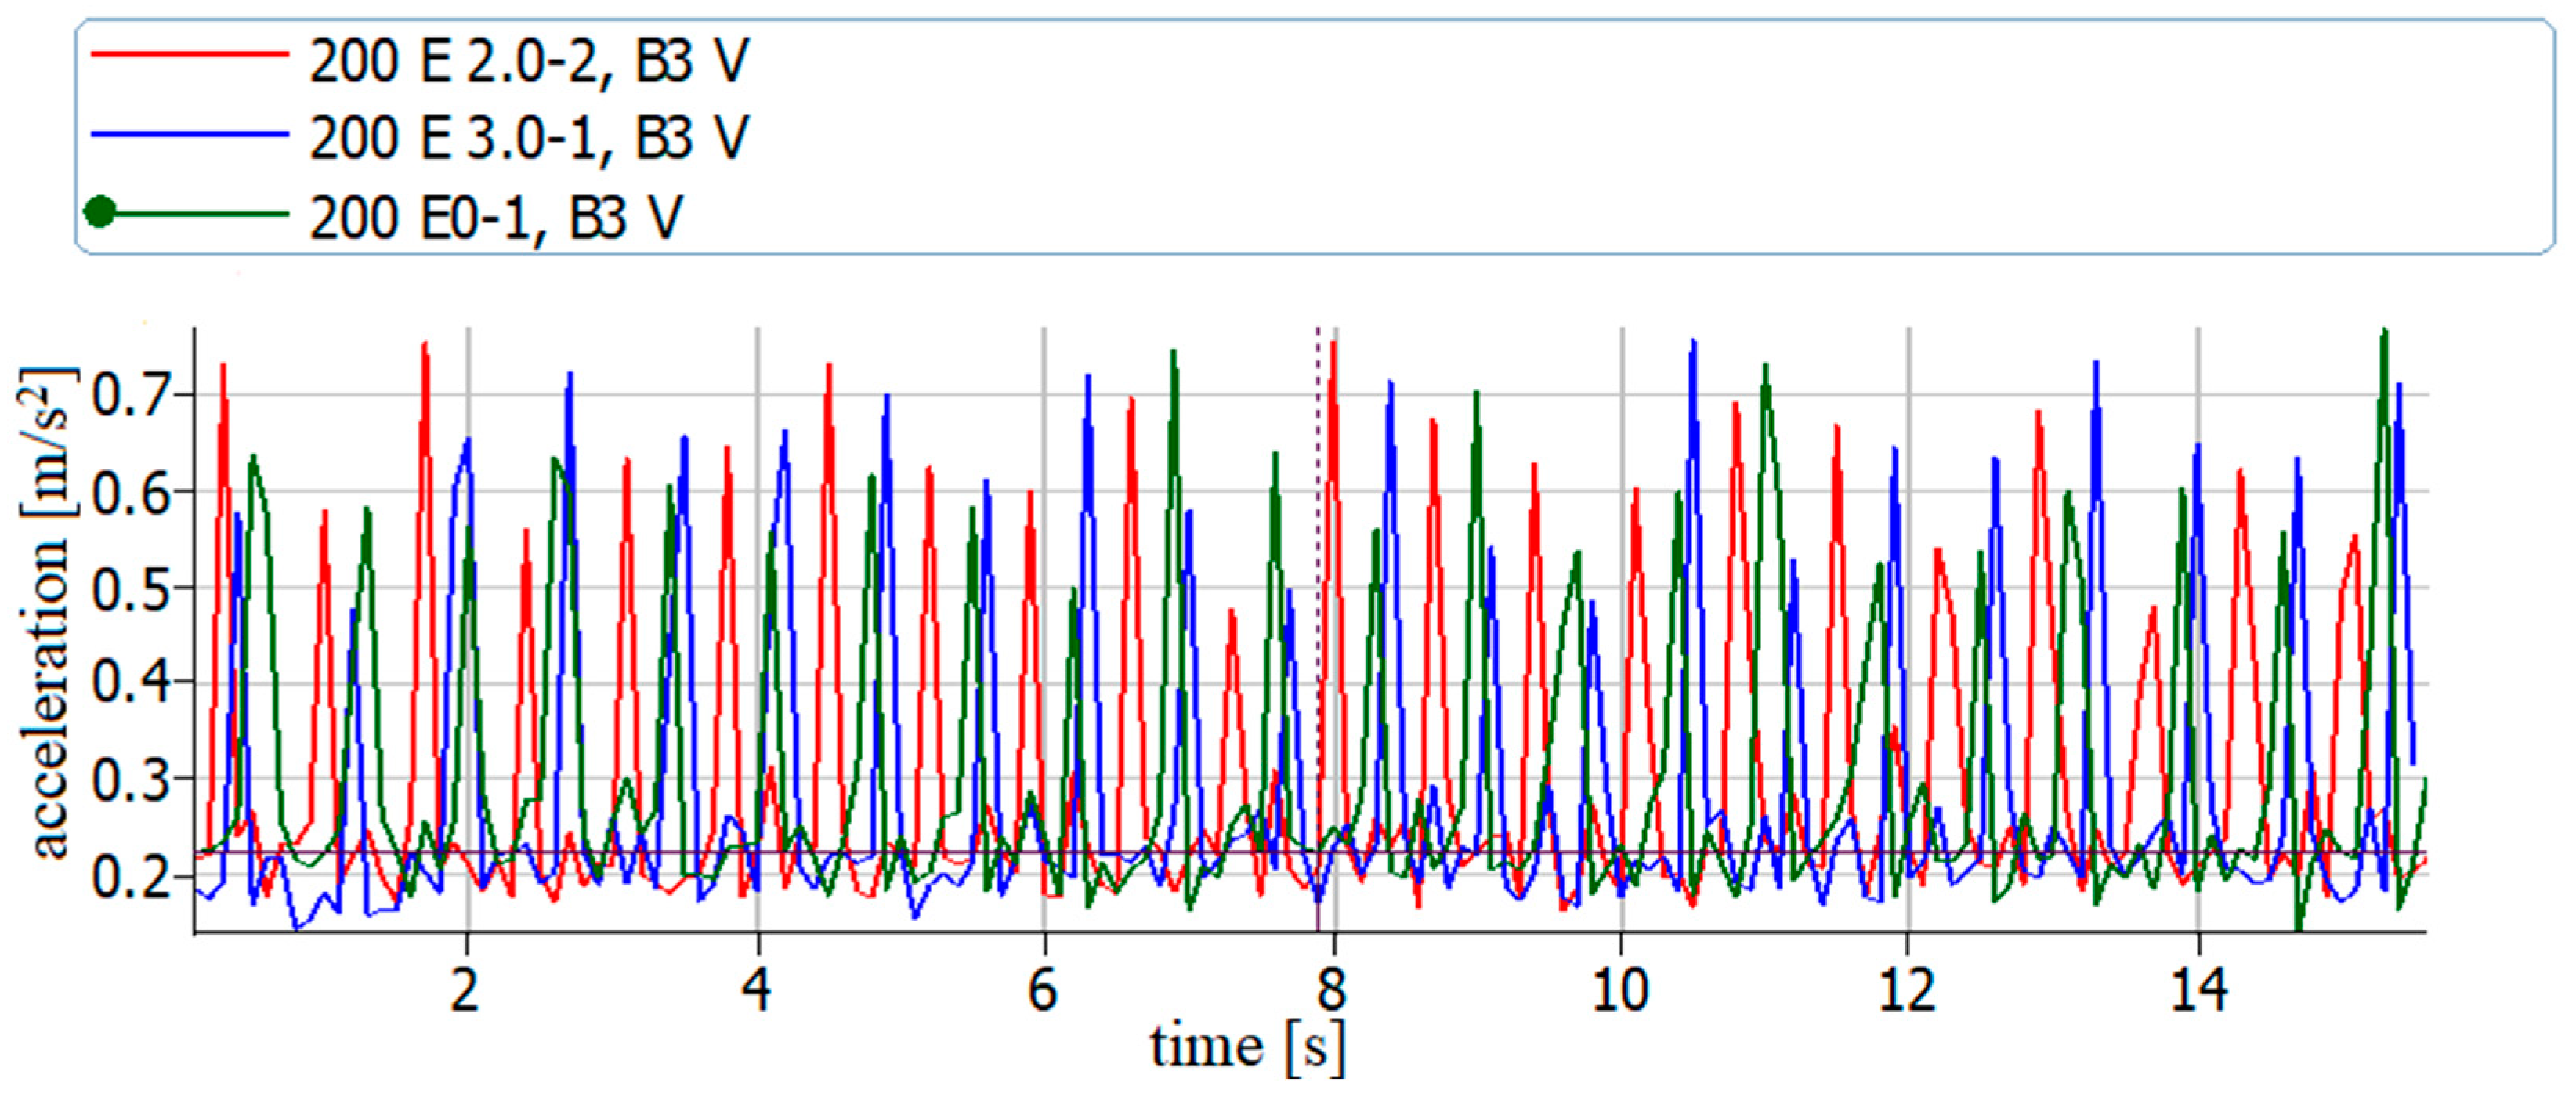
Figure 4 allowed us to find some specific peak values in the waveforms, but it was difficult to associate them with misalignment. Nevertheless, they were random and could not be used for further diagnostic purposes. To find measured values that could be used to detect a malfunction, such as misalignment, the time course values were first averaged to intervals of 0.1 s to check whether the overall vibration acceleration level, as a function of time, had changed noticeably with decreasing alignment. An example of such averaging is shown in
Figure 5.
An analysis of the waveforms presented in
Figure 5 shows that regardless of the introduced deviations of the tested rotating system, they were impossible to identify based on such prepared averaged time waveforms.
Before basic measurements in a steady state (at constant shaft rotational speeds) were conducted, a series of measurements were carried out during test rig runouts from a speed of 200 rpm to 0 rpm. Such measurements were intended to provide information on the occurrence of resonances in the tested shaft system during the deceleration process. This allowed for measurements without external forcing in the engine’s supplied torque. The recorded signals were analyzed using the Short-Time Fourier Transform (STFT). Through the application of windowing techniques with overlap, the signal was divided into equal sections, and the Discrete Fourier Transform (DFT) was performed on each section. This process generated a three-dimensional spectrum that shows amplitude variations for individual signal frequencies over time. Detailed procedures and mathematical descriptions can be found in publications [
28,
29].
The spectrum presented in
Figure 6 indicates a typical distribution of amplitudes of subcritical machines during the rundown process. No sudden increases in amplitude were observed with decreasing shaft rotation speed, which proves that the rig did not pass through the resonance area in this test. Similar results were obtained for all five measurement points. Thanks to this procedure, the diagnostician can be sure that the obtained results were not influenced by amplitudes related to the resonance of the entire system or local resonances. If such analysis is not conducted, unrecognized resonance may appear at certain characteristic frequencies and disturb the possibility of the unambiguous identification of shaft line misalignments.
As a final step, a spectral analysis was performed to determine the impact of the simulated axial deviations on the vibration characteristics of the test rig. The obtained FFT (Fast Fourier Transform) spectra were checked for changes in the value of the first harmonic of the vibration velocity related to the shaft rotation speed, which is a commonly recognized parameter for the identification of misalignment in rotating shaft systems [
2,
5,
16]—
Figure 7.
The amplitude of the first harmonic caused by unbalance almost always yields the same values in both vertical and horizontal directions. However, if there is an absence of resonance, the vibrations caused by misalignment generate higher amplitude values of the first harmonic in the horizontal direction than in the vertical direction. Similar correlations can also be confirmed in the case of further harmonics up to and including the 10th harmonic. However, in the case under consideration, no such regularity was found. Also, the value of the first harmonic was not found to be dominant in the analyzed spectra (see
Figure 6). The situation in which the value of the amplitude of the first harmonic of the rotational speed is the highest is typical for most propulsion systems of vessels. An example of a typical vibration velocity spectrum recorded at the thrust bearing in front of the engine while operating at a speed of 1500 rpm is shown in
Figure 8.
It is also typical of misalignments that the first harmonic is most often dominant in the spectrum, while the subsequent harmonics are significantly smaller, with their amplitudes decreasing as the order of the harmonic increases—see
Figure 8. Most often, when the value of the amplitude of the second harmonic begins to exceed one-third of the amplitude of the first harmonic, we can say with a high degree of probability that there are alignment deviations in the tested object. Neither of these were confirmed during the signal analysis of the test rig.
During the analysis of the vibration spectra, an example of which is shown in
Figure 7, the values of harmonics from I to III and their ratios, i.e., I/II, I/III and II/III, were verified. The average values of vibration velocity in the frequency range from 2 Hz to 1000 Hz and from 2 Hz to 50 Hz were also checked. Therefore, all typical parameters in which changes may indicate the occurrence of concentricity deviations were analyzed, but none of them allowed the identification of significant simulated misalignments. A diagnostician conducting research and analyzing vibration parameters must have a thorough understanding of the structure and operation of the tested object. For this reason, the values of the VIIth harmonic were analyzed in detail. This provided information about the functionality of the dog clutch used in the considered test rig. In the presence of dog clutches in the torque transmission system and simultaneous misalignment, the dominant harmonic is most likely the harmonic corresponding to the number of dog teeth in the clutch. The values of vibration velocity of the VIIth harmonic amplitude relating to all measurements are presented in
Table 1.
Due to the presence of a seven-tooth dog clutch in the tested line of shafts, the dominant harmonic was the VIIth harmonic. However, the regularity typical of misalignments has been maintained, consisting of larger amplitudes in the horizontal rather than the vertical direction, as seen in
Table 1. In the case of the tested system, the values of the VIIth harmonic amplitudes were found to decrease with increasing bearing displacement and consequently with increasing misalignment. This is due to the change in clearance in the dog clutch, resulting in its smoother operation. It would be expected that a further increase in concentricity deviations would result in the opposite effect. However, experimental verification of this phenomenon is not possible due to the design limitations of the test rig.
5. FEM Analysis of Shaft Line Vibrations
The aim of this work was to examine how bearing displacement affects the vibration results in the system. For this purpose, the shaft line was modeled as beam elements with different diameters, with data about the steel material and the equivalent stiffness of the coupling being assigned. Most beam models use the boundary condition as the degrees of freedom at the bearing points. Unfortunately, such a model does not allow for the determination of the accelerations at the bearing points, since the displacements of the nodes at these points are zero and cause a reaction only at this node. In the context of this task, a solution was proposed that models the stiffness of the supports as beams with an appropriately selected cross-section. This solution added the appropriate stiffness to the support and allowed the accelerations at the bearing nodes to be determined. At the connection points with the shaft, only the first three degrees of freedom were transferred, which allowed the shaft to rotate and transfer vibrations. In a typical case, the support is modeled as a spring element, but such an element does not allow free rotation and the execution of dynamic loads in the Abaqus program. The numerical model with assigned boundary conditions is shown in
Figure 9.
The stiffness of the supports is unknown. It was modeled using the stiffness resulting from the moment of inertia of the cross-section of the beam element. The moments of inertia of the cross-section were modelled based on the dimensions of the bearing housings, with the walls of the rectangular section being assigned the corresponding thickness. According to theory, the stiffness is defined as the quotient of Young’s modulus and the moment of inertia of the cross-section, so that the stiffness of the supports is as follows [
30]:
![Jmse 12 02284 i001]()
With consideration of the above equations, the stiffness of the support should be determined in two directions, namely, tangential to and normal to the shaft axis. These values describe the profile’s resistance to deflection depending on the load direction. Due to the different sizes of the supports, six stiffnesses were determined in the task, equal to
The FEM task was carried out in several stages. In the first stage, the vibration accelerations for the balanced shaft were determined. The bearing support was then displaced by 0.003 m in the horizontal plane of the shaft, and the shaft rotation speed was assigned. The effect of the bearing displacement on shaft displacement is shown in
Figure 10.
The rotational speed range of the shaft rig was from 0 to 300 rpms, corresponding to an angular velocity of 31.42 rad/s. The measurements and the detailed FFT analysis were performed at a rotational speed of 140 rpm (14.66 rad/s), so the simulations were also performed at this speed. The simulation was performed for a balanced shaft, which was then displaced by 3 mm, and the simulation was repeated. Since the FEM solution was based on displacements and the measurements were based on accelerations, it was decided to perform the model verification in the velocity domain. After performing initial simulations, it was found that the FEM solution was too ideal (it did not introduce any clear harmonic), so it was necessary to introduce a slight mass unbalance to convex the first and seventh harmonics. After small unbalanced masses were introduced, the model was consistent with the measurements at a level of 3% in the frequency domain for the balanced shaft.
The bearing displacement was then checked to determine how it affected the time histories of vibrations. The velocity results for both the aligned reference model and for the misaligned configuration at the place of the shifted bearing are shown in
Figure 11.
The vibration velocity curves from the CAE program were compared with the measured values. These values differed from each other, probably due to the fact that no complete information regarding the stiffness of the supports was available. Through changes in the stiffness of the individual supports, the calculation model could be refined to come closer to reality. Once the model had been calibrated, the misalignment of the shaft could be simulated for different mounting positions of the tested bearing and then introduced as a load on the supports and tested on the bearings. The simulations of the vibration velocity time histories showed differences in the vibration parameters between the operating condition without misalignment and the condition with introduced misalignment—
Figure 11 and
Figure 12.
With the FEM results, it is possible to visualize the shaft deformations during rotation and to find potentially damage-prone areas. Selected forms of shaft deformation during rotation and the stresses occurring in it are shown in
Figure 13. From the results shown, it can be seen that the clutch located closest to the displaced bearing was most susceptible to damage. In addition, the stress values occurring in the shaft exceeded over 100 MPa. Although this value did not yet lead to plastic deformation, it significantly reduced the fatigue strength of the shaft.
6. Conclusions
This study involved conducting a vibration analysis of shaft lines on a shaft test rig. Misalignment was deliberately introduced, and vibration measurements were performed at designated points. A numerical model of the shaft line was developed to predict the vibration behavior at the bearings caused by misalignment. The beam model was based on elastic supports with certain assumed stiffnesses, which led to discrepancies between the experimental measurements and the model predictions. To improve accuracy, the model requires calibration through the adjustment of the stiffness values of the supports. There are FEM models of shaft lines that allow for the prediction of various physical phenomena associated with them. This study introduces a novel contribution by developing a comprehensive model for the test rig, which previously did not have such a model. In addition, an innovative approach combining quasi-static displacement with implicit dynamic rotation was used, which allowed for the direct determination of vibrations.
The research results reveal a correlation between the decreasing amplitude of the vibration velocity at the seventh harmonic of the shaft rotation and increasing misalignment. These findings generally match with simulations conducted using finite element method (FEM) models. However, the numerical results also show significant changes in other spectral components with increasing coaxiality deviation. These discrepancies occurred due to several modeling simplifications, mainly because not all damping parameters were considered in the simulation, such as material damping and damping within the supports. The findings suggest the need for further experimental studies, particularly with increased coaxiality deviations, which may yield more distinct and interpretable changes in vibration parameters. Notably, the tested torque transmission system displayed atypical behavior; specifically, there was no significant change in the amplitude of the first harmonic of vibration velocity with increasing misalignment. This behavior was attributed to the large mass of the rotating components and the dog clutch in the system, which largely compensated for the introduced misalignment deviations. Nevertheless, it is possible to identify vibration parameters that indicate misalignment, provided there is a comprehensive understanding of the system’s structure and an open approach to vibration diagnostics.
Within the scope of this work, a numerical problem was solved to describe vibrations arising from rotational motion. This paper represents an innovative approach to the problem, as it accounts for the unbalance, but not for the dynamic effects, resulting from the rotational speed and support stiffness. Despite its limitations, the model effectively identifies potential damage points and predicts the effects of imbalance on shaft strength. Additionally, it enables the visualization of shaft vibration modes during forced vibration. The model achieved a 3% accuracy in predicting frequency-domain results, although discrepancies in amplitude were noted due to uncertainties in the stiffness properties of the supports.
The modeling process revealed a change in vibration amplitude between the balanced and unbalanced shaft, indicating the model’s sensitivity to variations in initial conditions, such as bearing displacement. However, further refinement is required to enhance the model’s accuracy, which is planned as part of future research.


