Article

A Feature Extraction Method of Ship Underwater Noise Using Enhanced Peak Cross-Correlation Empirical Mode Decomposition Method and Multi-Scale Permutation Entropy

1
School of Mechanical and Automotive Engineering, Qingdao University of Technology, Qingdao 266525, China
2
Laboratory of Science and Technology on Integrated Logistics Support, National University of Defense Technology, Changsha 410073, China
3
College of Engineering, Ocean University of China, Qingdao 266005, China
*
Author to whom correspondence should be addressed.
J. Mar. Sci. Eng. 2024, 12(12), 2222; https://doi.org/10.3390/jmse12122222
Submission received: 31 October 2024 / Revised: 22 November 2024 / Accepted: 2 December 2024 / Published: 4 December 2024
(This article belongs to the Section Ocean Engineering)

Abstract

:
A feature extraction method based on the combination of improved empirical modal decomposition (IEMD) and multi-scale permutation entropy (MPE) is proposed to address the problem of inaccurate recognition and classification of ship noise signals under complex environmental conditions. In order to eliminate the end effects, this paper proposes an extended model based on the principle of peak cross-correlation for improved empirical modal decomposition (EMD). In this paper, the IEMD method is used to decompose three ship underwater noise signals to extract the MPE features of the highest order intrinsic modal function (IMF) of energy. The results show that the IEMD-MPE method performs well in extracting the feature information of the signals and has a strong discriminative ability. Compared with the IEMD-aligned entropy (IEMD-PE) method, which describes the signals only at a single scale, the IEMD-MPE method achieves an improvement in the minimum difference distance ranging from 101.36% to 212.98%. In addition, two sets of highly similar ship propulsion noise signals were applied to validate the IEMD-MPE method, and the minimum differences of the experimental results were 0.0814 and 0.0057 entropy units, which verified the validity and generality of the method. This study provides theoretical support for the development of ship target recognition technology for propulsion.

1. Introduction

The ship noise signal contains many ship characteristic parameters and is an important index for measuring ship performance [1]. Ship noise is the signal source for passive sonar to detect, track, identify, and locate the target. Therefore, denoising and feature extraction of the ship noise signal are the key technologies of ship target recognition. In-depth research on ship radiation noise feature extraction technology is helpful to improve the working performance of passive sonar and holds significant practical engineering significance [2].
Underwater ship noise separation and detection analysis is one of the basic techniques of modern hydroacoustic signal processing, where feature extraction is a key link in underwater target detection and classification. Therefore, the reliable and effective extraction of underwater ship noise signal features is a very challenging task [3,4]. Due to the complexity of the ship noise generation mechanism and the influence of various factors such as the marine environment and topography, ship noise exhibits non-linear, non-smooth, and non-Gaussian features, which makes it difficult to extract stable features in the field of hydroacoustic research [5]. Therefore, it has become a very challenging task to reliably and effectively extract underwater noise features through classical time and frequency domain analysis [6]. So far, researchers at home and abroad have explored a variety of feature extraction and separation methods for ship noise signals. Classical signal processing methods assume that hydroacoustic data and noise are linear and Gaussian [7]. Due to the inability of Fourier transform and power spectrum analysis to capture the time-varying characteristics of the studied signals, traditional signal processing feature extraction methods (short-time Fourier transform, power spectrum analysis [8], wavelet transform [9], and others) have limitations and are ineffective in dealing with noisy signals [10]. Therefore, finding a reliable method is the key to analyzing underwater noise signals from ships.
Generally speaking, the underwater ship noise can be viewed as a nonlinear time series, which is analyzed from the perspective of time series complexity. Recently, several nonlinear-based feature extraction techniques, such as entropy calculation, have been reported to extract information from acoustic data, and studies have shown that they are superior to classical feature extraction techniques [11]. Entropy, originally introduced by Shannon [12], refers to the information stored in a system and serves as a measure of uncertainty, irregularity, and complexity. There are many kinds of entropy algorithms, including approximate entropy, sample entropy (SampEn), slope entropy (SloEn), dispersion entropy (DE), and permutation entropy (PE). Because PE [13] has a simple theory, simple calculation, and fast and strong anti-noise ability, it has been widely used in EMG and heart rate signal analysis, mechanical fault detection, and ship noise feature extraction. With advancements in the PE method, it has gained increasing popularity in ship noise feature extraction. In subsequent years, improved PE algorithms, such as weighted permutation entropy (WPE), reverse permutation entropy (RPE), and MPE, have been developed and applied. Liu X. et al. [14] proposed an improved variational mode decomposition (IVMD) combined with RPE, WPE, and energy ratio to address the challenge of low recognition accuracy of ship noise signals under complex environmental conditions. The experimental results show that compared with the EMD, the proposed method based on IVMD-RPE can effectively reduce the influence of environmental noise, improve the signal-to-noise ratio, and have a higher accuracy for the recognition and classification of ship noise target signals. Li Y. et al. [15] proposed a new multi-scale integrated dispersion Lempel–Ziv complexity (MEDLZC) measurement method in combination with multi-scale coarse-grained processing. The results of three simulation experiments show that MEDLZC has better anti-noise performance, more sensitivity to dynamic changes, and stability. In addition, the real signal experimental results indicate that the proposed MEDLZC offers the best feature extraction effect for different kinds of measured ship-radiated noise. Li Y. et al. [16,17] proposed a feature extraction method based on variational mode decomposition (VMD), MPE, and support vector machine (SVM) to eliminate mode aliasing, aiming at the difficulty and inaccuracy of feature extraction of ship radiated noise. Chen Zhe [18] proposed a complex feature extraction method for ship radiated noise based on EEMD and MPE, addressing the feature extraction challenges in complex marine environments. Experimental results demonstrate that the proposed method effectively extracts MPE features, enabling ship classification and recognition. Moreover, the MPE feature demonstrates high separability, leading to significantly improved ship classification recognition rates compared with other ship radiated noise feature extraction algorithms.
It has been observed that MPE [19,20] is a nonlinear characteristic parameter with good consistency and strong stability. Combined with multi-scale coarse-grained processing, signal complexity can be described from multiple dimensions. Therefore, this paper investigates the use of MPE to extract complexity features from underwater noise signals from ships. To reduce the effect of ocean noise, noise reduction is performed prior to MPE computation, making it more effective in terms of identification, separation, and classification of underwater noise sources [21]. One strategy to remove ocean noise is to use modal decomposition techniques. As a traditional signal decomposition method, the classical EMD algorithm [22] is a good technique for analyzing non-smooth and non-linear signals in the field of signal processing and has better decomposition performance than other decomposition methods, so it has received attention from many scholars. However, EMD has some problems, such as the end effects caused by non-extreme points and the mode aliasing caused by the uneven distribution of extreme points. Liu Qianli [23] addressed EMD’s mode aliasing problem by proposing an adaptive line spectrum and continuous spectrum extraction method for Ensemble Empirical Mode Decomposition (EEMD). This method extracts the line spectrum from IMFs decomposed by EEMD and utilizes residual and remaining IMFs to accurately estimate the continuous spectrum. Despite its recursive decomposition, EEMD is susceptible to end effects and may introduce decomposition errors. To reduce the end effects, Mehdi Zare et al. [24] proposed an improved empirical mode decomposition algorithm based on a correlation expansion model by using correlation with the signal of radiated noise itself. To solve the EMD end effects problem, the EMD method can be improved by extending the signal according to different methods, which has good robustness. In this paper, a signal expansion model based on the principle of peak cross-correlation is proposed to improve the EMD algorithm and eliminate the end effects of the EMD algorithm.
Therefore, addressing the challenges of ship noise signal feature extraction and the end effects of the EMD method, a method based on IEMD and MPE is proposed in this paper. IEMD, an improvement of EMD, extends the noise signal using the peak cross-correlation method to overcome deficiencies in the EMD algorithm’s end effects. Then, the ship’s underwater noise is decomposed into multiple IMFs by IEMD, the highest energy IMF signal is extracted, and the MPE algorithm is combined to realize the feature extraction and classification identification of the ship’s propeller noise signal.

2. The Proposed Method for Extracting Features from Ship Underwater Noise Signals

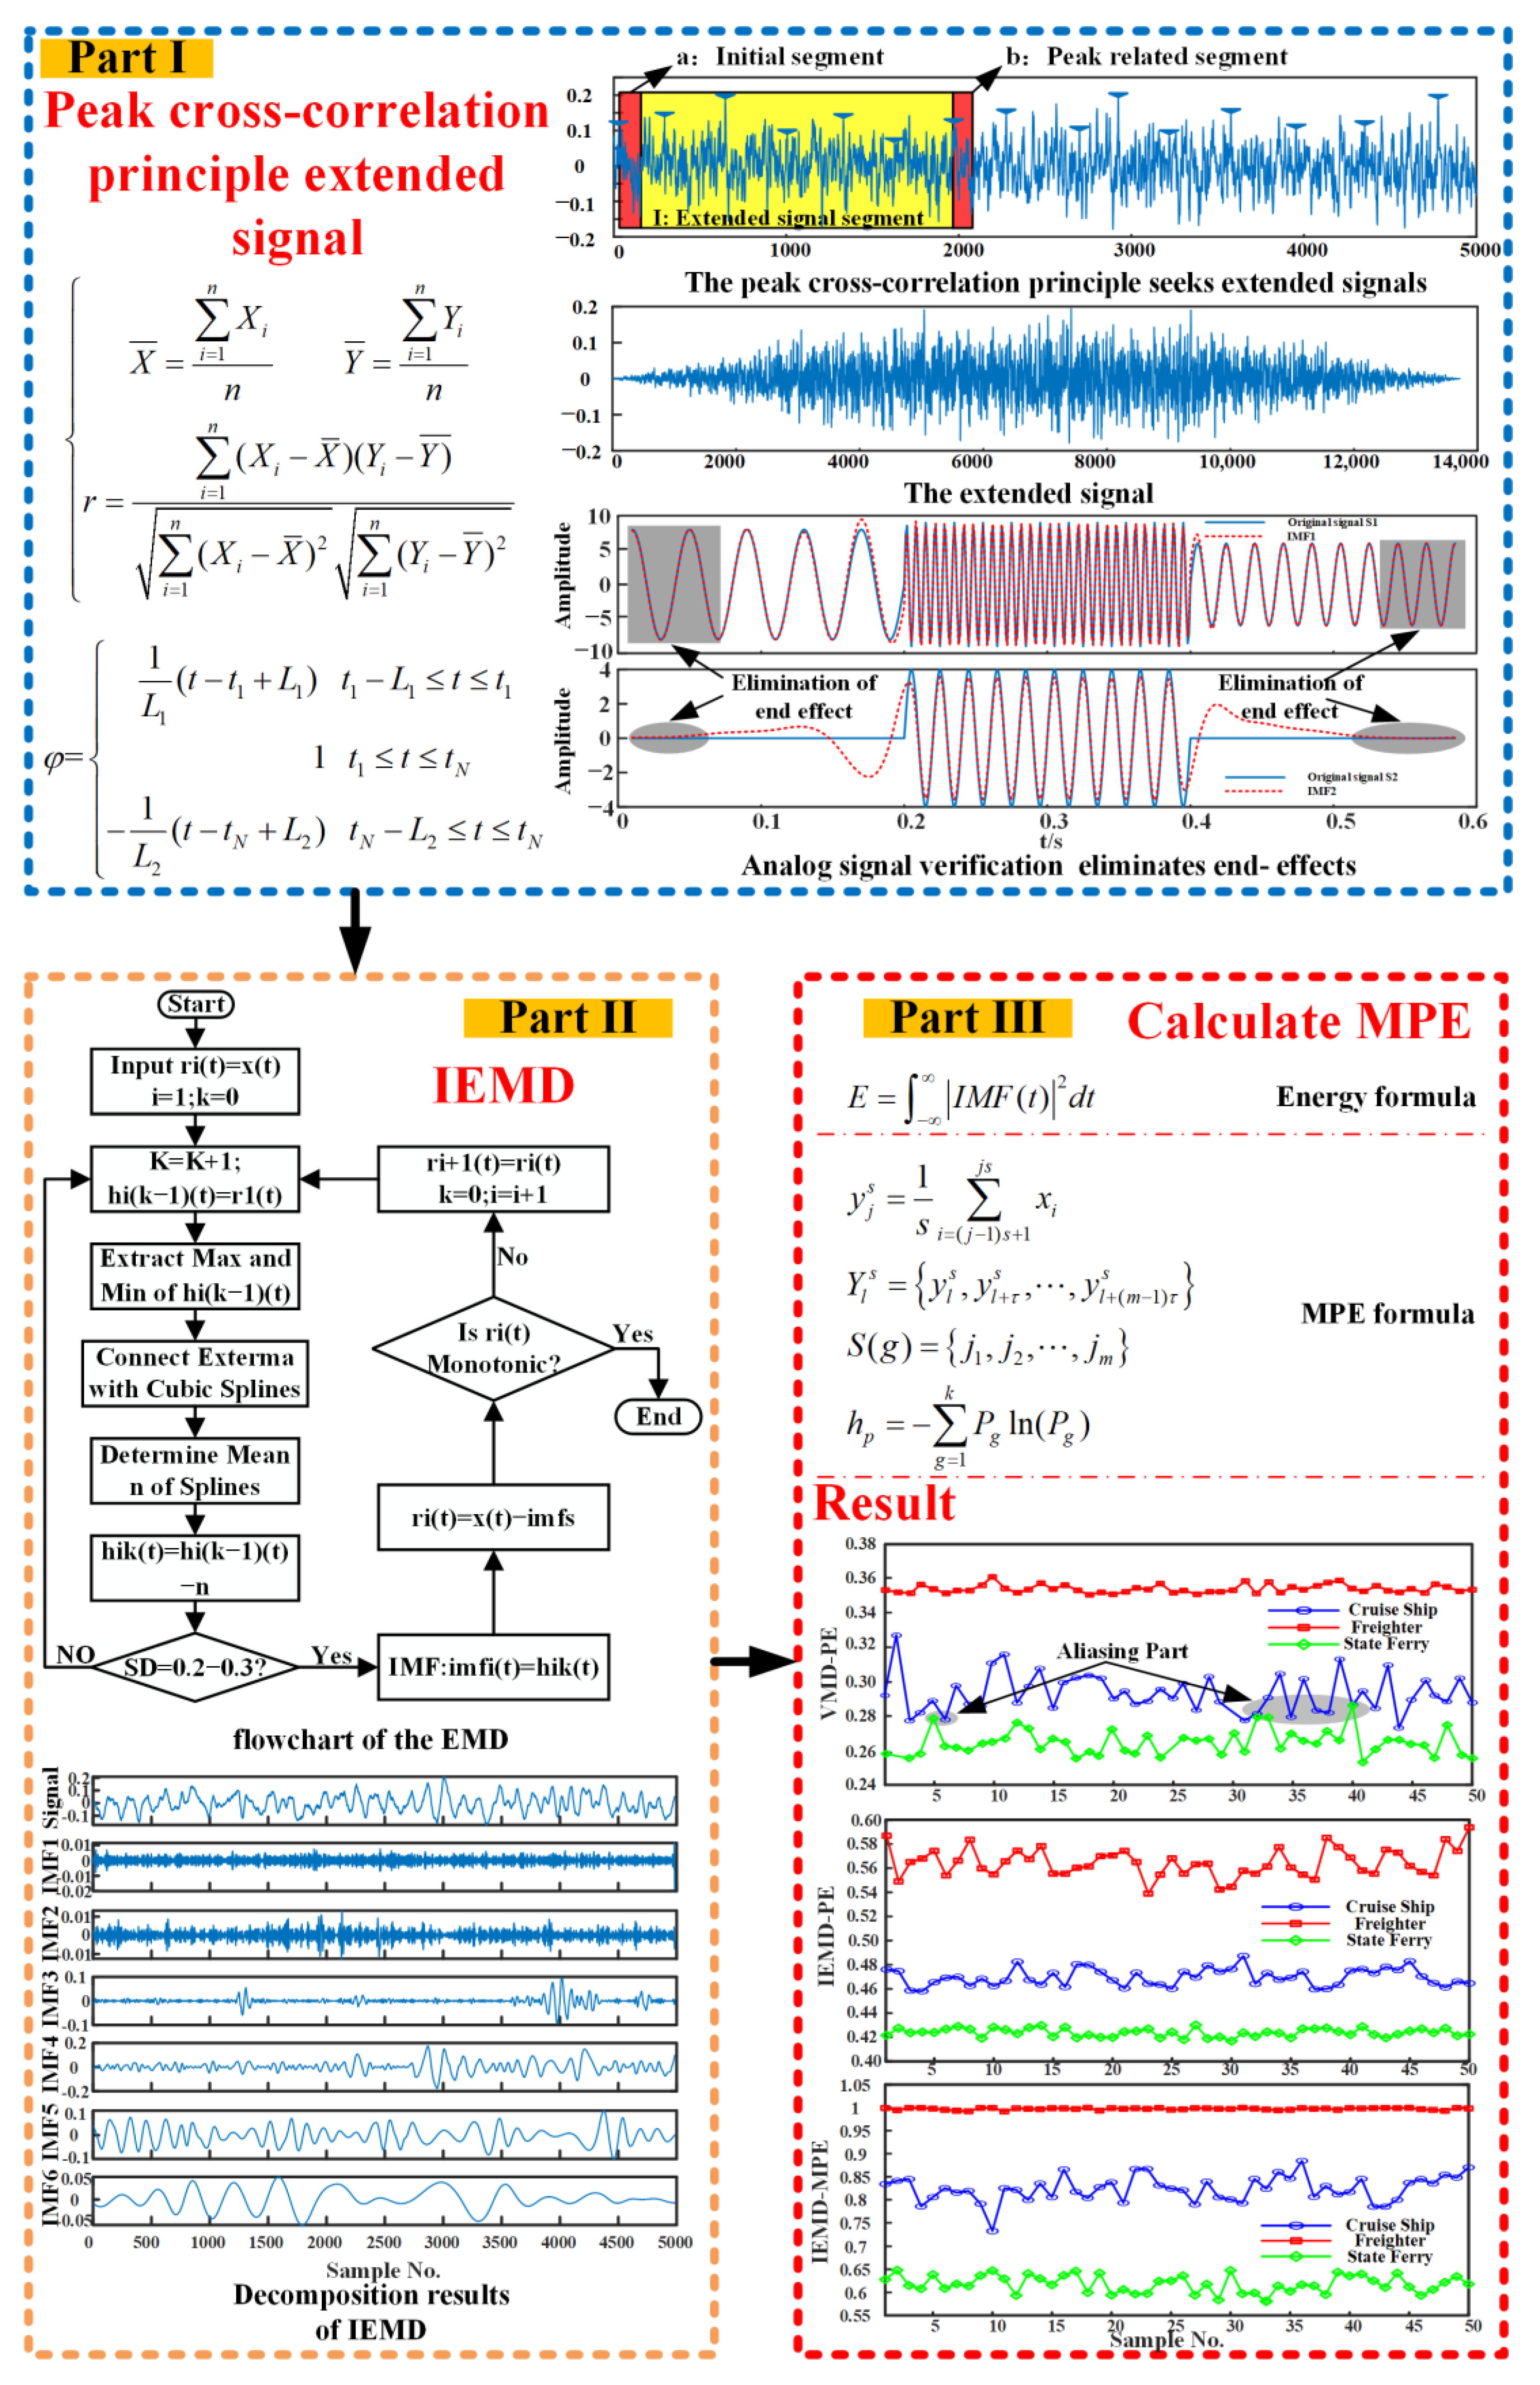
2.1. Overview of Research Methods

Reliable and effective underwater ship noise signal feature extraction is a challenging task. In the research process, due to the highly nonlinear nature of underwater noise signals, the end effect is prominent in the decomposition process of the EMD algorithm, and the existing signal expansion model introduces a large error. Aiming at the problem of end effects in EMD methods, a new EMD algorithm with an improved signal expansion model based on the principle of peak cross-correlation is proposed to combine the IEMD algorithm with MPE to propose a new feature extraction method for underwater noise signals. The general framework of the method is shown in Figure 1.
The IEMD-MPE feature extraction method proposed in this paper consists of three main parts:
In the first part, the original underwater noise signal is pre-processed by the new peak cross-correlation principle method, and the underwater noise signal expansion model is established to expand the endpoints of the ship underwater noise signal to improve the endpoint effect in the EMD method.
In the second part, the extended ship underwater noise signal is decomposed by EMD to obtain multiple IMFs, which contain signal features of different frequency components.
In the third part, the individual IMFs obtained after the decomposition by the IEMD method are analyzed using the energy formula; the highest energy IMFs are filtered to obtain the highest energy IMFs, and the MPE feature information of the highest energy order IMFs is extracted. The extracted IEMD MPE features can also reflect the characteristics of the main signal. In addition, this feature can achieve higher discrimination between different types of underwater ship noise signals. The specific algorithm formula is shown in Section 2.2 and Section 2.3.

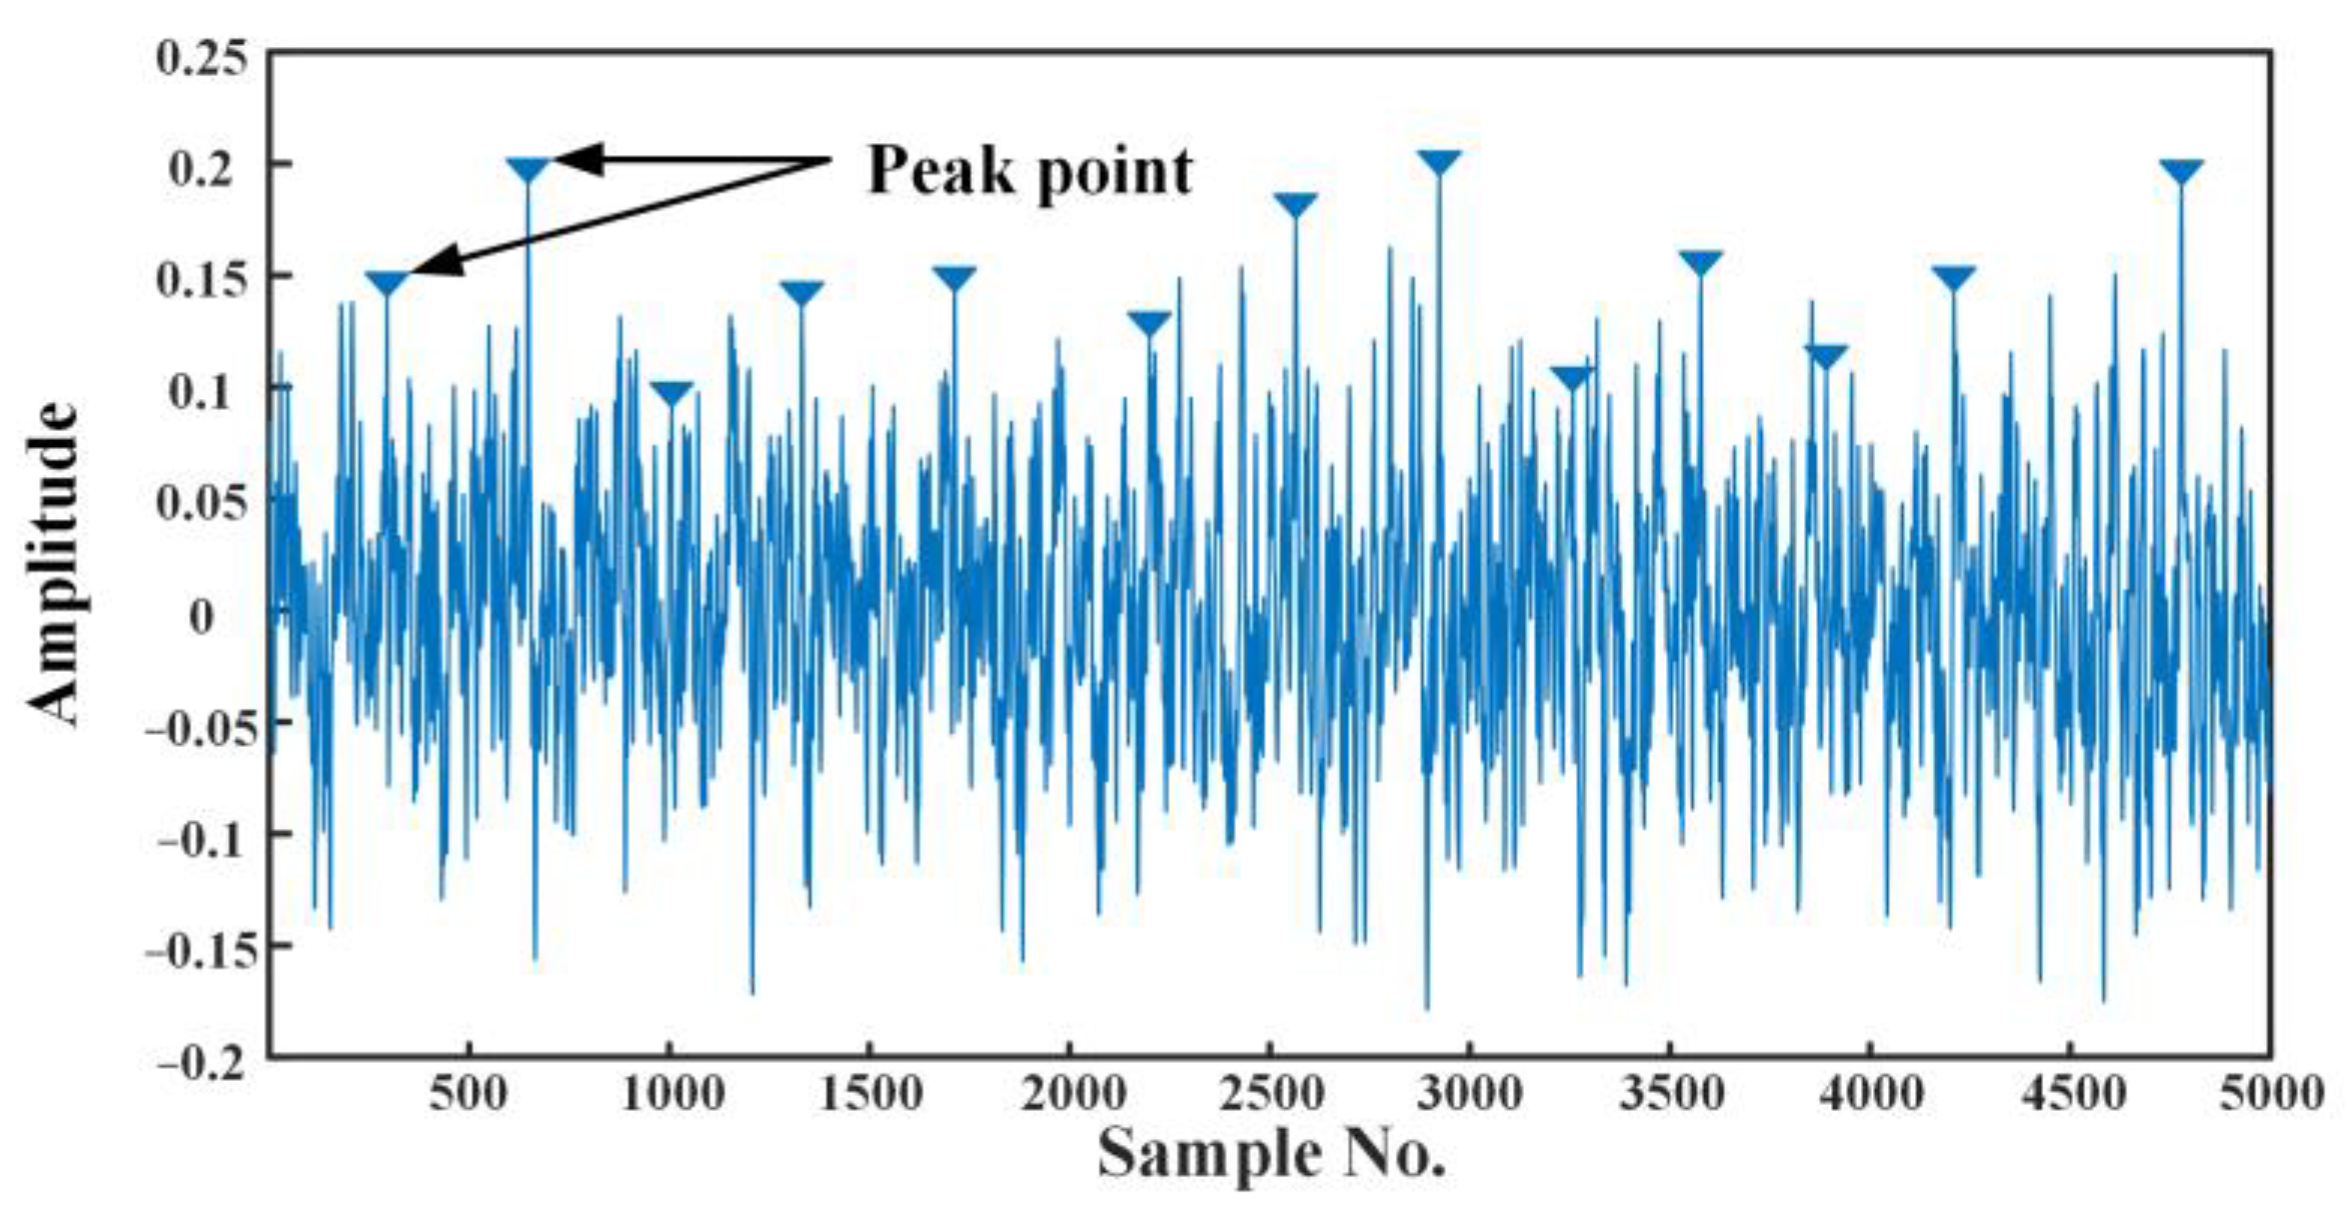
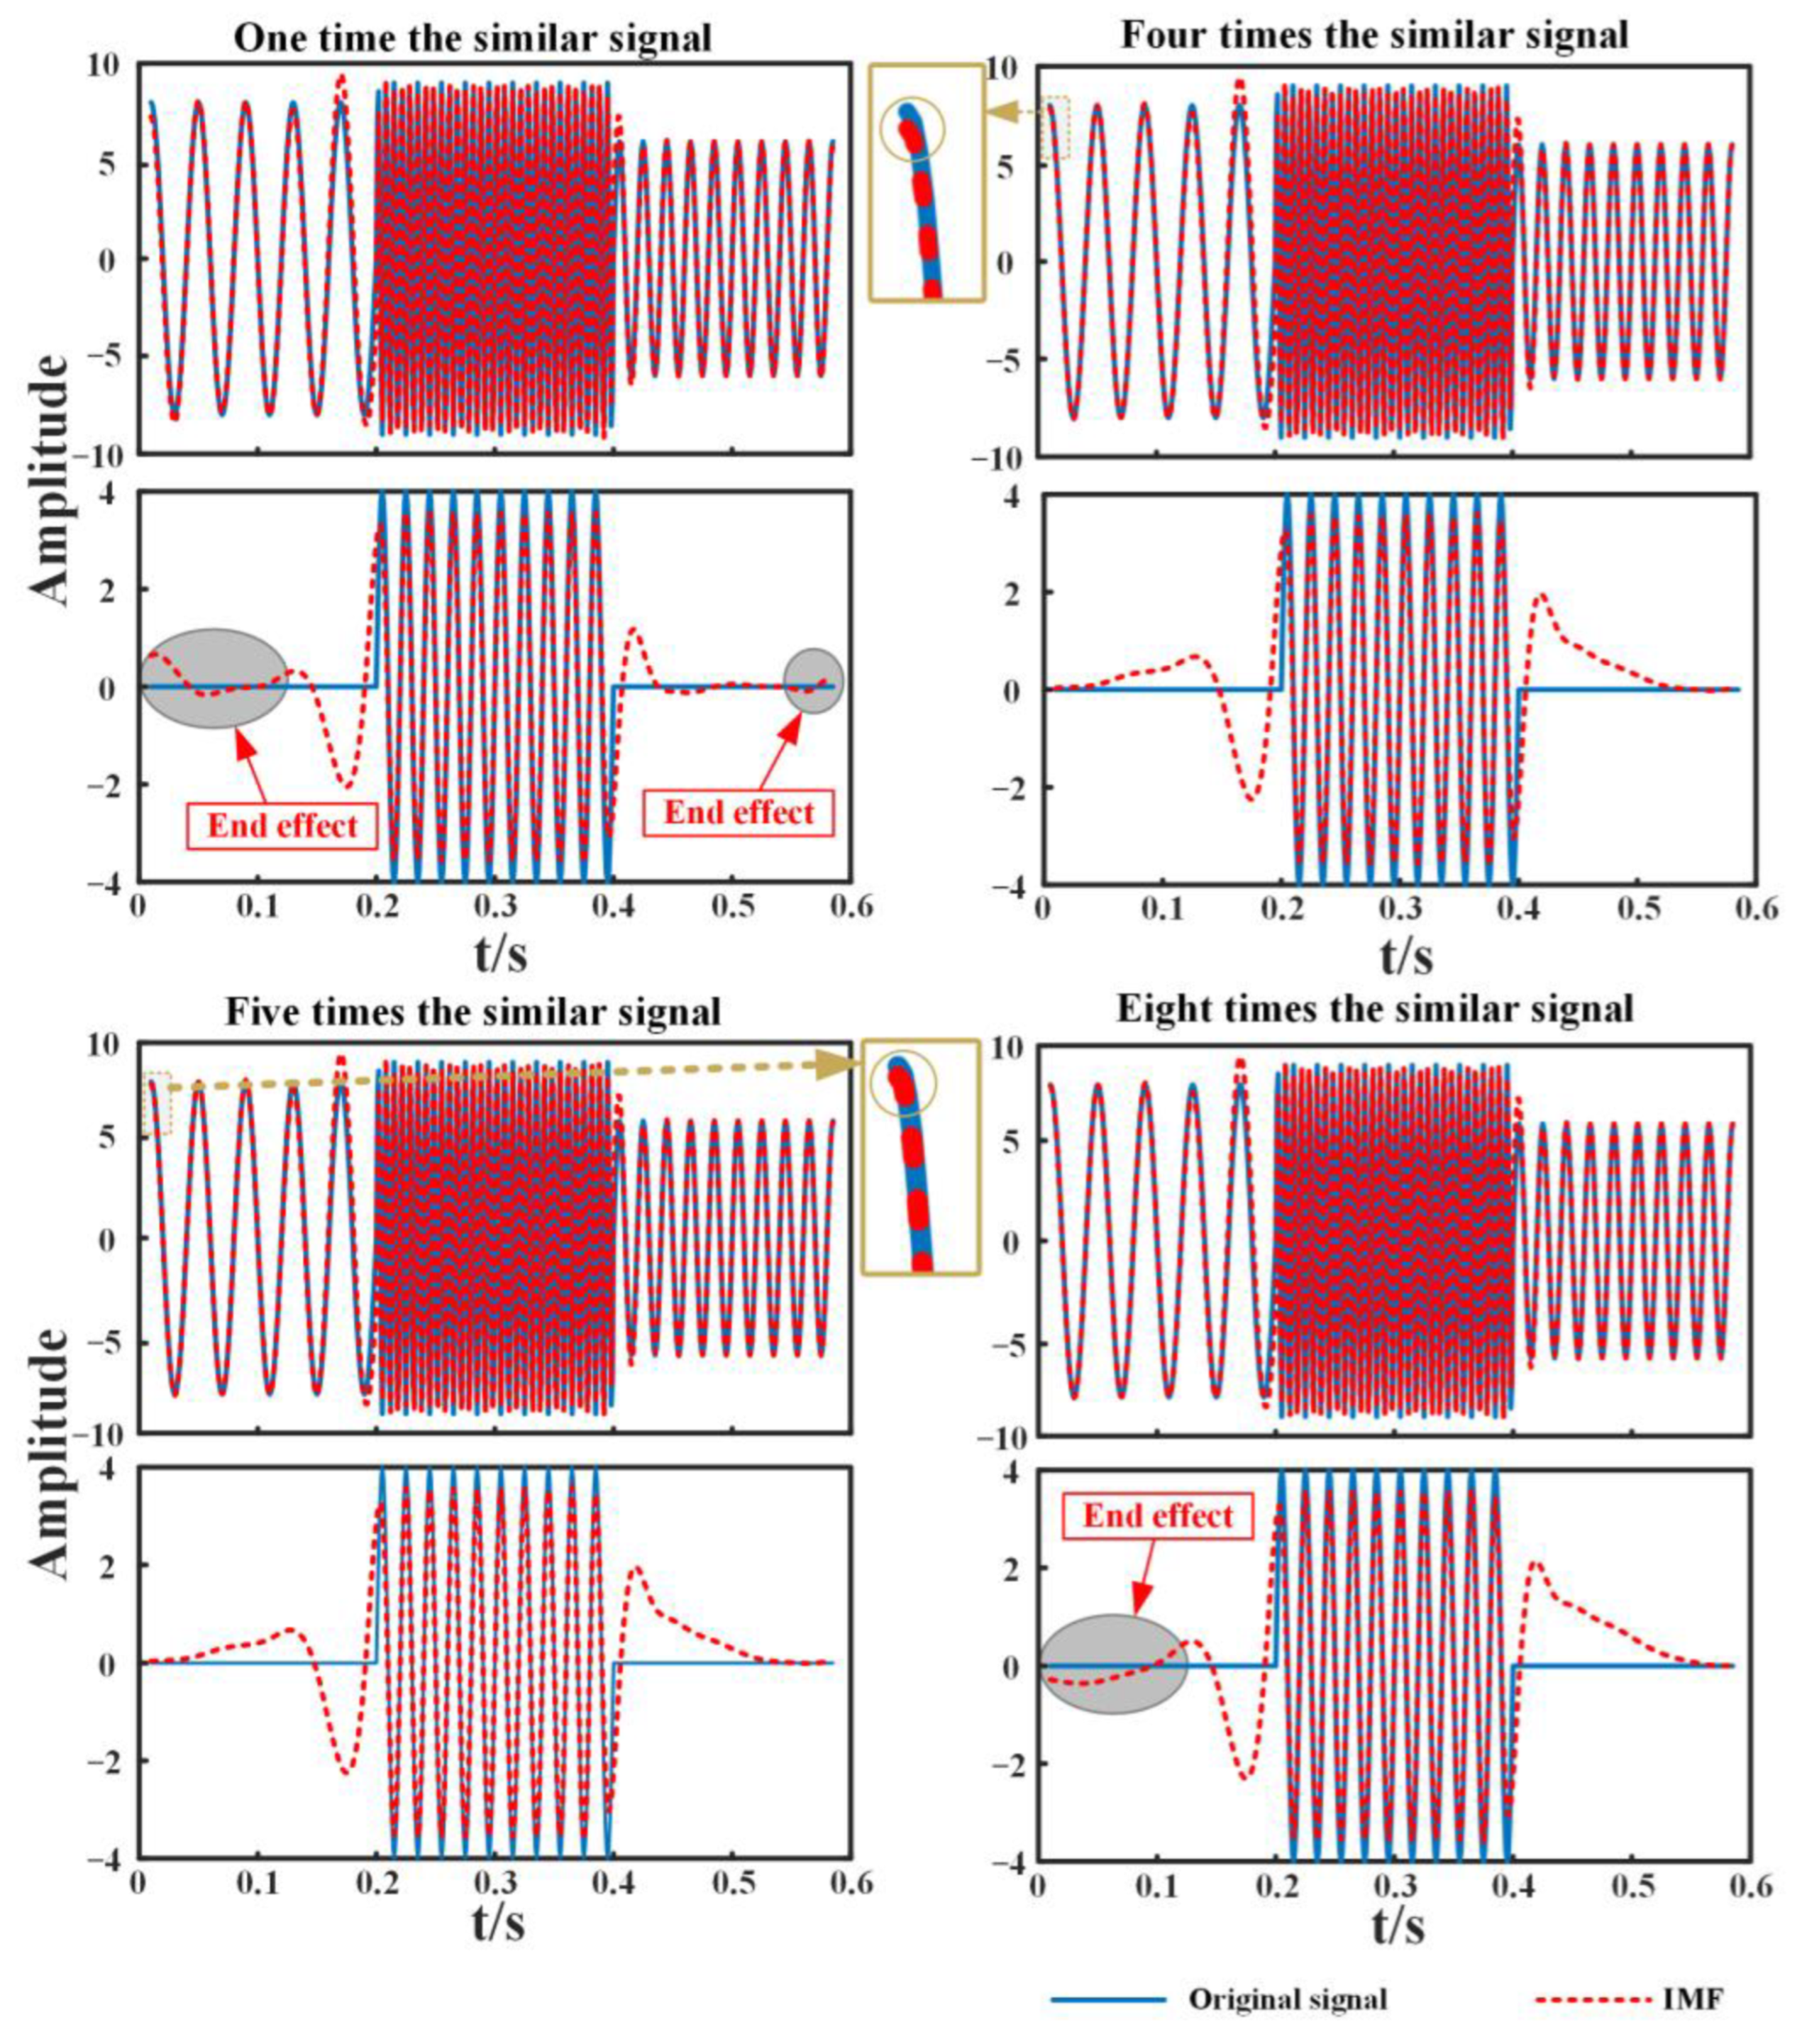
2.2. The Peak Cross-Correlation Method Is Proposed to Solve the End Effects of EMD

In the process of decomposing IMF, EMD [25] uses cubic spline interpolation to iterate the envelope calculation. Each IMF undergoes multiple “screening” processes, where each process calculates the local average of the signal based on its upper and lower envelopes. The upper (lower) envelope is obtained from the local maximum (minimum) value of the signal by cubic spline interpolation. However, in most cases, the end point of the signal is not necessarily in the maximum or minimum value [26], so the upper and lower envelope lines of the extreme value will diverge at the final break point, and this divergence will gradually turn inward with the progress of the operation, thus affecting the entire data series, thus distorting the waveform of IMF at the end point, resulting in IMF estimation errors and convergence problems. In addition, the calculation error of the first IMF will lead to the increase of the error of the subsequent IMF, which may cause the problem of data loss after decomposition [27]. This is the end effect of the EMD method, which is exacerbated by the high nonlinearity of the underwater ship noise signal. Therefore, addressing end effects is crucial when utilizing EMD for signal decomposition.
Currently, in the fields of mathematics and signal processing, the methods to mitigate the end effects of EMD can be achieved by increasing the signal length and using boundary processing, etc. No single method can completely eliminate the end effects of EMD. Therefore, adjusting and optimizing methods according to specific circumstances can help minimize them and achieve more accurate decomposition results.
Signal extension is a commonly utilized method to mitigate the end effects of EMD [28]. By adding additional sample points at both ends of the signal, the length of the signal can be extended so that the envelope can fully encompass the underwater noise signal, thus reducing the influence of the end effects. At present, three main methods are widely employed to extend the boundaries of time series, as detailed in Table 1.
The use of signal expansion methods provides additional data for EMD, thereby enhancing the availability of data at the signal edges and reducing the impact of end effects. However, it is crucial to consider that ship motion in water, load conditions, engine and hull mechanical vibrations, and other factors contribute to non-stationary and non-Gaussian characteristics of noise signals. These factors introduce complexity, resulting in noise signals with multiple frequency components and diverse time domain characteristics. When supplementing signals using existing methods, such as zero-value signals, periodic or symmetrical signals, certain challenges may arise. Introducing zero-value signals can generate unreal spectrum components, leading to pseudo-features in decomposition results and affecting accurate analysis. Similarly, supplementing with periodic or symmetrical signals can compromise the signal’s original periodicity or symmetry, thereby reducing decomposition accuracy and feature extraction precision. These methods involve human intervention, introducing subjective factors that can influence the objectivity and reliability of decomposition results. Selecting an appropriate signal expansion method should align with the signal’s characteristics and application scenario to avoid unnecessary distortion or errors. Addressing the end effects problem of EMD remains an open question. In this paper, a peak cross-correlation method is proposed to intercept the most relevant data from the ship underwater noise signal itself to expand the original signal and mitigate the end effects. Supplementing self-similar signals with peak cross-correlation can obtain more real and accurate decomposition results, which has the following advantages: supplementing self-similar signals does not introduce external information, can better maintain the characteristics of the original signal, and avoid the influence of human intervention on the decomposition results. The addition of self-similar signals helps to maintain the continuity and smoothness of signals and can improve the accuracy and quality of decomposition results. Compared with other extension methods, the supplementary self-similar signal is more objective, not affected by subjective factors, and can better reflect the characteristics of the signal itself. Therefore, supplementing ship underwater noise signals with self-similar signals through peak cross-correlation represents a reliable and effective approach to enhance the reliability and accuracy of decomposition results.
The approach presented in this paper aims to identify the peaks of the ship’s underwater noise signal based on the peak principle, subsequently segmenting the data at these peaks. The principle of finding peaks can be expressed in mathematical language: In a segment of the ship underwater noise signal   y ( t ) , the peak of a signal is typically defined as a local maximum.
At a given time t i , if the following two conditions are met, it is considered that a peak exists at that moment y ( t i ) :
  • y ( t ) is greater than the amplitude of its adjacent moments, namely y ( t i ) > y ( t i 1 ) and y ( t i ) > y ( t i + 1 ) .
  • The peak y ( t i ) is greater than a predefined threshold, which is used to screen out the more obvious peak.
Therefore, the method employed in this study to locate peaks involves traversing the entire underwater noise signal of the ship and examining each moment to determine if it meets the aforementioned conditions. For the underwater noise signal of the ship, the first-order difference of each noise signal point is calculated, and the local maximum points that meet the conditions are identified as the peak of the noise signal. The maximum length of the cross-correlation signal is determined based on the length of the noise signal. In Section 4 of this paper, the length of the noise signal is set to 5000 data points, and the maximum length of the selected cross-correlation signal segment is set to 350 data points, ensuring that at least 10 peak positions are identified for each noise signal, as shown in Figure 2.
The peak position y ( t i ) in underwater noise signal y ( t ) is detected by the peak principle, and the minimum distance between the peaks is controlled by the shortest interval j :
If   y ( t i )   is   the   crest ,   then   y ( t i ) y ( t i - 1 ) j ,
where j is the shortest distance between two crests.
Set j = 50 ~ 350 , obtain the peak position B 1 ( i 1 ) under each shortest interval condition according to the wave peak principle, and extract the signal fragment g 1 ( i 1 , 1 : j + 1 ) with length j starting from the peak position, that is, the first contrast signal fragment:
g 1 ( i 1 , 1 : j + 1 ) = y [ B 1 ( i 1 ) : B 1 ( i 1 ) + j ] ,
where the value of i 1 ranges from 1 to the number of wave peaks under this condition. Equation (2) represents the interception of the B 1 i 1 to the B 1 ( i 1 ) + j th data in the underwater noise signal y ( t ) saved in g 1 ( i 1 , 1 : j + 1 ) .
The wave peak signal segment g 1 is converted into cell matrix D 1 = C 1 = g 1 , and the correlation number a 1 between each pair of wave peak signal segments g 1 is calculated. The normalized correlation [29] between D 1 and C 1 is calculated as in Equation (3):
a 1 ( z ) = n = 0 J 1 1 ( D 1 ( n ) μ D 1 ) ( C 1 ( n + τ ) μ C 1 ) n = 0 J 1 1 ( D 1 ( n ) μ D 1 ) 2 n = 0 J 1 1 ( C 1 ( n + τ ) μ C 1 ) 2 μ D 1 = 1 J 1 n = 1 J 1 1 D 1 ( n ) μ C 1 = 1 J 1 n = 1 J 1 1 C 1 ( n )
where J 1 is the signal length of the cell matrices D 1 and C 1 , and τ is the time delay, taken as 1.
For each minimum interval distance j , find the maximum phase relation value e 1 j 50 , : for each row in the correlation number matrix a 1 :
e 1 ( j 50 , : ) = m a x ( a 1 ,   [ ] , 2 ) ,
where Equation (4) means that all maximum values in the second dimension (column) of the correlation coefficient matrix a 1 are extracted and stored in e 1 j 50 , : . The number 2 represents the second dimension (column) of the matrix.
Then, calculate the mean of the maximum cross-correlation values m 1 for all the shortest interval distances j :
m 1 = mean ( e 1 , 2 ) ,
where mean ( ) is the calculation of the mean value of the mutual relation number.
Finally, by comparing all m 1 values, select the peak interval length u 1 corresponding to the maximum value:
[ max _ value , p 1 ] = m a x ( m 1 ) ,
where p 1 denotes the number of positions corresponding to max_value; p 1 + 50   is the best peak interval length u 1 .
The optimized peak interval length is obtained by the above calculation. According to the peak principle, find the peak position B 2 ( i 2 ) under the condition of optimized peak interval length u 1 , and extract the first wave peak signal fragment g 2 i , 1 : u 1 + 1 :
g 2 ( i 2 , 1 : u 1 + 1 ) = y [ B 2 ( i 2 ) : B 2 ( i 2 ) + u 1 ] ,
where Equation (7) represents the interception of the B 2 i 2 th to B 2 ( i 2 ) + j th data in the underwater noise signal y ( t ) is stored in g 2 ( i 2 , 1 : j + 1 ) .
The optimized wave crest signal fragment g 2 is converted into cell matrix D 2 = C 2 , and the correlation matrix a 2 is calculated:
a 2 ( z ) = n = 0 J 2 1 ( D 2 ( n ) μ D 2 ) ( C 2 ( n + τ ) μ C 2 ) n = 0 J 2 1 ( D 2 ( n ) μ D 2 ) 2 n = 0 J 2 1 ( C 2 ( n + τ ) μ C 2 ) 2 μ D 2 = 1 J 2 n = 1 J 2 1 D 2 ( n ) μ C 2 = 1 J 2 n = 1 J 2 1 C 2 ( n )
where J 2 is the signal length of the cell matrices D 2 and C 2 , and τ is the time delay, taken as 1.
The maximum correlation value q 2 of each row in the correlation number matrix a 1 is obtained by Equation (9). The maximum value of the correlation coefficient and the corresponding number of positions are extracted using Equation (10), in which e 2 denotes the maximum value of the correlation coefficient and r 2 denotes the number of wave positions corresponding to e 2 .
q 2 = m a x ( a 2 ,   [ ] , 2 )
[ e 2 , r 2 ] = m a x ( q 2 ( 2 : e n d ) , [ ] , 1 ) ,
where Equation (9) represents the extraction of all the maximum values in the second dimension (columns) of the correlation number matrix a 2 saved in q 2 . The number 2 in Equation (9) represents the second dimension (column) of the matrix. Equation (10) represents the extraction of the maximum value e 2 and its corresponding position r 2 in the second to last row of the first dimension (row) of the matrix q 2 .1 in Equation (10) denotes the first dimension (row) of the matrix.
In turn, the peak position B corresponding to the segment most similar to the first segment is calculated using Equation (11):
B = B 2 ( 1 , r 2 + 1 )     1 ,
where B 2 1 , r 2 + 1 denotes the number corresponding to the first row and the r 2 + 1 column of matrix B 2 . B denotes the peak position corresponding to the signal segment most similar to the first end of the underwater noise signal. B is the position of the crest of the first data point in segment b of Figure 3a.
The core of the peak cross-correlation principle is to calculate the correlation number between underwater noise signal segments by adjusting the optimal peak interval length and find the peak interval length that makes the maximum correlation number. This method ensures that the underwater noise signal segments have the strongest cross-correlation at the selected interval length. This method ensures that the underwater noise signal segments have the strongest cross-correlation at the selected interval length. As illustrated in Figure 3a, segment “a” represents the initial segment at the position of the first peak, segment “b” represents the signal segment most correlated with segment “a” found using peak correlation, and segment “I” between segments “a” and “b” represents the extension signal S e x p at the front end of the original signal. S e x p is multiplied by a mathematical function φ (Equation (29)) to extend it to the end of the underwater noise signal. The value of this function at the boundary of the original underwater noise signal is 1, gradually decreasing to 0 over time. The method for finding the extension signal at the end is the same as for the front end. The extended underwater noise signal based on the crest cross-correlation expansion model is shown in Figure 3b.
The extended signal x t of the underwater noise signal is processed by the peak cross-correlation principle, and it is processed by EMD. The flow chart of the EMD algorithm [30] is shown in Figure 4, that is,
r 1 ( t ) = x ( t ) , i = 1 , k = 0 ,
where x t is the extended signal of underwater noise signal y t after processing by the peak cross-correlation principle, and r i t is the residual signal, k is the number of iterations.
Setting up the initial IMF is as follows:
h i , k 1 t = r 1 t ,
where k = k + 1 .
Determine the local maximum and local minimum values of the initial IMF signal h i , k 1 t . The upper envelope X m a x ( t ) and lower envelope X m i n ( t ) of the signal are obtained by fitting the extreme points with the cubic spline function interpolation method. Average up and down packet routes are as follows:
M ( t ) = X m a x ( t ) + X m i n ( t ) 2
Subtract the average envelope M ( t ) from the initial IMF signal h i , k 1 t to obtain the remaining signal h i , k ( t ) . In general, for a stationary signal, h i , k ( t ) is the first IMF of the original extended signal x ( t ) .
h i , k ( t ) = h i , k 1 ( t ) M ( t )
For non-stationary signals, the signal is not monotonically increasing in a certain region, but there will be a turning point. If these inflection points, which can reflect the specific characteristics of the initial IMF signal h i , k 1 t , are not selected, the obtained first-order modal function is not accurate, that is, the usually obtained h i , k ( t ) does not meet the two conditions of IMF, so it is necessary to continue screening. Determine whether h i , k ( t ) meets the stop criteria and whether SD meets the condition SD = 0.2 0.3   [31]:
SD = t = 0 N 1 ( h i , k 1 ( t ) h i , k ( t ) ) 2 t = 0 N 1 h i , k 1 ( t ) 2
If the stop criterion condition is met, the i-th IMF is generated, and the residual signal r i + 1 ( t ) and the IMF count are updated.
IMF i ( t ) = h i ( t )
r i + 1 ( t ) = r i ( t ) IMF i ( t ) ,   k = 0 , i = i + 1
Check whether the residual signal r i + 1 ( t ) is a monotone signal. If yes, the decomposition ends. Otherwise, after letting r i ( t ) = r i + 1 ( t ) and then letting I = i + 1, return   r i ( t ) to Equations (13)–(18) above and continue the loop until the residual signal r i + 1 ( t )   is monotonic. The above steps are repeated until the signal r t becomes monotonous, no new IMF can be decomposed.
The final underwater noise extended signal x t can be expressed as the sum of all IMF and the final residuals r n t :
x ( t ) = i = 1 n IMF i ( t ) + r n ( t )

2.3. Noise Signal Feature Extraction and Recognition

In signal analysis, energy is a key feature; it describes the strength and power of the signal, reflects the total energy of the signal in the whole time domain, and can effectively reflect its overall strength. In contrast to the single time domain value, the highest-energy IMF usually contains the main noise source information, representing the high frequency and instantaneous variation of the part, which is often the key to distinguishing between different noise sources. Therefore, the main characteristics of underwater noise signals can be reflected more comprehensively. Existing relevant studies [16,32] showed that selecting the IMF with the highest energy and extracting its relevant features has significant advantages in signal classification tasks, especially in the complex underwater noise environment, which can provide higher robustness and classification accuracy. These results have been verified in multiple application scenarios, further proving the rationality of taking the IMF with the highest energy as the research object of feature extraction. Therefore, this study chooses to extract the MPE features of the IMF with the highest energy by comparing different levels of IMF energy so as to ensure that the most representative patterns and features in the signal are captured. The underwater noise signal is decomposed into IMFs by using the IEMD method proposed in this paper, where each IMF represents a different frequency component in the signal. The energy formula [33] is used to calculate the energy of IMFs, and the IMF with the highest energy is selected through this step. Because the IMF with the highest energy often represents the most significant component of the signal, it can effectively reflect the main information related to the characteristics of the target.
E = I M F ( t ) 2 d t
The IMF-PE and IMF-MPE characteristics of underwater ship noise signals are analyzed by combining signal energy and permutation entropy. Initially, the IMF category with the highest energy is determined by the energy formula. This IMF data are converted into a permutation sequence, and the probability distribution of different permutations is calculated to evaluate the complexity of the signal. Subsequently, the IMF signal with the highest energy is divided into disjoint sub-sequences. The arrangement order of samples within each subsequence forms a new permutation sequence, and the entropy of this sequence is calculated [34]. The fundamental principles are as follows:
(1)
A phase space reconstruction is carried out for an IMF signal ( x ( t ) ) whose group length is N , and the matrix Y is obtained as follows:
Y = x   ( 1 ) x   ( 2 ) x   ( 3 ) x   ( 2 ) x   ( 3 ) x   ( 4 ) x   ( 3 ) x   ( 4 ) x   ( 5 ) x   ( K ) x   ( K + 1 ) x   ( K + 2 ) ,
where K = N + ( m 1 ) t , m is the embedding dimension, m = 3 ; t is the delay time, t = 1 [35]. In this paper, the length N of IMF is 5000. Each row in the matrix Y is a reconstruction component, and there are K reconstruction components.
(2)
Rearrange each reconstructed component in ascending order, obtaining a new sequence where the column indices of each data position in the vector form a new sequence. There is a total of m ! different sequences mapped in the m -dimensional phase space: S ( l ) = j 1 , j 2 , , j m , l = 1,2 , , k , and   k m !
(3)
Calculate the occurrence frequency of each sequence and divide it by the total occurrences of the m different symbol sequences, yielding the probability of each sequence occurrence: P 1 , P 2 , , P k .
(4)
The formula for calculating the permutation entropy of the energy-optimal IMF obtained from the enhanced EMD method with peak cross-correlation for underwater ship noise signals is as follows:
h p e = j = 1 k P j l n ( P j )   ,
where h p e represents the unnormalized permutation entropy; P j is the probability of occurrence of different signal time series.
(5)
The maximum value of the permutation entropy is l n ( m ! ) , and the permutation entropy is normalized, that is,
0     H p e = h p e ln m !   1
The magnitude of the permutation entropy value indicates the randomness of the underwater ship noise signals of this class: the smaller the entropy value, the simpler and more regular the signal; conversely, the larger the entropy value, the more complex and random the signal over time.
Considering that ship underwater noise signals are affected by many factors such as marine environments and terrain, they have nonlinear, non-stationary, and non-Gaussian characteristics. In order to extract its features more accurately, MPE is further constructed. Firstly, the energy-optimal IMF signals obtained from decomposition are subjected to multi-scale decomposition. Then, the PE of each scale subsequence is calculated, thereby describing the complexity of underwater ship noise signals from multiple dimensions [16]. The specific calculation process is as follows:
(1)
The IMF signal X = x i , i = 1,2 , , N of length N is subjected to coarse-graining to obtain the multi-scale decomposition sequence y   j s :
y j s = 1 s i = ( j 1 ) s + 1 j s x i ,
where s represents the scale factor; 1 j   [ N / s ] , [ N / s ] indicates rounding; y s is the subsequence under scale s .
(2)
Sequence reconstruction is performed for y j s (calculating permutation entropy): Y l s = y l s , y l + τ s , , y l   +   ( m 1 ) τ s , where y l s represents the component of the l reconstruction; m is the embedding dimension; τ is the delay time.
(3)
Arrange each component in Y l s in ascending order to obtain:
S ( g ) = j 1 , j 2 , , j m ,
where g = 1,2 , , k , a n d   k m ! .
There is a total of m ! different permutations in S ( g ) , but the probability of arranging them in ascending order is one of the m ! possibilities. Calculating the probability of occurrence for each symbol sequence: P g = P 1 , P 2 , , P k ,   g = 1 k P g = 1 .
(4)
The formula for calculating the MPE of the energy-optimal IMF signal X = x i , i = 1,2 , , N is shown in Equation (26).
h p = g = 1 k P g l n ( P g )
MPE enables the analysis of these factors at different time scales, thereby obtaining more comprehensive information. Compared with traditional PE, MPE enhances the accuracy and robustness of analyzing underwater ship noise signals, thereby improving the reliability of ship status assessment and issue detection. Combining the IEMD method based on the peak cross-correlation principle proposed in this paper to decompose underwater ship noise signals and extract the MPE features of the IMF with the highest energy, analysis of ships can be conducted by analyzing the MPE values. Generally, higher entropy values generally indicate greater randomness or complexity and lower predictability of the noise signal, whereas lower entropy values suggest stronger signal regularity. Additionally, noise signals from different ship types exhibit varying frequency components and complexities. These variations in entropy values can distinguish between different sources of underwater ship noise signals.
To evaluate the method’s effectiveness in distinguishing ship noise signals, it is crucial to assess whether IEMD-MPE consistently reflects the intrinsic characteristics and differences among the three distinct noise signals. Key evaluation metrics include similar permutation entropy for noise signals from the same ship type, significantly different MPE for noise signals from different ship types, and stable entropy calculation results.

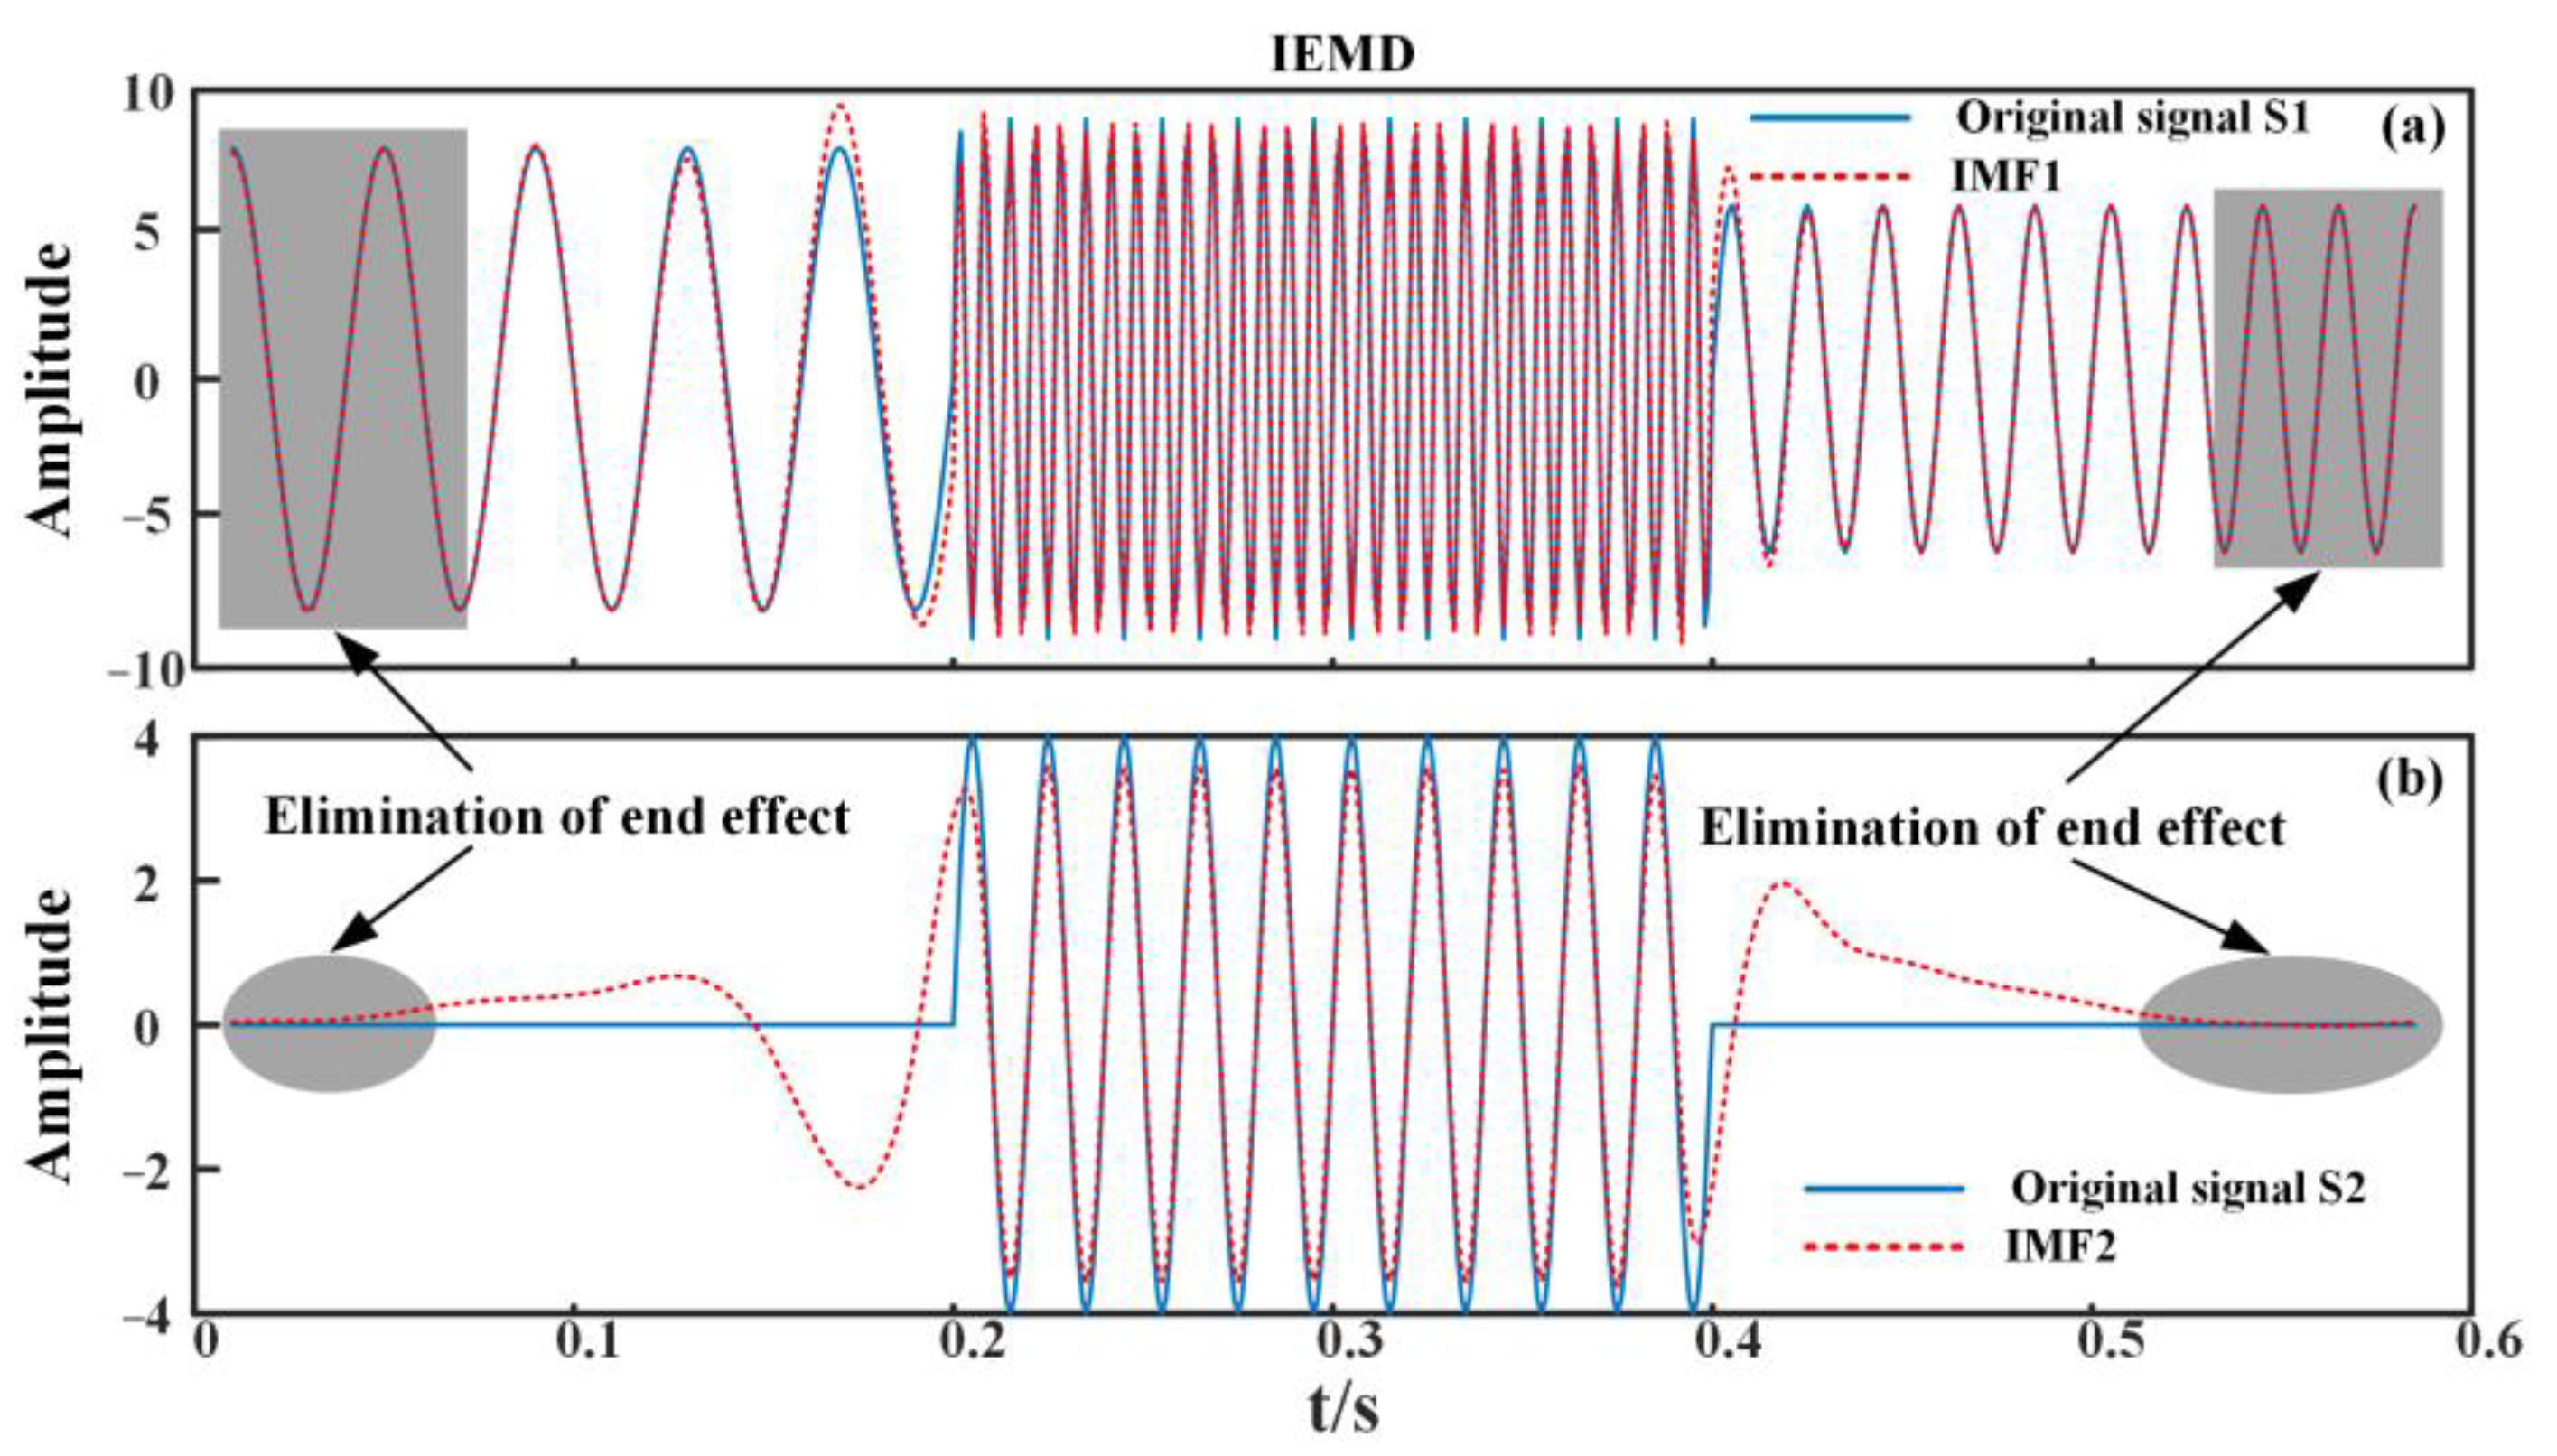
3. Validation of EMD Method with Peak Cross-Correlation

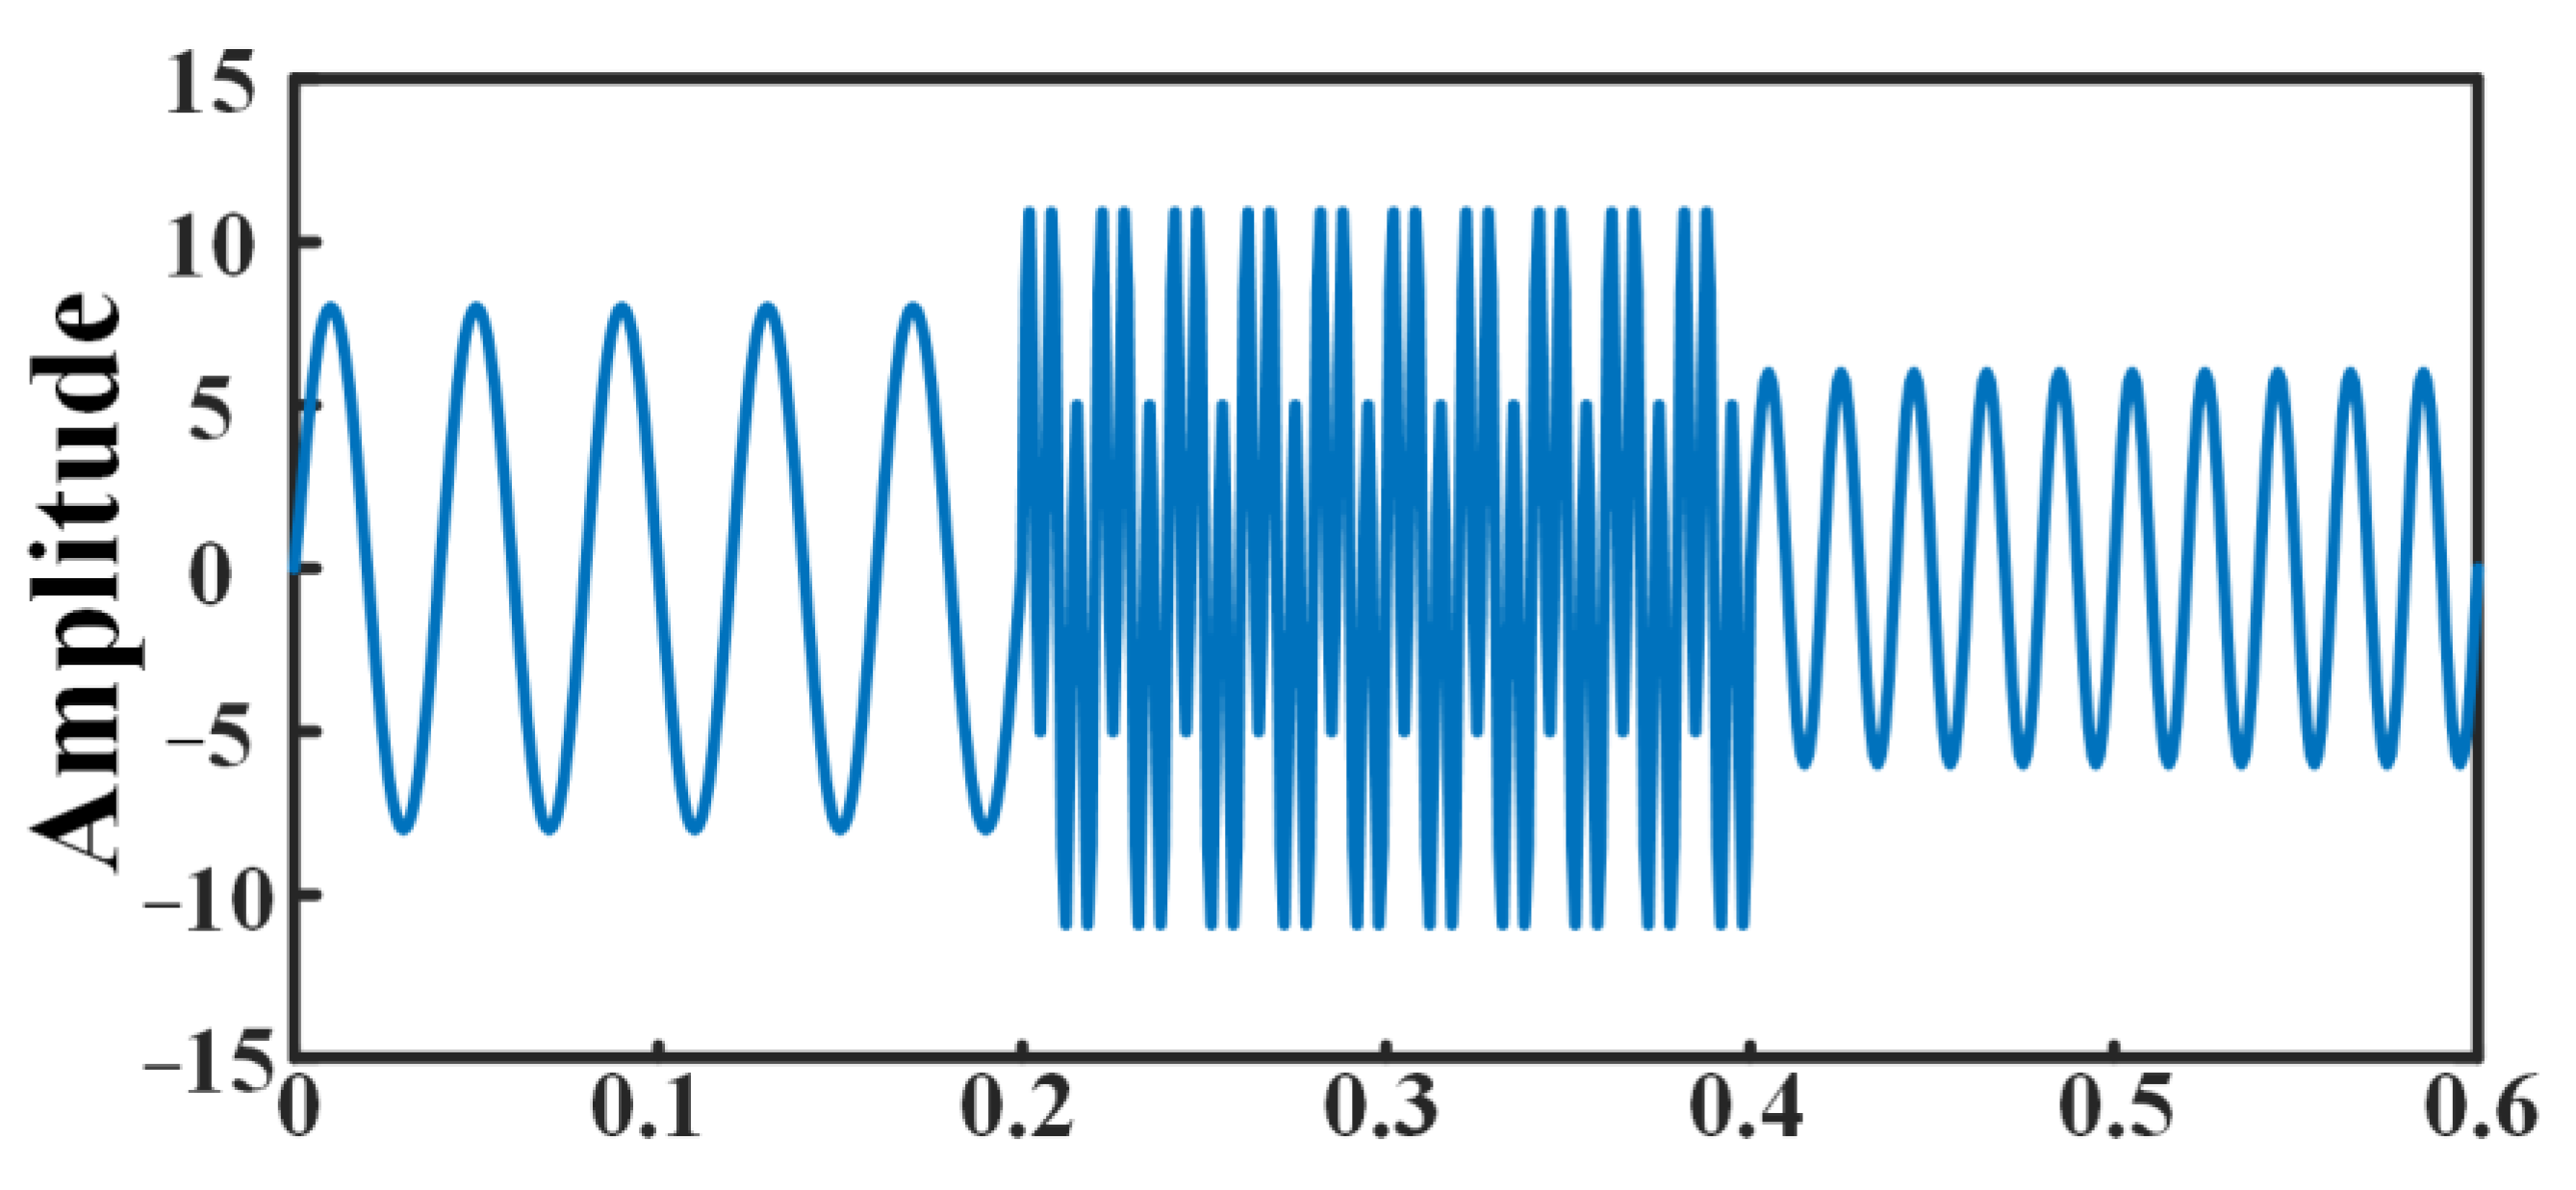
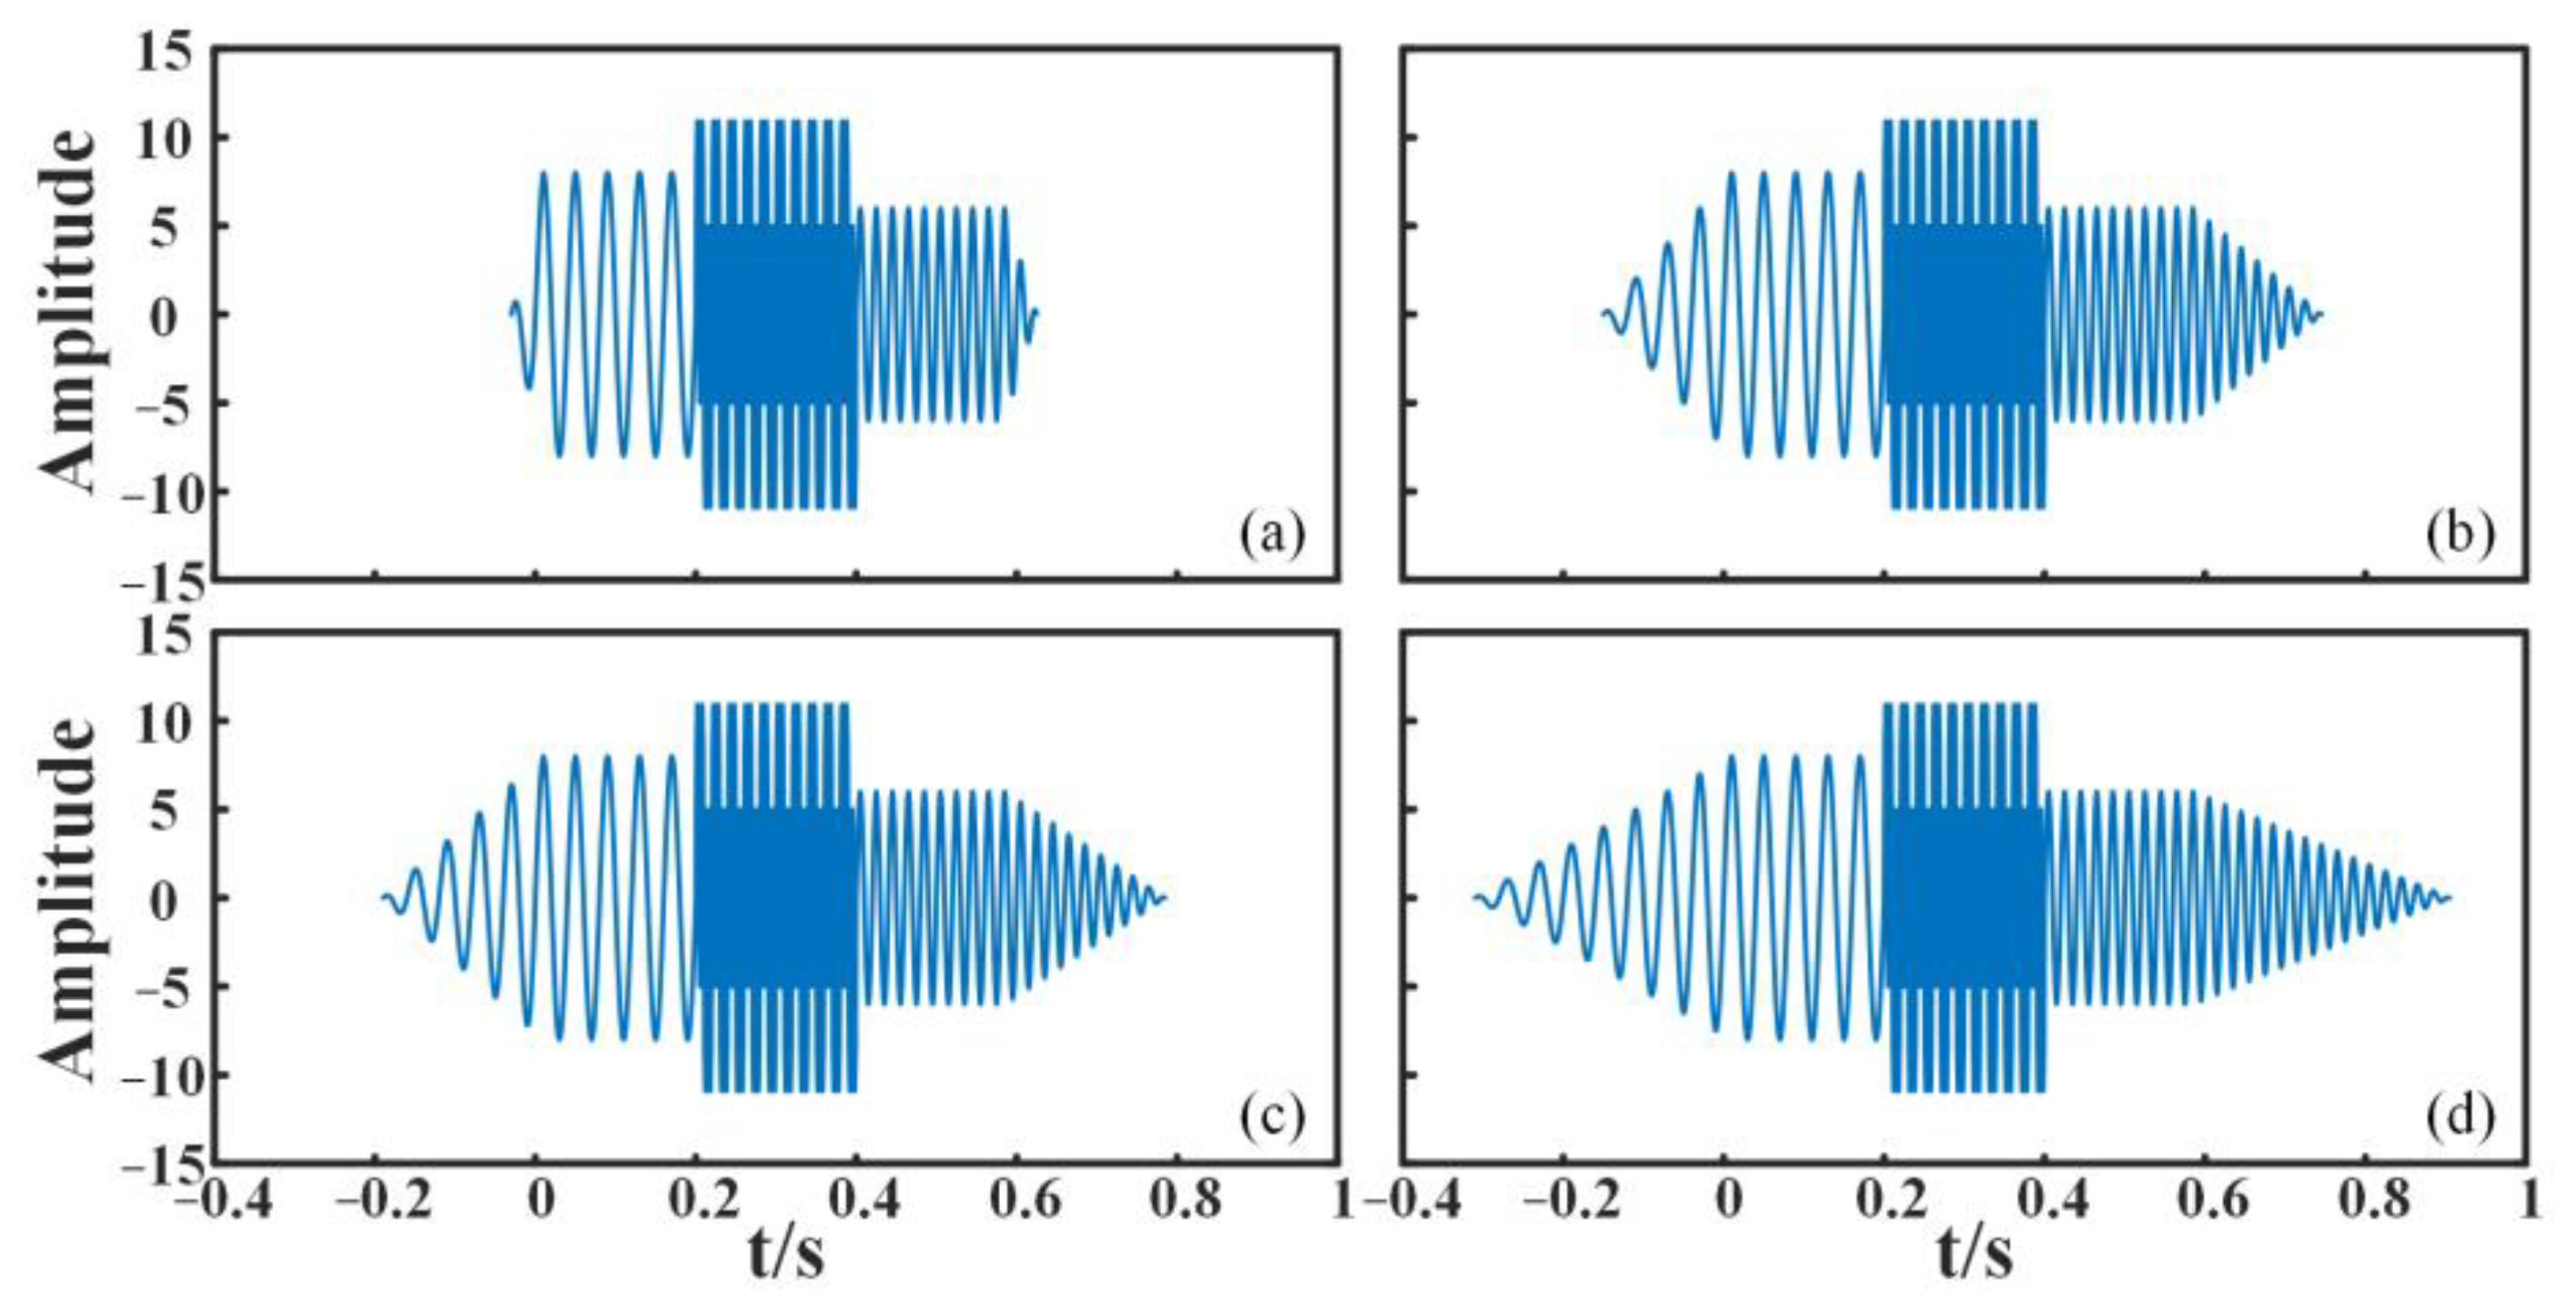
3.1. Analog Signal Verification

In order to verify the effectiveness of IEMD in eliminating the end effects of the EMD algorithm, as well as the validity of the decomposition results, an analogue signal was chosen for this paper. Analog signals can be precisely defined in a computer environment, allowing complete control of the signal and ensuring uniformity of experimental conditions and reproducibility of results. Since the analogue signal does not contain any real noise, the interference of noise can be excluded, and the analysis of the processing effect of the IEMD algorithm can be focused on, and its performance in eliminating the end effects can be clearly and intuitively verified. At the same time, the differences between traditional EMD and IEMD are compared through the simulated signals, providing a benchmark for optimizing and adjusting the algorithm parameters. For real ship underwater noise signals, it is impossible to determine the accuracy of the decomposed IMFs, so the choice of analogue signals is a necessary choice for the experimental design.
Specifically, in this section, the EMD and IEMD methods are used to decompose the constructed analogue signal S t = S 1   ( t ) + S 2   ( t ) . The IMFs obtained from the two methods are then compared with S 1   t ,     S 2 ( t ) for analysis. Figure 5 is the original signal, and Figure 6 is the EMD result of the original analog signal.
S ( t ) = 8   sin ( 50 π t )   0 t 0.2 4   sin 100 π t + 9   sin 300 π t   0.2 t 0.4 6   sin 100 π t   0.4 t 0.6
S 1 ( t ) = 8   sin 50 π t   0 t 0.2 9   sin 300 π t   0.2 t 0.4 6   sin 100 π t   0.4 t 0.6
S 2 ( t ) = 0         0 t 0.2 4   sin 100 π t 0.2 t 0.4 0   0.4 t 0.6
Near the boundaries of the EMD decomposition results (especially for IMF2), significant differences are observed due to end effects, as indicated by the light gray shading in Figure 6. Moreover, throughout the decomposition process, end effects from preceding IMFs exert a pronounced influence on subsequent IMFs, propagating from the boundary regions towards the signal’s center. Although the end effects of the EMD method are localized, their influence may permeate throughout the depth of the studied signal, thereby affecting the decomposition results globally.
According to the principle of peak cross-correlation to find the extended signal segment, multiply the extended signal segment with the φ function to obtain the extended analogue signal. As shown in Figure 7, the extended signals of different times of similar signals are expanded. Figure 8 shows the results of the IEMD decomposition of the extended signal in Figure 7. Comparison of the results shows that the end effect is best eliminated when the length of the extended signal segment is five times the length of the most similar signal segment. Notably, in Equation (30), the function φ is assumed to be linear.
φ = 1 L 1 ( t t 1 + L 1 ) t 1 L 1 t t 1 1 t 1 t t N 1 L 2 ( t t N + L 2 ) t N L 2 t t N
where L 1 is the length of the signal supplemented before the first segment, L 2 is the length of the signal supplemented after the tail end, t 1 is the time corresponding to the first wave peak of the noise signal, and t N is the time corresponding to the last wave peak of the noise signal.
The best results are analyzed; Figure 9 illustrates the comparison between the original simulated signal and the IMFs extracted using the IEMD algorithm improved through peak cross-correlation, as proposed in this paper. Observing the dark gray shaded areas in the figure reveals that the end effects in the decomposition results of the IEMD algorithm are significantly reduced compared with the unimproved EMD algorithm. In Figure 9a, IMF1 closely matches the original simulated signal S1, with complete elimination of end effects. Figure 9b demonstrates noticeable improvement in reducing end effects for IMF2. In summary, the method proposed in this study effectively mitigates end effects in the EMD algorithm, yielding optimal results and validating the efficacy of the IEMD method.

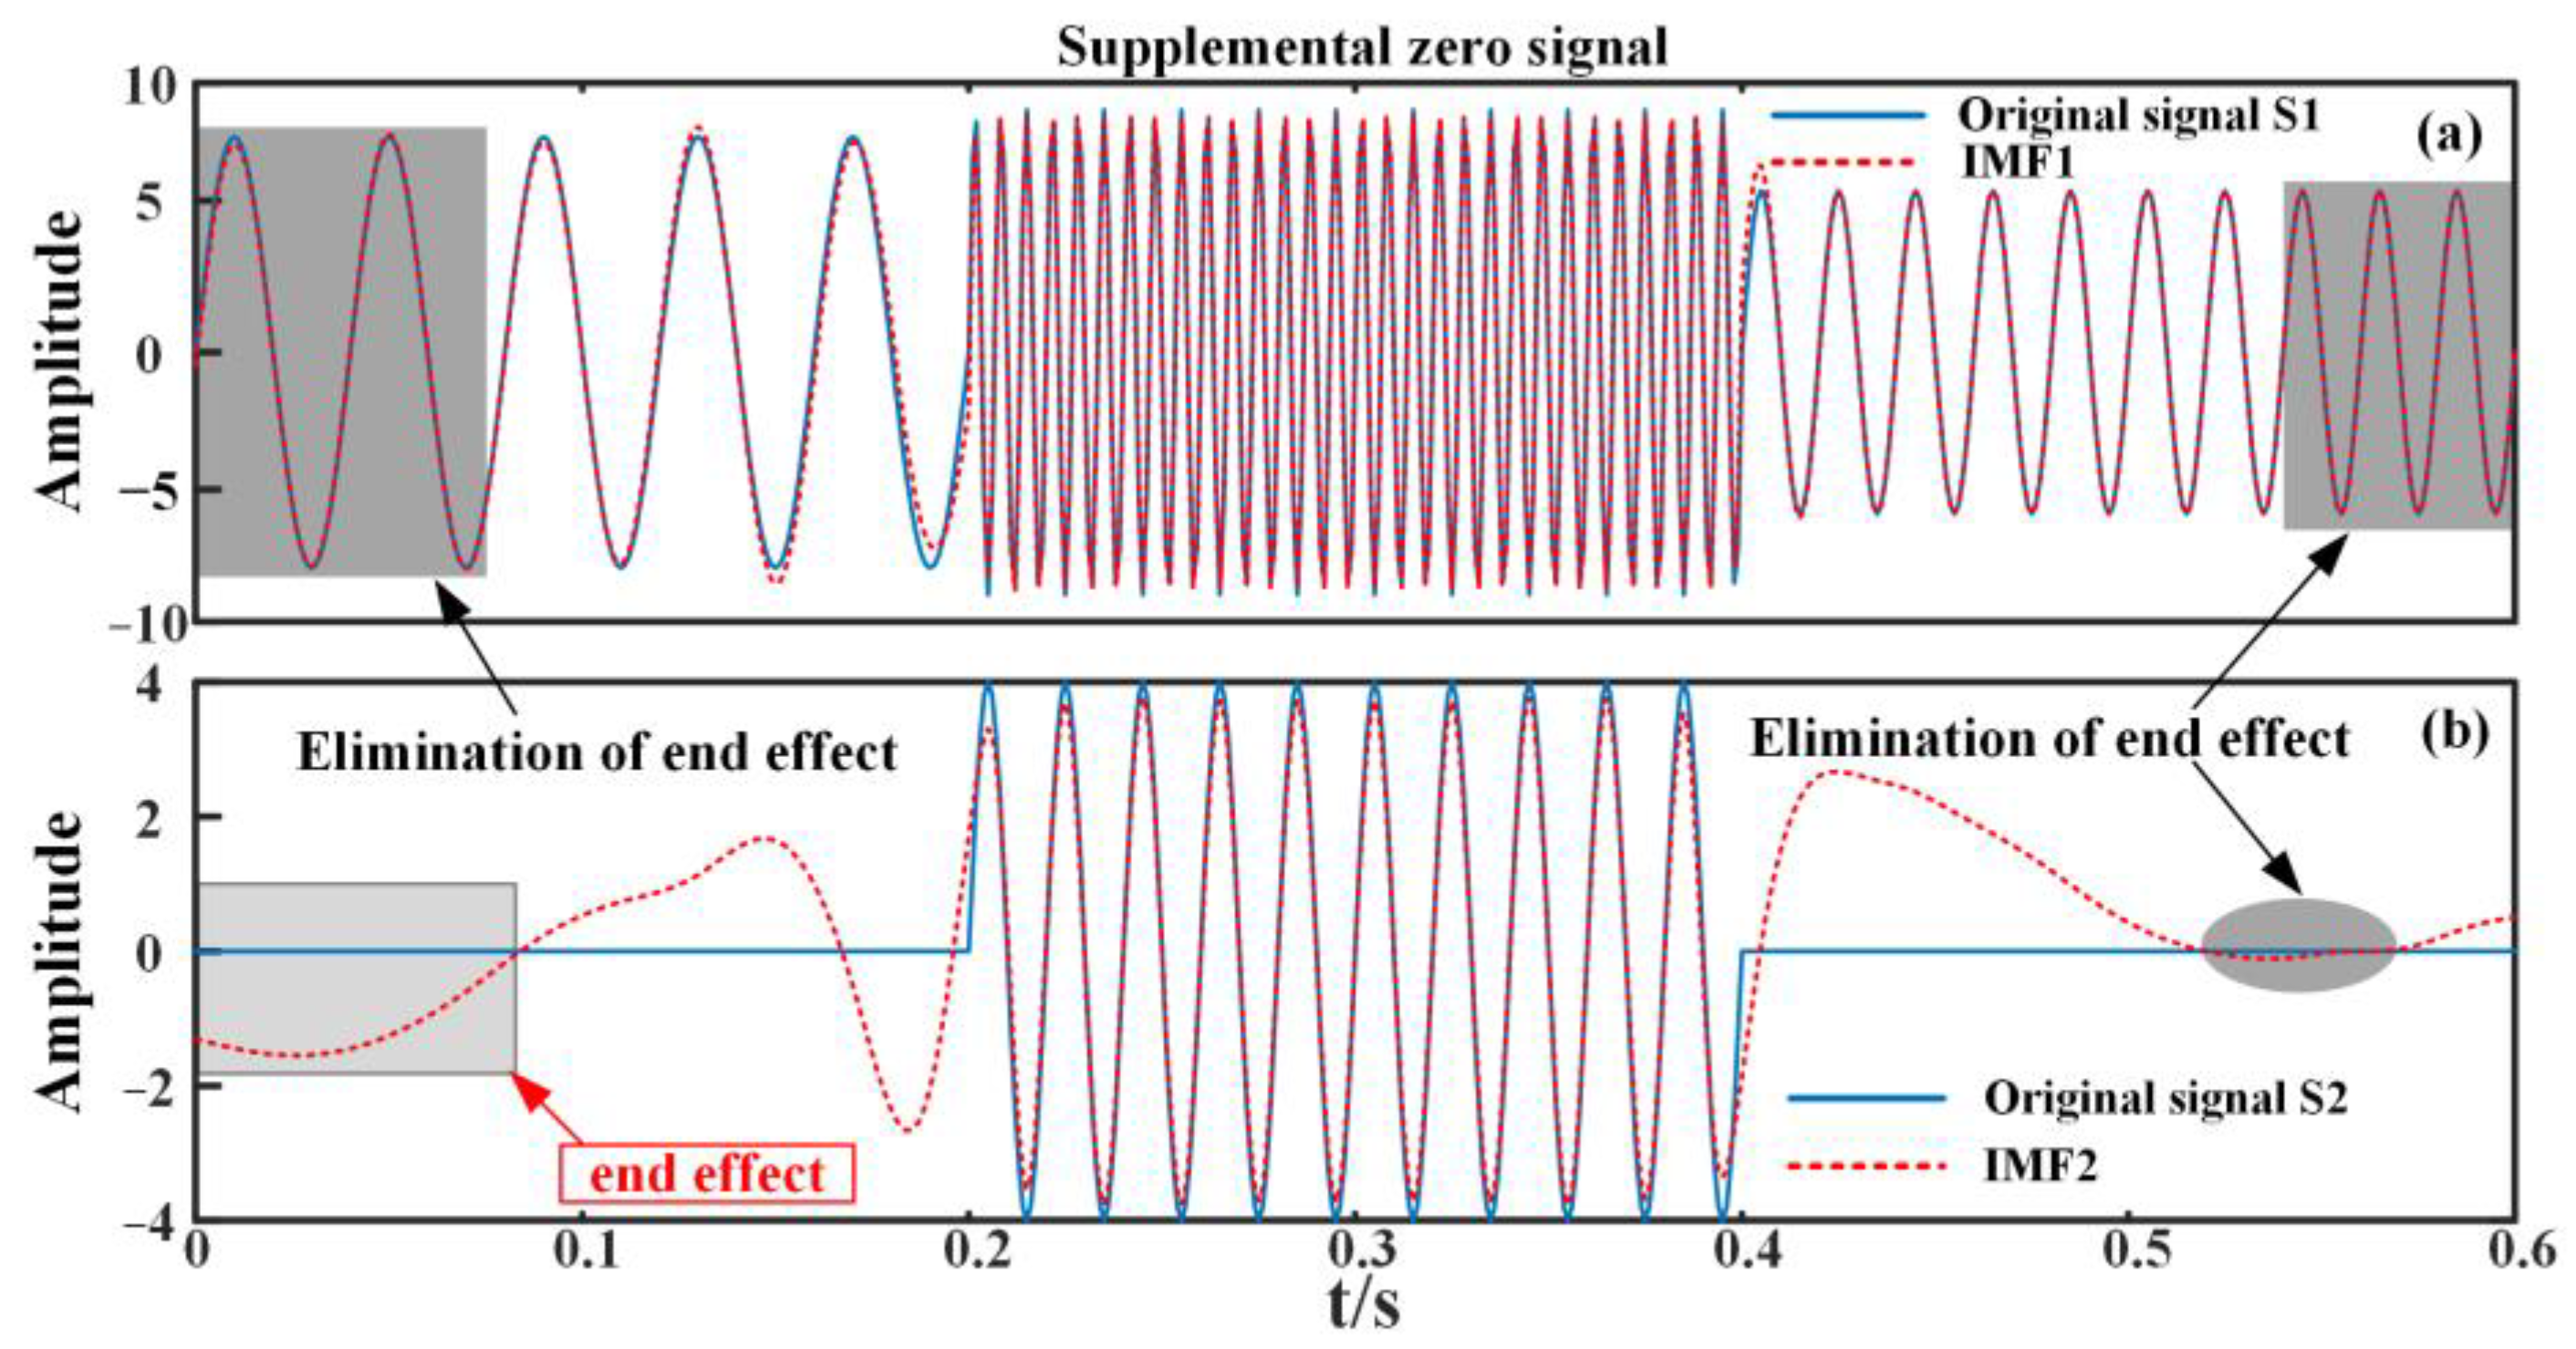
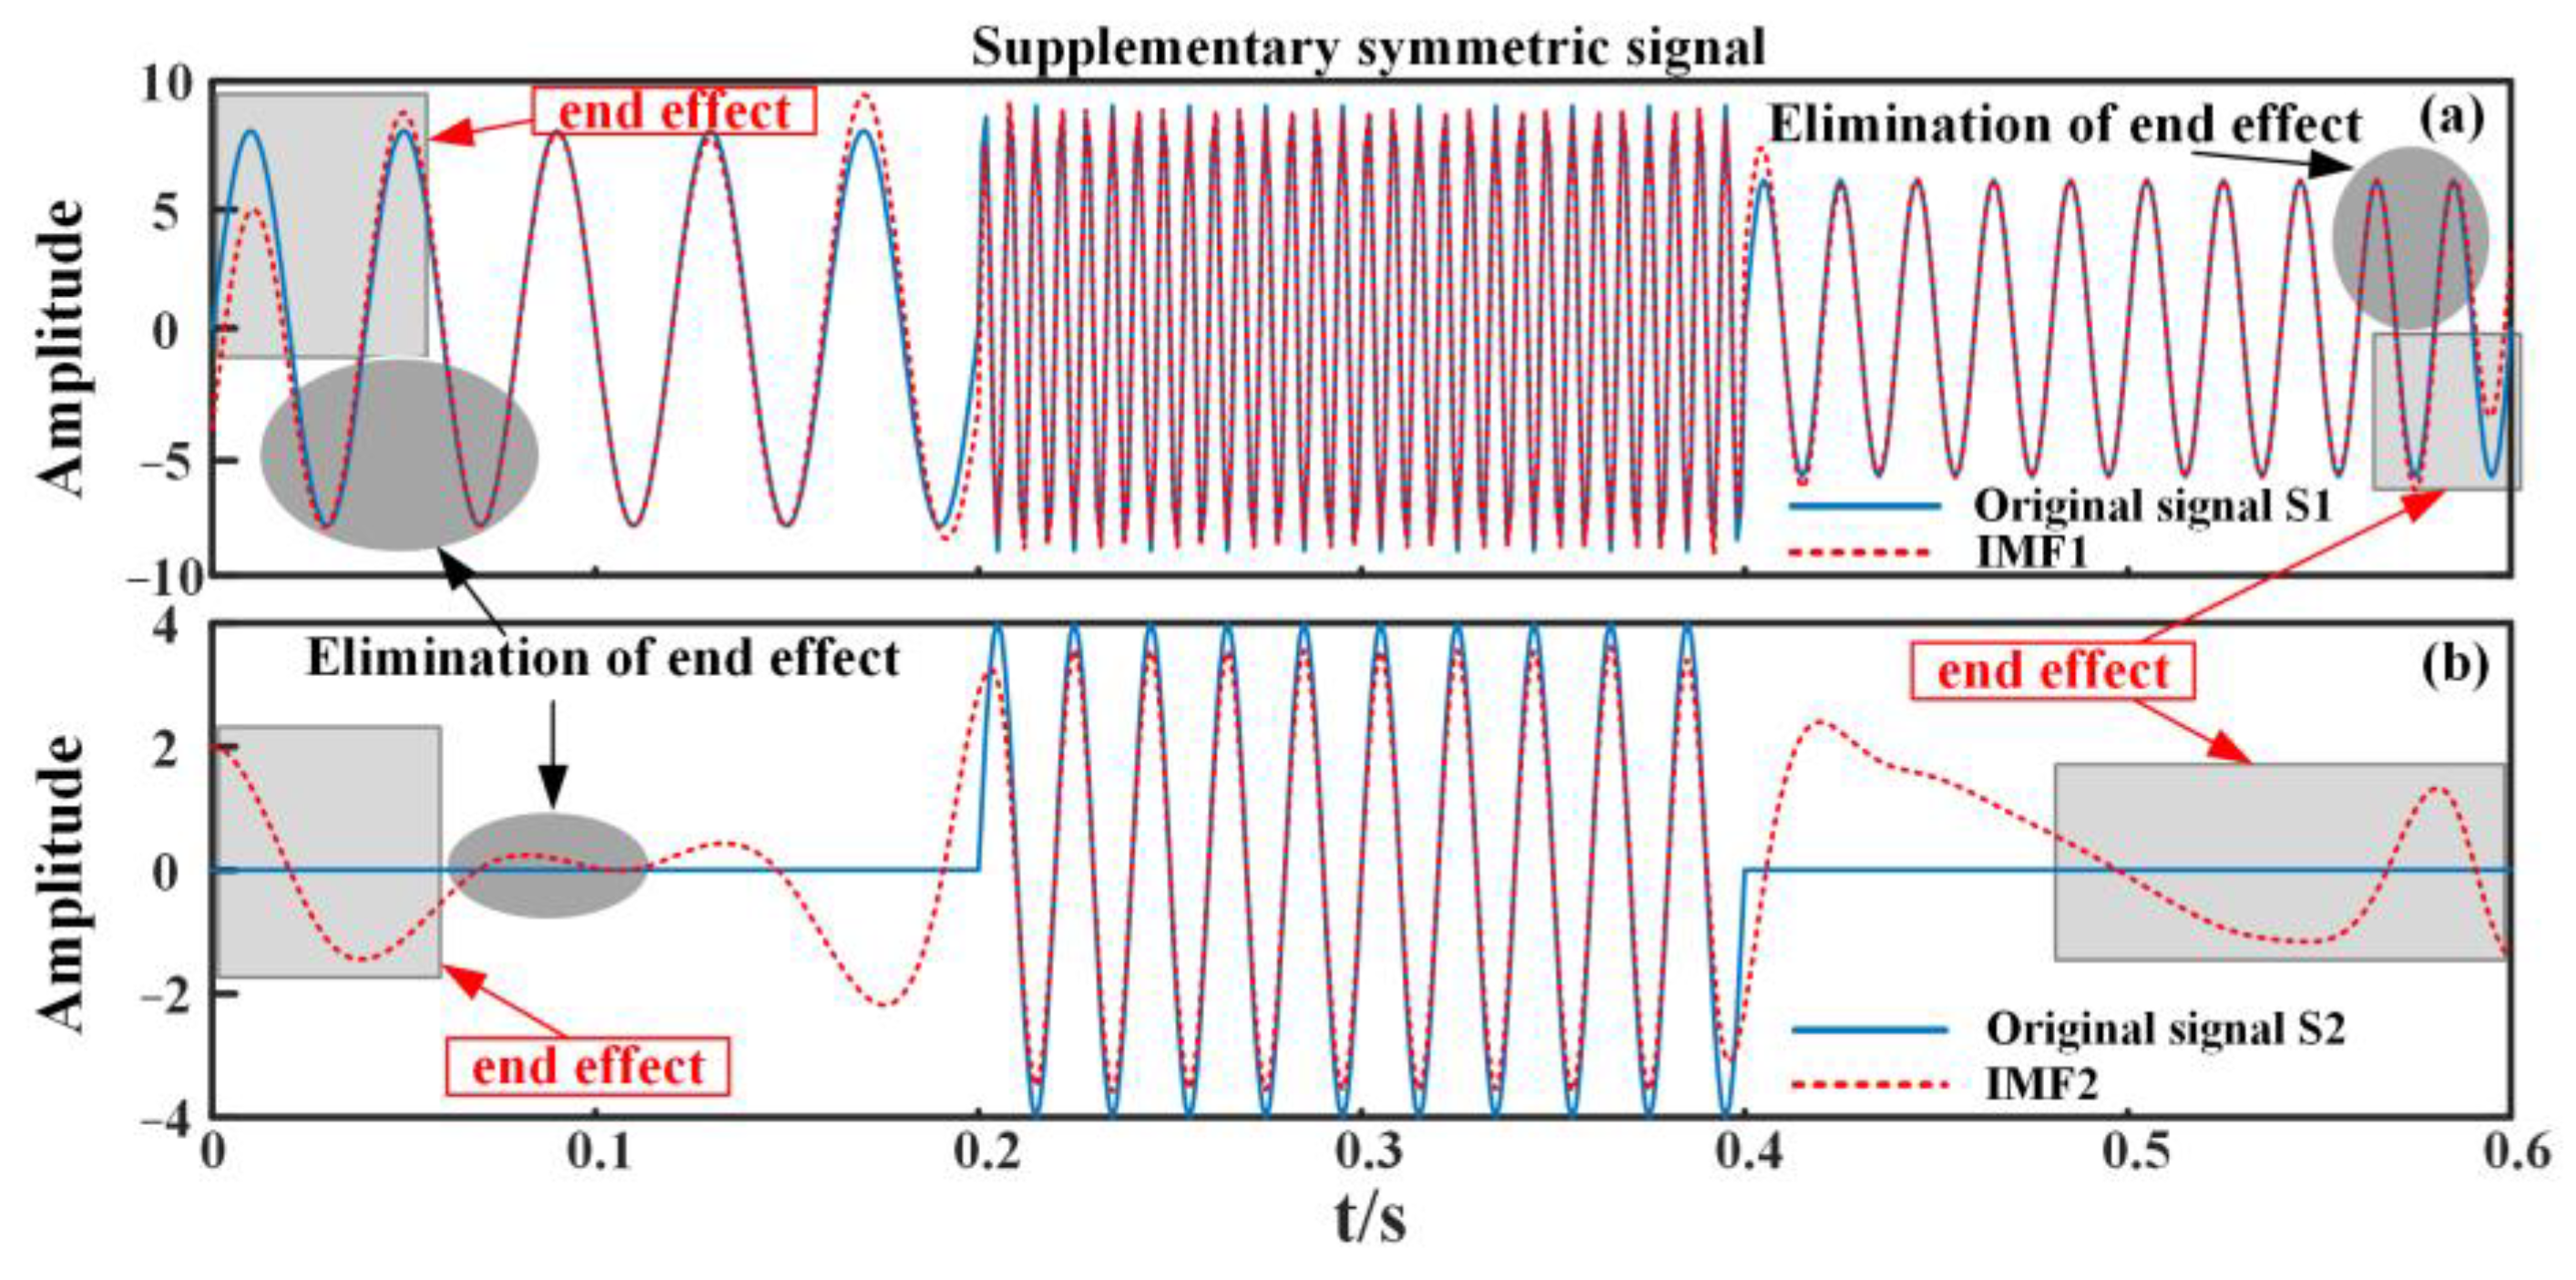
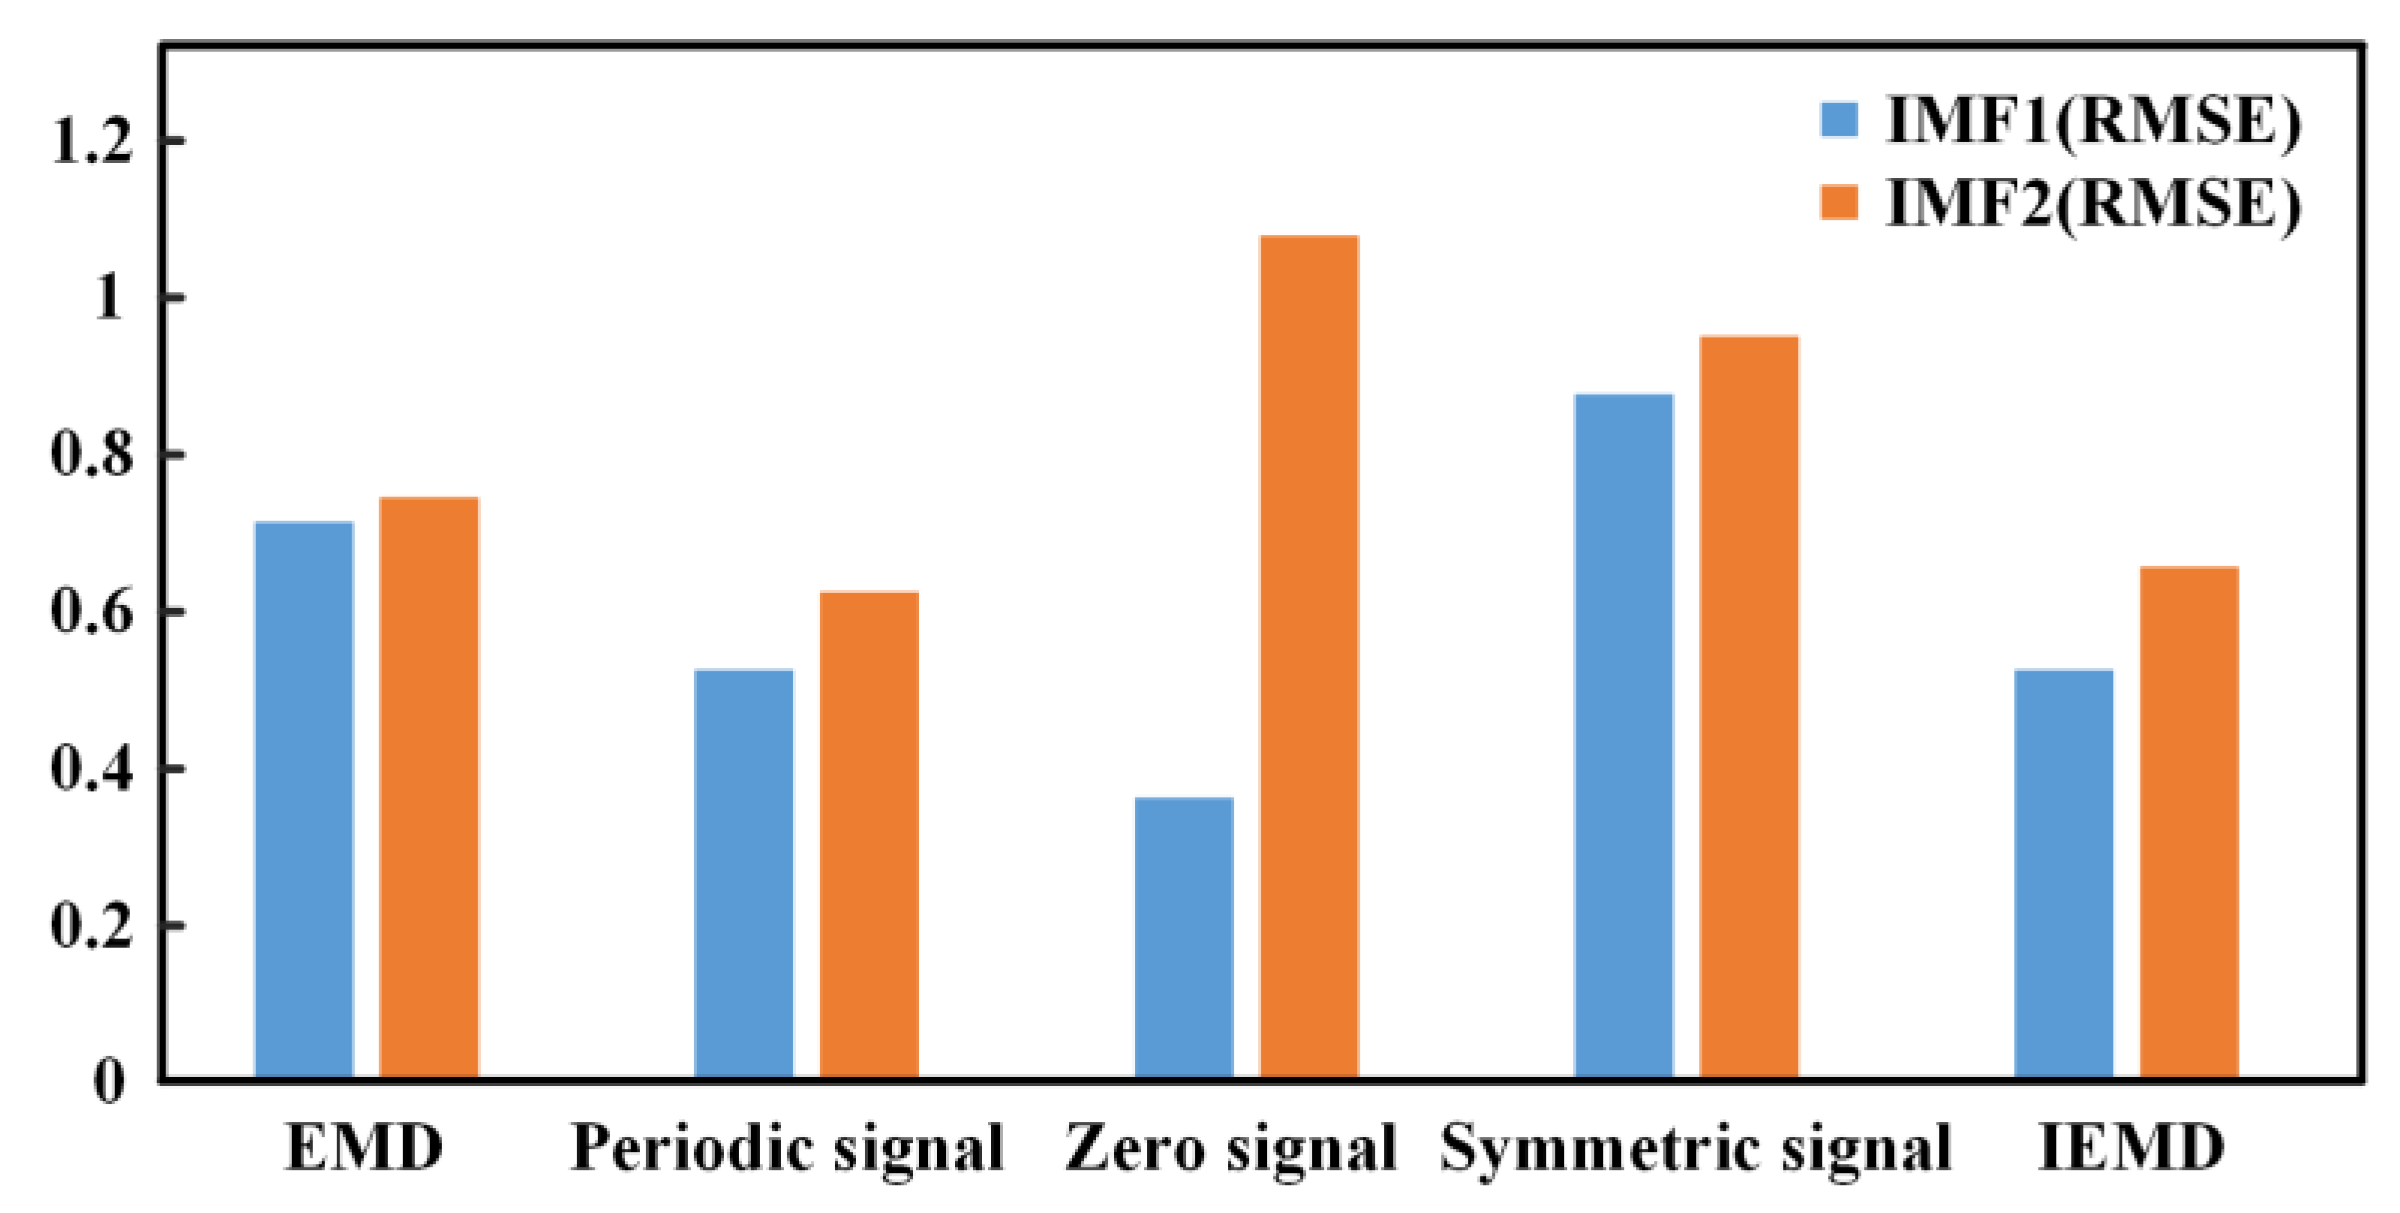
3.2. Comparison of IEMD with EMD Based on Other Expansion Methods

Comparison between the IEMD using the peak cross-correlation method and EMD employing other expansion methods involves assessing decomposition outcomes. Specifically, the results from the extended and enhanced EMD methods, including supplementary zero, symmetric, and periodic signals as previously mentioned, are contrasted with those from the peak cross-correlation-enhanced EMD method proposed in this study.
Comparison of the three enhanced methods with the original analog signals reveals that supplementing periodic signals yields the most effective results. In Figure 10a, the dark grey shaded area representing IMF1, decomposed using the zero-value supplementation method, closely aligns with the original analog signal S1, effectively eliminating end effects. But in Figure 10b, the end effects of the light grey shadow part are more obvious, and there is no elimination effect. In Figure 11, only part of the end effects are improved by supplementing the symmetrical signal, and the overall end effects are still obvious. Extending periodic signals to both ends of the original simulated signal proves most effective in eliminating end effects, with Figure 12b showing only minor residual end effects in the light grey shaded area near the front end. However, most of the underwater ship noise signals are not periodic, and the end effects cannot be eliminated by extending the periodic signal. The reason why the results of the three methods compared still suffer from the end effects is that the introduction of zero-value signals, symmetric signals, and periodic signals all requires manual intervention, which can produce unrealistic spectral components and destroy the original characteristics of the signals, leading to pseudo-characteristics in the decomposition results and affecting the accuracy of the analyses. In contrast, the IEMD method proposed in this paper, which is based on the extended model of the wave intercorrelation principle, is more effective than the traditional method in mitigating the end effects.

3.3. Criteria for Evaluation

To quantitatively describe the effectiveness of the IEMD method based on peak cross-correlation enhancement proposed in this paper, a comparative analytical evaluation of this method and other improved methods is carried out by means of the root mean square error (RMSE) method.
REMS is the square root of the ratio of the square of the deviation between the predicted value and the true value to the number of observations n. In practical measurements, the number of observations n is always finite, and the true value can only be replaced by the most reliable (best) value. Therefore, the RMSE is used to measure the deviation between the decomposed IMF and the true value. The RMSE quantifies whether the IMF generated by the EMD decomposition matches the true data or not. The smaller the RMSE value, the higher the degree of matching between the two signals. The formula for the RMSE is shown in Equation (31).
R M S E ( I M F ( t ) , S ( t ) ) = t = 1 T ( I M F ( t ) S ( t ) ) 2 T
where T is the length of time of the original signal.
The RMSE between the decomposition results of the above four improved methods and the unimproved EMD algorithm and the original analog signal was calculated and evaluated. The calculation results are shown in Table 2.
The RMSE results of the five methods are visualized in Figure 13 and Table 2 to compare the decomposition effectiveness of four improved methods with the original EMD method. The RMSE between the two IMFs obtained by the method enhancing EMD through supplemental periodic signal extension shows the smallest value, indicating the highest degree of similarity to the original analog signal and the most favorable outcomes. However, this method is only suitable for periodic signals and not applicable to signals with non-stationary characteristics like ship radiation noise. Among the methods, decomposing IMF1 using the zero-value supplementation method yields the best result with the smallest RMSE and highest fidelity to the original signal. Conversely, the RMSE for IMF2 from this method increases, indicating poorer matching. Moreover, as observed from Figure 11 and RMSE analysis, supplementing symmetrical signals does not effectively mitigate end effects.
In contrast, the IEMD method using peak cross-correlation for signal extension achieves better alignment with the original analog signal compared with the unimproved method, without being limited to periodic signals. In summary, the IEMD method proposed in this paper offers enhanced decomposition capabilities for ship-radiated noise with non-stationary characteristics, demonstrating that peak cross-correlation signal extension improves EMD effectiveness and optimizes end effects.

4. Based on the Method Proposed in This Paper, the Extraction of Characteristics from Underwater Ship Noise

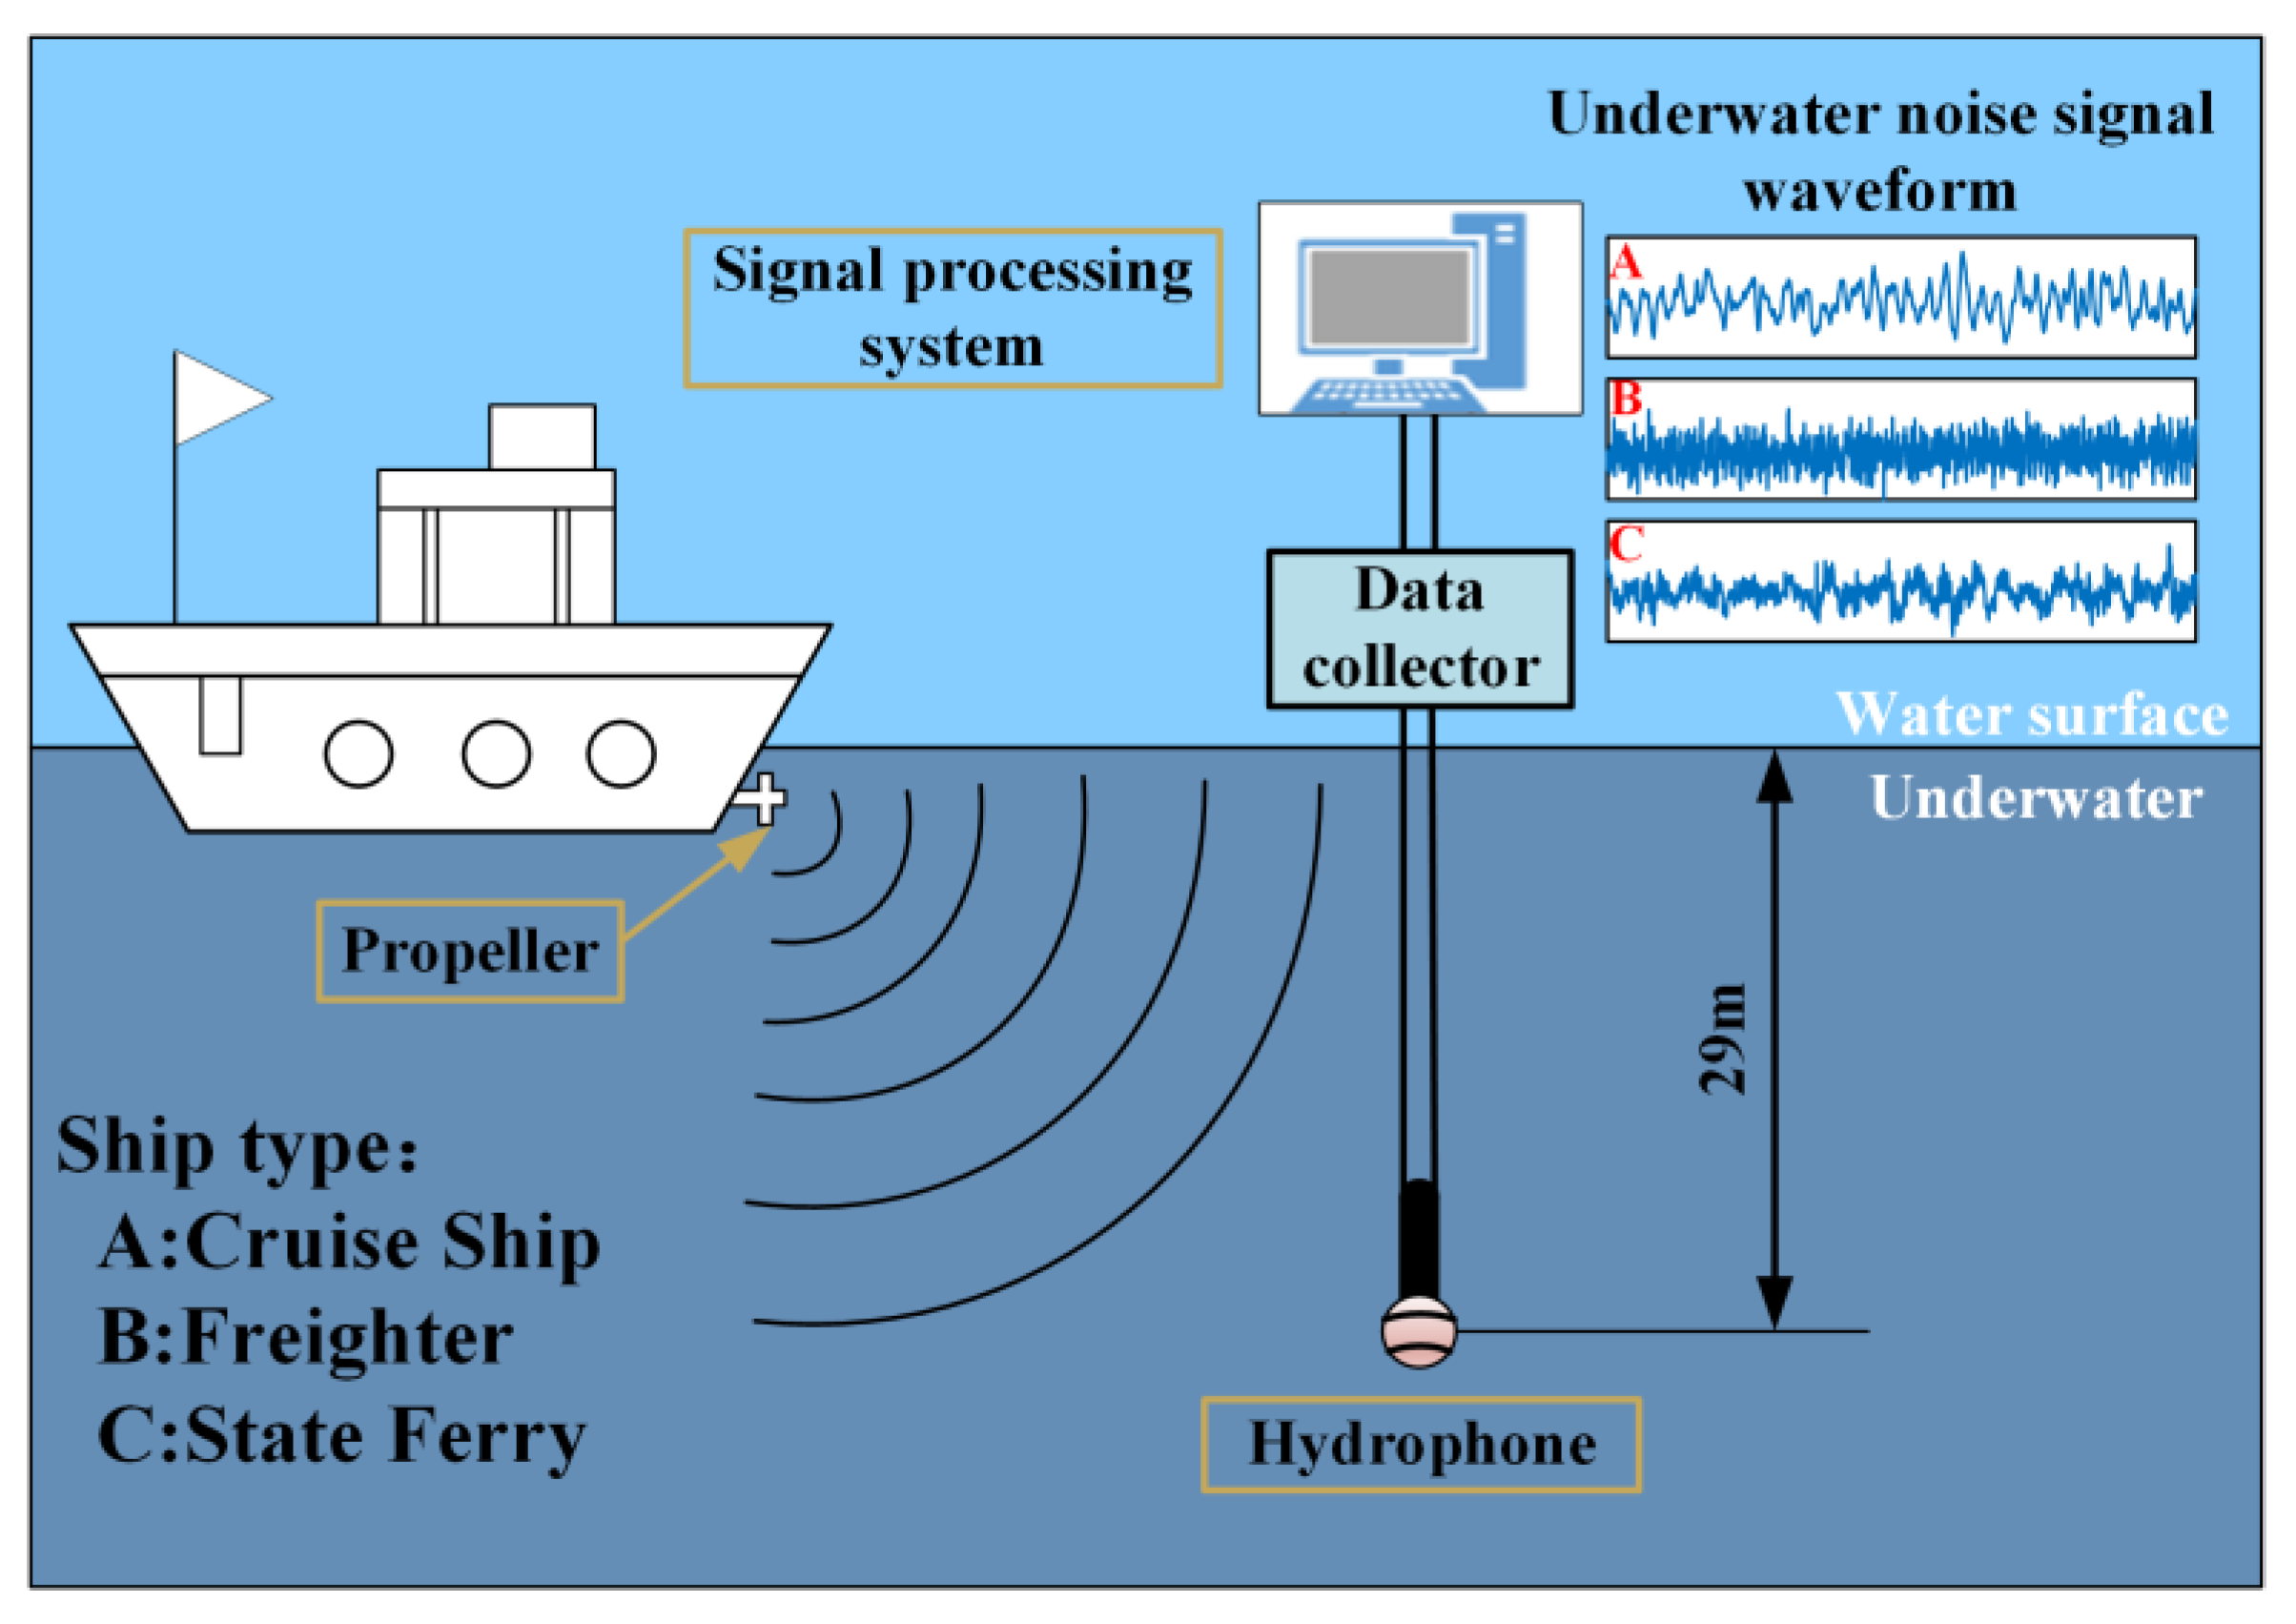
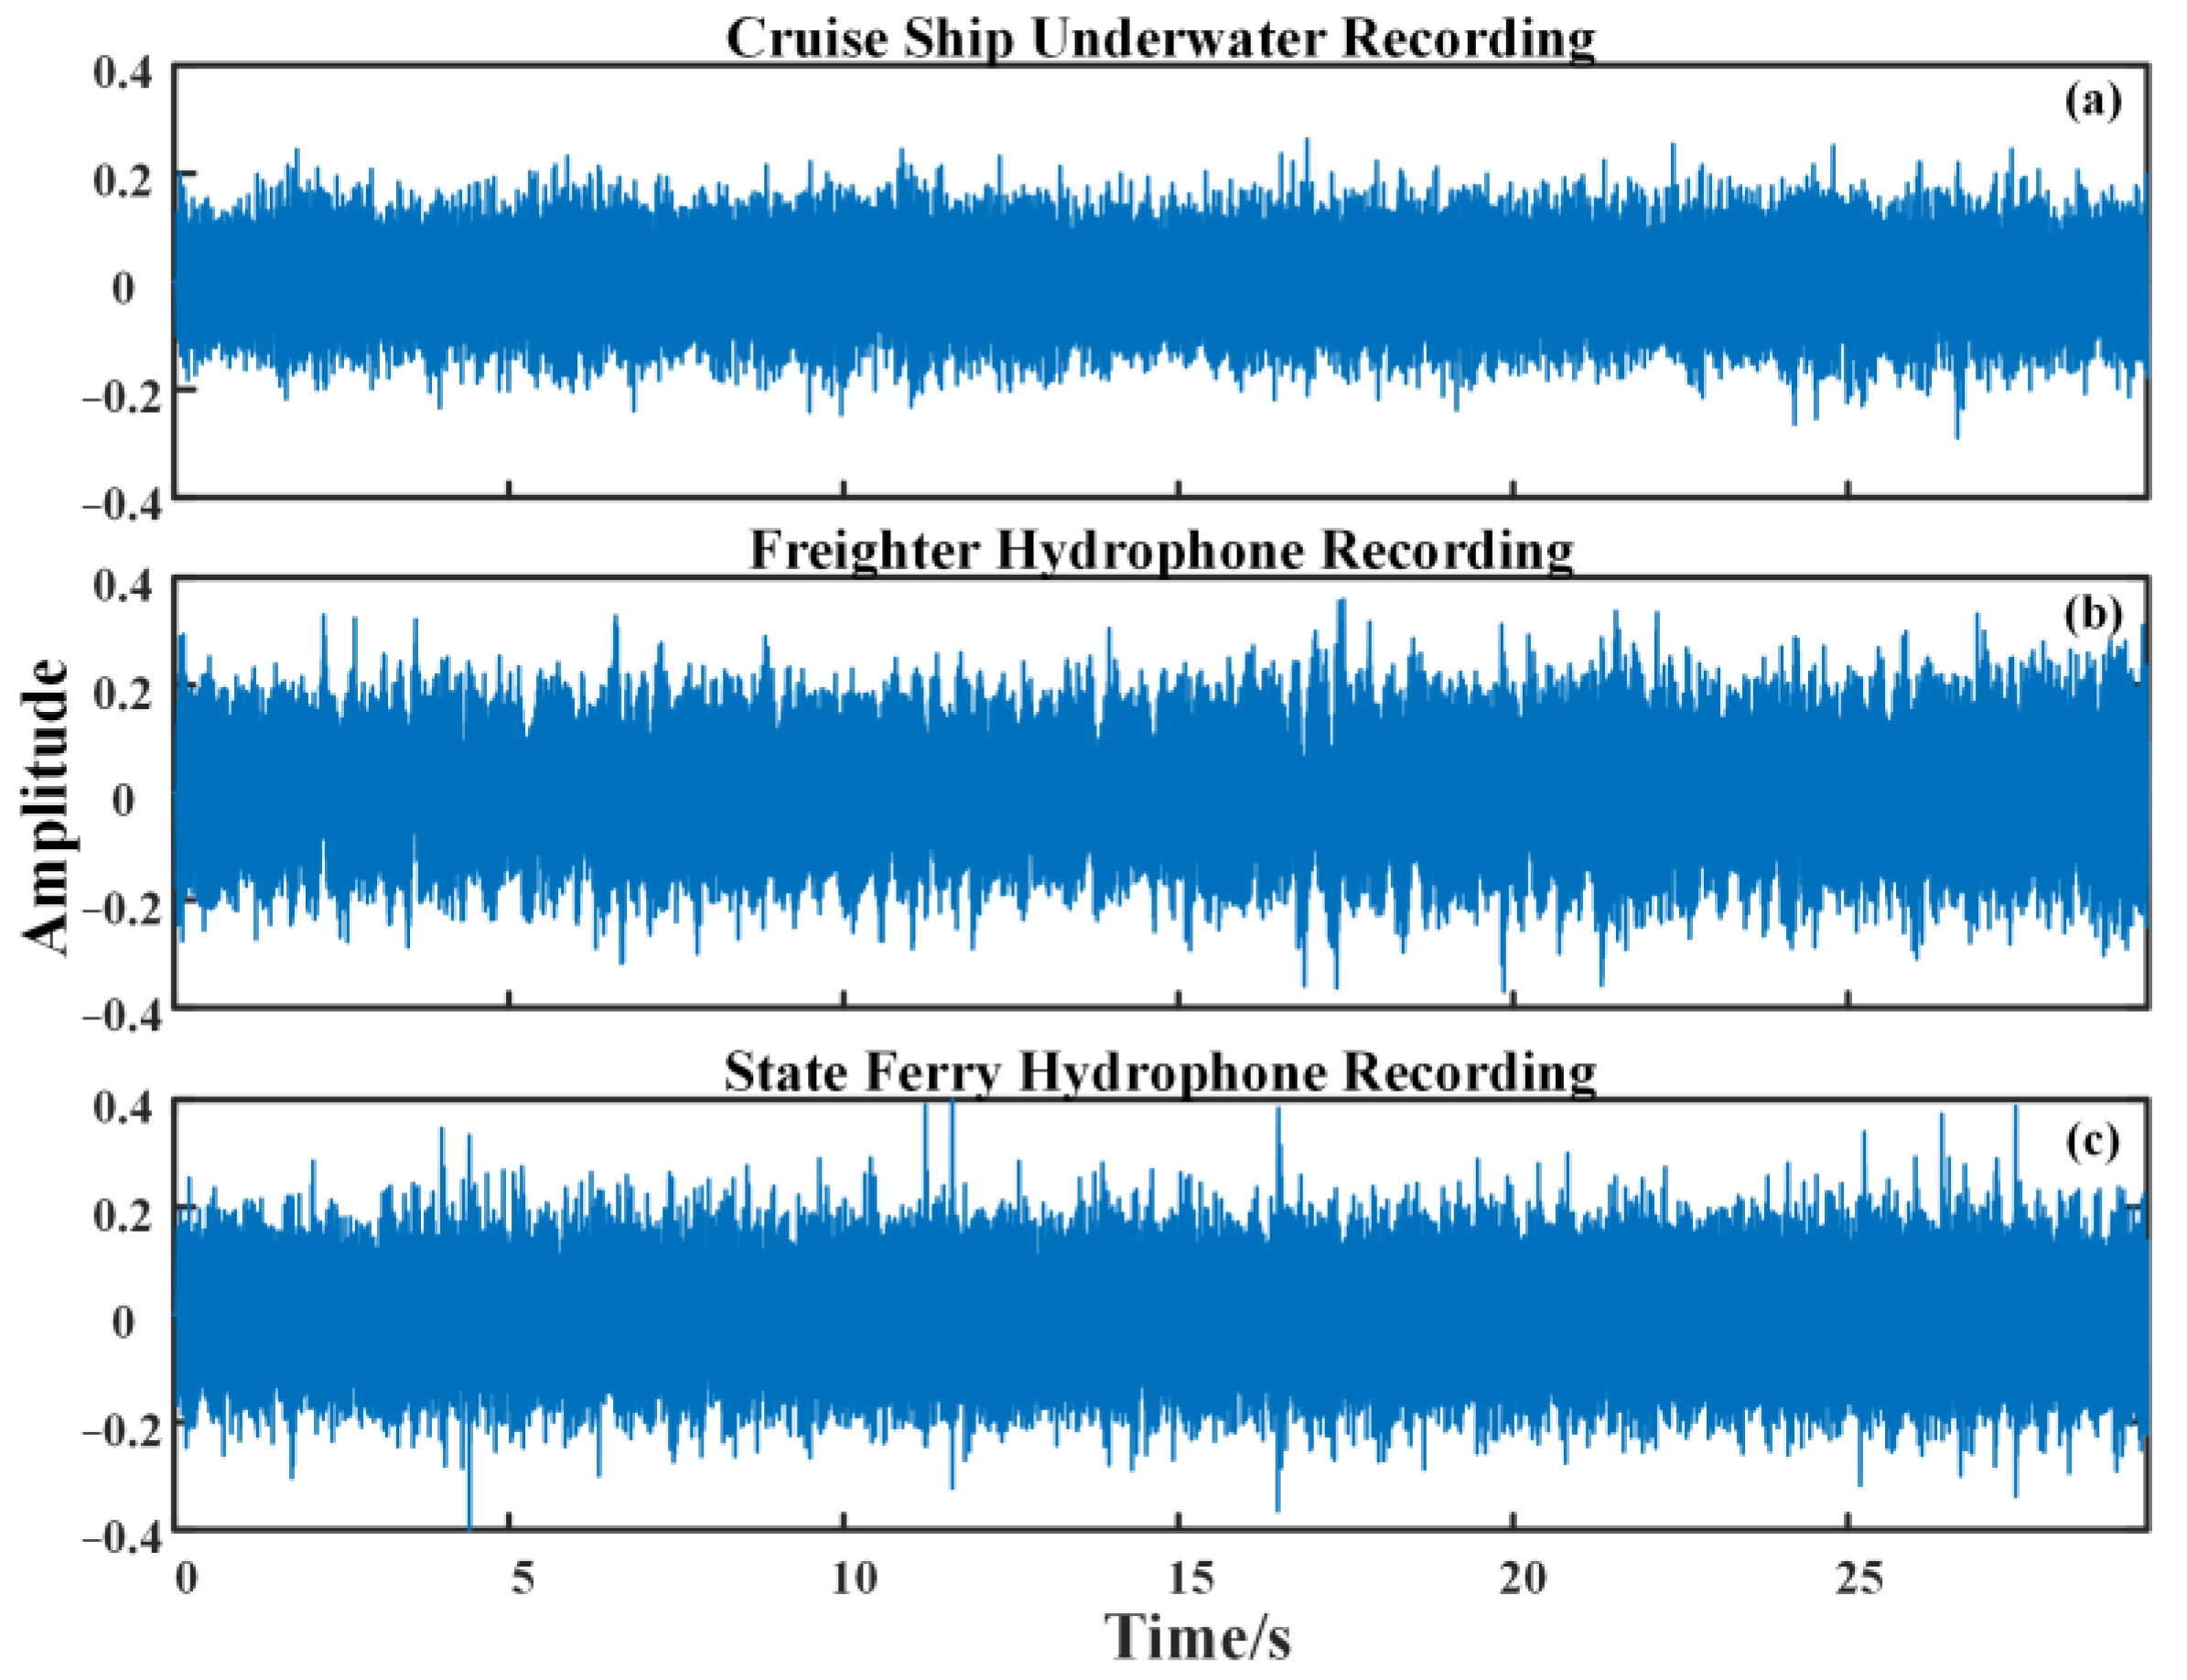
4.1. Source of Underwater Noise Signal of Ship

The dataset examined in this paper consists of the radiated noise signals from three different types of vessels recorded at a depth of 29 m in the South China Sea using a calibrated omnidirectional hydrophone with the acquisition system shown in Figure 14. No interference from biological or anthropogenic sources was observed during the recording period. The data were sourced from an underwater noise database accessible on the official website of the National Park & Preserve.
The sampling frequency of the ship underwater noise signal is 44.1 kHz, with signal data lengths ranging from 138 to 5.6 million sampling points. A 30 s noise signal is taken to study and analyze, and the three types of ships are cruise ships, freighters, and state ferries, respectively. The time-domain waveforms of these underwater noise signals are illustrated in Figure 15.
Observation of the time-domain waveforms of the three ship-radiated noise signals indicates that distinguishing between these signals is challenging based solely on their time-domain characteristics. Therefore, the underwater noise signals emitted by the three types of ships are further analyzed using the IEMD-MPE feature extraction method enhanced by peak cross-correlation, as proposed in this study.

4.2. IEMD Is Applied to the Underwater Noise Signal of Ships

In order to ensure the statistical representativeness of the samples and balance the effect of feature extraction and computational efficiency, 50 segments of underwater noise signals are randomly selected for each segment of the ship, and the sampling length of each segment is 5000 data points. According to the signal processing theory, 50 segments perform well in terms of data representativeness, algorithm robustness, and computation time, and the length of 5000 data points can fully capture the nonlinear and non-smooth characteristics of underwater noise signals while avoiding the introduction of excessive redundant data to ensure the stability of the algorithm and computational efficiency [16,24]. Each sample of the three underwater ship noise signals undergoes processing using both the unimproved EMD method, with results of EMD shown in Figure 16, and the processing results of the IEMD method are shown in Figure 17. In the figure, ‘abc’ represents the decomposition results of the underwater noise signals of the cruise ship, freighter, and state ferry, respectively. Through comparison, it is found that the IEMD method decomposes more IMFs than the EMD method. Due to the unknown nature of the underwater noise, it is not possible to directly indicate the effect of end effects elimination by relying on the two result plots alone. To further reflect the accuracy of the decomposition results of the IEMD method and the effect of end effects elimination, the PE features of the IMFs with the highest energy order are extracted for comparative analysis by combining the entropy features.
Considering the influence of marine background noise, it is necessary to distinguish between the noise produced by the ship itself and the environmental background noise in the environment when extracting features from the underwater ship noise analysis. By observing Figure 17, it is found that the main information of IMFs decomposed by the IEMD method is concentrated in the first five orders of IMF. Because the background noise is usually a broadband, low-frequency noise component. Therefore, when comparing the energy of IMFs for feature extraction, only the first five orders of IMFs are compared, and the latter low-frequency IMF signals are ignored. The energy of the first five IMFs is calculated to obtain the IMF with the highest energy for each sample. Table 3 shows the energy values of the first five IMFs obtained from the above IEMD. The table shows that the IMFs with the highest energy for the underwater noise signals of the three types of ships are IMF4, IMF3, and IMF5, respectively, and then the MPE features of the IMFs with the highest order of energy are extracted.

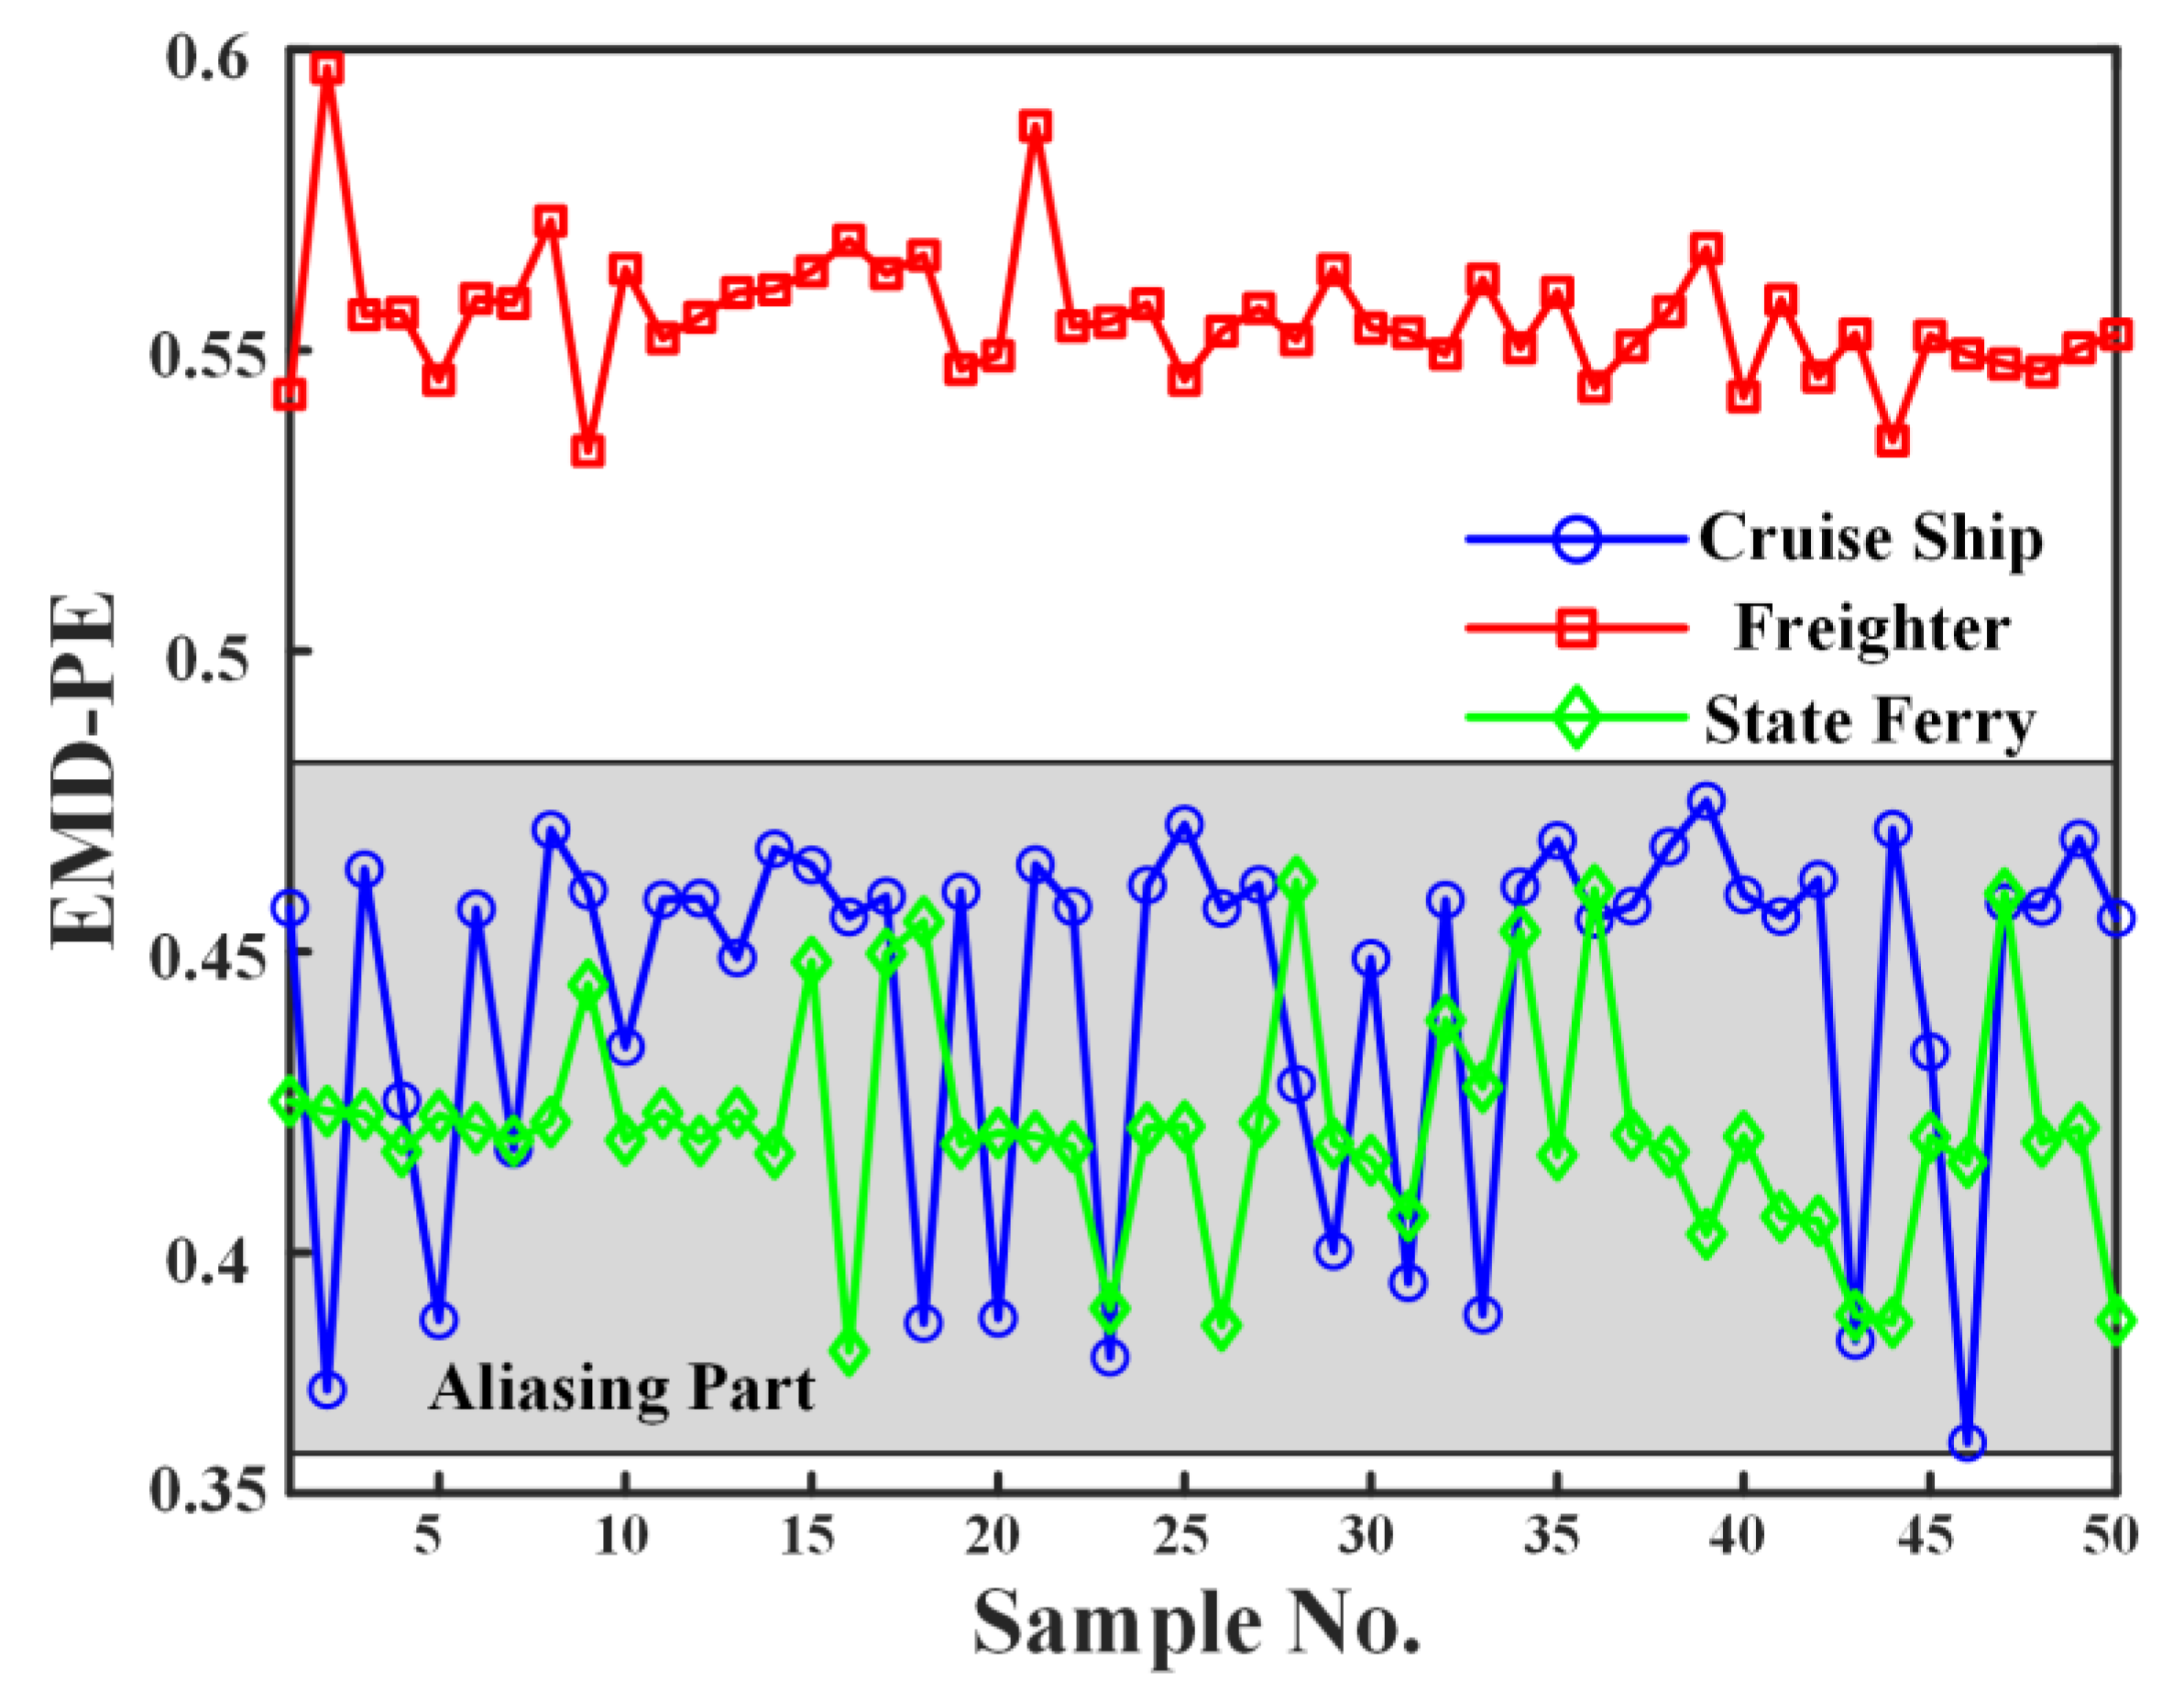
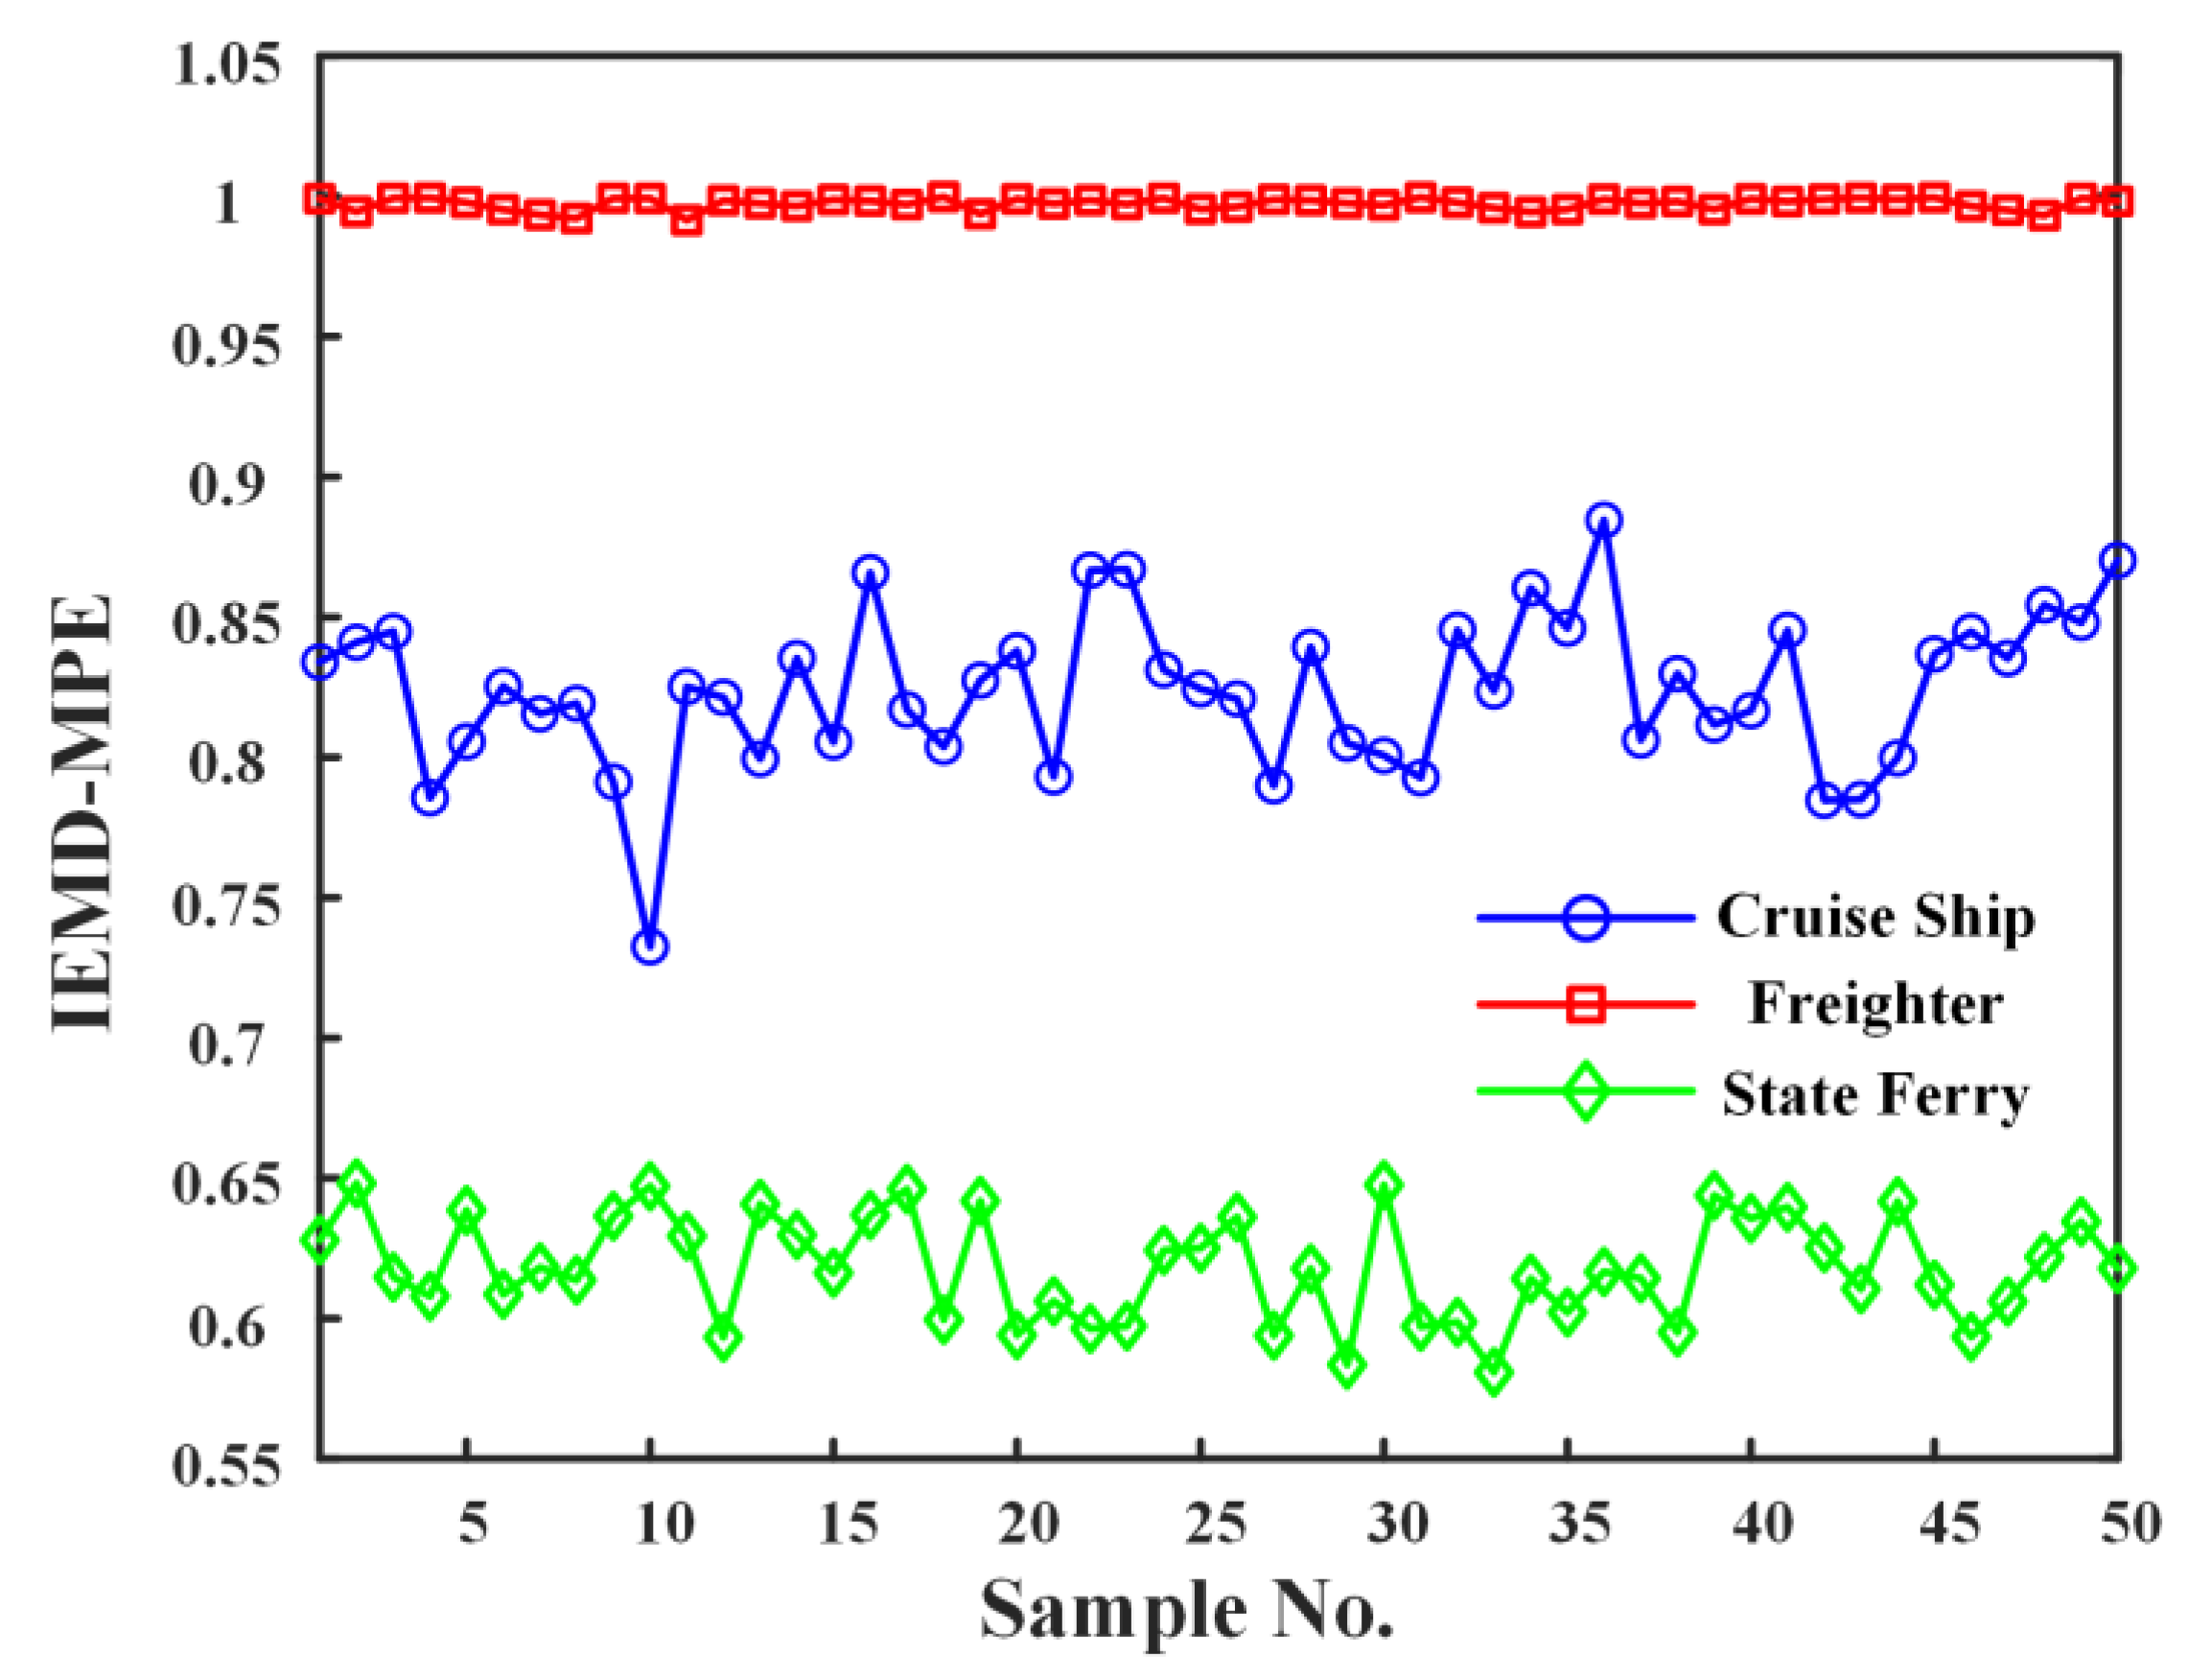
4.3. Feature Extraction of Ship Underwater Noise Signal

The PE features are directly extracted from 50 randomly selected sample signals of three ship noise signals.
Figure 18 shows the PE feature distribution of three ship noise signals, and the shaded part of the grey circle in the figure is the aliasing part of the PE values of the three noise signals. Due to the influence of the background noise in the complex marine environment, the PE values of the original signals are higher than those of the decomposed IMFs, which makes it difficult to discriminate between three types of submerged ship noise signals by the method of PE feature extraction directly on the noise signals.
To further compare the accuracy of the decomposition results of the EMD and IEMD methods and the effect of eliminating the end effects, the feature information is effectively extracted. In this study, 50 randomly selected ship noise signal samples are decomposed by EMD and IEMD methods. Combined with the entropy value features, the PE features of the highest order IMF of the three types of noise signal energies are extracted, respectively, and the distribution results are shown in Figure 19 and Figure 20. By comparing Figure 19 and Figure 20, it is found that the PE values of the highest-order IMFs extracted from the noise signals of two types of ships, cruise ships and state ferries, processed by the EMD method are mixed together because the end effects problem of the EMD method affects the results inaccurately, and the highest-energy IMFs are not of the same order. The PE values of the highest-order IMFs obtained by the IEMD method for the three ship noise signals can distinguish the three noise signals very well, which reflects that the IEMD method has weakened the end effect, and the decomposition results are more accurate. The feature information can be extracted effectively.
Due to the solid theoretical foundation of VMD in signal processing, the processing stability is strong, and, at the same time, it has good robustness to noise. In order to comprehensively evaluate the improvement effect of the IEMD method, this paper chooses the VMD method as the comparison tool of the IEMD method. In addition, the results of the improved EMD-PE method with the correlation unfolding model proposed by Mehdi Z. are compared and analyzed with the results of the IEMD-PE method based on the peak cross-correlation principle in this paper. Mehdi Z.’s improved EMD-PE method introduces the correlation expansion model to extend underwater noise signals when processing signals, as in this paper method, but the difference lies in the method of finding similar signals. Mehdi Z.’s method searches for similar signals backwards according to the position of the first segment, while the IEMD method proposed in this paper further optimizes the length of the similar signals based on the wave peak principle and then searches for the optimal similar signal segments based on the position of the wave peak.
The IEMD method based on peak cross-correlation proposed in this paper is compared with the two existing methods. Figure 21 shows the feature extraction results of IMF-PE based on VMD, which are derived from the reference [20]. Figure 22 shows the results of the EMD method improved by Mehdi Z. et al. using the signal extension model. The results are derived from the reference [12]. By comparing the feature extraction results of the three methods in Figure 20, Figure 21 and Figure 22, it is found that the IEMD-PE proposed in this paper has the best feature extraction effect, followed by Mehdi Z.’s method. However, for the underwater noise feature extraction results of cruise ship and state ferry, the distinction is lower than that of IEMD method based on peak cross-correlation proposed in this paper, and there is still a small area of feature aliasing phenomenon as shown in the grey shadow in Figure 21 and Figure 22. Compared with traditional PE methods, the IEMD-PE method and previous feature extraction methods, the IEMD-MPE method has better performance in the stability, accuracy, and robustness of feature extraction, so as to show higher reliability and effectiveness in a complex underwater environment.
In order to further validate the effectiveness of the IEMD-MPE method, SampEn is introduced in this paper, and the IEMD-SampEn features of the three noisy signals are extracted for comparison with the IEMD-MPE features proposed in this paper. SampEn is a commonly used and effective time-series complexity metric, which provides a method for distinguishing between different types of signals by evaluating the complexity of samples in the signals and their changes over time. In the analysis and classification of noisy signals, SampEn is widely used in biomedical signal processing, engineering signal analysis, and other fields, providing a more intuitive and classical reference standard. The IEMD-SampEn feature plot is shown in Figure 23.
The IEMD-MPE feature extraction method proposed in this paper is used, in which MPE combines multi-scale and alignment entropy to more effectively analyze the information of the ship’s underwater noise signal. In this section, according to the parameter settings of PE, an embedding dimension of 3 and a time delay of 1 are applied. The MPE features of the IMF with the highest energy order are extracted from the IEMD results. As shown in Figure 24, the impact of different time scales on entropy values and signal classification can be observed. As the time scale increases, the MPE value rises, indicating that the complexity and regularity of the ship noise signals are better captured at longer time scales. The figure demonstrates that, for ship noise signals, the differentiation among different types of vessels (cruise ships, freighters, and state ferries) is maximized at a time scale of 10. At this specific scale, the extracted MPE features can provide an optimal representation of the unique characteristics of each ship’s underwater noise, aiding in more accurate signal classification.
This finding highlights the significance of selecting an appropriate time scale when implementing the IEMD-MPE method for feature extraction and signal classification of ship underwater noise. It underscores the versatility of the proposed method in accommodating the varying complexities of noise signals while ensuring effective differentiation between different types of ships.
From Figure 25, it is evident that the three types of ships exhibit distinct entropy characteristics. State ferries show entropy values fluctuating around 0.6–0.65 with a low MPE value, indicating relatively low complexity in noise signals and a predominance of regular signals. This observation likely stems from ferries adhering to fixed routes and schedules, as well as consistent mechanical and operational conditions. Cruise ships display entropy values fluctuating around 0.8–0.85. The noise signals of cruise ships exhibit MPE values intermediate between those of state ferries and freighter ships, suggesting moderate signal complexity. This phenomenon is possibly due to cruise ships maintaining navigation alongside passenger services, resulting in a diverse range of noise signal sources. In contrast, freighter ships tend to exhibit a characteristic entropy value close to 1. The high entropy value of freighter ship noise signals indicates significant time series complexity, which likely reflects intricate interactions among engines and mechanical equipment during navigation.
By observing Figure 20, Figure 23 and Figure 25, the comparison of IEMD-PE and IEMD-SampEn with the IEMD-MPE method proposed in this paper shows that all three methods are able to differentiate the three ship noise signals, but the eigenvalues extracted by IEMD-MPE have more obvious differences between different noise signals and are more significant in the ability to differentiate the underwater noise signals, which shows its superiority. In addition, IEMD-MPE is more detailed and stable in the characterization of signal variations and can better capture the essence of the signal compared with IEMD-PE and IEMD-SampEn. The experimental results show that IEMD-MPE has higher accuracy and robustness in dealing with complex noise signals; not only can it clearly distinguish the three types of noise signals, but it is especially outstanding in the stability and differentiation of freighter underwater noise signals. Its extracted entropy feature interval is more distinct, and the signal fluctuation characteristics are more significant, which further proves the superiority of IEMD-MPE in complex noise signal processing, and it is a more accurate and effective means of signal classification.
Table 4 shows the maximum and minimum entropy values of the above four comparison methods as well as the IEMD-MPE method proposed in this paper for the three types of ship underwater noise signals. From Figure 26, it can be seen that the minimum eigenvalue difference between the two methods, VMD-PE and PIEMD-PE, for the two types of ship underwater noise signals, cruise ships and state ferries, is negative, indicating that the eigenvalues are mixed and cannot distinguish the two types of ship noise. Although the IEMD-SampEn method is slightly better than the IEMD-MPE method proposed in this paper in discriminating between the two types of ship noise, Freighter and Cruise Ship, it is much less effective in discriminating between the two types of ship noise, Cruise Ship and State Ferry. The smallest difference between the IEMD-PE and IEMD-MPE methods in feature extraction for freighters and cruise ships is 0.0514 entropy units and 0.1035 entropy units, respectively. The minimum difference between the two methods is 101.36% higher for IEMD-MPE compared with IEMD-PE. This signifies a doubling in differentiation. For cruise ships and state ferries, the minimum difference of underwater noise signal feature extraction is 0.0285 entropy units and 0.0843 entropy units, respectively. The minimum difference distance of IEMD-MPE is 195.79% higher than that of the IEMD-PE method, and the differentiation is two times higher distance. In comparing feature extraction for freighters and state ferries, the minimum difference in underwater noise signal features is 0.1086 entropy units and 0.3399 entropy units, respectively. The distance between the IEMD-MPE and IEMD-PE methods in terms of minimum difference increased by 212.98%; the differentiation is two times higher distance. It can be seen from these comparisons that the IEMD-MPE method proposed in this paper is easier to classify and more distinguishable than the previous methods. Experimental results verify the effectiveness of the proposed method for the classification and recognition of ship noise signals.
By analyzing the entropy features through the ship underwater noise feature extraction method based on the peak cross-correlation enhanced IEMD method in conjunction with MPE proposed in this paper, it is possible to understand the noise signal patterns and potential complexity of different ships. This analysis aids in designing appropriate monitoring and intervention strategies aimed at reducing noise pollution, safeguarding the marine environment, and enhancing ship performance and safety. The feature extraction method plays a crucial role in ship noise management, environmental impact assessment, and the optimization of ship operational efficiency.

4.4. Application Verification

To validate the effectiveness and versatility of the method proposed in this paper, an experimental apparatus for acquiring underwater propeller noise signals is constructed in this paper, and two different types of propeller noise signals are acquired as the research object of feature extraction. The experimental setup, depicted in Figure 27, comprises an experimental pool, a BK8104 hydrophone, various types of propellers, an NI information acquisition card, a LabVIEW data acquisition system, and so on. Install the BK8104 hydrophone and small-thrust propeller in the position shown in the figure, connect the hydrophone with the A0 channel of the NI signal acquisition card, and at the same time, connect the acquisition card with the LabVIEW data acquisition system in the computer. After installing the experimental device, set the sampling time to 39 s and the sampling frequency to 12,800, set the speed of the low-thrust propeller (half-power speed and full-power speed), and then start the propeller, and after the propeller is running smoothly, open the LabVIEW data acquisition system to collect the underwater noise signal of the propeller. After the underwater noise signal acquisition of the low-thrust propeller is completed, replace the high-thrust propeller and repeat the above operation for noise signal acquisition.
This experiment collects two groups of underwater noise signals from propellers. The first group comprises noise signals from two different types of propellers, labeled as P1 and P2 for convenience. Specifically, P1 represents the underwater noise signals from low-thrust propellers, while P2 represents those from high-thrust propellers. The second group consists of noise signals from a low-thrust propeller at two different speeds, labeled as S1 and S2. Here, S1 denotes the noise signals from the low-speed propeller, whereas S2 represents those from the high-speed propeller. Each segment of noise signals was sampled at a frequency of 12.8 kHz for a duration of 39 s. The time domain waveforms of the two groups of noise signals are shown in Figure 28 and Figure 29.
Fifty samples from each noise signal dataset were selected for processing and analysis, with each sample consisting of 5000 data points. Initially, the PE features of the underwater propeller noise signals are directly extracted, as shown in Figure 30. Observing Figure 28, Figure 29 and Figure 30, it becomes evident that the time-domain waveforms within the same noise signal group exhibit similarities, and their PE features are intertwined. The noise features cannot be effectively extracted to distinguish between the two noise signals in each data group by directly observing the time-domain waveform graphs of the two groups of noise signals and the PE features.
The two groups of propeller underwater noise signals are processed by EMD to extract the PE features of the highest energy order IMF, and the results are shown in Figure 31. Figure 31a shows the EMD-PE feature extraction results of underwater noise signals from two different types of propellers in the first group, and Figure 31b shows the EMD-PE feature extraction results of underwater noise signals from small-thrust propellers at different speeds in the second group. By observing Figure 31a, it is found that the IMF obtained from the decomposition is inaccurate due to the effect of the end effects of the EMD method on the decomposition results, and there is a discrepancy of the IMF with the highest energy at individual sample points in the figure. In Figure 31b, the EMD-PE feature results of the low-speed, low-thrust S1 overlap with those of the high-speed S2, and there is a discrepancy of the IMF obtained from the decomposition of a single sample with the highest energy in S1. It is not effective to distinguish two sets of highly similar experimental noise signals by extracting EMD-PE characteristic information.
The two sets of propeller underwater noise signal data are processed using the IEMD method based on the principle of peak cross-correlation proposed in this paper, and the IEMD-PE and IEMD-SampEn features of the two sets of signals are extracted, respectively, and the feature results are shown in Figure 32 and Figure 33. As can be seen from the figures, the EMD method improved by the peak inter-correlation method decomposes the IMF more accurately, and the IMF with the highest energy is all second-order without any anomalies. Although the IEMD-SampEn features have a clear differentiation effect on the first set of different types of propeller noise signals, the grey shaded parts in Figure 32 and Figure 33b appear to be aliased. The aliasing part indicates that the two noise eigenvalues are similar and cannot effectively distinguish between different noise signals.
Taking P1, P2, and S1, S2 as the research object, two groups of propulsion underwater noise signals were studied. These signals were processed using the IEMD-MPE feature extraction method based on peak cross-correlation enhancement proposed in this study. The effectiveness and versatility of this method were verified through classification analysis. Figure 34 illustrates the IEMD-MPE feature plots under different time scales: the first group of propulsive underwater noise signals is analyzed at a time scale of 3, while the second group is analyzed at a time scale of 5. The distributions of the IEMD-MPE features extracted from the two groups of data are presented in Figure 35.
In order to verify the differentiation effect of the IEMD-MPE feature extraction method on underwater noise signals, the experimental results of the two methods, IEMD-PE and IEMD-SampEn, are compared and analyzed with the IEMD-MPE method proposed in this paper. Through the comparative analysis of the IEMD-PE feature diagram (Figure 32), the IEMD-SampEn feature diagram (Figure 33), and the IEMD-MPE feature diagram (Figure 35), it is obvious that the IEMD-MPE method has a better differentiation ability in both cases. In Figure 32, the IEMD-PE method now shows aliasing in the feature extraction of both sets of propellers, and both of its differentiation effects are much worse than that of the IEMD-MPE. A similar trend can be seen in the IEMD-SampEn feature plot in Figure 33, where the IEMD-SampEn has limited differentiation of the noise signals, although it is better than the IEMD-MPE method on the first set of noise signals of the different propellers. IEMD-MPE method, it is observed that in Figure 33b, there is an obvious aliasing part in the feature extraction of IEMD-SampEn for underwater noise signals at different rotational speeds of the same propellers, which is not as effective as the IEMD-MPE features in terms of recognition. In contrast, the IEMD-MPE feature map shown in Figure 35 can more clearly distinguish underwater noise signals under different conditions, which significantly improves the discriminative effect. Further experimental results show that the IEMD-MPE feature extraction method has higher reliability and effectiveness in processing underwater noise signals.
As can be seen from Figure 35, the IEMD-MPE feature extraction method based on peak cross-correlation enhancement not only distinguishes the underwater noise samples of the first group of two thrust types of propellers well, but the distribution results are clearer. It is also effective in distinguishing the underwater noise signals of the same thrust type of propellers at different rotational speeds. Table 5 shows the maximum and minimum entropy eigenvalues of the two comparison methods and the IEMD-MPE method proposed in this paper for the extraction of underwater noise signals from three types of ships. As can be seen from the comparison of propeller noise signals between the two groups in Figure 36, the minimum difference values of the IEMD-PE method are all negative, and the two groups of data cannot be distinguished. Although the IEMD-SampEn method is highly distinguishable from the first group of noise signals, the feature aliasing phenomenon still occurs when the minimum feature difference of the second group of signals is negative, and the reliability of this method is not high. The minimum difference of the IEMD-MPE for the two types of propellers of underwater noise signals of P1 and P2 feature extraction is 0.0814 entropy units. The minimum difference of the underwater noise signal feature extraction for S1 and S2 propellers of the same model at different speeds is 0.0057 entropy units. The experimental results prove that the method is discriminative for two groups of highly similar propeller noises. The experimental results show that the feature extraction technique for ship radiated noise proposed in this paper is effective and versatile, which is more conducive to feature extraction and other subsequent processing of ship underwater noise signals.

5. Conclusions

The key to the feature extraction technique is the signal processing technique and the feature selection. The IEMD-MPE-based feature method extracted in this paper is of great significance in the classification and recognition of underwater noise signals from ships. By effectively extracting the IEMD-MPE features, it not only improves the accuracy of target recognition but also can more accurately identify different types of ships and their operational status, which has important application value in the fields of marine surveillance and maritime security and provides solid theoretical support and practical value for advancing the development of ship target recognition technology.
In this paper, the feature extraction method based on IEMD-MPE first extends the ship noise signal according to the peak cross-correlation principle, and the noise signal is decomposed into IMFs of single-component signals of specific physical interpretations by using the IEMD method. The IMF with the highest order of energy is selected using the energy formula, and finally the MPE feature of the IMF is extracted, enabling discrimination among different types of underwater noise signals. The main work and contributions are as follows:
  • In this paper, an extension method based on peak cross-correlation is proposed to improve the EMD algorithm (IEMD). Comparative analysis with traditional EMD and other extension methods validates that the IEMD algorithm effectively mitigates the end effects inherent in EMD.
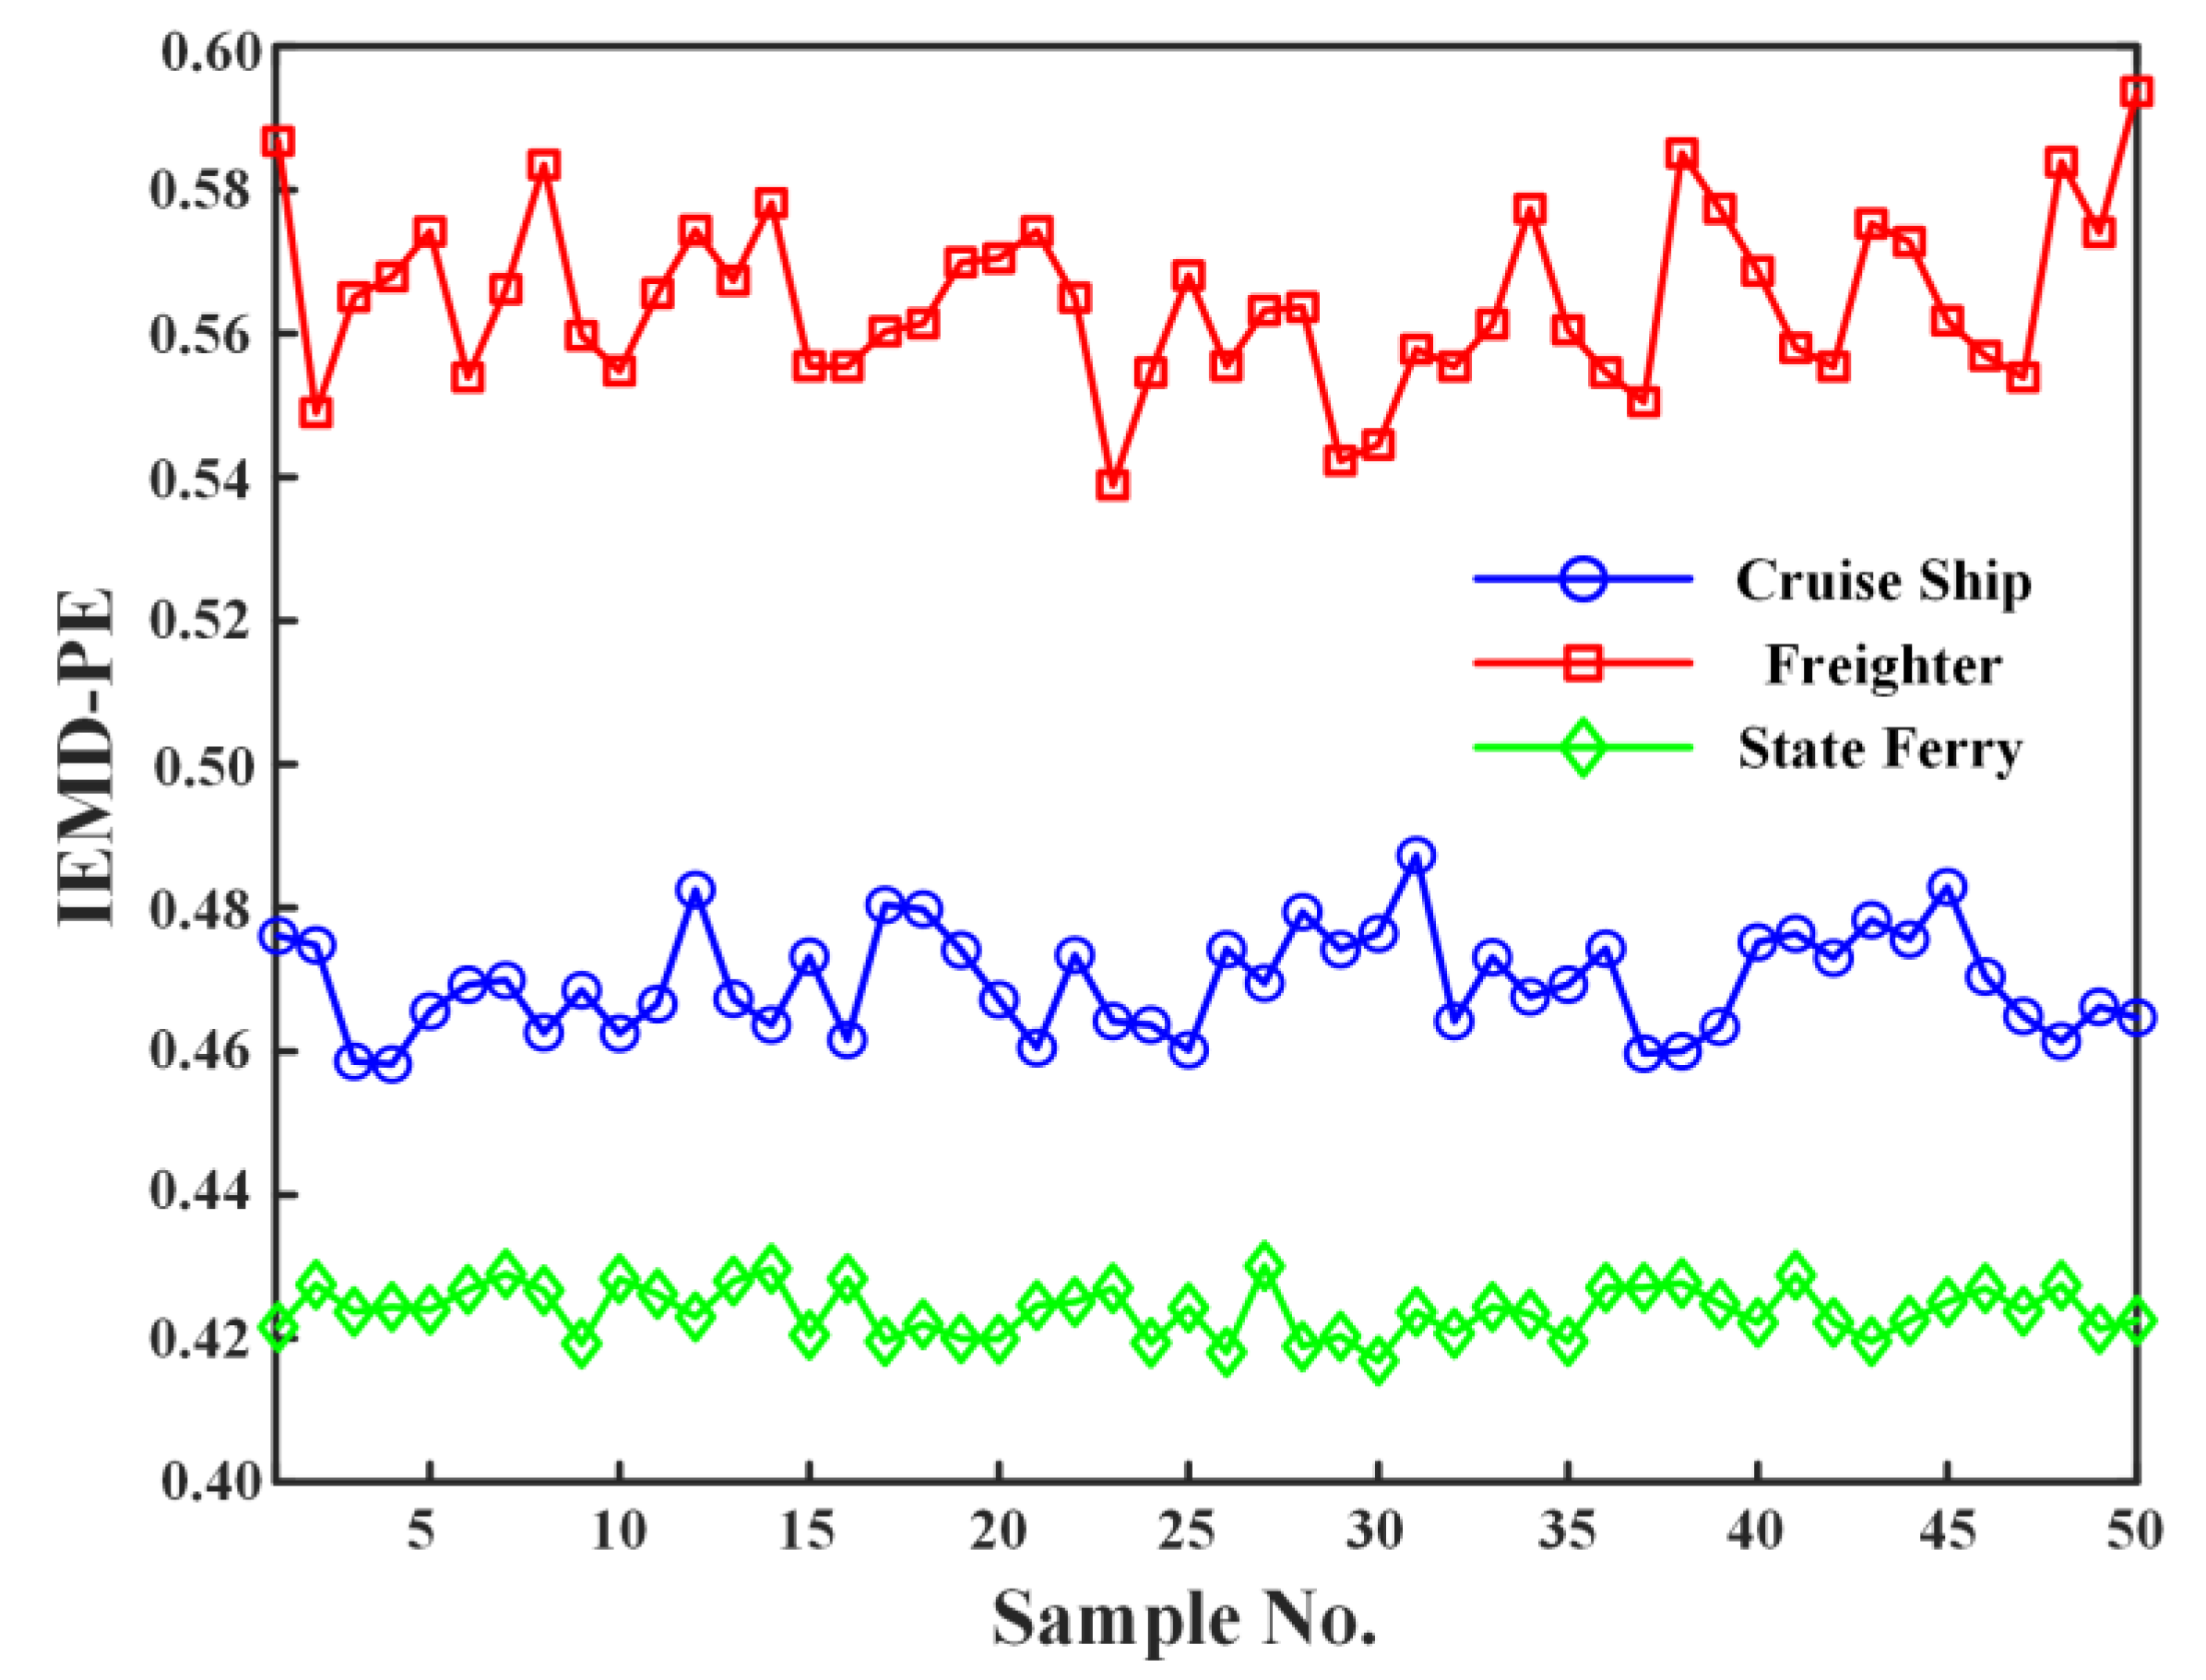
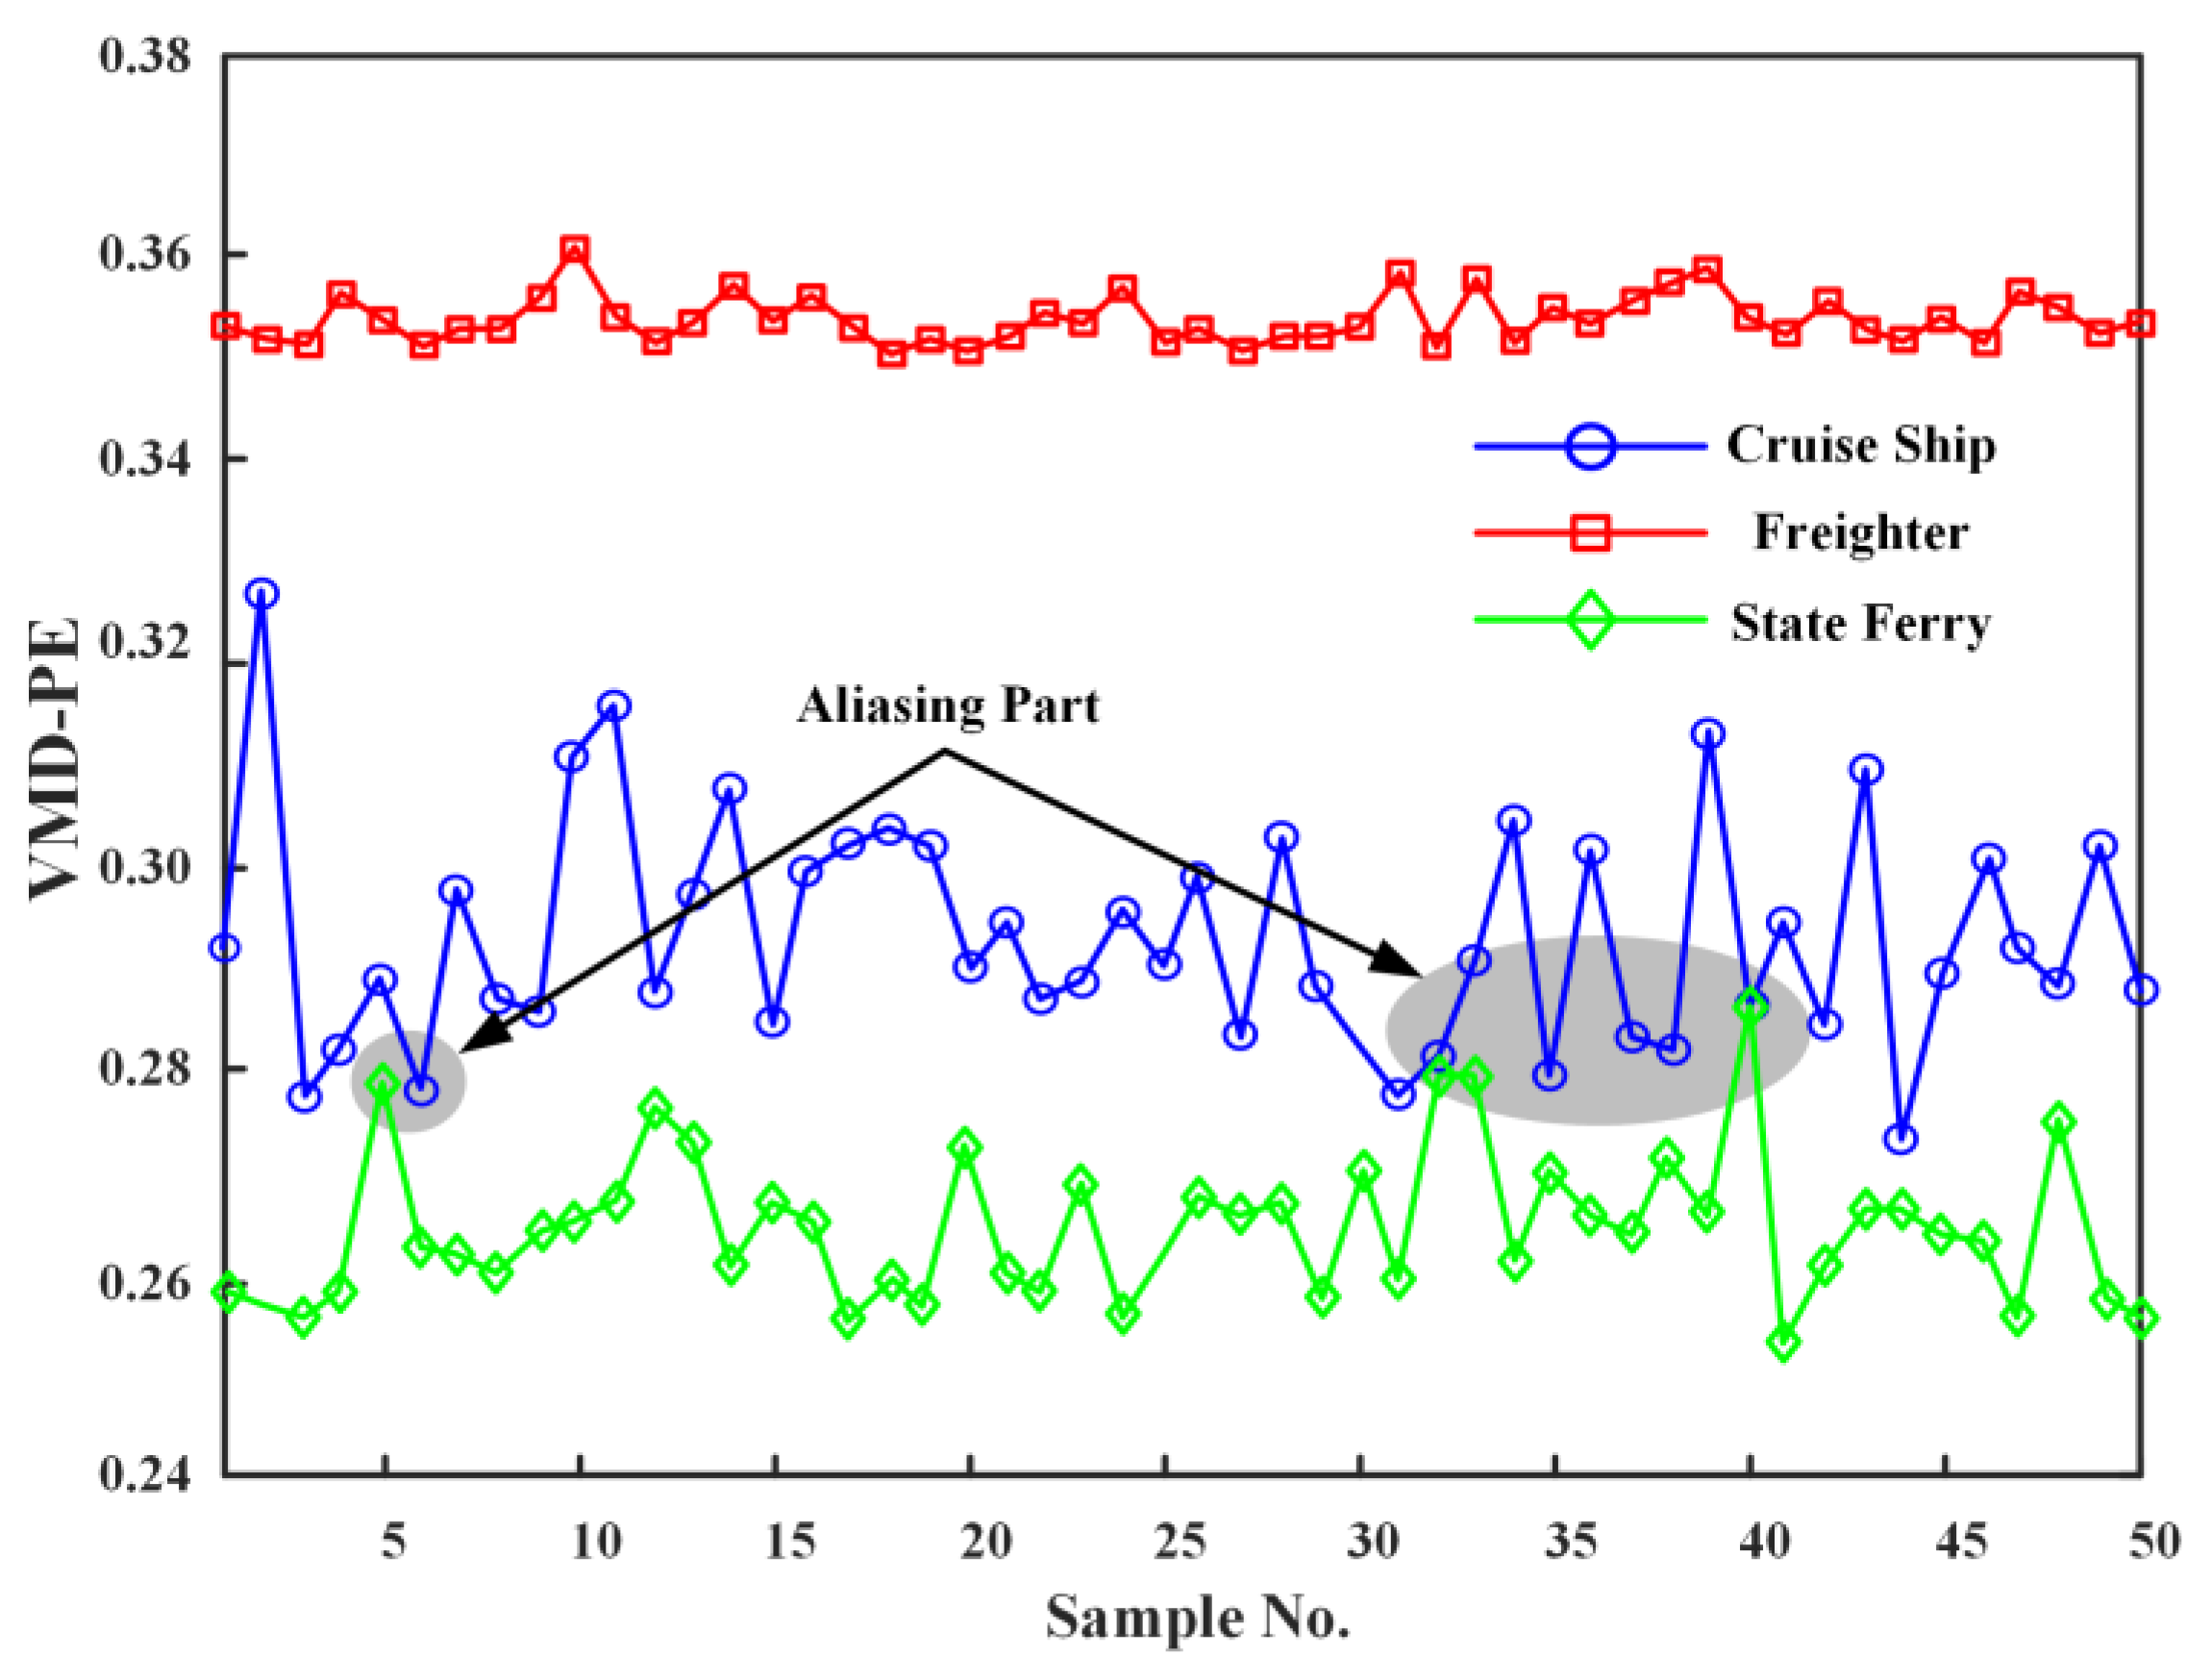
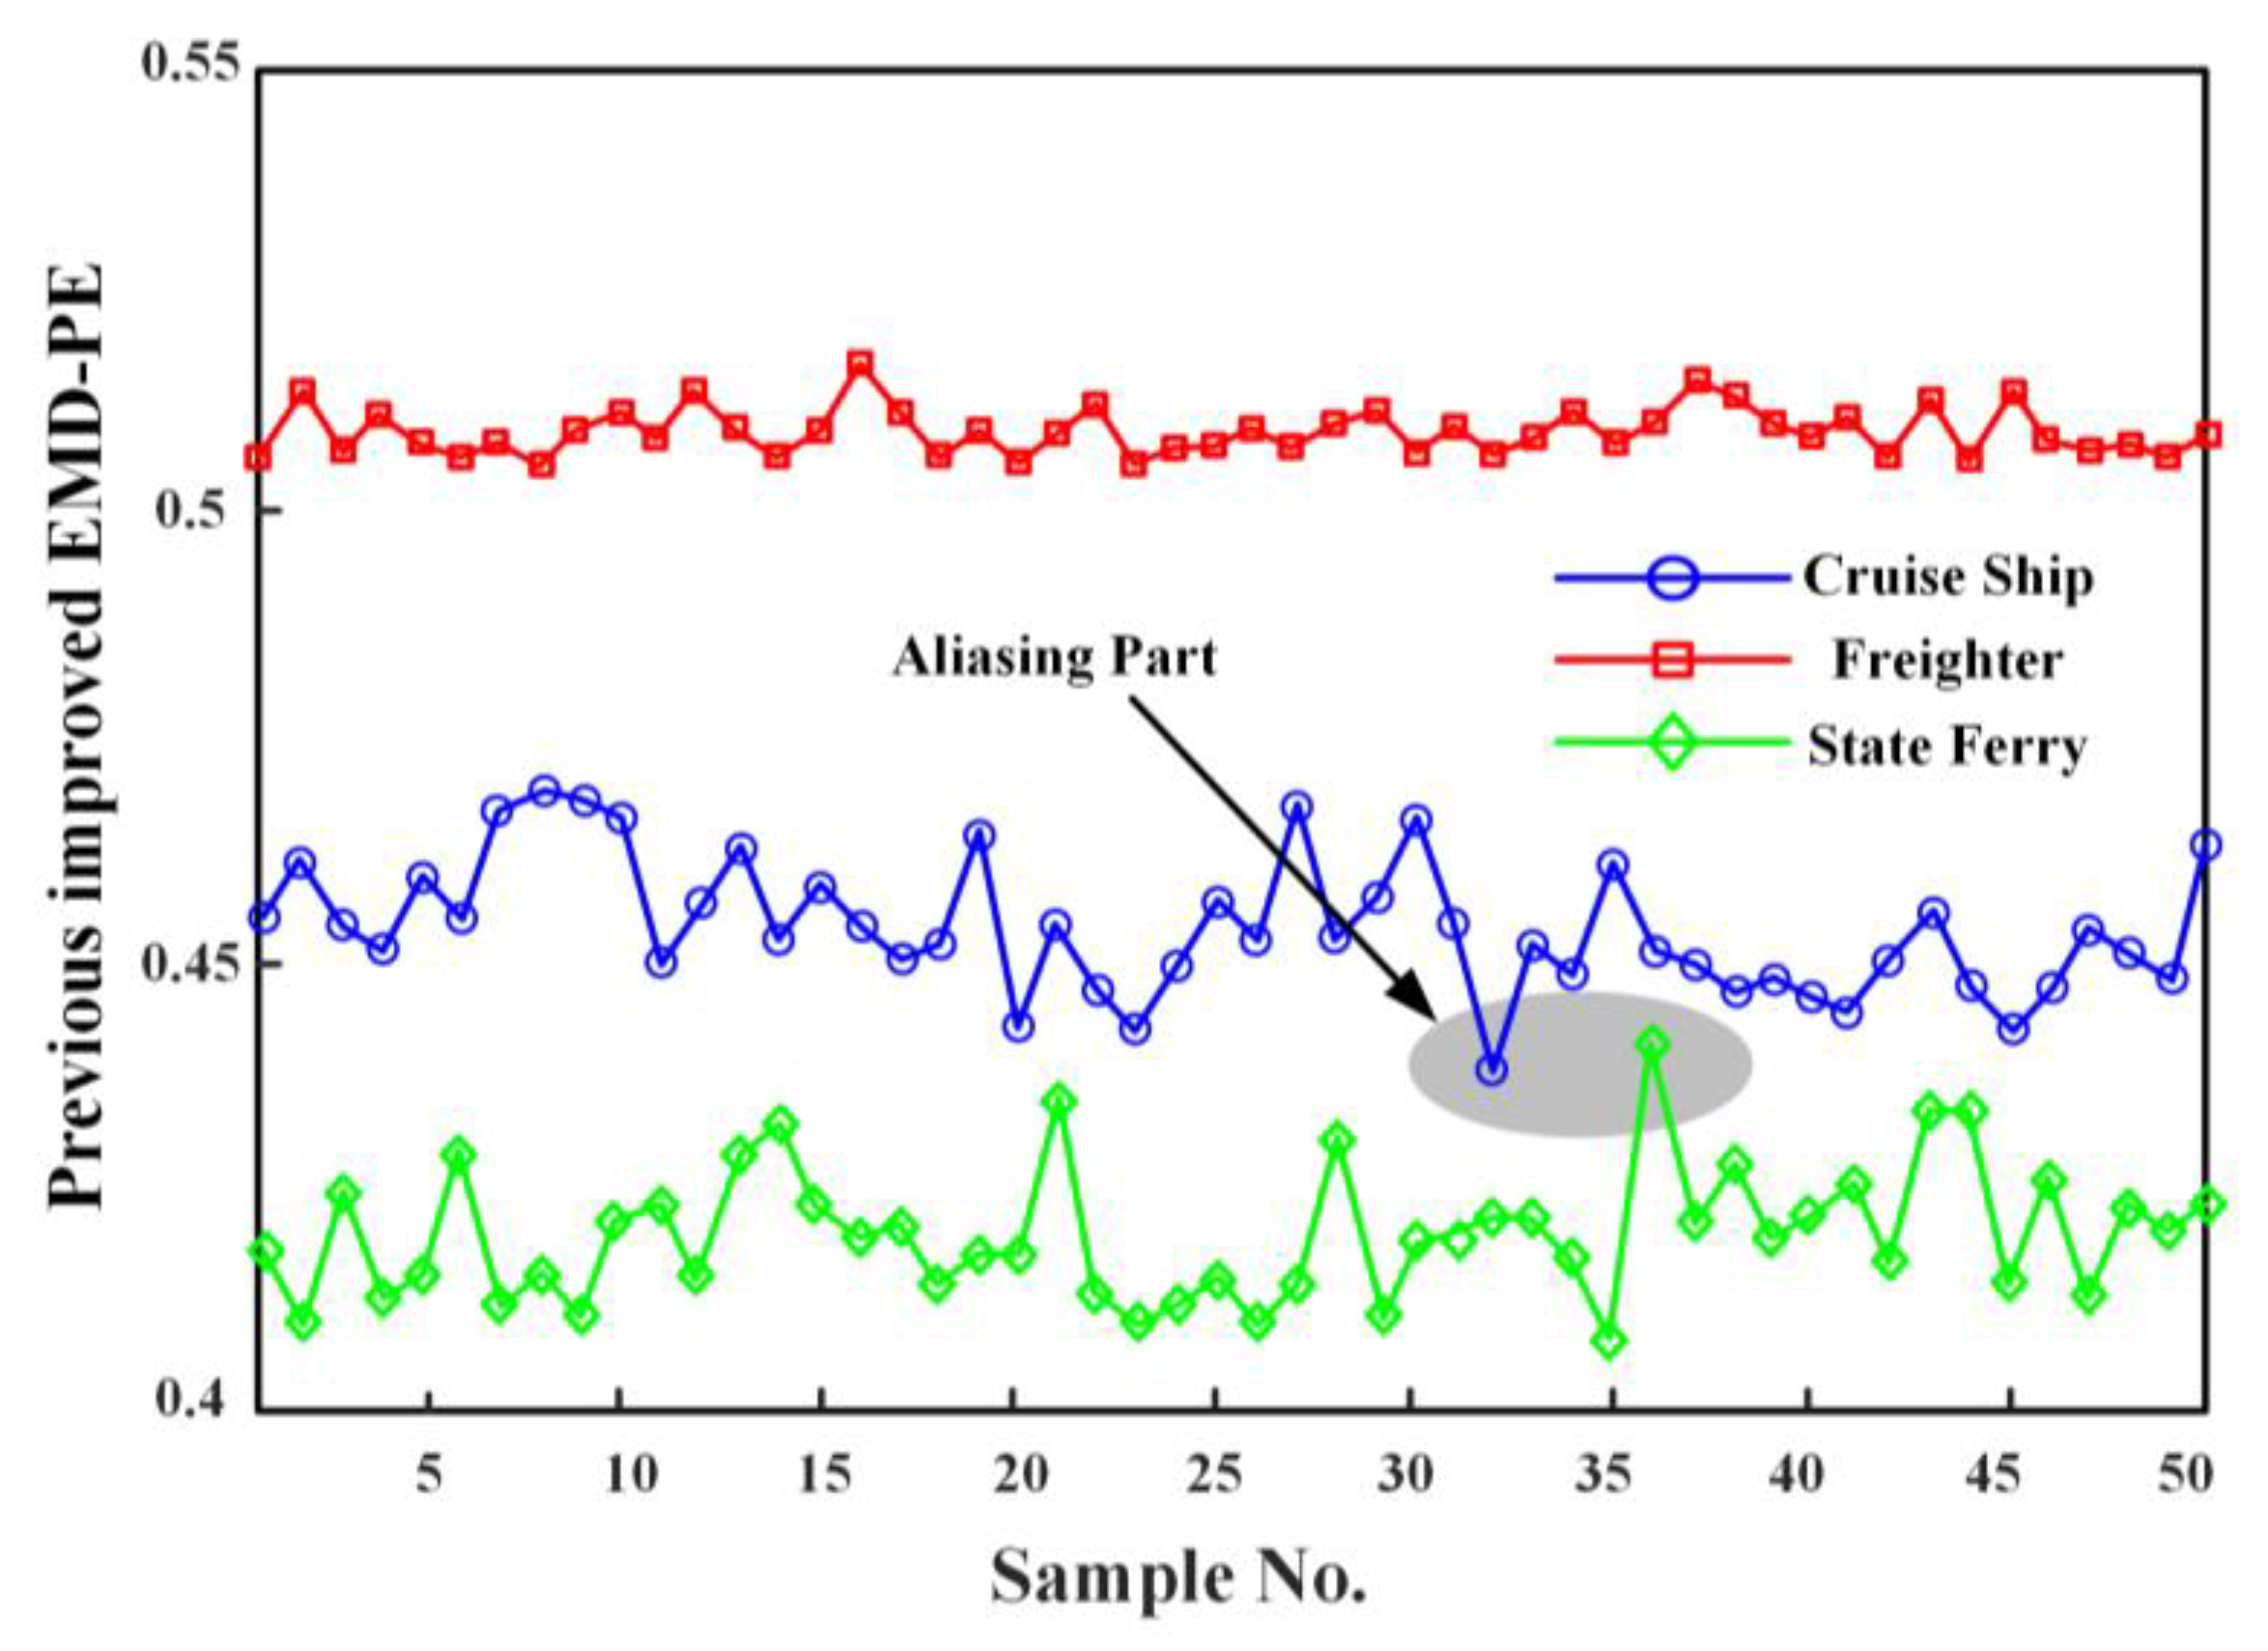
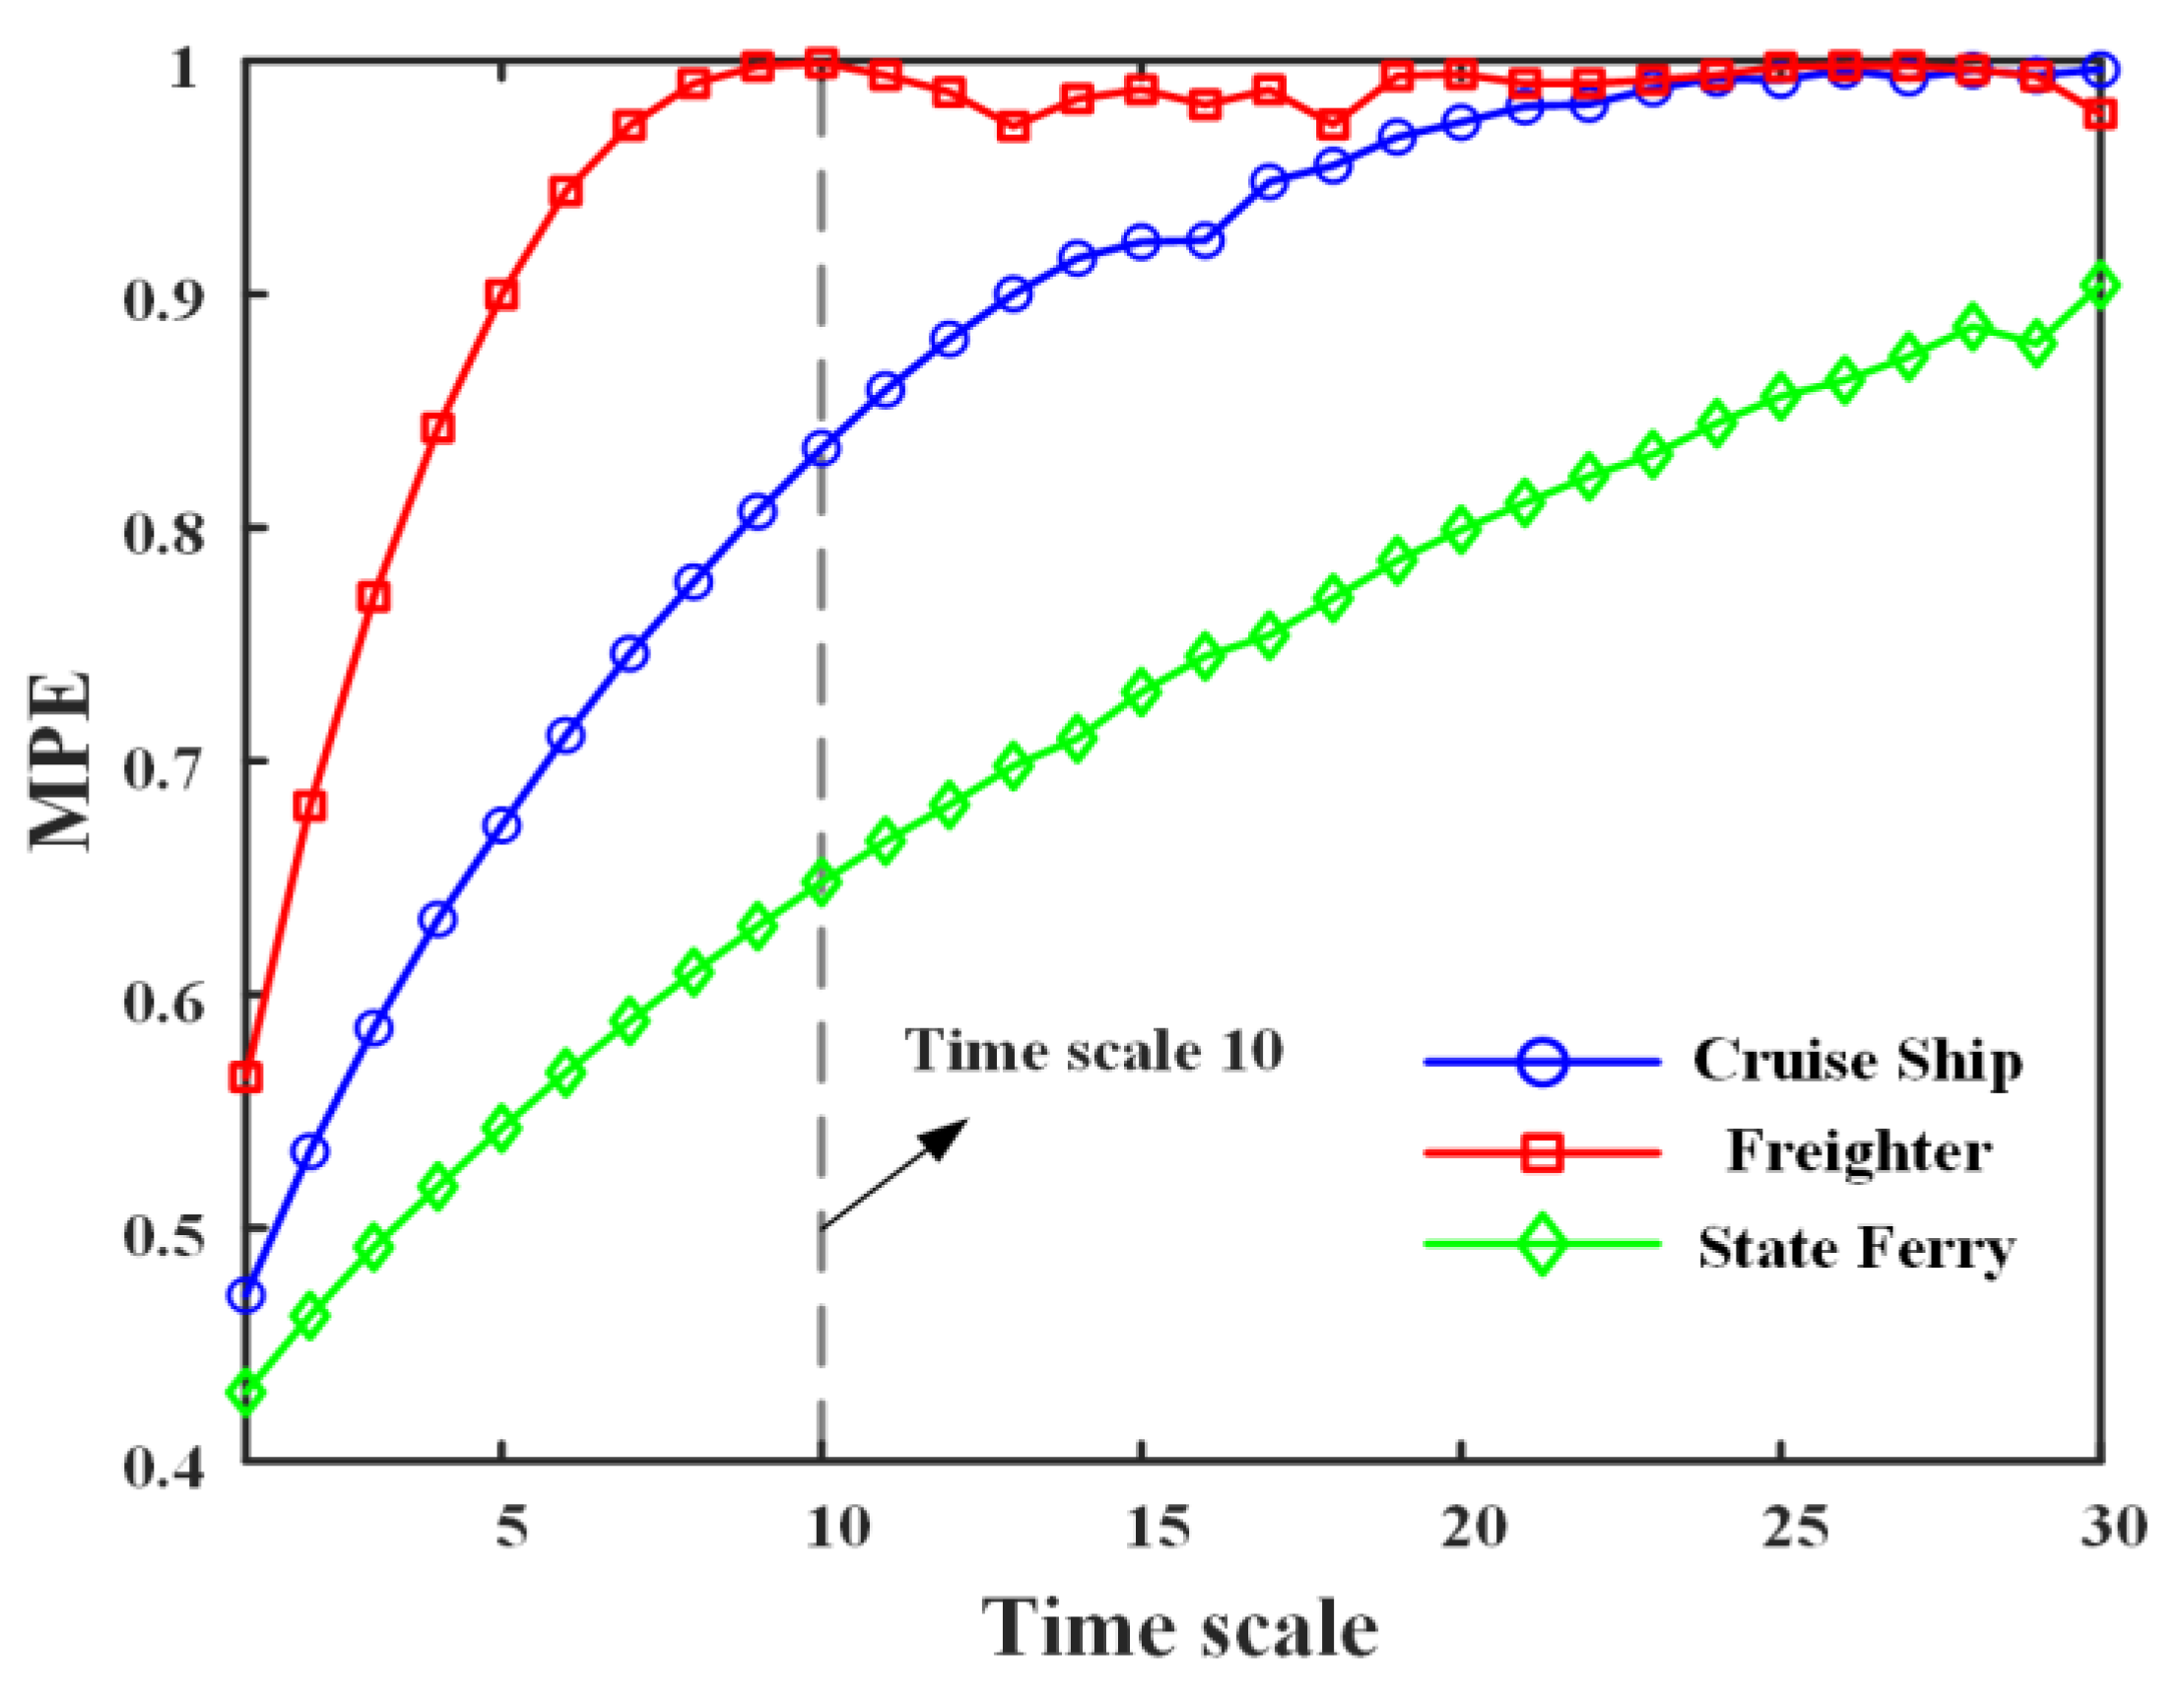
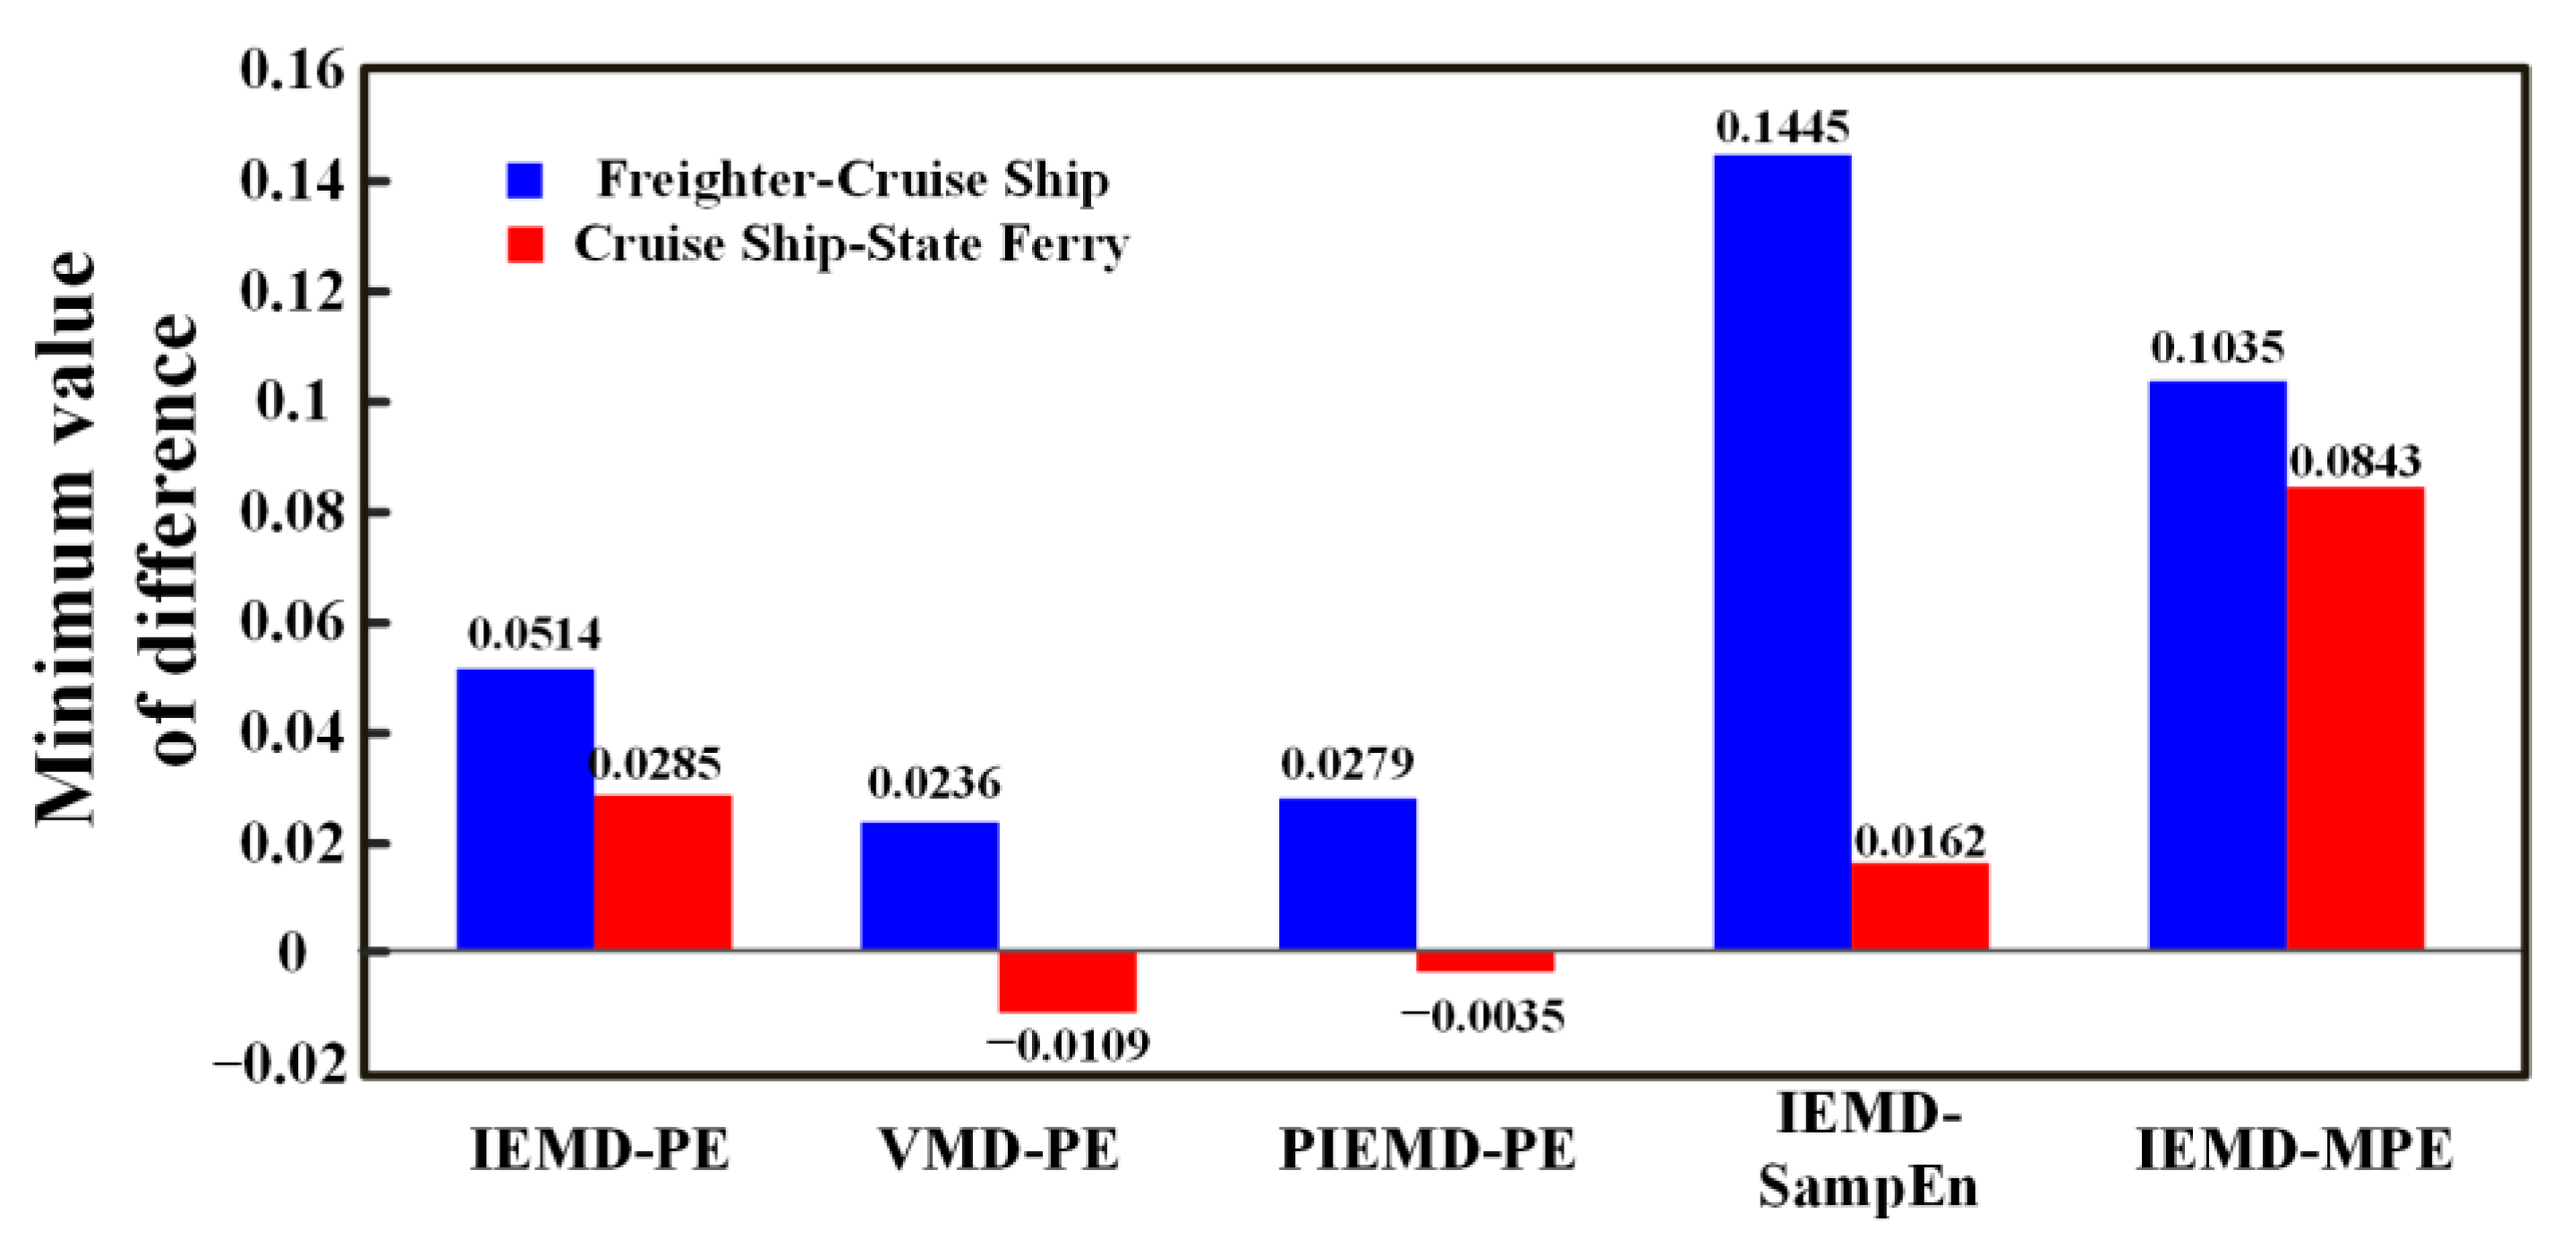
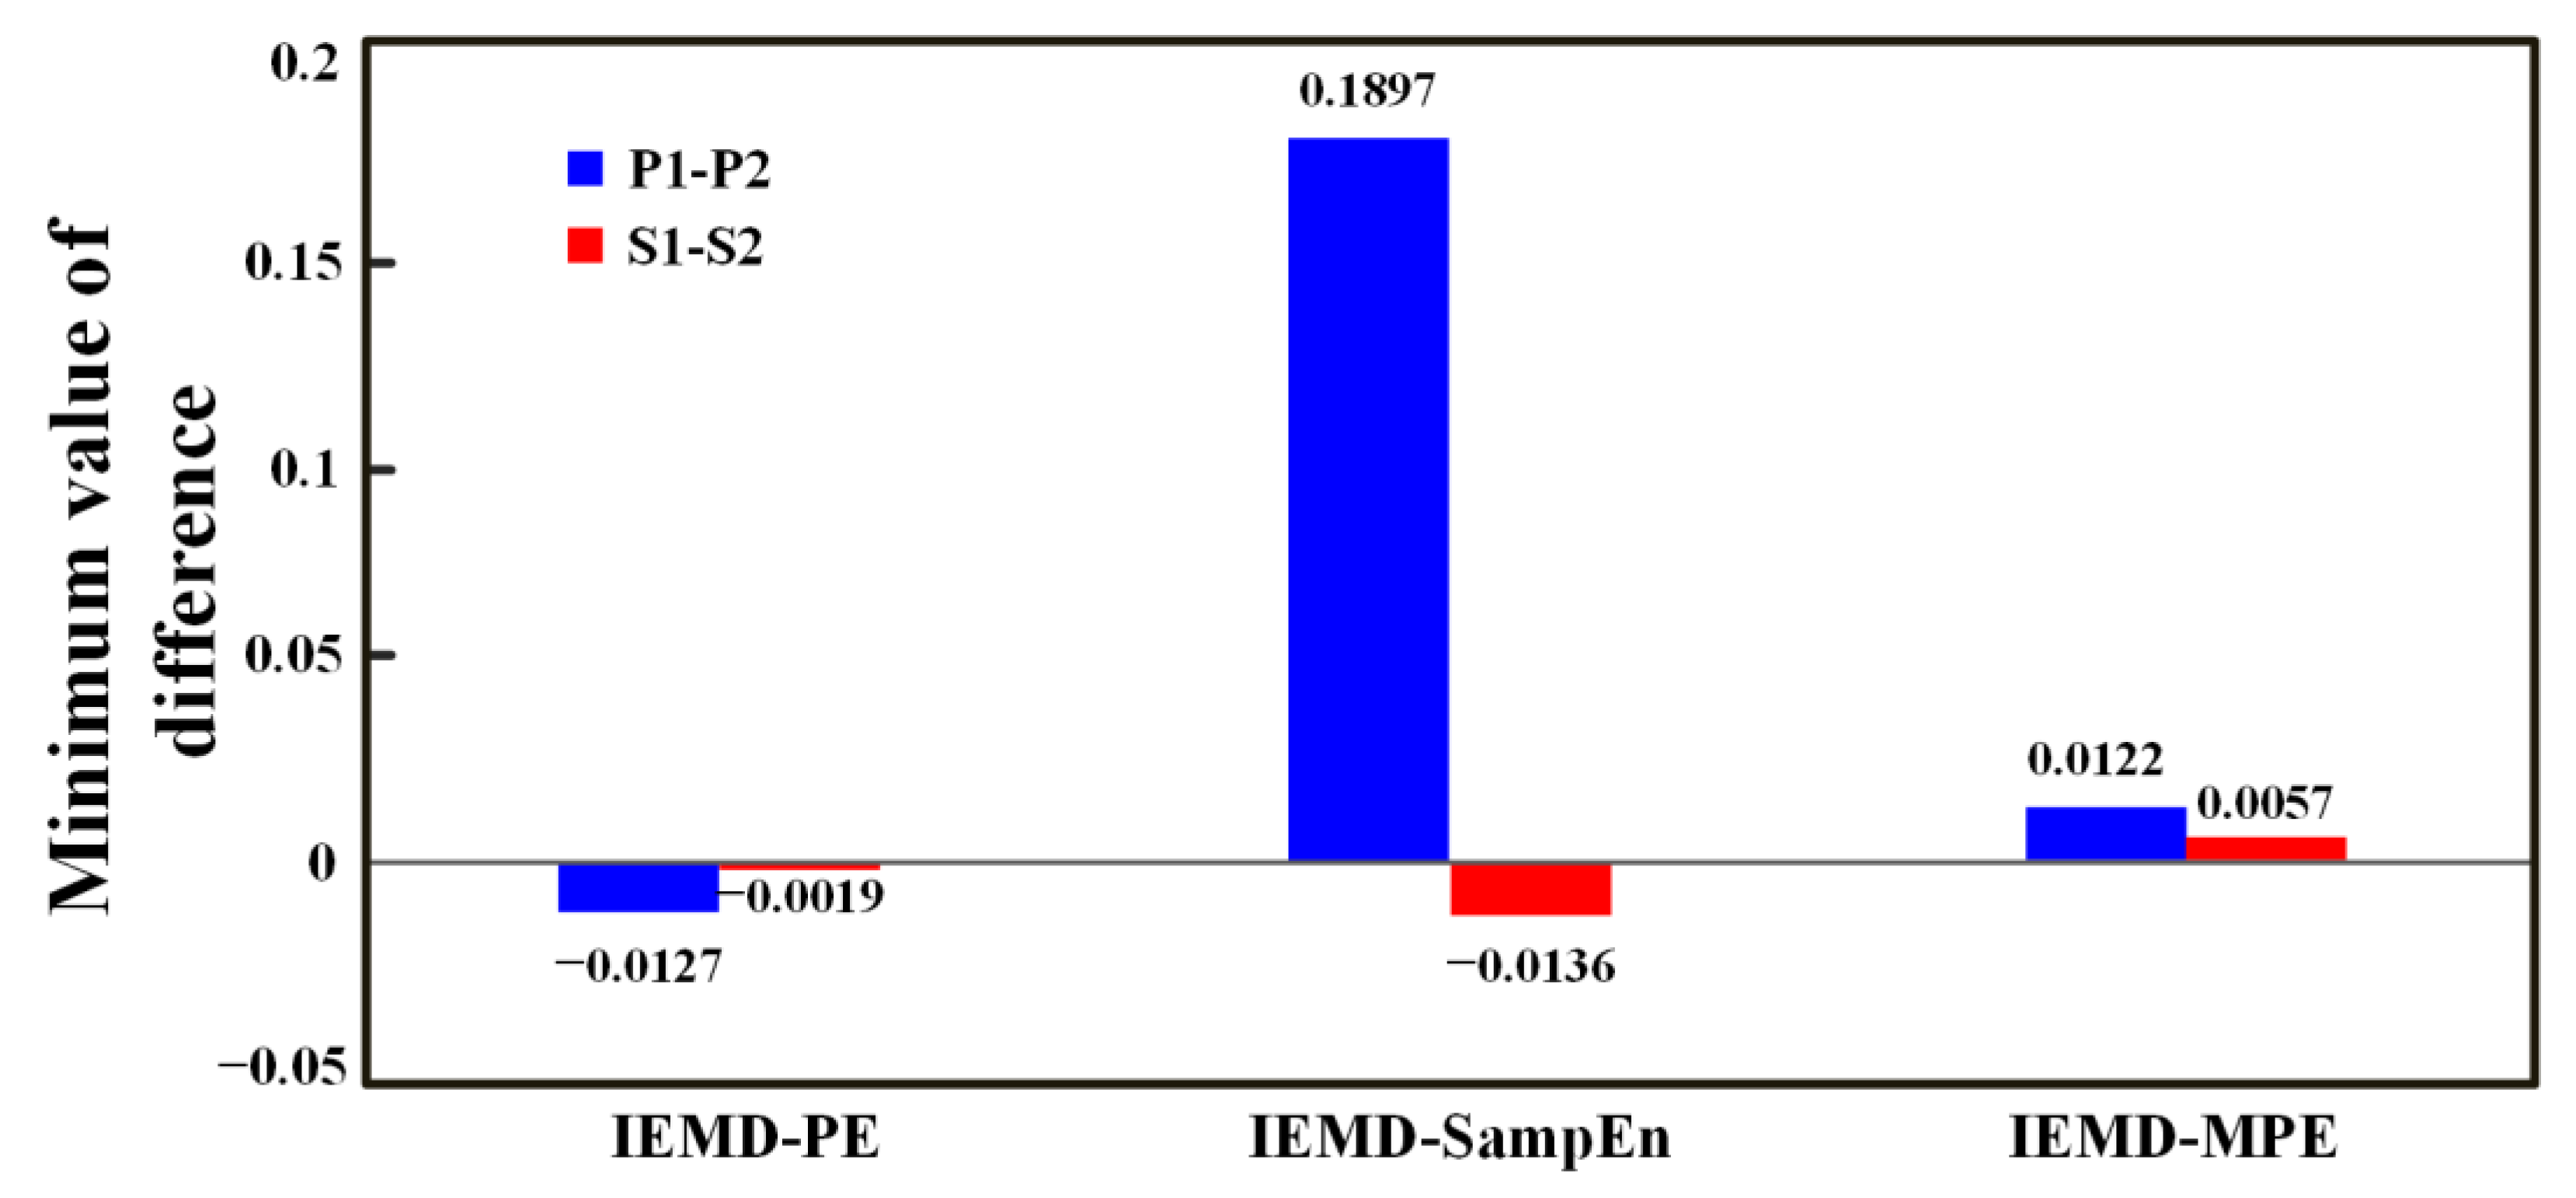
  • An IEMD-based feature extraction method for noise signals is proposed and applied to three types of ship noise signals. Results demonstrate that the IEMD-PE, IEMD-SampEn, and IEMD-MPE methods achieve superior separability compared with the VMD-PE method. The MPE can describe the ship noise from multiple dimensions with strong separability. The IEMD-MPE method is significantly better than the feature extraction method of IEMD-PE and IEMD-SampEn, which can only describe the signal from a single scale, and the IEMD-MPE method improves the minimum difference distance by 101.36% to 212.98% over the IEMD-PE method.
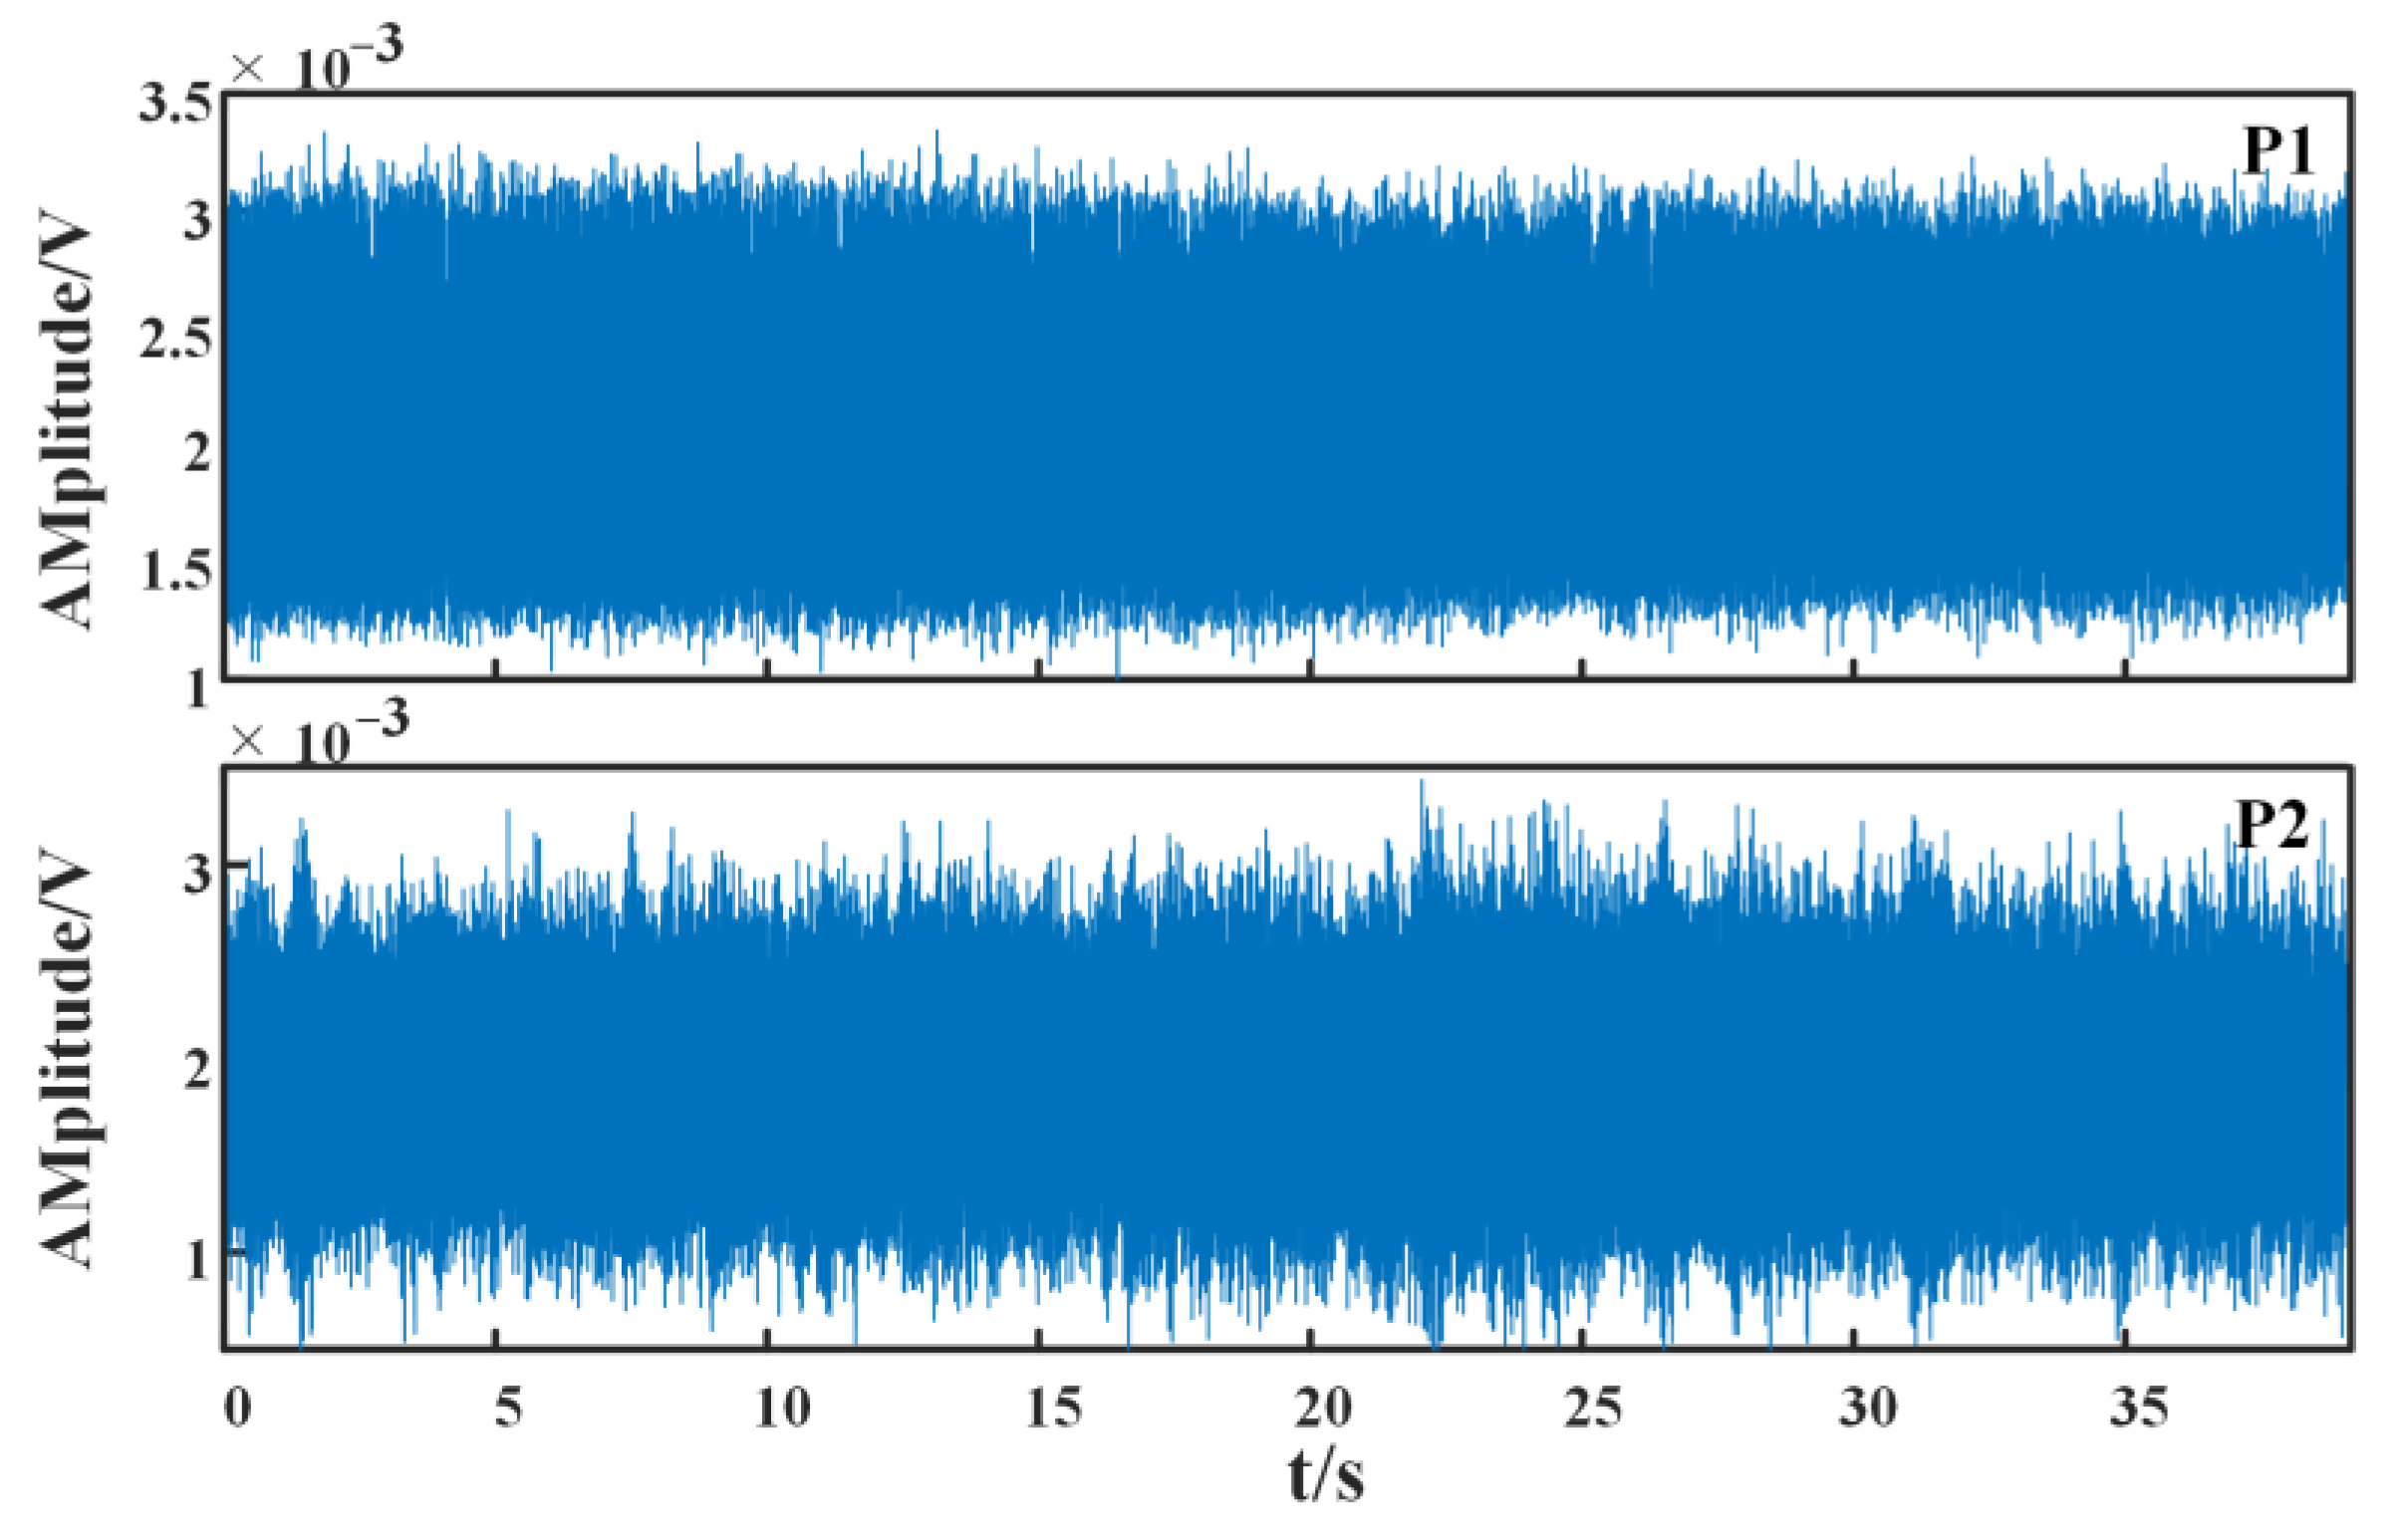
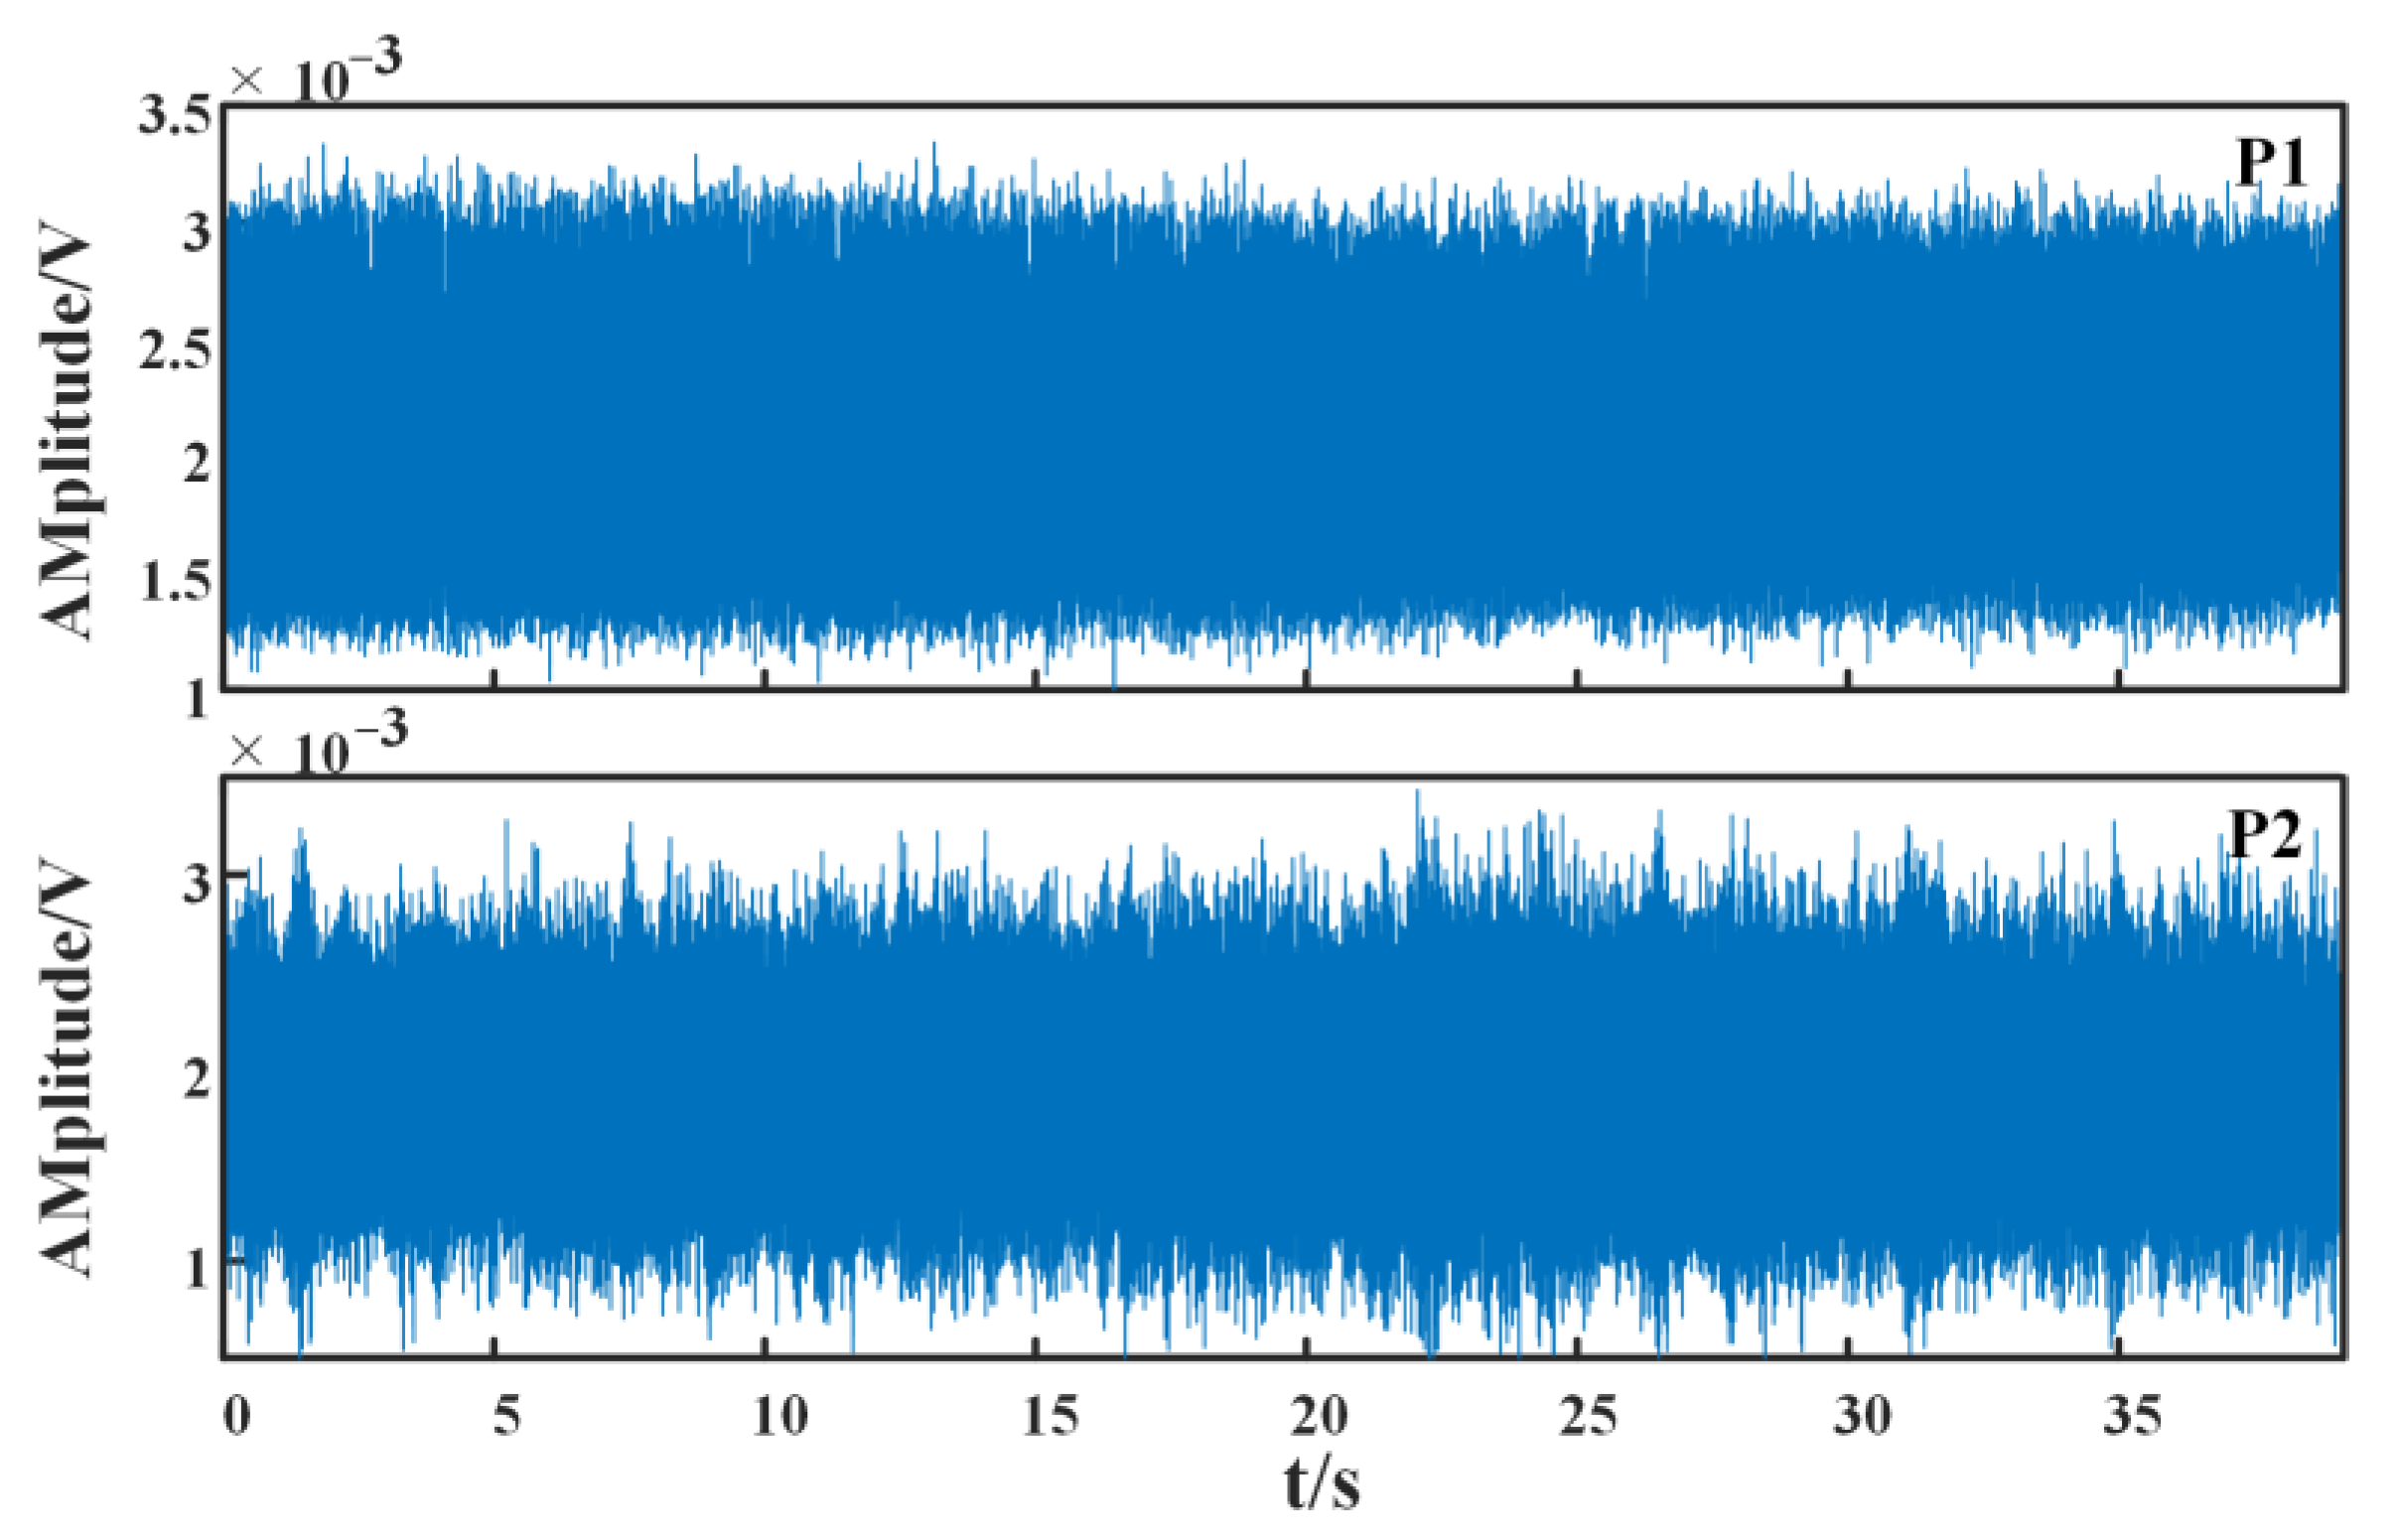
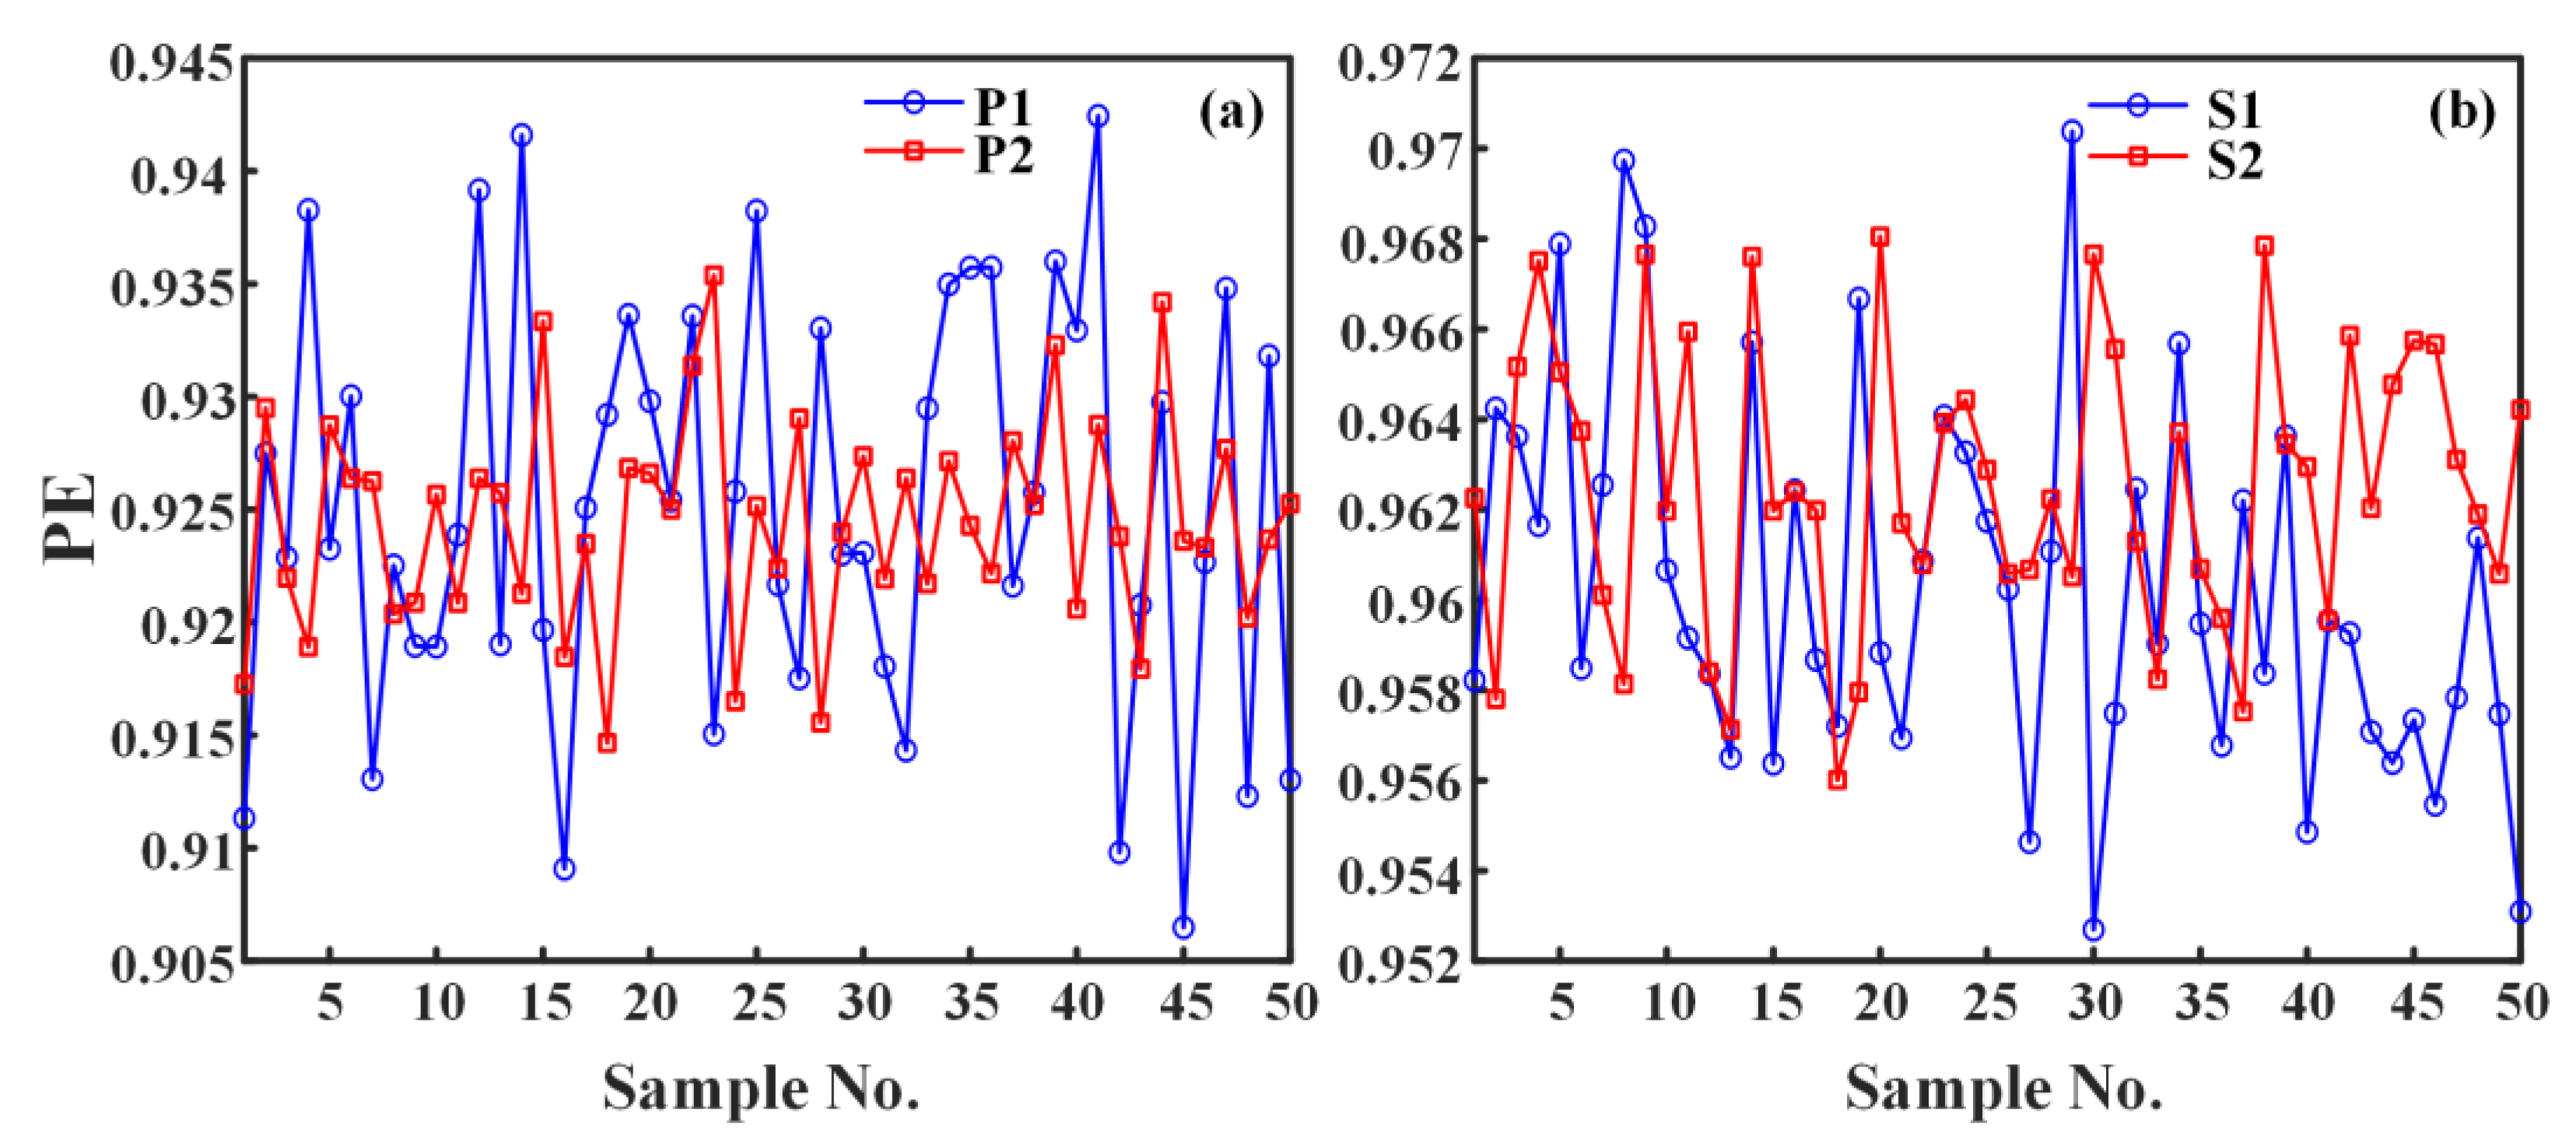
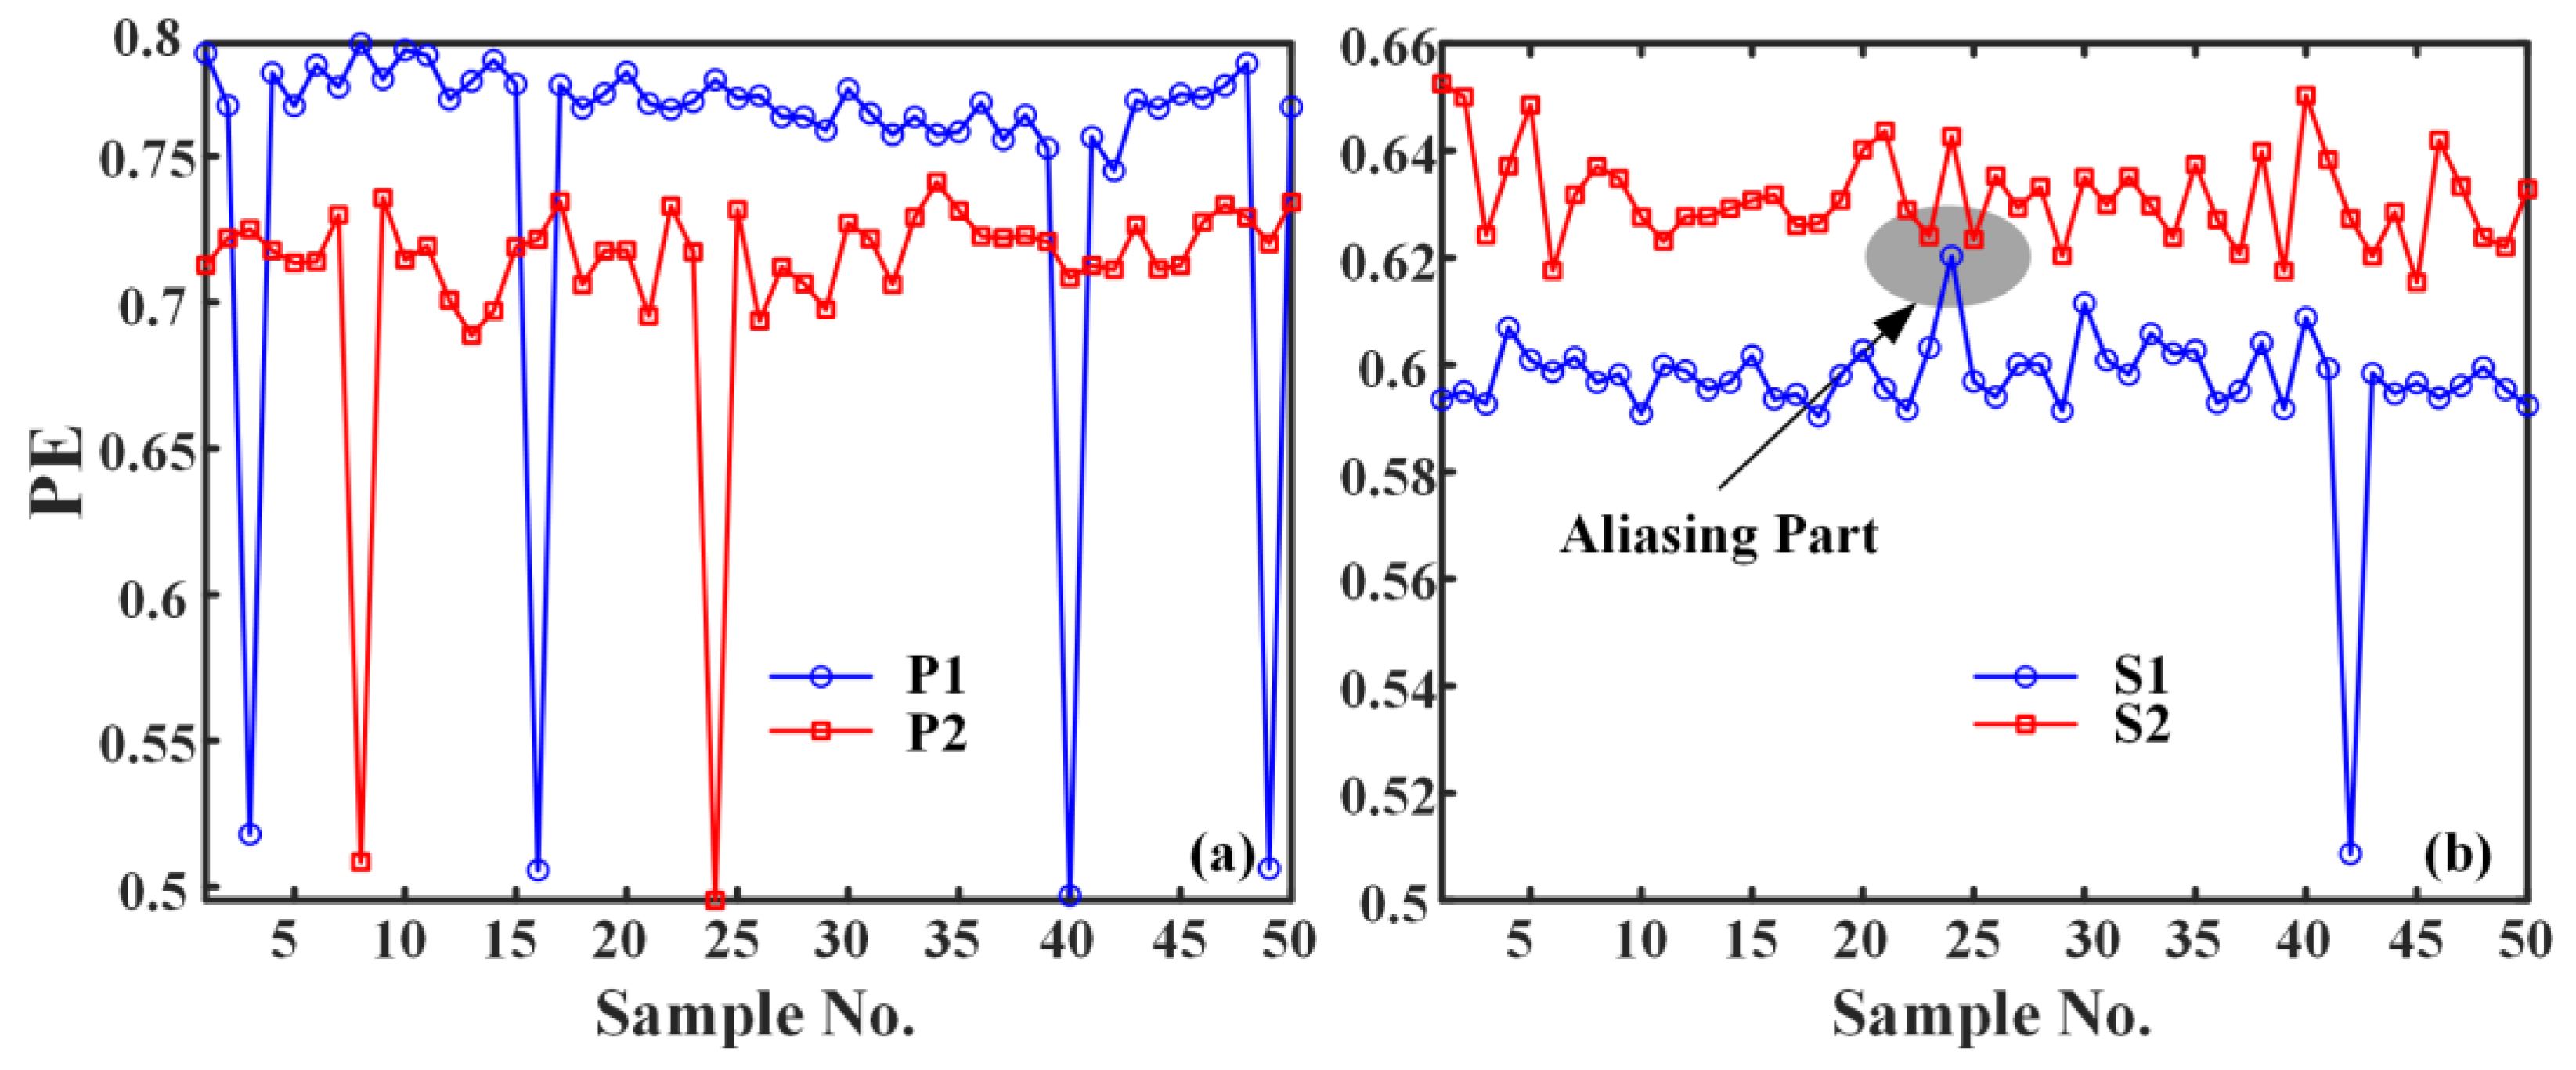
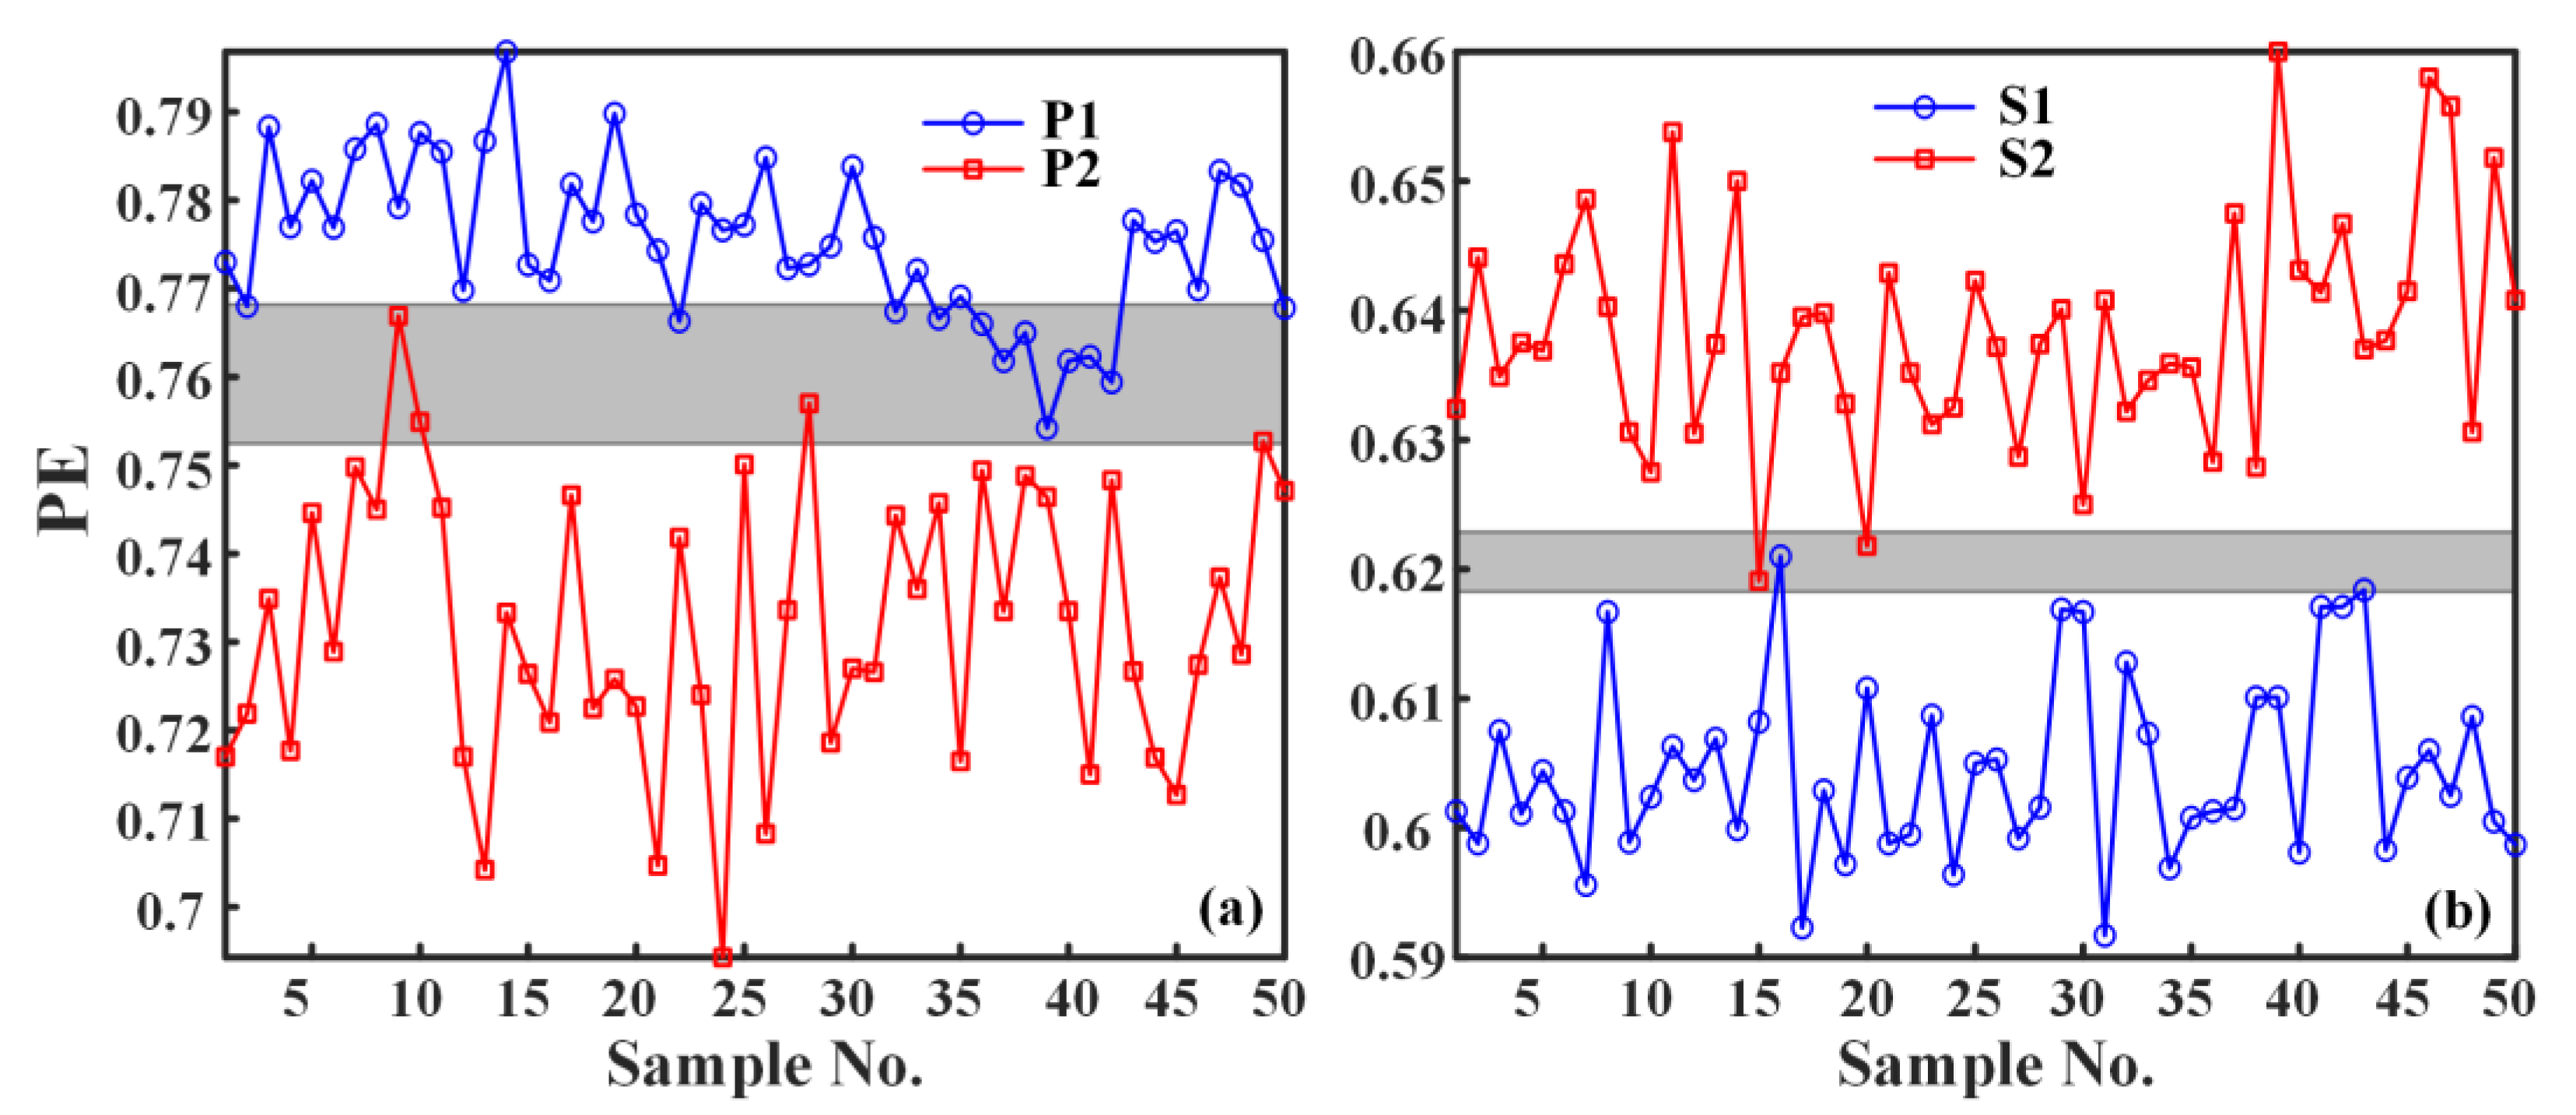
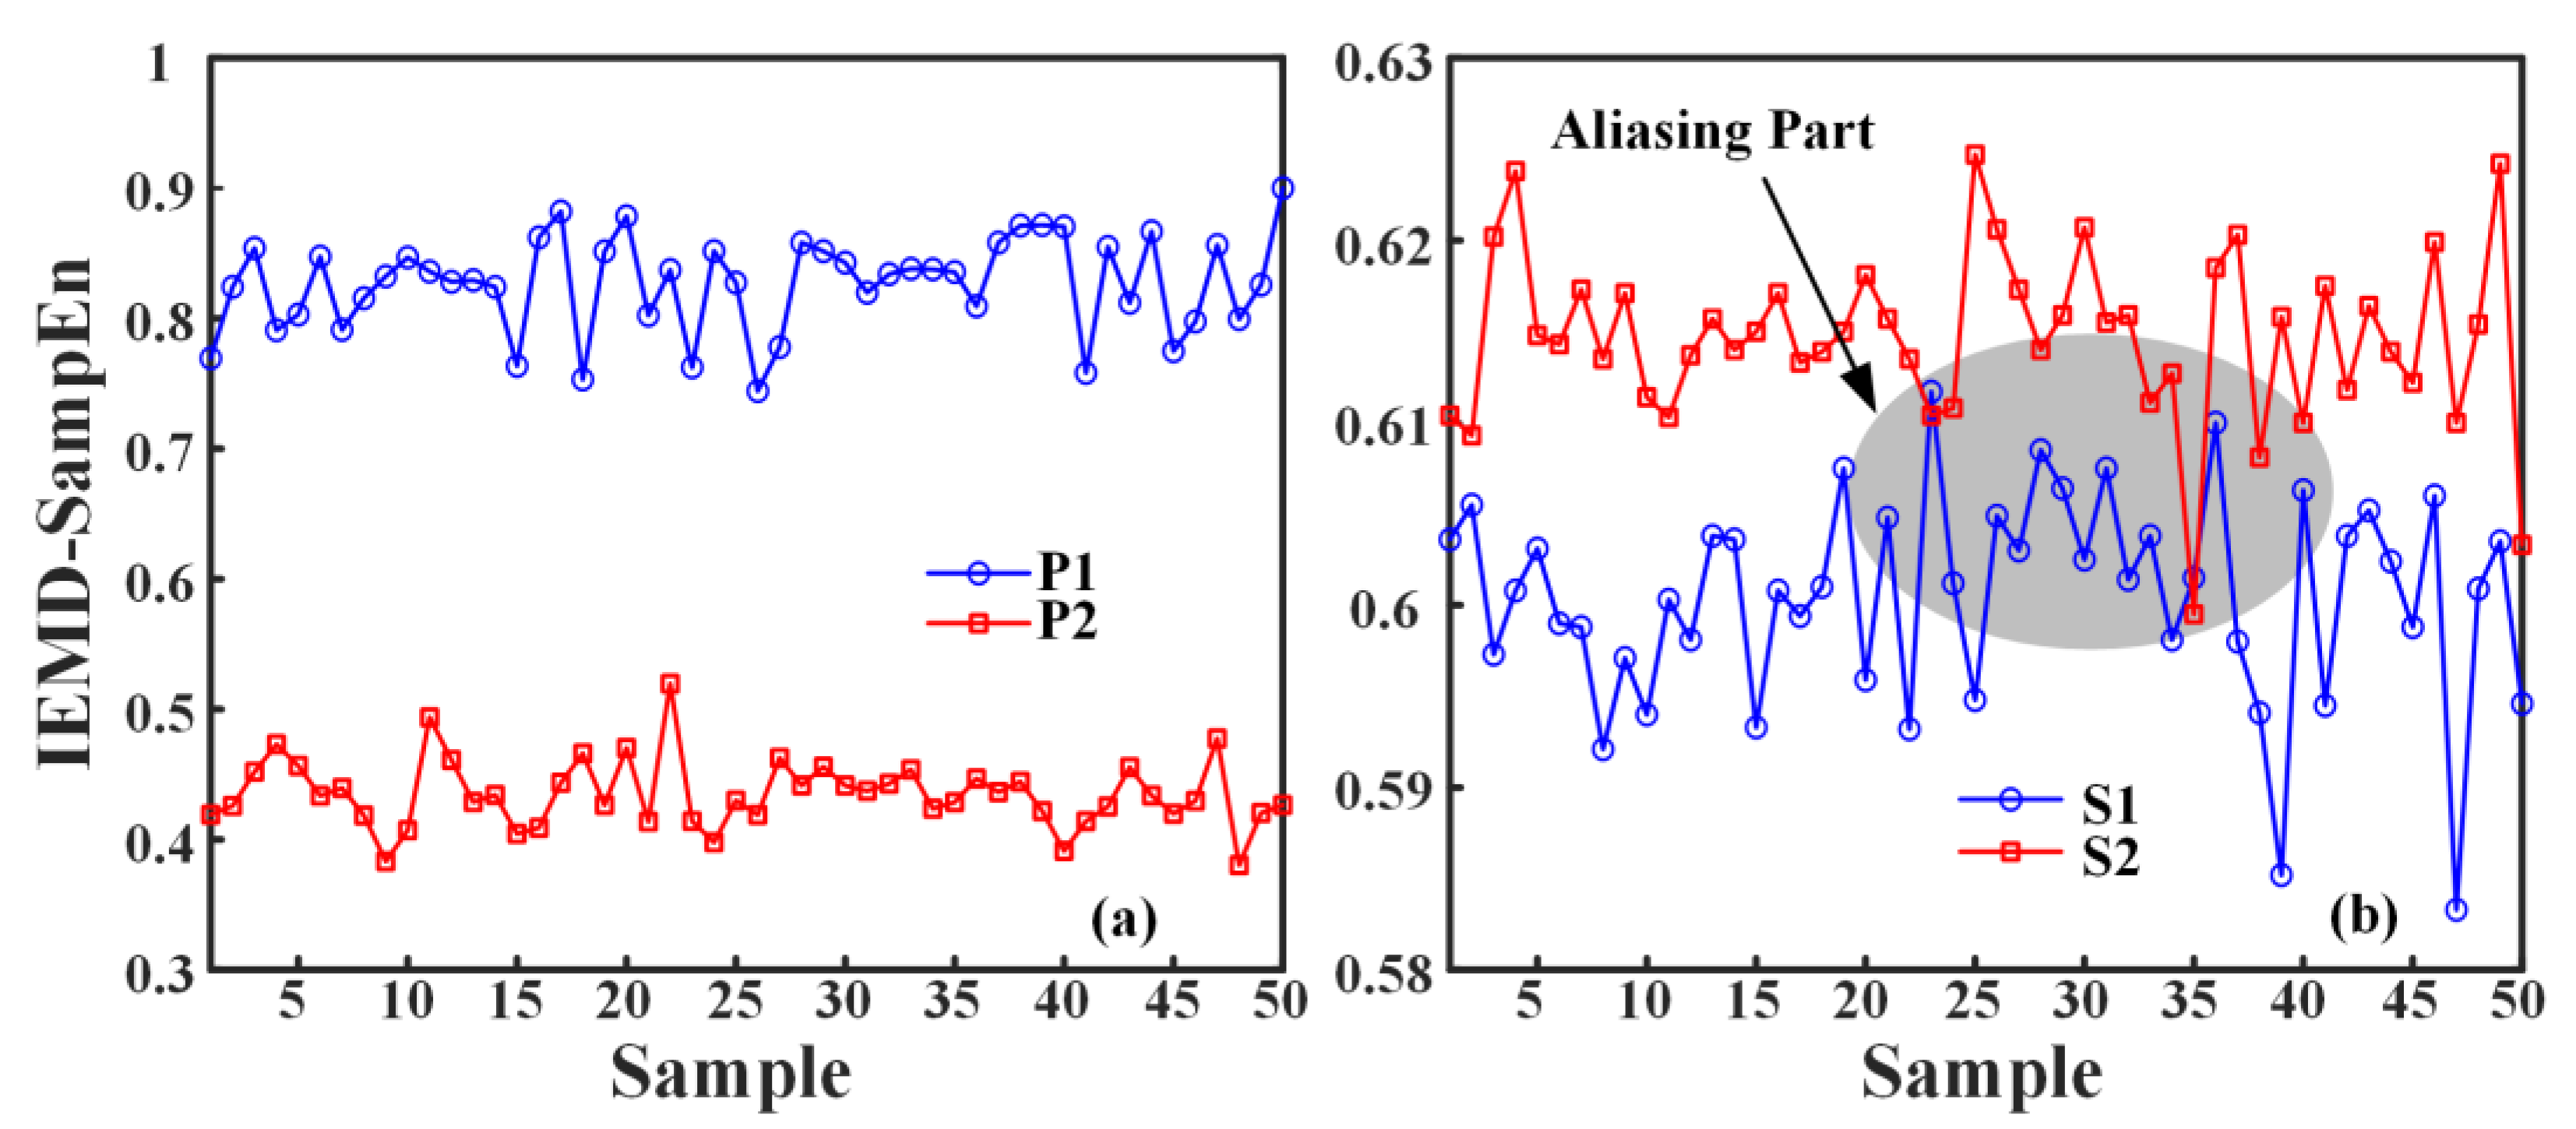
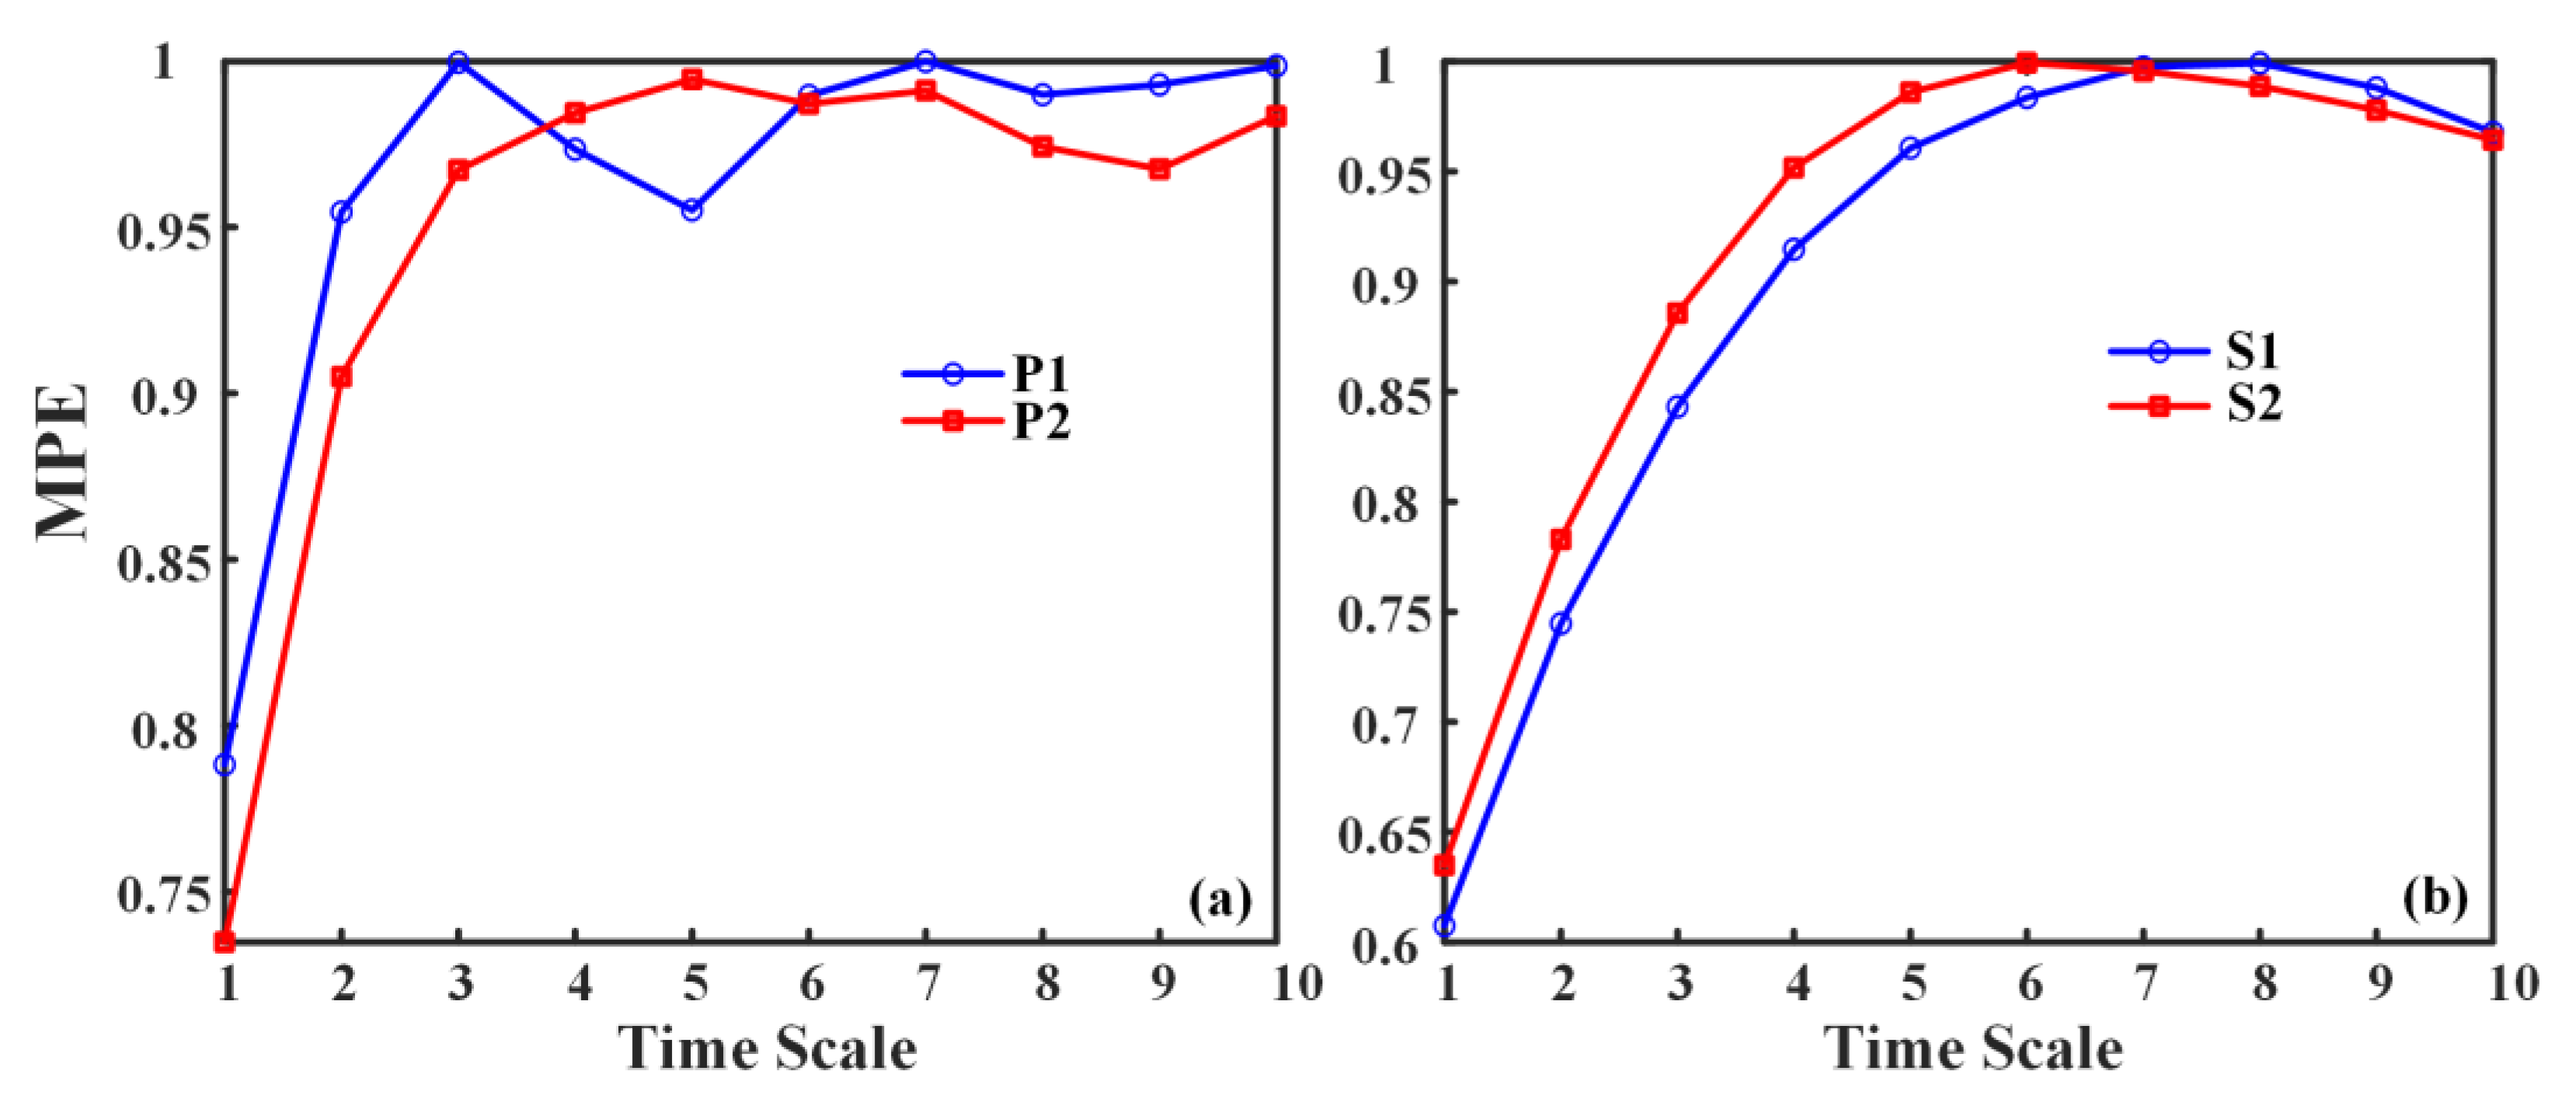
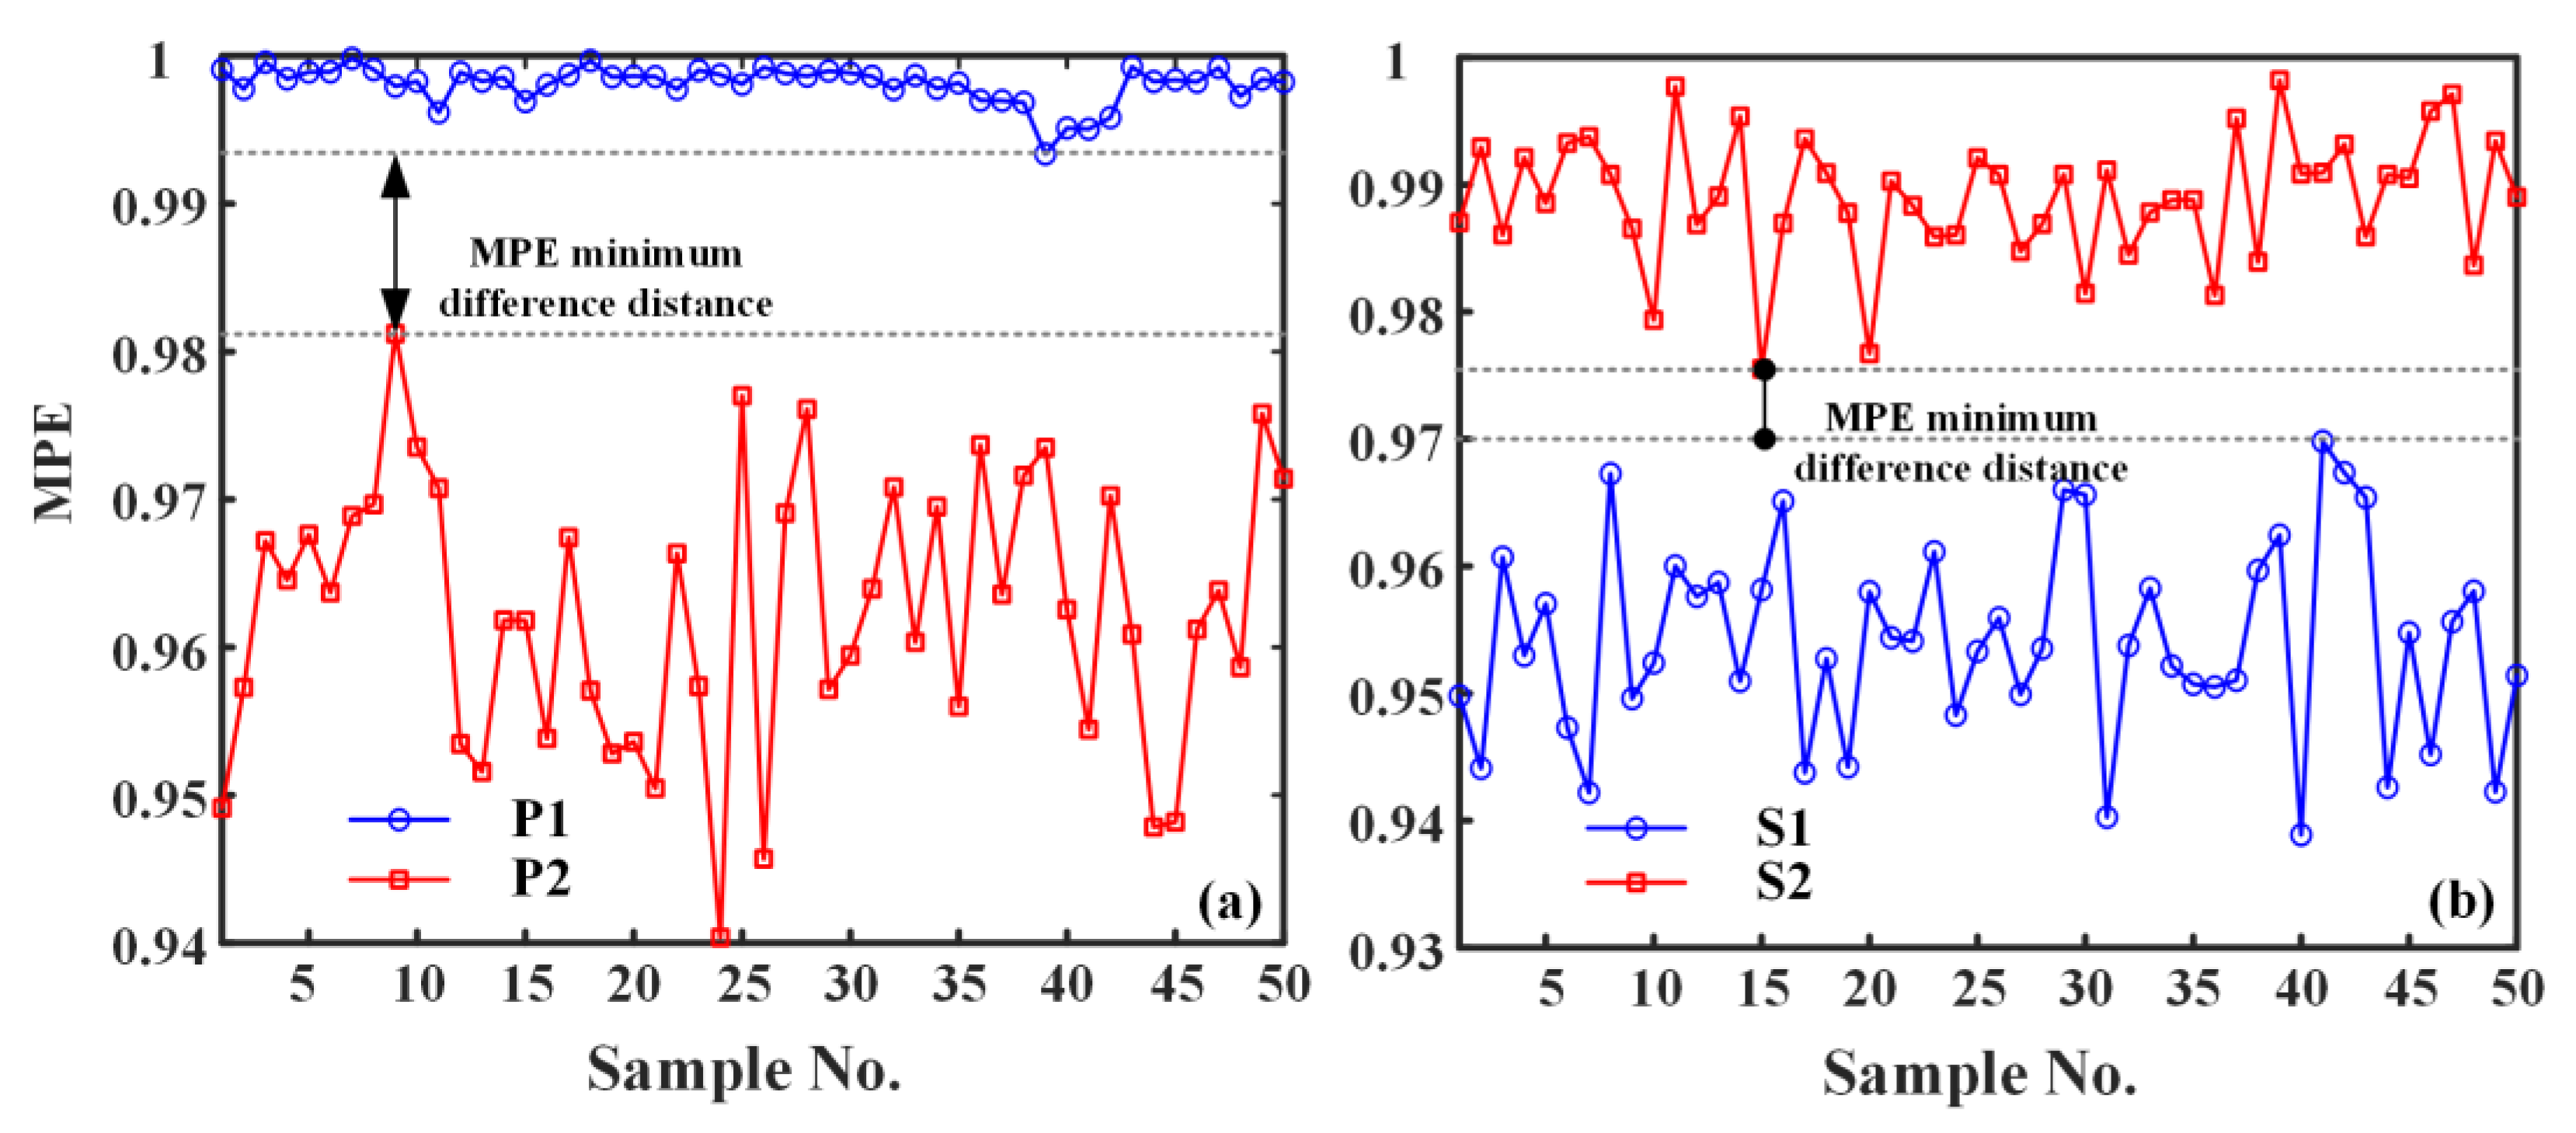
  • To verify the effectiveness and generality of the methods proposed in this paper, IEMD-PE, IEMD-SampEn, and IEMD-MPE are applied to two sets of propulsive noise signals. Since the two sets of underwater thruster noise signals are very similar, the experimental results show that the previous IEMD-PE method is indistinguishable. The IEMD-SampEn has limited differentiation of the noise signals. The IEMD-MPE feature extraction method based on peak cross-correlation enhancement proposed in this paper is not only effective in distinguishing the underwater noise samples of the two propellers with different thrusts in the first group but also in distinguishing the very similar underwater noise signals of the propellers of the same thrust model at both high and low rotational speeds. The minimum difference between the IEMD-MPE feature extraction results of the two sets of experiments is 0.0814 and 0.0057 entropy units, respectively.
Although the IEMD-MPE method based on peak cross-correlation in this study performs effectively in distinguishing underwater vessel noise from propeller noise, it still has some limitations, such as being based on limited sample data and experiments in controlled environments. In practical applications, marine environmental factors may reduce the effectiveness of feature extraction. Therefore, future research could consider validating the robustness of the method under a wider range of conditions (e.g., different signal-to-noise ratios, temperatures, and water depths) and exploring algorithmic improvements to meet the challenges of practical applications. Variations in marine environmental factors may significantly affect the results of acoustic signal processing based on the IEMD-MPE method.
Overall, although the performance of the method under different SNR conditions has not been specifically investigated in existing studies, based on the theoretical foundation and principle analysis of the IEMD-MPE method, the method enhances the feature extraction capability in high-noise environments by introducing MPE and an improved EMD algorithm based on the extended model of the wave inter-correlation principle. Future work will include experiments under different signal-to-noise ratios, temperatures, and water depths to further validate the adaptability and stability of the method.

Author Contributions

Conceptualization, P.L. and C.D.; methodology, P.L. and C.D.; software, C.D.; validation, P.L., C.D. and S.L.; formal analysis, C.D.; investigation, H.J.; resources, G.L.; data curation, X.L.; writing—original draft preparation, C.D.; writing—review and editing, P.L. and C.D.; visualization, S.L.; supervision, G.L.; project administration, P.L.; funding acquisition, P.L. All authors have read and agreed to the published version of the manuscript.

Funding

The authors wish to acknowledge the financial support of the Laboratory of Science and Technology on Integrated Logistics Support, National University of Defense Technology (WDZC20245150310), Natural Science Foundation of Hu’nan (2024JJ6462), Guangxi Scientific Research Basic Ability Enhancement Project (2024KY0355), Natural Science Foundation of Shandong (ZR2021QE059), National Natural Science Foundation (52074161).

Institutional Review Board Statement

Not applicable.

Informed Consent Statement

Not applicable.

Data Availability Statement

The data that support the findings of this study are available from “A Feature Extraction Method of Ship Underwater Noise Using Enhanced Peak Cross-correlation Empirical Mode Decomposition Method and Multi-Scale Permutation Entropy”, upon reasonable request.

Acknowledgments

The authors would like to thank every person/department who helped throughout the research work. The careful review and constructive suggestions made by the anonymous reviewers are gratefully acknowledged.

Conflicts of Interest

The authors declare no conflicts of interest.

References

  1. He, Q.; Wang, H.; Zeng, X.; Jin, A. Ship-Radiated Noise Separation in Underwater Acoustic Environments Using a Deep Time-Domain Network. J. Mar. Sci. Eng. 2024, 12, 885. [Google Scholar] [CrossRef]
  2. Chen, Z.; Li, Y.; Chen, X. Underwater acoustic weak signal detection based on Hilbert transform and intermittent chaos. Acta Phys. Sin. 2015, 64, 200502. [Google Scholar] [CrossRef]
  3. Wang, Q.; Zeng, X.; Wang, L.; Wang, H.; Cai, H. Passive moving target classification via spectra multiplication method. IEEE Signal Process. Lett. 2017, 24, 451–455. [Google Scholar] [CrossRef]
  4. Mehdi, Z.; Nouri, N.M. A new analysis of flow noise outside the time-frequency representation using graph-based feature extraction. Ocean. Eng. 2022, 266, 112700. [Google Scholar] [CrossRef]
  5. Khobotov, A.G.; Kalinina, V.I.; Khil’ko, A.I.; Malekhanov, A.I. Underwater Acoustic Signal Detection against the Background of Non-Stationary Sea Noise. J. Mar. Sci. Eng. 2024, 12, 1540. [Google Scholar] [CrossRef]
  6. Niu, F.; Hui, J.; Zhao, A.; Cheng, Y.; Chen, Y. Application of SN-EMD in Mode Feature Extraction of Ship Radiated Noise. Math. Probl. Eng. 2018, 1, 2184612. [Google Scholar] [CrossRef]
  7. Wang, S.; Zeng, X. Robust underwater noise targets classification using auditory inspired time–frequency analysis. Appl. Acoust. 2014, 78, 68–76. [Google Scholar] [CrossRef]
  8. Wu, G.; Li, J.; Chen, Y.; Yuan, Y.; Chen, Y. Ship radiated-noise recognition (I) the overall framework, analysis and extraction of line-spectrum. ACTA Acust.-Peking 1998, 23, 394–400. [Google Scholar] [CrossRef]
  9. Yasin, Y.A.; Ahmad, Z.S. Improved signal de-noising in underwater acoustic noise using S-transform: A performance evaluation and comparison with the wavelet transform. J. Ocean. Eng. Sci. 2017, 2, 172–185. [Google Scholar] [CrossRef]
  10. Li, Y.; Li, Y.; Chen, X. Ships’ radiated noise feature extraction based on EEMD. J. Vib. Shock 2017, 36, 114–119. [Google Scholar] [CrossRef]
  11. Bao, F.; Li, C.; Wang, X.; Wang, Q.; Du, S. Ship classification using nonlinear features of radiated sound: An approach based on empirical mode decomposition. J. Acoust. Soc. Am. 2010, 128, 206–214. [Google Scholar] [CrossRef] [PubMed]
  12. Shannon, C.E. A mathematical theory of communication. Bell Syst. Tech. J. 1948, 27, 379–423. [Google Scholar] [CrossRef]
  13. Bandt, C.; Pompe, B. Permutation Entropy: A Natural Complexity Measure for Time Series. Phys. Rev. Letters 2002, 88, 174102. [Google Scholar] [CrossRef] [PubMed]
  14. Liu, X.; Li, J.; Zhao, G.; Liu, Y.; Lei, Q. Ship signal denoising and feature extraction based on IVMD-RPE. Tech. Acoustics 2023, 42, 297–305. [Google Scholar] [CrossRef]
  15. Li, Y.; Zhou, Y.; Jiao, S. Multi-scale ensemble dispersion Lempel-Ziv complexity and its application on feature extraction for ship-radiated noise. Appl. Acoustics 2024, 218, 109890. [Google Scholar] [CrossRef]
  16. Li, Y.; Li, Y.; Chen, X.; Yu, J. A novel feature extraction method for ship-radiated noise based on variational mode decomposition and multi-scale permutation entropy. Entropy 2017, 19, 342. [Google Scholar] [CrossRef]
  17. Liu, F.; Li, G.; Yang, H. Application of multi-algorithm mixed feature extraction model in underwater acoustic signal. Ocean. Eng. 2024, 296, 116959. [Google Scholar] [CrossRef]
  18. Chen, Z.; Li, Y. A study on complexity feature extraction of ship radiated signals based on a multi-scale permutation entropy method. J. Vib. Shock 2019, 38, 225–230. [Google Scholar] [CrossRef]
  19. Li, W.; Shen, X.; Li, Y. A comparative study of multiscale sample entropy and hierarchical entropy and its application in feature extraction for ship-radiated noise. Entropy 2019, 21, 793. [Google Scholar] [CrossRef]
  20. Yi, Y.; Li, Y.; Wu, J. Multi-scale permutation Lempel-Ziv complexity and its application in feature extraction for Ship-radiated noise. Front. Mar. Sci. 2022, 9, 1047332. [Google Scholar] [CrossRef]
  21. Li, Y.X.; Li, Y.A.; Chen, Z.; Chen, X. Feature extraction of ship-radiated noise based on permutation entropy of the intrinsic mode function with the highest energy. Entropy 2016, 18, 393. [Google Scholar] [CrossRef]
  22. Wu, Z.; Huang, N.E. Ensemble empirical mode decomposition: A noise-assisted data analysis method. Adv. Adapt. Data Anal. 2009, 1, 1–41. [Google Scholar] [CrossRef]
  23. Liu, Q. A method of line spectrum extraction based on global mean empirical mode decomposition. Ship Electron. Eng. 2020, 40, 40–42, 88. [Google Scholar]
  24. Mehdi, Z.; Nouri, N.M. A novel hybrid feature extraction approach of marine vessel signal via improved empirical mode decom-position and measuring complexity. Ocean. Eng. 2023, 271, 113727. [Google Scholar] [CrossRef]
  25. Huang, N.E.; Shen, Z.; Long, S.R.; Wu, M.C.; Shih, H.H.; Zheng, Q.; Yen, N.C.; Tung, C.C.; Liu, H.H. The empirical mode decomposition and the Hilbert spectrum for nonlinear and non-stationary time series analysis. Proc. R. Soc. Lond. Ser. A Math. Phys. Eng. Sci. 1998, 454, 903–995. [Google Scholar] [CrossRef]
  26. Lin, D.C.; Guo, Z.L.; An, F.P.; Zeng, F.L. Elimination of end effects in empirical mode decomposition by mirror image coupled with support vector regression. Mech. Syst. Signal Process. 2012, 31, 13–28. [Google Scholar] [CrossRef]
  27. Wang, J.; Liu, W.; Zhang, S. An approach to eliminating end effects of EMD through mirror extension coupled with support vector machine method. Pers. Ubiquitous Comput. 2019, 23, 443–452. [Google Scholar] [CrossRef]
  28. He, Z.; Shen, Y.; Wang, Q. Boundary extension for Hilbert–Huang transform inspired by gray prediction model. Signal Process. 2012, 92, 685–697. [Google Scholar] [CrossRef]
  29. León, F.P.; Heizmann, M. Strategies to detect non-linear similarities by means of correlation methods. Intell. Robot. Comput. Vis. XX Algorithms Tech. Act. Vis. 2001, 4572, 513–524. [Google Scholar] [CrossRef]
  30. Huang, N.E.; Chern, C.C.; Huang, K.; Salvino, L.W.; Long, S.R.; Fan, K.L. A new spectral representation of earthquake data: Hilbert spectral analysis of station TCU129, Chi-Chi, Taiwan, 21 September 1999. Bull. Seismol. Soc. Am. 2001, 91, 1310–1338. [Google Scholar] [CrossRef]
  31. Lu, T.; Chen, P.; Yeh, S.; Van, L. Multiple stopping criteria and high precision EMD architecture implementation for Hilbert-Huang transform. In Proceedings of the 2014 IEEE Biomedical Circuits and Systems Conference (BioCAS) Proceedings, Lausanne, Switzerland , 22–24 October 2014; IEEE: Piscataway, NJ, USA, 2014; pp. 200–203. [Google Scholar] [CrossRef]
  32. Ding, Y.; Liu, L.; Liu, S.; Yang, Y. Feature extraction of ship-radiated noise based on VMD and IMWPE. Ship Sci. Technol. 2023, 45, 121–127. [Google Scholar] [CrossRef]
  33. Azad, M.; Khaled, F.; Pavel, M.I. A novel approach to classify and convert 1D signal to 2D grayscale image implementing support vector machine and empirical mode decomposition algorithm. Int. J. Adv. Res. 2019, 7, 328–335. [Google Scholar] [CrossRef] [PubMed]
  34. Xie, D.; Esmaiel, H.; Sun, H.; Qi, J.; Qasem, Z.A.H. Feature extraction of ship-radiated noise based on enhanced variational mode decomposition, normalized correlation coefficient and permutation entropy. Entropy 2020, 22, 468. [Google Scholar] [CrossRef] [PubMed]
  35. Tang, G.; Wang, X.; He, Y.; Liu, S. Rolling bearing fault diagnosis based on variational mode decomposition and permutation entropy. In Proceedings of the 2016 13th International Conference on Ubiquitous Robots and Ambient Intelligence (URAI), Xi’an, China , 19–22 August 2016 ; IEEE: Piscataway, NJ, USA, 2016; pp. 626–631. [Google Scholar] [CrossRef]
Figure 1. Overall flow frame diagram.
Jmse 12 02222 g001
Figure 2. Peak location diagram.
Jmse 12 02222 g002
Figure 3. Peak cross-correlation extended signal diagram.
Jmse 12 02222 g003
Figure 4. IEMD flow diagram.
Jmse 12 02222 g004
Figure 5. Original analog signal.
Jmse 12 02222 g005
Figure 6. Comparison between EMD results and original simulated signal diagram: (a) Diagram of EMD-IMF1 against the original signal S1; (b) Diagram of EMD- IMF2 against the original signal S2.
Jmse 12 02222 g006
Figure 7. Extended analog signal: (a) The extended length is the length of the most similar signal segment; (b) the extension length is four times the length of the most similar signal segment; (c) The extension length is five times the length of the most similar signal segment; (d) The extension length is eight times the length of the most similar signal segment.
Jmse 12 02222 g007
Figure 8. IEMD results.
Jmse 12 02222 g008
Figure 9. Comparison between IEMD Results and Original Signal Diagram. (a) Diagram of IEMD-IMF1 against the original signal S1; (b) Diagram of IEMD- IMF2 against the original signal S2.
Jmse 12 02222 g009
Figure 10. Comparison between the decomposition results of the supplementary zero-value signal method and the original analog number diagram: (a) Diagram of IMF1 against the original signal S1; (b) Diagram of IMF2 against the original signal S2.
Jmse 12 02222 g010
Figure 11. Comparison between the decomposition results of the supplementary symmetric signal method and the original analog number diagram: (a) Diagram of IMF1 against the original signal S1; (b) Diagram of IMF2 against the original signal S2.
Jmse 12 02222 g011
Figure 12. Comparison between the decomposition results of the supplementary periodic signal method and the original analog number diagram: (a) Diagram of IMF1 against the original signal S1; (b) Diagram of IMF2 against the original signal S2.
Jmse 12 02222 g012
Figure 13. Comparison of RMSE values.
Jmse 12 02222 g013
Figure 14. Schematic diagram of data acquisition system.
Jmse 12 02222 g014
Figure 15. Waveform diagram of the time domain: (a) cruise ships noise signal; (b) freighters noise signal; (c) state ferries noise signal.
Jmse 12 02222 g015
Figure 16. EMD decomposition results: (a) EMD results of cruise ships noise signal; (b) EMD results of freighters noise signal; (c) EMD results of state ferries noise signal.
Jmse 12 02222 g016
Figure 17. IEMD decomposition results: (a) IEMD results of cruise ships noise signal; (b) IEMD results of freighters noise signal; (c) IEMD results of state ferries noise signal.
Jmse 12 02222 g017
Figure 18. The PE distribution of ship-radiated noise.
Jmse 12 02222 g018
Figure 19. The EMD-PE feature diagram.
Jmse 12 02222 g019
Figure 20. The IEMD-PE feature diagram.
Jmse 12 02222 g020
Figure 21. The VMD-PE feature diagram.
Jmse 12 02222 g021
Figure 22. The previous improved EMD-PE feature diagram.
Jmse 12 02222 g022
Figure 23. The IEMD-SampEn feature diagram.
Jmse 12 02222 g023
Figure 24. The MPE at different time scales.
Jmse 12 02222 g024
Figure 25. The IEMD-MPE feature diagram.
Jmse 12 02222 g025
Figure 26. The minimum value of difference of various entropy characteristics between the underwater noise signals of different ships.
Jmse 12 02222 g026
Figure 27. Propeller underwater noise signal acquisition experimental equipment.
Jmse 12 02222 g027
Figure 28. Waveform of noise signal of different types of thrusters.
Jmse 12 02222 g028
Figure 29. Waveform of noise signal of small thruster at different speeds.
Jmse 12 02222 g029
Figure 30. The PE characteristics of propeller underwater noise signal (a) first group; (b) second group.
Jmse 12 02222 g030
Figure 31. The EMD-PE characteristics of propeller underwater noise signal (a) first group; (b) second group.
Jmse 12 02222 g031
Figure 32. The IEMD-PE characteristics of propeller underwater noise signal (a) first group; (b) second group.
Jmse 12 02222 g032
Figure 33. The IEMD-SampEn characteristics of propeller underwater noise signal (a) first group; (b) second group.
Jmse 12 02222 g033
Figure 34. The IEMD-MPE characteristics at different time scales (a) first group; (b) second group.
Jmse 12 02222 g034
Figure 35. The IEMD-MPE characteristics of propeller underwater noise signal (a) first group; (b) second group.
Jmse 12 02222 g035
Figure 36. The minimum difference between the different entropy characteristics of two groups of propeller noise.
Jmse 12 02222 g036
Table 1. Signal expansion modes.
Extension TypeExtended Form
Zero signal Extension 0 , 0 , 0 x 1 , x 2 , x 3 x n 2 , x n 1 x n 0 , 0 , 0
Periodic signal Extension x n 2 , x n 1 , x n x 1 , x 2 , x 3 x n 2 , x n 1 x n x 1 , x 2 , x 3
Symmetric signal Extension x 3 , x 2 , x 1 x 1 , x 2 , x 3 x n 2 , x n 1 x n x n , x n 1 , x n 2
Table 2. Values of RMSE.
MethodIMF1 (RMSE)IMF2 (RMSE)
EMD0.71180.7428
Supplementary periodic signal0.52340.6192
Supplemental zero signal0.36061.0765
Supplementary symmetric signal0.87450.9484
Peak cross-correlation-IEMD0.53490.7259
Table 3. Energy values of each IMF.
Cruise ShipFreighterState Ferry
IMF10.03384.20430.5898
IMF20.05575.71733.0221
IMF30.64026.45434.7652
IMF49.03742.84732.7068
IMF56.60142.570311.3309
Table 4. Maximum and minimum values of entropy features of various methods.
IEMD-PEVMD-PEPIEMD-PEIEMD-SampEnIEMD-MPE
Freighter Minimum value0.53870.35210.50230.50060.9881
Cruise ShipMaximum value0.48730.32850.47440.35610.8846
Minimum value0.45860.27340.43920.13470.7325
State FerryMaximum value0.43010.28430.44270.11850.6482
Table 5. Maximum and minimum values of entropy features of various methods.
IEMD-PEIEMD-SampEnIEMD-MPE
P1Minimum value0.75420.72250.9934
P2Maximum value0.76690.53280.9812
S2Minimum value0.61910.59850.9755
S1Maximum value0.62100.61210.9698
Disclaimer/Publisher’s Note: The statements, opinions and data contained in all publications are solely those of the individual author(s) and contributor(s) and not of MDPI and/or the editor(s). MDPI and/or the editor(s) disclaim responsibility for any injury to people or property resulting from any ideas, methods, instructions or products referred to in the content.

