1. Introduction
Port state control (PSC) plays an essential role in the current ship supervision system, serving as a complement to flag state inspections. The International Maritime Organization (IMO) has established various maritime regulations to ensure compliance, safety in maritime operations, and environmental protection [
1], including the International Convention for the Safety of Life at Sea (SOLAS); the International Convention on Standards of Training, Certification and Watchkeeping for Seafarers (STCW); etc. In order to verify that ships are actually operating in accordance with international regulations and standards, port states select potentially high-security-risk ships for boarding and inspection upon arrival, and non-compliance can result in fines or ship detention [
2]. In 2023, the number of detained ships increased by over 80% compared with 2022, as reported by the Tokyo Memorandum of Understanding (MoU) [
3], which highlights persistent issues with ship deficiencies that pose continuous safety risks to the crew and the marine environment. Detained ships experience both time and resource challenges, and the resulting delays in ship schedules can add high operating costs [
4], such as cargo demurrage costs [
5]. These challenges make it difficult for shipowners to arrange effective operation plans and lead to potential loss of business opportunities. Statistics show that if a Panamax vessel is detained, the daily off-hire cost can be as high as USD 20,000 [
6]. In general, there are direct losses such as repair and maintenance costs (dry dock, parts fees, etc.) as well as indirect economic losses such as lost revenue and higher insurance premiums [
7]. For the port authorities, a large number of ships staying in the port for a long period of time and constantly occupying berth resources aggravates the port congestion, which affects the operational efficiency of the port and adds additional burdens to the port management.
Ships can be released from detention only when the relevant deficiencies have been rectified and there is no longer a risk of harm to safety or the environment [
8]. But the time a detained ship takes to be released following PSC inspection often involves substantial uncertainty and variation, complicating the ability of shipping companies and port authorities to develop proactive response strategies. This, in turn, has a negative impact on ship operational efficiency and port management [
9]. Therefore, it is particularly important to accurately and effectively predict the duration a ship will be detained, so that the relevant parties can implement more effective management strategies. Specifically, if the ship stays for only a short term of detention duration, i.e., one or two days, the shipping company can flexibly dispatch the route plan and change the speed of the subsequent voyage to meet the cargo delivery date without mobilizing other ships to take over the operation; the port state can speed up the pre-release inspection of the ship and reasonably allocate resources so as to be able to arrange the berthing plan of other merchant ships without triggering port congestion. If the ship’s deficiencies are very severe and it must remain in port for a long time for repair and maintenance, the shipping company must arrange for other ships to take over the duty of cargo transportation to ensure the fulfillment of the contract, and secondly, it also needs to re-schedule the crew of the detained ship in order to control operating costs, etc. Ports may need to set up a specific berthing area for the long-term detained ship, which makes it necessary for the port authorities to consider the limited resources when arranging berthing plans, to formulate timely response strategies to ensure the safe and orderly loading and unloading of incoming vessels, and to arrange for personnel to follow up on the repair of the detained ship.
In recent years, scholars have conducted a wide range of studies to discuss the characteristics of ship detention data and predict ship risk and have obtained abundant research results, which have found that the ship age, port state factors, etc. have an important impact on ship detention in PSC inspections. For example, Chuah et al. [
10] conducted Bayesian model analysis of the influencing factors of port state control, Fan et al. [
11] pointed out the importance of flag choice in ship inspection, while Sanlier analyzed the ship inspection in the Black Sea region [
12]. However, while scholars have mostly focused on the port state inspection level, i.e., whether a ship is detained or not or the potential risk of arriving ships, few studies have focused on the issue of ships being detained in port, such as the duration of ships’ detention. Although Yang et al. [
13] analyzed the ship detention duration, they stayed at the level of correlation analysis only, pointing out the key influencing factors of the ship detention duration, and there has not been any research on predicting the long-term or short-term detention of ships. To address this gap, this paper combines improved entropy weight–grey relational analysis and random forest to construct a prediction model for ship detention duration, aiming to provide a reference for port states to reduce port congestion and for shipping companies to optimize ship operation plans. Firstly, based on the improved entropy weight–grey relational analysis, this study analyzes the influence of 16 deficiency types in port state inspections on the ship detention duration and identifies the key deficiency categories, which provides support for the subsequent construction of the prediction model. Then, due to the wide distribution of the ship detention durations, the specific time of ship detention is often accompanied by uncertainty; most of the ships are either released on the same day or stay for one day. This paper divides the ship detention duration into two categories, long-term and short-term detention, to reduce the impact of data uncertainty and constructs a random forest classification model for prediction with consideration of the imbalanced datasets of the short-term and long-term detention.
This study not only comprehensively investigates the influence mechanism of ship detention duration to predict whether a ship will be detained for a short term or long term, but it also provides a scientific basis of accurate management for shipping companies and port managers. The accurate classification of long-term and short-term ship detention can provide early warning of ship detention, provide targeted decision support and flexible and efficient response strategies for related parties, help shipping companies optimize ship scheduling and personnel arrangements, and also assist port authorities to improve their overall efficiency and management level.
2. Literature Review
2.1. Influencing Factors
Research on the factors affecting ship detention is extensive and mature, and scholars have analyzed the influencing factors of detention in depth from multiple perspectives, such as ship inherent attributes and ship deficiency types, etc., in an attempt to reveal the key reasons leading to ship detention and to provide support for improving the efficiency of port state supervision.
On the one hand, scholars have constructed the indicator system by combining two aspects, namely, ship characteristic factors and port state control factors. Ship intrinsic attributes refer to the characteristics of the ship itself, including variables such as age, ship type, and ship tonnage; port state control factors refer to factors related to the PSC inspections, including flag state performance level, recognized organization performance level, and number of ship deficiencies. Cariou et al. [
14] quantitatively examined the Tokyo MoU data from 2000 to 2011, considering several categories of factors such as ship age, ship type, flag, port state, recognized organization, and year of inspection, and found that port state and ship type have a greater degree of influence on ship safety. Şengül Şanlıer [
12] scrutinized factors affecting vessel detentions based on PSC inspection data from the Black Sea MoU between 2012 and 2017. The analysis underscored vessel age, vessel type, flag, recognized organization, type of defects, and port state as significant factors, with vessel age emerging as the most influential. Xiao et al. [
15] employed binary logistic regression and decision trees to examine factors influencing vessel detentions based on the inspection records from the Tokyo MoU from 2015 to 2017 and identified vessel age, vessel type, flag state performance, and number of defects as pivotal factors in the new inspection regime. Chuah et al. [
16] conducted qualitative and quantitative analyses on PSC inspection data under the Tokyo MoU from 2016 to 2021. They also observed that flag state and vessel type played pivotal roles in PSC inspections. Wang et al. [
17] categorized factors affecting PSC inspections into vessel technical characteristics, PSC inspection factors, and deficiency types. They utilized a Bayesian network to identify key influencing factors and explore dependencies among variables. The analysis revealed vessel tonnage and PSC inspection factors as prominent influencers on port state inspections.
On the other hand, after conducting boarding inspections, Port State Control Officers (PSCOs) will document their findings and record and store ship deficiency types in the MoU’s detention database, such as Certificate and Documentation defects, fire safety issues, and Working and Living Conditions [
18,
19]. Ship deficiency types have also been another focus of PSC research, generally identifying the key deficiency types that affect ship detention. Chen et al. [
5] selected nine defect types including emergency systems, fire safety measures, and life-saving equipment, applying entropy-weighted grey relational analysis to study vessel detention data from the Tokyo MoU between 2008 and 2017. They found the International Safety Management (ISM) code, emergency systems, and fire safety measures to be primary detention factors. Maşalacı and Çakır [
20] also employed the correlation between various types of deficiencies before and after COVID-19 based on entropy-weighted grey relational analysis and found that the influence and interrelationships of various types of defects had some changes before and after the outbreak; for example, the number of emergency systems and fire safety deficiencies that caused ships to be detained decreased significantly after COVID-19. Zhu et al. [
21] collected the data from the two MoUs of Tokyo and Paris, compared the critical deficiency types in the different MoUs, and found that the categories affecting ship detention were different, with the most critical factors in the Tokyo MoU being life-saving equipment and ISM, while fire safety and water/weatherproof conditions of ships were the most important in the Paris MoU. Tsou et al. [
22], Chen et al. [
23], and Fu et al. [
24] utilized association rule analysis to investigate ship defect code interrelationships and how defects correlate with external factors such as vessel age and tonnage.
The existing research on the selection of indicators of ship detention is very mature, mostly for the ship characteristics factors, port state inspection factors, and deficiency types, and previous studies pointed that these three categories of variables have an impact on ship detention, so this paper will consider all three categories to build a comprehensive variable system. At the same time, all activities in the shipping industry are directly or indirectly regulated by the shipping market; based on the fluctuations in the market, shipping companies weigh their own costs and benefits and constantly adjust the ship’s operating strategy, which affects the ship’s regular maintenance schedule. Therefore, this paper will also introduce market factors to further explore the impact of the shipping market on ship detention and provide a more integrated research perspective.
2.2. Detention Prediction
Ship detention prediction studies usually focus on analyzing and predicting the likelihood of a ship being detained after port state inspection. This type of research aims to identify and assess the risk factors that may lead to ship detention [
25] and help shipping companies take preventive measures by constructing prediction models [
26,
27]. Research methods are mostly based on machine learning models, such as random forest and Bayesian network. Yan et al. [
28] established a balanced random forest to predict ship detention based on Hong Kong’s PSC inspection data from 2016 and 2018, which solved the problem of imbalance between the detained and non-detained ship datasets. Xiao et al. (2024) developed an uncertain random forest algorithm to further consider the uncertainty and imbalance of ship detention data and predicted the probability of ship detention; Demirci and Cicek [
29] proposed an intelligent ship inspection analysis (I-SIA) model to identify ship deficiency patterns based on specific ship attributes and to predict the deficiency types that need to be focused on for the ship to be inspected based on historical PSC inspection records. Fu et al. [
30] applied the Analytic Hierarchy Process (AHP) model to identify the most critical defect types, which were subsequently integrated into a naive Bayesian algorithm, and selected more than five thousand general cargo and bulk carriers’ data to predict ship detention probabilities. Shen et al. [
31] combined the importance performance analysis (IPA) and the technique for order of preference by similarity to ideal solutions (TOPSIS) to develop a ship risk prediction and identification system for the high-risk ships that exist among the Standard Risk Ships in PSC inspections, which identifies the hidden high-risk ships in the SRS category and can further improve the efficiency and effectiveness of PSC inspections.
Ship detention prediction research provides an important decision support tool for shipping enterprises that can help improve the efficiency and safety of ship management and operation while assisting port states to rationally allocate PSC inspection resources by evaluating the risk of ships. However, the current forecasting of ship detention neglects to pay attention to the ship detention duration. During the period of detention, ships must be repaired and maintained in the port, and there are a lot of uncertainties in their operation and management. The additional costs incurred in the port make it difficult for shipping companies to effectively deploy the voyage plan. And detained ships occupy port berths, manpower, and other resources, putting considerable pressure on port efficiency and optimal allocation of resources. In addition, the potential impact of cargo delays on the global supply chain should not be ignored. It can be said that ship detention has negative impacts on different stakeholders in the shipping industry. If the ship detention duration can be predicted in advance, shipping enterprises and port authorities could better cope with the uncertainty caused by ship detention and optimize resource allocation.
Based on the literature review, we found that there are very few studies on ship detention duration, and they stay at the correlation analysis level only. For example, Yang et al. [
13] constructed a Bayesian network with more than ten types of factors, including ship detention duration, ship flag, ship age, historical detention data, deficiency type, etc., and found that the number of deficiencies, ship age, and gross tonnage are the most critical risk factors in ship detention duration. At present, no scholars have constructed an effective and accurate prediction model to classify the long-term or short-term ship detention; based on this, this paper will be the first to conduct a prediction study on the ship detention duration. Since the specific time of ship detention is often accompanied by uncertainty, and most ships have a short detention time while a few have a long detention time, this paper classifies ships into two categories, long-term detention and short-term detention, in order to alleviate the impact of data uncertainty on the accuracy of the model. Bayesian networks are graphical models that represent probabilistic relationships and dependencies between variables and are widely used in the current PSC research field for correlation analysis to explain the causal relationship between different variables. But they are less effective in dealing with complex, nonlinear datasets and unbalanced data, while random forests are able to solve this problem and perform well in predicting ship detention. For example, Yan et al. [
28] and Xiao et al. [
32] both utilized random forests to analyze ship risk and detention problems. Meanwhile, this paper aims to develop a prediction model for ship detention duration, not limited to an analysis of the impact mechanism, thus, we will construct a random forest model to predict short-term detained and long-term detained ships.
3. Materials and Methods
3.1. Variable Selection and Data Source
Based on an extensive review of the literature of recent decades, this study identifies that researchers primarily choose variables from three primary aspects when investigating ship detention: ship inherent attributes (such as ship age, flag, and gross tonnage), port state inspection conditions (such as historical detention instances and the port state itself), and ship deficiency types (such as fire safety, ISM, etc.).
The purpose of this paper is to predict the length of time a ship will remain in port. By observing the detention database [
33], it is found that the distribution of the ship detention duration is relatively wide due to different types of deficiency, with most ships being released on the same day or after one or two days of maintenance in port and a small number of ships remaining in the port for more than half a month. For specific ships, their detention and release are affected by a variety of factors, including the ship’s technical status, port regulatory policies, etc., which create uncertainty in the release time under different circumstances. Therefore, it is not realistic to predict the exact length of time that a ship will stay in the port, but instead, it can be converted into a categorical variable to categorize and manage long-term detained and short-term detained ships, as Xiao et al. [
32] also categorized the ship detention duration in their study. This paper converts the ship detention duration into a categorical variable, which is divided into two categories: short-term detention and long-term detention. Reducing data noise through categorization enables the model to capture the impact of key factors more effectively without individual data points affecting model accuracy, and it also provides decision makers with short- or long-term judgments on ship detention, which can be used to take targeted measures to deal with different detention scenarios. In the Tokyo MOU’s detention list, the detention duration shows power law distribution characteristics: 80% of the data are mostly concentrated in the short-term detention type, and 20% of the data face long-term detention. According to this distribution, and considering that the prediction model will be constructed for different ship types to eliminate the effect of differences in ship structure on the ship detention duration, different ship types are divided into long- and short-term periods. That is, we set the detention duration of bulk carriers less than or equal to 2 days as short-term detention and more than 2 days as long-term detention, the detention duration of containers less than or equal to 3 days as short-term detention and greater than 3 days as long-term detention, and the detention duration of oil tankers less than or equal to 6 days as short-term detention and greater than 6 days as long-term detention.
Among the factors affecting ship detention, this paper synthesizes the index system of previous studies and selects the target factors from three aspects: ship characteristic variables, port state inspection situations, and ship deficiency types. Considering the close relationship between the fixed attributes of ships and their performance and operational conditions, this paper gathers ship age, ship flag, gross tonnage, and ship type as characteristic variables. Ship flag is represented by flags of convenience as defined by the International Transport Workers’ Federation (ITF) organization [
34]; ship tonnage is classified into categorical variables with reference to Yang et al. [
9]. Furthermore, recognizing the varying intensity of inspections and policy regulations across different port states as well as the variations in ship operational management and supervision reflected by PSC-related inspection variables, we choose the number of ship deficiencies, the total number of detentions in the past five years, the port state, the performance level of the flag state, and the performance level of recognized organizations to accurately represent the condition of port state inspections. The Tokyo MOU Committee annually assesses the level of performance of flag states and recognized organizations on the basis of their historical records of inspections and detentions, reflecting the specific performance of flag states and recognized organizations [
35]. Since the ship deficiency type directly affects the results of port state inspection, 16 deficiency types identified by the Tokyo MoU are introduced to reflect the different levels of ship maintenance work required for specific levels of severity of the defect categories. In addition, considering the impact of market factors on each segment, this paper also includes the shipping market index in the index system for the first time, which is used to study the extent of the impact of market changes on ship operations. The detailed index system is shown in
Table 1.
The data on ship detentions, ship characteristic factors, and port state inspection conditions utilized in this paper are obtained from the Tokyo MoU database. The Tokyo MoU recorded a total of 7014 detained ships from 2016 to 2023, with bulk carriers, container ships, and oil tankers accounting for over 86% of the total data. Therefore, this paper primarily focuses on these three categories to achieve more specific detention analysis. Shipping market conditions are statistically analyzed based on the different types of ships, utilizing indices to represent the market conditions. The Baltic Dry Index (BDI) is selected to reflect the shipping market situation for bulk carriers, the World Container Index (WCI) is selected to reflect the shipping market situation of containers, and the Baltic Dirty Tanker Index (BDTI) and the Baltic Clean Tanker Index (BCTI) are selected to reflect the shipping market situations of oil tankers. The BDI measures different dry bulk cargoes such as iron ore, coal, and grain and includes different ship types such as Panamax, Capesize, and Handysize covering routes around the world, which can effectively reflect the global dry bulk shipping market. BDTI and BCTI cover the world’s major oil transportation routes, such as the Middle East to Asia routes, the Americas to Europe routes, etc., and are a reflection of the overall supply and demand of the global oil shipping market [
36,
37].
3.2. Research Methods
3.2.1. Improved Entropy Weight–Grey Relational Analysis
The Tokyo MoU organization has classified 16 ship deficiency types, and some types of defects occur much more frequently than others in actual port state inspections, such as ISM and fire safety. In order to specifically investigate the impact of different deficiency types on ship detention duration, this paper firstly introduces the improved entropy weight–grey relational analysis. This model was first introduced into the field of ship detention research by Chen et al. [
5] to analyze the pivotal deficiency types in the Tokyo MoU that affect ship detention, and then, Maşalacı [
20] also constructed this model in the PSC research area and obtained reliable analyzing results. Grey system theory, initially proposed by Ju-Long Deng [
38], addresses real-world problems that typically possess incomplete information—a state referred to as “grey”. The principle of grey relational analysis (GRA) is to assess the closeness of relationships by examining the similarity of sequence data [
39,
40]. As GRA has been extensively applied in research, scholars have noted that the traditional weighting method limits model accuracy. As a result, Li and Fu [
41] proposed an entropy-weighted grey relational analysis, significantly refining the precision of analytical results [
42]. The improved entropy weight method combined with grey relational analysis can dynamically adjust the weights, which can significantly improve the objectivity, sensitivity, and accuracy of the analysis. Considering that this method has been widely used in the field of ship detention, it can be used as a reliable research method to analyze ship detention duration.
Improved entropy weight–grey relational analysis first calculates the information entropy of each index and determines the weights of different independent variables in the whole analysis process. Then, it defines the reference sequence (ship detention duration) and the comparison sequence (16 ship deficiency types), calculates the correlation coefficients of the comparison sequences relative to the reference sequence, and finally, combines the entropy weight and the correlation to determine the degree of influence of various deficiency types on the ship detention duration to arrive at a comprehensive analytical result. This process can effectively identify the key deficiency types affecting ship detention duration and provide a scientific basis for predicting a ship’s long-term or short-term detention. The specific model steps can be referred to in the study of Chen et al. [
5].
3.2.2. Random Forest
Random forest is a machine learning algorithm proposed by Breiman in 2001, which extends the concept of bagging and integrates random feature selection, significantly enhancing the model’s generalization capability [
43]. Currently in ship detention prediction research, scholars like Yan et al. [
28] and Tian et al. [
44] have carried out relevant research based on random forest to predict ship risk, ship detention, etc. They found that the model prediction ability of random forest is very optimistic, and it can effectively identify the data characteristics when dealing with a ship detention dataset. Therefore, this paper also constructs a random forest model to predict the ship detention duration.
As mentioned in
Section 3.1, there is a certain difference in the amount of data between short-term and long-term ship detention; i.e., most of the ships are short-term, while a few ships are long-term. Due to this data imbalance characteristic, the sampling analysis may capture more characteristics of the multi-class data while ignoring the characteristics of fewer classes, leading to inaccurate prediction results [
45]. Currently, the processing of random forests for imbalanced data can be roughly categorized into three types: (1) First is sampling processing from the data level, including oversampling, under-sampling, and combined sampling, etc. The principle of oversampling is to increase the number of samples in a few classes, that of under-sampling is to decrease the number of samples in the majority class, and combined sampling uses both oversampling and under-sampling at the same time. The Synthetic Minority Oversampling Technique (SMOTE) is one of the most widely used methods of oversampling. The principle is to perform linear interpolation between the nearest neighbors of a few classes of samples to generate a new composite sample so as to preserve the distribution characteristics of the original sample, rather than simply replicate it. In this way, the minority samples generated are able to better approximate the distribution of the real data without causing the model to become dependent on the oversampled sham samples [
46]. SMOTEENN is an ensemble algorithm; based on SMOTE, the Edited Nearest Neighbors (ENN) algorithm is introduced, which reduces the number of samples and reduces noise by analyzing the neighbor samples around each sample and eliminating some unnecessary samples [
47]. (2) The second type improves random forest from the algorithm level, such as the balanced random forest (BRF). This algorithm ensures that both majority and minority classes are equally represented when building decision trees, which means that instead of having many more examples from the majority class (which can cause bias), BRF randomly selects an equal number of samples from both classes. This helps the model focus on the minority class, which is often underrepresented in the data, leading to more balanced predictions [
48]. (3) The final method is cost-sensitive learning, which deals with the data imbalance problem by adjusting the class weight parameter in the random forest to increase the penalty when misclassifying data from the minority class [
49]. Accordingly, in a later section, we will compare these three imbalanced data processing methods in detail to find a model that is most suitable for predicting ship detention duration. The framework of this paper is shown in
Figure 1.
4. Results
4.1. Preliminary Analysis
In ship detention studies, several researchers [
50,
51] have utilized Poisson regression to identify key factors influencing ship detentions from a statistical perspective and have observed exact impact trends and degrees. Therefore, this paper also employs a statistical model to conduct an initial analysis of the number of ship defects from three indicator perspectives: ship characteristic variables, port state inspection conditions, and shipping market conditions.
Considering that the association between the shipping market and ship detentions may not occur simultaneously, this paper initially assumes that the market’s effect on ship detentions may have different lagged effects, including one month, three months, and six months. In assessing the predictive performance of the model, Mean Squared Error (MSE) is commonly used as the criterion, representing the average of the squared differences between predicted values and actual values. A smaller MSE indicates better predictive performance of the model.
As observed in
Table 2, comparing the same period with different lag periods indicates that bulk carriers, container ships, and oil tankers demonstrate shipping market lag effects of approximately one month, six months, and three months, respectively. And Poisson regression models constructed for these three ship types produced the results shown in
Table 3.
Notably, the results for bulk carriers stand out, with various indicators such as port state historical inspection levels and ship characteristic attributes showing significance at the 99% confidence level, including PD, Ag, and Gt. However, no statistically significant association was observed for oil tankers, potentially due to substantial differences in data volume across these three ship types. Within the Tokyo MoU, bulk carriers experienced the highest number of detentions, leading to more pronounced model results. Concerning different dependent variables, the port state emerges as the most influential factor, with correlation coefficients for P1, ..., P5 generally exceeding 0.1, followed by ship characteristic attributes such as ship tonnage and ship age. While shipping market conditions also exhibit some influence, their correlation coefficients are comparatively lower and statistically insignificant. For bulk carriers, a higher BDI correlates with fewer ship defects, whereas for container ships and oil tankers, higher freight rates correlate with more ship deficiencies.
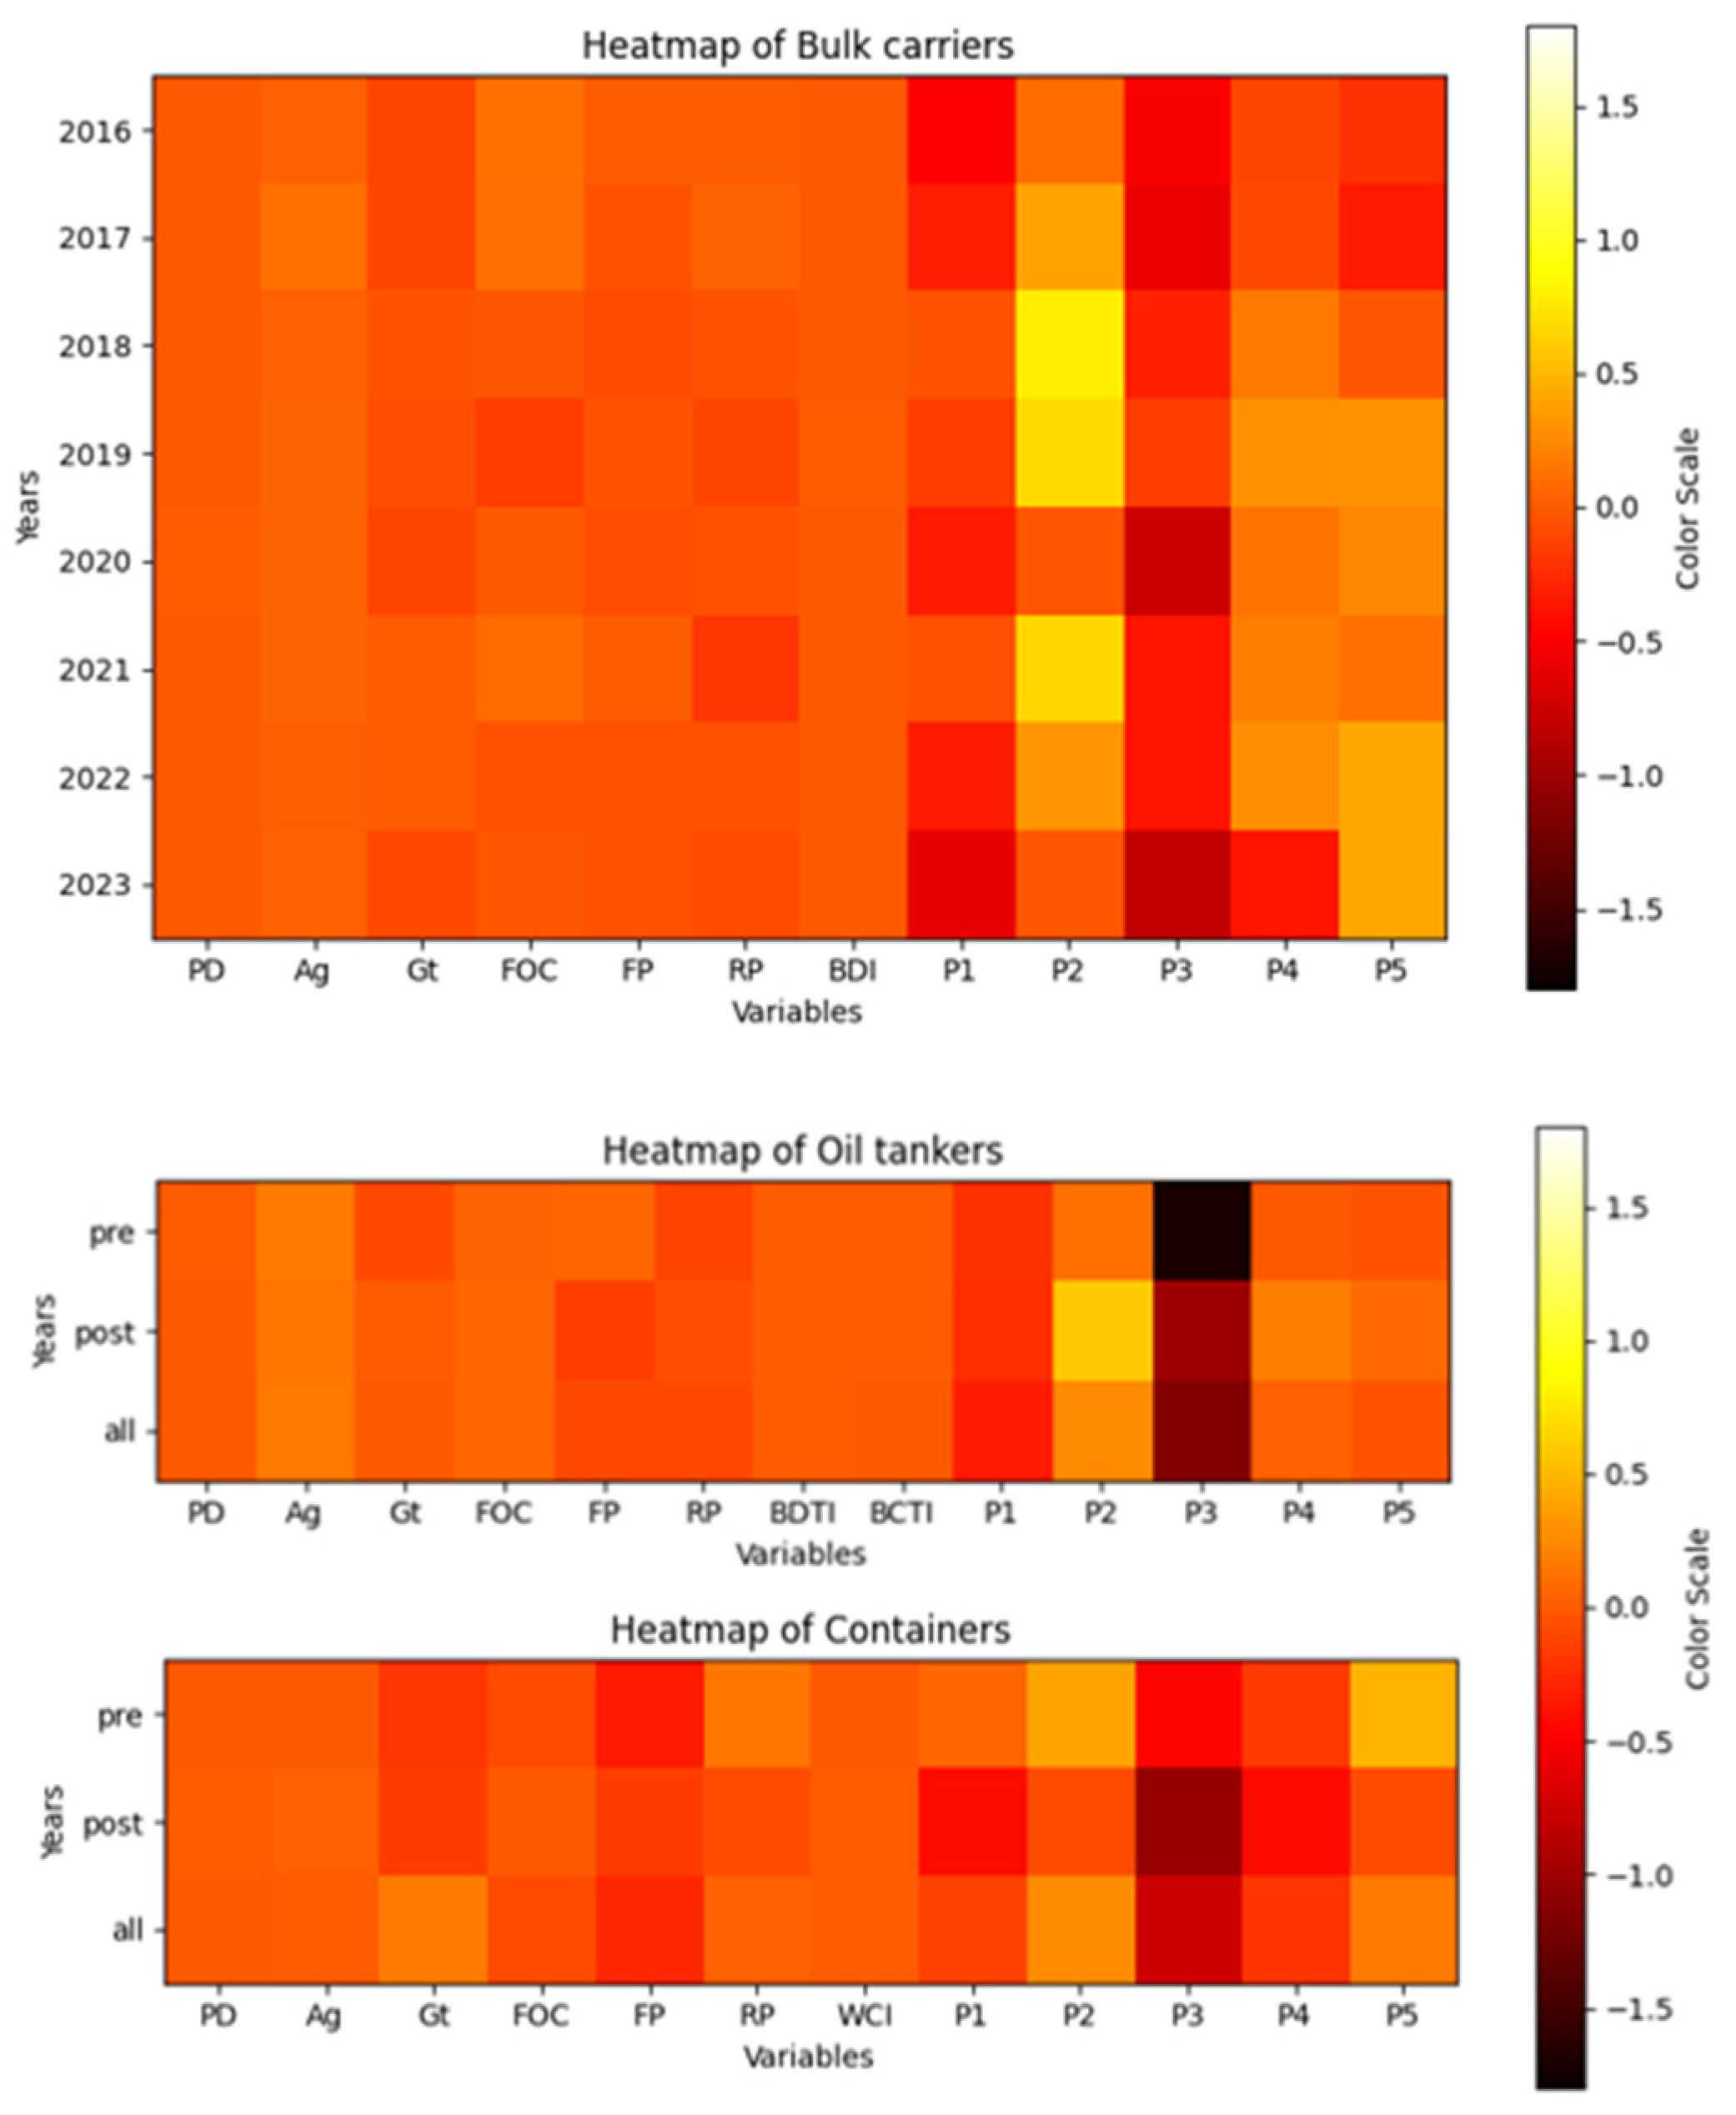
Based on historical data, heatmaps illustrating model results for different ship types were generated, as shown in
Figure 2. Due to the limited data availability for container ships and oil tankers, modeling them on a yearly basis would significantly reduce model accuracy. Consequently, for these two types of ships, the data were segmented into two periods: pre- and post-COVID-19 pandemic, i.e., 2016 to 2019 and 2020 to 2023, respectively, to enable comparative analysis. The results are depicted in
Figure 1. For bulk carriers, the port state emerges as the most variable factor. In China (P2), the correlation transitioned from positive to negative, whereas in Russia (P5), it shifted from negative to positive. This suggests that before the pandemic, ship deficiencies tended to increase during inspections in Chinese ports while decreasing in Russian ports. Post-pandemic, the trend reversed, indicating a relative relaxation in enforcement intensity and requirements of port state control in China, with Russia progressively strengthening its enforcement. In 2018 and 2019, China exhibited a correlation coefficient close to 1, signifying the strictest enforcement. For container and oil ships, ship characteristics such as GT and FOC, and port state control conditions like FP and RP, demonstrated slight variations pre- and post-pandemic. However, the most significant changes still stemmed from port state effects. For instance, the impact of Japan (P3) on the number of deficiencies in container ships was approximately −1.8 before the pandemic and approached −1 afterward, indicating a weakening of the negative effects of PSC inspections and suggesting a strengthening of Japan’s port state control post-pandemic.
4.2. Pivotal Deficiency Types
According to the Tokyo MoU’s classification of 16 types of deficiencies [
19], represented sequentially as C1, C2, …, C16, the detention duration data from 2016 to 2023 for each deficiency type were standardized, and the entropy weights were calculated and are presented in
Table 4. Specifically, C1 stands for Certificate and Documentation deficiency, C2 stands for Structural Conditions deficiency, and C16 stands for Labor Conditions deficiency, as listed in Tokyo MOU’s deficiency code. In
Table 4,
indicates the
jth deficiency’s information entropy and
represents entropy weights of the
jth deficiency (
j = 1, …, 16).
Subsequently, a grey relational analysis was conducted on ship detention durations and deficiency codes. The correlation coefficient matrix was computed, with the results shown in
Table 5, illustrating the influence of different ship deficiency types on the detention duration of the specific year. This matrix portrays the level of association between the detention duration of each year and particular deficiency types.
Finally, based on the entropy weight results and the correlation coefficient matrix, the impact of the 16 deficiency types on ship detention duration can be ranked, as shown in
Table 6. Remarkably, the top three deficiency types, regarding their effect on detention duration, are C7 (Fire Safety), C13 (Propulsion and Auxiliary Machinery), and C14 (Pollution Prevention). Conversely, the three types with the least impact are C1 (Certificate and Documentation), C16 (Labor Conditions), and C6 (Cargo Operations Including Equipment). The grey relational degree for fire safety is 0.513778, identifying it as the most critical factor affecting ship detention duration, while the value for certificate and documentation is only 0.065073, indicating its minimal impact on detention durations. According to the study by Chen et al. [
5], ISM (International Safety Management), emergency systems, and fire safety are the three types of deficiencies with the highest influence on ship detentions during PSC (port state control) inspections. In this study, these three deficiencies (C4, C7, C15) all exhibit grey relational degrees above 0.4, suggesting that ISM, emergency systems, and fire safety not only play a crucial role in ship detentions but also significantly affect the ship detention duration.
Figure 3 illustrates the grey relational degrees of each deficiency type on ship detention duration from 2016 to 2023. C1 (Certificate and Documentation) consistently demonstrates the least impact on detention durations, while deficiencies such as C3 (Water/Weathertight Conditions), C7 (Fire Safety), C11 (Life-Saving Appliances), C13 (Propulsion and Auxiliary Machinery), C14 (Pollution Prevention), and C15 (ISM) consistently exhibit high relational degrees, all above 0.045. Some deficiencies display a declining trend in importance, such as C6, which had a relational degree above 0.03 before 2020 but decreased to 0.02 afterward. Similar trends are observed for C7 and C16 (Labor Conditions). Additionally, during the COVID-19 pandemic period from 2020 to 2022, ship detention duration was most significantly influenced by deficiencies C3, C7, C11, and C14. In the post-pandemic year of 2023, C8 (Alarms) and C13 emerged as the most prominent deficiency types. Generally speaking, as Yan et al. [
52] pointed out, before and after the outbreak of COVID-19, the impact of the sixteen deficiency types on ship detention changed.
4.3. Prediction Model Evaluation
Based on the results of the improved entropy weight–grey relational analysis in
Section 4.2, this paper selects the five most prominent ship deficiency types, namely, C3 (Water/Weathertight Conditions), C7 (Fire Safety), C11 (Life-Saving Appliances), C13 (Propulsion and Auxiliary Machinery), and C14 (Pollution Prevention) and combines them with ship characteristic variables, port state inspection variables, and shipping market conditions to construct a random forest classification model of ship detention duration. For the imbalance of the data categories of short-term and long-term detention, four different methods are selected to process the imbalanced dataset, with SMOTE and SMOTEENN denoting oversampling and combined sampling techniques, respectively, while BRF and CSRF represent balanced random forest and cost-sensitive random forest methods. The results are shown in
Table 7. The comparative analysis aims to obtain the most accurate and effective prediction method to help ports and shipping companies to develop appropriate management strategies for ships with different detention duration types to improve operational efficiency.
The predictive data in this study are categorized into two groups: ships detained long-term and those detained short-term. Accuracy denotes the proportion of correctly predicted short-term or long-term detentions within the total dataset. As illustrated in
Table 7, oil tankers demonstrate the highest accuracy under SMOTE sampling at 0.85, while bulk carriers and container ships achieve their peak accuracy under the CSRF model (0.73 and 0.85, respectively). Most models exhibit an accuracy surpassing 70%, indicating robust predictive accuracy of the random forest. Precision, which gauges the proportion of data predicted as short-term detentions that are indeed short-term, exceeds 85% for all three types of ships, implying that when the model predicts a short-term detention, it is accurate in over 85% of cases. The highest precision values observed in the BRF model, at 0.88, 0.95, and 0.94, suggest that the BRF model is most effective in predicting short-term detentions and is least likely to misclassify long-term detentions as short-term. Recall, representing the proportion of actual short-term detentions that are correctly predicted, indicates that oil tankers achieve the best recall value under SMOTE sampling (0.92). Bulk carriers and container ships attain recall values of 0.80 and 0.89, respectively, under the CSRF model, indicating that the CSRF model performs optimally in identifying short-term detentions. The F1 score, an integrated measure of precision and recall, indicates that the best F1 scores for the three types of ships are 0.82, 0.91, and 0.90, respectively. This implies that the model achieves high precision and recall in predicting ship detention durations while maintaining a balance between these two metrics. The Area Under the Curve (AUC) is utilized to assess the model’s robustness, typically ranging between 0.5 and 1, with higher values indicating better predictive accuracy. An AUC of 1 represents a perfect prediction model, which is generally unattainable in practice. The AUC for bulk carriers exceeds 0.6, for container ships it reaches 0.73, and for oil tankers, the highest AUC is 0.76, demonstrating that the constructed random forest models for predicting ship detention durations perform effectively and can adequately capture the variations in detention duration.
To assess the fitting of different models and identify potential overfitting, learning curves for various models were plotted (
Figure 4). The cross-validation score reflects the model’s generalization ability on the test set, indicating its performance in real-world scenarios. Meanwhile, the training score indicates the model’s predictive power on the training set [
53]. Observing the cross-validation scores, it can be found that the bulk carriers’ score tends to decrease under the CSRF model, indicating that with the increase in the training set, the model also fails to capture the data features, and there is a problem of underfitting. The curves tend to stabilize under the SMOTEENN sampling and the BRF model, but there is a large difference in the test set; especially, the difference between the two curves under the BRF model is close to 0.06, which shows the problem of high variance. The model performance on the training set is higher than that on the validation set, indicating that the model overfitted the noise in the training data. Under SMOTE sampling, the score of the validation set gradually rises and finally tends to be stable, and it is closer to the score of the training set, which indicates that the SMOTE sampling is able to capture the characteristics of the data of the short-term detention and long-term detention of the bulk carriers with high generalization ability, and it is a relatively effective prediction model. The cross-validation scores of container ships tend to decrease under the BRF and CSRF models, suggesting that the models fail to adequately capture the data features and that there is an underfitting problem. Under SMOTE sampling, the gap between the two curves is close to 0.1, and the training set performs significantly better, reflecting the overfitting problem of the model. Under SMOTEENN sampling, the cross-validation set and the training set both tend to converge at a higher level, close to 0.84, which indicates that the container ship data are more suitable for SMOTEENN sampling, and the model is able to capture the detained ship features more accurately. The scores of the two curves of the tanker training set and validation set are close to each other at the beginning under SMOTEENN sampling, the BRF model, and the CSRF model, and the gap between the scores of the two curves becomes bigger and bigger with the increase in the training set, which clarifies that the model is gradually overfitting and over-capturing the characteristics of the tankers’ long-term and short-term detention. Under SMOTE sampling, as the training set increases, the model continuously learns the data features, which makes the score tend to increase while the gap between the two curves gradually decreases, demonstrating that the model performance is continuously improving, and it can effectively capture the short-term and long-term status of ship detention and balances the samples of different categories.
Overall, SMOTE sampling has a better performance on both the bulk carriers’ and oil tankers’ data, and SMOTEENN sampling has the best model performance in the containers’ dataset, which indicates that the imbalance in the ship detention data can be relatively better solved from the data sampling perspective, and it more accurately predicts the ship detention duration. Through the sampling level, the random forest pays more attention to a small number of classes, i.e., long-term detained ships, and improves the identification and analysis of the characteristics of different detained ship types. In port state inspections, although most detained ships are released swiftly, a minority may face prolonged detentions due to severe deficiencies, leading to resource occupation, cargo delivery delays, and increased operational costs. Focusing on the characteristics of the minority class is crucial for the timely identification and resolution of issues related to long-term detentions, thereby enhancing the operational management levels of ports and shipping companies, especially as the minority detained ship categories are more prone to greater losses at the economic and security levels. Therefore, this model could provide valuable insights for stakeholders to develop targeted management measures.
5. Discussion
As an effective prediction mechanism for ship detention duration, both port managers and shipping companies can incorporate the random forest into their daily management and use it as an early warning tool for ship detention. Based on the prediction results of the random forest model, port authorities can establish a ship risk assessment and release system and apply the prediction results in real time to port scheduling and resource allocation so as to allocate inspection resources more efficiently, avoid port congestion, and improve the management level. Shipping companies can integrate the prediction results into fleet management systems to monitor ship operation conditions in real time and adjust operation strategies based on the prediction results. For example, they can carry out quick maintenance and adjustments for short-term detained ships, and rearrange the routes or cargo transportation plans for long-term detained ships, to minimize the economic losses caused by different detention situations. Based on the results of this study, we could further conclude several managerial implications for port authorities and ship companies.
For shipping companies, before arrival at ports, the shipping companies should proactively monitor older ships with greater tonnages and review the performance level of recognized organizations and flags to ensure that they meet international safety and operational standards. Meanwhile, shipping companies should prepare documentation and conduct pre-arrival checks, especially focusing on ISM (International Safety Management), emergency systems, and fire safety areas, as they will be strictly scrutinized by port authorities. Secondly, during the ship inspection process, shipping companies must ensure that ship crews are well prepared to assist port state control (PSC) officers, especially in areas of deficiency types critical to detention duration. If any deficiencies are identified during inspections, shipping companies should deploy immediate corrective actions, such as arranging on-the-spot repairs or calling in certified technicians, to address potential issues that could lead to long-term detention. Thirdly, if a ship is far from further safety operation and is under a long duration in port, companies should adjust their logistics and operations by reallocating cargo or adjusting routes for other vessels in the fleet to ensure the completion of the transportation contract. For instance, shipping companies could transfer high-value or time-sensitive cargo to other ships. Shipping companies may also use models to predict whether a ship will be stuck in port for a long time so they can take precautionary measures in advance, such as adjusting the fleet operation. Since ISM, emergency systems, and fire safety affect both the results of port state inspections and the ship detention duration, shipping companies should, as a matter of priority, strengthen the construction of safety management systems, ensure that ships comply with ISM standards, formulate and strictly implement relevant safety procedures, and ensure that captains and crews are fit for duty and receive regular training.
For port authorities, it is important to establish a complete and strict ship inspection mechanism. Specifically, in the process of risk assessment before ship inspection, port authorities should give more credit to the old ship with greater tonnage while also monitoring recognized organization’s performance level and flag performance level, which could categorize high-risk and low-risk ships when they are arriving at ports in a more effective way. Secondly, during the inspection period, focus on ISM, emergency systems, and fire safety, as they are the most dominant factors influencing ship detention duration. Thirdly, if a ship is detained in the port for severe deficiencies, port authorities could assess ship detention duration based on this model and gain some advance judgement about whether this ship will be detained for a long time. Lastly, when a ship is predicted to be kept in port for a long period, port authorities could urge shipping companies as soon as possible to repair these defects in a timely manner to minimize the negative impact of long-term detained ships. Fines or fees related to ship detention may also be increased by port authorities to avoid idleness of shipping companies, if necessary.
While this study employs techniques to address data imbalance, inherent biases may still exist due to the unequal representation of short-term and long-term detention cases. Future research could explore additional methods to further mitigate potential biases. In the subsequent research, it is also possible to continue to classify the categories of ship detention duration to predict different categories of ship detention on a broader scale, whereas this paper currently divides into only two categories (long-term and short-term). Secondly, for the dataset range, it can be extended to some other regional organizations’ detention list (such as Paris MOU) to observe the applicability of the model to ship detention duration on a global scale. At the same time, considering the detention data of other regions can further verify the accuracy of the model and the robustness of the treatment of imbalanced ship detention duration. Thirdly, future research could also further construct a universal prediction model based on multiple regions’ detained ship dataset while considering different ship types at the same time.
6. Conclusions
This paper initially analyzes the factors influencing ship detention deficiencies from three aspects: ship characteristic variables, port state inspection, and the shipping market. The results indicate that ship age has the greatest impact on the defects of bulk carriers and oil tankers, and ship tonnage has the deepest impact on container ships. Among the factors from the port state inspection level, the port authority has the greatest influence. Bulk carriers, containers, and oil tankers each exhibit a shipping market lag effect of approximately one month, six months, and three months, respectively, but these effects are not pronounced. Variables such as ship attributes and historical levels of port state inspections show significant correlations.
Then, we introduce the improved entropy weight–grey relational analysis method, identify the impact of different ship deficiency types on ship detention duration, and select the five most crucial types of deficiencies to further develop a random forest classification model. The most prominent deficiencies impacting ship detention durations are C3 (Water/Weathertight Conditions), C7 (Fire Safety), C11 (Life-Saving Appliances), C13 (Propulsion and Auxiliary Machinery), and C14 (Pollution Prevention). In addition, there is a tendency for each deficiency type to evolve over time; e.g., in 2023, C8 (Alarms) and C13 become the most prominent deficiency types.
Considering the imbalance of the data categories of short-term and long-term ship detention, four processing methods are selected from three perspectives: the data sampling method, algorithm level method, and cost-sensitive random forest to construct the random forest model, and a complete and comprehensive comparative analysis of the ship detention duration prediction model is carried out. It is found out that random forest, improved at the data-sampling level (SMOTE or SMOTEENN), has the best model performance, with accuracies above 70% for all ship types, and even above 80% for oil tankers, and is able to effectively deal with the imbalance in the data categories of long-term and short-term detained ships. According to the F1 scores, this model effectively balances precision and recall, accurately predicting the duration of ship detentions and avoiding misclassification.
This study not only constructed the index system including ships’ inherent attributes, port state inspection factors, ship defect types, and shipping market conditions, but also introduced the improved entropy weight–grey relational analysis to study the deficiency types affecting the ship detention duration for the first time. We selected four imbalanced data processing methods, constructed a random forest model to deal with the data of short-term detention and long-term detention, and obtained an accurate and effective random forest model to predict ship detention duration. This study not only helps to provide accurate early warning of ship detention for shipping enterprises and port authorities to manage detained ships, but also provides a certain reference for stakeholders to arrange resources reasonably and specifically for long-term and short-term detained ships.


