Article

Assessing the Interrelationship Between Microplastics and Polychlorinated Biphenyls Contamination in Chinese Mangrove Sediment

1
Institute of Green and Low Carbon Technology, Guangxi Institute of Industrial Technology, Nanning 530004, China
2
College of Light Industry and Food Engineering, Guangxi University, Nanning 530004, China
3
School of Marine Sciences, Guangxi University, Nanning 530004, China
*
Author to whom correspondence should be addressed.
These authors contributed equally to this work.
J. Mar. Sci. Eng. 2024, 12(12), 2216; https://doi.org/10.3390/jmse12122216
Submission received: 30 October 2024 / Revised: 13 November 2024 / Accepted: 21 November 2024 / Published: 3 December 2024
(This article belongs to the Section Marine Environmental Science)

Abstract

Mangrove ecosystems, critical intertidal zones at the land–ocean interface, are increasingly recognized for their role in microplastic (MP) pollution dynamics. Despite extensive research on the interaction of MPs with various chemical contaminants, the specific contamination levels of polychlorinated biphenyls (PCBs) associated with MPs in mangroves remain poorly understood. In this study, we quantified the concentrations of PCBs on MPs extracted from representative mangrove sediment samples across China, revealing values ranging from 9.80 to 13.91 ng/g. In contrast, PCB concentrations in sediment samples were found to vary between 25.67 and 69.85 ng/g. Our findings indicate a consistent level of PCB contamination on MPs across different sites, although these levels were marginally elevated compared to those in the surrounding sediments. Notably, Penta-PCBs were detected with the highest frequency across all samples analyzed. This study provides crucial insights into the occurrence and distribution of PCBs on MPs within the mangrove ecosystem, highlighting their significance in environmental contamination assessments.

1. Introduction

Microplastic (MPs, <5 mm in diameter) contamination has been identified across marine, freshwater, sediment, and biological samples globally [1,2,3,4]. Owing to their distinct physicochemical characteristics, MPs are recognized as carriers of various pollutants, including organic contaminants (OPs) [5,6,7], heavy metal [8], and antibiotic resistance genes (ARGs) [9]. Zooplankton in marine environments ingests microplastics, which accumulate in higher trophic organisms and ultimately pose risks to human health through the food chain [10,11]. Organic pollutants, in particular, deserve attention as MPs provide a novel route for these substances to enter the digestive systems of organisms through accidental ingestion, heightening ecological risks.
Organic pollutants that accumulate on the surfaces of MPs can amplify their toxicity and potential for bioaccumulation, posing risks to ecosystems and human health [12,13,14]. On a molecular level, the interactions between MPs and organic pollutants are influenced by hydrophobic and electrostatic forces, hydrogen bonding, π–π interactions, and van der Waals forces, as shown in laboratory simulations [9,15]. Recent studies have examined the abundance and ecological risk of organic pollutants associated with MPs [16]. Notably, research in river environments has shown that pollutants bound to plastic debris contribute less significantly compared to the discharge of these contaminants through river [17]. It is almost certain that the environmental factors of the micro-region surrounding MPs and their physicochemical properties, including functional group structure, specific surface area and crystallinity, co-determined the loading capacity of OPs in field [18]. However, the specific interactions between polychlorinated biphenyls (PCBs) and MPs remain poorly understood with existing studies providing limited insights into this relationship. Further research is critically needed to address these gaps.
As a crucial ecological buffer, the mangrove ecosystem’s role in filtering pollutants has garnered significant attention [19,20]. In recent years, driven by industrialization and urbanization, a large volume of land-based pollutants has found its way into mangrove forests [21,22,23,24]. Sediment provides the foundation for mangrove ecosystems and serves as the primary repository for OPs and MPs [25,26,27]. Specifically, organic pollutants like PCBs can adhere to plastic surfaces, contributing to complex MP pollution PCBs [28]. Due to their ability to bioaccumulate and biomagnify, they become available within the food chain, posing serious health risks such as cancer, birth defects, and genetic mutations [29]. Despite the ban on PCB production since the 1970s, these chemicals continue to persist in global sediments and soil [30,31]. Mangrove sediments have been identified as significant reservoirs for PCBs due to their affinity for MPs [32,33]. However, little is known about how contaminants on MPs behave and transform within mangrove ecosystems. Hence, it is essential to investigate the distribution and fate of PCBs on MPs within mangrove sediments in southern China to better understand the movement and impact of these pollutants between mangrove and marine environments.
This study focuses on PCBs and PCB-laden MPs in the sediments of typical mangrove areas in southern China to (i) map the spatial distribution of PCBs associated with MPs in mangrove sediments and identify potential sources and influencing factors, (ii) examine the relationship between the transport and transformation of PCBs and PCB-laden MPs within these sediments, and (iii) analyze the potential correlation between MPs abundance and PCB concentrations in mangrove sediment.

2. Materials and Methods

2.1. Chemicals and Reagents

The details of the PCB standards utilized in this study are listed in Table S1. All PCB standards were sourced from Wellington Laboratories (Guelph, ON, Canada). Additionally, mass-labeled standards (SC) were also procured from Wellington Laboratories Inc. (Guelph, ON, Canada). N-hexane and acetone (both HPLC-grade) were obtained from Fisher Scientific (Pittsburgh, PA, USA). Anhydrous sodium sulfate (Na₂SO₄), sodium chloride (NaCl), and hydrogen peroxide solution (H₂O₂) were supplied by Sigma-Aldrich (St. Louis, MO, USA). Ultra-pure water was produced using a Milli-Q water purification system (Millipore, Bedford, MA, USA). Florisil cartridges (500 mg, 3 mL) were acquired from Agilent (Santa Clara, CA, USA).

2.2. Study Area

The study areas were several mangrove habitats, which were located at the Maowei Sea of Guangxi Province, Leizhou Peninsula, and Hainan Island in southern China. Also, samples were collected in May 2019. These areas have experienced increasing population density, industrial discharges, and pollutants from rivers in recent years, all of which pose potential threats to the health of mangrove ecosystems [34,35]. This made them suitable as study locations. Samples were gathered from the sediments of mangroves across eleven representative sites: Longmen (LM), Kangxi Ling (KL), Qishier Jing (QJ), Shankou (SK), Guandu (GD), Zhanjiang (ZJ), Hebei (HB), Xinying (XY), Qinglan (QL), Shamei (SM), and Sanya (SY). The geographical coordinates of the sampling locations are shown in Figure 1 (18°25′–21°90′ N, 108°59′–110°83′ E).

2.3. Sample Collection

Mangrove sediment collection was conducted in alignment with the methodology we previously established [36]. The approach to sampling took into account the geographical settings and the spatial distribution of different mangrove species. For each location, three separate sampling sites were selected, gathering a minimum of 5 kg of sediment from mangroves. To ensure the reliability of the data, field blanks were introduced with commercially obtained MPs particles, specifically polyethylene acquired from Goodfellow Company in Cambridge, London. Prior to any sampling activities, the stainless-steel shovel was meticulously rinsed with distilled water to prevent contamination. Post-collection, the samples were taken to the laboratory and preserved at a temperature of 4 °C until they underwent analysis.

2.4. Sample Pretreatment and Extraction

2.4.1. Sample Pretreatment

Following a slightly modified approach based on Li et al.’s method, samples from each bottle were immersed in a sufficient amount of 30% hydrogen peroxide (H₂O₂) solution and left to sit overnight [37]. The use of H₂O₂ has been demonstrated to effectively eliminate natural organic matter without altering the physical properties of the plastic particles being studied. The debris was subsequently floated in the supernatant due to the addition of saturated sodium chloride solution (~1.2 g cm−3). After treatment, the samples were passed through stainless steel sieves with 50 meshes (equivalent to 0.3 μm pore size). Particles larger than 5 mm were excluded from further analysis. Any remaining debris on the sieves was carefully collected, and visible plastic particles were isolated using pre-cleaned tweezers. The MPs and sediments were then thoroughly rinsed with distilled water and wrapped in aluminum foil for freeze drying.

2.4.2. Sample Extraction

The dried MPs and sediment samples were weighed with an analytical balance, transferred into glass vials, and spiked with 20 ng of the surrogate standard TCmX (2,4,5,6-tetrachloro-m-xylene). The samples were extracted three times, each for 20 min, using a 1:1 mixture of n-hexane and acetone in a 25 °C sonication bath. The extracts were pooled and concentrated under a gentle stream of nitrogen in a 30 °C water bath until nearly dry. Florisil cartridges were pre-conditioned with 6 mL of n-hexane and acetone. The sample concentrates were rinsed with n-hexane three times and loaded onto the cartridges at a controlled flow rate of 1–2 drops per second. Afterward, the dried cartridges were eluted with 6 mL of the same solvent mixture. These eluates were concentrated to near dryness, rinsed with n-hexane three more times, and transferred into vials for further reduction to 0.5 mL. Each extract was supplemented with 20 ng of 13C-PCB-141 as an internal standard and filtered through a 0.22 μm organic membrane filter (Whatman, Maidstone, UK) into vials for subsequent analysis. Throughout the entire pretreatment process, samples were kept in the dark by either wrapping containers with aluminum foil or using amber glassware to prevent photodegradation.

2.5. Instrument Analysis

2.5.1. Microscopic Inspection and Raman Analysis

After pretreatment (described in Section 2.4.1), the particles retained on the filter membranes were inspected and counted under a stereomicroscope (Leica M205C, Wiesbaden, Germany) with 3–15× magnification, which was equipped with an Andor Zyla 4.2sCMOS camera and LED illumination (Leica KL300 LED, Wiesbaden, Germany). MPs were classified into four size categories based on their diameters: <0.5 mm, 0.5–1 mm, and 1–5 mm.
The selected particles were further analyzed with a micro-Raman spectrometer (Renishaw, London, UK) to confirm their identity. The spectrometer was set with an excitation laser at 785 nm and 15 mW (5% power) with an emission range from 130 to 1400 cm−1 and a 2 s exposure time per scan. To ensure accurate particle identification, 11 different microzones on each particle were scanned. In line with previous studies, chemometric techniques were applied to mitigate background fluorescence interference, achieving a spectral match accuracy exceeding 90%.

2.5.2. Instrumental Analysis of PCBs

Polychlorinated biphenyls (PCBs) were analyzed using Agilent’s (Santa Clara, CA, USA) 7890 gas chromatograph coupled with a 7000 C triple quadrupole mass spectrometer (GC-MS/MS). The mass spectrometer operated in Electron Impact (EI) mode with Multiple Reaction Monitoring (MRM). PCB separation was achieved using an Agilent HP-5MS capillary column (30 m length, 0.25 mm diameter, 0.25 μm film thickness; Santa Clara, CA, USA). The oven temperature was initially held at 80 °C for 1 min, which was followed by an increase to 180 °C at 25 °C/min and then maintained for 2 min. The temperature was further increased to 280 °C at a rate of 5 °C/min and held for 5 min. Other critical instrument parameters included the transmission line, ion source, injector, and detector temperatures of 280 °C, 230 °C, 250 °C, and 150 °C, respectively. Injections of 1 μL were performed with helium as the carrier gas at a constant flow rate of 1 mL/min [38].
The following 28 PCB congeners were measured: Di-PCBs (PCB-8), Tri-PCBs (PCB-18 and -28), Tetra-PCBs (PCB-44, -52, -66, -77, and -81), Penta-PCBs (PCB-101, -105, -114, -118, -123 and -126), Hexa-PCBs (PCB-128, -138, -153, -156, -158, -166, and -169), Hepta-PCBs (PCB-179, -180, -187, and -189), Octa-PCBs (PCB-195), Nona-PCBs (PCB-206), and Deca-PCBs (PCB-209).

2.6. Quality Assurance (QA) and Quality Control (QC)

During the experiment, nitrile gloves and cotton lab coats were worn by the researcher to minimize the risk of MPs contamination in the laboratory environment. All vessels and tools used were rinsed three times with n-hexane, allowed to air dry, and wrapped in PCB-free aluminum foil prior to use. The solvents employed were of HPLC grade, and all glass vials were soaked overnight in an alkaline solution and then baked at 500 °C for 4 h to ensure the removal of any residual compounds. To monitor potential background contamination, field blanks (n = 8), procedural blanks (n = 8), and matrix-spiked samples (n = 6) were processed concurrently during MPs extraction. For values falling below the limit of quantification (LOQ), they were divided by the square root of two. Separate field and procedural blanks were conducted for each sampling site and sample batch with blank values consistently below the LOQ. Sample concentrations were adjusted based on procedural blank values but were not corrected for surrogate standard recoveries. The mean recovery of PCBs from matrix spikes ranged from 86% to 113%. The limits of detection (LOD) and quantification (LOQ) were determined using signal-to-noise (S/N) ratios of 3 and 10, respectively. More detailed information on quality assurance and control can be found in Table S1.

2.7. Statistical Analysis

The statistical analysis was carried out using SPSS Statistics 24.0 software. Pearson correlation analysis was performed to assess the relationship between MPs concentrations and various factors such as wastewater discharge, population density, and specific PCB congeners. Additionally, a paired t-test (two-tailed) was used to compare the number and mass concentrations of MPs across different sampling sites. In all statistical tests, results with p-values less than 0.05 were considered statistically significant.

3. Results

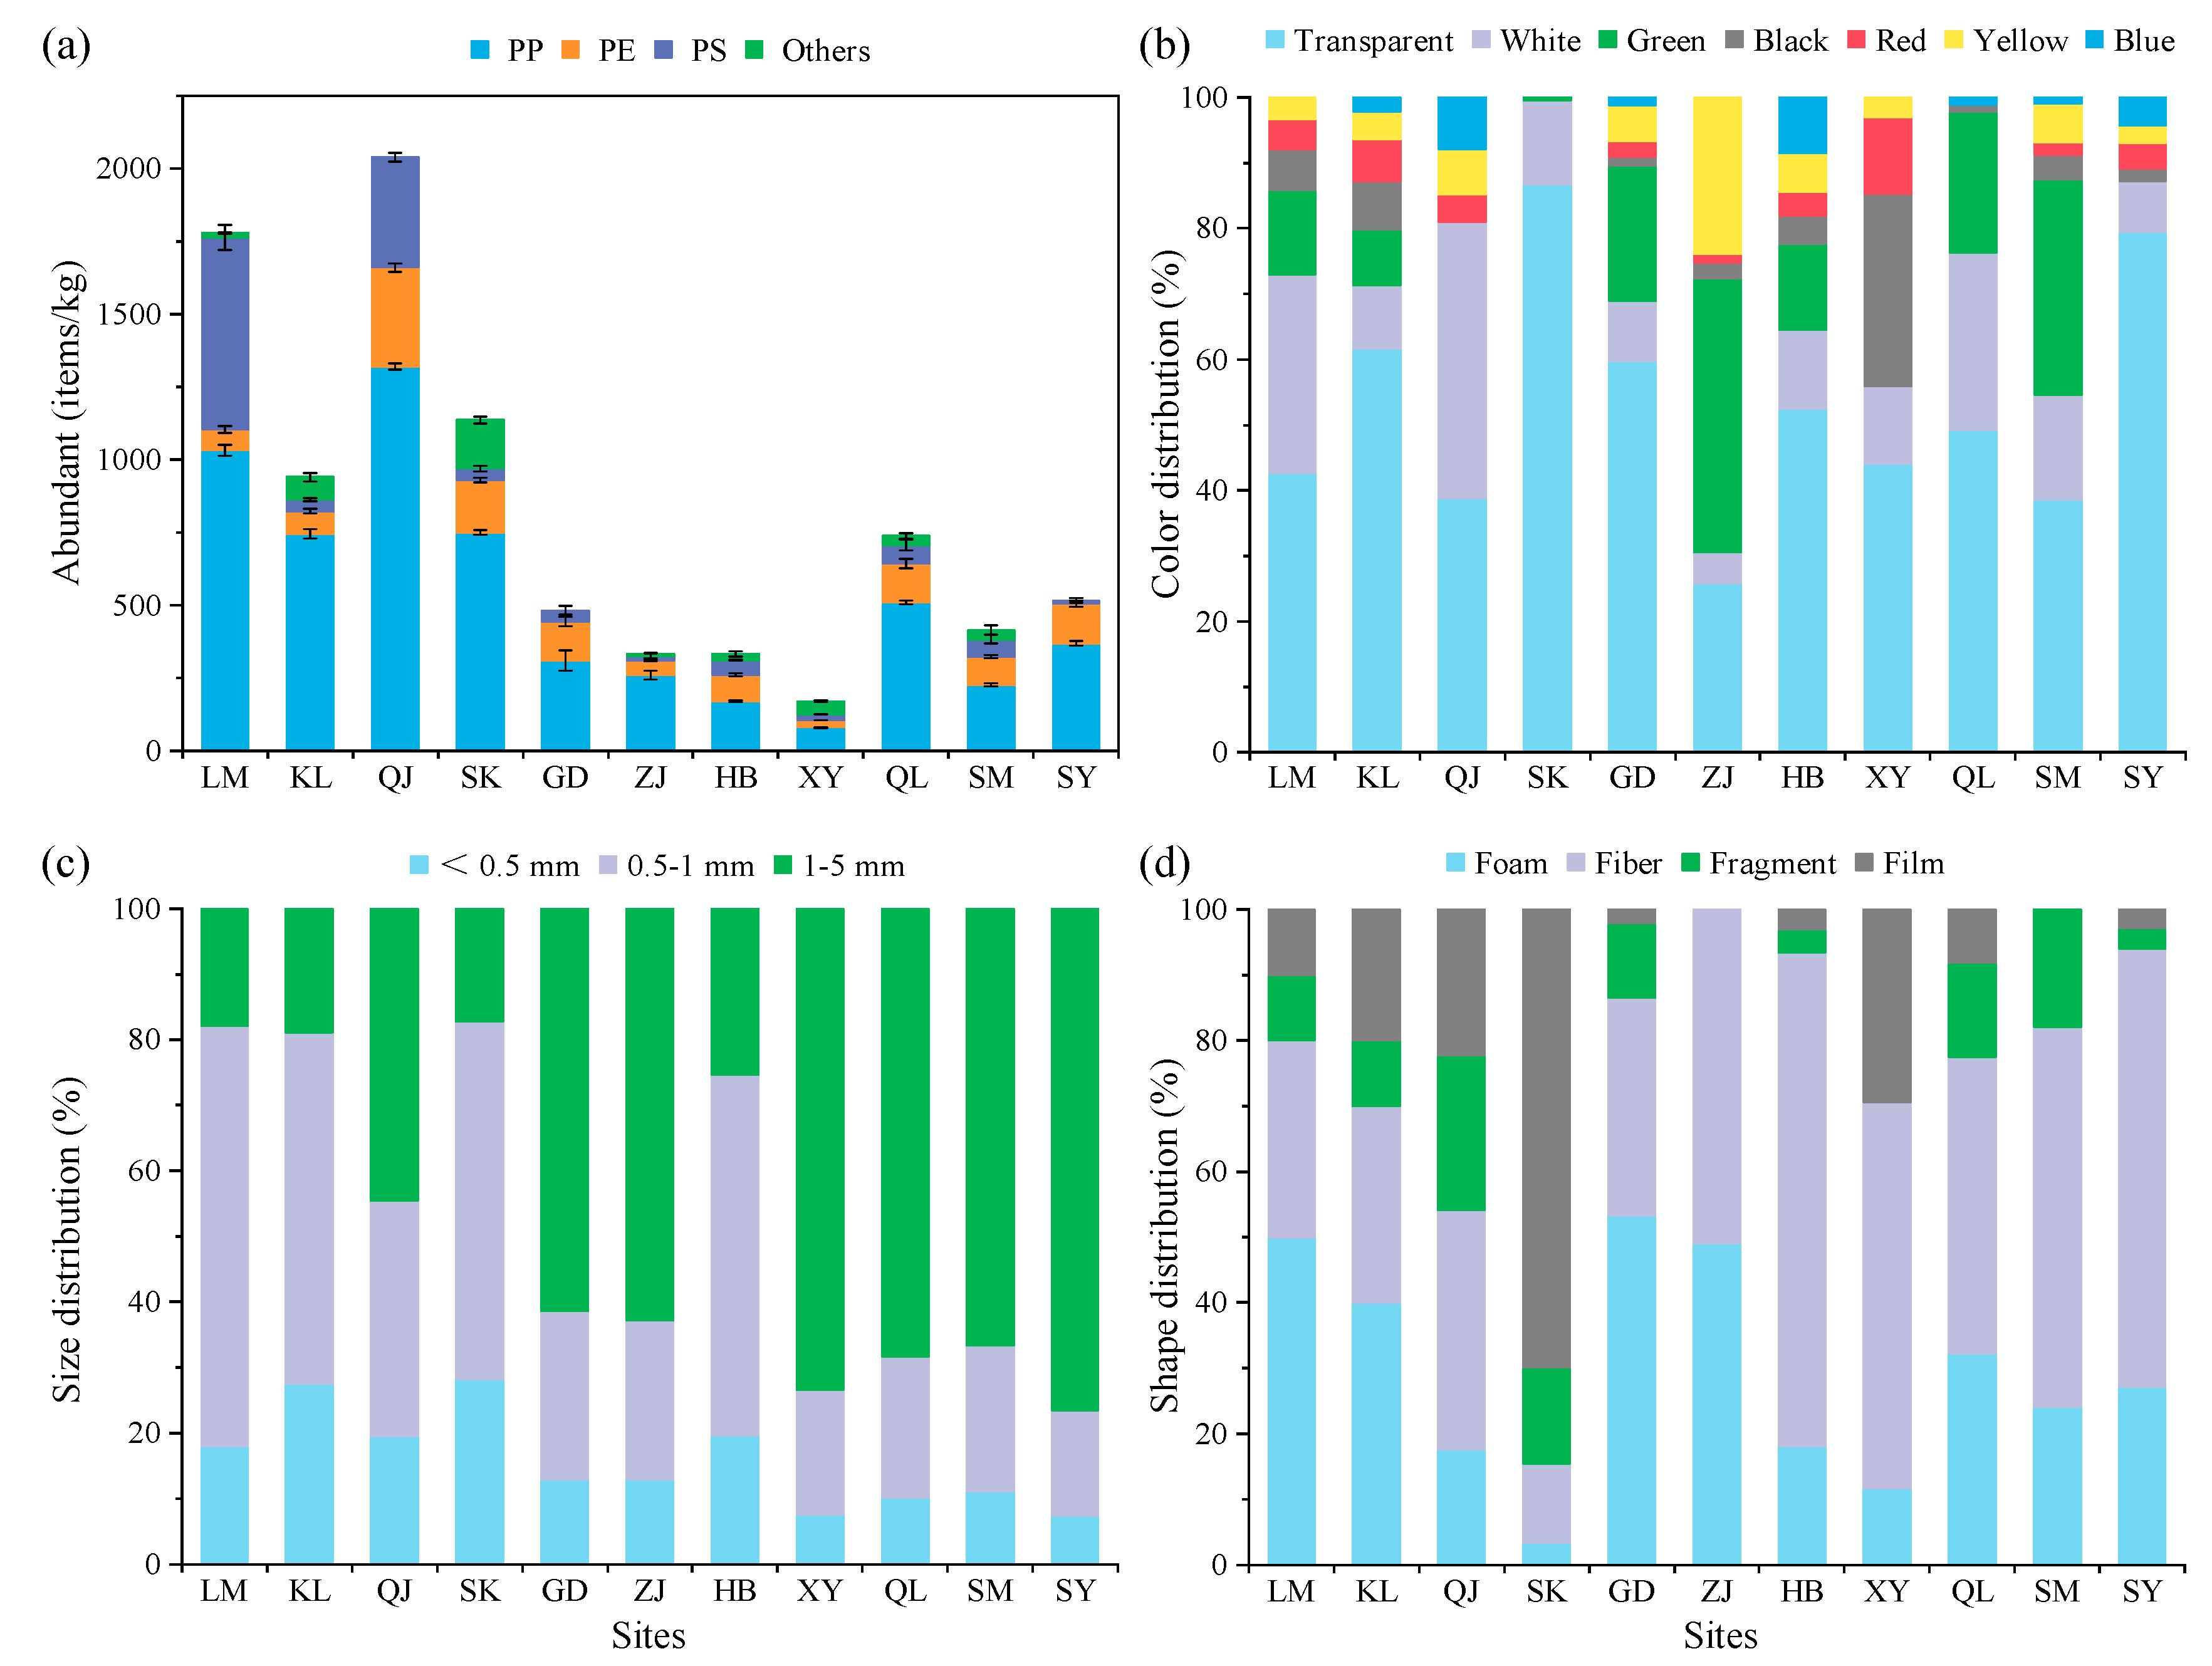
3.1. Abundance and Features of MPs from Different Mangrove Sediment Regions

The concentration levels of MPs in this study were notably higher than those reported for other mangrove areas, such as Maowei Sea, Singapore, and Colombia, with average values of 2310 ± 29 items/kg, 60.7 ± 27.2 items/kg, and 2863 ± 31 items/kg, respectively. These levels even exceeded those found in river sediments at similar latitudes and in sandy coral reef environments [37,39,40,41]. Despite this, the Beibu Gulf is not a highly industrialized area, suggesting that human activity may not be the primary factor contributing to the elevated MPs levels [42]. Further investigation is necessary to determine the underlying causes of the high MPs concentrations in this region. The dominant polymer type of plastic fragments identified was polypropylene (PP, 44.7%), which was followed by polystyrene (PS, 28.5%) and polyethylene (PE, 20.3%) in these wetland areas (Figure S1).
In this study, MPs were detected in all sampling sites, and their abundances varied from 170 ± 15 to 2160 ± 34 items/kg (Figure 2a). MPs abundances observed in this study were similar to our previous observation in the semi-enclosed Maowei Sea [43]. Therefore, the abundance of MPs (940 ± 18–2160 ± 34 items/kg) from the four mangrove regions of the Beibu Gulf (LM, KL, QJ, and SK) is relatively high among these samples. A relative low abundance of MPs (332 ± 20–482 ± 30 items/kg) has also been reported in three mangrove regions (GD, ZJ, and HB) of the Leizhou Peninsula. The occurrence of MPs (170 ± 15–738 ± 20 items/kg) from four sampling sites (XY, QL, SM, and, SY) on Hainan Island is in the middle of the range. The characterization of MPs used in this study showed that PE and PP are two dominant plastic types for MPs, which are followed by other polymer materials accounting for a minor portion (Figure 2a). A similar result was also found in the semi-enclosed Maowei Sea where PP and PE were major compositions of MPs.
When classified by colors (Figure 2b), transparent was the most abundant (25.75–86.71%), which was followed by white (4.79–42.13%) and green (0–41.92%); the black, yellow, red, and blue MPs contributed merely 0–29.40%, 0–23.95%, 0–11.76%, and 0–8.43%, respectively. The majority (21.92–82.64%) of MPs in this study had a diameter of 1–5 mm (Figure 2c), 17.36–78.08% ranged between 0.5 and 1 mm, while only 7.95% and 39.22% were <1 mm, respectively. The relative abundance of MPs with different shapes is shown in Figure 2d. Four types of MPs with different shapes were collected, which were categorized as fragments, fibers, film, and foam. Interestingly, fiber accounted for 83.87% of the total MPs. Such a high level of fiber MPs might come from dropped fishing nets or ropes, as fishing activities were relatively frequent before sample collection.

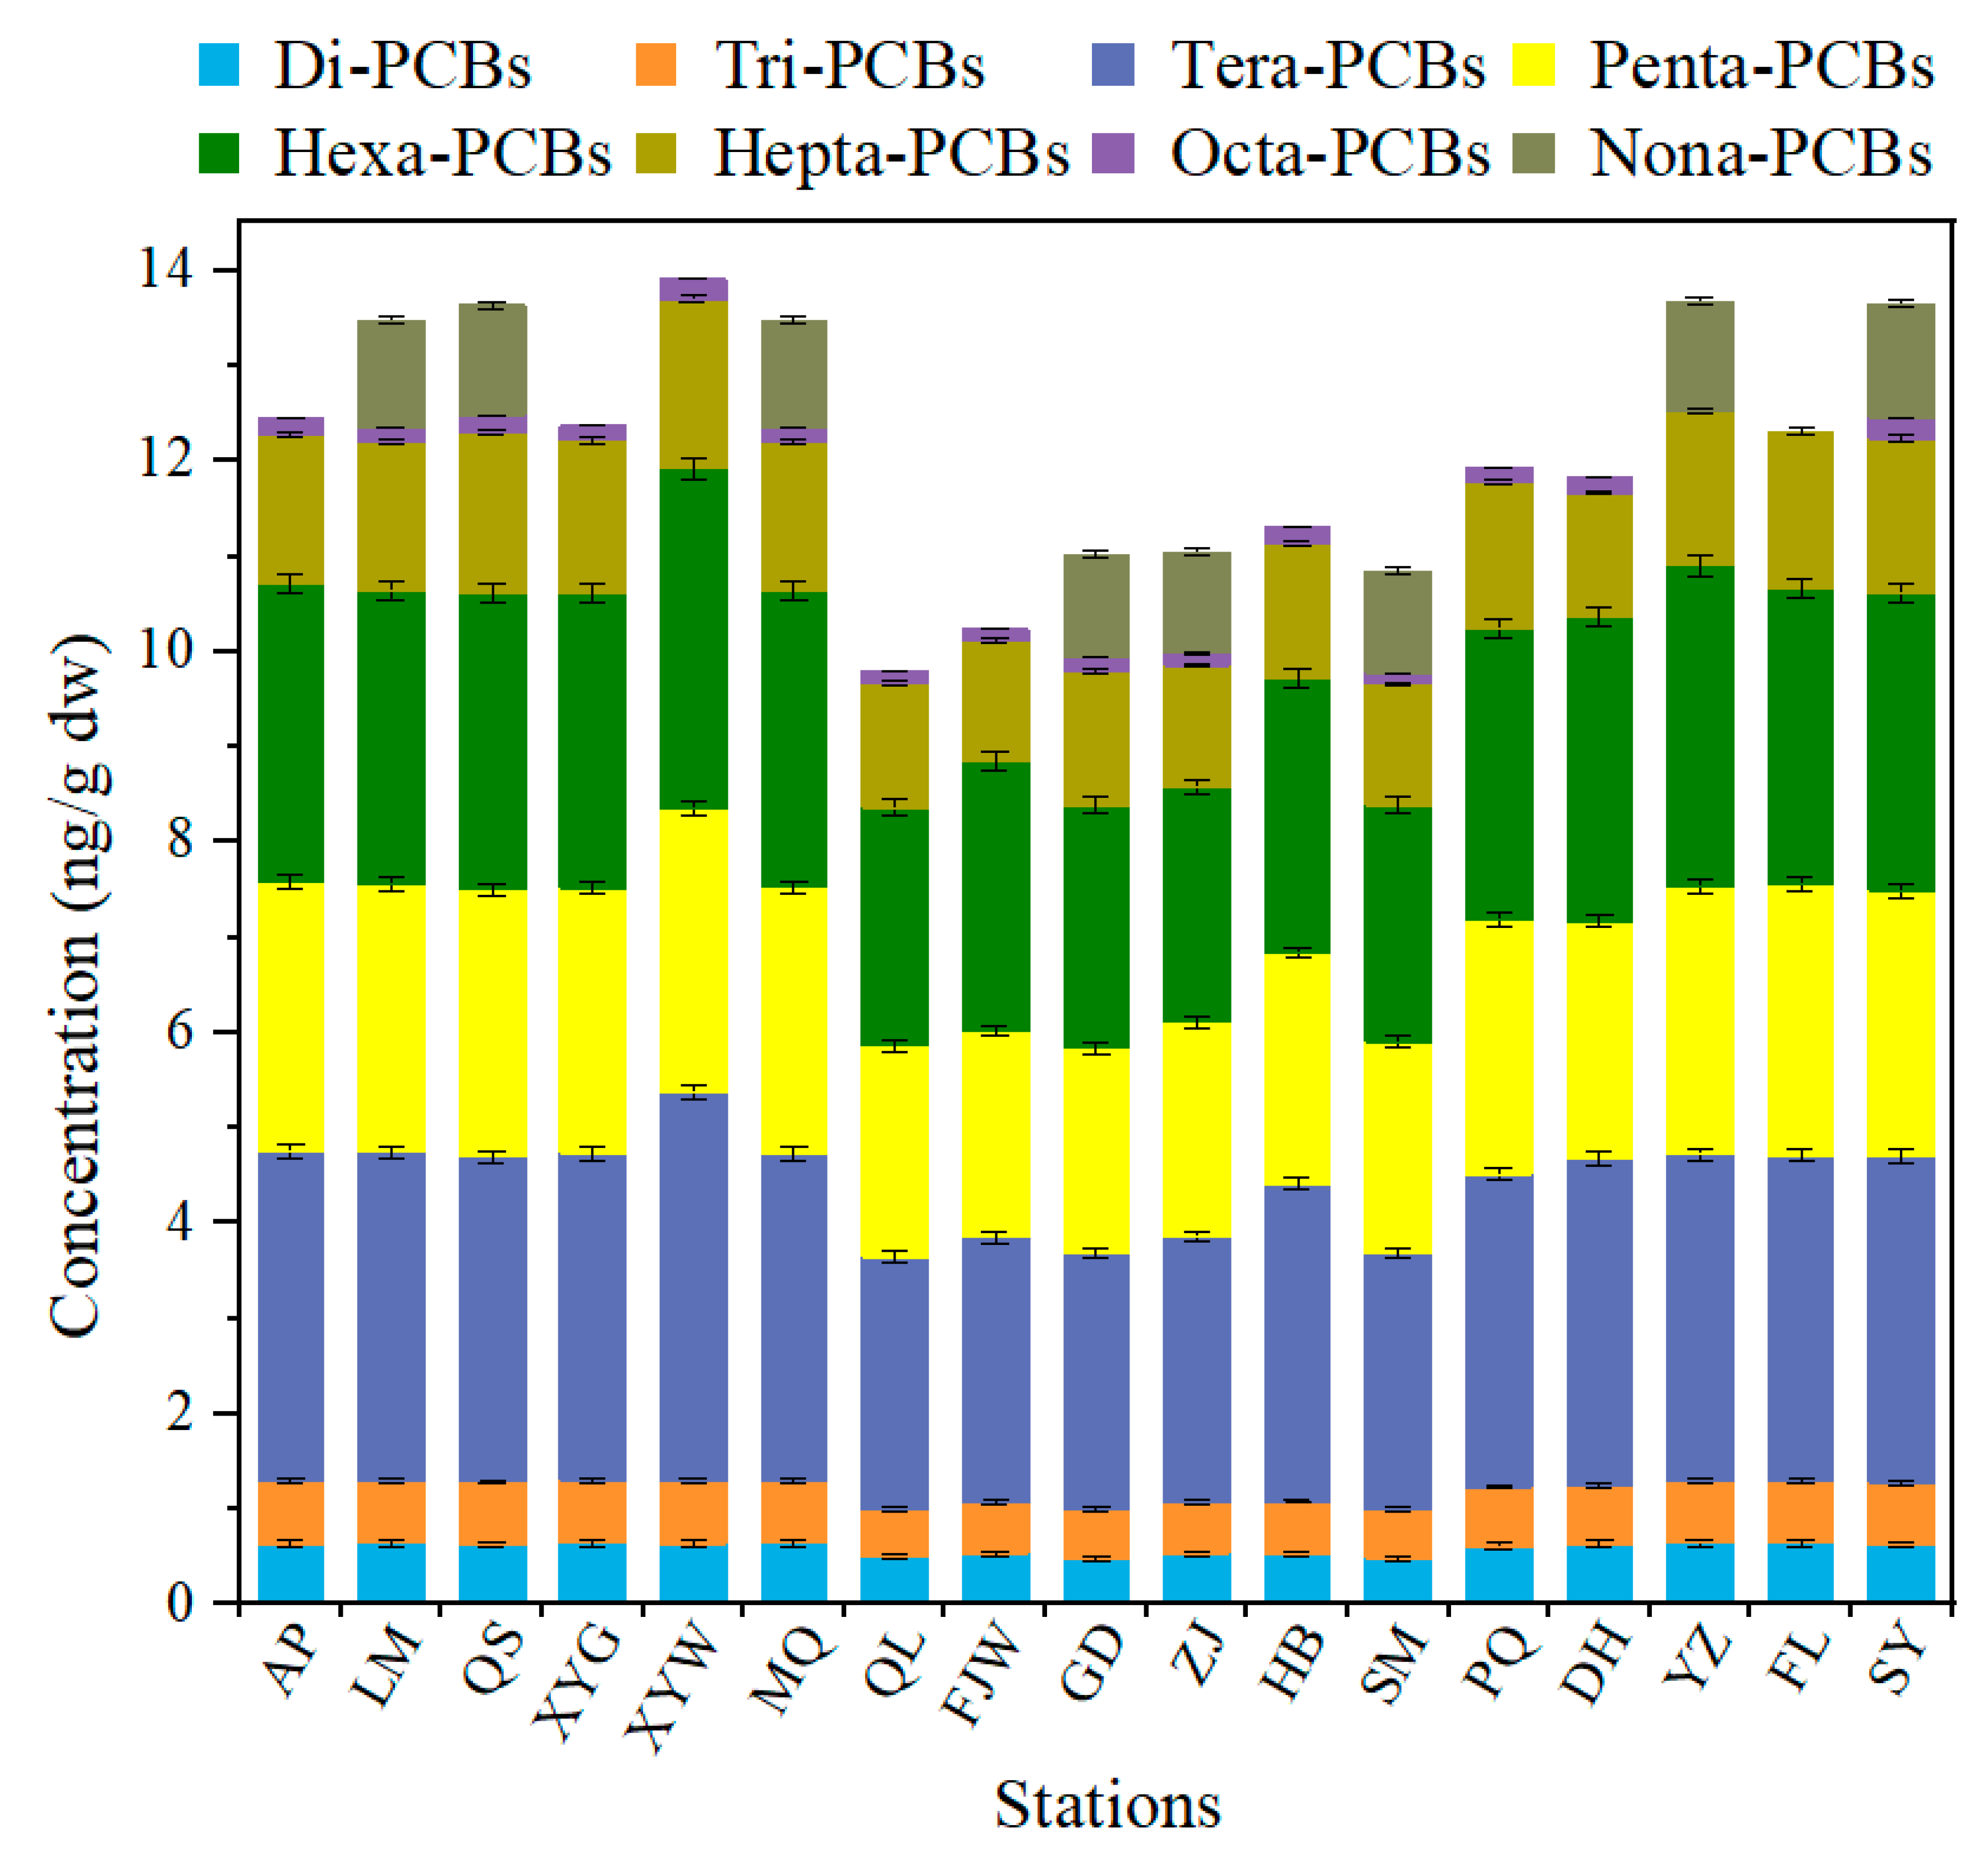
3.2. Characterization of PCBs Contamination in Different Mangrove Sediment Areas

In this study, PCBs were extracted and analyzed for PCBs in sediment samples and MPs obtained from 17 sampling sites (Figure S2). The total PCBs in the sediments from the mangrove forests in Leizhou Peninsula and Hainan Island ranged from 9.80 to 13.91 ng/g with an average of 12.17 ± 1.32 ng/g. These levels are similar to those reported in mangrove sediments from Guangdong Province (3.03 to 46.62 ng/g) [44] and the estuarine area near Jiaozhou Bay (0.83 to 7.29 ng/g) [45], indicating comparable contamination across different mangrove regions. The highest concentration of total PCBs was found at station XYW, and the lowest concentration was found at site GD. The average concentrations of PCBs congeners at all stations ranged from 0.14 to 3.24 ng/g with the highest average concentration of Tera-PCBs, which was followed by Hexa-PCBs (2.98 ng/g), Penta-PCBs (2.59 ng/g) and Hepta-PCBs (1.50 ng/g). Tetra-PCBs, Penta-PCBs, and Hepta-PCBs were the three components of PCBs with the highest proportion. They reached 30%, 25% and 27%, respectively (Figure S2). The least abundant congeners were Tri-PCBs (0.61 ng/g), Di-PCBs (0.59 ng/g), Nona-PCBs (0.53 ng/g), and Octa-PCBs (0.14 ng/g). The mean abundance of total PCBs in sediments from six points (AP, LM, QS, XYG, XYW, MQ) on the western side of the Leizhou Peninsula and Hainan Island was 13.22 ng/g, while the mean abundance of total PCBs in sediments from six points (QL, FJW, GD, ZJ, HB, SM) on the eastern side was 10.71 ng/g, and the abundance of total PCBs was significantly higher in the six western points than in the six points on the eastern side. The abundance of total PCBs at the six points on the west side was significantly higher than that at the six points on the east side. Among them, the first seven types of PCBs were detected in both zones, while the congener Nona-PCBs were not detected in some sites in both zones.
A total of eight PCBs congeners were detected in the sediment at all monitoring sites, including Di-PCBs, Tri-PCBs, Tera-PCBs, Penta-PCBs, Hexa-PCBs, Hepta-PCBs, Octa-PCBs, and Nona-PCBs. At least six congeners were detected at each site, of which the first six PCBs were detected at all monitoring sites (Figure 3a). At least six congeners were detected at each monitoring site, of which the first six congeners (Di-PCBs, Tri-PCBs, Tera-PCBs, Penta-PCBs, Hexa-PCBs, and Hepta-PCBs) were detected at each monitoring site, Octa-PCBs were detected at all sites except two (DH and FL), and the congeners Octa-PCBs were not detected at more than half of the monitoring sites (Figure 3b).

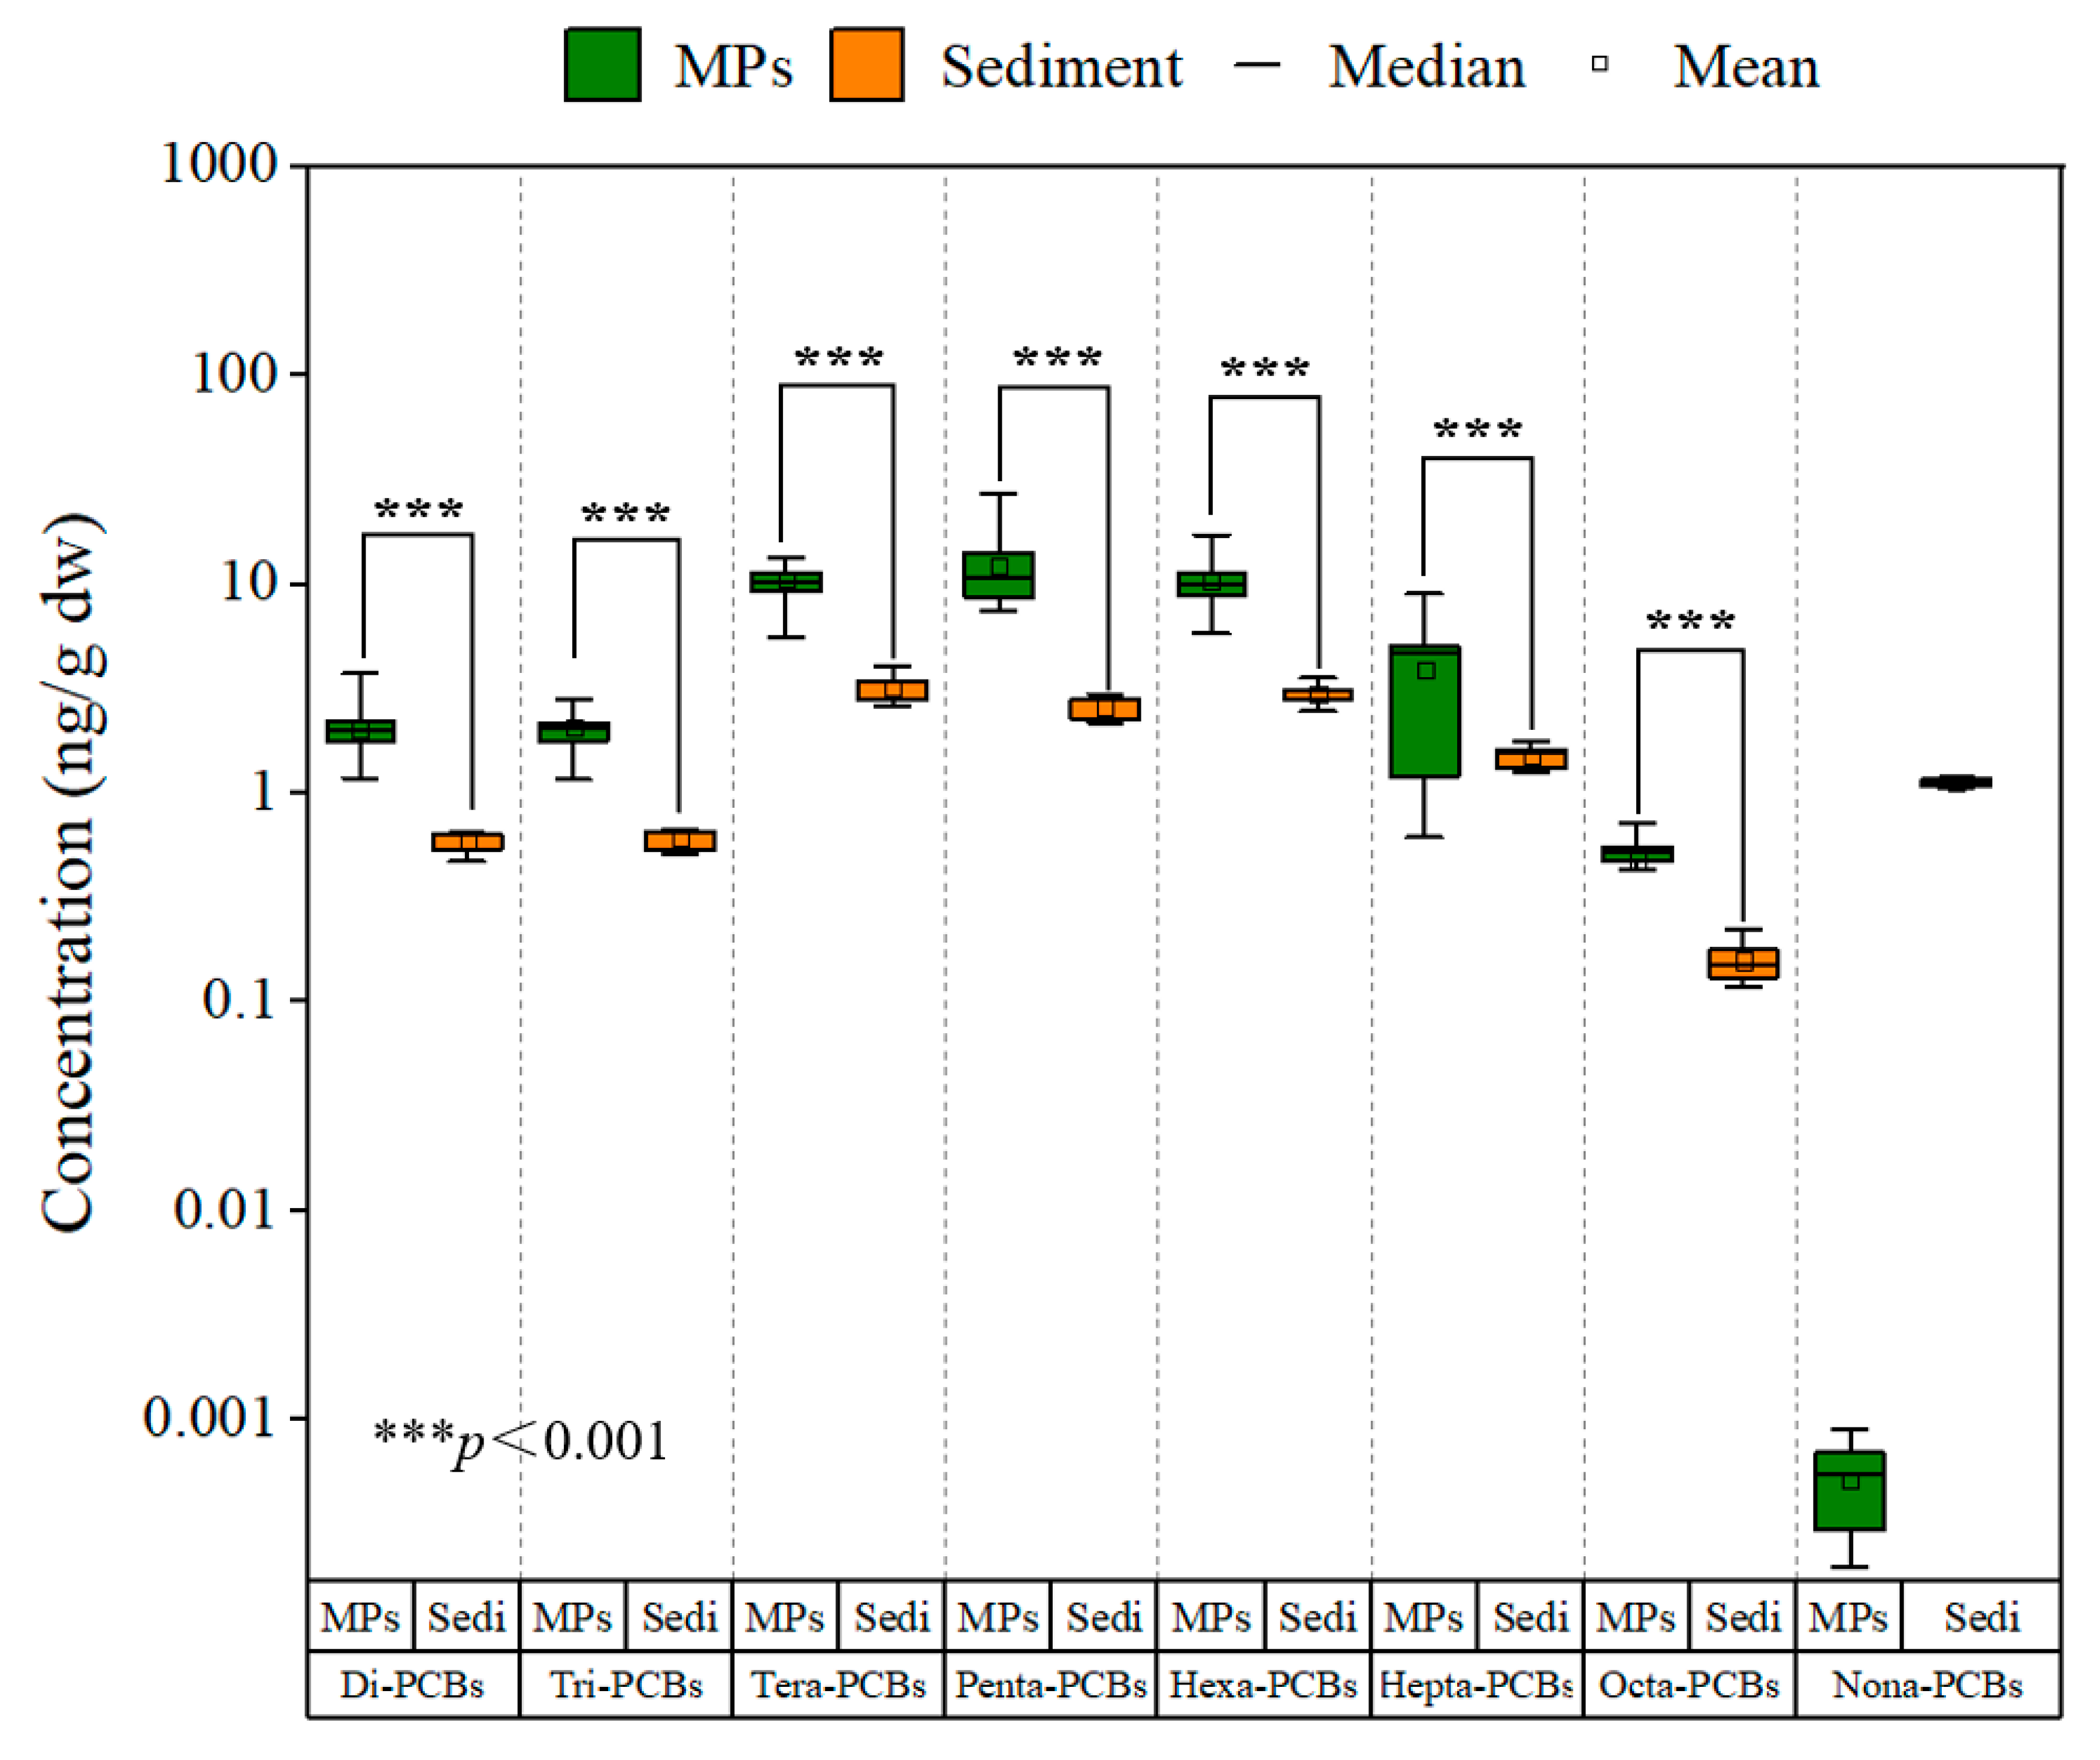
3.3. Characteristics of Microplastics-Loaded PCBs in Different Mangrove Sediment Regions

The PCB concentration on MPs within mangrove sediments (9.80–13.91 ng/g) was over 70% higher than that in the surrounding sediments (25.67–69.85 ng/g), affirming that MPs serve as a significant PCB carrier in these environments (Figure S2). When comparing this study to findings from on PCB loads in plastic fragments within the Pearl River Estuary Basin, it becomes evident that MPs in mangrove sediments carry higher PCB loads, which is likely due to the extended interaction time between MPs and PCBs within mangrove environments [46].
Regarding PCB congeners, this study identified a marked difference (p < 0.001) between the congener profiles on MPs and those in sediments, confirming MPs as key carriers of PCBs in mangrove sediments and highlighting a significant distributional variation across congener types. Figure 4 indicates that Tetra-PCBs are predominant in sediments, whereas Penta-PCBs dominate MPs loads, with MPs generally carrying higher PCB concentrations compared to sediment, except in the case of ninety-chlorobiphenyl (PCB), which was less prevalent on MPs. This discrepancy may be due to the stable characteristics of highly chlorinated PCBs, which are less volatile, more lipophilic, and resistant to biodegradation, allowing them to persist in sediments. The detected levels of these stable, highly chlorinated PCBs in sediments were between 0 and 1.18 ± 0.54 ng/g.
Across all sampling stations in the mangrove forests of Leizhou Peninsula and Hainan Island, the total PCB levels on MPs within sediments ranged from 25.68 to 69.85 ng/g with an average of 41.64 ± 11.15 ng/g (Figure S3). The highest PCB concentrations on MPs were observed in sediments from site XYW, correlating with this site’s highest overall sediment PCB levels, while the lowest concentration appeared at site QL (Figure 5). Average concentrations of PCB congeners on MPs at all sites ranged from 0.37 to 12.29 ng/g with the highest averages occurring in Penta-PCBs, which was followed by Tetra-PCBs (10.63 ng/g) and Hexa-PCBs (10.29 ng/g). Hepta-PCBs (3.938 ng/g), Tri-PCBs (2.08 ng/g), Di-PCBs (2.05 ng/g), and Octa-PCBs (0.37 ng/g) were the least abundant congeners, underscoring that PCB concentrations on MPs were consistently higher than in sediments.
Additionally, PCBs were detected in sediments across all sites with seven PCB congener types (Di-PCBs, Tri-PCBs, Tetra-PCBs, Penta-PCBs, Hexa-PCBs, Hepta-PCBs, and Octa-PCBs) identified throughout. Each site’s sediment samples contained at least six congeners, with Di-PCBs, Tri-PCBs, Tetra-PCBs, Penta-PCBs, Hexa-PCBs, and Hepta-PCBs present on MPs at every site, while Octa-PCBs were absent on MPs at MQ, FL, and QS sites (Figure S4). These patterns reinforce that MPs in mangrove sediments are critical PCB carriers and exhibit congener-specific loading distinctions.

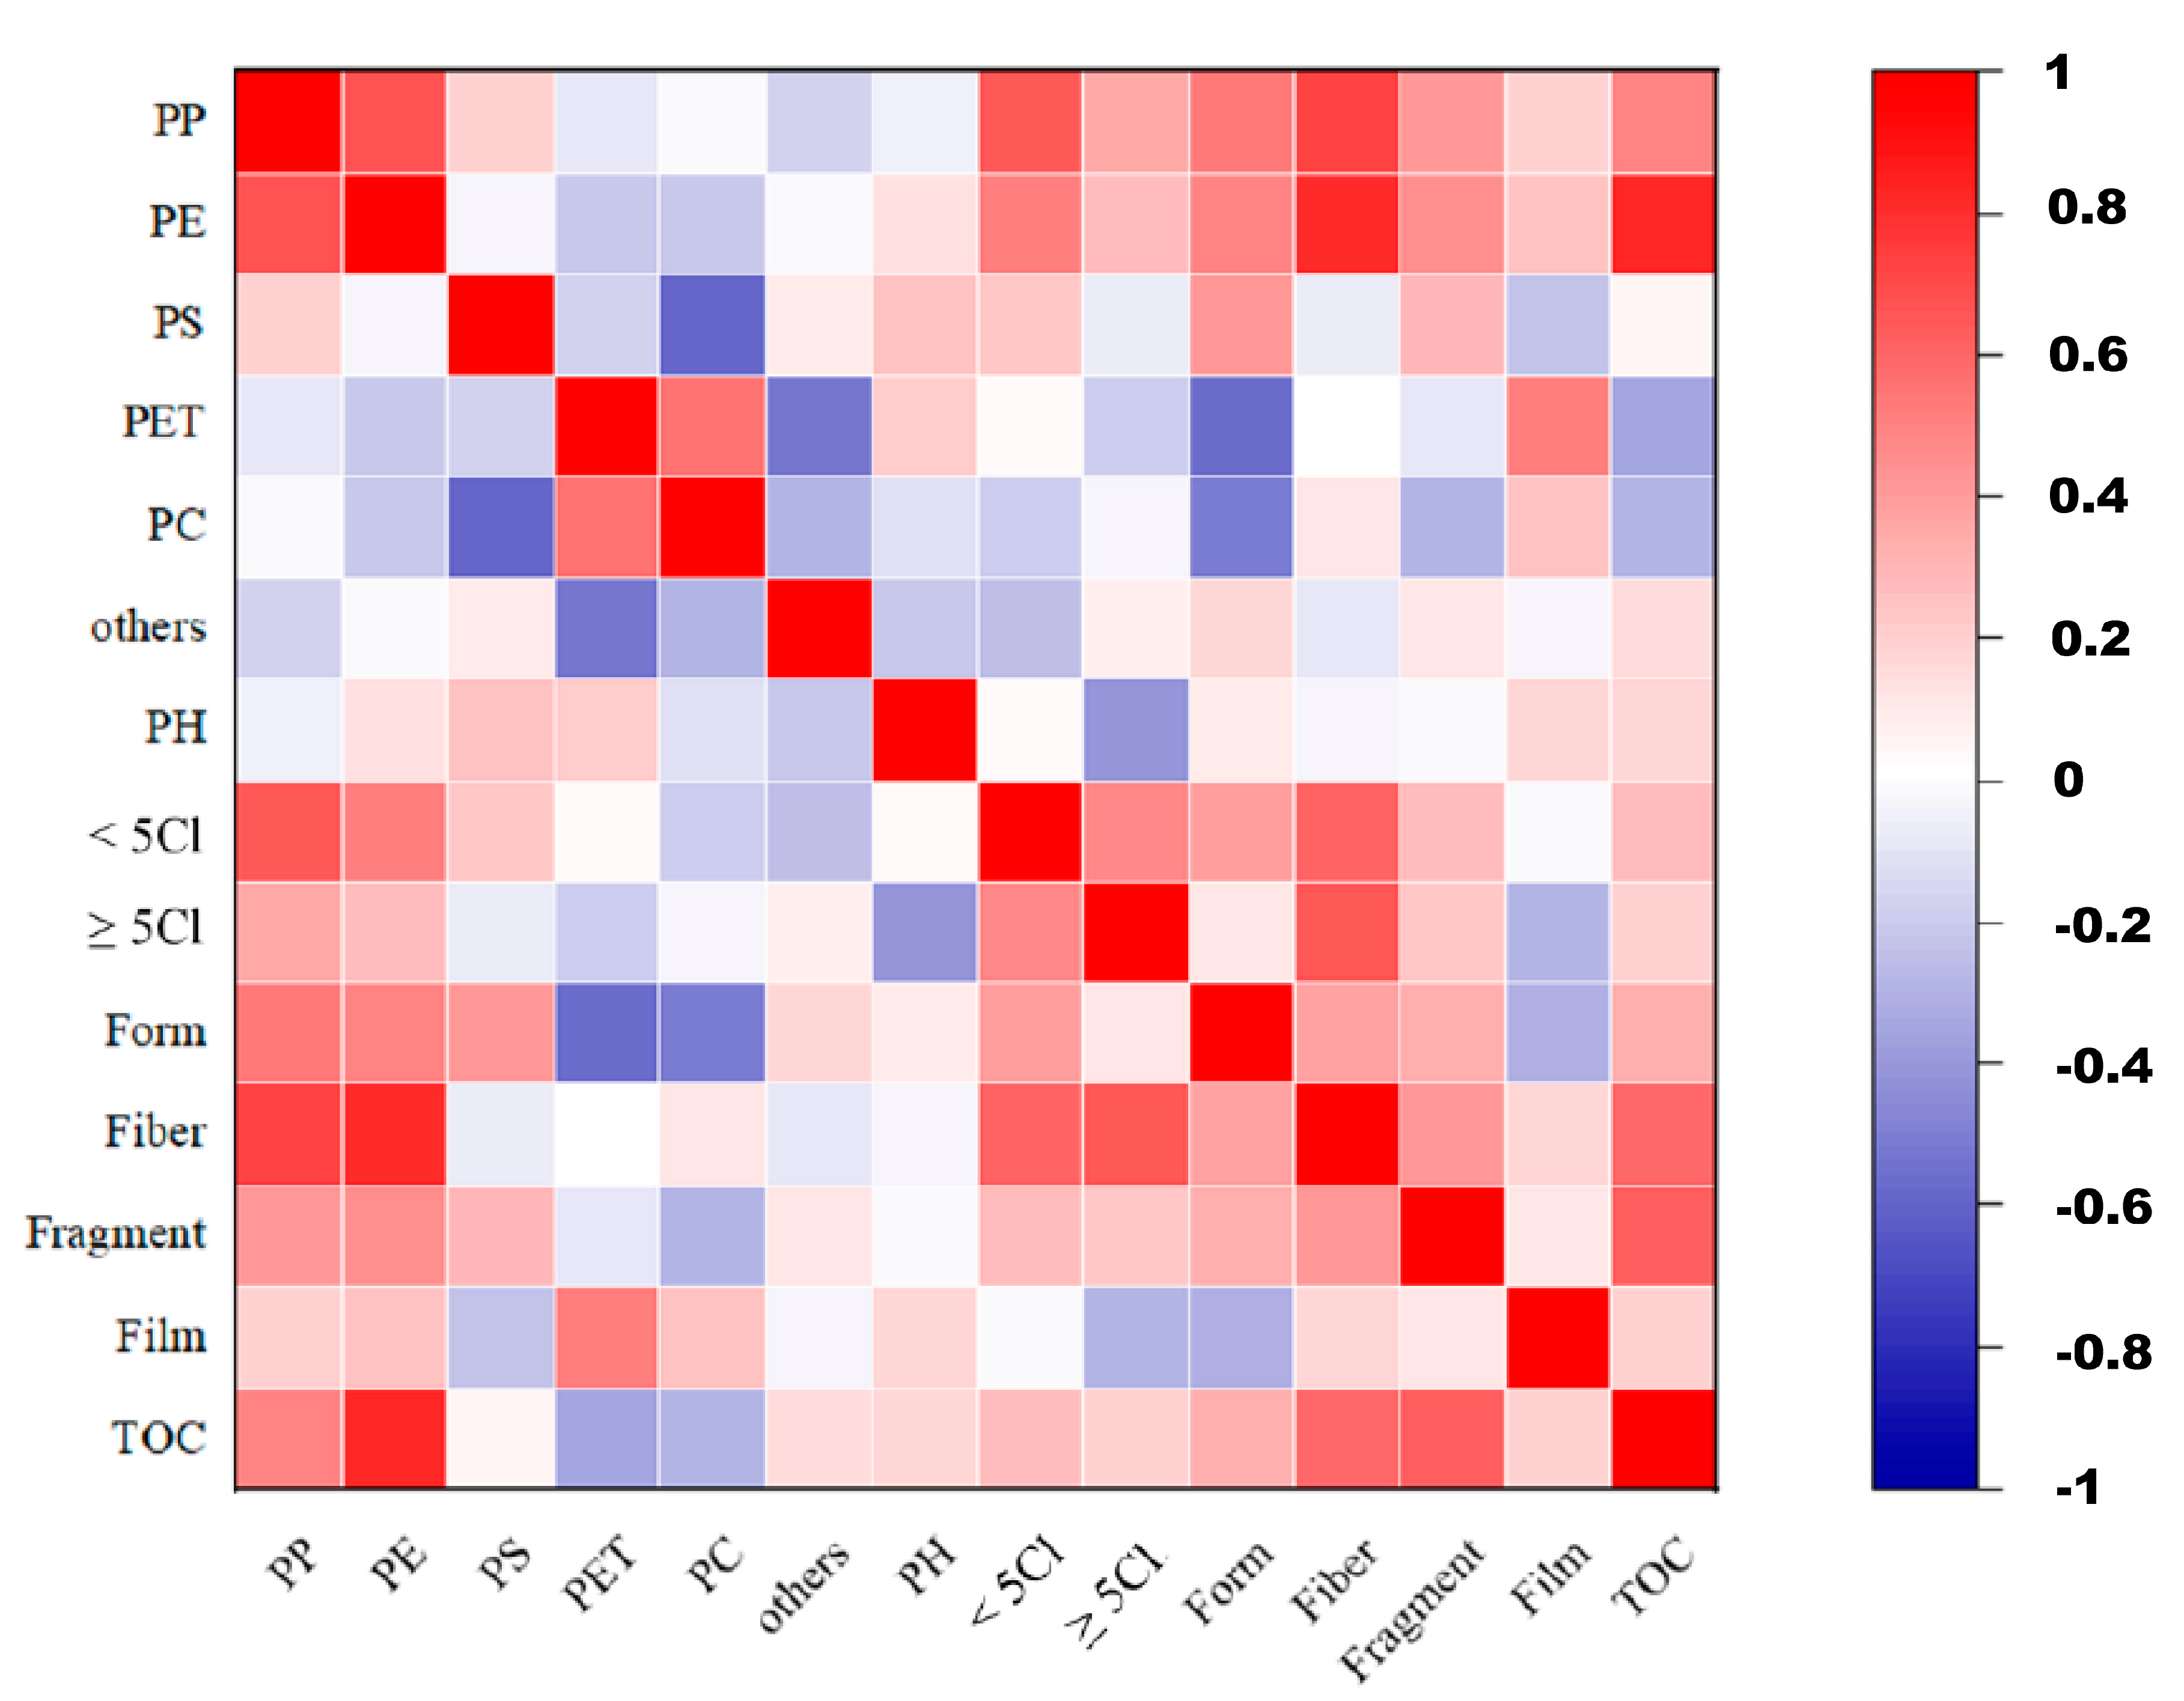
3.4. Analysis of Factors Affecting Microplastics-Loaded PCBs in Different Mangrove Sediment Regions

The quantity of PCBs attached to MPs at MQ, QS, and XYW sites varied from high to low, yet for MPs abundance, the pattern observed was QS > XYW > MQ. This indicates that PCB load on MPs does not have a direct relationship with MPs abundance. Given the diversity in MPs colors across samples, PCB load was examined primarily in relation to the predominant colors. In the samples collected from QL, colorless and transparent MPs represented 58.90% of the total MPs abundance with white MPs comprising 41.07%. Notably, MPs from QL carried a PCB load 15% higher than those from DH, even though similar color distributions were found in both locations (Figure S5). Although QL’s total MPs abundance was lower than DH’s, this outcome suggests that the MPs’ color is not directly associated with PCB load. The findings further confirm that MPs abundance does not determine the number of PCBs on MPs. In terms of size, the MPs in this study were mostly between 1 and 5 mm, with MPs in this range constituting over 60% of the total at 13 sites. However, the PCB load measured on MPs of similar sizes displayed significant variation, implying that the MPs size also does not directly influence PCB load.
Using QS, YZ, and FL as examples, the PCB loads in MPs samples from these three sites followed the order QS > YZ > FL. When comparing the main components of these samples, PP and PE made up around 90% of the total abundance, showing little variation in composition, thus enabling a meaningful comparison of their shapes. Fiber and foam structures accounted for 92%, 82%, and 70% of the total MPs abundance in samples from QS, YZ, and FL, respectively. This suggests that the PCB load on MPs is related to their shape: a higher proportion of fibers and foams correlates with increased PCB loading on MPs. This finding indicates a significant relationship between MPs type and PCB loading in typical mangrove sediments. MPs composed of PP, PE, and fiber or foam structures are particularly effective carriers of high PCB loads (Figure 6). Additionally, the MPs’ size (linked to the specific surface area) and structural characteristics can influence the adsorption of PAHs and pesticides. The study further reveals that the total organic carbon (TOC) content in mangrove sediments is positively correlated with PCB loads on MPs, while other sediment properties show no significant correlation, which is similar to the abundance patterns of MPs in these sediments.

4. Discussion

4.1. The Level of MPs-Bound PCBs and Microplastic Contamination

Although previous studies found a positive correlation between the MPs contamination level and riverine inputs, as well as densely populated and industrial areas, our study found no such relationship in the estuaries examined [47,48]. These estuaries are situated in highly populated and industrialized urban areas of China, yet the expected link between MPs contamination and anthropogenic influences was absent. One possible explanation could be the differences in economic structures and industrial practices across these urban estuaries, which may significantly influence the MPs contamination levels in mangrove ecosystems.
MPs abundance in the sediments varied considerably among different mangrove regions (p < 0.05), indicating localized differences in pollution sources or environmental conditions. Similarly, the levels of PCBs in sediments showed significant differences across regions (p < 0.05). Although the PCB concentrations on MPs did not exhibit significant variation between sites (p > 0.05), they were generally higher than in the surrounding sediment matrix, suggesting that MPs act as a vector for transporting PCBs in these ecosystems. Interestingly, the prevalence of higher-chlorinated PCBs, such as Hepta-PCBs and Octa-PCBs, was more pronounced in the sediment than on MPs.
The concentrations of individual PCB congeners adsorbed onto MPs did not significantly differ across sites. However, sediments showed a notable variation in the levels of moderately chlorinated congeners, which may imply a consistent pattern in the sorption behavior of PCBs to MPs. Lower molecular weight PCB congeners tended to dominate the total PCB load, which is likely because chemicals with lower molecular weights and hydrophobicity achieve sorption equilibrium more rapidly compared to heavier, more hydrophobic molecules [49]. This observation aligns with findings by Rai et al. [50], who demonstrated that the sorption equilibrium of PCBs on polyethylene plastics in the environment might take over a year to establish.
The moderate levels of MPs and low levels of PCBs detected in the mangrove regions, especially the prevalence of small MPs with film and fragment shapes, could pose a significant risk. The affinity of MPs to adsorb toxic substances like PCBs can create a composite toxicological effect, heightening the potential threat to aquatic organisms through ingestion and subsequent bioaccumulation [51]. This scenario also raises concerns for human health, particularly as these contaminants may transfer through the food web.
Moreover, the sorption dynamics of PCBs on MPs suggest that even low levels of MPs contamination can enhance the mobility and persistence of PCBs in the environment [52]. Given that mangrove ecosystems serve as important nurseries for marine life, the combination of MPs and associated toxicants could disrupt the ecological balance and affect biodiversity. Continued exposure to MPs-bound PCBs might lead to long-term adverse effects, including endocrine disruption and impaired growth in marine organisms, emphasizing the need for more stringent pollution control and monitoring measures in these critical habitats.

4.2. Sources of PCBs Laden on MPs and Sediment of Mangrove Ecosystem

Concentrations of PCBs laden on MPs that have been detected in mangrove sediments are lower, reflecting the weak development of the industry. PCBs were detected in cores from the more industrialized estuaries of the Changjiang (~50–750 pg/g) and Pearl River (~1.86–456 ng/g) with maxima corresponding to peak production times. The use of PCBs for industrial purposes has been banned for decades, and only limited amounts of legacy PCBs are available for affiliation with MPs.
The most abundant PCB congeners were Hexa-PCBs and Penta-PCBs in sediment, implying that lower chlorinated PCB congeners are more bioaccumulative. In addition, PCBs with high molecular weight (HMW) usually have a high octanol–water partition coefficient (Kow), but when the chlorine number of PCBs exceeds six, their bio-accumulative ability decreases because large molecules may have difficultly migrating across bio-membranes and be easily metabolically degraded.
Under the same MPs abundance, there was no significant relationship between PCBs laden on MPs and type (p > 0.05). There is evidence that PCBs buried in anaerobic sediments such as mangrove sediments would slowly undergo reductive dichlorination, resulting in a fresh source of lower chlorinated PCB congeners [53]. Although the production and use of PCBs in China were banned in the 1980s, with the rapid development, electronic manufacturing and recycling activities, pigment/paint production, and waste incineration plants may be possible new sources of PCBs in the mangrove ecosystem [54]. They can remain in the soil and sediments for long periods of time and are gradually released into the surrounding water bodies. Mangrove sediments often serve as reservoirs for these historical pollutants due to their good adsorption properties. Moreover, PCBs have been present in fuels, paints and other chemical products from ships, especially in old ships or in unregulated harbors and ship repair yard areas [55]. These activities may also release PCBs into surrounding water bodies and contaminate mangrove sediments.
In the current study, sediment dredging, bioremediation, and phytoremediation are potential strategies for mitigating PCB contamination in mangrove ecosystems [56]. PCBs, although banned in China since the 1980s, remain a concern due to ongoing industrial activities, such as electronic manufacturing, pigment production, and shipping, which continue to release PCBs into the environment [57]. These pollutants accumulate in mangrove sediments, which serve as long-term reservoirs. Sediment dredging can effectively reduce PCB concentrations by removing contaminated sediment but requires careful management to prevent the re-suspension of pollutants [58]. Bioremediation, utilizing microorganisms to degrade PCBs, offers a sustainable and eco-friendly solution, though it may be slow and may need environmental optimization to enhance effectiveness [59]. Phytoremediation uses plants to absorb and accumulate PCBs from sediments, providing a long-term solution but requiring the management of contaminated plant material to avoid secondary pollution [60,61]. Given the persistence of PCBs and the introduction of new sources, these strategies are necessary to reduce contamination levels. Strengthened regulations and improved waste management practices are crucial to mitigating PCB pollution and protecting the ecological functions of mangrove ecosystems.
The ongoing challenges of PCB pollution in mangrove ecosystems require the continued development of innovative solutions. Meanwhile, emerging technologies such as nanotechnology, electrokinetic remediation, and genetically engineered organisms offer promising new avenues for addressing this persistent problem [62,63]. A multifaceted approach, combining both remediation and pollution prevention, will be essential for reducing PCB contamination in the long term. Additionally, future research should focus on understanding the complex interactions between pollutants and ecosystems as well as considering the impacts of climate change on contamination dynamics [64]. Ultimately, effective PCB management will require a concerted effort across scientific, regulatory, and community levels to ensure the protection of mangrove ecosystems and other critical environments [65].

5. Conclusions

The study discussed in this passage focuses on MPs found in mangrove sediments, particularly on the types of plastic and colors present, as well as their shapes and sizes. The dominant types of plastic identified were polyethylene (PE) and polypropylene (PP), while transparent was the most common color, which was followed by white and green. The majority of MPs measured between 1 and 5 mm in diameter and were categorized into four shapes, including fragments, fibers, films, and foam. The study also detected PCBs associated with the MPs, although concentrations were relatively low due to the limited availability of legacy PCBs. Among the 28 PCB congeners detected, Penta-PCBs and Hexa-PCBs were the most prevalent in the MPs from mangrove sediments, accounting for around 57 ± 9% and 32 ± 5% of ∑28PCBs, respectively. Overall, there was no significant variation in PCB congener abundance among the different study sites with Tetra-PCBs, Penta-PCBs, and Hexa-PCBs being the most concentrated PCB congeners associated with the MPs or in the mangrove sediment.

Supplementary Materials

The following supporting information can be downloaded at https://www.mdpi.com/article/10.3390/jmse12122216/s1, Figure S1: The features of total abundance and spatial distribution of various types of microplastics in typical mangrove sediments; Figure S2: Distribution characteristics of PCBs in typical mangrove sediments and microplastics in Leizhou Peninsula and Hainan Island; Figure S3: Distribution of polychlorinated biphenyls (PCBs) on microplastics in mangrove sediments from Leizhou Peninsula and Hainan Island and their homologue relationships; Figure S4: Distribution characteristics of PCB-loaded congeners on microplastics in typical mangrove sediments from Leizhou Peninsula and Hainan Island; Figure S5: Concentrations of PCBs congeners laden on MPs and in mangrove sediments from different mangrove regions; Table S1: Information on the sampling sites from surface sediments of mangrove stations in Leizhou Peninsula and Hainan Island.

Author Contributions

J.H.: Conceptualization, Methodology, Writing—Original draft. J.D.: Software, Data curation, Visualization. G.Z.: Software, Data curation. G.Y.: Investigation. G.P.: Validation. Y.W. (Yihua Wei): Supervision. L.R.: Conceptualization. Y.W. (Yinghui Wang): Writing—Review & editing, Project administration, Funding acquisition. All authors have read and agreed to the published version of the manuscript.

Funding

This research was funded by the Guangxi Key Research and Development Program (GUIKEAB23026007 and GUIKEAB24010248), together with Guangxi Science and Technology Major Program (GUIKEAA23062054).

Institutional Review Board Statement

Not applicable.

Informed Consent Statement

Not applicable.

Data Availability Statement

The data are available on request.

Conflicts of Interest

The authors declare no conflicts of interest.

References

  1. Bellasi, A.; Binda, G.; Pozzi, A.; Galafassi, S.; Volta, P.; Bettinetti, R. Microplastic Contamination in Freshwater Environments: A Review, Focusing on Interactions with Sediments and Benthic Organisms. Environments 2020, 7, 30. [Google Scholar] [CrossRef]
  2. Thompson, R.C.; Olsen, Y.; Mitchell, R.P.; Davis, A.; Rowland, S.J.; John, A.W.G.; McGonigle, D.; Russell, A.E. Lost at Sea: Where Is All the Plastic? Science 2004, 304, 838. [Google Scholar] [CrossRef] [PubMed]
  3. Koutnik, V.S.; Leonard, J.; Alkidim, S.; DePrima, F.J.; Ravi, S.; Hoek, E.M.V.; Mohanty, S.K. Distribution of microplastics in soil and freshwater environments: Global analysis and framework for transport modeling. Environ. Pollut. 2021, 274, 116552. [Google Scholar] [CrossRef] [PubMed]
  4. Azaaouaj, S.; Nachite, D.; Anfuso, G.; Er-Ramy, N. Abundance and distribution of microplastics on sandy beaches of the eastern Moroccan Mediterranean coast. Mar. Pollut. Bull. 2024, 200, 116144. [Google Scholar] [CrossRef]
  5. Endo, S.; Takizawa, R.; Okuda, K.; Takada, H.; Chiba, K.; Kanehiro, H.; Ogi, H.; Yamashita, R.; Date, T. Concentration of polychlorinated biphenyls (PCBs) in beached resin pellets: Variability among individual particles and regional differences. Mar. Pollut. Bull. 2005, 50, 1103–1114. [Google Scholar] [CrossRef]
  6. Shi, R.; Liu, W.; Lian, Y.; Zeb, A.; Wang, Q. Type-dependent effects of microplastics on tomato (Lycopersicon esculentum L.): Focus on root exudates and metabolic reprogramming. Sci. Total Environ. 2023, 859, 160025. [Google Scholar] [CrossRef]
  7. Teng, L.; Zhu, Y.; Li, H.; Song, X.; Shi, L. The phytotoxicity of microplastics to the photosynthetic performance and transcriptome profiling of Nicotiana tabacum seedlings. Ecotoxicol. Environ. Saf. 2022, 231, 113155. [Google Scholar] [CrossRef]
  8. Kinigopoulou, V.; Pashalidis, I.; Kalderis, D.; Anastopoulos, I. Microplastics as carriers of inorganic and organic contaminants in the environment: A review of recent progress. J. Mol. Liq. 2022, 350, 118580. [Google Scholar] [CrossRef]
  9. Hartmann, N.B.; Rist, S.; Bodin, J.; Jensen, L.H.; Schmidt, S.N.; Mayer, P.; Meibom, A.; Baun, A. Microplastics as vectors for environmental contaminants: Exploring sorption, desorption, and transfer to biota. Integr. Environ. Assess. Manag. 2017, 13, 488–493. [Google Scholar] [CrossRef]
  10. Setälä, O.; Fleming-Lehtinen, V.; Lehtiniemi, M. Ingestion and transfer of microplastics in the planktonic food web. Environ. Pollut. 2014, 185, 77–83. [Google Scholar] [CrossRef]
  11. Li, X.; Zheng, Y.; Lu, L.; Eom, J.; Ru, S.; Li, Y.; Wang, J. Trophic transfer of micro- and nanoplastics and toxicity induced by long-term exposure of nanoplastics along the rotifer (Brachionus plicatilis)-marine medaka (Oryzias melastigma) food chain. Environ. Pollut. 2024, 346, 123599. [Google Scholar] [CrossRef] [PubMed]
  12. Li, R.; Yu, L.; Chai, M.; Wu, H.; Zhu, X. The distribution, characteristics and ecological risks of microplastics in the mangroves of Southern China. Sci. Total Environ. 2020, 708, 135025. [Google Scholar] [CrossRef] [PubMed]
  13. Liu, X.; Liu, H.; Chen, L.; Wang, X. Ecological interception effect of mangroves on microplastics. J. Hazard. Mater. 2022, 423, 127231. [Google Scholar] [CrossRef] [PubMed]
  14. Yu, H.; Qi, W.; Cao, X.; Hu, J.; Li, Y.; Peng, J.; Hu, C.; Qu, J. Microplastic residues in wetland ecosystems: Do they truly threaten the plant-microbe-soil system? Environ. Int. 2021, 156, 106708. [Google Scholar] [CrossRef]
  15. Song, X.; Zhuang, W.; Cui, H.; Liu, M.; Gao, T.; Li, A.; Gao, Z. Interactions of microplastics with organic, inorganic and bio-pollutants and the ecotoxicological effects on terrestrial and aquatic organisms. Sci. Total Environ. 2022, 838, 156068. [Google Scholar] [CrossRef]
  16. Su, X.; Liu, M.; Yuan, J.; Huang, X.; Lu, Z.; Xu, J.; He, Y. Potential risk of co-occurrence of microplastics and chlorinated persistent organic pollutants to coastal wetlands: Evidence from a case study. Environ. Pollut. 2023, 320, 121087. [Google Scholar] [CrossRef]
  17. Rani, M.; Shim, W.J.; Han, G.M.; Jang, M.; Al-Odaini, N.A.; Song, Y.K.; Hong, S.H. Qualitative Analysis of Additives in Plastic Marine Debris and Its New Products. Arch. Environ. Contam. Toxicol. 2015, 69, 352–366. [Google Scholar] [CrossRef]
  18. Mai, L.; You, S.-N.; He, H.; Bao, L.-J.; Liu, L.-Y.; Zeng, E.Y. Riverine Microplastic Pollution in the Pearl River Delta, China: Are Modeled Estimates Accurate? Environ. Sci. Technol. 2019, 53, 11810–11817. [Google Scholar] [CrossRef]
  19. Rohais, S.; Armitage, J.J.; Romero-Sarmiento, M.-F.; Pierson, J.-L.; Teles, V.; Bauer, D.; Cassar, C.; Sebag, D.; Klopffer, M.-H.; Pelerin, M. A source-to-sink perspective of an anthropogenic marker: A first assessment of microplastics concentration, pathways, and accumulation across the environment. Earth Sci. Rev. 2024, 254, 104822. [Google Scholar] [CrossRef]
  20. Wang, Y.; Jiao, M.; Zhao, Z.; Wang, Y.; Li, T.; Wei, Y.; Li, R.; Yang, F. Insight into the role of niche concept in deciphering the ecological drivers of MPs-associated bacterial communities in mangrove forest. Water Res. 2024, 249, 120995. [Google Scholar] [CrossRef]
  21. Bolívar-Anillo, H.J.; Asensio-Montesinos, F.; Reyes Almeida, G.; Solano Llanos, N.; Sánchez Moreno, H.; Orozco-Sánchez, C.J.; Villate Daza, D.A.; Iglesias-Navas, M.A.; Anfuso, G. Litter Content of Colombian Beaches and Mangrove Forests: Results from the Caribbean and Pacific Coasts. J. Mar. Sci. Eng. 2023, 11, 250. [Google Scholar] [CrossRef]
  22. De, K.; Sautya, S.; Dora, G.U.; Gaikwad, S.; Katke, D.; Salvi, A. Mangroves in the “Plasticene”: High exposure of coastal mangroves to anthropogenic litter pollution along the Central-West coast of India. Sci. Total Environ. 2023, 858, 160071. [Google Scholar] [CrossRef] [PubMed]
  23. Farzana, S.; Cheung, S.G.; Zhou, H.C.; Tam, N.F.Y. Growth and antioxidative response of two mangrove plants to interaction between aquaculture effluent and BDE-99. Sci. Total Environ. 2019, 662, 796–804. [Google Scholar] [CrossRef] [PubMed]
  24. Yang, T.; Zeng, Y.; Kang, Z.; Cai, M.; Chen, K.; Zhao, Q.; Lin, J.; Liu, R.; Xu, G. Enrichment and ecological risks of microplastics in mangroves of southern Hainan Island, China. Sci. Total Environ. 2023, 889, 164160. [Google Scholar] [CrossRef]
  25. Yu, L.; Li, R.; Zhang, Z.; Wu, H.; Chai, M.; Zhu, X.; Guo, W. Distribution, characteristics, and human exposure to microplastics in mangroves within the Guangdong-Hong Kong-Macao Greater Bay Area. Mar. Pollut. Bull. 2022, 175, 113395. [Google Scholar] [CrossRef]
  26. Mendes, D.S.; Silva, D.N.N.; Santiago, L.E.P.; Gomes, V.J.C.; Beasley, C.R.; Fernandes, M.E.B. Comprehensive risk assessment of microplastics in tidal channel sediments in amazonian mangroves (northern Brazil). J. Environ. Manag. 2024, 366, 121826. [Google Scholar] [CrossRef]
  27. Qian, X.; Liang, B.; Fu, W.; Liu, X.; Cui, B. Polycyclic aromatic hydrocarbons (PAHs) in surface sediments from the intertidal zone of Bohai Bay, Northeast China: Spatial distribution, composition, sources and ecological risk assessment. Mar. Pollut. Bull. 2016, 112, 349–358. [Google Scholar] [CrossRef]
  28. Ranjbar Jafarabadi, A.; Riyahi Bakhtiari, A.; Moghimi, H.; Gorokhova, E. Assessment of parent and alkyl -PAHs in surface sediments of Iranian mangroves on the northern coast of the Persian Gulf: Spatial accumulation distribution, influence factors, and ecotoxicological risks. Chemosphere 2024, 358, 142176. [Google Scholar] [CrossRef]
  29. Prajapati, A.; Narayan Vaidya, A.; Kumar, A.R. Microplastic properties and their interaction with hydrophobic organic contaminants: A review. Environ. Sci. Pollut. Res. 2022, 29, 49490–49512. [Google Scholar] [CrossRef]
  30. Tan, B.; Li, Y.; Xie, H.; Dai, Z.; Zhou, C.; Qian, Z.-J.; Hong, P.; Liang, Y.; Ren, L.; Sun, S.; et al. Microplastics accumulation in mangroves increasing the resistance of its colonization Vibrio and Shewanella. Chemosphere 2022, 295, 133861. [Google Scholar] [CrossRef]
  31. Olisah, C.; Malloum, A.; Adegoke, K.A.; Ighalo, J.O.; Conradie, J.; Ohoro, C.R.; Amaku, J.F.; Oyedotun, K.O.; Maxakato, N.W.; Akpomie, K.G.; et al. Scientometric trends and knowledge maps of global polychlorinated naphthalenes research over the past four decades. Environ. Pollut. 2024, 357, 124407. [Google Scholar] [CrossRef] [PubMed]
  32. Yuan, L.; Wu, Y.; Shi, L.; Song, J.; Jiang, Y. Organochlorine pesticides and polychlorinated biphenyls in sediments of the Lanzhou reach of Yellow River (China): Spatial distribution, sources and risk assessment. Mar. Pollut. Bull. 2024, 208, 116962. [Google Scholar] [CrossRef]
  33. Noman, M.A.; Adyel, T.M.; Macreadie, P.I.; Trevathan-Tackett, S.M. Prioritising plastic pollution research in blue carbon ecosystems: A scientometric overview. Sci. Total Environ. 2024, 914, 169868. [Google Scholar] [CrossRef] [PubMed]
  34. Zanardi-Lamardo, E.; Mitra, S.; Vieira-Campos, A.A.; Cabral, C.B.; Yogui, G.T.; Sarkar, S.K.; Biswas, J.K.; Godhantaraman, N. Distribution and sources of organic contaminants in surface sediments of Hooghly river estuary and Sundarban mangrove, eastern coast of India. Mar. Pollut. Bull. 2019, 146, 39–49. [Google Scholar] [CrossRef] [PubMed]
  35. Hao, Z.; Xu, M.; Zou, X.; Wang, C. The changing Changjiang River estuarine-coastal ocean continuum in the anthropocene. Catena 2024, 238, 107904. [Google Scholar] [CrossRef]
  36. Xue, B.; Zhang, L.; Li, R.; Wang, Y.; Guo, J.; Yu, K.; Wang, S. Underestimated Microplastic Pollution Derived from Fishery Activities and “Hidden” in Deep Sediment. Environ. Sci. Technol. 2020, 54, 2210–2217. [Google Scholar] [CrossRef]
  37. Li, R.; Zhang, L.; Xue, B.; Wang, Y. Abundance and characteristics of microplastics in the mangrove sediment of the semi-enclosed Maowei Sea of the south China sea: New implications for location, rhizosphere, and sediment compositions. Environ. Pollut. 2019, 244, 685–692. [Google Scholar] [CrossRef]
  38. Ding, J.; Jiang, F.; Li, J.; Wang, Z.; Sun, C.; Wang, Z.; Fu, L.; Ding, N.X.; He, C. Microplastics in the Coral Reef Systems from Xisha Islands of South China Sea. Environ. Sci. Technol. 2019, 53, 8036–8046. [Google Scholar] [CrossRef]
  39. Mohamed Nor, N.H.; Obbard, J.P. Microplastics in Singapore’s coastal mangrove ecosystems. Mar. Pollut. Bull. 2014, 79, 278–283. [Google Scholar] [CrossRef]
  40. Zhang, D.; Dang, H.; Li, Z.; Zhang, C. Redox characteristics of humins and their coupling with potential PCB dechlorinators in southern Yellow Sea sediments. Environ. Pollut. 2019, 252, 296–304. [Google Scholar] [CrossRef]
  41. Zhang, Z.; Pei, N.; Sun, Y.; Li, J.; Li, X.; Yu, S.; Xu, X.; Hu, Y.; Mai, B. Halogenated organic pollutants in sediments and organisms from mangrove wetlands of the Jiulong River Estuary, South China. Environ. Res. 2019, 171, 145–152. [Google Scholar] [CrossRef] [PubMed]
  42. Zhu, J.; Zhang, Q.; Li, Y.; Tan, S.; Kang, Z.; Yu, X.; Lan, W.; Cai, L.; Wang, J.; Shi, H. Microplastic pollution in the Maowei Sea, a typical mariculture bay of China. Sci. Total Environ. 2019, 658, 62–68. [Google Scholar] [CrossRef] [PubMed]
  43. Lu, X.; Lao, Q.; Chen, F.; Zhou, X.; Chen, C.; Zhu, Q. Assessing the sources and dynamics of organic matter in a high human impact bay in the northern Beibu Gulf: Insights from stable isotopes and optical properties. Front. Mar. Sci. 2022, 9, 1043278. [Google Scholar] [CrossRef]
  44. Mai, L.; He, H.; Bao, L.-J.; Liu, L.-Y.; Zeng, E.Y. Plastics Are an Insignificant Carrier of Riverine Organic Pollutants to the Coastal Oceans. Environ. Sci. Technol. 2020, 54, 15852–15860. [Google Scholar] [CrossRef]
  45. Zhao, B.; Zhou, Y.-W.; Chen, G.-Z. The effect of mangrove reforestation on the accumulation of PCBs in sediment from different habitats in Guangdong, China. Mar. Pollut. Bull. 2012, 64, 1614–1619. [Google Scholar] [CrossRef]
  46. Wu, H.; Li, Q.; Wang, Y.; Hu, S. Distribution, sources, and ecological risk assessment of polychlorinated biphenyls (PCBs) in the estuary of Dagu River, China. Mar. Pollut. Bull. 2023, 194, 115340. [Google Scholar] [CrossRef]
  47. Wu, Y.; Chen, X.; Wen, L.; Li, Z.; Peng, M.; Wu, H.; Xie, L. Linking human activity to spatial accumulation of microplastics along mangrove coasts. Sci. Total Environ. 2022, 825, 154014. [Google Scholar] [CrossRef]
  48. Xin, X.; Chen, B.; Yang, M.; Gao, S.; Wang, H.; Gu, W.; Li, X.; Zhang, B. A critical review on the interaction of polymer particles and co-existing contaminants: Adsorption mechanism, exposure factors, effects on plankton species. J. Hazard. Mater. 2023, 445, 130463. [Google Scholar] [CrossRef]
  49. Delle Site, A. Factors Affecting Sorption of Organic Compounds in Natural Sorbent/Water Systems and Sorption Coefficients for Selected Pollutants. A Review. J. Phys. Chem. Ref. Data 2001, 30, 187–439. [Google Scholar] [CrossRef]
  50. Rai, P.K.; Sonne, C.; Brown, R.J.C.; Younis, S.A.; Kim, K.-H. Adsorption of environmental contaminants on micro- and nano-scale plastic polymers and the influence of weathering processes on their adsorptive attributes. J. Hazard. Mater. 2022, 427, 127903. [Google Scholar] [CrossRef]
  51. Xu, H.; Hu, Z.; Sun, Y.; Xu, J.; Huang, L.; Yao, W.; Yu, Z.; Xie, Y. Microplastics supply contaminants in food chain: Non-negligible threat to health safety. Environ. Geochem. Health 2024, 46, 276. [Google Scholar] [CrossRef] [PubMed]
  52. Ali, M.; Xu, D.; Yang, X.; Hu, J. Microplastics and PAHs mixed contamination: An in-depth review on the sources, co-occurrence, and fate in marine ecosystems. Water Res. 2024, 257, 121622. [Google Scholar] [CrossRef] [PubMed]
  53. Souza ASd Torres, J.P.M.; Meire, R.O.; Neves, R.C.; Couri, M.S.; Serejo, C.S. Organochlorine pesticides (OCs) and polychlorinated biphenyls (PCBs) in sediments and crabs (Chasmagnathus granulata, Dana, 1851) from mangroves of Guanabara Bay, Rio de Janeiro State, Brazil. Chemosphere 2008, 73 (Suppl. 1), S186–S192. [Google Scholar] [CrossRef] [PubMed]
  54. Chen, S.-J.; Luo, X.-J.; Mai, B.-X.; Sheng, G.-Y.; Fu, J.-M.; Zeng, E.Y. Distribution and Mass Inventories of Polycyclic Aromatic Hydrocarbons and Organochlorine Pesticides in Sediments of the Pearl River Estuary and the Northern South China Sea. Environ. Sci. Technol. 2006, 40, 709–714. [Google Scholar] [CrossRef] [PubMed]
  55. Alagan, M.; Chandra Kishore, S.; Perumal, S.; Manoj, D.; Raji, A.; Kumar, R.S.; Almansour, A.I.; Lee, Y.R. Narrative of hazardous chemicals in water: Its potential removal approach and health effects. Chemosphere 2023, 335, 139178. [Google Scholar] [CrossRef]
  56. Qamar, A.; Waheed, J.; Ghulam Mohyuddin, S.; Chen, Z.-B.; Kang, D.-J.; Li, Z.; Anthony, G.H.; Gooneratne, R.; Nie, F.-H.; Chen, J.-J. The Status of Polychlorinated Biphenyls (PCBs) Extract from Zhanjiang Mangrove Sediments and the Effects on Tissue Structure and Inflammatory Cytokines in Zebrafish Liver. Bull. Environ. Contam. Toxicol. 2022, 108, 890–900. [Google Scholar] [CrossRef]
  57. Zhu, M.; Yuan, Y.; Yin, H.; Guo, Z.; Wei, X.; Qi, X.; Liu, H.; Dang, Z. Environmental contamination and human exposure of polychlorinated biphenyls (PCBs) in China: A review. Sci. Total Environ. 2022, 805, 150270. [Google Scholar] [CrossRef]
  58. Šrédlová, K.; Cajthaml, T. Recent advances in PCB removal from historically contaminated environmental matrices. Chemosphere 2022, 287, 132096. [Google Scholar] [CrossRef]
  59. Valizadeh, S.; Lee, S.S.; Baek, K.; Choi, Y.J.; Jeon, B.-H.; Rhee, G.H.; Andrew Lin, K.-Y.; Park, Y.-K. Bioremediation strategies with biochar for polychlorinated biphenyls (PCBs)-contaminated soils: A review. Environ. Res. 2021, 200, 111757. [Google Scholar] [CrossRef]
  60. Passatore, L.; Rossetti, S.; Juwarkar, A.A.; Massacci, A. Phytoremediation and bioremediation of polychlorinated biphenyls (PCBs): State of knowledge and research perspectives. J. Hazard. Mater. 2014, 278, 189–202. [Google Scholar] [CrossRef]
  61. Kafle, A.; Timilsina, A.; Gautam, A.; Adhikari, K.; Bhattarai, A.; Aryal, N. Phytoremediation: Mechanisms, plant selection and enhancement by natural and synthetic agents. Environ. Adv. 2022, 8, 100203. [Google Scholar] [CrossRef]
  62. Pokrajac, L.; Abbas, A.; Chrzanowski, W.; Dias, G.M.; Eggleton, B.J.; Maguire, S.; Maine, E.; Malloy, T.; Nathwani, J.; Nazar, L.; et al. Nanotechnology for a Sustainable Future: Addressing Global Challenges with the International Network4Sustainable Nanotechnology. ACS Nano 2021, 15, 18608–18623. [Google Scholar] [CrossRef] [PubMed]
  63. Rafeeq, H.; Afsheen, N.; Rafique, S.; Arshad, A.; Intisar, M.; Hussain, A.; Bilal, M.; Iqbal, H.M.N. Genetically engineered microorganisms for environmental remediation. Chemosphere 2023, 310, 136751. [Google Scholar] [CrossRef] [PubMed]
  64. Hatje, V.; Sarin, M.; Sander, S.G.; Omanović, D.; Ramachandran, P.; Völker, C.; Barra, R.O.; Tagliabue, A. Emergent interactive effects of climate change and contaminants in coastal and ocean ecosystems. Front. Mar. Sci. 2022, 9, 936109. [Google Scholar] [CrossRef]
  65. Weiskopf, S.R.; Rubenstein, M.A.; Crozier, L.G.; Gaichas, S.; Griffis, R.; Halofsky, J.E.; Hyde, K.J.W.; Morelli, T.L.; Morisette, J.T.; Muñoz, R.C.; et al. Climate change effects on biodiversity, ecosystems, ecosystem services, and natural resource management in the United States. Sci. Total Environ. 2020, 733, 137782. [Google Scholar] [CrossRef]
Figure 1. Spatial distribution of PCBs laden on MPs sampled in eleven major mangrove sediments of typical mangrove regions.
Jmse 12 02216 g001
Figure 2. The abundance and type (a), color (b), size (c), and shape (d) characteristics of microplastics in mangrove sediment located on the typical mangrove regions.
Jmse 12 02216 g002
Figure 3. Concentrations of PCBs in sediments (a) and MPs-bound PCBs (b) from different mangrove sediment regions.
Jmse 12 02216 g003
Figure 4. Distribution characteristics of PCB-loaded congeners on typical mangrove sediments and microplastics in Leizhou Peninsula and Hainan Island.
Jmse 12 02216 g004
Figure 5. Characteristic distribution of PCBs and their congeners in typical mangrove sediments of Leizhou Peninsula and Hainan Island.
Jmse 12 02216 g005
Figure 6. Correlation analysis of PCBs in MPs with microplastics characteristics and environmental parameters in the corresponding sediment samples.
Jmse 12 02216 g006
Disclaimer/Publisher’s Note: The statements, opinions and data contained in all publications are solely those of the individual author(s) and contributor(s) and not of MDPI and/or the editor(s). MDPI and/or the editor(s) disclaim responsibility for any injury to people or property resulting from any ideas, methods, instructions or products referred to in the content.

