Article

Dynamic Response and Fatigue Analysis of a New Marine Gravitational Energy Storage System Under Wave Loads

by
Ziheng Wang
1,
Dazhi Huang
2,*,
Hongkun He
2,
Feifei Yang
2,
Wenhao Li
3 and
Yi Chen
2
1
Makarov College of Marine Engineering, Jiangsu Ocean University, Lianyungang 222005, China
2
College of Ocean Engineering, Jiangsu Ocean University, Lianyungang 222005, China
3
Lianyungang Port Group Co., Ltd., Lianyungang 222005, China
*
Author to whom correspondence should be addressed.
J. Mar. Sci. Eng. 2024, 12(12), 2196; https://doi.org/10.3390/jmse12122196
Submission received: 14 October 2024 / Revised: 25 November 2024 / Accepted: 26 November 2024 / Published: 1 December 2024
(This article belongs to the Section Marine Energy)

Abstract

:
Given the unstable input of electricity generated by offshore renewable energy in connection to the power grid at present, one solution is energy storage technology. In recent years, the new marine gravitational energy storage technology has received wide attention in China and worldwide. To apply this new energy storage technology for use in the ocean, in view of the structural characteristics of the new offshore gravitational energy storage system, a support structure based on the foundation of a wind-powered pipe frame is proposed. In order to verify the feasibility of the support structure, a finite element model is established using SACS to analyze whether it meets the requirements. The construction of this structure in a specific sea is simulated through finite element simulation. Then, in accordance with the hydrogeological conditions of the sea area, the wind turbine data, and the dimensional parameters of the energy storage system’s structure, a finite element model is established with SACS for static analysis, modal analysis, random wave response analysis, and wave spectrum fatigue analysis, thereby determining whether the structure meets the requirements for strength, deformation, and fatigue. The research results show that the UC value of the static strength of the support structure of the new offshore gravitational energy storage system is less than 1. In the modal analysis, the natural frequencies of the first- and second-order modes are not within the danger range. In the corresponding random wave analysis, it is found that the natural frequencies of the first four orders are the greatest contributors to the dynamic response during the normal operation of the turbine. In fatigue analysis, it is concluded that the structure meets all the requirements of DNV specifications. The research results provide a reference for the engineering application of the support structure of the new gravitational energy storage system in the ocean.

1. Introduction

Energy has always been a critical factor in human social development. In terms of new energy sources, such as offshore wind power, drawbacks like variability are causing increasingly significant challenges. Energy storage, one essential solution [1,2], has experienced rapid advancements in recent years. Today, various forms of energy storage technologies exist, including electrochemical energy storage, flywheel energy storage, and pumped storage, among others [3].
Due to the extensive deployment of variable renewable energy sources, power systems face the major challenge of an unstable energy supply. Power operators must balance fluctuating energy demand with volatile energy supply in a timely manner. One technical option to address this problem is the use of energy storage systems. We compared the performance of gravitational energy storage (GES) with other energy storage systems in large-scale applications (such as pumped storage systems (PHESs), sodium–sulfur batteries (NAS), and lithium-ion batteries). The results show that gravitational energy storage systems (GESs) perform well on multiple performance indicators, including the project internal rate of return (IRR) and net present value (NPV) [4] (as shown in Table 1).
The adaptation of new energy storage systems to meet the evolving requirements of the modern era involves numerous factors and significant technical challenges, which present considerable obstacles to such research. Given these facts, both Chinese and foreign scholars have proposed a new gravitational energy storage device [5,6]. Characterized by a simple energy storage principle, this mechanical energy storage device is not easily affected by other factors. Immediately after it was proposed, it attracted wide attention. However, it also has several issues, such as the occupation of valuable land resources, and unsatisfactory integration with land-based wind power systems. To address these concerns, a mechanical energy storage technology (the same type as pumped energy storage) is introduced into the ocean. Compared to traditional pumped energy storage, it is more flexible with a higher energy density, without being restricted by climatic conditions or geographical location. Designed to adapt to the ocean, it integrates with the offshore engineering structure to assist the efficiency of offshore renewable energy power generation systems, thereby improving the dispatching capacity and reducing the requirements of the transmission infrastructure. Its power density and discharge time are suitable for distributed power generation. Moreover, the system is suitable for correcting continuous and sudden frequency and voltage changes in the grid [7]. Therefore, a new technology scheme for offshore gravitational energy storage is proposed in this paper. The support structure of the system is analyzed with SACS to verify its structural feasibility of the gravitational energy storage and offshore wind power integration scheme, which provides ideas for further research on it. The scheme is an integrated system based on the foundation of the wind turbine tower, with an integrated structure of “wind power + energy storage”. According to the basic principle of this system, since the energy storage capacity is mainly determined by height and weight, the distance from the seabed to the sea surface provides a natural height difference. Furthermore, the construction of the device at sea will not occupy valuable land resources. Instead, it makes full use of offshore resources and combines well with offshore wind power installations, which makes the application of this technology in the ocean possible.
At present, the research on on-land gravitational energy storage systems is relatively mature. Although researchers have carried out a lot of research on the structure of offshore platform jackets, the research on this system is still being explored. In terms of basic research on the jacket, the jacket foundation is one of the basic forms of offshore wind power projects. It is connected to steel pipe piles using high-strength grouting material, and is anchored to the seabed [8]. In the Zhuhai Guishan offshore wind power demonstration project [9], a four-pile inserted leg jacket was implemented for the first time in China in 2016, where the average water depth in the site area ranged from 7 to 11 m. This marked the first offshore wind power project in China to utilize a four-pile jacket infrastructure in a true sense. Lavassani S. H. H. [10] simplified the jacket platform structure into a multi-degree-of-freedom system. Numerical analysis indicates that viscoelastic dampers, viscous dampers, and friction dampers can all be employed to provide additional damping forces while altering the structural cycle, effectively reducing the response of the jacket platform structure to wave action. Othman et al. [11] predicted the behavior of a four-legged jacket platform by assessing its ultimate strength. Finally, the results of this research show that the response of the offshore jacket platform is very important for its safe design and operation. Sui H et al. [12] studied the structural dynamics of a 10 MW jacket offshore wind turbine under the combined action of sea ice and wind loads, but the wave loads were not analyzed.
The above-mentioned research results are mainly independent research works on gravitational energy storage systems and offshore jacket platforms. At present, there are very few related studies on this system, let alone studies on its structural stability. SACS (Structural Analysis Computer System CONNECT Edition 2023) is a powerful structural analysis and design software widely used in various fields, including offshore engineering, civil engineering, and building engineering. The software is primarily utilized to analyze the static and dynamic responses of complex structures, making it particularly suitable for the design and evaluation of offshore platforms, wind energy facilities, and other marine structures. In this paper, SACS is used to study this system from four aspects: static analysis, modal analysis, dynamic response analysis, and fatigue analysis, which provides ideas and methods for the stability research of this system. However, due to space limitations, this paper only analyzes the dynamic response from the perspective of wave factors. There is no comprehensive analysis of other factors such as wind and weight position. If the system is to be fully analyzed, it is necessary to add wind conditions to superimpose wind and wave fatigue damage and comprehensively analyze the impact of weights on the stability of the system structure under different motion states. This paper presents a preliminary design of the energy storage system and then verifies its structural rationality and provides a research idea for the structural stability study of this system.

2. Materials and Methods

2.1. Basic Principles of Gravitational Energy Storage

The new gravitational energy storage system primarily consists of three stages: energy storage, storage, and energy release [13]. In the energy storage stage, excess electrical energy is supplied to the energy storage system. Under the management of the control system, the motor operates in an electric state, driving the lifting transmission mechanism. The reel begins to wind the wire rope, elevating the energy storage medium to the designated height, thereby converting electrical energy into mechanical energy and subsequently into gravitational potential energy. In the storage stage, the braking device on the control transmission mechanism and the energy storage medium is fixed at the design height, waiting for a signal to release the heavy object. In the energy release stage, the braking device is released, and the motor is changed to a power generation state. The energy storage medium drops under its own gravity, and the motor is driven by the lifting machinery to generate electricity. At this time, the generator also undergoes adjustment and transformation under the grid connection control system, and is finally connected to the power grid, whereby the conversion of potential gravitational energy–mechanical energy–electrical energy is completed [14]. The basic principles of the energy storage system and the energy conversion relationship are shown in Figure 1.

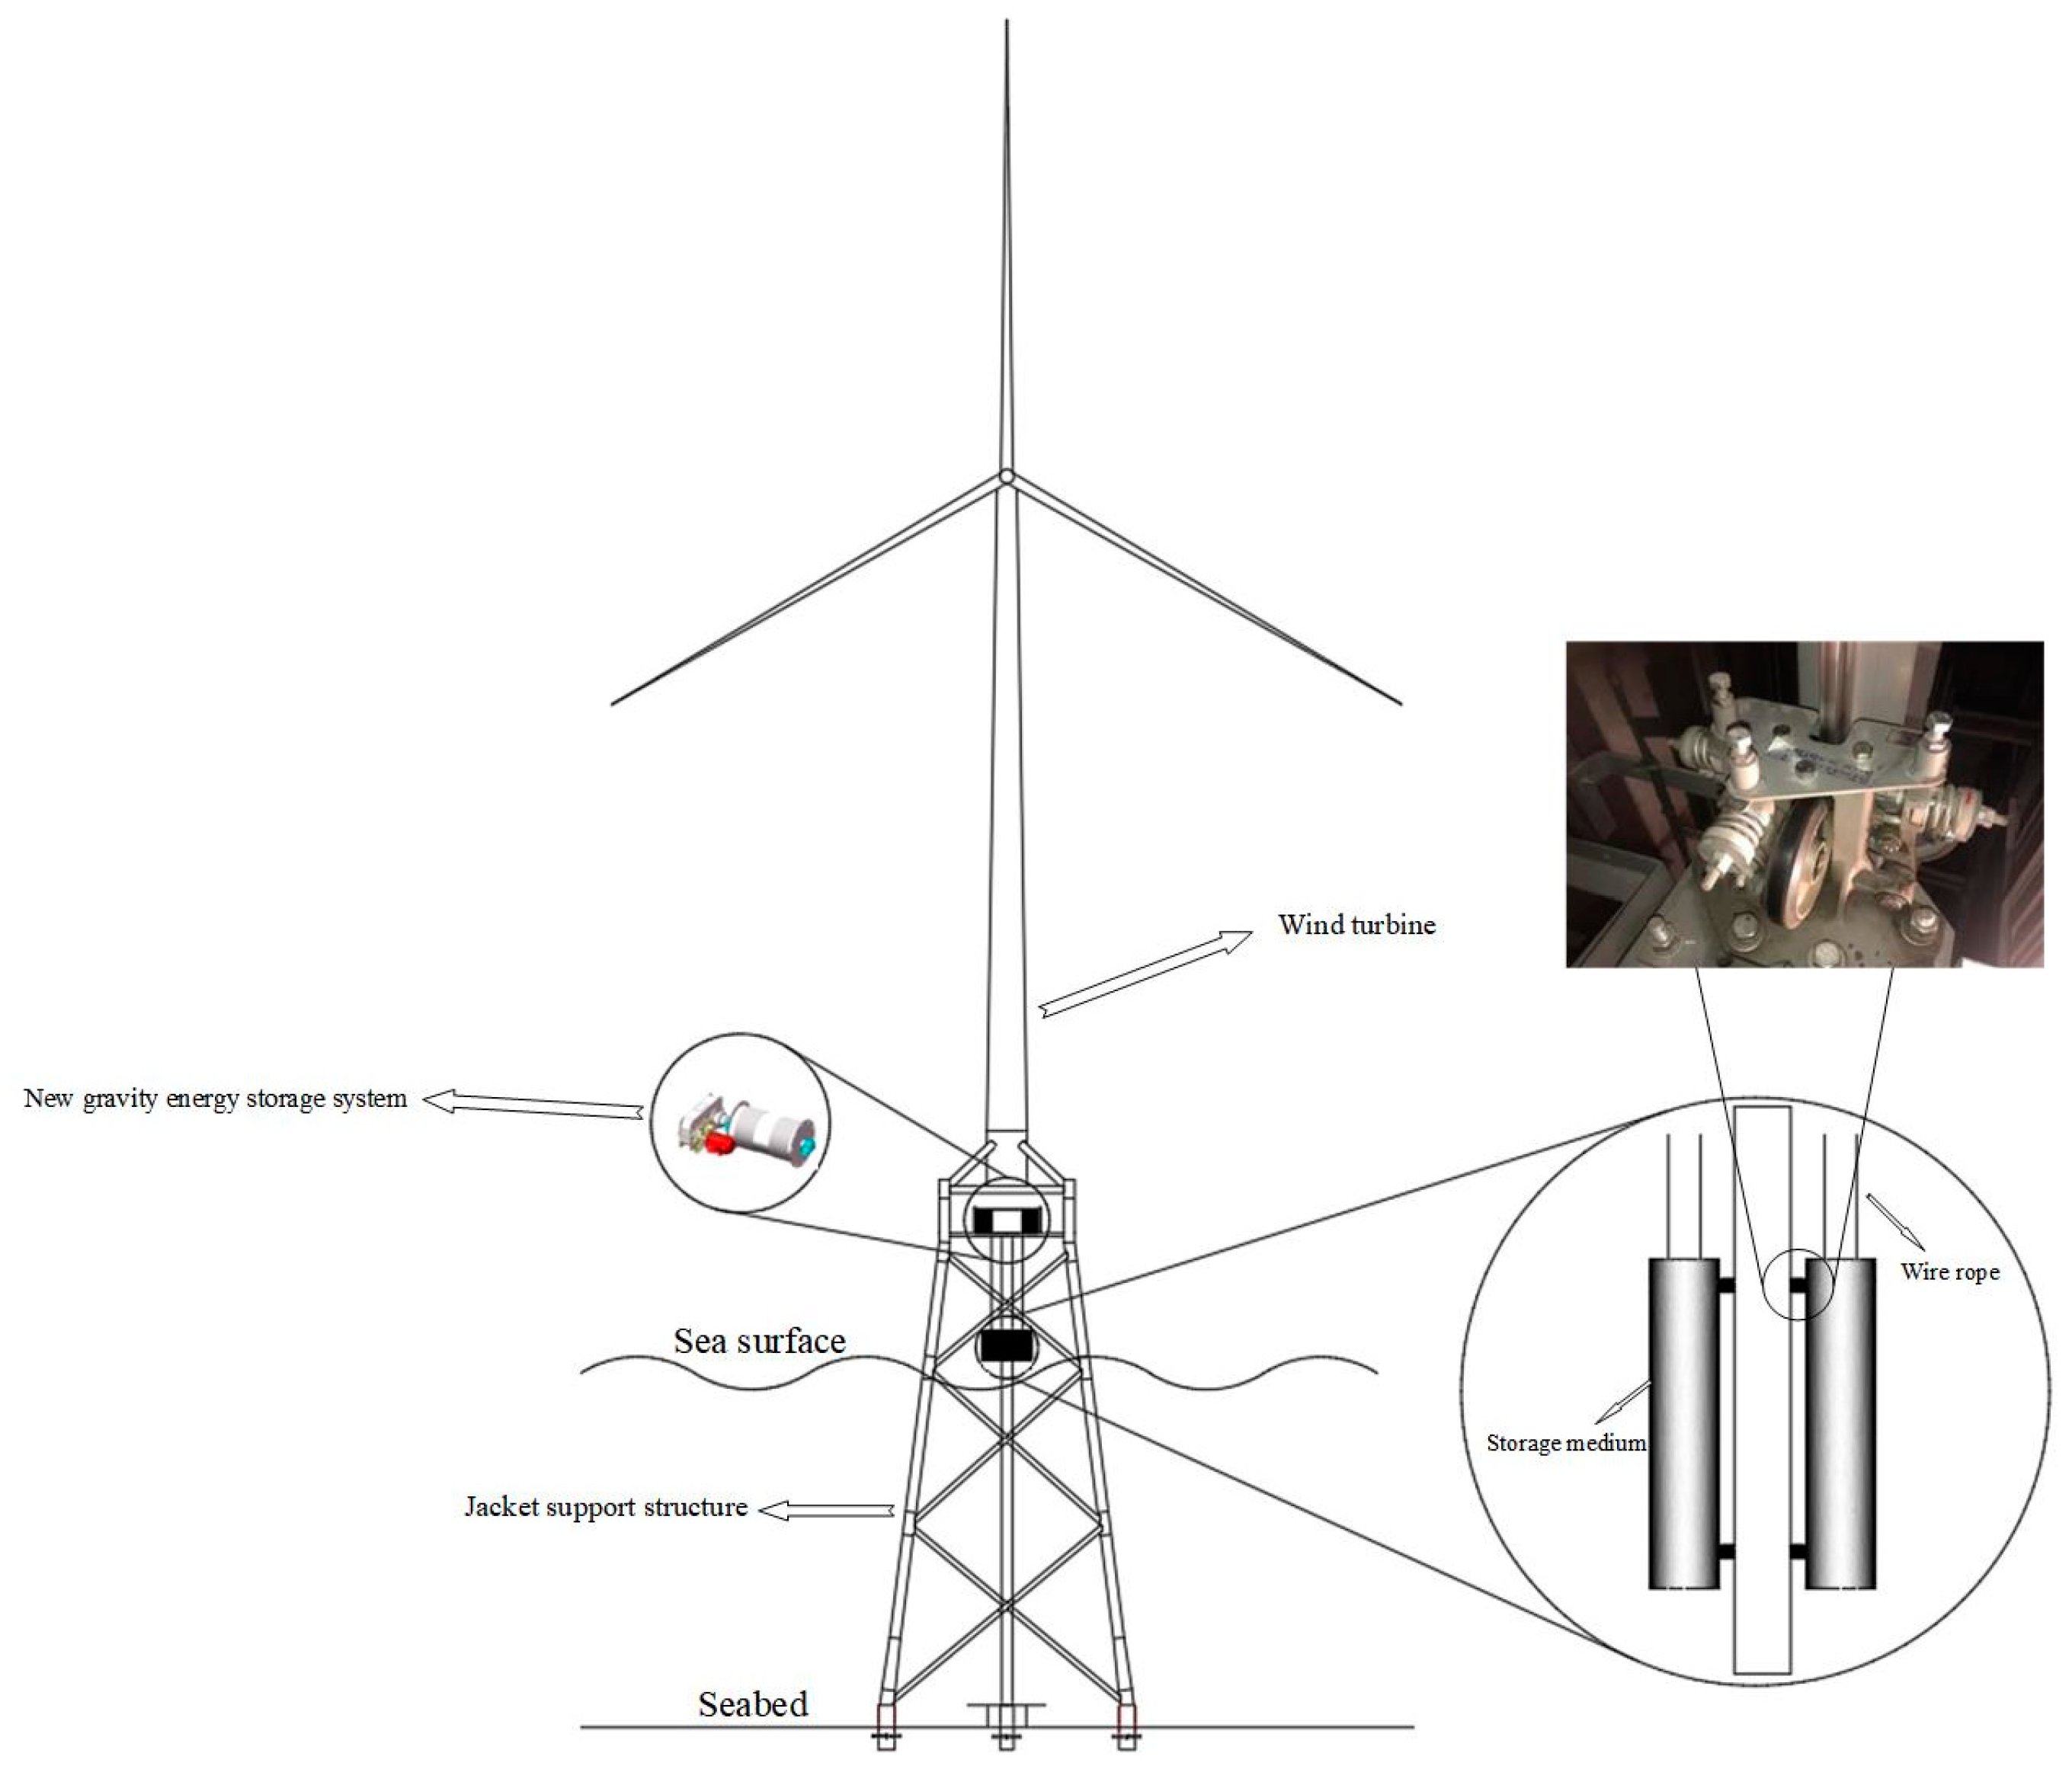
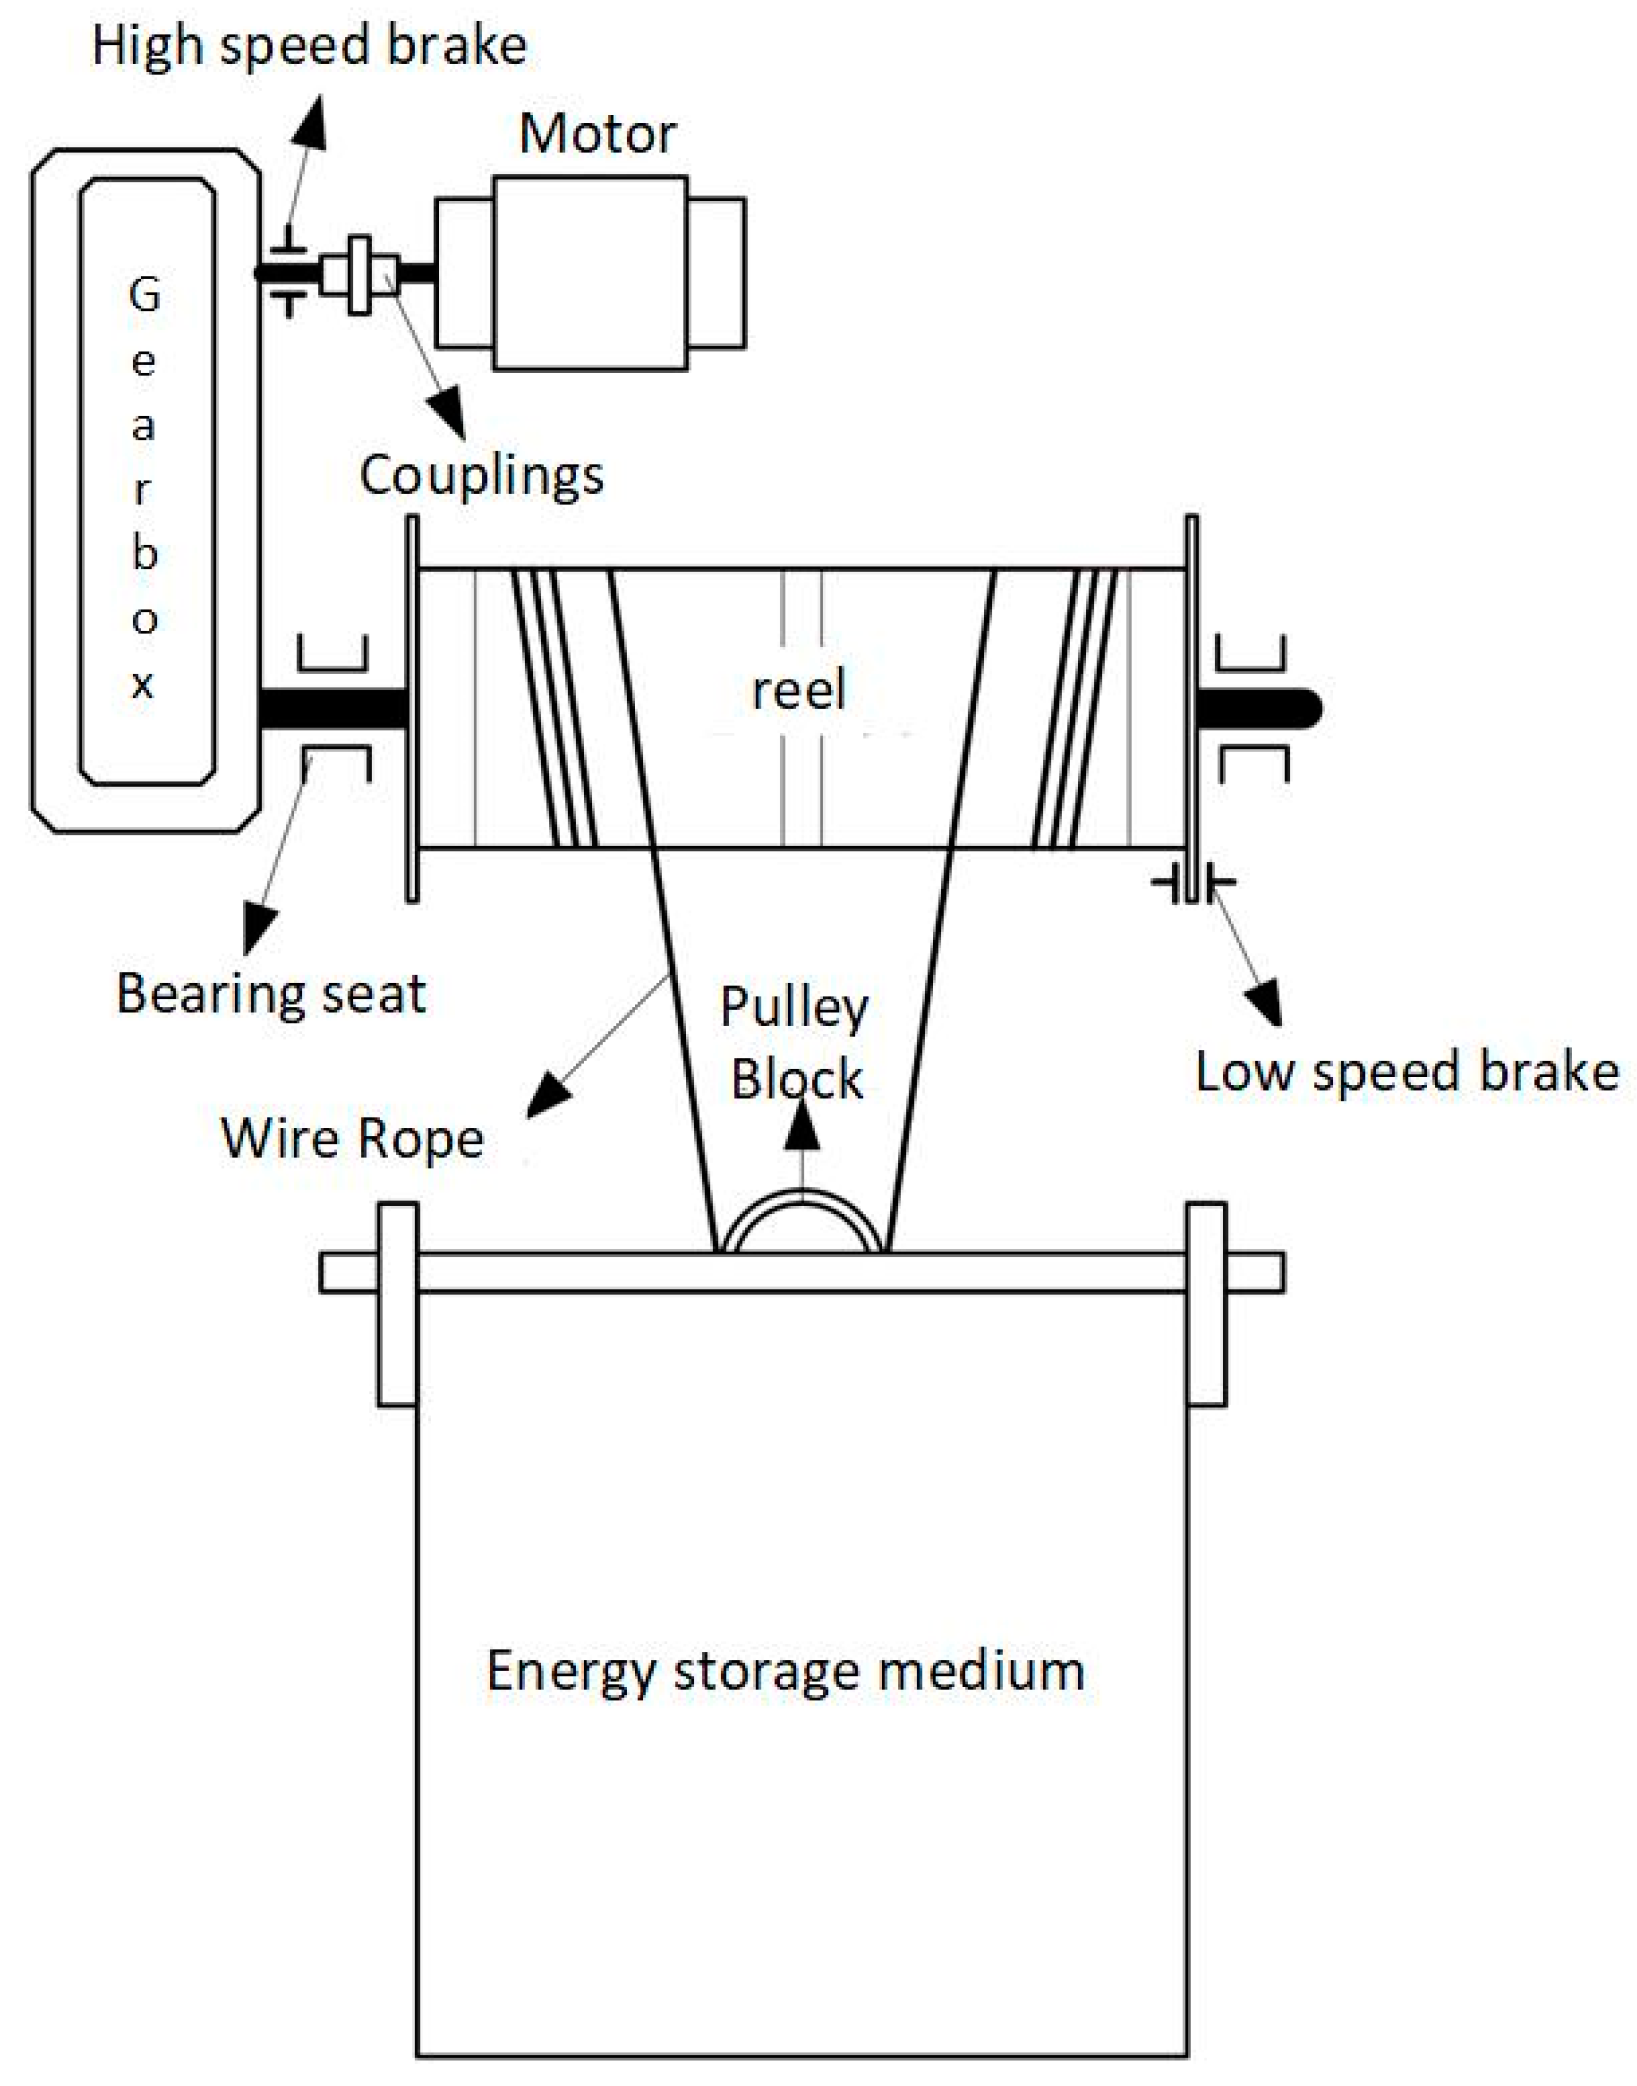
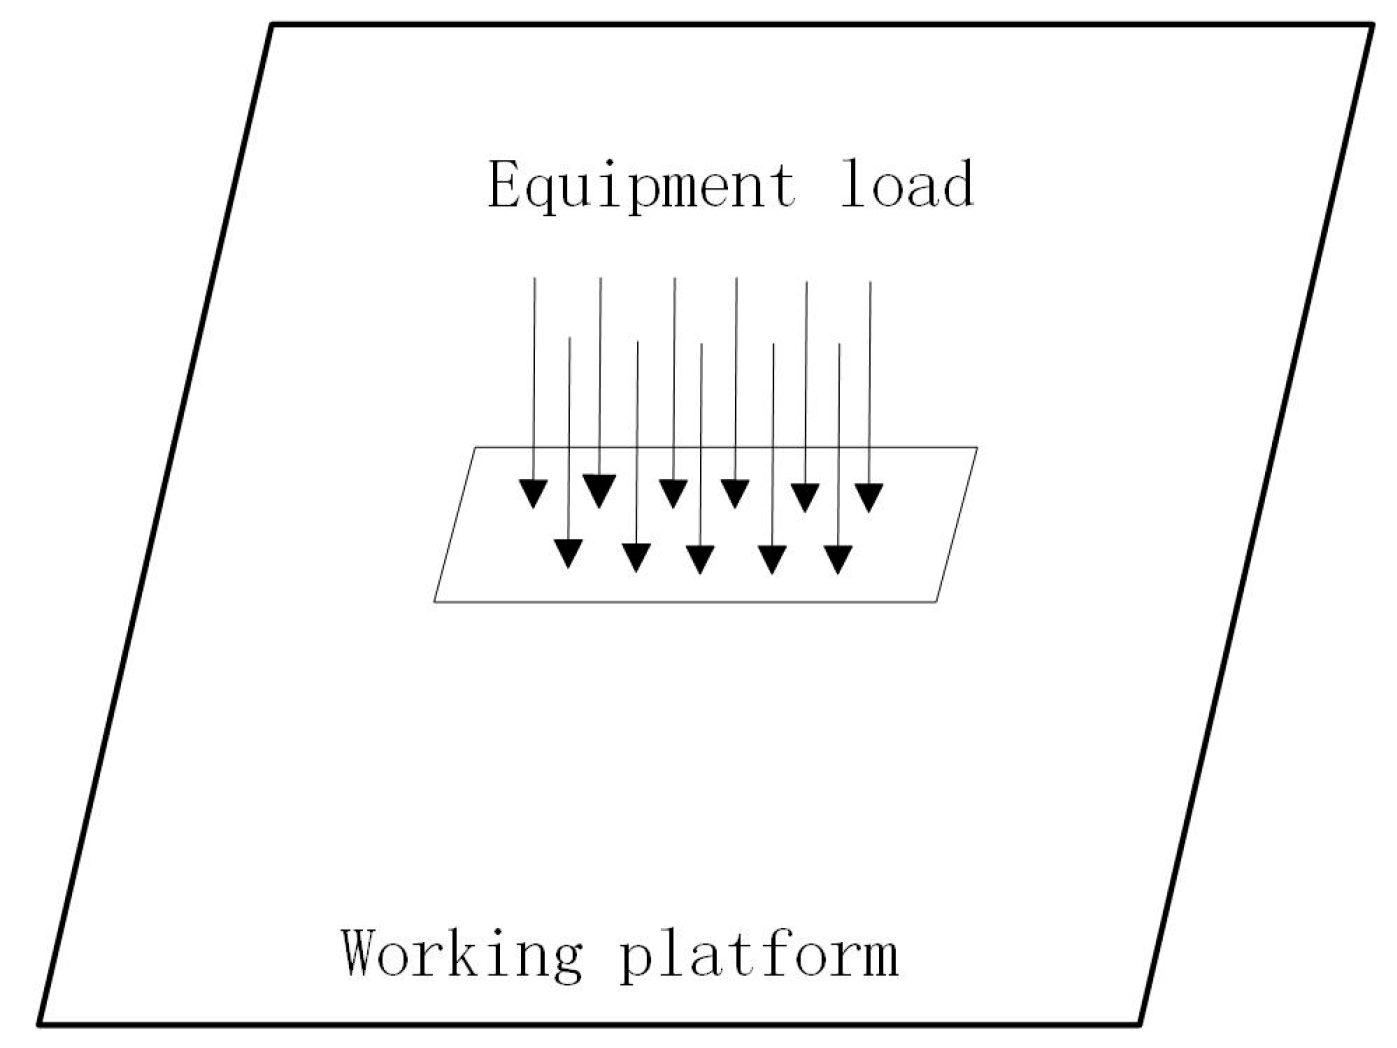
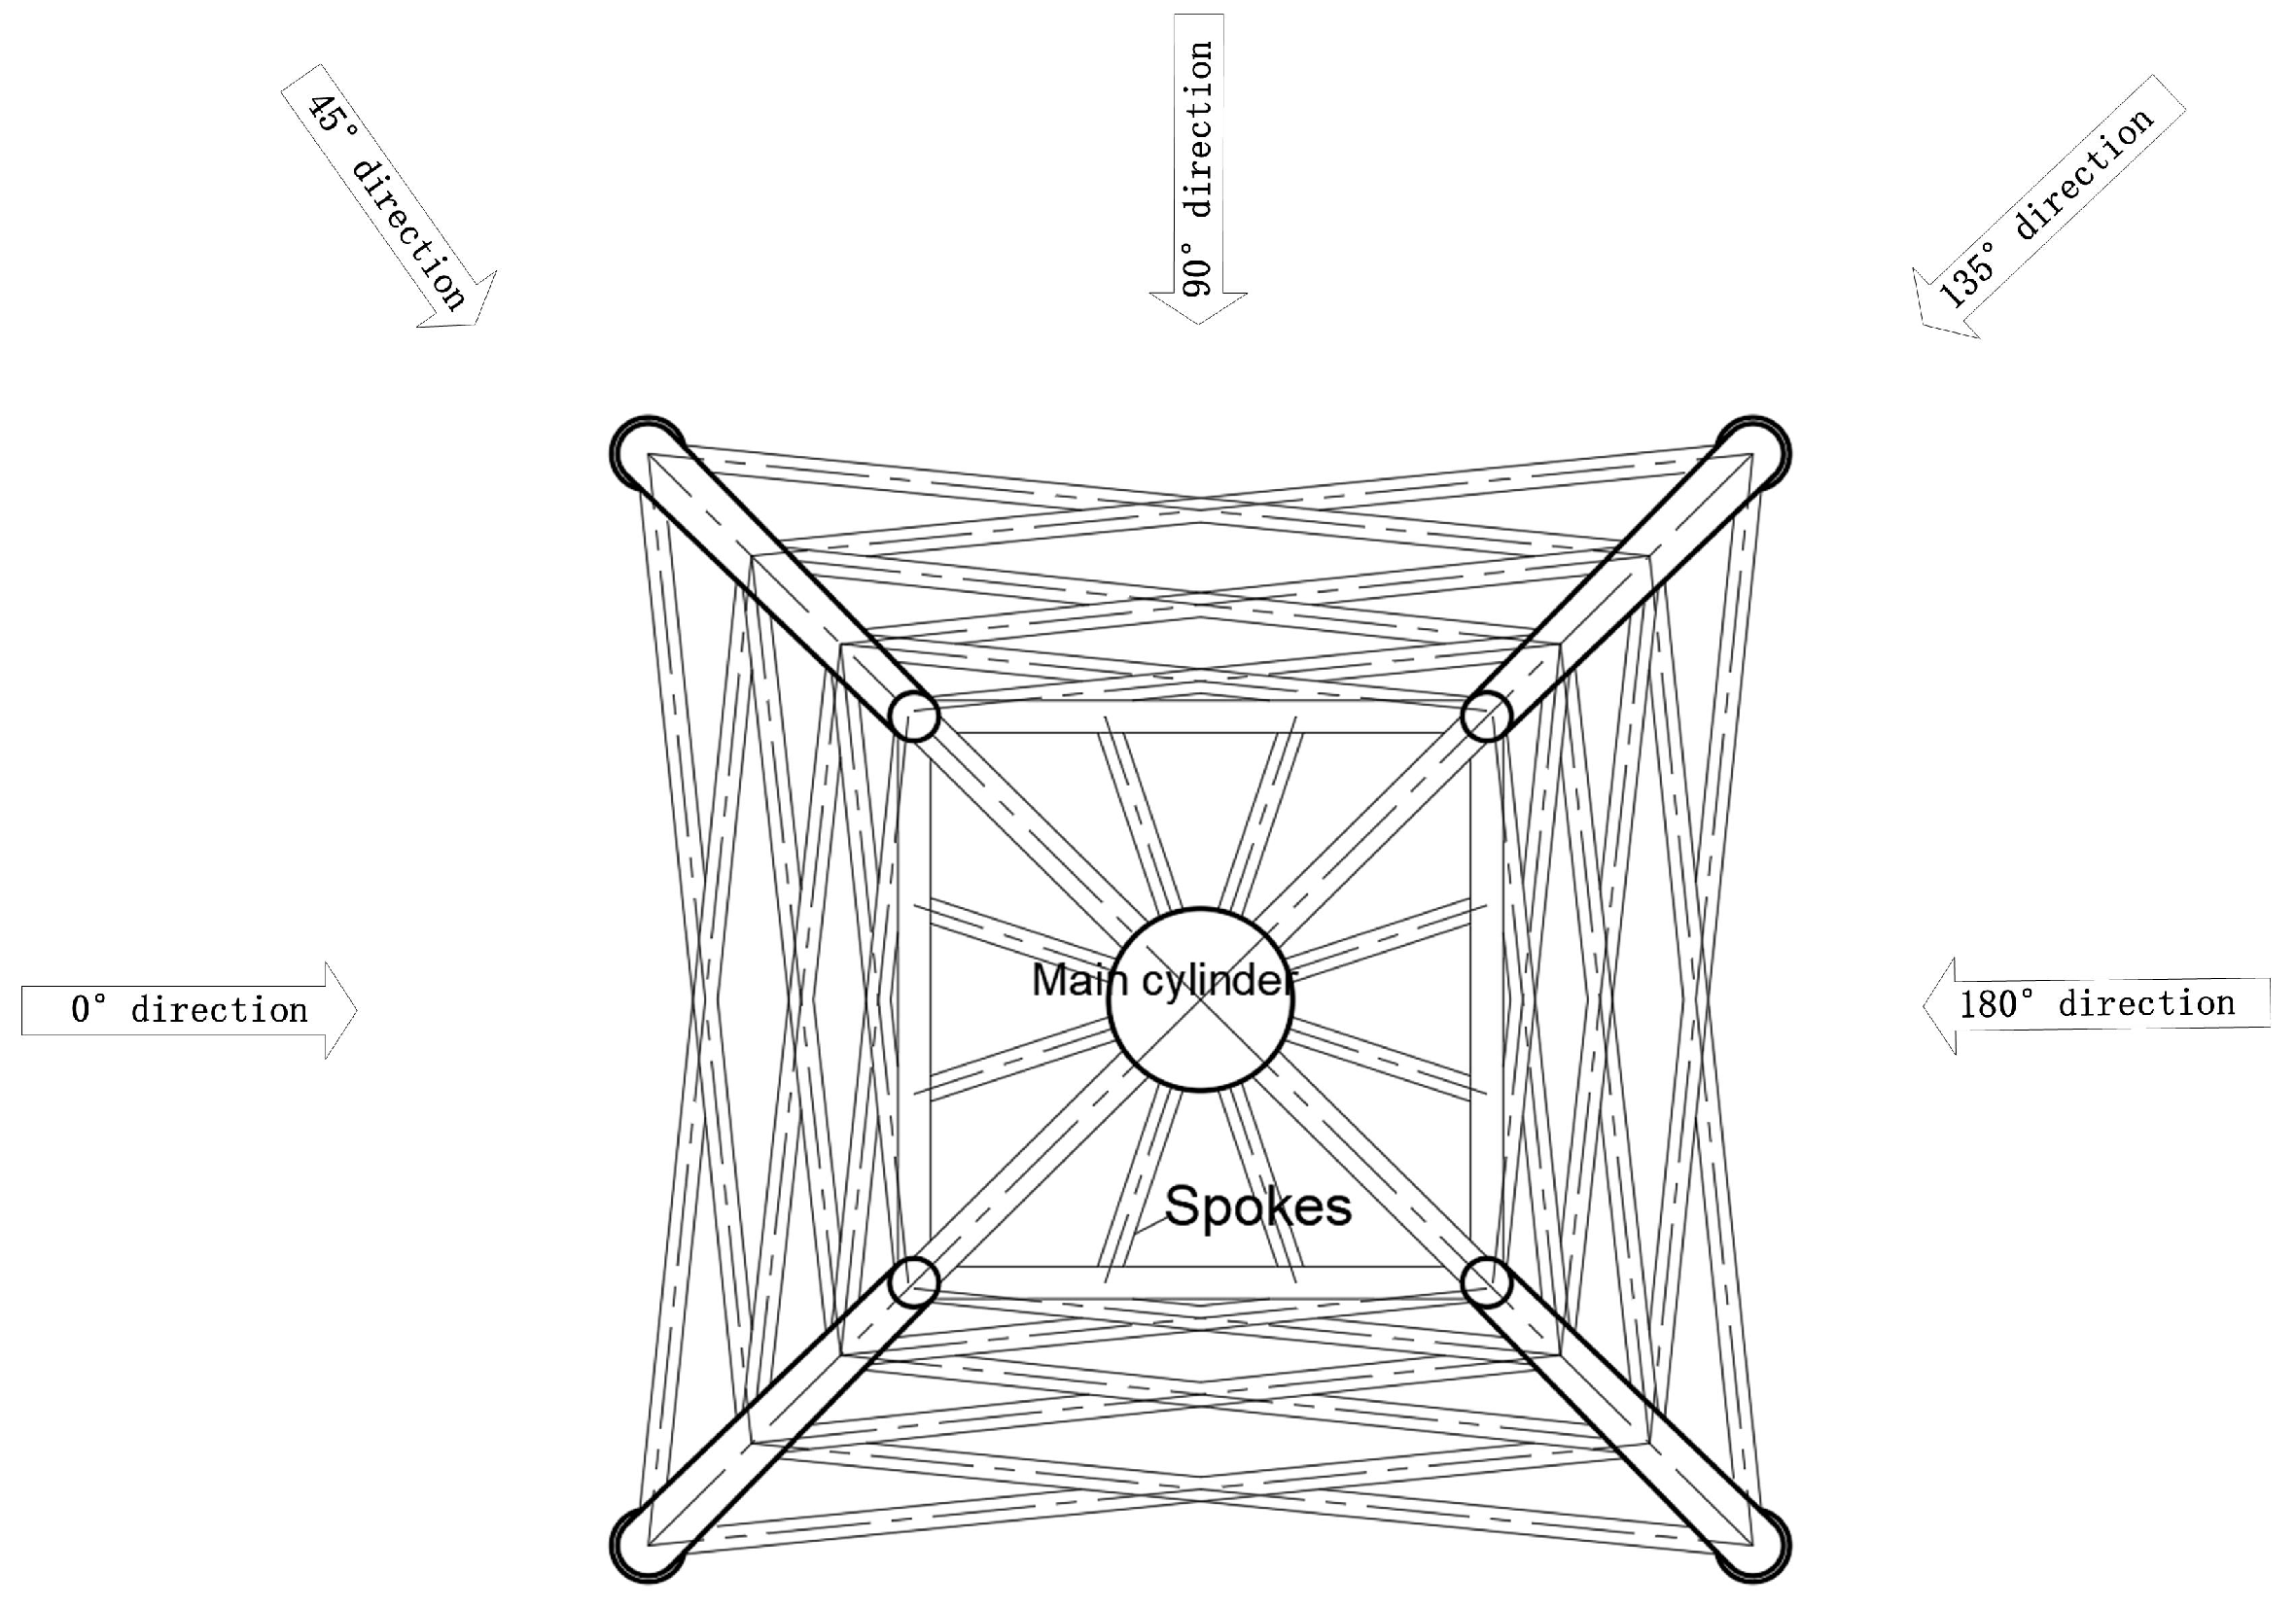
2.2. Design of a New Marine Gravitational Energy Storage System

In the overall design plan, the main structure of the new marine gravitational energy storage system is composed of a gravitational energy storage system and an offshore support structure. The concept of the design plan is shown in Figure 2 [15,16]. To achieve effective integration of the two, a working platform was set up at a certain height above the sea surface of the jacket foundation for placing the lifting transmission mechanism of the energy storage system and power equipment [17]. The working platform consists of steel beams that are connected to the main legs of the jacket. The structural load of the energy storage system is transmitted to the jacket’s support structure through the platform. A guide rail column is positioned in the center of the jacket foundation and is connected to the steel beam of the working platform. This column primarily serves as a fixed guiding structure for the vertical movement of the energy storage medium, preventing its movement in the water from being influenced by ocean currents and enhancing the operational stability of the energy storage system to some extent. Additionally, it functions as part of the structure that bears the load. A platform has been established on the seabed for the placement of the energy storage medium, mitigating the impact on the energy storage structure caused by the uneven terrain of the seabed [18]. The energy storage medium moves up and down on the guide rail column through the roller guide shoes. The roller guide shoe is composed of a roller, a spring, and a shoe seat rocker arm. Since the roller guide shoe adopts rolling contact, the friction resistance between the guide shoe and the guide rail can be reduced, thereby reducing vibration.
The new gravitational energy storage system primarily consists of an energy storage medium (at the top of the intermediate rail column pile), a lifting transmission mechanism, a motor, and a control unit. The total weight of the energy storage system is approximately 100 tons, with the energy storage medium comprising the majority of this weight at around 80 tons (it can generate about 15 kwh of energy). This figure is based on the “Building Structure Load Code” established by the Ministry of Housing and Urban–Rural Development of the People’s Republic of China. The selected energy storage medium material is concrete because it is a kind of composite material whose raw materials are easy to obtain and low in price; the material itself has good durability, strong plasticity, and high compressive strength; its density and strength grades are proportional to its characteristics; and other characteristics can also be modified according to the application environment, enhancing environmental adaptability. Additionally, the reuse of construction waste concrete not only repurposes building waste concrete, reducing the cost of the system, but also plays a positive role in the environment. The lifting transmission mechanism is primarily utilized for lifting the energy storage medium, which is similar to crane lifting and mine elevator mechanisms, mainly composed of wire rope, pulley groups, a drum, couplings, a gear box, and a brake. As the core principle of energy conversion, the motor needs to meet the requirement of reversibility. This paper adopts an integrated reversible motor to reduce the complexity of the system structure, so as to ensure safety and reliability during operation, control over system operation, and match the power grid’s requirements. The schematic diagram of the basic structural composition of the new gravitational energy storage system is presented in Figure 3.

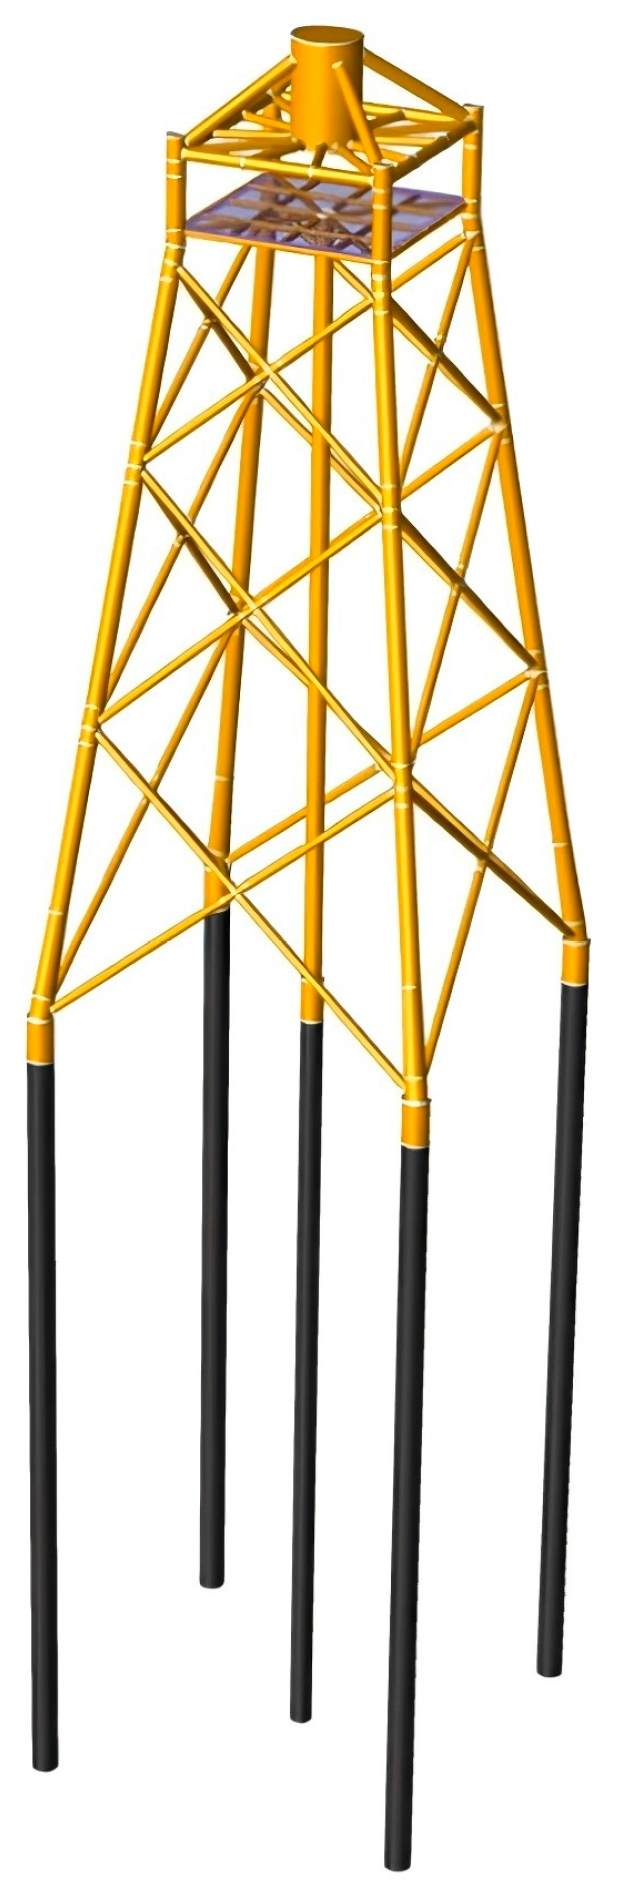
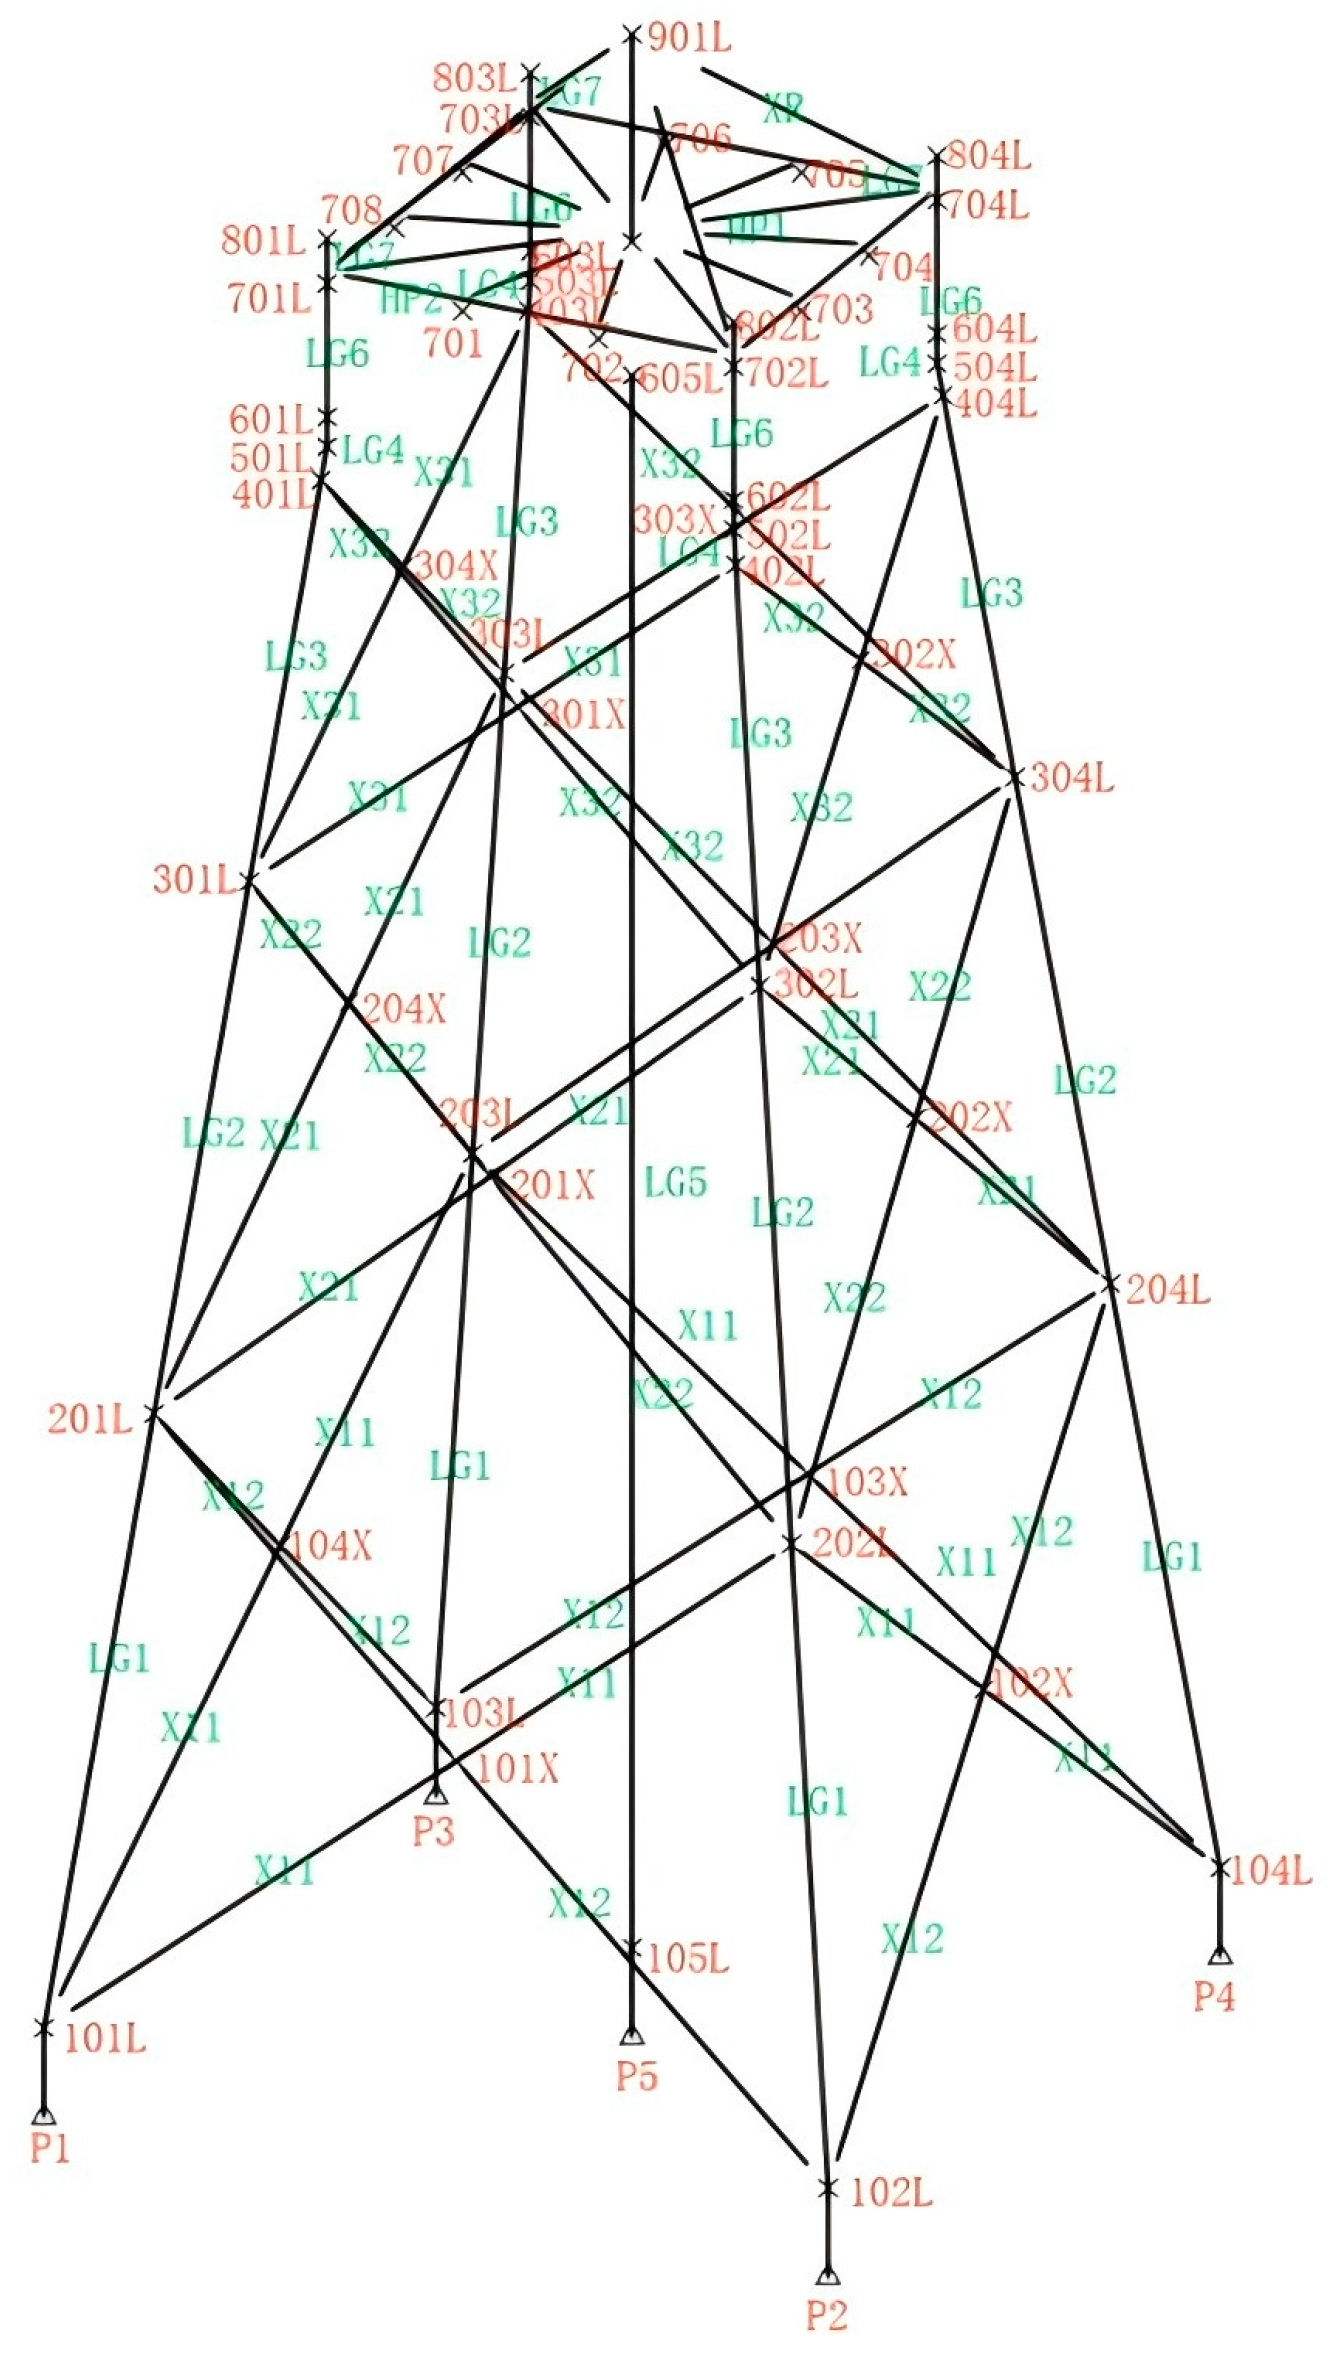
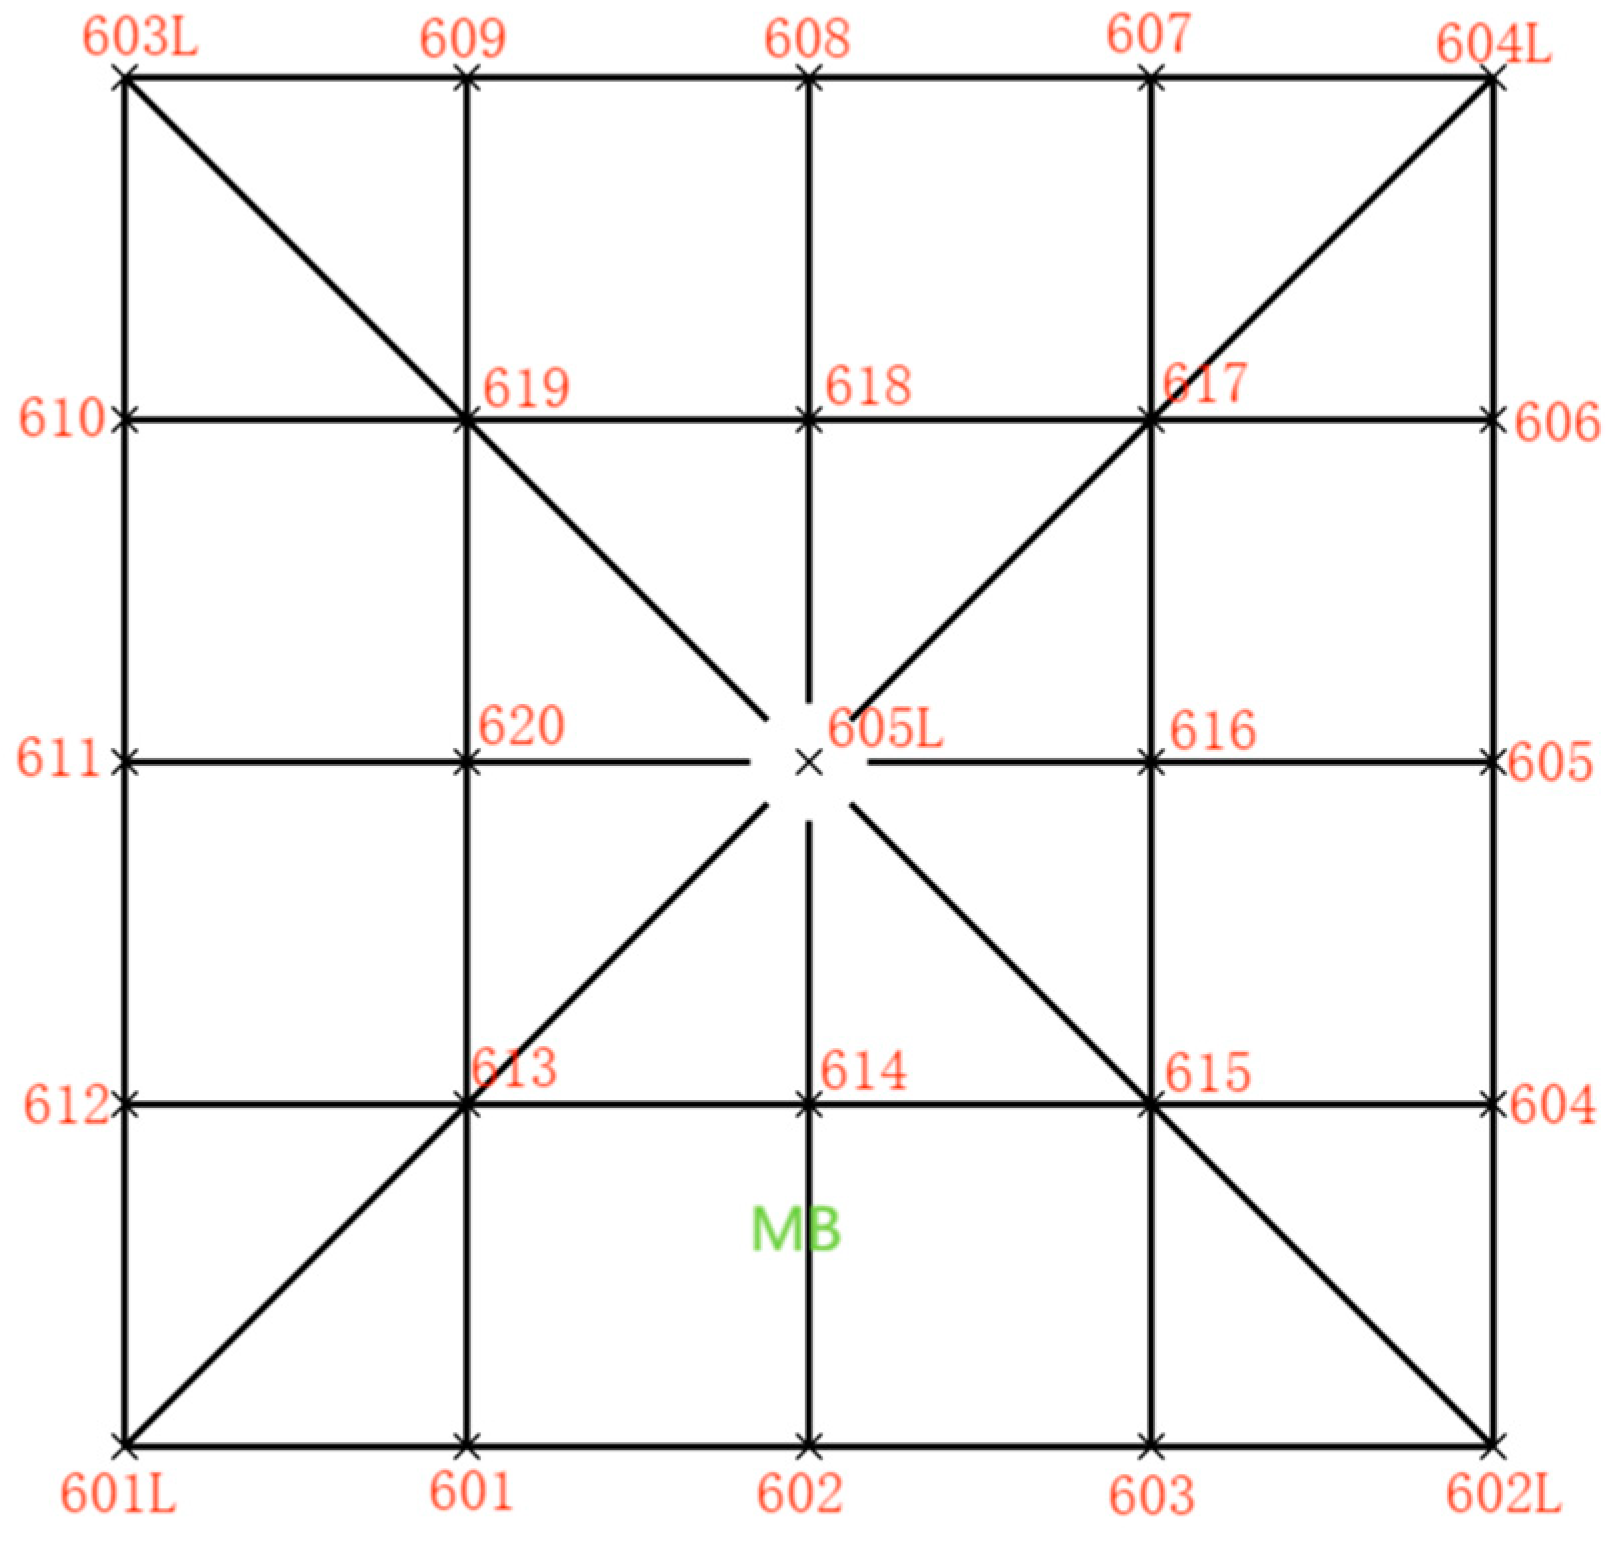
2.3. Design and Establishment of the Model

In this paper, the target sea area was the sea area of Jiangsu, in the southern Yellow Sea. The seabed terrain is gently sloped with an elevation of −38.5 m~−40.3 m, and the natural mud surface elevation is −39.5 mm. The gravitational energy storage support structure mainly includes three parts: a transition section, the foundation, and the base. The specific design is shown in Figure 4. The foundation section consists of three layers of X-bracing and five conductor pipes, with the outer four being the main conductors, arranged in a biclinic symmetry with an inclination ratio of 1:8. In the middle of the support structure, there is a structural conductor string for the energy storage system, which is connected to the working platform as part of the overall support structure. The main conductor strings at the top of the foundation were 14 m apart, and the working platform was located at a height of 13.5 m above the elevation datum. The base part was composed of 5 steel piles. In order to ensure the stability of the conductor strings, they were fixed on the seabed through a pile foundation. The top of the pile was 3 m above the natural mud surface; the depth of the pile foundation was 55 m; the diameter of the four main peripheral piles was 1.8 m; the wall thickness was 35 mm; the diameter of the intermediate rail column pile was 1.5 m; and the wall thickness was 35 mm. According to the structural characteristics, the pile-first method was employed in the base construction. Therefore, the grouting connection will be used between the foundation and the base. The structural material was Q345 steel, which was rust-proofed through coating and pole protection treatments. For information on the finite element model established with SACS, please refer to the basic numerical calculation model of the conductor frame in Figure 5, the member bars in the main part of the support structure and the node numbers in Figure 6, and the member bars of the support structure working platform and node numbers in Figure 7.

2.4. Environmental Parameters

2.4.1. Soil Parameters

The target sea area was in the sea area of Jiangsu, in the southern Yellow Sea. The seabed terrain is gently sloped with an elevation of −38.5~−40.3 m, and the natural mud surface elevation is −39.5 mm. According to the survey, there are a total of eight layers. Layers ①~③ are mucky clay, silt, and clay of new Quaternary (Q4) littoral and transitional facies, and layers ④~⑧ are deposits of late Pleistocene (Q3) land and littoral facies. The specific soil layer distribution and their physical and mechanical parameters are shown in Table 2.

2.4.2. Marine Environmental Parameters

The environmental elements should be designed based on the environmental conditions of the sea area in which the project is located, as well as the relevant specifications and standards. Since the sea area is the southern Yellow Sea, there is no freezing all year round. Therefore, the influence of sea ice is not considered. In this paper, the main design environment elements included the designed water level, the designed wave elements, the designed ocean current elements, and the designed wind elements. The environmental elements at different water levels in the sea area are shown in Table 3.

2.4.3. Parameters of Upper Wind Turbine

(1)
Basic Parameters of Wind Turbine
The upper wind turbine is a reference XX5.0-110 wind turbine. Its shape is characterized by a traditional three-blade horizontal axis, and the design service life is 20 years. The main parameters are shown in Table 4.
(2)
Parameters of wind turbine tower
With a length of 77.8 m, the tower was composed of three sections. The bottom and top diameters of the tower were 4.5 m and 3.07 m, respectively, and the total mass of the tower and its accessories was 285 T. The specific parameters are shown in Table 5.
(3)
Peak load of wind turbine
The data of wind turbine load were provided by the manufacturer, and the load was applied at the bottom of the tower, that is, the top of the base flange. The load size is shown in Table 6.

3. Numerical Simulation Analysis

3.1. Static Analysis

3.1.1. Analysis Method

The structural static calibration will be carried out based on the limit state design method [19,20], covering the calibration of structural strength, stability, and pile foundation bearing capacity under extreme working conditions at the limit state of carrying capacity, as well as the calibration of structural deformation under normal operating conditions at the limit state of normal use. Here, the calibration of structural strength includes member bar strength, node strength, and structure; meanwhile, the calibration of bearing capacity is mainly based on pressure bearing and uplift resistance of the pile foundation.
In this paper, the static and dynamic characteristics of new offshore support structure will be calibrated using SACS software developed by Bently Company (Crewe, UK) [21,22]. First, according to the parameters of the structural design, the finite element modeling of the support structure was completed using tube units in SACS, and the corresponding member bars and node numbers are shown in Figure 6. The upper wind turbine, including the tower, is excluded in structural modeling. The load generated by it acts on the top of the main cylinder in the form of point load, and the load size is shown in Table 6. Second, based on the design data and the relevant content of the load combination, the load application and combination were completed. Finally, the pile–soil super-unit file was established according to the soil distribution of each layer, and the p-y curve, Q-z curve, and t-z curve were used to simulate the nonlinear pile–soil interaction of the pile foundation structure.
With the use of SACS, the stress of each member bar and node, and the bearing capacity of the pile foundation at all working conditions can be obtained. According to the API (American Petroleum Institute) specifications, the UC value (that is, the ratio of the applied stress/load to the allowable stress/load) of the member bars and the nodes can be obtained automatically with the software according to the cross-section type and force (tension, pressure, stretch bending, and compression bending) of the selected member of the structure. If the UC value is greater than 1, it indicates that it is unsafe; if the UC value is less than 1, it indicates that the requirements are met. The size of the UC value reflects the degree of safety of the structure. As to the calibration of the bearing capacity of the pile foundation, it is necessary to obtain the load of the pile foundation and its ultimate bearing capacity using the software, thereby calculating the bearing capacity ratio of the foundation in combination with the resistance coefficient of the pile foundation, as shown in Formula (1). If the calculated ratio is less than that calculated in Formula (1), the bearing capacity of the pile foundation is deemed to meet the requirements [23].
F = r × a l
where F is the bearing capacity ratio of pile foundation; r is the resistance coefficient of the pile foundation; a is the axial load of the pile under load; l is the axial bearing capacity limit of the pile.
The calibration of structural deformation includes pile foundation displacement at the mud surface and the inclination rate and angle at the flange surface [24]. For the lateral displacement at the mud surface of the pile foundation, the critical displacement was selected as the deformation control standard to prevent the failure of the pile foundation structure of the wind turbine with a single pile foundation, that is, the allowable lateral displacement was 20 mm. In the FD003-2007 specification [25], it is stated that the allowable sedimentation of the infrastructure and the inclination rate at the flange need to be determined according to the soil type and the height of the hub [26], as shown in Table 7. According to the parameters of the upper wind turbine and the structural design parameters, the height of the wind turbine hub was higher than 100 m. Therefore, the maximum amount of foundation settlement shall not be greater than 100 mm, and the allowable tilt rate at the rotor flange was 0.003. In addition, according to the recommendation in the DNVGL-ST-0126 specification, the maximum allowable angle of the pile head position is 0.5°.
In order to correctly calculate the wave force, the correct wave theory should be chosen first [27]. According to the different water depths and the designed wave elements, H / g T 2 and H w / g T 2 were calculated. From Table 8, the applicable wave theory can be determined. The specific parameters are shown in Table 8 below.
For the design at this stage, only the direct effect of the energy storage system structure on the support structure is considered, while the indirect effect of the external environment is ignored. Therefore, the structural load of the energy storage system is mainly the weight of the energy storage system equipment. According to the energy storage system given above, it mainly includes the motor, lifting transmission structure, and energy storage medium mass. During the design of the supporting structure, the mass of the system equipment is estimated to be 100 t. The SACS Footprint Weight module was integrated into the center of the support platform, and then converted into load by incorporating the acceleration due to gravity, as shown in Figure 8. Additionally, similar to lifting equipment, the new gravity system structure demonstrated significant dynamic properties and necessitates regular maintenance during operation. Therefore, the dynamic load of the structure of the energy storage system and the maintenance load of the equipment on the support platform should be considered. This part of the load was applied in the form of a uniform active load on the floor. The value was taken as 12 kN/m2 by reference to the size of the active load specifications for the floor of an industrial building as outlined in the Load Code for the Design of Building Structures.

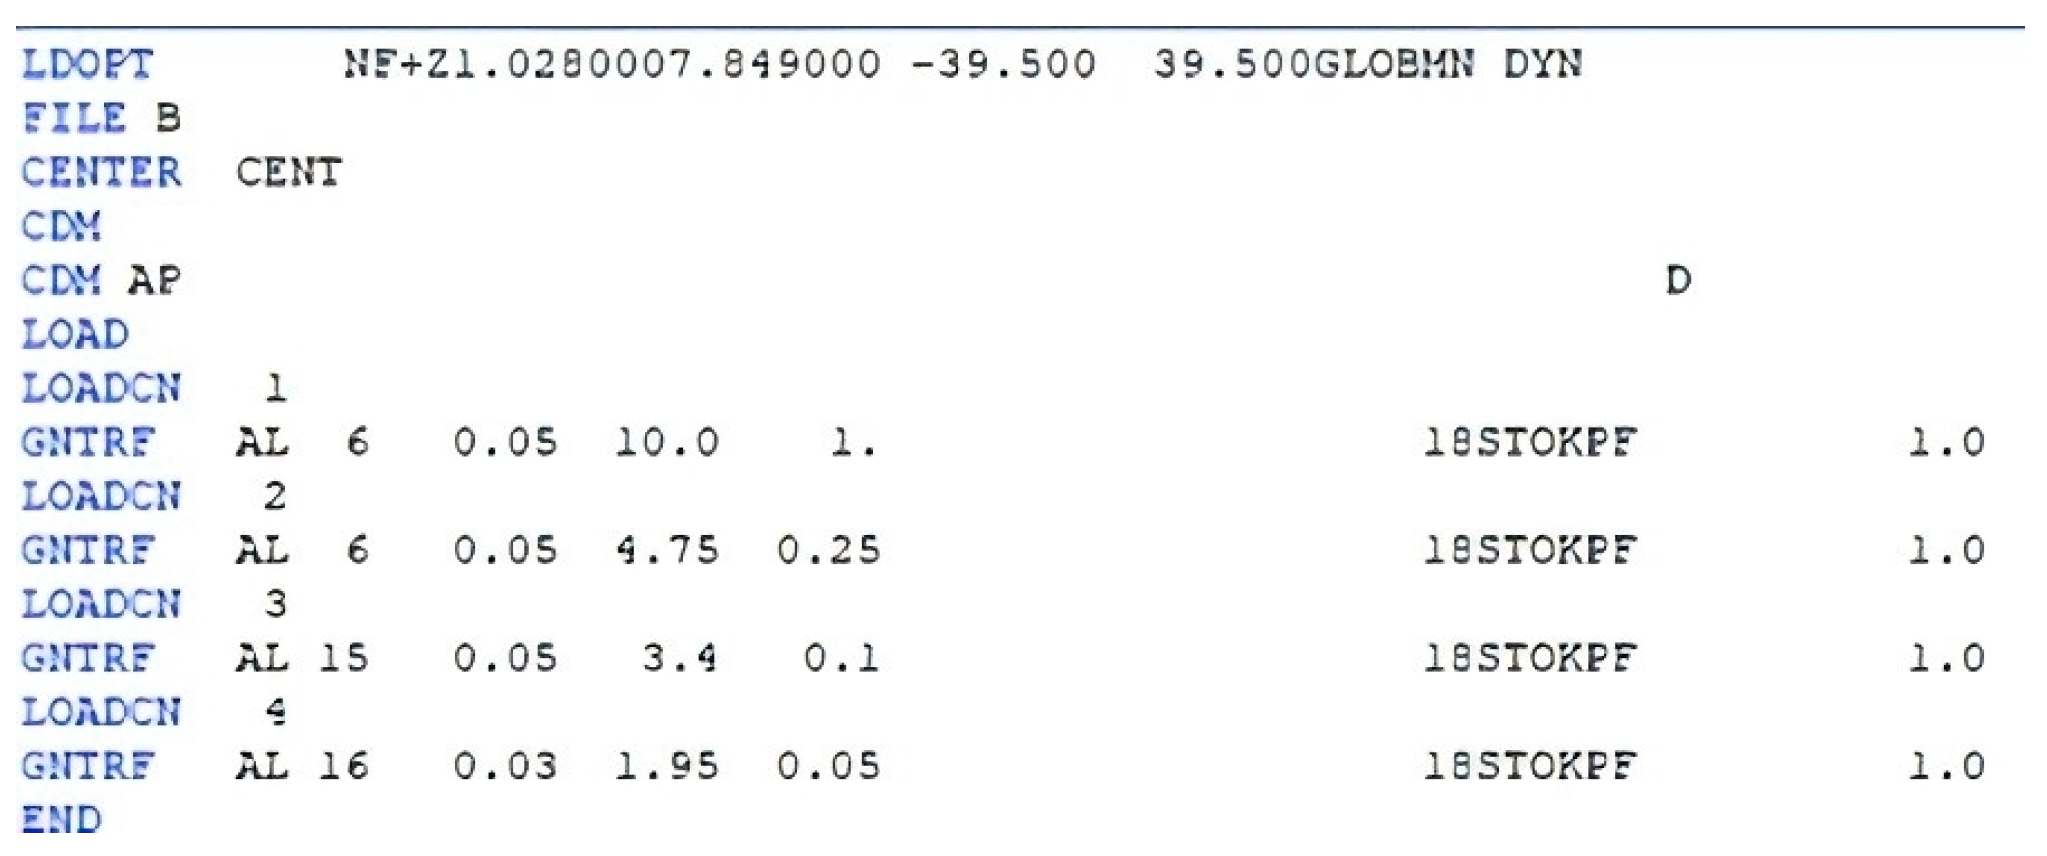
3.1.2. Load Conditions and Combinations

The proposed offshore support structure is designed to accommodate both extreme working conditions and normal operating conditions. Under extreme working conditions, the load combination consists of the extreme load from the wind turbine and other associated loads. In contrast, under normal operating conditions, the load combination is the standard load from the wind turbine and other related loads. In the SACS seastate module, the load conditions of the structure were specified in the seainp file. The load from the wind turbine at the upper part of the structure is a combination of force and torque in three directions, and different loads need to be established for various operating conditions. Additionally, considering the symmetry of the basic model of the wind turbine foundation on a jacket, environmental loads such as wind, waves, and currents were calculated and analyzed from five angles, namely, 0°, 45°, 90°, 135°, and 180°. Finally, the self-weight and environmental load, etc., were combined to produce the required calibration conditions. Figure 9 shows the directions of wind, wave, and flow loads. By reference to the DNV-OS-J101 specification [28], the load combination method for various design conditions was determined [29,30], as shown in Table 9. Additionally, the correlation coefficients for the load combinations under the corresponding operating conditions is shown in Table 10. For the itemized coefficients of fixed and variable load, it is 1.0 when unfavorable and 0.9 when favorable.

3.1.3. Static Analysis Results

  • Calibration of Structural Strength
As shown in Table 11 and Table 12, the calibration results of structural strength met the structural bearing requirements. From Table 11, it can be learned that the member bars with large UC values in the proposed structure were mainly those that connect the main conductor pipe and the main cylinder. Since the main conductor pipe is the main bearing structure of the jacket structure, all forces must be finally transmitted to the foundation through the main conductor pipe. The member bars connecting the main cylinder in the transition section mainly included oblique bracing and radial rods. At the upper part, the wind turbine load transmitted to the flange on the top of main cylinder was large. The oblique bracing and radial rods support the main cylinder most and are the first to be affected. At the same time, it shows that the structural form of the transition section herein is not better at transferring the upper wind turbine load to the lower part, and the structure needs to be optimized. In addition, it is easily found from the UC value of the x-shaped oblique support and the main conductor pipe that the UC value of the bottom member bars of the foundation part is often greater than that on the top, and most of the force is concentrated at the bottom. According to the table below, most of the combined operating conditions corresponding to the maximum UC values of either the rods or nodes are at extremely low water levels with wave loads as the main control loads during the 50-year recurrence period. The reason is that a low water level exposes more parts of the structure to air, resulting in increased load. Additionally, the direction of the larger environmental load significantly influences the structural forces.
2.
Calibration of bearing capacity of pile foundation
As shown in Table 13 and Table 14, the calibration results of the bearing capacity of the pile foundation met the requirements. From the table below, it can be seen that the pile foundation of the support structure in this project was mainly subject to compression. The pile foundations corresponding to the pile heads P1, P3, and P5 were not affected by the tensile load under the set conditions, and the pile foundations of P1 and P3 were under the greatest compression load. At the same time, the maximum load of the pile foundation is mainly subject to the combined working conditions of control load dominated by wave load at the extremely low water level.
3.
Calibration of structural deformation
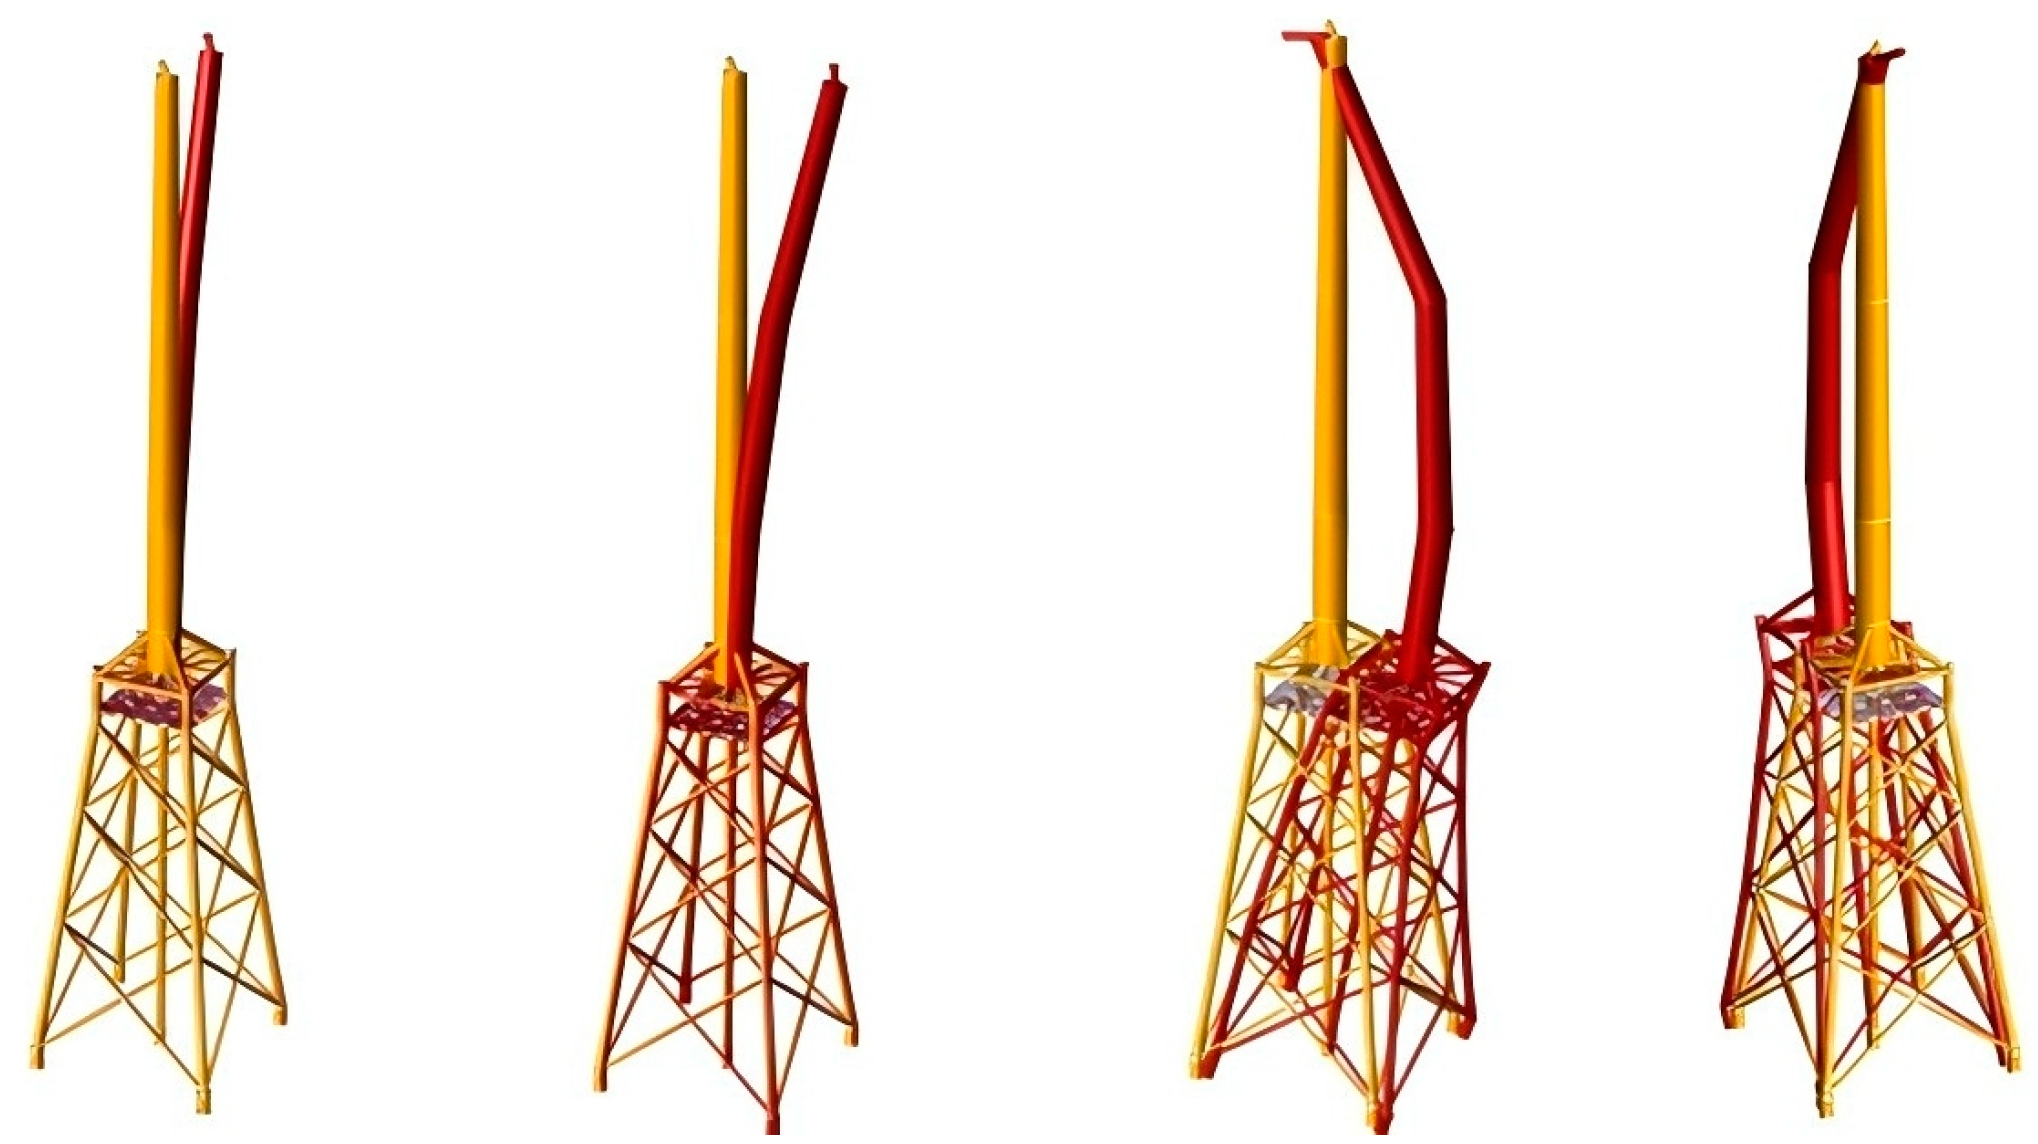
As shown in Table 15, the calibration results of pile foundation deformation at the mud surface under normal operating conditions can meet the requirements on normal operating control indicators. At the same time, after static analysis, the maximum angle at the wind turbine flange was 0.002, which was less than the maximum allowable value of 0.003 in the specification, which meets the requirements.

3.2. Modal Analysis

Modal analysis is used to determine the vibration characteristics of a structure, being the basis of all structural dynamic analysis. The principle is to the number of degrees of freedom of the structure, which is influenced by its stiffness and mass distribution. In modal analysis, the first step is to obtain the modal mass and modal shape in the Dynpac module of SACS. In modal analysis, as the influence of pile–soil coupling should be considered, it is necessary to establish a pile–soil super-unit file in the Static Analysis with Pile module in SACS to linearize the pile foundation, thereby establishing the boundary constraints of the support structure foundation [31].
The second step is to conduct the modal analysis of the overall energy storage system and use the DYMOD module in SACS to establish a foundation + support structure + heavy object + wind turbine structure system. The equipment room, wind turbine, and other equipment in the wind turbine are added to the corresponding mass point, and the flexibility of the wind turbine structure and rotor is included in the modal analysis. Finally, the subsequent dynamic time-domain simulations the modal analysis are carried out to obtain the self-vibration characteristics of the supporting structure foundation, as shown in Table 16 and Figure 10.
Under normal circumstances, offshore wind turbines have three blades. Because the average wind speed is different from the upper and lower parts of blades, the structure undergoes a stimulated response three times per revolution as it rotates. The resonance excitation is mainly 1P and 3P, and 3P is caused by the rotational sampling of the wind field by the three-bladed rotor. According to relevant regulations, the intrinsic frequency of the jacket base should be avoided within a certain range. Under normal circumstances, the designed error range is ±10%. The first-order intrinsic frequency of wind turbine calculated herein should avoid the intervals of [0.109, 0.266 Hz] and [0.356, 0.798 Hz]. From Table 16, it can be found that the intrinsic frequency of the first-order mode was 0.326 Hz, and that of the second-order mode was 0.327 Hz, neither of which was within the two intervals. It can be concluded that the design meets the requirements and in the case of low harmonics, there is basically no resonance.
According to Figure 10, the upper tower structure of the wind turbine underwent bending in the x-direction in the first-order mode, and the first-order intrinsic frequency was 0.326 HZ, which meets the requirements of the operating frequency limit interval of the wind turbine. In the second-order mode, there was bending in the y-direction, and the support structure foundation basically does not deform. In the third- and fourth-order modes, coupling vibration of the overall structure occurred, and as the modal order increased, the deformation was more obvious. It can be found that the foundation of the support structure and the wind turbine can easily cause bending at low-order frequencies (especially at third- and fourth-order frequencies). Therefore, in building support structure, special attention should be paid to strengthening the stiffness and bending resistance to avoid safety hazards.
Since the self-vibration period of the jacket base in the first-order mode exceeded 3 s, according to the requirements of the API specification, the dynamic response analysis of the structure must be performed. As can be seen from the table above, the self-vibration cycle of the support structure in the first-order mode exceeded 3 s. According to the API specification, the dynamic response of the support structure must be further performed.

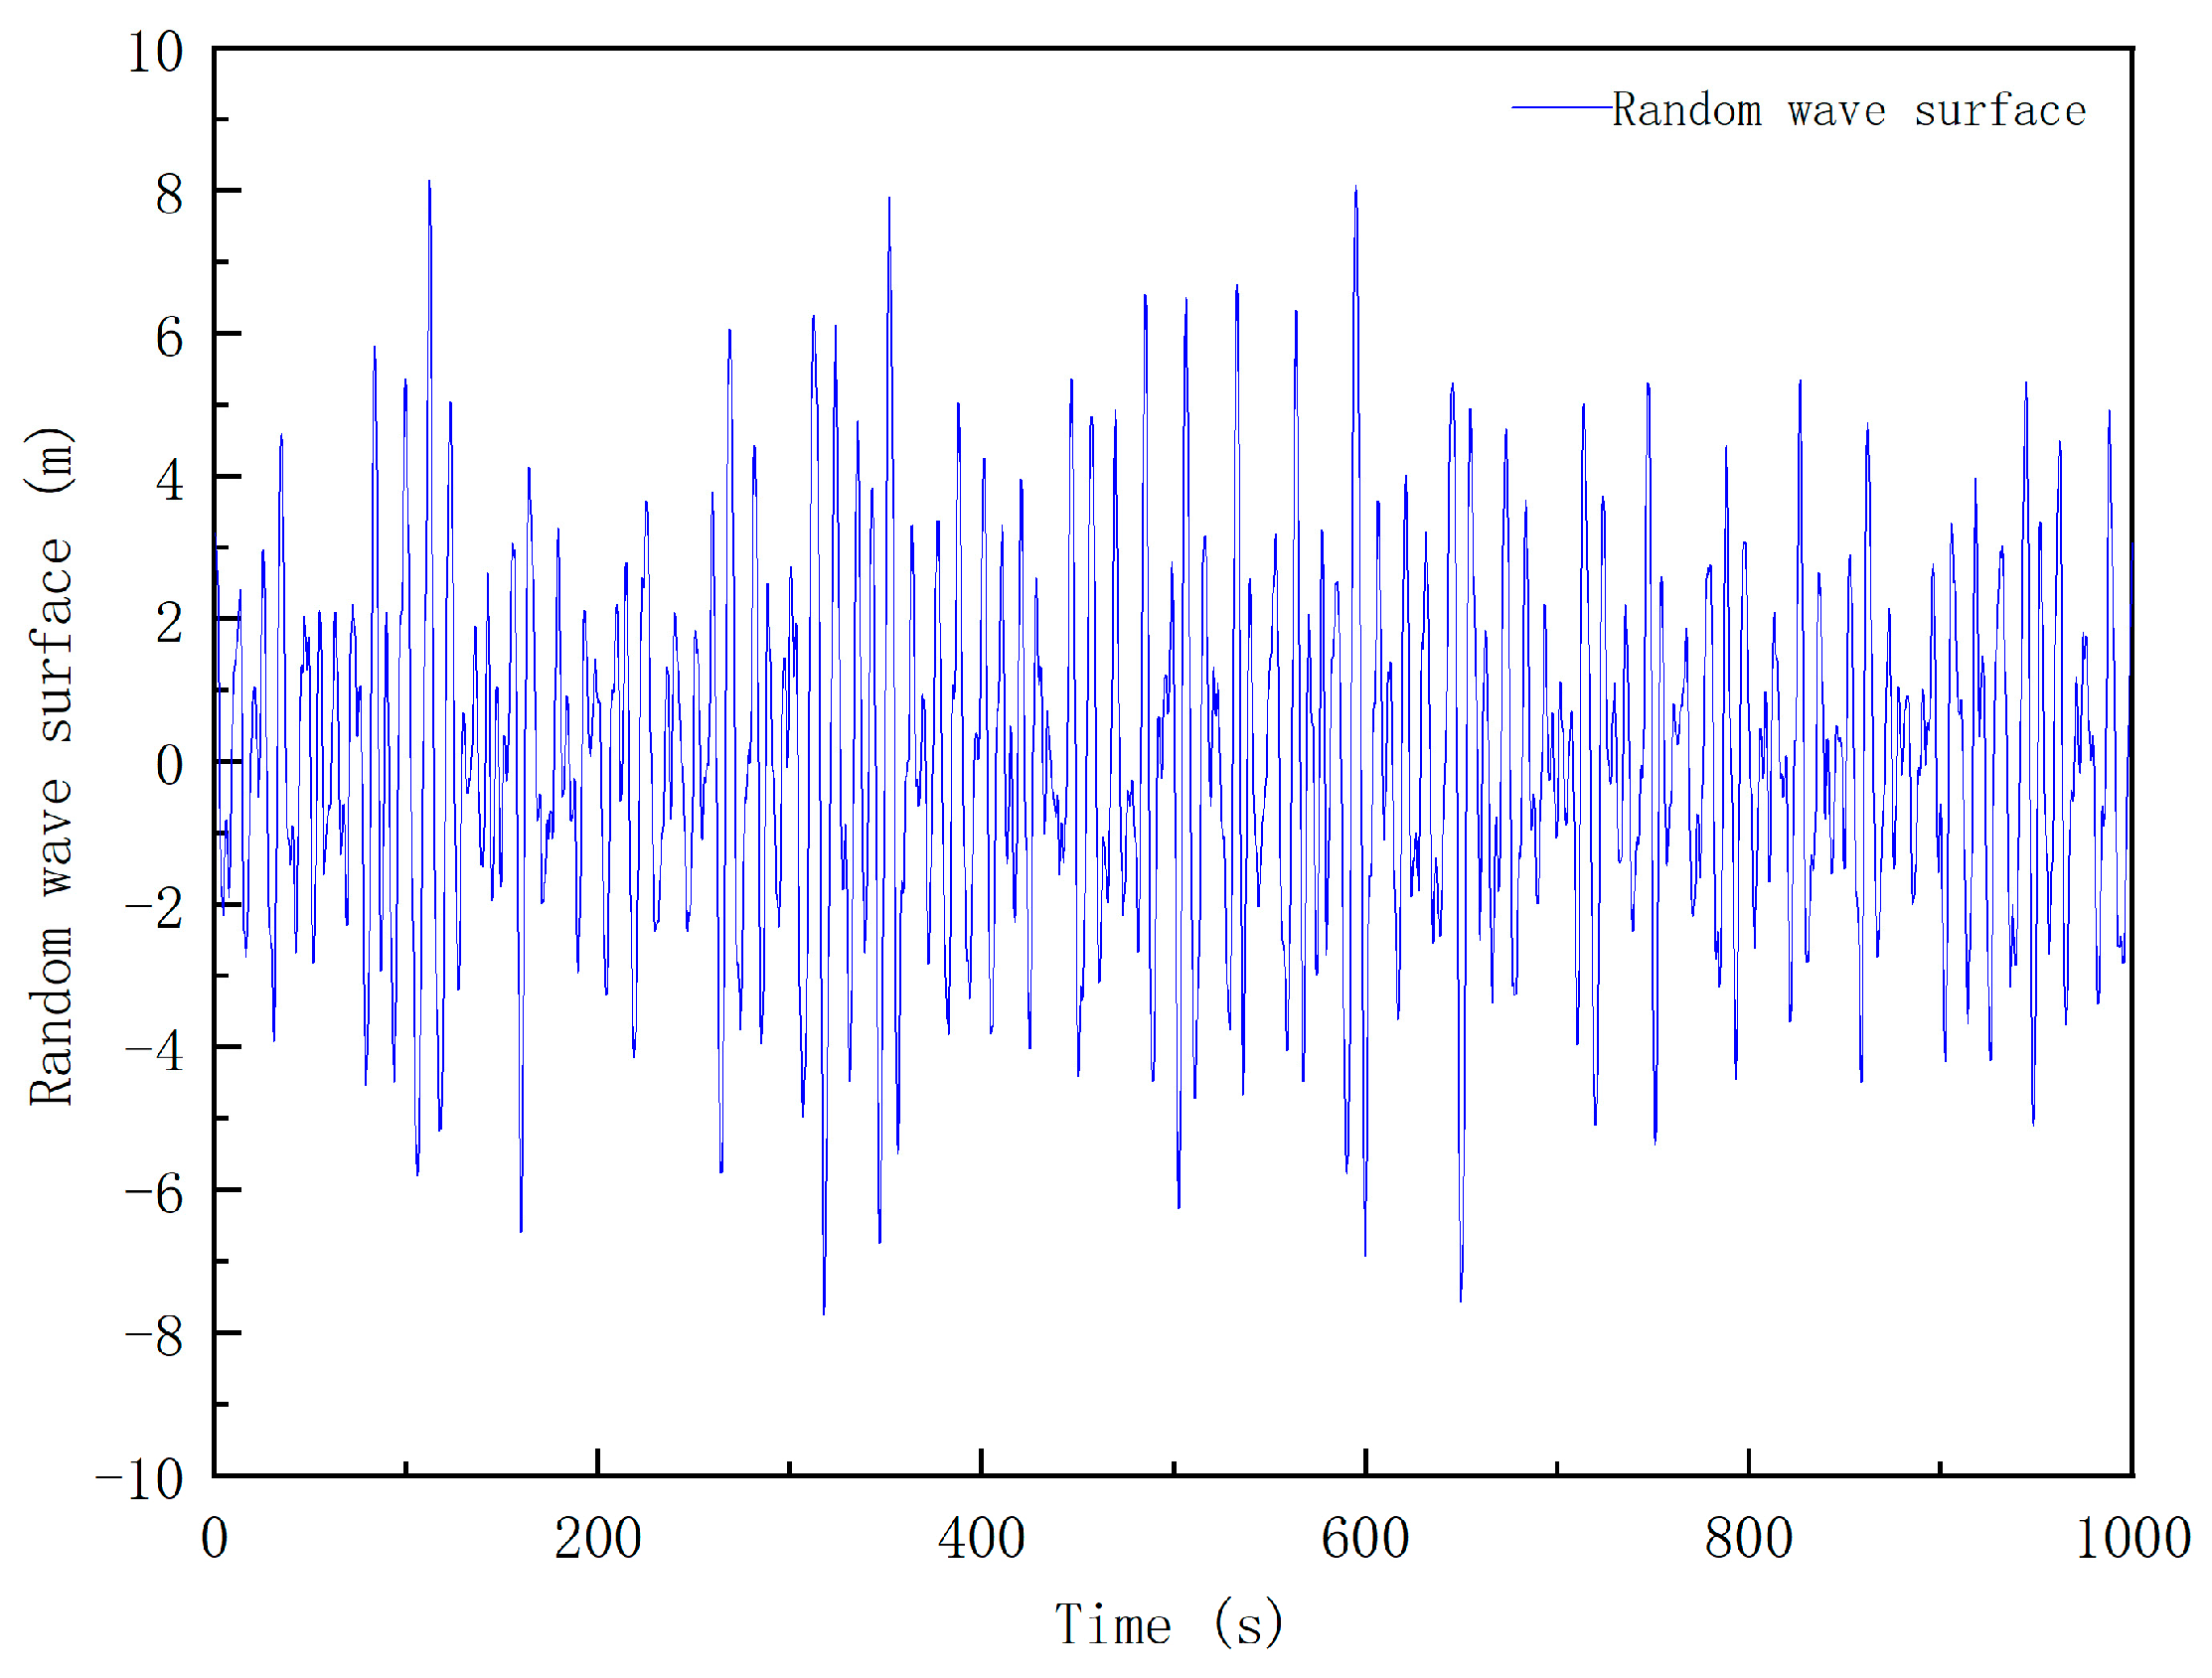
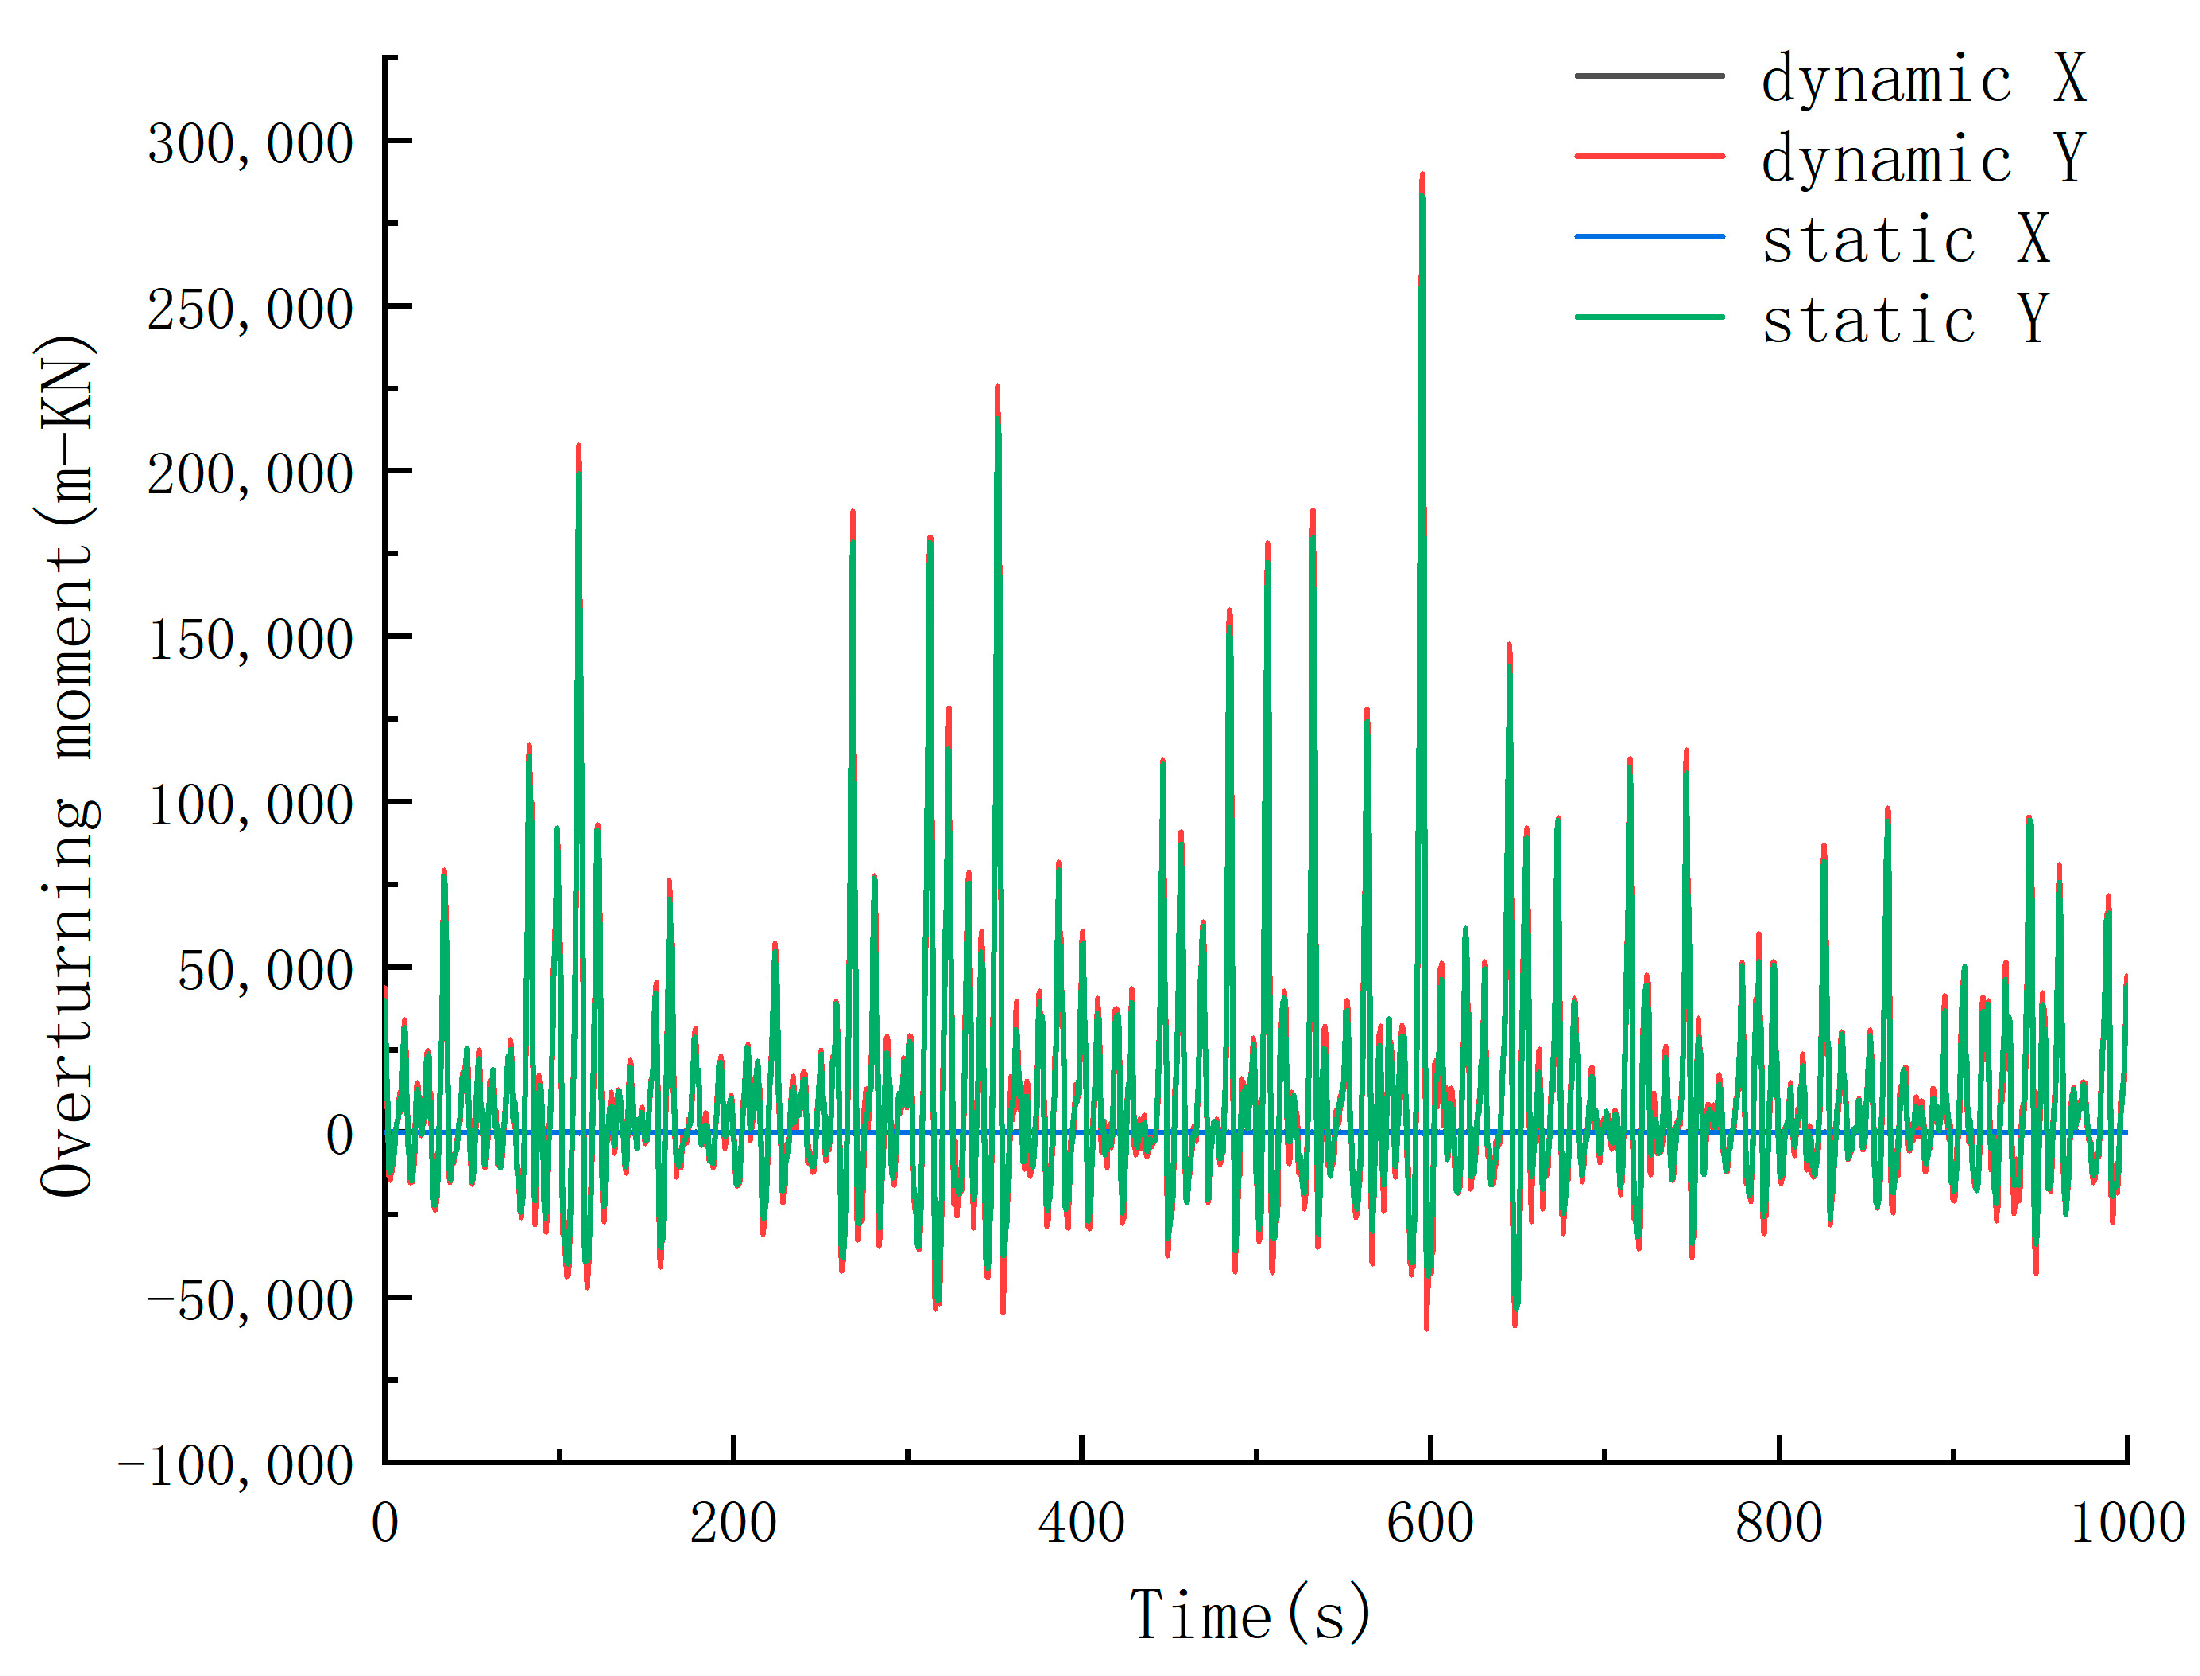
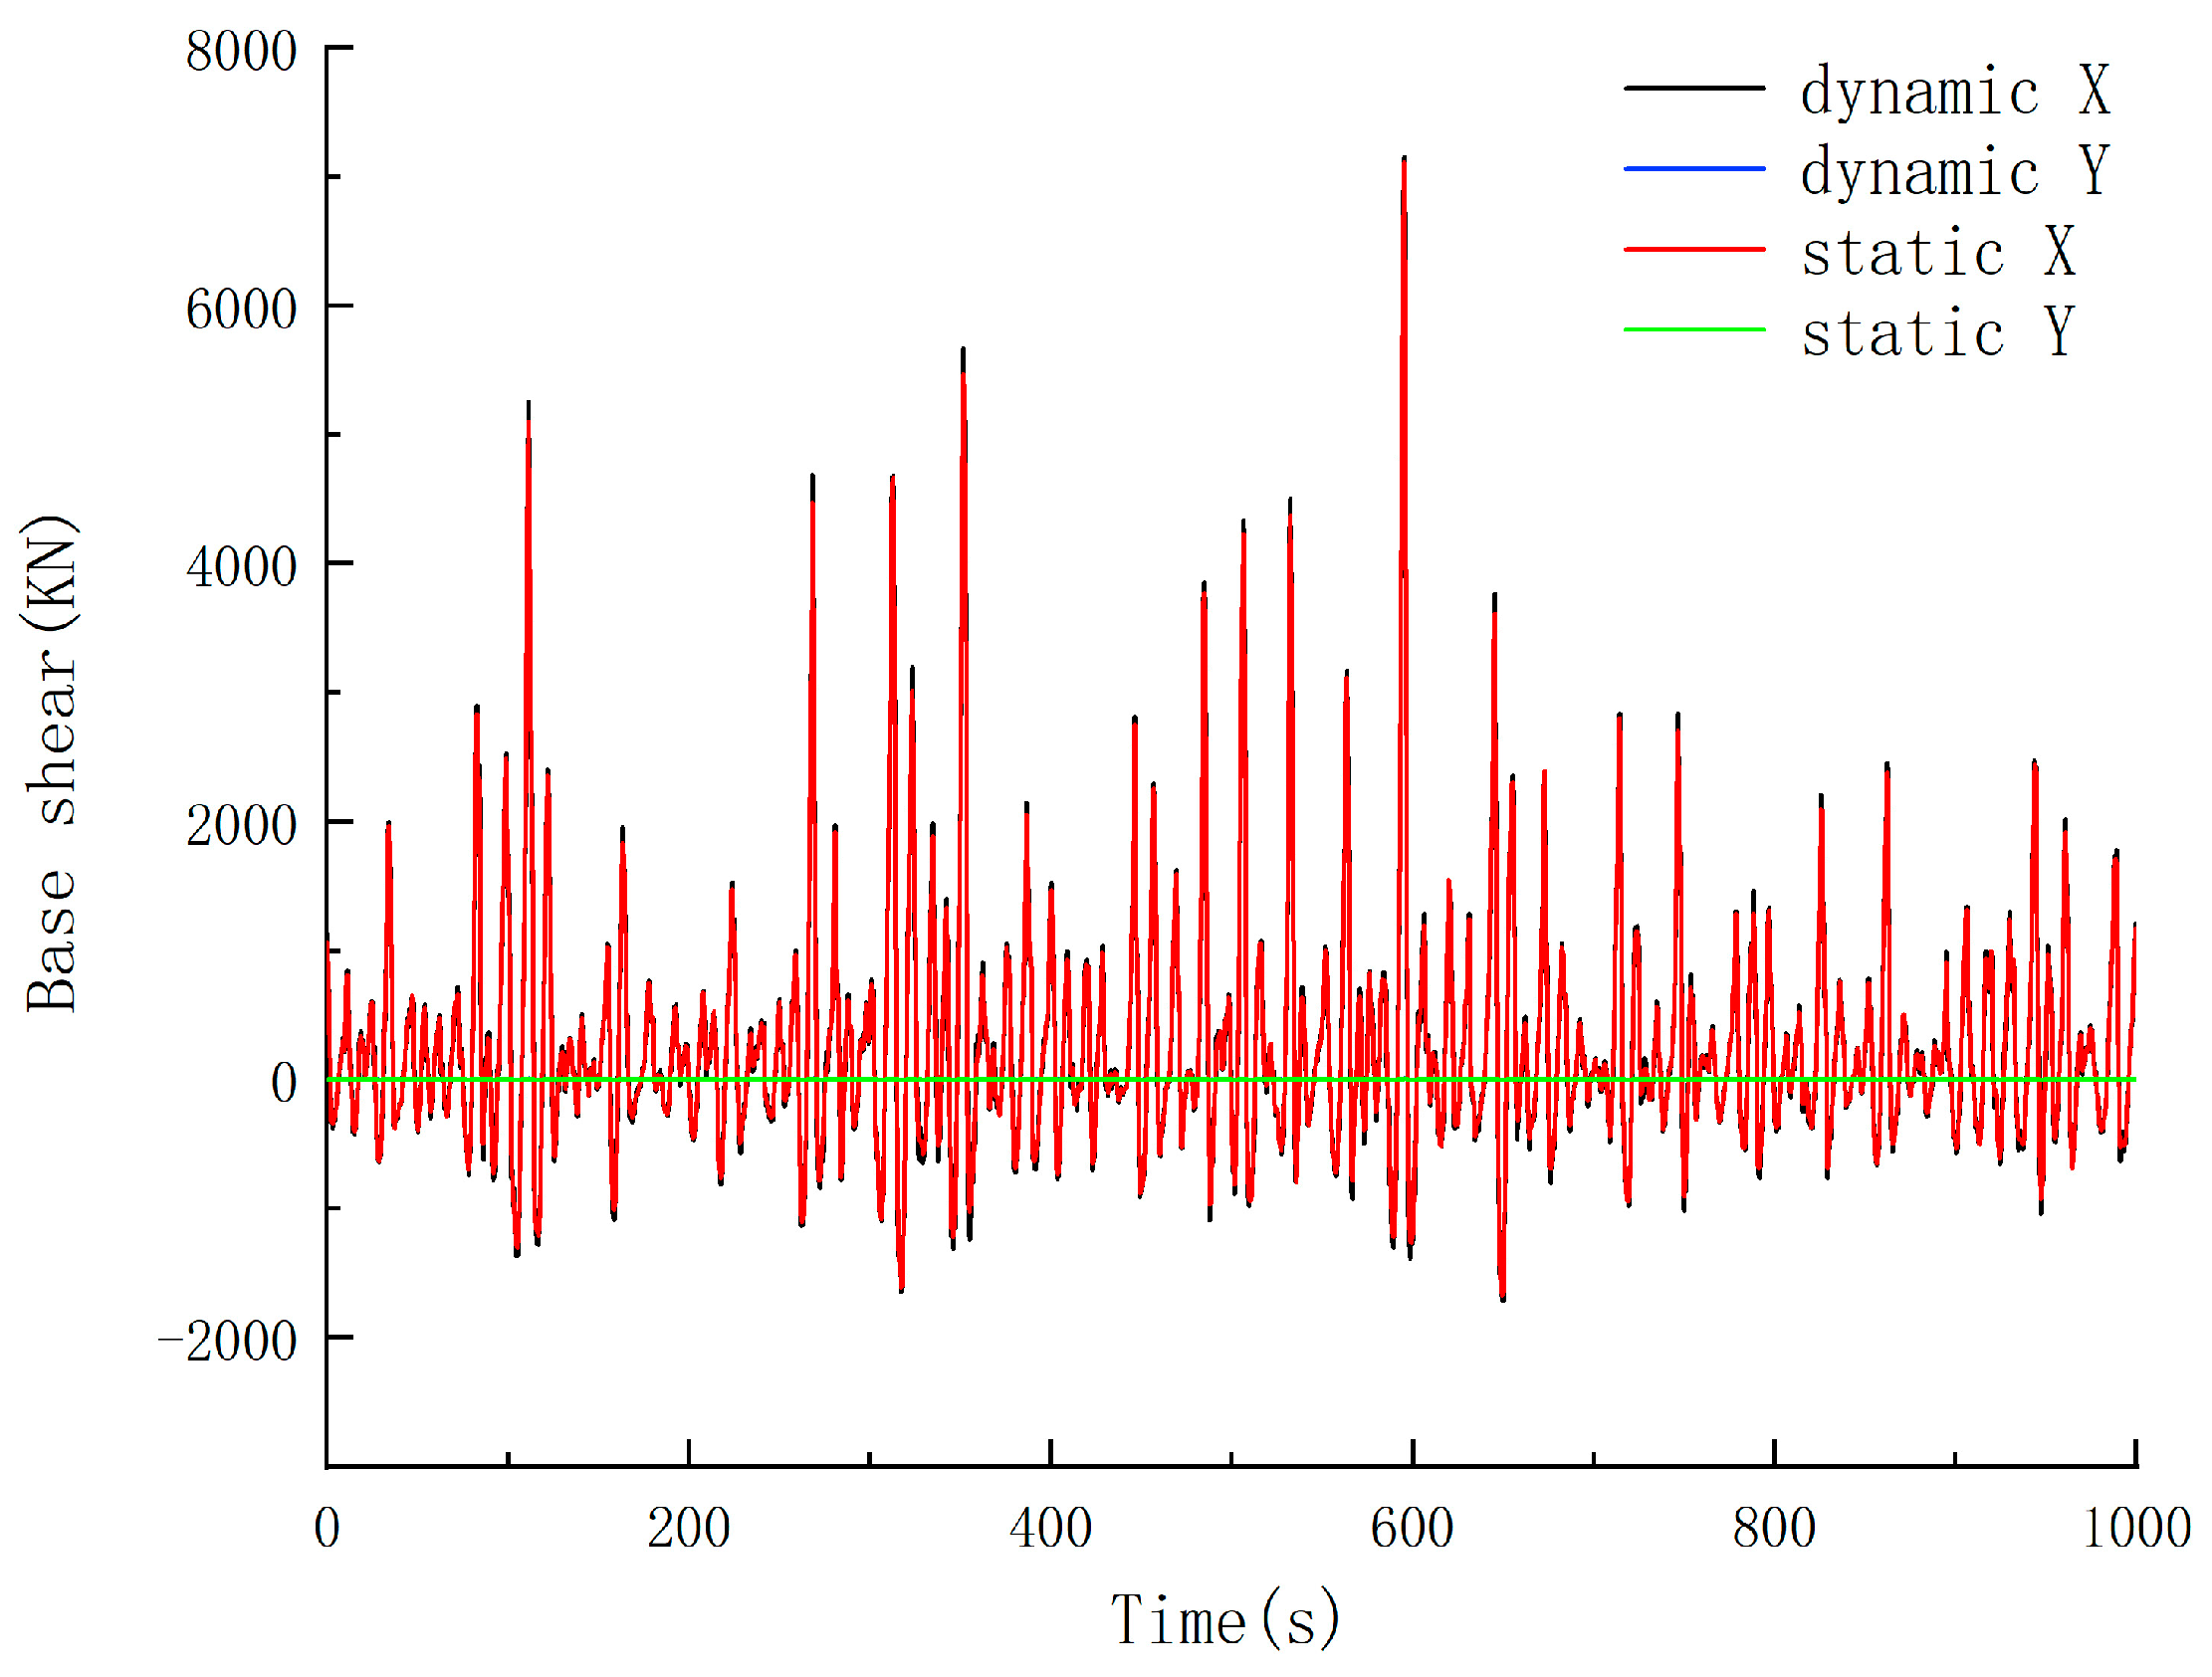
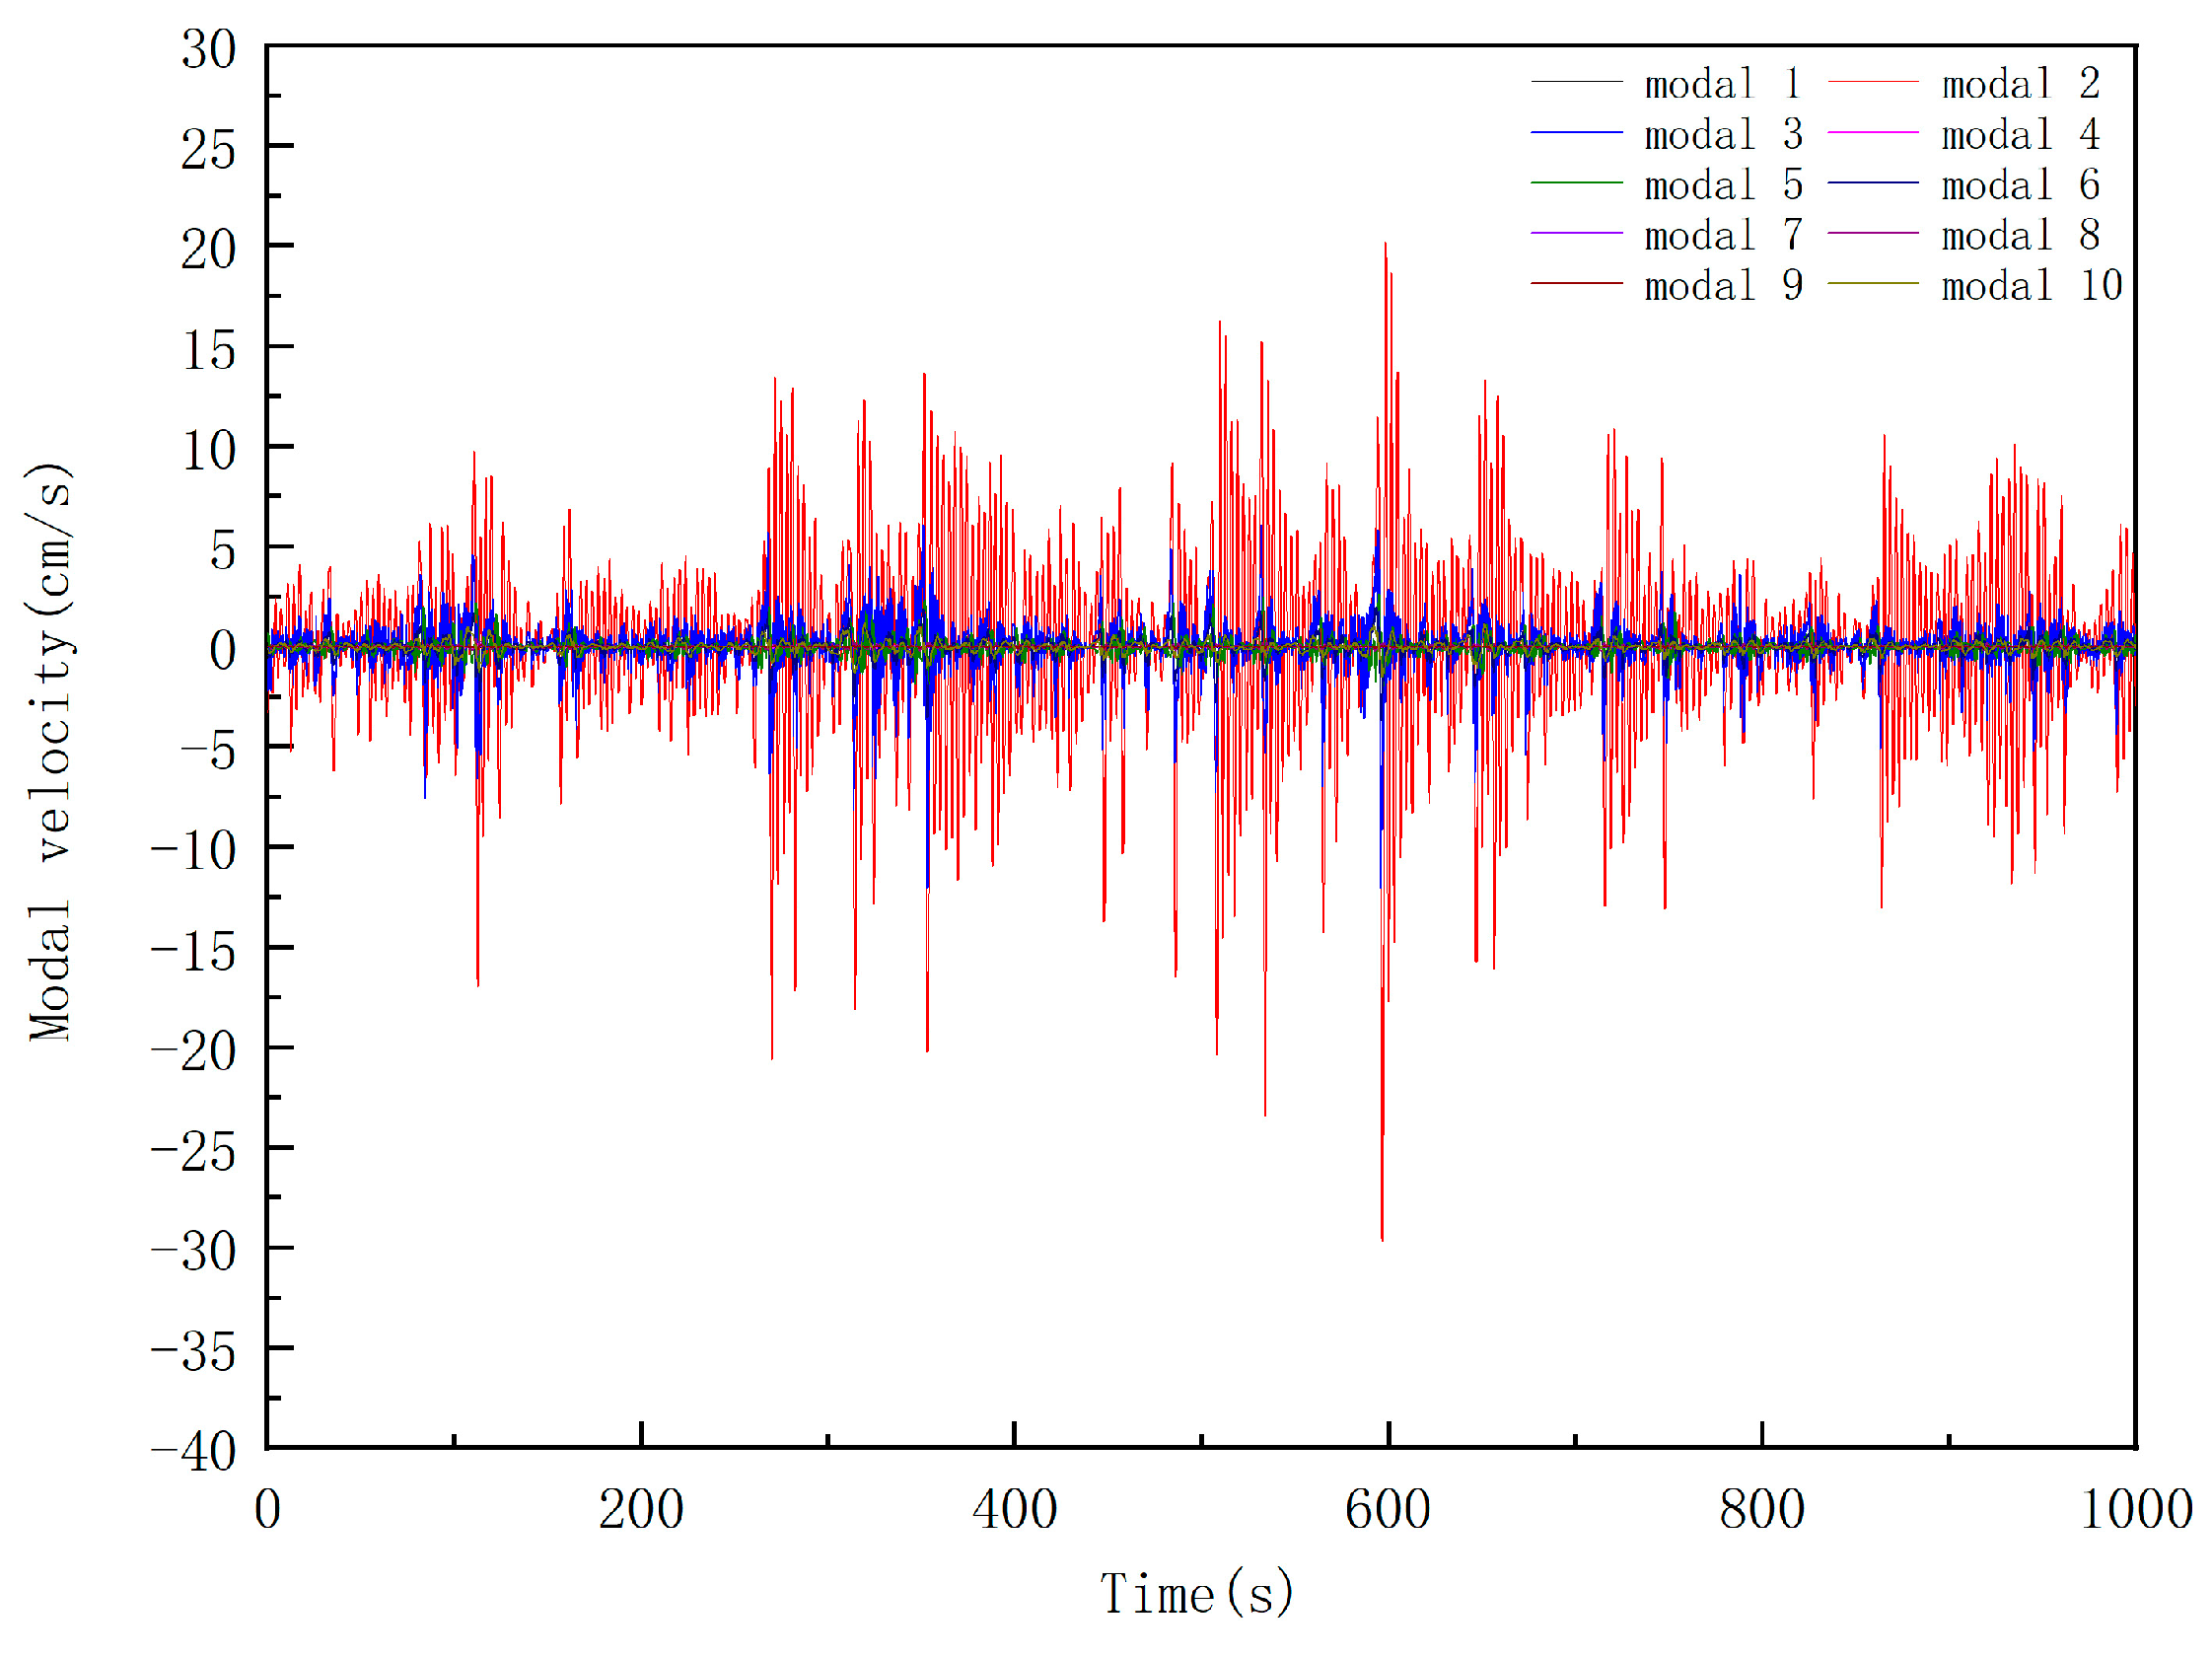
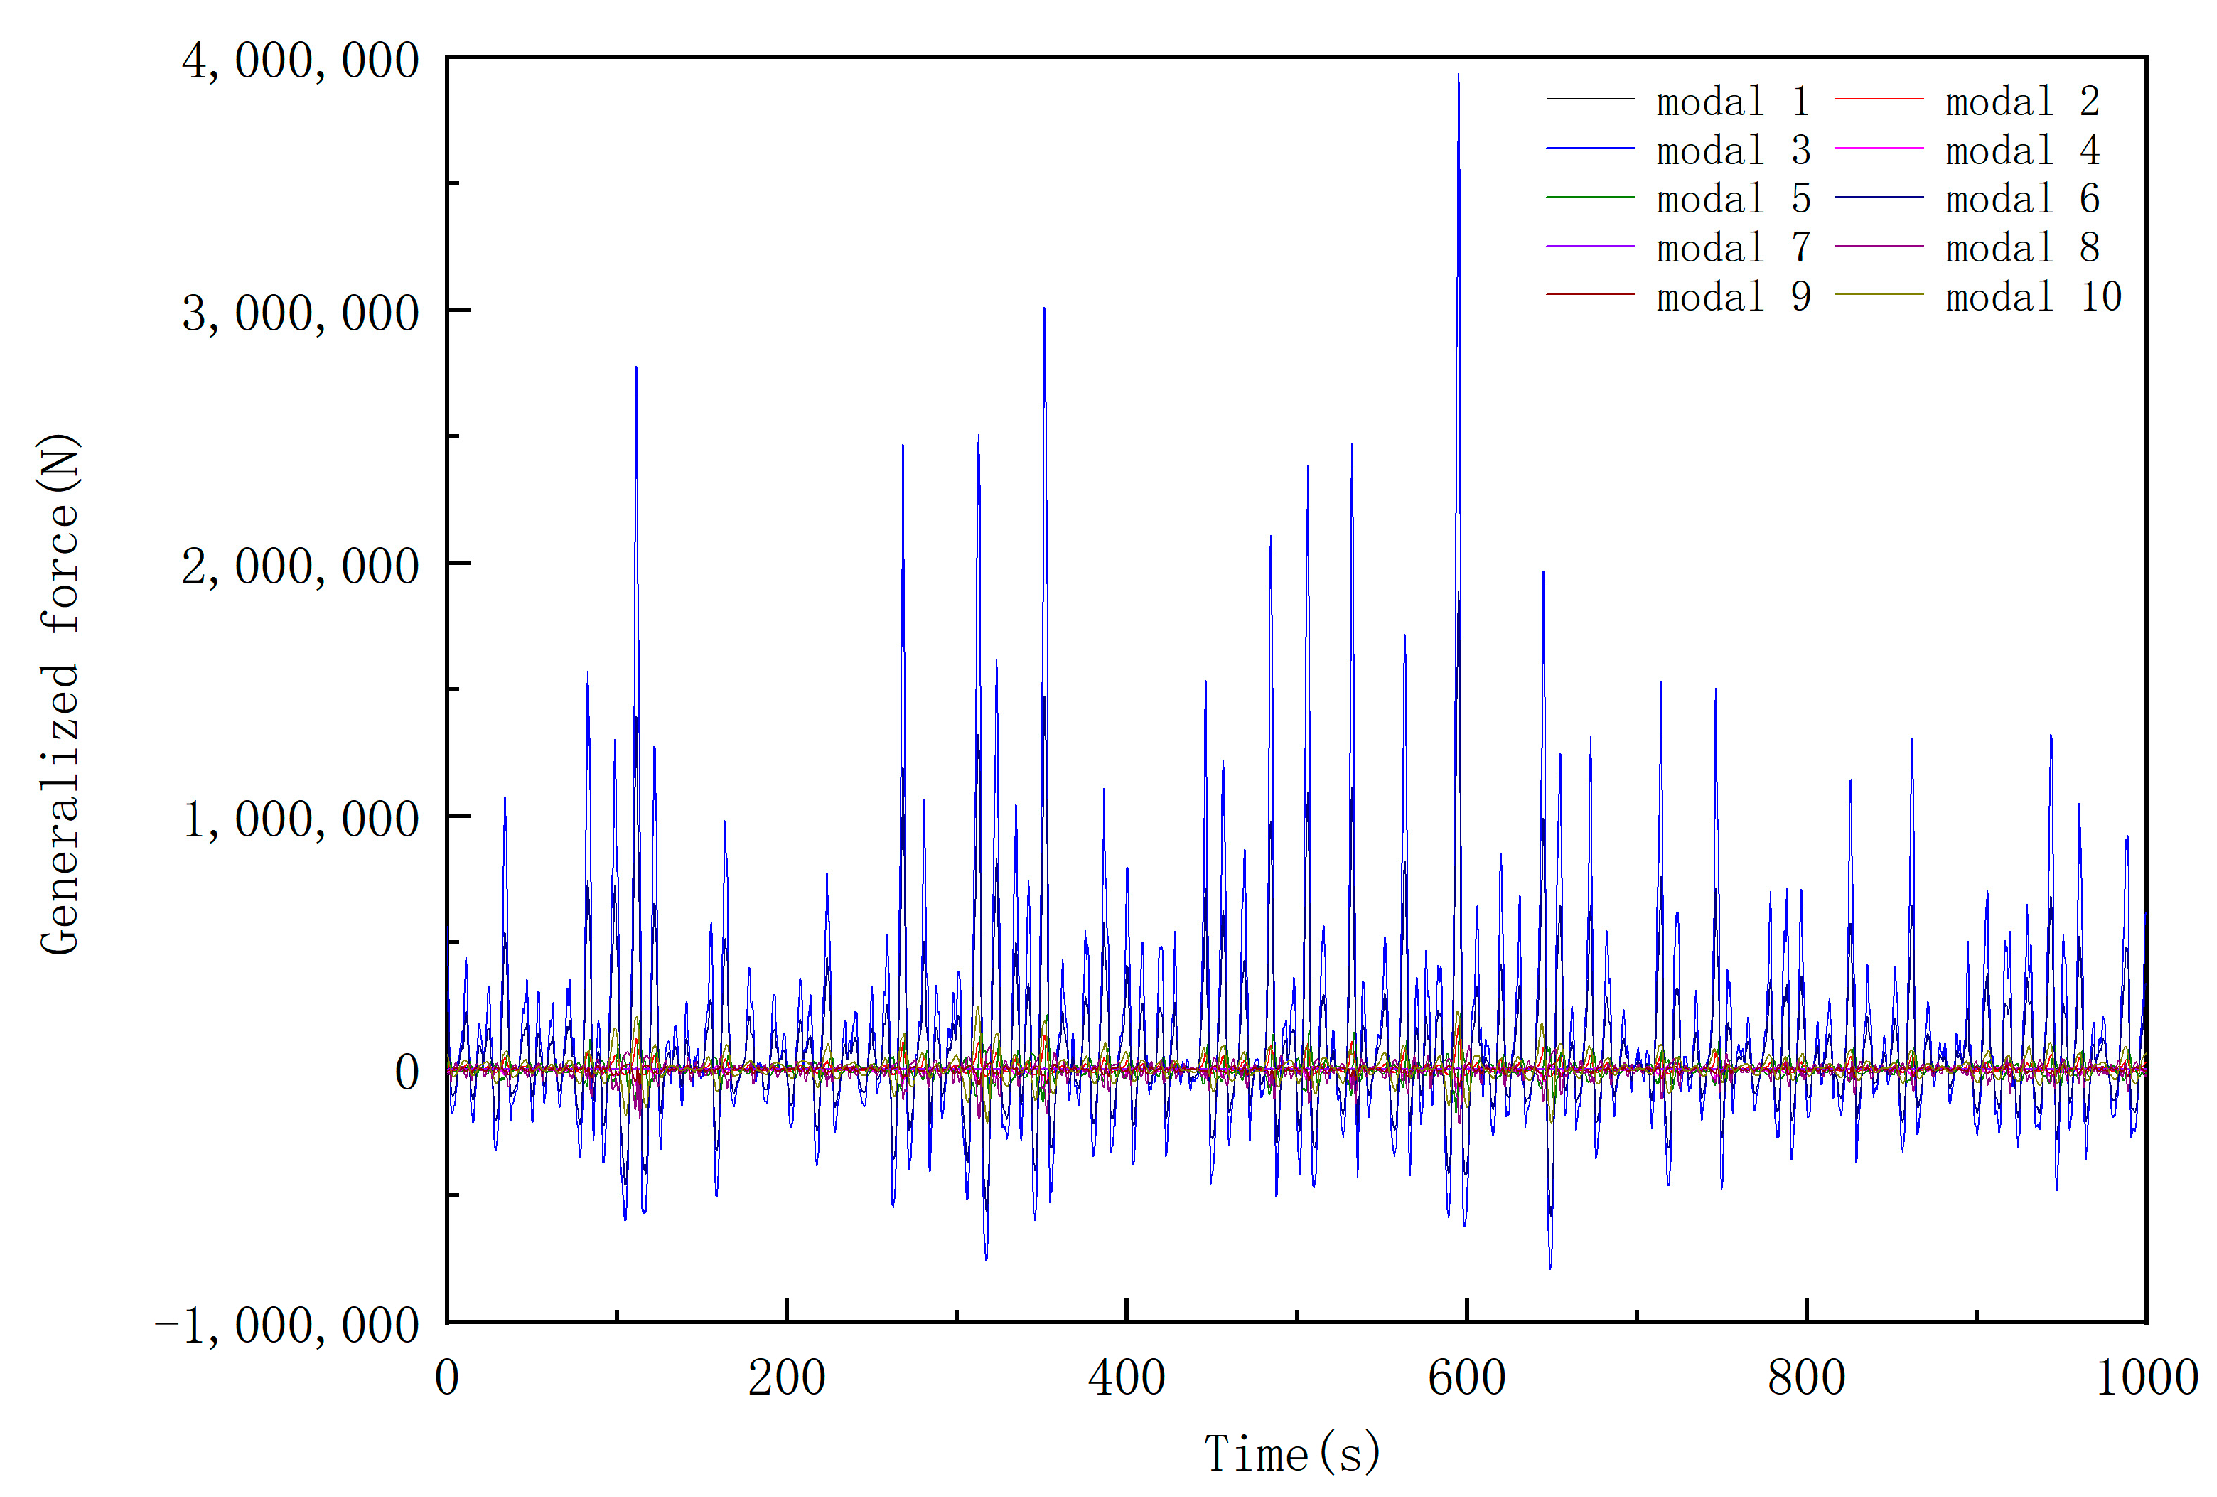
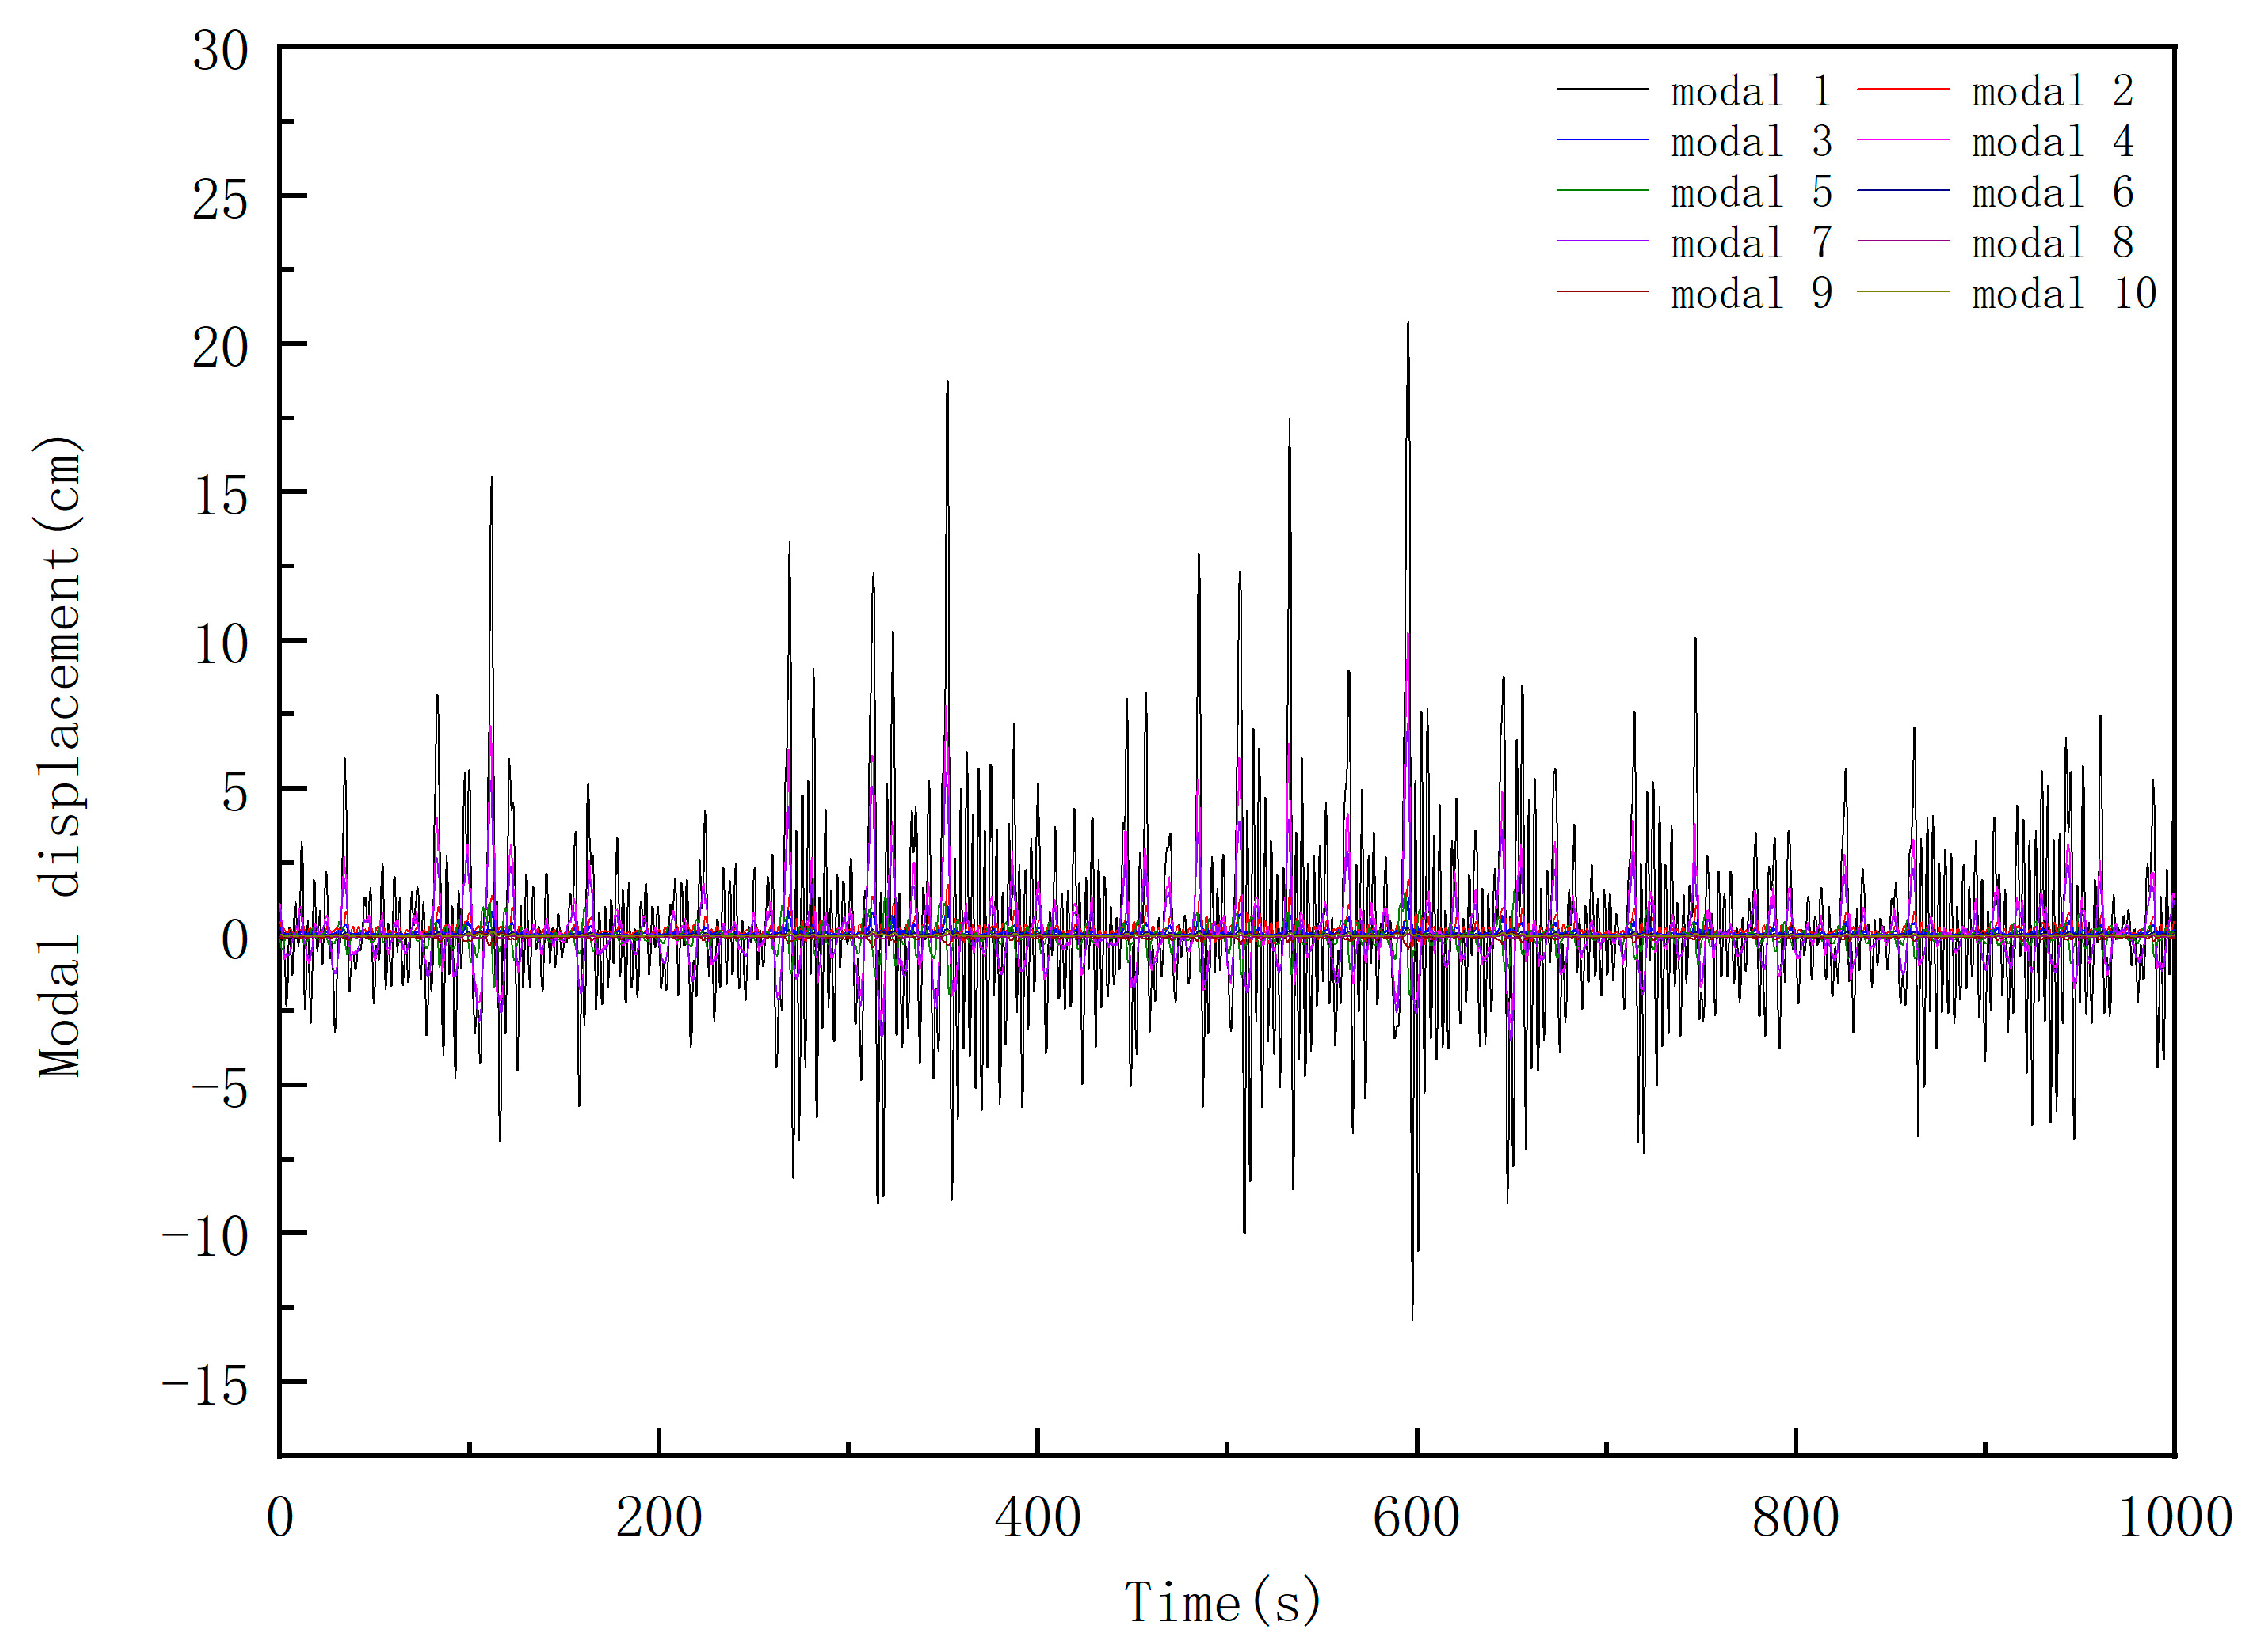
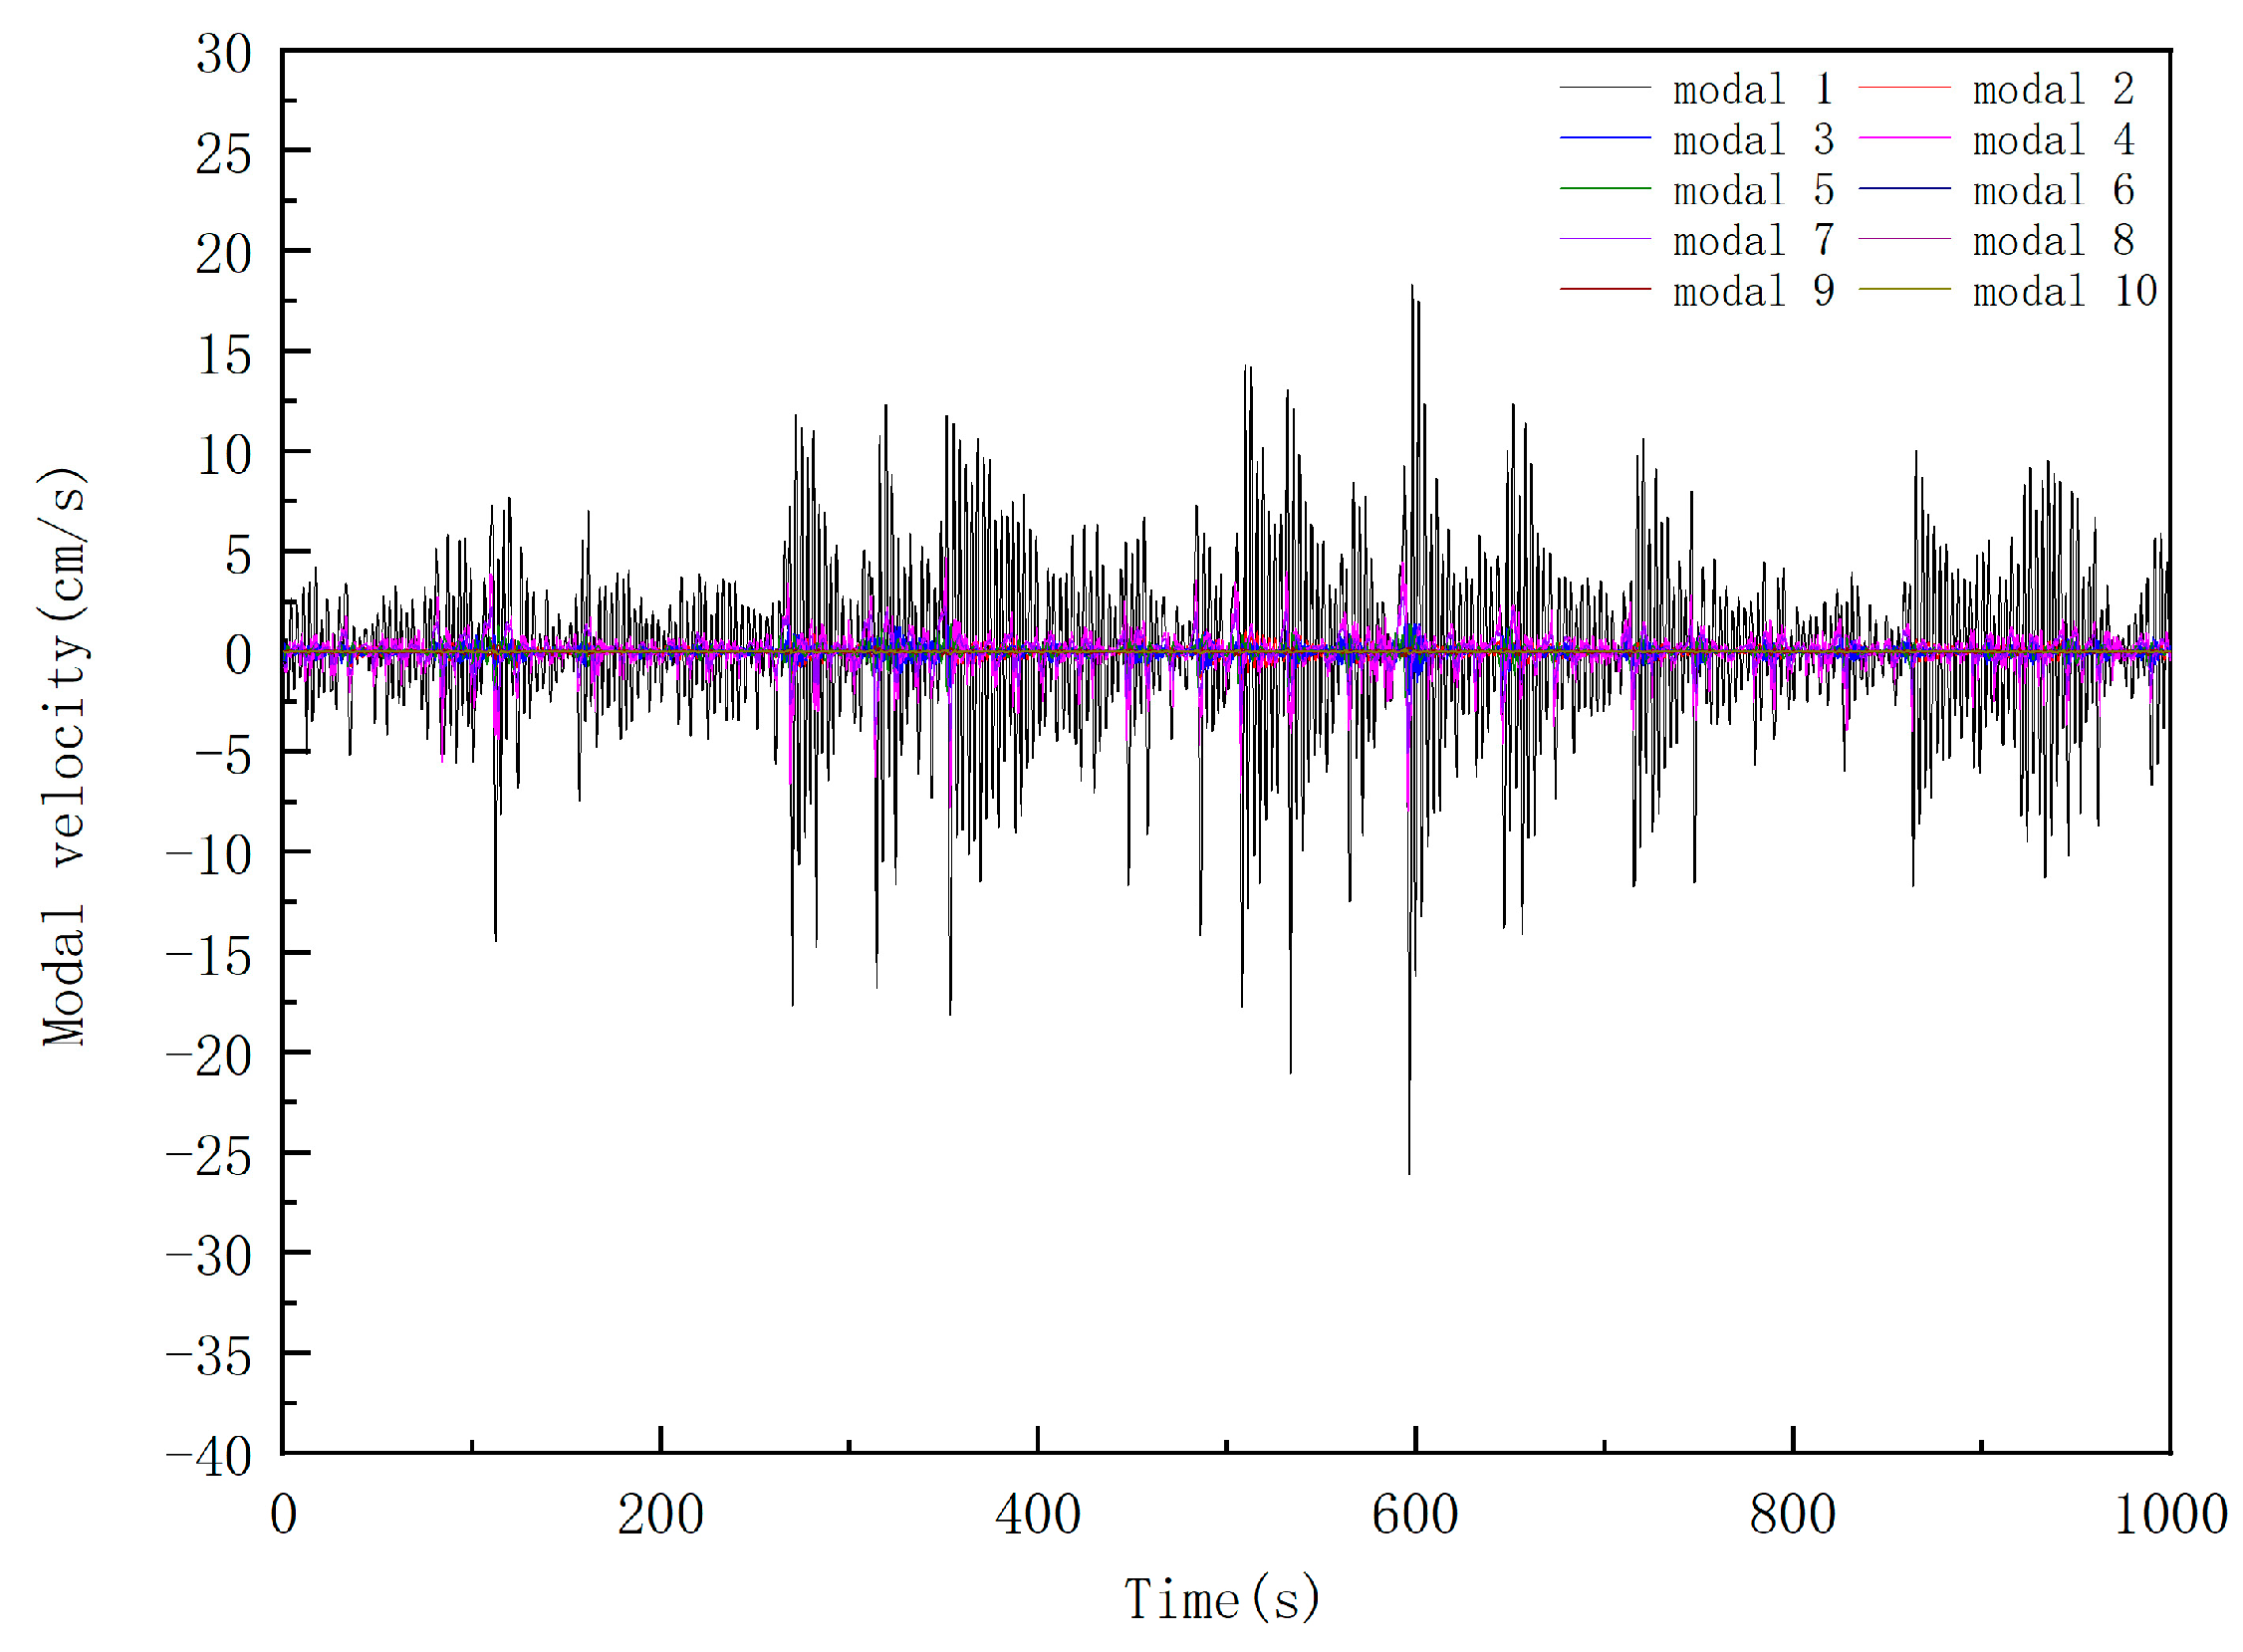
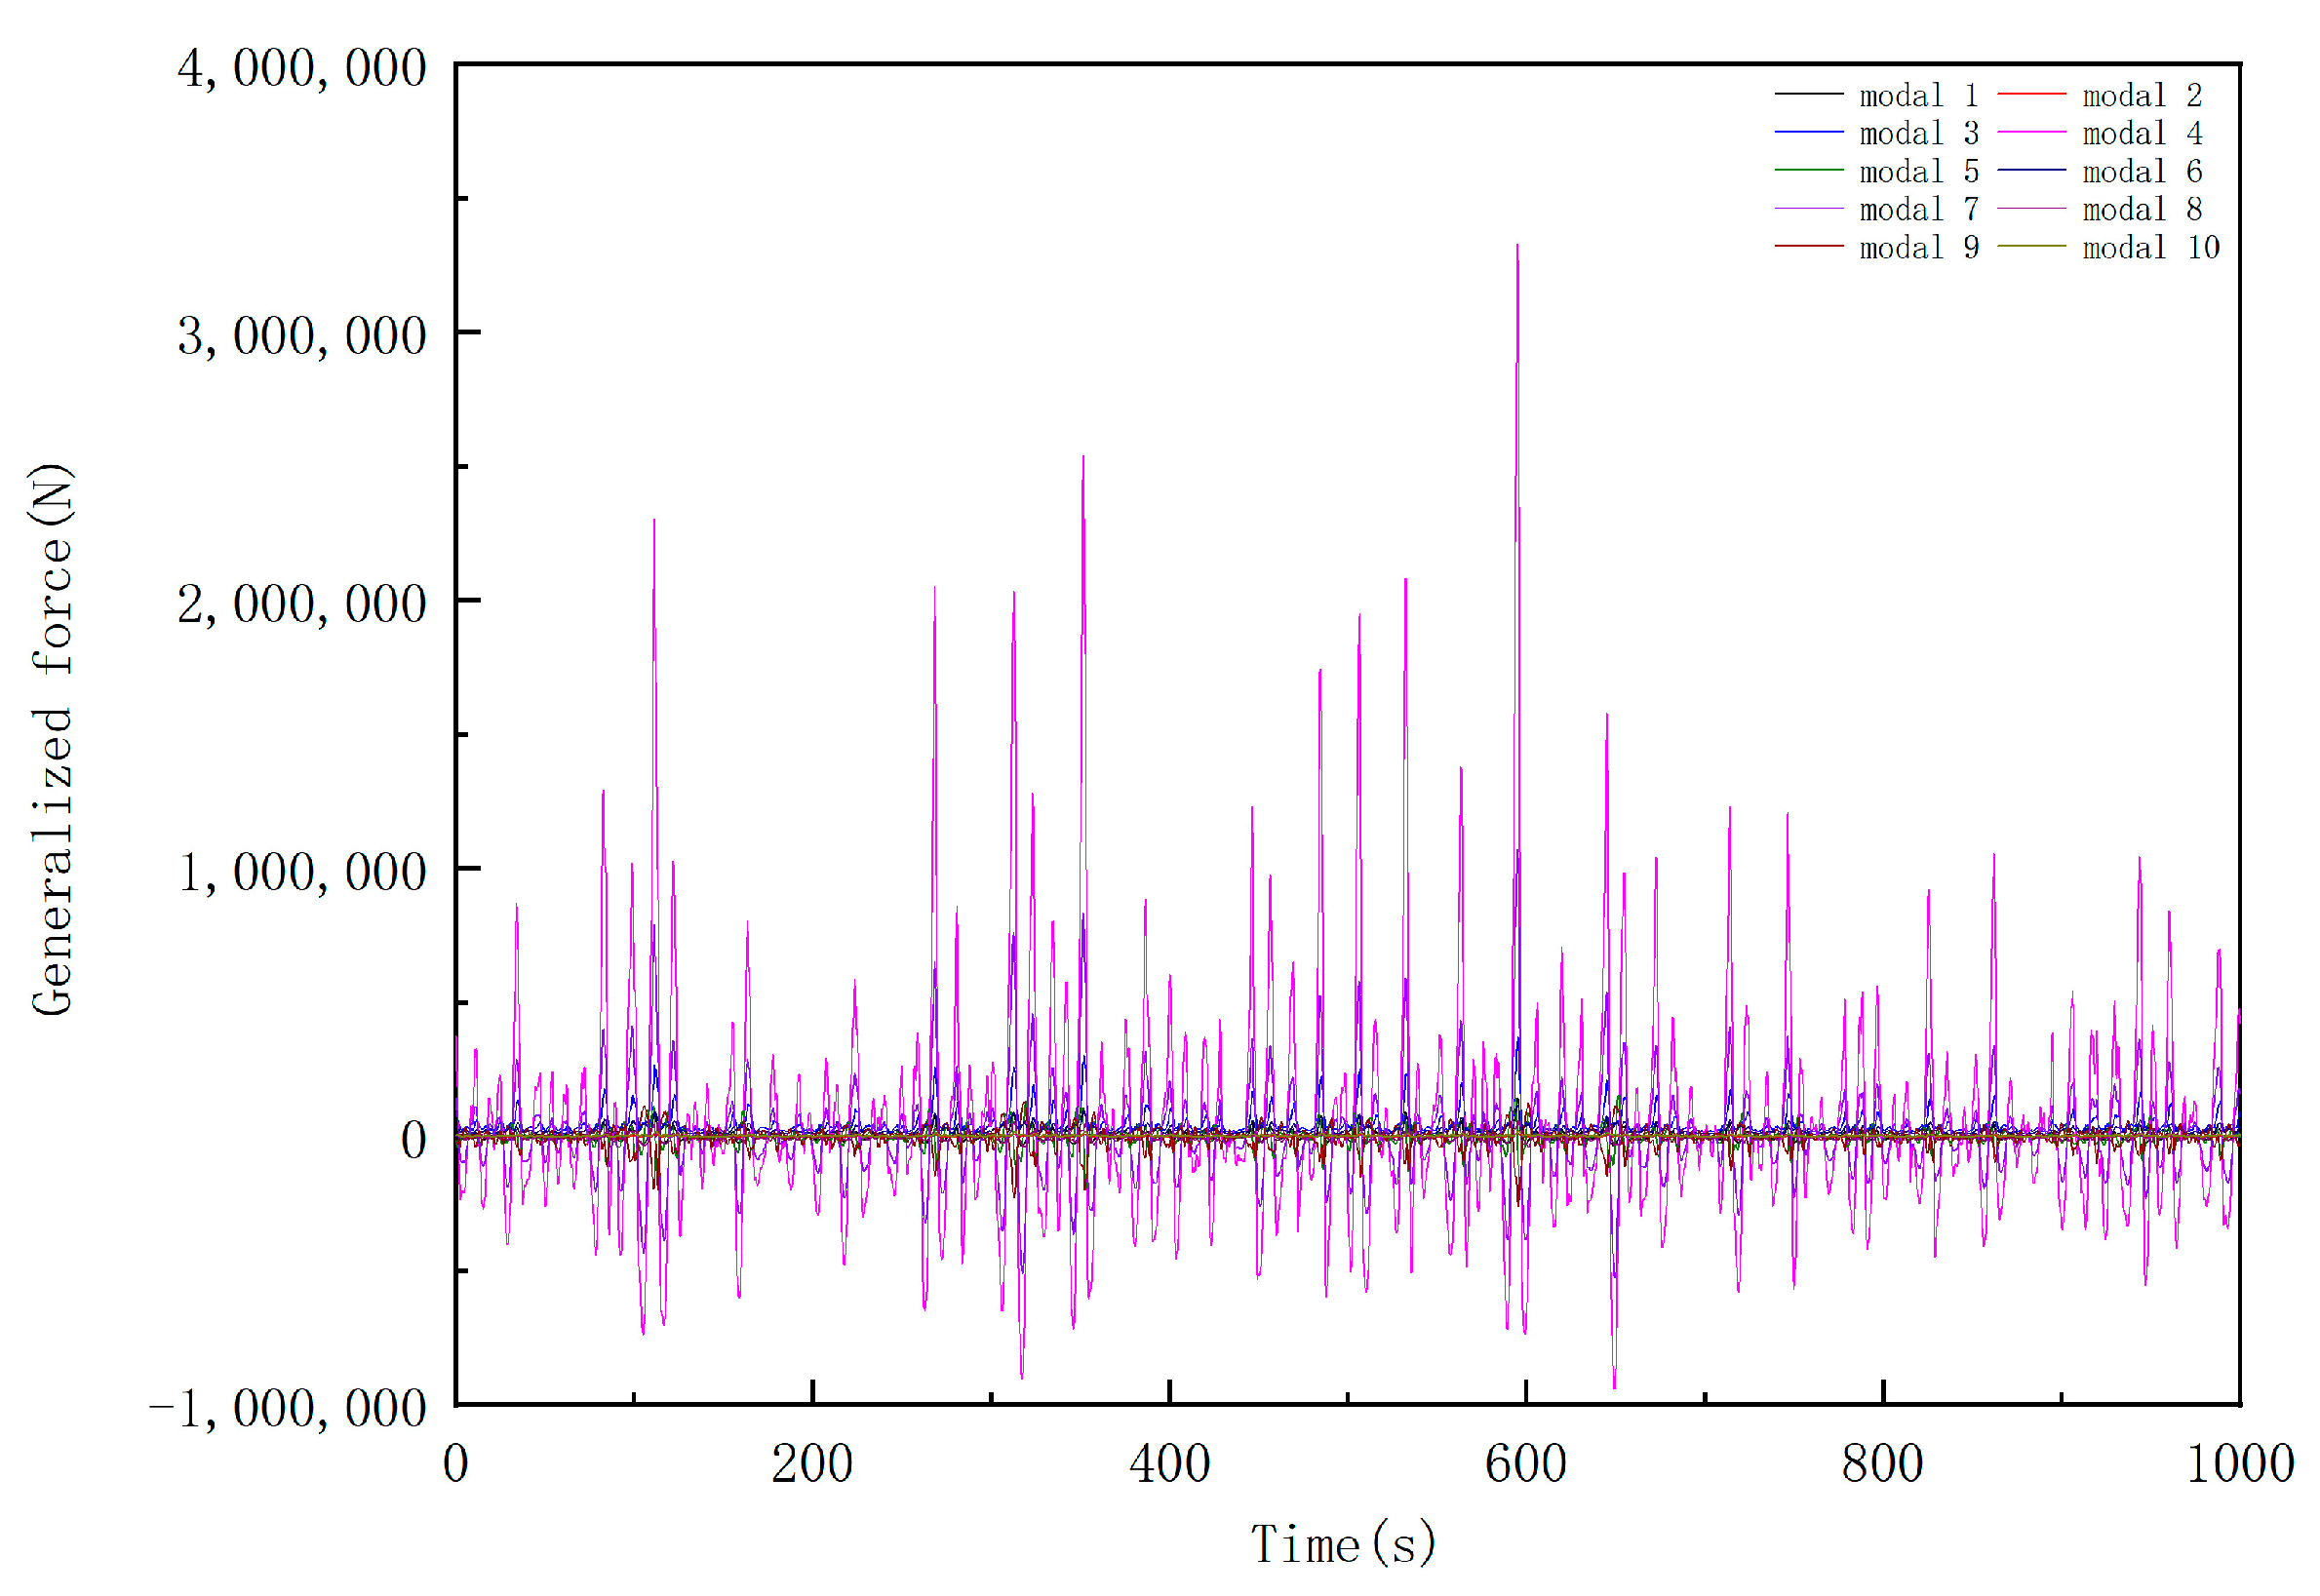
3.3. Dynamic Response Analysis of Random Waves

In the design of marine structures and ships, understanding the impact of waves on these structures is the key to ensuring their safety and stability. The dynamic response analysis of waves can evaluate the response of the structure to force, displacement, stress, and vibrations under different sea conditions, thereby determining the design strength and durability of the structure.
The new maritime gravitational energy storage system is installed in a sea area with large waves, deep water, and high vibration frequency. Therefore, there may be a small difference between self-vibration frequency and a frequency with larger energy components at some moments, which enhances the wave response and results in greater resonance. Therefore, in analyzing the operation of the energy storage system, the dynamic response of random waves must be considered [32].
The mode superposition method was used to analyze the dynamic response of the random-wave P-M wave spectrum, and the incident direction of the wave was from 0° to 180°. The wave incident was carried out every 30°. The specific parameters of random waves are shown in Table 17 below.
After calculating the self-vibration characteristic parameters of the support structure, the wave response module in SACS was used to analyze the random wave’s dynamic response, followed by calculation of the dynamic response of the support structure under wave load. At the same time, the force amplification coefficient (DAF) was calculated by comparing the dynamic and static overturning moment with the base shear force of the support structure.
Figure 11 shows the profile of the random wave.
In order to accurately reflect the statistical characteristics of waves, multiple random numbers were set up by the SACS software to generate wave spectra fitted with multiple sets of random wave surfaces, as shown in Figure 12. As can be seen from Figure 12, the theoretical value of the random wave generated by the Stokes fifth-order wave showed a high degree of fit with the true value and can thus be used as an input condition for the analysis of the random wave response of the support structure.
The overturning moment and base shear force of the random waves against the jacket base were compared under dynamic and static methods, and the numerical simulation results are shown in Figure 13 and Figure 14. It can be seen that the overturning moment and base shear force of the support structure exhibited obvious amplification effects. Therefore, the dynamic amplification coefficient (DAF) should be considered.
From the perspective of vibration theory, the dynamic amplification coefficient (DAF) is the ratio of the overturning moment and the base shear force of the support structure under the dynamic and static methods. The essential difference is that inertia and damping effects are considered in the dynamic process. Here, DAF is mainly reflected in the size of the inertial force. Usually, DAF can be used to quantify the response parameters of the studied structure, such as the base shear force and the overturning moment. There are three main methods for calculating the dynamic amplification coefficient [33], namely the single-degree-of-freedom method, the time domain analysis method, and the frequency domain analysis method.
The formula of the dynamic magnification coefficient (DAF) used in this paper is as follows:
D A F = 1 2 β ω / ω n 2 + 1 ω / ω n 2 2
where DAF is the dynamic amplification coefficient; ω n is the basic intrinsic frequency; and β is the damping coefficient, which is 3% in this paper.
Within the 1000 s simulation, the maximum dynamic overturning moment (base shear force) and maximum static overturning bending moment (base shear force) of the structure at the same time were compared in Figure 13 and Figure 14 above, and the maximum dynamic magnification coefficient (DAF) under different operating conditions was obtained, as shown in Table 18 below.
From Table 18, it can be found that the overturning moment in the X and Y directions and the DAF of the substrate shear force were all greater than 1, and the overturning moment in the X direction was up to 1.550. By analyzing Figure 13 and Figure 14, it can be found that the DAF at certain times was significantly greater than the value in Table 18. Therefore, for the support structure, the received random wave power response was very obvious. Therefore, wave power response analysis must be further analyzed through static analysis to ensure the safety of the support structure.
In the following additional wave power response analysis of the support structure, the modal displacement, modal velocity, and the change in modal generalized force with time were analyzed in the support structure of the first ten modes. Figure 15, Figure 16, Figure 17, Figure 18, Figure 19 and Figure 20 show the foregoing analysis results in the directions of 0 degrees and 90 degrees within the time domain. According to the data in the figures, it can be concluded that in the wave direction of 0 degrees, the modal displacement and modal velocity of the second-order model were the greatest among the first tenth-order modes, and the generalized force of the third-order mode was the greatest. Therefore, the second and third-order modes were the largest contributors to the dynamic response, and the fluctuations of other modes are lower. When the wave direction was 90 degrees, the modal displacement and modal velocity of the first-order mode was the greatest among the first tenth-order modes, and the generalized force of the fourth-order mode was the largest. Therefore, the first- and fourth-order modes were the most significant contributors to the dynamic response. This indicates that during the normal operation of wind turbines, it is necessary to avoid the first- and fourth-order intrinsic frequencies of the structure from being close to the wave frequency area, as resonance will cause damage and pose a safety risk.

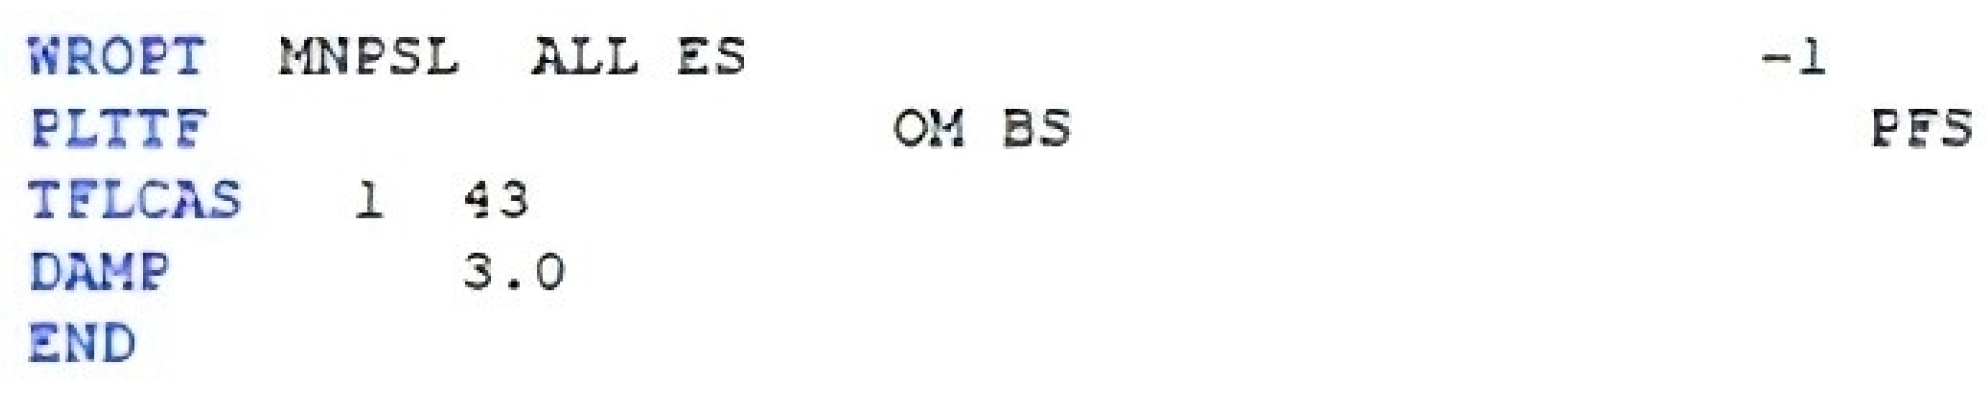
3.4. Wave Spectra and Fatigue Analysis

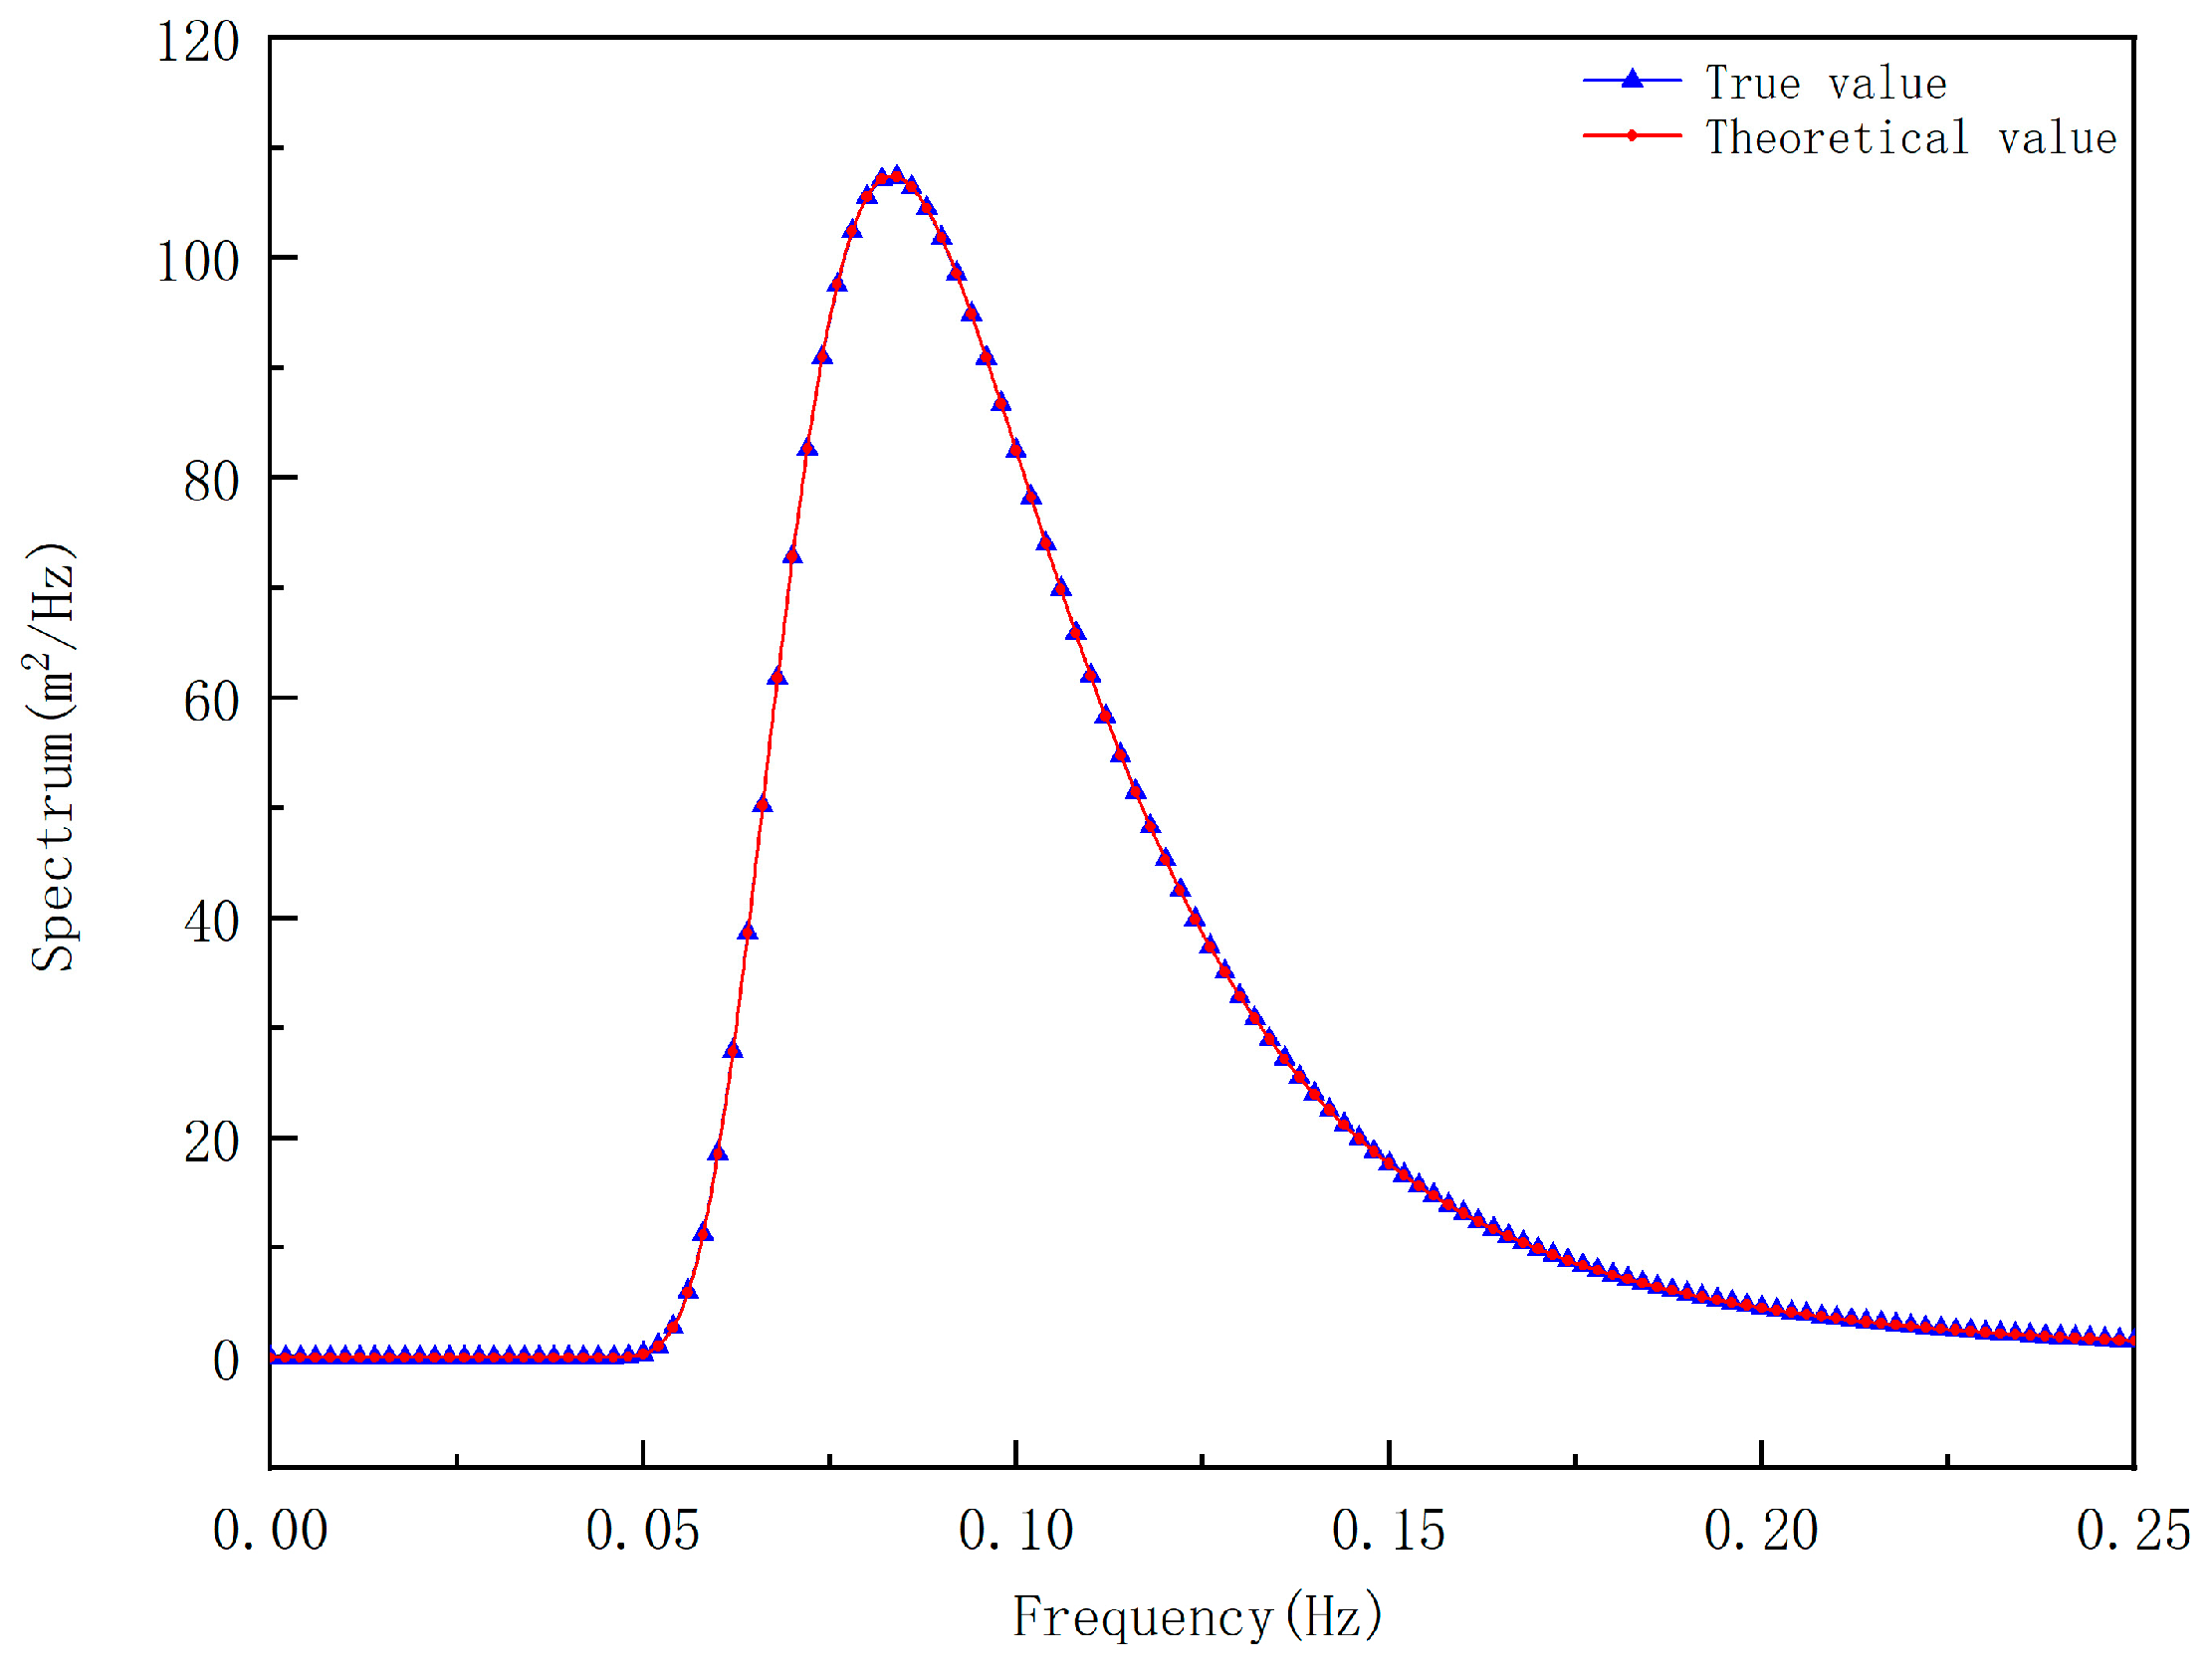
3.4.1. Wave Conditions

SACS provides many built-in wave theories, such as Stream, Airy, Stokes, and Cnoidal. In order to calculate the accurate wave load, the choice of wave theory should meet the requirements. In Norway’s DNV, parameters such as wave steepness coefficient (S), relative water depth (H0), and Ursell (Ur) number are used as the criteria for choosing a wave theory, and the Stokes fifth-order wave theory is selected. The wave spectrum is the P-M wave spectrum, and the structural damping is set to 3.0%.
For each wave direction, 6 waves are selected from the interval of 5~10 s with an interval of 1.0 s; 6 waves are selected from the interval of 4.75~3.5 s with an interval of 0.25 s; 15 waves are selected from the interval of 3.4~2.0 s with an interval of 0.1 s; and 16 waves are selected from the interval of 1.95~1.2 s with an interval of 0.05 s. The wave steepness is 1/30. In the calculation, a total of 43 frequencies are applied to solve the transfer function of the frequency of each wave angle. The specific 0° direction sea condition data command is shown in Figure 21.
The wave response analysis input file is shown in Figure 22.
The parameters set for spectrum and fatigue analysis of waves are as follows: according to the requirements of the API specification, since the wave angle change should be less than 30°, the angle settings are 0°, 30°, 60°, 90°, 120°, 150°, and 180°.
The response of the support structure is affected by the direction and occurrence probability of waves. During fatigue analysis, the influence of direction and occurrence probability of waves needs to be considered in general. According to the wave conditions in the sea area, the probability of each wave angle and the combined probability distribution of wave height and wave period (used in subsequent analysis) are shown in Table 19 and Table 20 below.

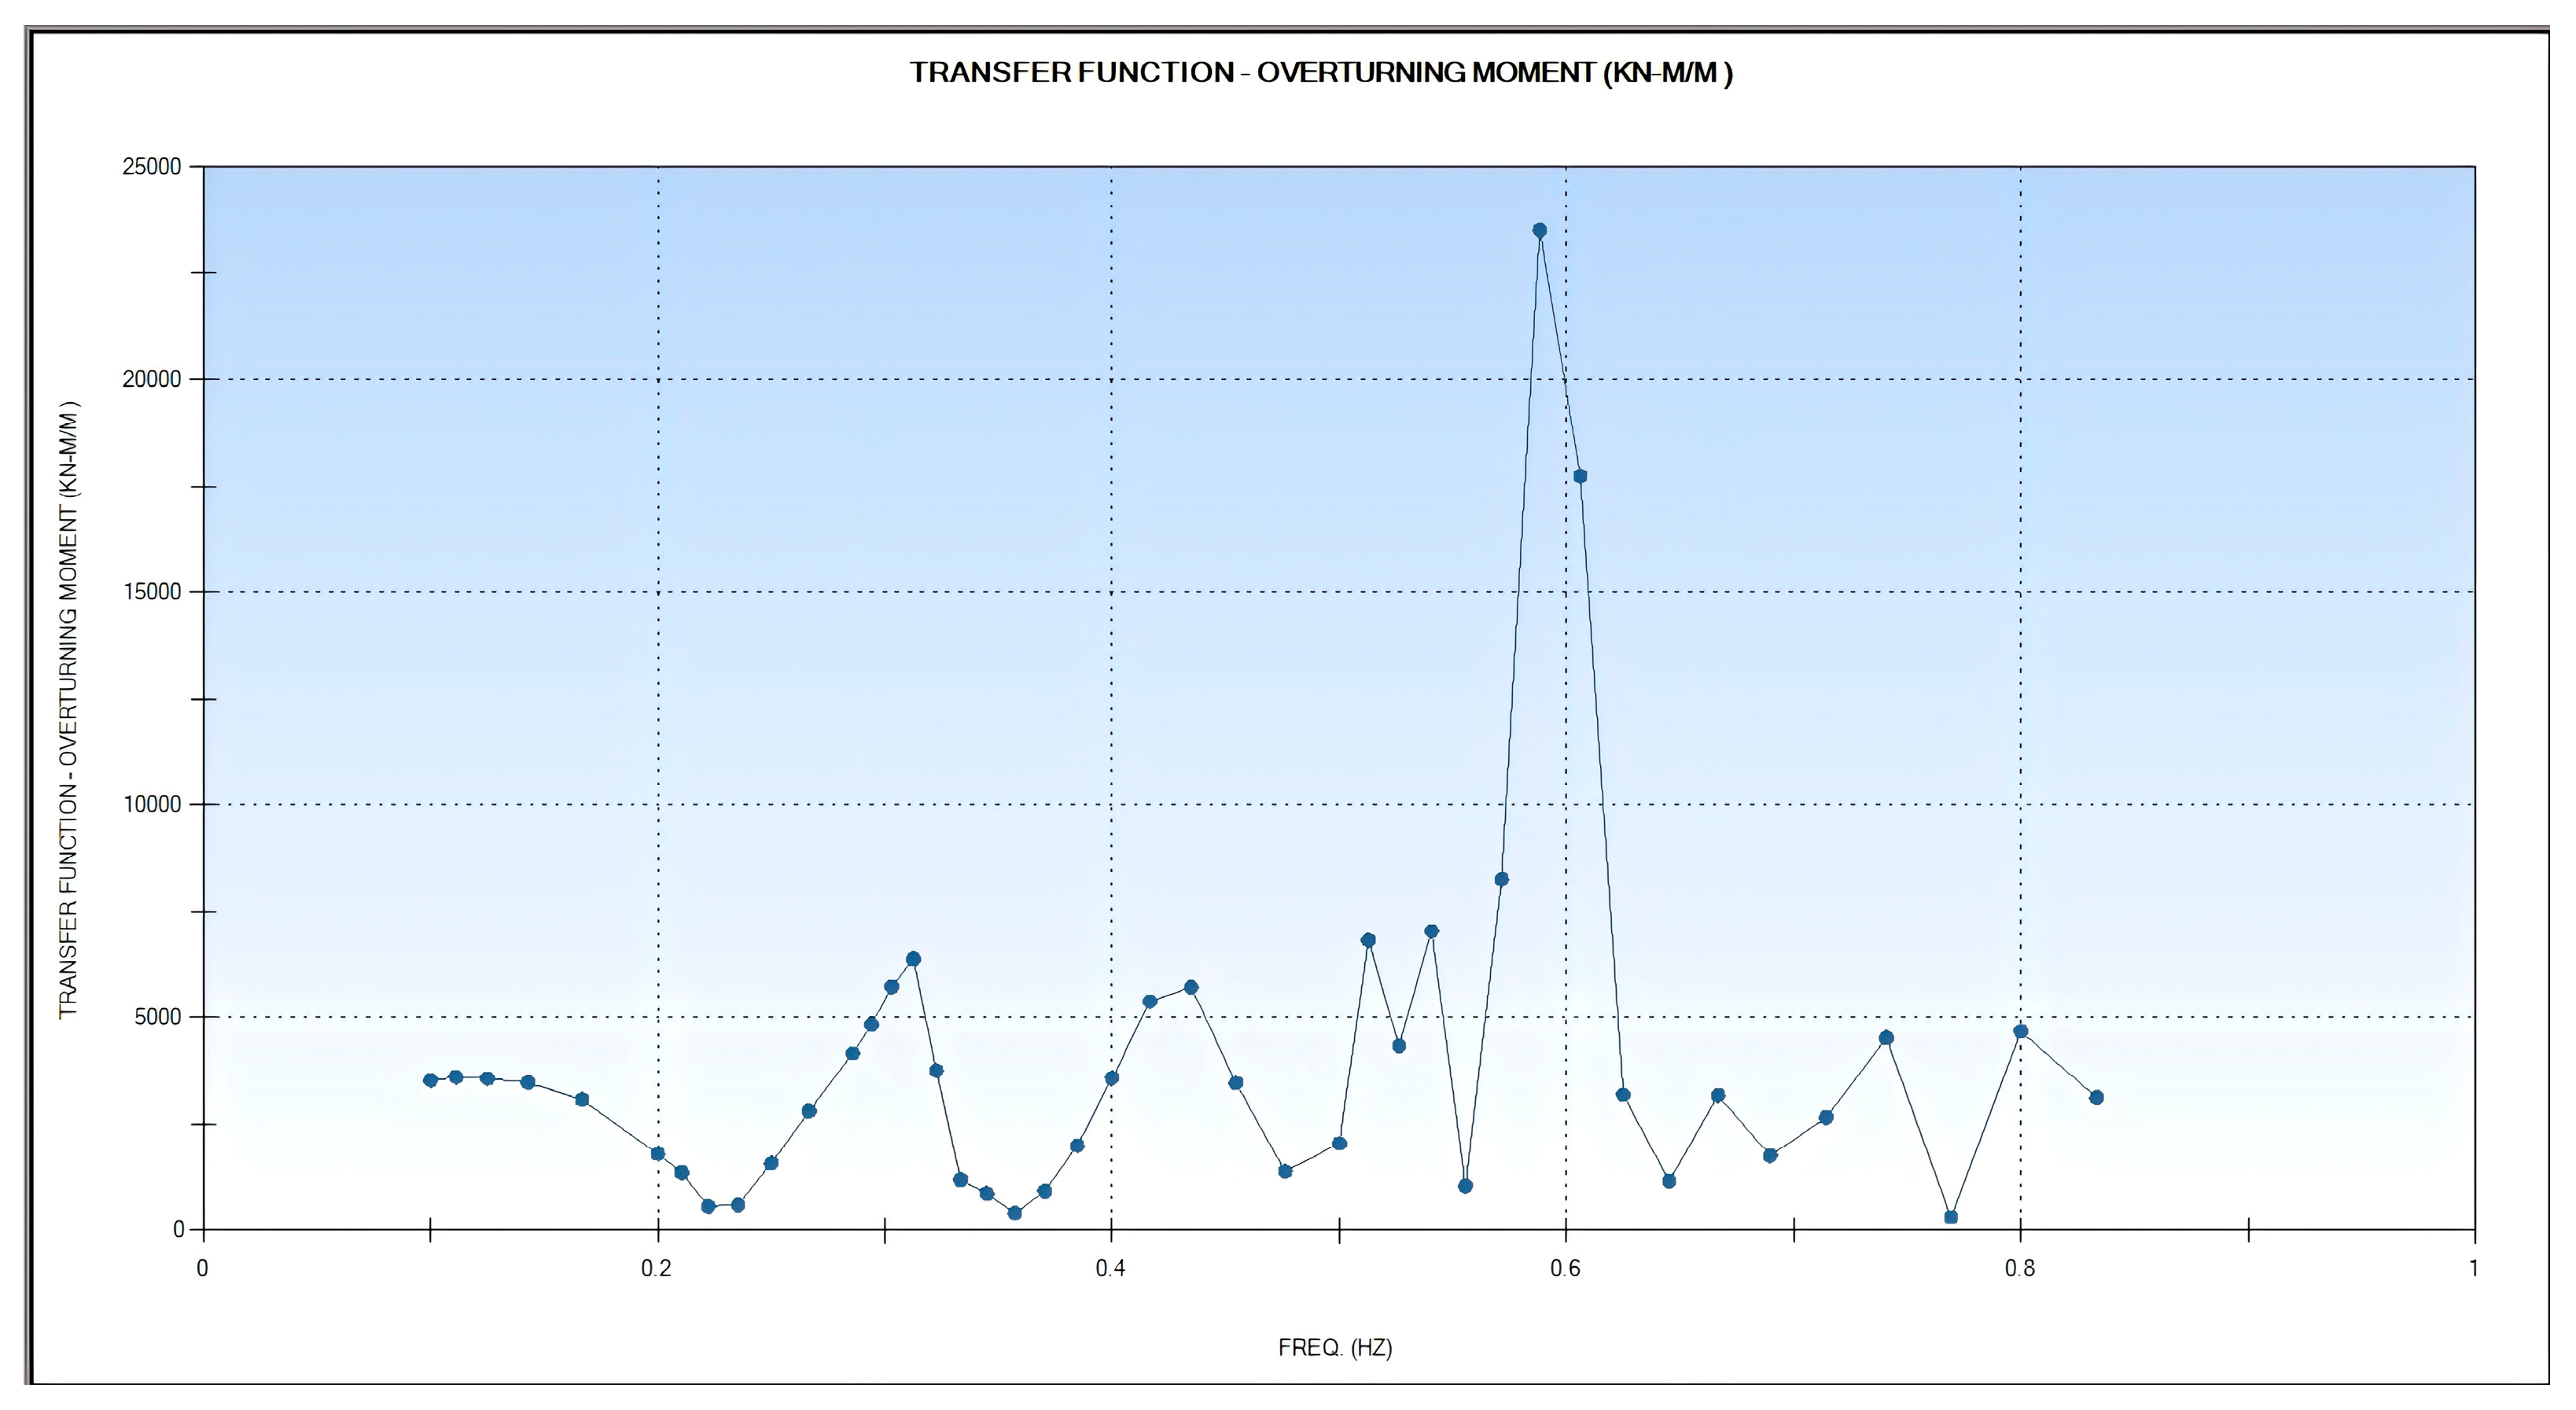
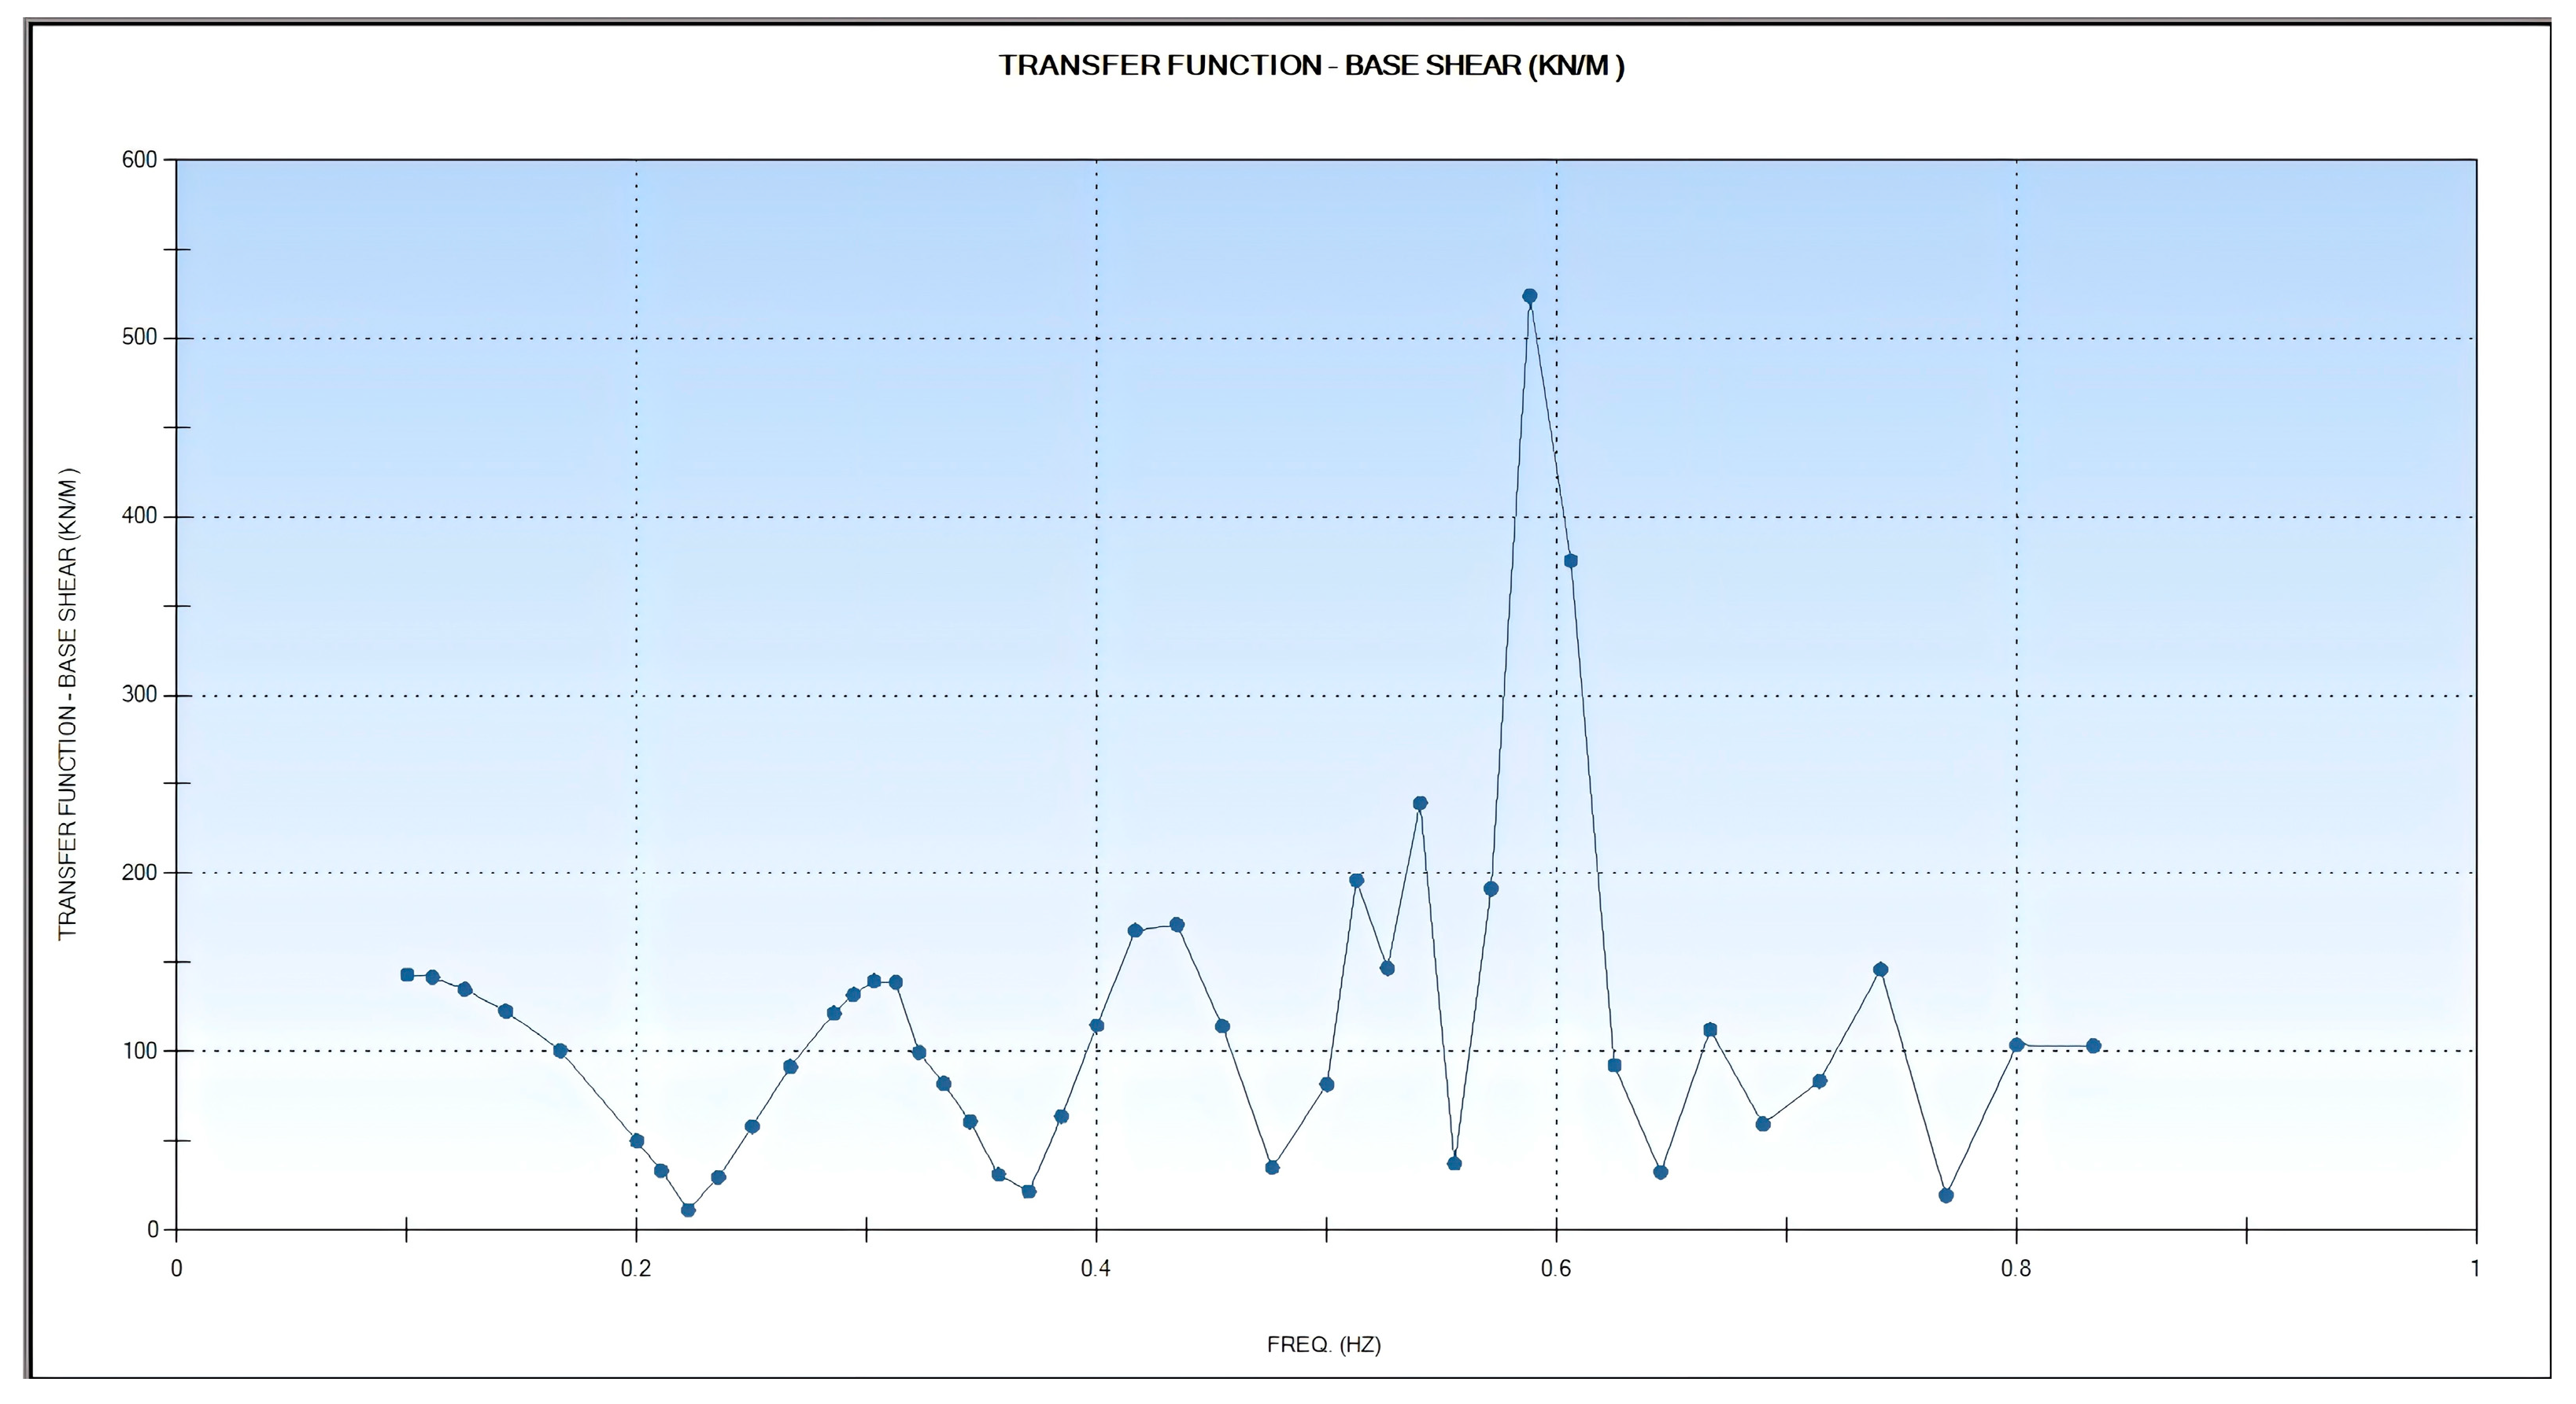
3.4.2. Calculation of Transfer Function

In SACS, the calculation of the transfer function is of great significance, especially in the dynamic and fatigue analysis of marine engineering structures. It is mainly used for dynamic response analysis, fatigue analysis, frequency response characteristic analysis, and optimization of the structure design.
In this paper, the transfer function is mainly used for fatigue analysis of the support structure to calculate the stress duration of the structure under dynamic load. By combining the spectrum of external loads with the transfer function, the stress response of various parts of the structure can be obtained, which allows the prediction of fatigue life. To ensure the accuracy of the final result, the transfer function needs to be accurately solved. Taking the wave calculation in the 0° direction as an example, the overturning moment and base shear force are as shown in Figure 23 and Figure 24 below.

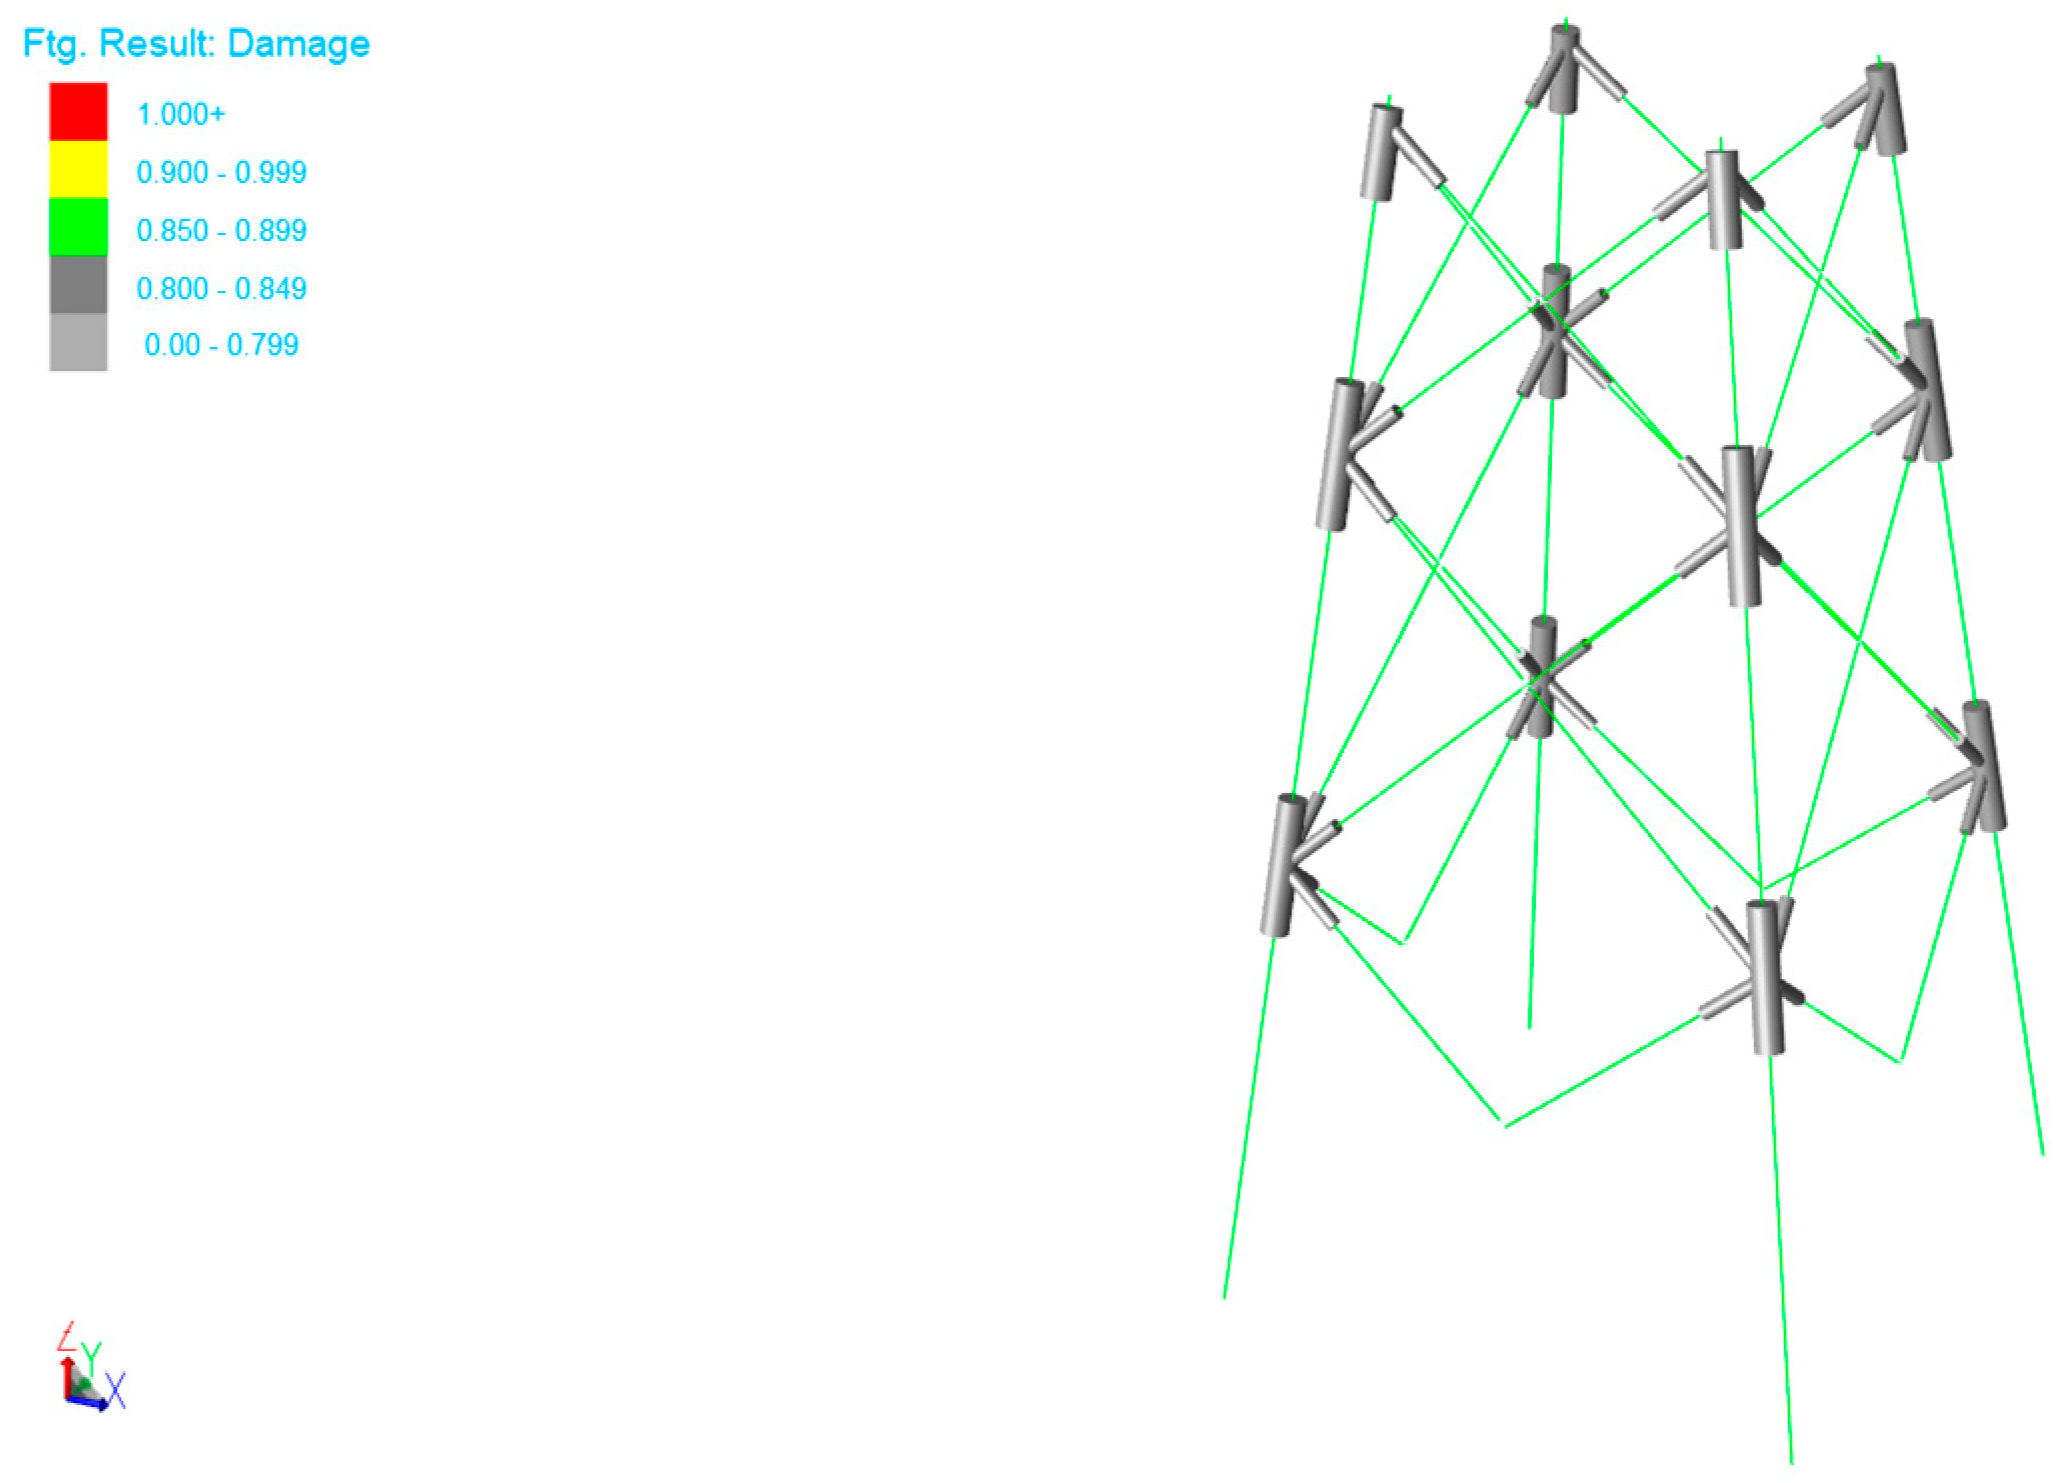
3.4.3. Fatigue Analysis Results

The damage value of the wave’s spectral fatigue is shown in Table 21 below. From Table 18 and Figure 25, the fatigue damage value of the structure foundation is within the allowable range. Since the damage value of node 303L was greater than that of the other nodes, this node should be considered in the later structural optimization. From Table 21, it can be found that the damage values for the middle-level nodes 301L, 302L, 303L, and 304L of the support structure are generally larger than those of the other nodes, as this area is vulnerable to the influence of ocean waves. In the later structural optimization, the nodes within this layer should be prioritized.

4. Conclusions

In order to explore a gravitational energy storage system suitable for the ocean and verify the rationality and safety of its support structure, SACS is used for static analysis, modal analysis, dynamic response analysis, and fatigue analysis of the numerical model. The following conclusions are reached:
  • In the static analysis, all structural UC values meet the requirements. Among them, the member bars with larger UC values are mainly those that connect the main conductor pipe and the main cylinder.
  • In the modal analysis, the first- and second-order natural frequencies of the support structure are not within the hazard range and meet the safety requirements.
  • In the analysis of random wave dynamic response, it is concluded that the first- and fourth-order modes are the greatest contributor to the dynamic response.
  • In the fatigue analysis, all nodes are within a reasonable range, in which the damage values of 301L, 302L, 303L, and 304L are generally greater than those of other nodes.
This paper presents a preliminary discussion on the new gravitational energy storage support structure based on the foundation of marine wind power jackets, and verifies the feasibility of the structure, providing ideas for the stability analysis of the foundation of the marine gravitational energy storage jacket. However, comprehensive analysis of other factors such as wind and weight position is lacking. Later, we will conduct a comprehensive analysis of the system, add the superposition analysis of wind and wave fatigue damage, and comprehensively analyze the impact of different motion states on the structural stability of the system.

Author Contributions

Conceptualization, D.H. and Z.W.; methodology, Z.W. and Y.C.; software, Z.W. and Y.C.; validation, F.Y., D.H., H.H. and Z.W.; data curation, Z.W.; writing—original draft preparation, Z.W; writing—review and editing, D.H.; supervision, D.H.; funding acquisition, W.L. and D.H. All authors have read and agreed to the published version of the manuscript.

Funding

This work is supported by the Science and Technology Project of Jiangsu Province, (grant no. BE2020391).

Institutional Review Board Statement

Not applicable.

Informed Consent Statement

Not applicable.

Data Availability Statement

The data presented in this study are available upon request from the corresponding author.

Conflicts of Interest

Author Wenhao Li was employed by the company Lianyungang Port Group Co., Ltd. The remaining authors declare that the research was conducted in the absence of any commercial or financial relationships that could be construed as a potential conflict of interest.

References

  1. Wang, Z.; Carriveau, R.; Ting, D.S.K.; Xiong, W.; Wang, Z. A review of marine renewable energy storage. Int. J. Energy Res. 2019, 43, 6108–6150. [Google Scholar] [CrossRef]
  2. Amir, M.; Deshmukh, R.G.; Khalid, H.M.; Said, Z.; Raza, A.; Muyeen, S.; Nizami, A.-S.; Elavarasan, R.M.; Saidur, R.; Sopian, K. Energy storage technologies: An integrated survey of developments, global economical/environmental effects, optimal scheduling model, and sustainable adaption policies. J. Energy Storage 2023, 72, 108694. [Google Scholar] [CrossRef]
  3. Rekioua, D. Energy storage systems for photovoltaic and wind systems: A review. Energies 2023, 16, 3893. [Google Scholar] [CrossRef]
  4. Berrada, A. Financial and economic modeling of large-scale gravity energy storage system. Renew. Energy 2022, 192, 405–419. [Google Scholar] [CrossRef]
  5. Tong, W.; Lu, Z.; Sun, J.; Zhao, G.; Han, M.; Xu, J. Solid gravity energy storage technology: Classification and comparison. Energy Rep. 2022, 8, 926–934. [Google Scholar] [CrossRef]
  6. Tong, W.; Lu, Z.; Chen, W.; Han, M.; Zhao, G.; Wang, X.; Deng, Z. Solid gravity energy storage: A review. J. Energy Storage 2022, 53, 105226. [Google Scholar] [CrossRef]
  7. Botha, C.; Kamper, M. Capability study of dry gravity energy storage. J. Energy Storage 2019, 23, 159–174. [Google Scholar] [CrossRef]
  8. Du, Y.M.; Kong, D.Q.; Wang, S.L.; Zhu, B. Fatigue analysis of jacket foundations for offshore wind turbines. Rock Soil Mech. 2024, 44, 8. [Google Scholar]
  9. Zhu, R.H.; Tian, Z.; Long, Z. Jacket Foundation Design for 200 MW offshore Demonstration Wind Farm Project of Zhuhai Guishan. Wind 2013, 9, 94–98. [Google Scholar]
  10. Lavassani, S.H.H.; Gavgani, S.A.M.; Doroudi, R. Optimal control of jacket platforms vibrations under the simultaneous effect of waves and earthquakes considering fluid-structure interaction. Ocean Eng. 2023, 280, 114593. [Google Scholar] [CrossRef]
  11. Othman, N.A.; Mohd, M.H. Response of the offshore jacket platform at its ultimate strength under operating and extreme loads: A Malaysian waters case study. Ships Offshore Struct. 2024, 1–22. [Google Scholar] [CrossRef]
  12. Sui, H.; Zhang, J.; Liu, F.; Ma, Z.; Gu, C.; Qiu, H.; Wu, R.; Song, H.; Song, H. Dynamic response analysis and vibration reduction of a 10-MW jacket offshore wind turbines under the combined wind and ice loads. Ocean Eng. 2024, 303, 117553. [Google Scholar] [CrossRef]
  13. Hunt, J.D.; Zakeri, B.; Jurasz, J.; Tong, W.; Dąbek, P.B.; Brandão, R.; Patro, E.R.; Đurin, B.; Filho, W.L.; Wada, Y.; et al. Underground gravity energy storage: A solution for long-term energy storage. Energies 2023, 16, 825. [Google Scholar] [CrossRef]
  14. Tong, W.; Lu, Z.; Zhao, H.; Han, M.; Zhao, G.; Hunt, J.D. The structure and control strategies of hybrid solid gravity energy storage system. J. Energy Storage 2023, 67, 107570. [Google Scholar] [CrossRef]
  15. Hou, H.; Xu, T.; Wu, X.; Wang, H.; Tang, A.; Chen, Y. Optimal capacity configuration of the wind-photovoltaic-storage hybrid power system based on gravity energy storage system. Appl. Energy 2020, 271, 115052. [Google Scholar] [CrossRef]
  16. Ameur, A.; Berrada, A.; Emrani, A. Dynamic forecasting model of a hybrid photovoltaic/gravity energy storage system for residential applications. Energy Build. 2022, 271, 112325. [Google Scholar] [CrossRef]
  17. Botha, C.D.; Kamper, M.J. Linear electric machine-based gravity energy storage for wind farm integration. In Proceedings of the 2020 International SAUPEC/RobMech/PRASA Conference, Cape Town, South Africa, 29–31 January 2020; pp. 1–6. [Google Scholar]
  18. Yi, C.; Wang, Z.; Zhang, G.; Su, Y. Design and Analysis of a Novel offshore Gravity Energy Storage Support Structure Based Wind Power Jacket Foundation. Smart Syst. Green Energy 2024, 6, 1–9. [Google Scholar]
  19. Bauduin, C.; Bakker, K.; Frank, R. Use of finite element methods in geotechnical ultimate limit state design. In Proceedings of the 16th International Conference on Soil Mechanics and Geotechnical Engineering, Osaka, Japan, 12–16 September 2005; pp. 2775–2779. [Google Scholar]
  20. Wang, S.; Moan, T. Methodology of load effect analysis and ultimate limit state design of semi-submersible hulls of floating wind turbines: With a focus on floater column design. Mar. Struct. 2024, 93, 103526. [Google Scholar] [CrossRef]
  21. Saadian, R.; Taheri, A. Fatigue damage analysis of an existing fixed offshore platform using spectral method for life extension. J. Mar. Sci. Technol. 2018, 23, 877–887. [Google Scholar] [CrossRef]
  22. Wang, N.; Liang, R.; Li, L.; Liu, Z.; Zhao, Z. Research on complex multimodal vibration characteristics of offshore platform. Rev. Adv. Mater. Sci. 2023, 62, 20220311. [Google Scholar] [CrossRef]
  23. Józefiak, K.; Zbiciak, A.; Maślakowski, M.; Piotrowski, T. Numerical modelling and bearing capacity analysis of pile foundation. Procedia Eng. 2015, 111, 356–363. [Google Scholar] [CrossRef]
  24. Kuwajima, K.; Hyodo, M.; Hyde, A.F. Pile bearing capacity factors and soil crushabiity. J. Geotech. Geoenvironmental Eng. 2009, 135, 901–913. [Google Scholar] [CrossRef]
  25. FD003-2007; Design Regulations on Subgrade and Foundation for Wind Turbine Generator System. China Renewable Energy Engineering Institute: Beijing, China, 2007.
  26. Ren, J.; Sun, X. Prediction of ultimate bearing capacity of pile foundation based on two optimization algorithm models. Buildings 2023, 13, 1242. [Google Scholar] [CrossRef]
  27. Moarefzadeh, M.; Melchers, R. Nonlinear wave theory in reliability analysis of offshore structures. Probabilistic Eng. Mech. 2006, 21, 99–111. [Google Scholar] [CrossRef]
  28. DNV-OS-J101; Design of Offshore WindTurbine Structures. Det Norske Veritas AS: Oslo, Norway, 2013.
  29. Qu, K.; Wen, B.; Ren, X.; Kraatz, S.; Sun, W.; Deng, B.; Jiang, C. Numerical investigation on hydrodynamic load of coastal bridge deck under joint action of solitary wave and wind. Ocean Eng. 2020, 217, 108037. [Google Scholar] [CrossRef]
  30. Nessim, M.; Hong, H.; Swail, V.; Henderson, C. Design criteria for offshore structures under combined wind and wave loading. J. Offshore Mech. Arct. Eng. 1995, 117, 1–11. [Google Scholar] [CrossRef]
  31. Taira, K.; Brunton, S.L.; Dawson, S.T.; Rowley, C.W.; Colonius, T.; McKeon, B.J.; Schmidt, O.T.; Gordeyev, S.; Theofilis, V.; Ukeiley, L.S. Modal analysis of fluid flows: An overview. AIAA J. 2017, 55, 4013–4041. [Google Scholar] [CrossRef]
  32. Ti, Z.; Zhang, M.; Li, Y.; Wei, K. Numerical study on the stochastic response of a long-span sea-crossing bridge subjected to extreme nonlinear wave loads. Eng. Struct. 2019, 196, 109287. [Google Scholar] [CrossRef]
  33. Chao, Z.; Hao, H.; Bi, K.; Yan, X. Dynamic amplification factors for a system with multiple-degrees-of-freedom. Earthq. Eng. Eng. 2020, 19, 363–375. [Google Scholar] [CrossRef]
Figure 1. Diagram of the basic principle of the new gravitational energy storage system.
Jmse 12 02196 g001
Figure 2. Schematic diagram of the system scheme.
Jmse 12 02196 g002
Figure 3. Basic structural composition of the new gravitational energy storage system.
Jmse 12 02196 g003
Figure 4. Dimensions of the support structure.
Jmse 12 02196 g004
Figure 5. Basic numerical calculation model of the support structure.
Jmse 12 02196 g005
Figure 6. Member bars in the main part and node numbers.
Jmse 12 02196 g006
Figure 7. Member bars of working platform and node numbers.
Jmse 12 02196 g007
Figure 8. Schematic diagram of the load arrangement of energy storage system equipment.
Jmse 12 02196 g008
Figure 9. Direction of action of environmental load.
Jmse 12 02196 g009
Figure 10. The first four modes of the support structure.
Jmse 12 02196 g010
Figure 11. Profile of random wave.
Jmse 12 02196 g011
Figure 12. P-M wave spectrum.
Jmse 12 02196 g012
Figure 13. Comparison of dynamic and static analysis of overturning moment.
Jmse 12 02196 g013
Figure 14. Comparison of dynamic and static analysis of base shear force.
Jmse 12 02196 g014
Figure 15. Displacement diagram of modes under random waves in 0° direction.
Jmse 12 02196 g015
Figure 16. Velocity of modes under random waves in 0° direction.
Jmse 12 02196 g016
Figure 17. Generalized force of modes under random waves in 0° direction.
Jmse 12 02196 g017
Figure 18. Displacement diagram of modes under random waves in 90° direction.
Jmse 12 02196 g018
Figure 19. Velocity diagram of modes under random waves in 90° direction.
Jmse 12 02196 g019
Figure 20. Generalized force of modes under random waves in 90° direction.
Jmse 12 02196 g020
Figure 21. Data of SACS Sea conditions.
Jmse 12 02196 g021
Figure 22. SACS input files of waves.
Jmse 12 02196 g022
Figure 23. Transfer function of the overturning bending moment in the zero-degree direction.
Jmse 12 02196 g023
Figure 24. Transfer function of the base shear force in the zero-degree direction.
Jmse 12 02196 g024
Figure 25. Cloud map of wave fatigue damage spectrum.
Jmse 12 02196 g025
Table 1. Economic performance of different energy storage devices.
GESPHESLi-IonNaS
IRR14.16%13.46%16.27%16.40%
Payback Period (year)6844
Table 2. Soil layer distribution and their physical and mechanical parameters.
Soil Layer NumberNameLayer
Thickness
(m)
Effective
Unit Weight
(kN/m3)
Cu
Value
(kPa)
Mucky clay5.016.535
Silty clay9.517. 370
Sandy silt7.217. 285
Clay11.517.445
Viscous silt11.217.650
Silt13.318.2-
Viscous silt12.518.580
Clay13.818.7120
Table 3. Environmental working condition load.
Water LevelRecurrence
Interval (Years)
Wave Height H
(m)
Cycle T
(s)
Water Height Hw
(m)
Average Wind Speed (m/s)
Extremely high water level5013.712.742.0837.5
510.311.642.0828.4
Extremely low water level5013.112.440.9837.5
510.111.340.9828.4
Designed high water level15.910.638.0220.1
Designed low water level15.510.437.9020.1
Table 4. The main parameters of the wind turbine.
Wind Turbine ParametersValue
Wind turbine gradeIEC II A
Rated power5 MW
Blade diameter110 m
Total weight of rotor and cabin170 t
The position of the overall center of gravity of the rotors and cabin(1.1 m, 0, 1.8 m)
1P, 3P frequency range0.109~0.266 Hz, 0.356~0.798 Hz
Table 5. Parameters of the wind turbine tower at each section.
Segment NameTop Diameter
(m)
Bottom Diameter
(m)
Wall Thickness
(mm)
Height
(m)
Mass of Flange Accessories
(kg)
Upper section3.073.92032.14865.4
Middle section3.94.52830.87468.6
Lower section4.54.55114.918,708.7
Table 6. Peak load of the upper wind turbine.
Load ConditionsFx (kN)Fy (kN)Fz (kN)Mx (kN·m)My (kN·m)Mz (kN·m)
Extreme conditions−935−72−45403280−86,100−1145
Normal operating conditions510−22−4640413045,410472
Table 7. Allowable values of foundation deformation.
Wheel Height (m)Allowed Settlement ValueAllowed Tilt Rate tan θ
High-Compression ClayLow- and Medium-Compression Clay and Sandy Soil
Hl < 603001000.006
60 < Hl ≤ 802000.005
80 < Hl ≤ 1001500.004
100 > Hl1000.003
Table 8. Selection of wave theory.
Water LevelRecurrence Interval (Years)Wave Height H
(m)
Cycle T
(s)
Water Height Hw
(m)
H g t 2 H w g T 2
Extremely high water level5013.712.742.080.00870.026
510.311.642.080.00780.032
Extremely low water level5013.112.440.980.00870.027
510.111.340.980.00810.032
Designed high water level15.910.638.020.00540.035
Designed low water level15.510.437.900.00520.036
Table 9. Definition of load combination operating conditions.
Designed Working
Conditions
Load
Combinations
Wind
Turbine Load
Types of Environmental Loads and Corresponding
Recurrence Intervals
WindWaveCurrentWater Level
Extreme working conditionsE_1Extreme load5055Extremely high water level
E_25055Extremely low water level
E_35505Extremely high water level
E_45505Extremely low water level
E_55550Extremely high water level
E_65550Extremely low water level
Normal
operating conditions
N_1Normal operating load111Designed water level
N_2111Designed water level
Table 10. Relevant coefficients of load combination.
Designed Working
Conditions
Partial Coefficient of LoadCombination Value
Coefficient
Structural Importance CoefficientPile Foundation Resistance
Coefficient
Fixed LoadVariable LoadEnvironmental Load
Extreme working conditions1.0/0.91.0/0.91.350.71.11.25
Normal operating conditions1.01.01.01.01.01.5
Table 11. The maximum UC value of the strength of structural member bar.
Member
Bar Group Number
Member
Bars
Working
Conditions
UC ValueMember
Bar Group Number
Member BarsWorking
Conditions
UC ValueAllowable Value
BR1701L-901LE_4 (180°)0.71X32304L-303XE_4 (0°)0.241
FL901L-705LE_4 (0°)0.31LG1103L-203LE_4 (135°)0.61
MB620-605LE_4 (180°)0.81LG2203L-303LE_4 (135°)0.49
HP1705L-704LE_4 (180°)0.47LG3301L-401LE_4 (180°)0.46
HP2701L-706E_4 (180°)0.26LG4401L-501LE_4 (180°)0.35
X11101L-101XE_4 (180°)0.22LG5605L-105LE_4 (180°)0.54
X12104L-103XE_4 (0°)0.37LG6603L-703LE_4 (135°)0.32
X21201L-201XE_4 (0°)0.2PL1103L-P3E_4 (135°)0.17
X22204L-203XE_4 (0°)0.34PL2105L-P5E_4 (180°)0.07
X31301L-301XE_4 (180°)0.14
Table 12. Maximum UC values of node strength and structure.
Node NumberStrength UC ValueStructure UC ValueWorking
Conditions
Node NumberStrength UC ValueStructure UC ValueWorking
Conditions
Allowable Value
101L0.2890.414E_4 (180°)703L0.4870.590E_4 (180°)1
102L0.1040.414E_4 (0°)704L0.3130.590E_4 (45°)
103L0.3010.414E_4 (90°)7010.2160.811E_4 (180°)
104L0.1080.414E_4 (45°)7020.1530.811E_4 (90°)
201L0.1260.690E_4 (180°)7030.1560.811E_4 (180°)
202L0.1590.690E_4 (0°)7040.1590.811E_4 (180°)
203L0.1670.690E_4 (90°)7050.1460.811E_4 (90°)
204L0.1660.690E_4 (0°)7060.2560.811E_4 (135°)
301L0.2340.674E_4 (0°)7070.2260.811E_4 (45°)
302L0.1640.674E_4 (45°)7080.2530.811E_4 (180°)
303L0.2330.674E_4 (0°)101X0.1060.566E_4 (180°)
304L0.1460.674E_4 (45°)102X0.0870.566E_4 (180°)
401L0.3290.689E_4 (45°)103X0.0980.566E_4 (90°)
402L0.2610.689E_4 (180°)104X0.0700.566E_4 (135°)
403L0.2690.689E_4 (0°)201X0.1430.572E_4 (180°)
404L0.2610.689E_4 (45°)202X0.0950.572E_4 (45°)
501L0.4240.299E_4 (180°)203X0.1470.572E_4 (90°)
502L0.1280.299E_4 (180°)204X0.1120.572E_4 (180°)
503L0.3910.299E_4 (180°)301X0.1260.567E_4 (180°)
504L0.1320.299E_4 (135°)302X0.0830.567E_4 (135°)
701L0.5090.590E_4 (180°)303X0.1370.567E_4 (0°)
702L0.2770.590E_4 (0°)304X0.1310.567E_4 (0°)
Table 13. Uplift bearing capacity ratio of pile foundation.
Pile Head
Node Number
Maximum
Tensile Load of Pile Foundation (kN)
Limit Uplift Bearing
Capacity of Pile Foundation (kN)
Working
Conditions
Maximum Uplift Bearing Capacity RatioAllowable Value
P1017,775.5//1
P2158117,775.5E_4 (135°)0.11
P3017,775.5//
P4968.317,775.5E_4 (180°)0.07
P5014,704.9//
Table 14. Compression bearing capacity ratio of pile foundation.
Pile Head Node NumberMaximum Compression Load of Pile Foundation (kN)Limit Compression Bearing Capacity of Pile Foundation (kN)Working
Conditions
Maximum Uplift Bearing Capacity RatioAllowable Value
P18948.616,322.4E_4 (180°)0.691
P23277.416,322.4E_4 (0°)0.25
P39290.516,322.4E_4 (135°)0.71
P43780.016,322.4E_4 (45°)0.29
P53568.013,526.7E_4 (90°)0.33
Table 15. Calibration of the maximum deformation of the pile foundation.
Pile Head Node
Number
Maximum
Lateral
Displacement on the Mud Surface (mm)
Working ConditionsMaximum
Vertical Settlement (mm)
Working ConditionsMaximum
Angle on the Mud Surface (°)
Working Conditions
P12.6N_2 (180°)3.2N_2 (180°)0.29N_2 (180°)
P26.3N_2 (0°)6.0N_2 (0°)0.45N_2 (0°)
P32.6N_2 (135°)3.2N_2 (135°)0.3N_2 (90°)
P46.0N_2 (0°)6.0N_2 (45°)0.41N_2 (0°)
P50.2N_2 (0°)4.4N_2 (0°)0.05N_2 (0°)
Table 16. The first ten natural frequencies of the structure.
ModalFrequency (Hz)Cycle (s)
10.3263.323
20.3272.872
31.2960.772
41.2960.771
52.2010.454
62.3390.428
72.3680.422
82.3930.418
92.4540.408
102.9020.345
Table 17. Selected parameters of random waves.
ParametersSelected Parameters
Cycle12 s
Significant wave height10 m
Wave iteration time1000 s
Analysis time step size1 s
Structural damping3.0%
Table 18. Numerical simulation results of power amplification coefficient.
Calculation ItemsOverturning Moment (m-kN)Base Shear (kN)
DirectionXYXY
Static method112.8264283,279.97111.2588.4123
Dynamic method174.8481289,771.67151.91510.2785
DAF1.5501.0231.0061.222
Table 19. Wave direction and probability (%).
Wave Direction30°60°90°120°150°180°
Probability15121311201019
Table 20. Joint probability distribution of wave height and wave periods (%).
HS (m)0–11–33–6
TP (s)
0–1.515.010.010.0
1.5–310.019.011.0
3–55.08.05.0
5–82.03.02.0
Table 21. Damage values of wave’s spectrum fatigue.
Node NumberMaximum Damage ValueMinimum Damage Value
404L0.0760.036
403L0.0820.034
402L0.0760.035
401L0.0820.044
304L0.4840.038
303L0.7970.040
302L0.7950.042
301L0.6240.043
204L0.0290.155 × 10−2
203L0.0360.535 × 10−3
202L0.0260.168 × 10−2
201L0.0330.815 × 10−3
Disclaimer/Publisher’s Note: The statements, opinions and data contained in all publications are solely those of the individual author(s) and contributor(s) and not of MDPI and/or the editor(s). MDPI and/or the editor(s) disclaim responsibility for any injury to people or property resulting from any ideas, methods, instructions or products referred to in the content.

