Article

Hydrodynamic Performance Investigations of OWC and Hybrid System: Geometry of OWC and Rectangular Submerged Breakwater

1
School of Ocean Engineering and Technology, Sun Yat-sen University, Zhuhai 519082, China
2
Engineering Center, CIMC Raffles Offshore Ltd., Yantai 264012, China
3
Southern Marine Science and Engineering Guangdong Laboratory (Zhuhai), Zhuhai 519082, China
*
Authors to whom correspondence should be addressed.
J. Mar. Sci. Eng. 2024, 12(12), 2191; https://doi.org/10.3390/jmse12122191
Submission received: 22 October 2024 / Revised: 15 November 2024 / Accepted: 28 November 2024 / Published: 30 November 2024
(This article belongs to the Section Ocean Engineering)

Abstract

:
Due to its simplicity and high reliability, the Oscillating Water Column (OWC) has been a prominent focus of research. This study investigates the impact of OWC geometry on hydrodynamic performance by analyzing the effects of draft, chamber width, and Power Take Off (PTO) damping on energy conversion efficiency, reflection coefficient, transmission coefficient, and dissipation coefficient. The motion of the water column under different PTO damping conditions is analyzed. In addition, the hydrodynamic performance of the submerged breakwater-OWC hybrid system is studied and compared with that of a standalone OWC. The results show that a higher opening height improves the energy conversion efficiency of the OWC under medium-to-long waves. There is an optimal draft for the OWC to maximize the energy conversion efficiency for different wave periods. Meanwhile, the optimal draft increases with the wave period. Increasing PTO damping does not change the resonance period of the OWC, while the free surface elevation inside the chamber reduces. Within a range of periods around the maximum inclination, multi-point measurements of the wave elevation in the chamber are necessary to reduce measurement errors caused by the spatial non-uniformity of the water column. The submerged breakwater-OWC hybrid system exhibits a higher energy conversion efficiency under medium-to-long waves compared to a standalone OWC, and there is an optimal breakwater length.

1. Introduction

Ocean energy, such as tidal energy, wave energy, and ocean wind energy, has always been a prominent renewable energy subject. Among these, wave energy has been widely studied due to its high energy flux density and extensive distribution [1]. In a previous study, a variety of Wave Energy Conversion (WEC) devices were proposed. OWC, a type of WEC, has the advantages of simplicity and reliability [2,3,4,5]. However, the OWC undergoes multiple energy conversions during operation, resulting in relatively low power generation. Therefore, enhancing the energy conversion efficiency of OWCs is a key focus of current research.
Many studies on the hydrodynamic performance of OWCs have focused on optimizing the geometric and wave parameters of OWCs to improve their energy conversion efficiency [6]. Chen et al. [7] analyzed the relationship between the optimal chamber width and the wall draft of an OWC based on the Computational Fluid Dynamics (CFD) method and proposed an exponential fitting formula to solve the optimal chamber width and wall draft. Mahmoud et al. [8] numerically investigated the effect of front wall shape on OWC-wave energy converter performance. Anıl et al. [9] experimentally investigated the effect of the height difference between the front and rear plates of a device and the opening ratio on the energy conversion efficiency. Furthermore, their study divided the water column movement inside the chamber into ‘piston mode’ and ‘sloshing mode’. Some studies have also focused on the hydrodynamic performance of the integrated system of an OWC with other devices. Chen et al. [10] added plates to the bottom of an OWC and studied the variation in the immersed depth and plate length on the performance of a plate-integrated system using OpenFOAM2106. Ning et al. [11] proposed a dual-chamber OWC with a shared orifice and investigated the variation of the surface elevation and the water column volume. Mirzaei et al. [12] investigated the effect of the different shapes of the bottom on the conversion efficiency of OWC and found that the efficiency of the OWC decreases with an increase in the slope and a decrease in the opening.
Other studies have focused on the effects of different waves and environments on the hydrodynamic performance of OWCs. Masoud et al. [13] explored the impact of wave steepness on the hydrodynamic efficiency of an OWC. Mora et al. [14] designed a tapered and slender wave collector according to power-law distribution, which can improve the performance of the OWC. Rezanejad et al. [15] investigated the effect of the distance between the barriers and the length of the barriers on the hydrodynamic of the OWC.
The above investigations revealed that the wave period, device width, opening rate, and underwater geometry are essential parameters that affect the device’s energy conversion efficiency. These parameters are linked and influence each other. Data from multiple models are necessary for analysis to determine the relationship between the effects of different parameters on the performance of an OWC.
In addition to studying the hydrodynamic performance of OWC, a hybrid system combining OWC with other marine structures, such as breakwaters and floating platforms, has also received considerable attention [4]. Zheng et al. [16] integrated the OWC into coastal structures and developed a theoretical model based on the linear potential flow theory to study the hydrodynamic performance of the hybrid system. Boccotti et al. [17] demonstrated through experiments that the U-shaped OWC-breakwater hybrid system performs better than traditional breakwaters. Wang et al. [18] investigated the effect of the gap distance between the OWC and the breakwater on hydrodynamic performance, finding that the output power is optimized when the gap matches the wavelength. Han et al. [19] proposed a multi-layer breakwater system that integrates an OWC with a sloped breakwater. Rivas et al. found that [20,21] integrating an OWC with a vertical coastal structure can enhance the effective frequency bandwidth. At present, the formation of a hybrid system by integrating OWCs with marine structures can effectively enhance the hydrodynamic performance of OWCs. However, the study of flow field evolution and interaction mechanisms between OWCs and marine structures remains insufficient. This paper will further analyze the hydrodynamic performance of OWC hybrid systems.
The primary objective of the present investigation is to explore the influence of the OWC geometric parameters and analyze the effect of the size of the submerged breakwater on the hydrodynamic performance of the OWC-breakwater hybrid system. To this end, this study investigates the effects of the OWC draft, opening height, and chamber width on the energy conversion efficiency, reflection coefficient, transmission coefficient, and dissipation coefficient. Additionally, the characteristics of OWC-wave interactions are analyzed through the flow field. Finally, a submerged breakwater-OWC hybrid system is proposed to analyze the impact of different breakwater lengths on the hydrodynamic performance of the OWC. A flow chart of the investigation is shown in Figure 1.

2. Numerical Model

2.1. Governing Equation

Ahmed et al. [22] find that air compressibility effects can be neglected without significant differences in the device performance obtained with compressible air in a small-scale model. Therefore, this study assumes that the fluid is incompressible.
u = 0
ρ u / t + ( ρ u u T ) = P + ( μ u + u T ) + ρ g + ρ f
where u is the fluid velocity vector, = / x , / y , / z denotes the differential operator, P is the total pressure, μ denotes the dynamic viscosity of the fluid, ρ denotes the fluid density, g is the gravity acceleration, and f is the volume force.
The wave generation is a two-phase flow simulation. Therefore, the free surface can be obtained using the volume of fraction (VOF) method [23].
α / t + u α = 0
ρ = α ρ w + ( 1 α ) ρ a
μ = α μ w + ( 1 α ) μ a
where the subscripts w and a identify water and air, and α is the phase fraction.

2.2. Wave Generation and Absorption

The solver’s wave generation and absorption functions are performed using the waves2Foam toolbox. The target wave is generated at the inlet boundary of the computational domain by inflowing a specified fluid velocity component and water surface height according to the Stokes wave theory. In addition, a relaxation zone is provided to prevent the reflected waves from exiting the boundary and structure. The velocity and phase fraction functions in the relaxation zone are calculated as follows:
α = α R α c o m p u t e + ( 1 α R ) α t a r g e t
u = α R u c o m p u t e + ( 1 α R ) u t a r g e t
where α and u are the phase fraction and components of the velocity in the relaxation zone, αcompute and ucompute are the computed values of the phase fraction and velocity, αtarget and ucompute are the targeted values of the phase fraction and velocity, and αR is the weighting factor [24]:
α R ( χ R ) = 1 ( e x p ( χ R 3.5 ) 1 ) / ( e x p ( 1 ) 1 ) , χ R { 0 1 }
where λR is zero at the interface between the relaxation zone and the non-relaxation zone and gradually increases to 1 along the direction of the relaxation zone [25].

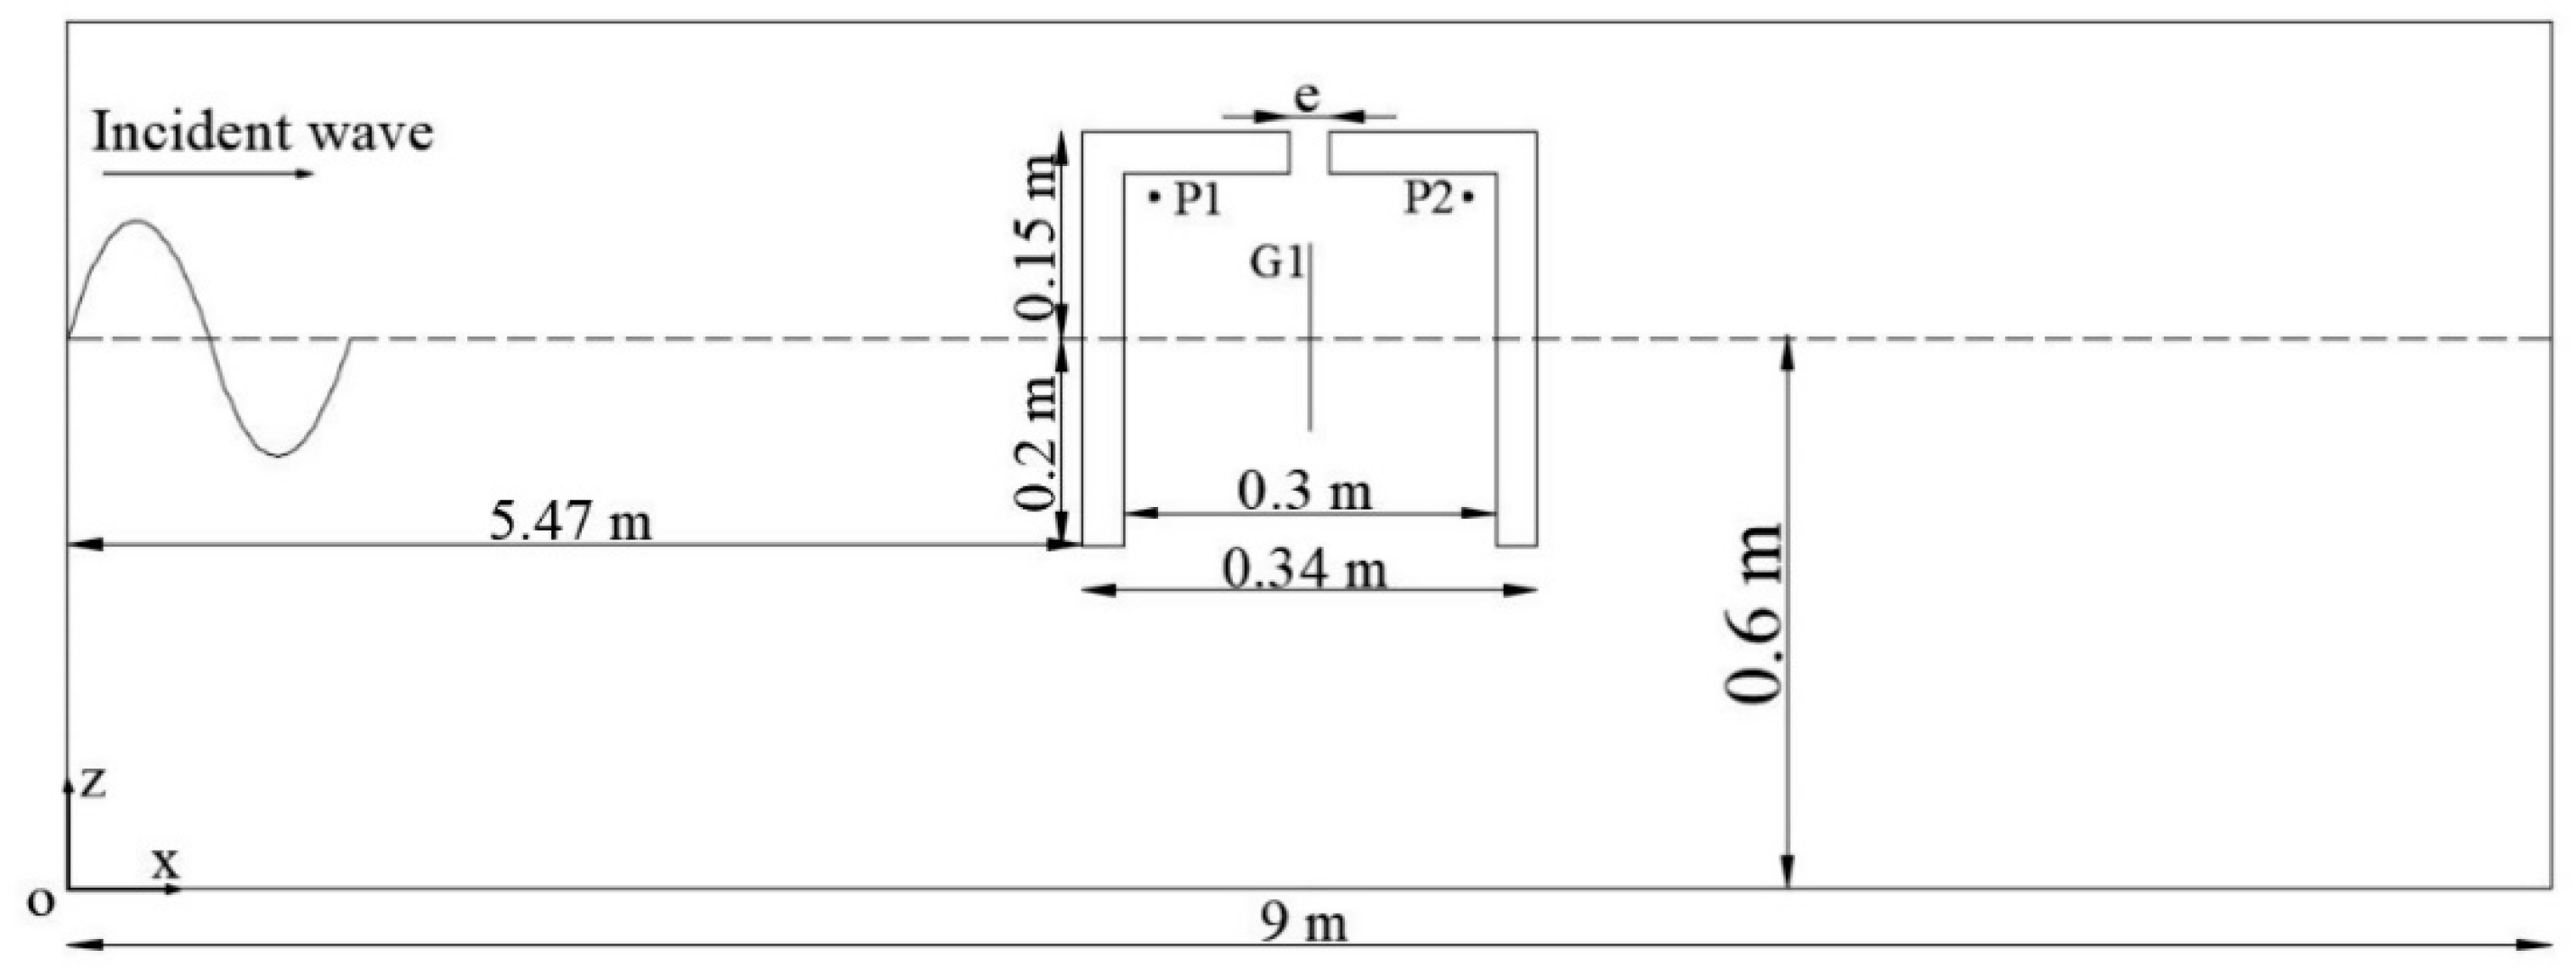
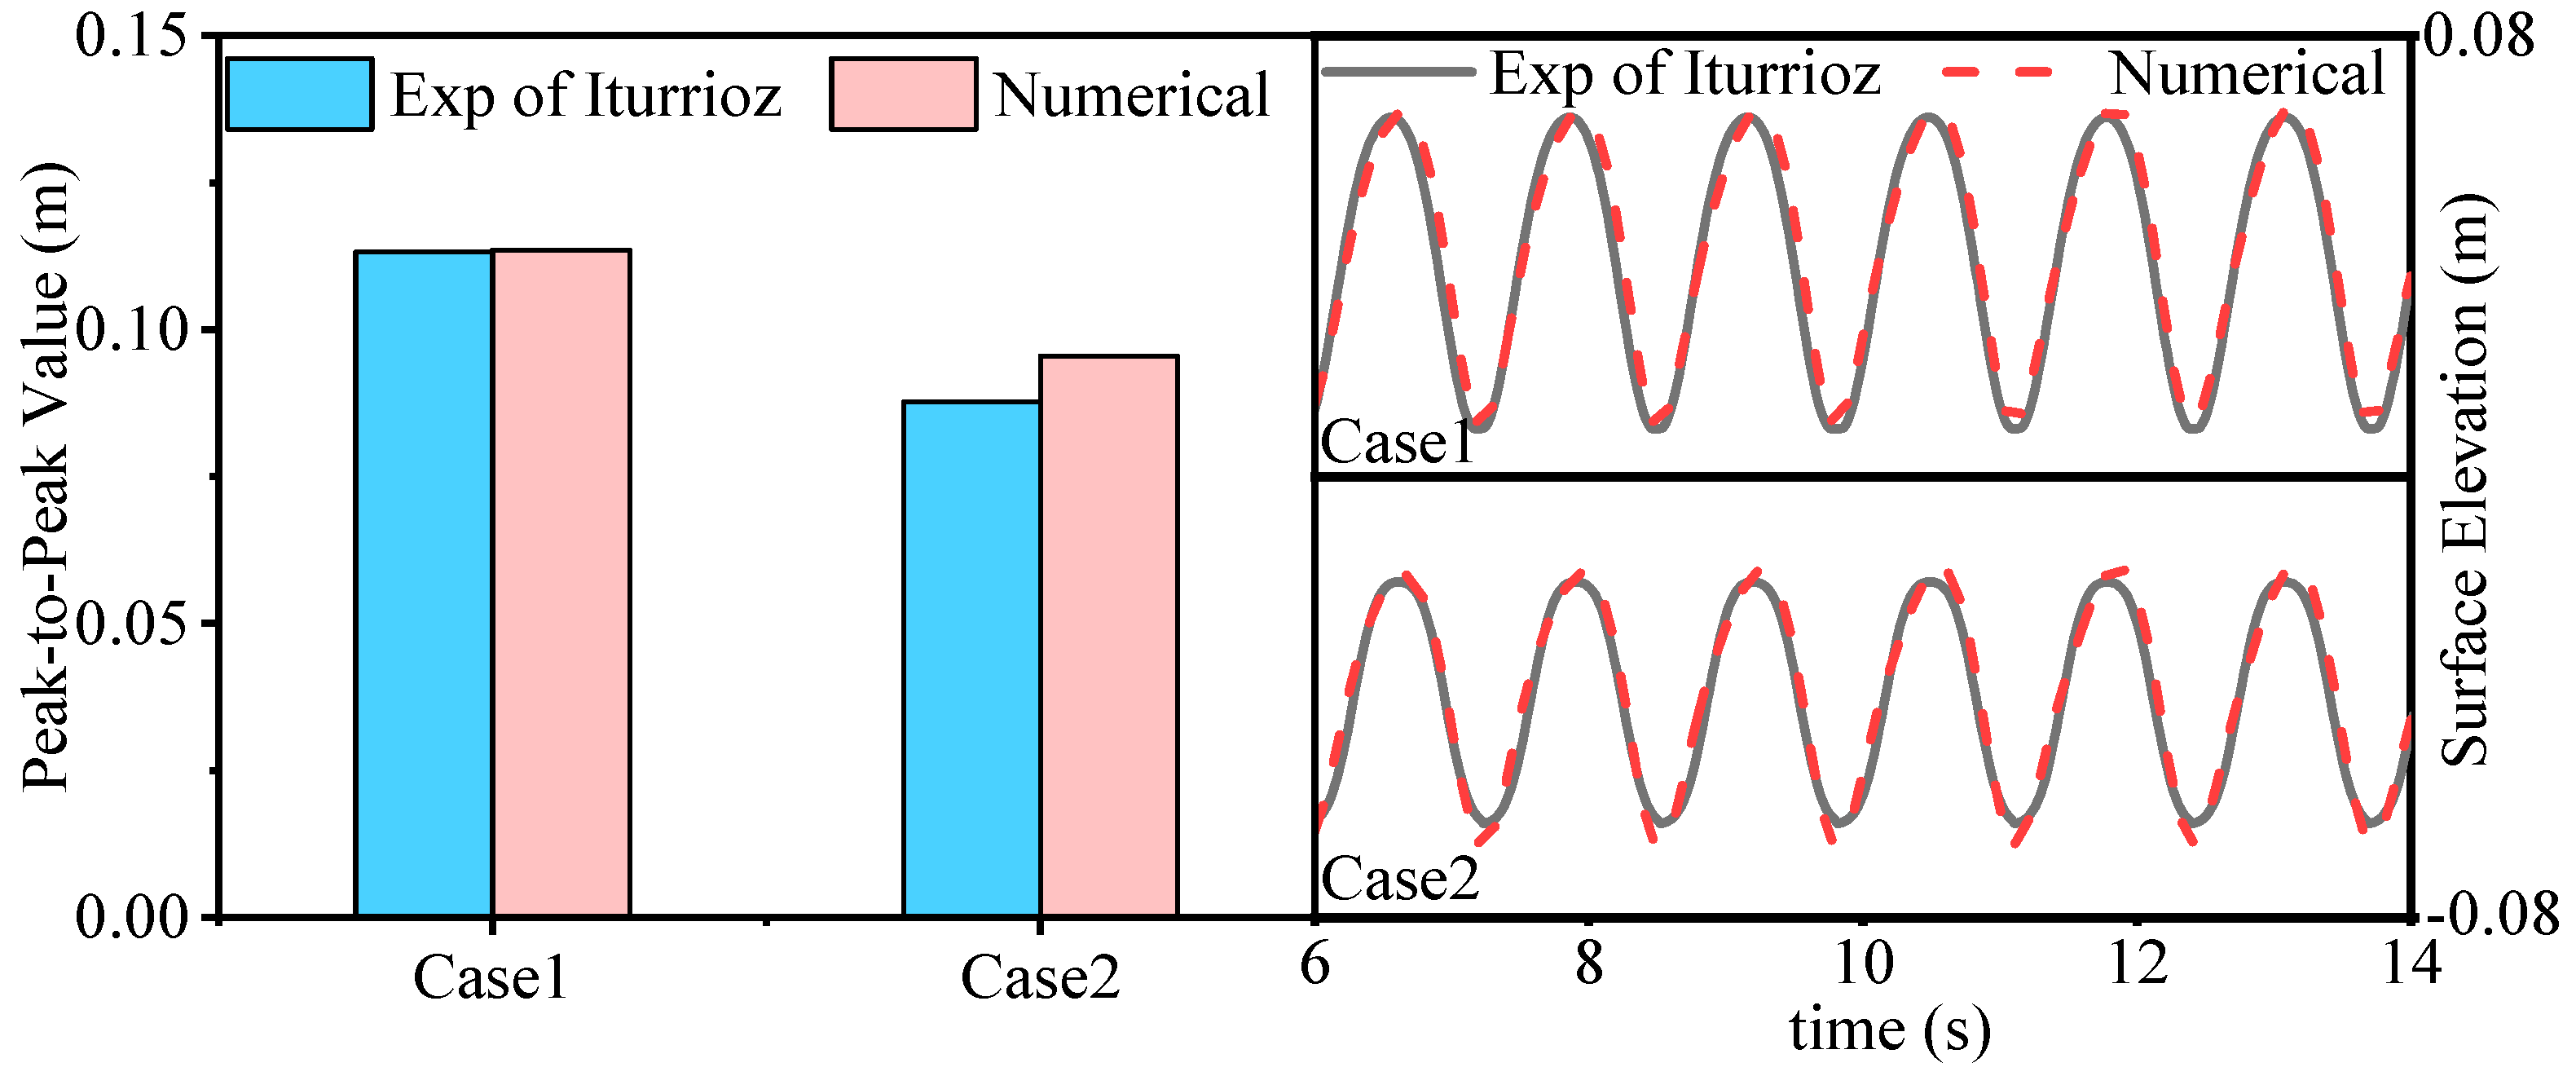
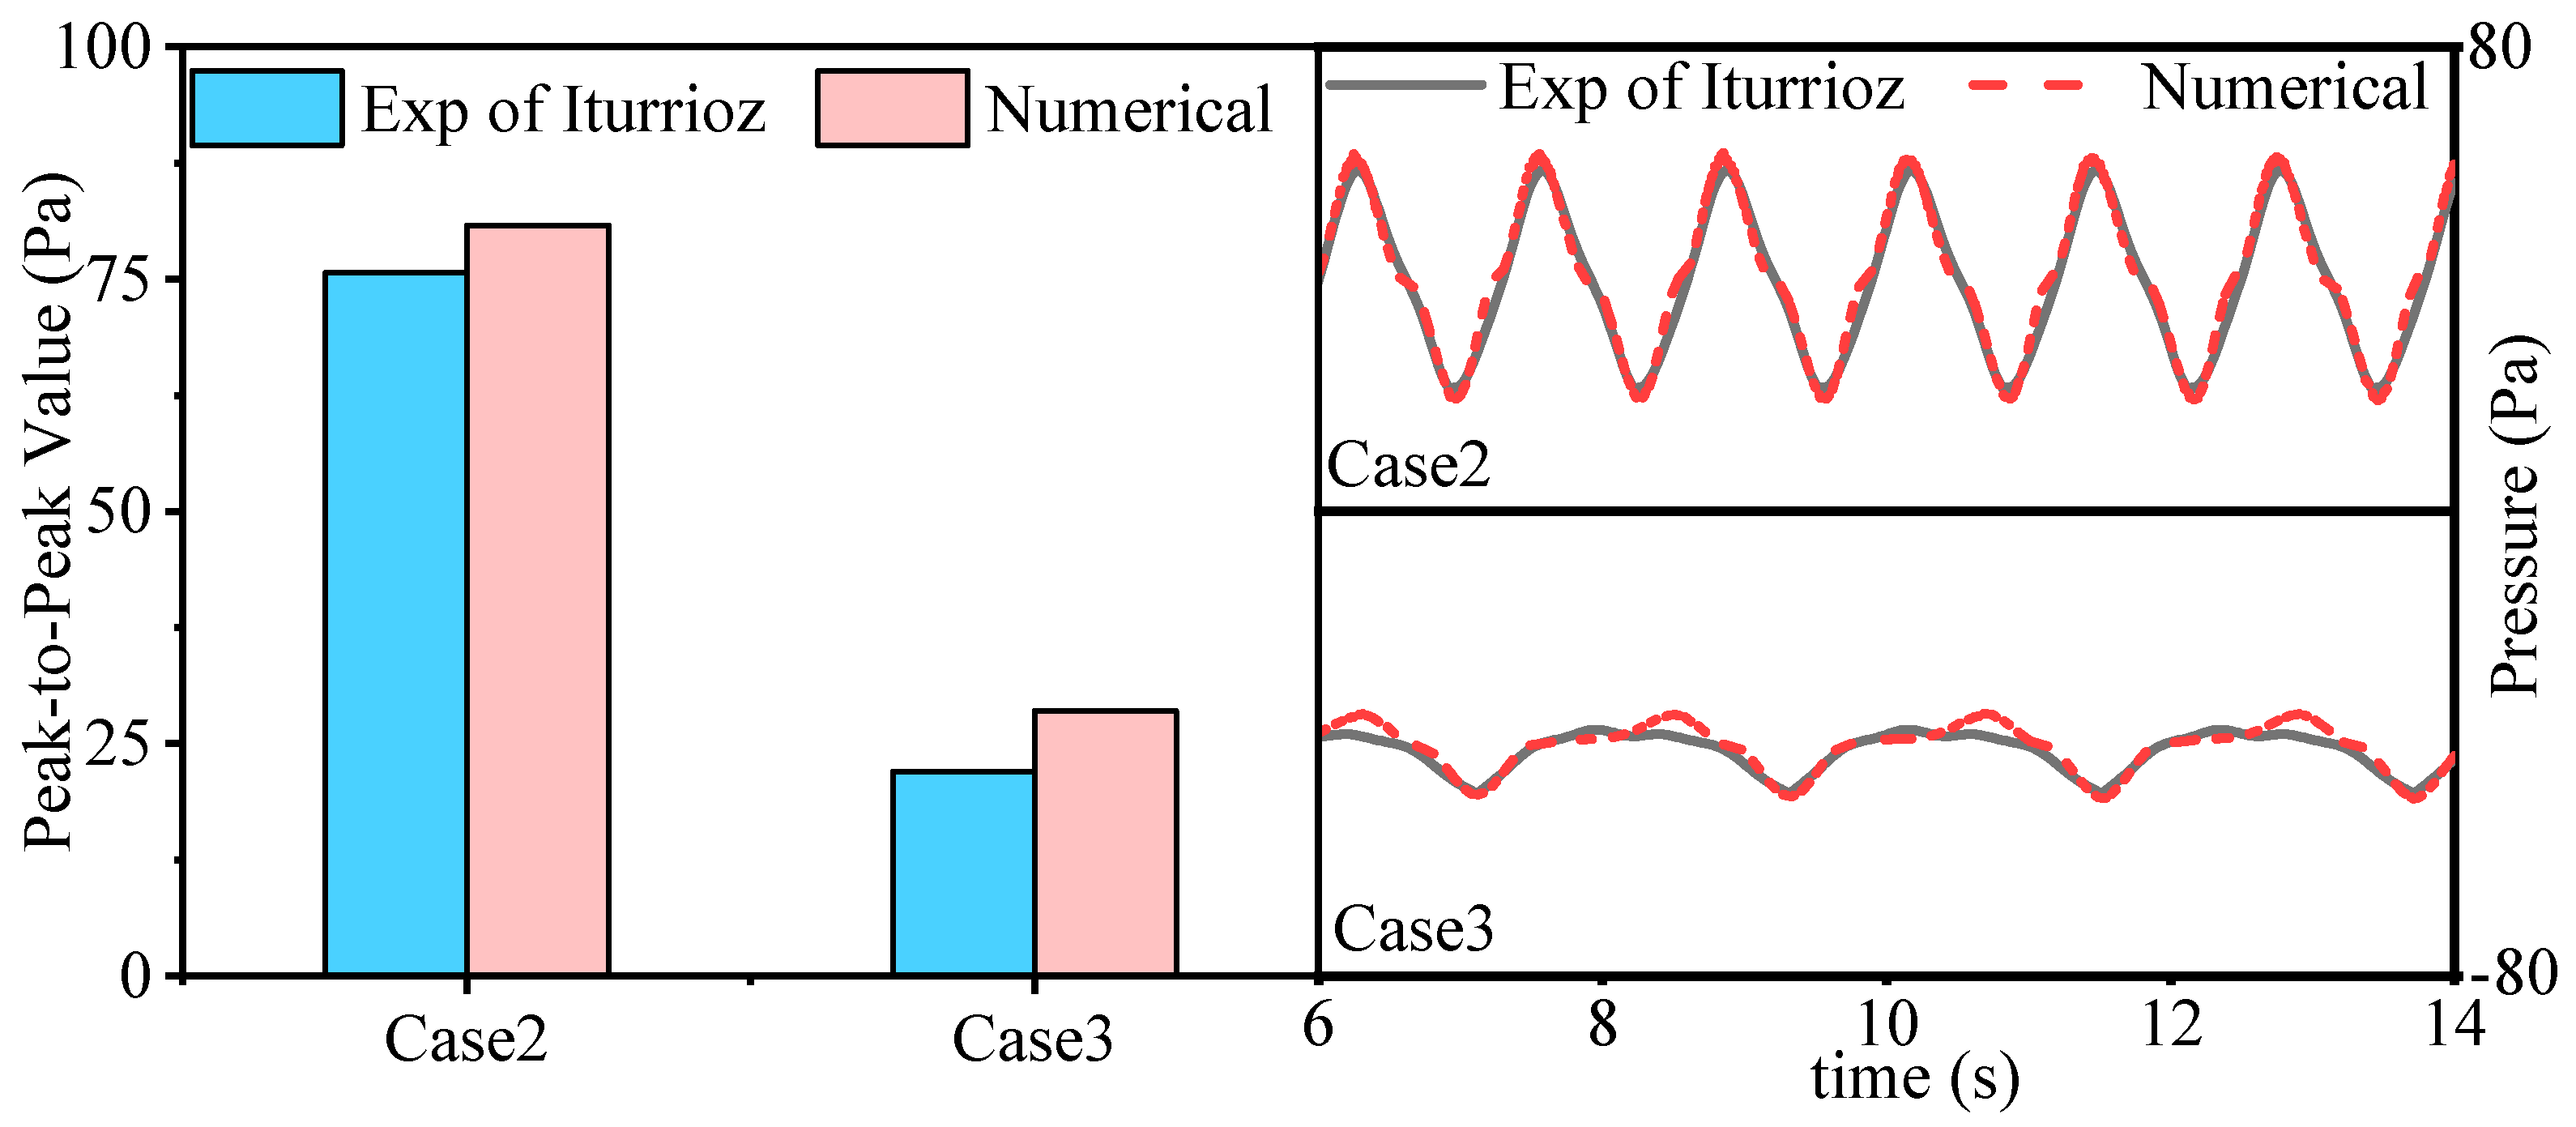
2.3. Model Validation

To investigate the wave-making accuracy of the numerical wave tank under different mesh sizes, the mesh sizes are defined as dz = H/15, H/20, and H/25. Three wave periods T of 1.2 s, 1.6 s, and 2.0 s are compared. The time histories of wave elevation are used to verify mesh convergence. As shown in Figure 2, the wave-making accuracy of the numerical wave tank satisfies the requirements when the mesh size is dz = H/15.
This paper combines the immersed boundary method (IBM) and waves2foam to simulate the interaction between OWC and wave. Relevant theories have been introduced in our previous research [26]. To validate the present numerical model, the experiment of an OWC conducted by Iturrioz et al. [27] is compared. Figure 3 shows the experimental setup and dimensions of the wave tank and OWC, with waves propagating in the positive direction of the x-axis. G1 records the surface elevation. The chamber pressure is the average of P1 and P2. The wave parameters and geometry of the OWC are listed in Table 1.
Figure 4 and Figure 5 compare the time histories and peak-to-peak values of the surface elevation and pressure inside the chamber for the three cases against the experimental results. In Case 1, there is no difference between the experimental and numerical simulations of the surface elevation. In Case 2, the numerical simulation of surface elevation and chamber pressure are slightly higher than the experimental data, with the maximum peak-to-peak difference being approximately 8%.
It can also be observed that the numerical results are in good agreement with the corresponding experimental data. Therefore, the present numerical model can be used as an efficient tool to simulate wave-OWC interactions.

2.4. Performance Coefficient of OWC

When a wave interacts with an OWC, the incident wave is divided into four components: a portion of the wave passes through the OWC, represented by the transmission coefficient Kt, and another portion is reflected by the OWC, represented by the reflection coefficient Kr. Some waves will be absorbed and converted into pneumatic power, indicated by the energy conversion efficiency η, while others are converted into vorticity and dissipate, represented by the dissipation coefficient Kd.
The energy conversion efficiency η is calculated as follows:
η = P P w a v e L
The pneumatic power P is calculated as follows [7]:
P = 1 n T t 0 t 0 + n T p ( t ) u ( t ) e d t .
where p(t) denotes the average air pressure inside the chamber, u(t) denotes the average velocity through the orifice, T is the wave period, and n is the number of periods.
P w a v e = 1 16 ρ g H 2 ω k ( 1 + 2 k d sinh 2 k d )
where H is the incident wave height, d is the water depth, ω = 2π/T is the wave frequency, and ρ is the water density.
Kr and Kt are calculated as follows:
K r = H r / H
K t = H t / H
where Hr is the reflection wave height and Ht is the transmission wave height. Hr is calculated using a two-point method [28]. Ht is derived by monitoring the wave elevation behind the OWC.
The dissipative coefficient Kd is defined as follows [29]:
K d = 1 K r 2 K t 2 η

3. Results

3.1. Effect of OWC Geometry

In this section, the effects of the opening height c, draft a, chamber width b, and PTO damping on the hydrodynamic performance of the OWC is investigated, as shown in Figure 6. The original OWC parameters are: chamber width b = 0.6 m, opening height c = 0 m, chamber height s = 0.25 m, draft a = 0.2 m, top opening e = 0.036 m, wall thickness t = 0.05 m, wave height H = 0.1 m, water depth d = 1.5 m.

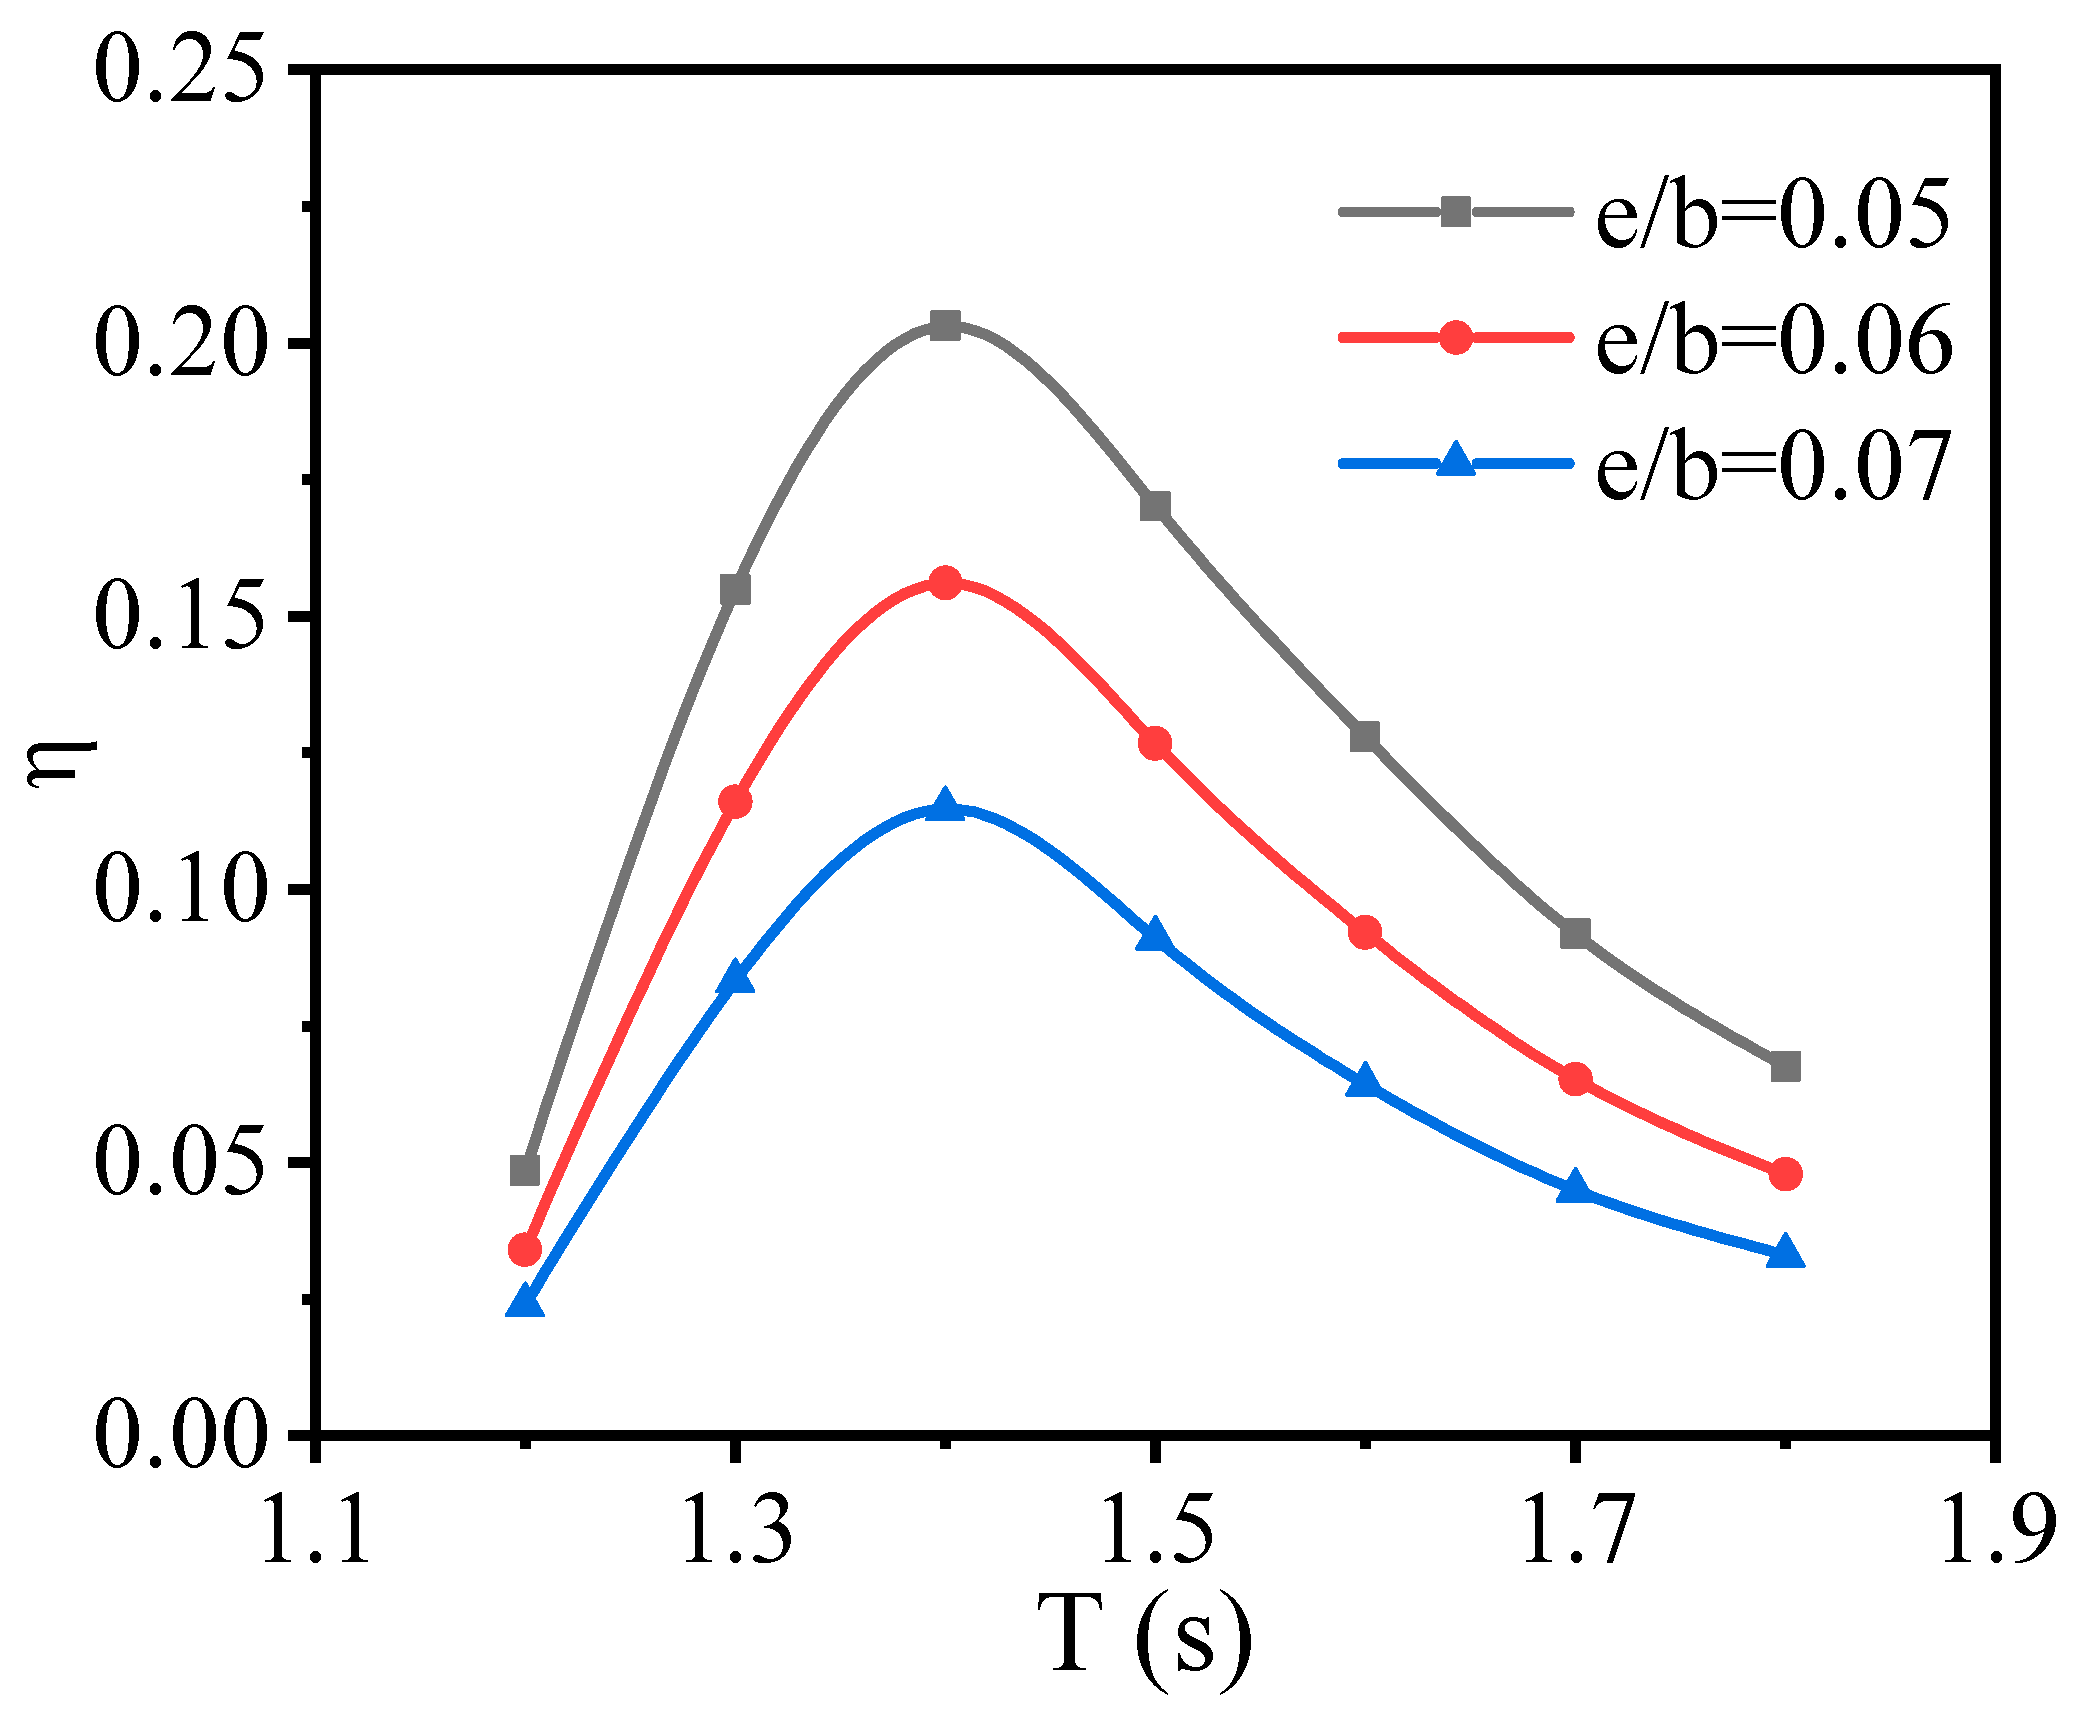
3.1.1. Effect of Opening Height

The influence of opening height c on the OWC performance is studied. Figure 7 shows the energy conversion efficiency, reflection coefficient, transmission coefficient, and dissipation coefficient for different opening heights (c/H = 0, 0.625, 1.25, 1.875, 2.5). The other parameters are the same as those of the original OWC.
In Figure 7, with increasing opening height c/H, the maximum energy conversion efficiency also increases. When the period T > 1.4 s, a larger c/H results in a higher conversion efficiency because a large c/H can induce water particles from deep areas to enter the chamber. When period T < 1.4 s, models with large c/H exhibit slightly lower conversion efficiency compared to those with a smaller c/H. According to the linear wave theory, the shorter the wavelength, the less wave energy is present in deep water areas. Therefore, with a short wavelength, increasing c/H does not capture more wave energy. Instead, it makes it more difficult for water particles inside the chamber to flow out, leading to a slight decrease in the energy conversion efficiency.
In Figure 7c, increasing c/H enhances the OWC’s ability to obstruct wave transmission, thereby reducing the transmission coefficient. In Figure 7b, for both short and long waves, the reflection coefficient increases as c/H increases. When the wave period is around the resonance period, the reflection coefficient decreases as c/H increases. This is primarily due to the sharp increase in the dissipation coefficient and energy conversion efficiency near the resonance period, as shown in Figure 7d. Around the resonance period, the amplitude of the water column motion inside the chamber is large. The water particles collide and rub against the OWC walls, generating more vortices, which increases the dissipation coefficient.
Figure 8 shows the vorticity and velocity contours at different opening heights c/H. At this moment, the wave elevation on the front side of the OWC reaches its peak, and the water column inside the chamber is in a horizontal position and begins to rise. When water particles enter the chamber, vortices are primarily generated at the bottom of the front and back walls. Because the large geometric curvature at this location causes water particles to experience significant velocity gradients. As the opening height increases, more vortices are generated at the bottom back wall. Due to the increasing opening height, the submerged volume of the OWC expands, and the contact area between the chamber walls and the water particles increases. As the water column oscillates, water particles are more likely to collide with the chamber walls, creating larger velocity gradients and generating more vorticity.

3.1.2. Effect of Draft

The effect of draft a on the OWC performance is investigated. Figure 9 shows the energy conversion efficiency, reflection coefficient, transmission coefficient, and dissipation coefficient for different opening heights (a/H = 1.0, 1.5, 2.0, 2.5, 3.0). The other parameters are the same as those of the original OWC.
In Figure 9a, the maximum energy conversion efficiency increases with an increase in a/H. When the wave period is short, a smaller a/H results in a higher conversion efficiency. Conversely, when the wave period is long, a larger a/H leads to a higher conversion efficiency. This indicates that for different wave periods, there is an optimal draft, and as the wave period lengthens, the optimal draft increases correspondingly. As shown in Figure 9b,c, with an increase in draft a/H, the OWC’s ability to block wave energy increases, leading to an increased reflection coefficient and decreased transmission coefficient across the entire range of wave periods.
Figure 10 presents a streamlined field near the OWC for different wave periods and drafts. According to wave theory, the trajectory of water particles in waves follows an elliptical path. When the wave period is short, the radius of the ellipse is small. With a large draft, it is challenging for water particles to enter the OWC chamber. Conversely, with a small draft, water particles can enter the OWC chamber easily, as shown in Figure 10a,c. When the wave period is large, water particles can be transmitted through the OWC with a small draft, as shown in Figure 10b,d.

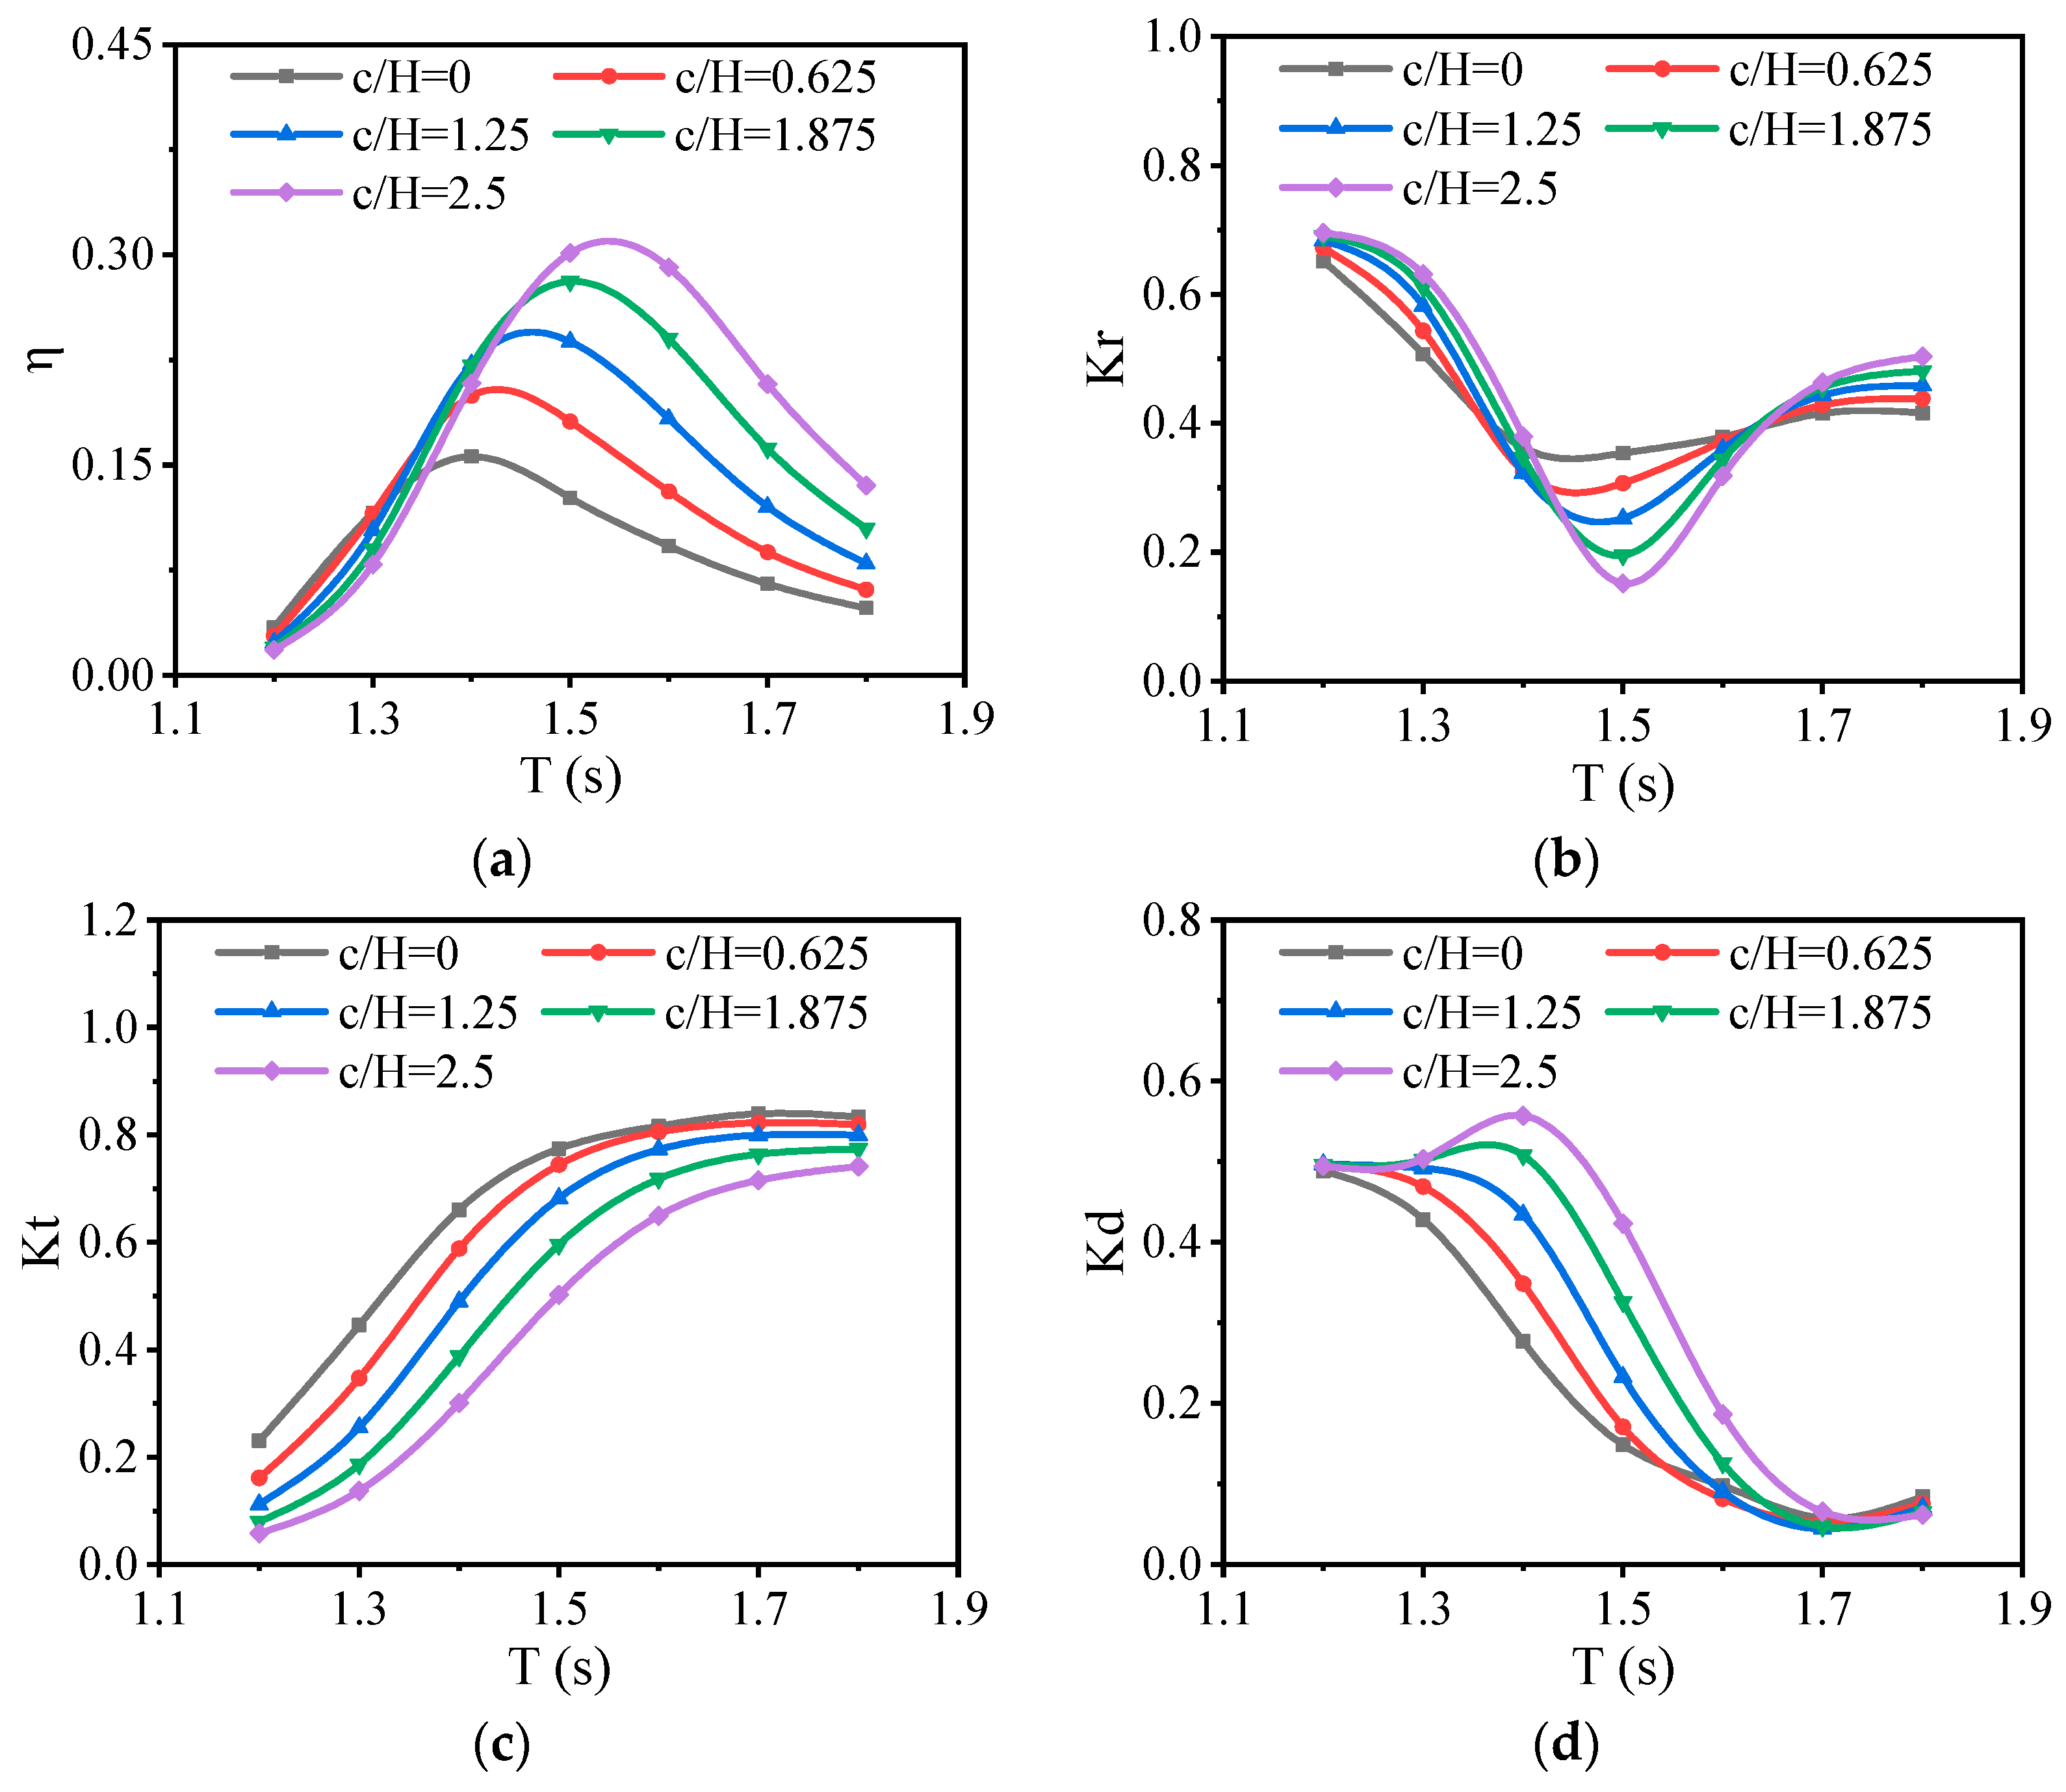
3.1.3. Effect of Chamber Width

The effect of chamber width b on the OWC performance is studied. Figure 11 shows the energy conversion efficiency, reflection coefficient, transmission coefficient, and dissipation coefficient for different chamber width (b/H = 1.0, 1.5, 2.0, 2.5, 3.0). The other parameters are the same as those of the original OWC.
In Figure 11, as b/H increases, the maximum value of the energy conversion efficiency rises, and the resonance period also increases. Because the width of the chamber increases while the opening width remains fixed, the opening ratio of the chamber decreases, increasing the PTO damping of the OWC. Additionally, the increased chamber width leads to an increase in the inertial force of the water column, thereby extending the resonance period of the OWC.

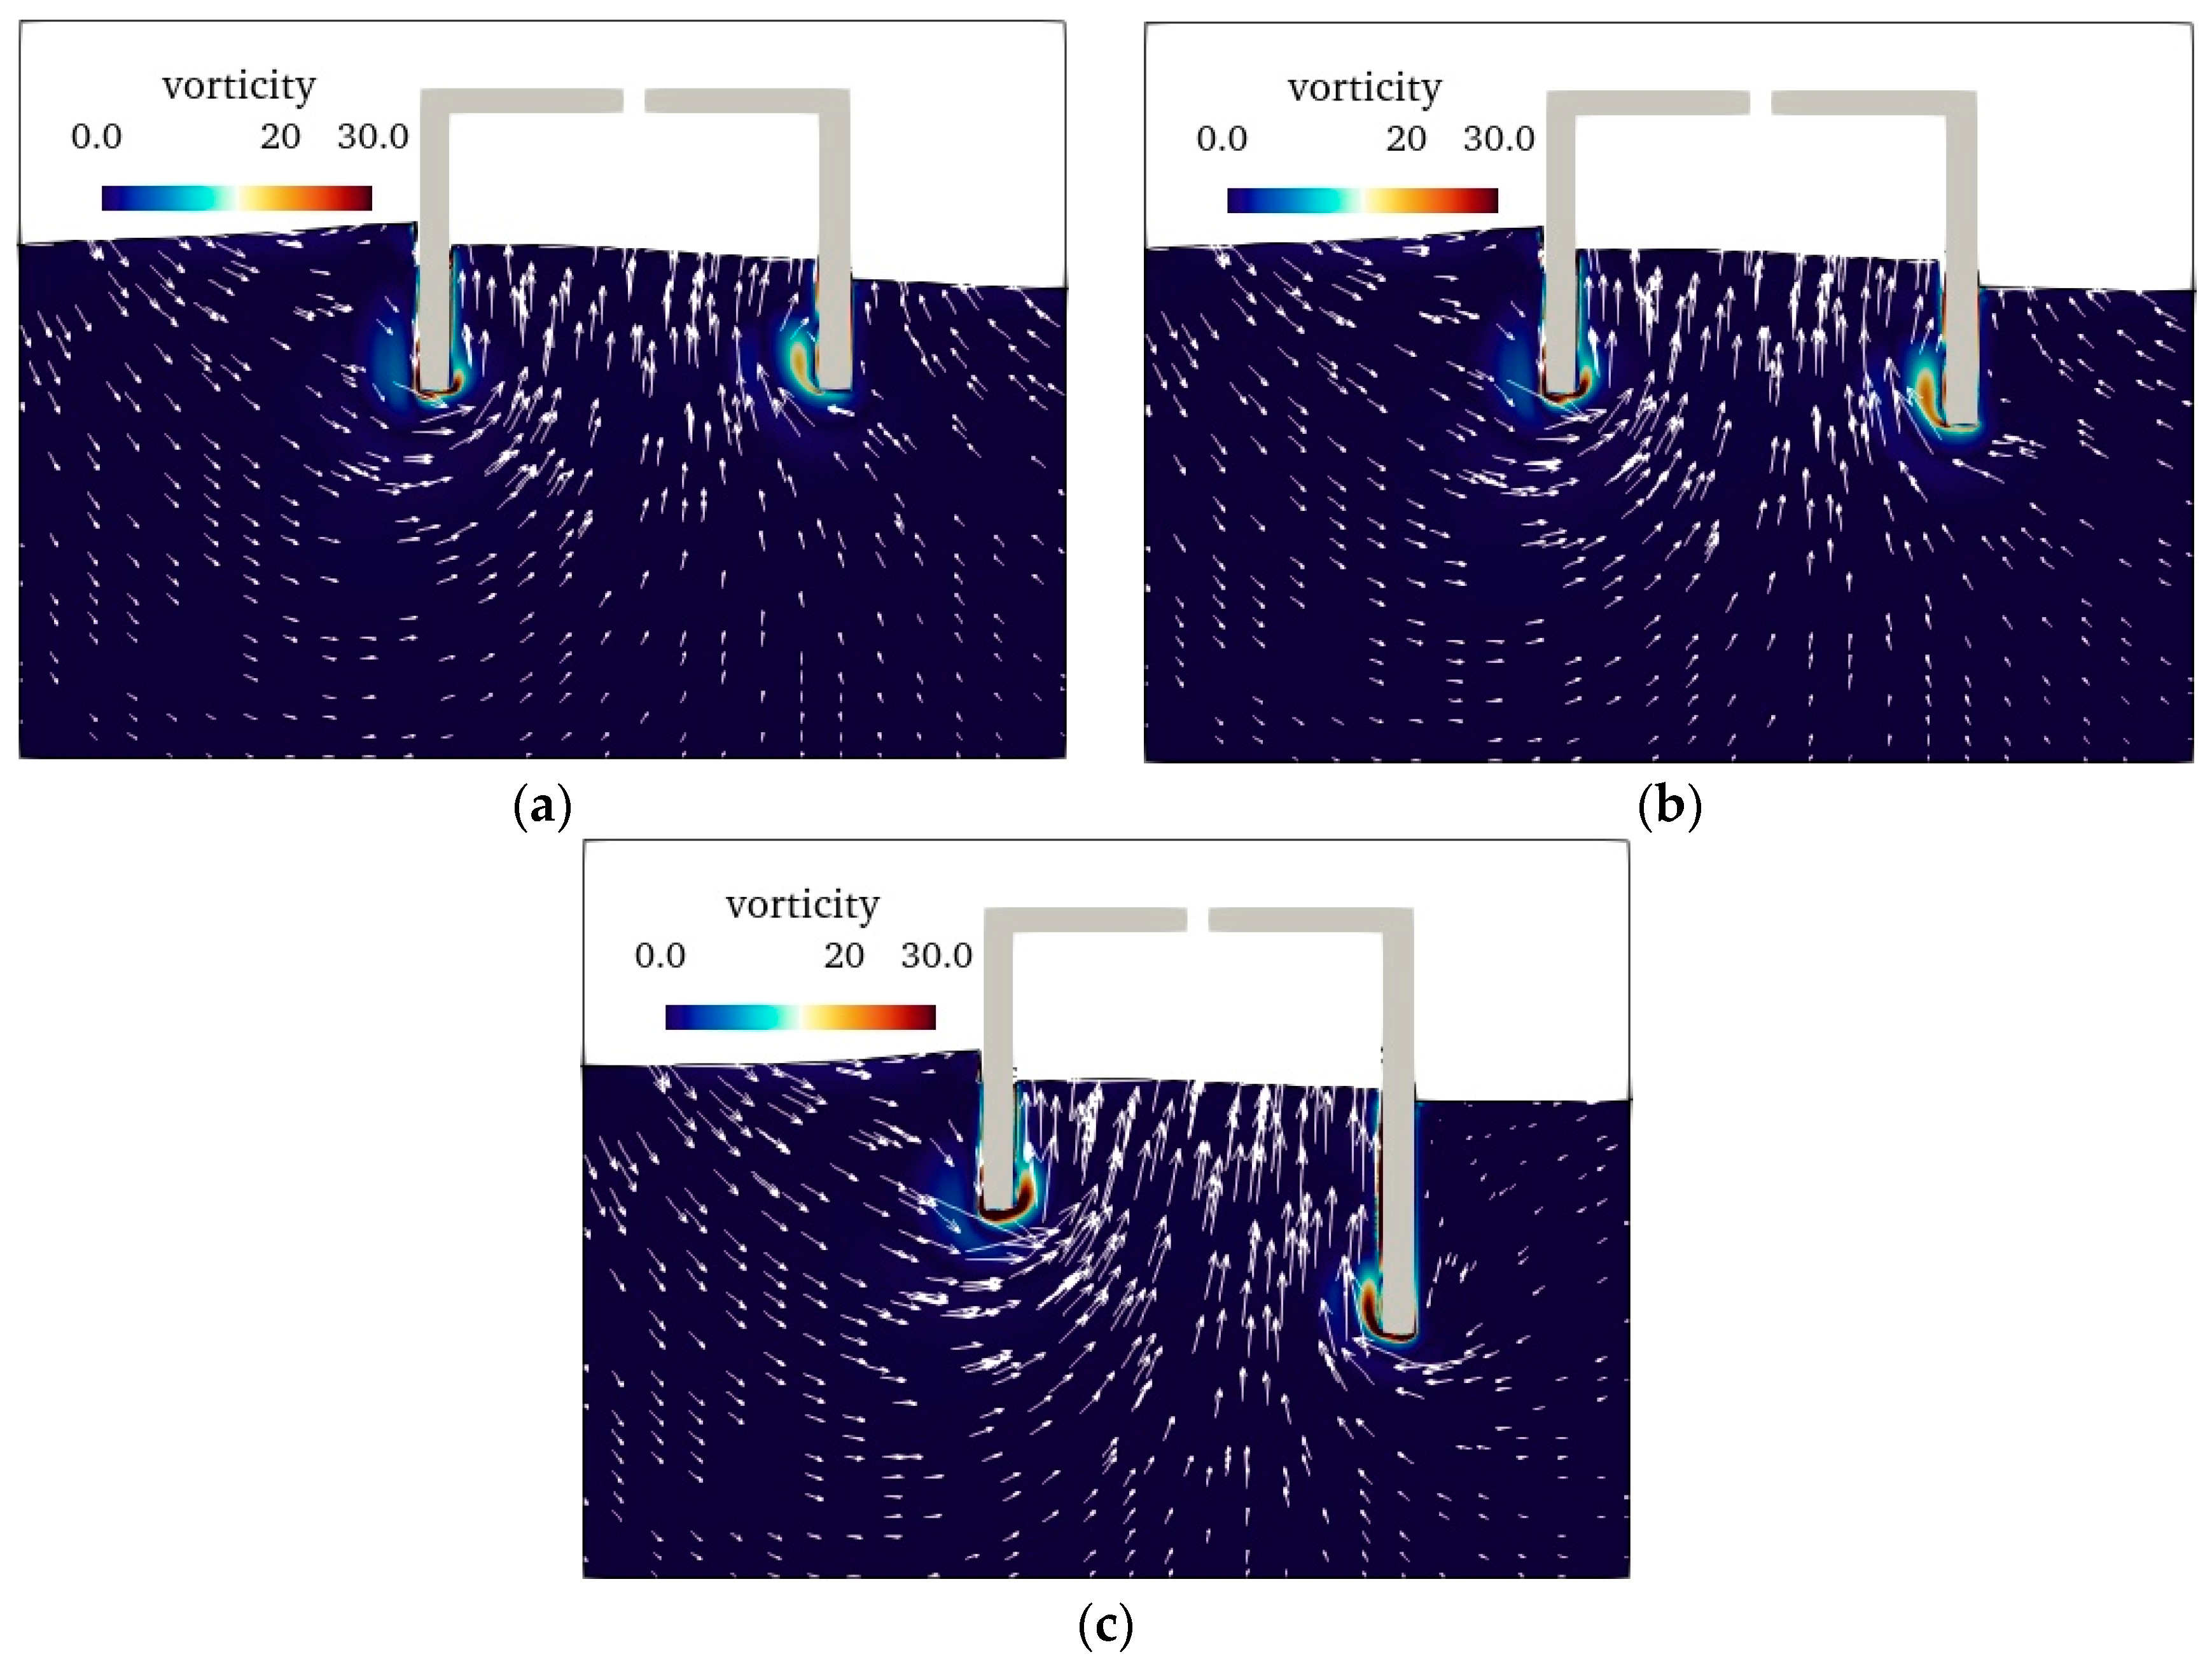
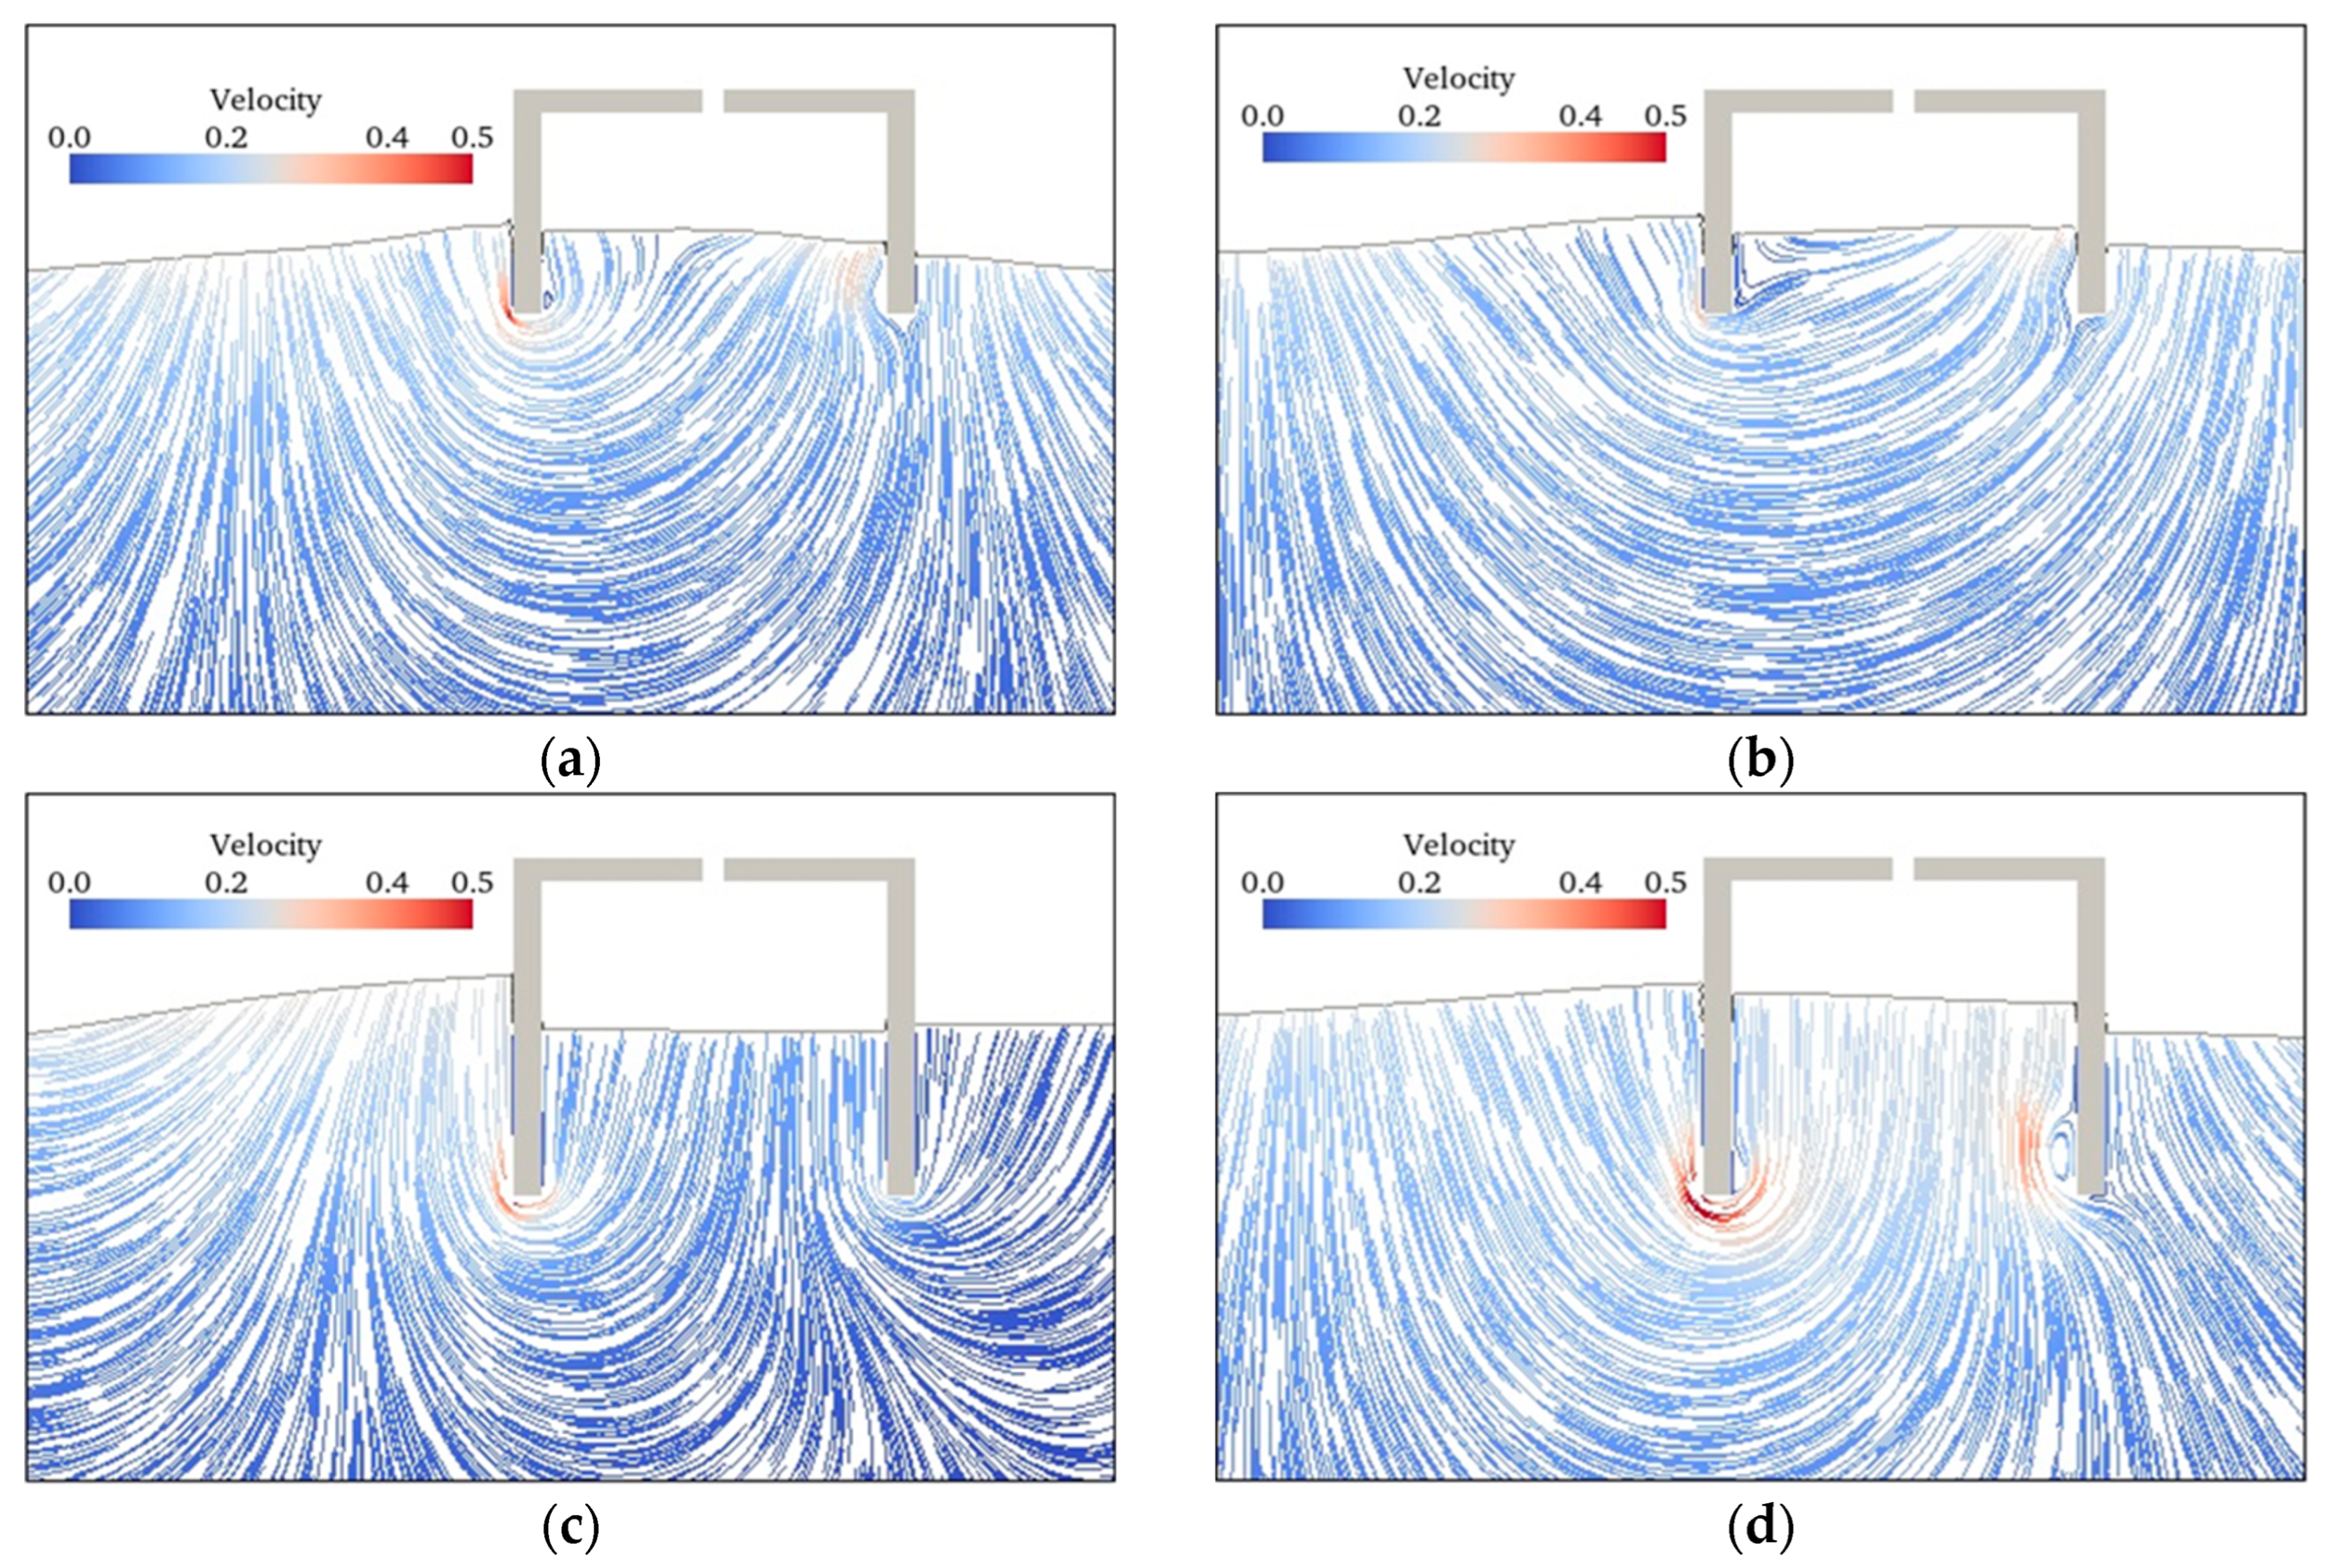
3.1.4. Effect of PTO Damping and Water Column Motion

The effect of PTO damping on the OWC performance is studied. Figure 12 shows the energy conversion efficiency for different opening widths (e/b = 0.05, 0.06, and 0.07); the chamber width is fixed. The other parameters are the same as those of the original OWC. The resonance period T of the three OWCs is 1.4 s, with different energy conversion efficiencies. This indicates that changes in PTO damping do not affect the resonance period.
Figure 13, Figure 14 and Figure 15 show the surface elevations inside the chamber during the different periods. When the period T = 1.1 s, due to the weak wave transmission, a small surface elevation in the chamber was observed. When the wave period is at the resonance period (T = 1.4 s), the free surface inside the chamber exhibits a significant inclination at all moments. When the wave period T is 2.0 s, the increased wavelength causes the free surface inside the chamber to become smooth. In previous research, Çelik [30] defined the inclined free surface as the “sloshing mode” and the vertically moving free surface as the “piston mode”.
Figure 16 shows the dimensionless elevation amplitude inside the OWC chamber under different PTO damping. When the PTO damping is high, the elevation amplitude is small because the increased air pressure within the chamber suppresses the free surface elevation. During the resonance period (T = 1.4 s), the elevation amplitude shows the greatest variation under different PTO damping conditions. When the wave period T is 1.1 s or 1.4 s, the elevation amplitude inside the chamber is uneven. When the wave period T is 2.0 s, the elevation amplitude inside the chamber is relatively smooth. This is consistent with the analysis results shown in Figure 13, Figure 14 and Figure 15.
To quantify the inclination of the water column inside the chamber, ng wave gauges (ng = 201 in this study) are placed within the OWC chamber to monitor the time history data of the surface elevation. Equation (15) decomposes the surface elevation of each wave gauge into the mean surface elevation and the surface elevation deviation; i represents the index number of the wave gauge. The λ i t can be solved using λ ¯ t and λ i t . Subsequently, ε is determined to represent the inclination of the water column inside the OWC chamber. ϕ denotes the average amplitude of the water column inside the OWC chamber.
λ i t = λ ¯ t + λ i t
ε λ t = 1 / n g i = 1 n g λ i t H
ε = max ε λ t
ϕ = max λ ¯ t H
In Figure 17, as the wave period increases, the average amplitude and inclination of the water column inside the chamber first increases and then decreases. Increasing PTO damping reduces the inclination and the average amplitude across the entire wave period. The period of the maximum inclination is 1.7 s, and the maximum average amplitude is 1.5 s, both exceeding the resonance period (T = 1.4 s).
An increase in the average amplitude ( ϕ ) of the water column enhances the OWC’s power output while its sloshing diminishes it. The inclination indicates the degree of sloshing. Observing the average amplitude and inclination for e/b = 0.05, when the period T is 1.4 s, the average amplitude is high, the inclination is low, and the energy conversion efficiency peaks. As the period increases to 1.5 s, the average amplitude slightly increases, but the inclination rises significantly, leading to a decrease in energy conversion efficiency. This explains why the periods during which the maximum values of the average amplitude and inclination occur are slightly longer than the resonance period.
From the above study, when the wave period falls within a certain range, the wave elevation inside the chamber exhibits significant spatial non-uniformity. In OWC model experiments, the volume change rate of the water column is often determined by measuring the wave elevation at a single point. However, significant spatial non-uniformity within the chamber can lead to larger measurement errors. Therefore, within a range of periods around the maximum inclination, multiple wave gauges need to be used to reduce measurement errors.

3.2. Effect of Submerge Breakwater on OWC

The research results presented above indicate that the key to improving the OWC performance is inducing more water particles to enter the chamber. A submerged breakwater is a common structure in ocean engineering and serves the function of reflecting waves. This section combines the OWC with a submerged breakwater, allowing the breakwater to reflect waves into the OWC chamber. The hybrid system is illustrated in Figure 18. The impact of different submerged breakwater lengths and extension directions on the performance of the OWC is investigated. The OWC parameters are the same as the original OWC, and the water depth d is 0.8 m.
Figure 19 shows the energy conversion efficiency, reflection coefficient, transmission coefficient, and dissipation coefficient for different submerge breakwater lengths (L1/b = 0, 0.08, 0.25, 0.58). The other parameters, rh/H = 4, L2/b = 0.
When L1/b is 0.08, the energy conversion efficiency is the highest at all periods, indicating the existence of an optimal L1. In Figure 19b, when L1/b = 0, 0.08, and 0.25, the reflection coefficient is lower than that of the standalone OWC at all periods, with a noticeable difference when the wave period is longer. When L1/b increases to 0.58, the reflection coefficient increases at all periods.
Figure 20, Figure 21 and Figure 22 show the velocity stream tracers of the standalone OWC and rectangular OWC-submerged breakwater (L1/b = 0, 0.08, and 0.58). At 1/5T, the water column inside the chamber descends, causing some water particles to flow out from the bottom of the front wall. The submerged breakwater interferes with the movement of water particles. As the breakwater length (L1/b) increases, the movement of water particles is increasingly affected, causing the velocity of water particles near the upper left corner of the submerged breakwater to increase, which intensifies the formation of reflected waves and reduces the conversion efficiency.
At 2/5T, the water column inside the chamber rises, and water particles around the OWC enter the chamber. As shown in Figure 20b, the water particles in the deep water are transmitted through the OWC without entering the chamber. However, in Figure 21b, water particles in the deep water are reflected into the chamber by the breakwater, improving the energy conversion efficiency. In addition, as the breakwater length increases, the front side of the breakwater gradually approaches the front wall of the OWC, as shown in Figure 22b. Some water particles are not reflected in the chamber, but are instead reflected to the front side of the OWC, increasing the reflection coefficient and reducing the energy conversion efficiency of the OWC.
Figure 23 shows the energy conversion efficiency, reflection coefficient, transmission coefficient, and dissipation coefficient for different submerge breakwater lengths (L2/b = 0, 0.08, 0.25, 0.58). The other parameters, rh/H = 4, L1/b = 0.
As shown in Figure 23a, as increases along the wave propagation direction, the maximum energy conversion efficiency gradually decreases from 14.1% to 12.3%. Comparing L2/b = 0.08 and L2/b = 058, when the wave period T < 1.6 s, the hybrid system (L2/b = 0.08) shows higher energy conversion efficiency. Analyzing the velocity streamlines and vorticity fields of the two models (Figure 24 and Figure 25), at 1/5T, the water column begins to descend. Some water particles flow out through the opening between the back wall and the top of the submerged breakwater. When L2/b = 0.08, water particles diffuse after passing through the opening in region A. However, when L2/b = 0.58, water particles can only flow along the top of the breakwater in region B, affecting the descent of the water column and thereby impacting the energy conversion efficiency.
When the wave period T > 1.6 s, the hybrid system (L2/b = 0.58) shows higher energy conversion efficiency. Because wave transmissivity increases, a longer submerged breakwater can block the waves more effectively. In Figure 24f, there is a velocity gradient at the top of the submerged breakwater that forms a range of vorticity. In Figure 25f, due to water particles having to flow along the top of the submerged breakwater, the velocity gradient is small, resulting in a smaller scale of vorticity. This explains why the longer submerged breakwater in Figure 23d generates a smaller dissipation coefficient.

4. Conclusions

This study employs the open-source software, OpenFOAM, to develop an IB-wave solver for simulating OWC-wave interactions. The impact of the geometric parameters of the OWC on the hydrodynamic performance was investigated, including the opening height, draft, and chamber width. Based on the above research, a hybrid system composed of a submerged breakwater and an OWC is proposed. The energy conversion efficiency, reflection coefficient, transmission coefficient, dissipation coefficient, and flow field are compared and analyzed under different wave periods. The following conclusions can be drawn from the present investigations:
(1)
Increasing the opening height enhances the energy conversion efficiency of the OWC under long wave periods. For different wave periods, there is an optimal draft for the OWC to maximize the energy conversion efficiency. Meanwhile, the optimal draft for the OWC increases with the wave period. Increasing PTO damping does not change the resonance period of the OWC, while the free surface elevation inside the chamber reduces.
(2)
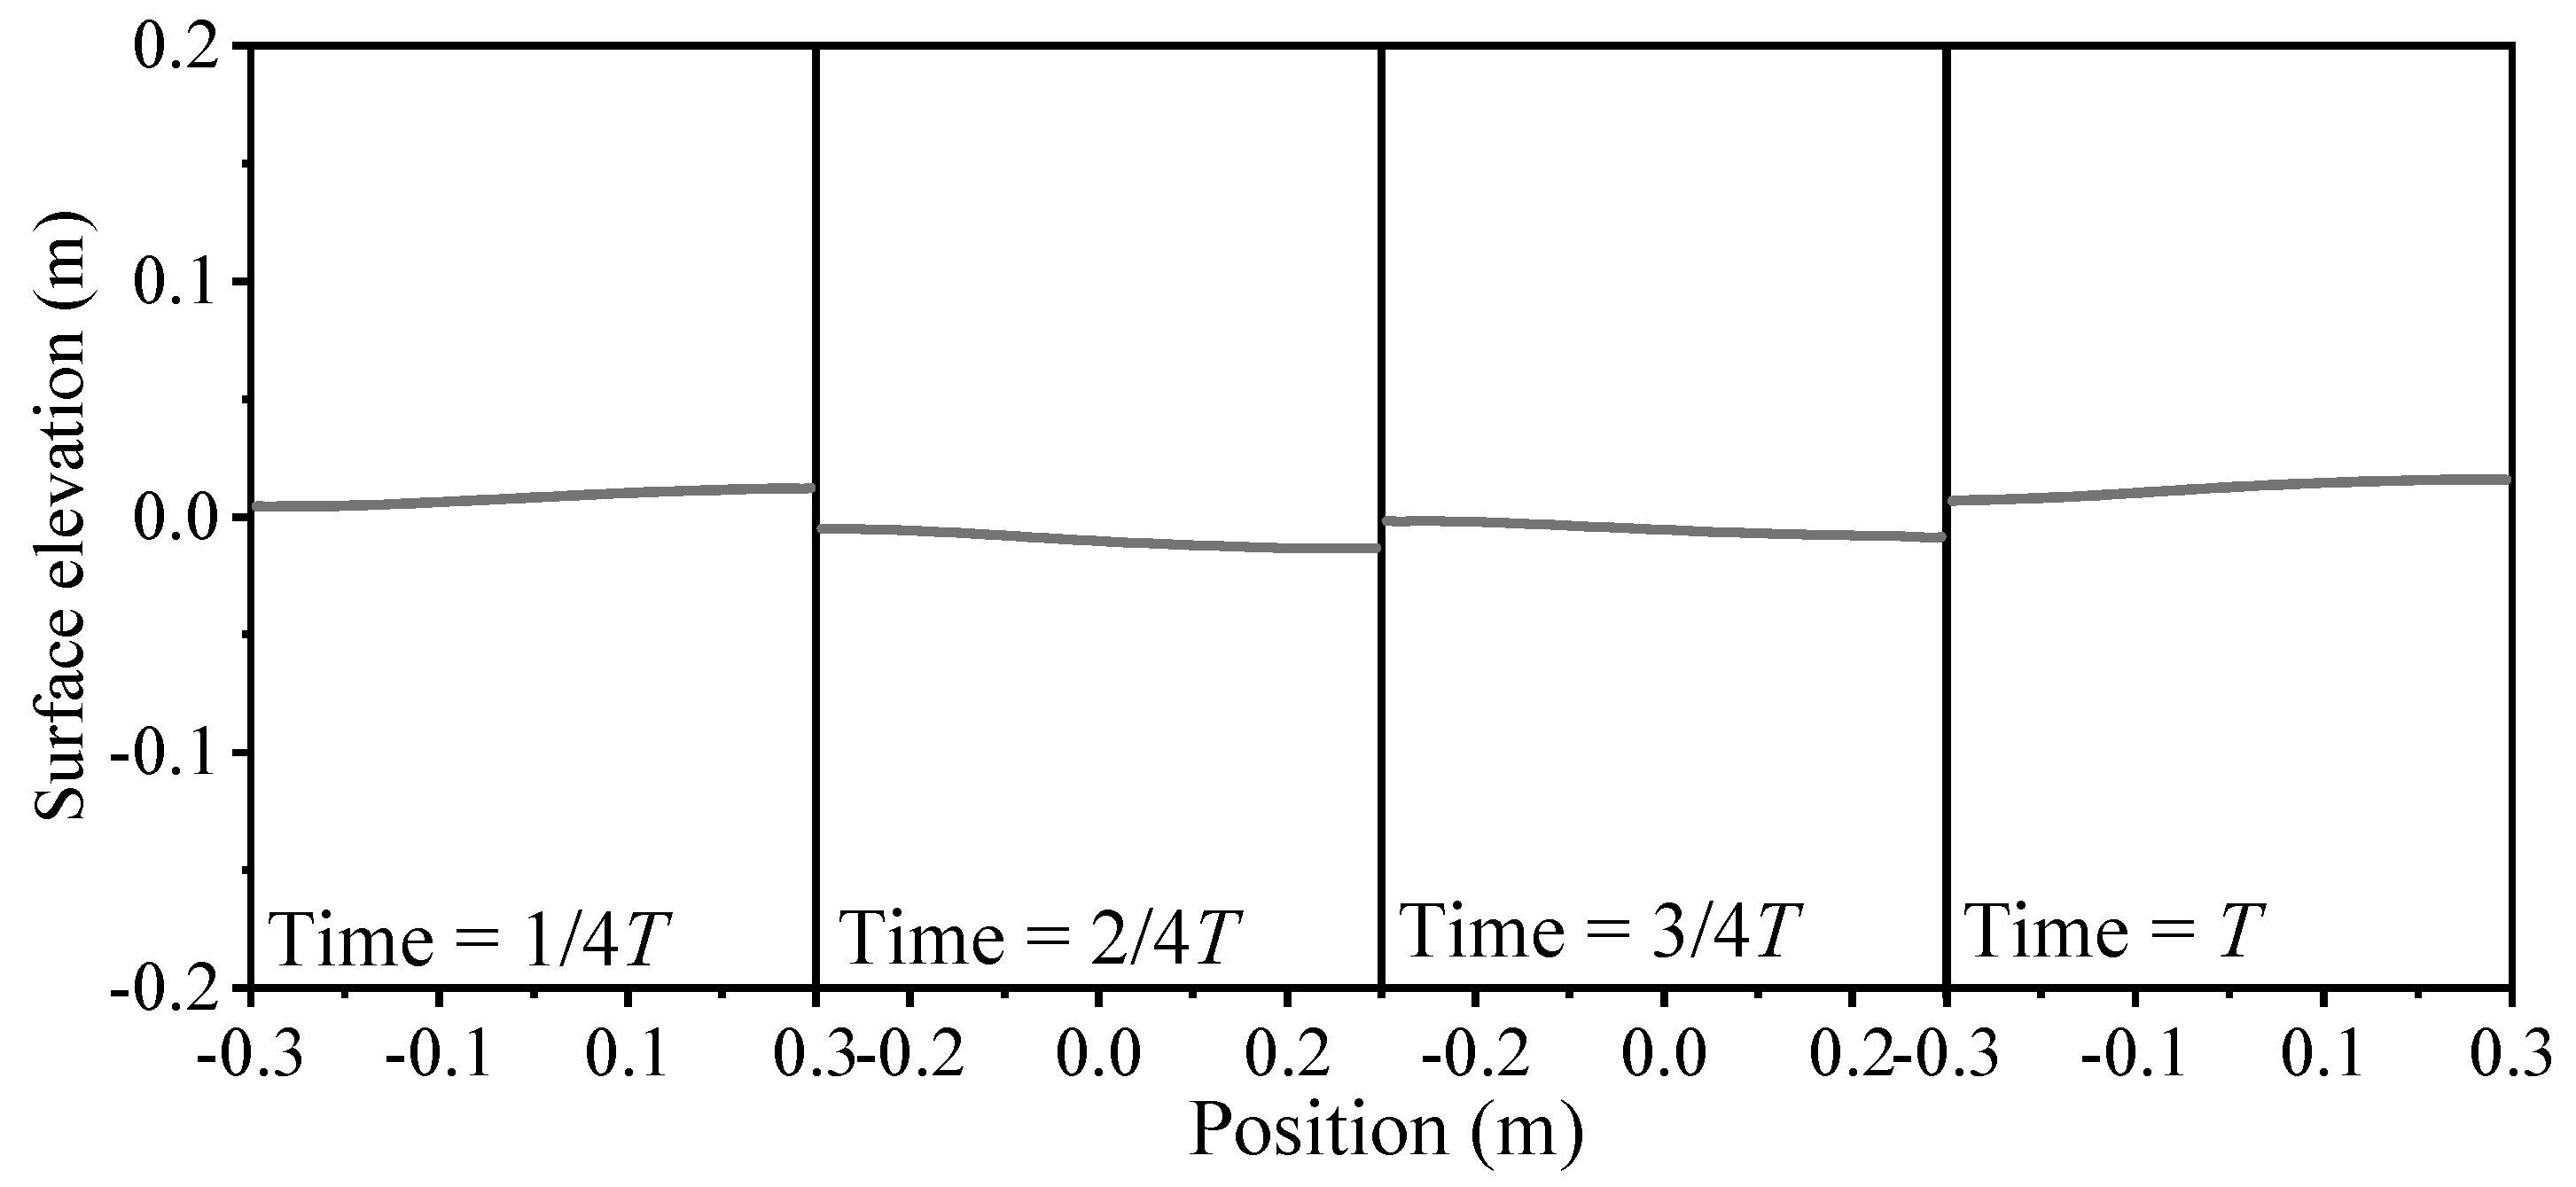
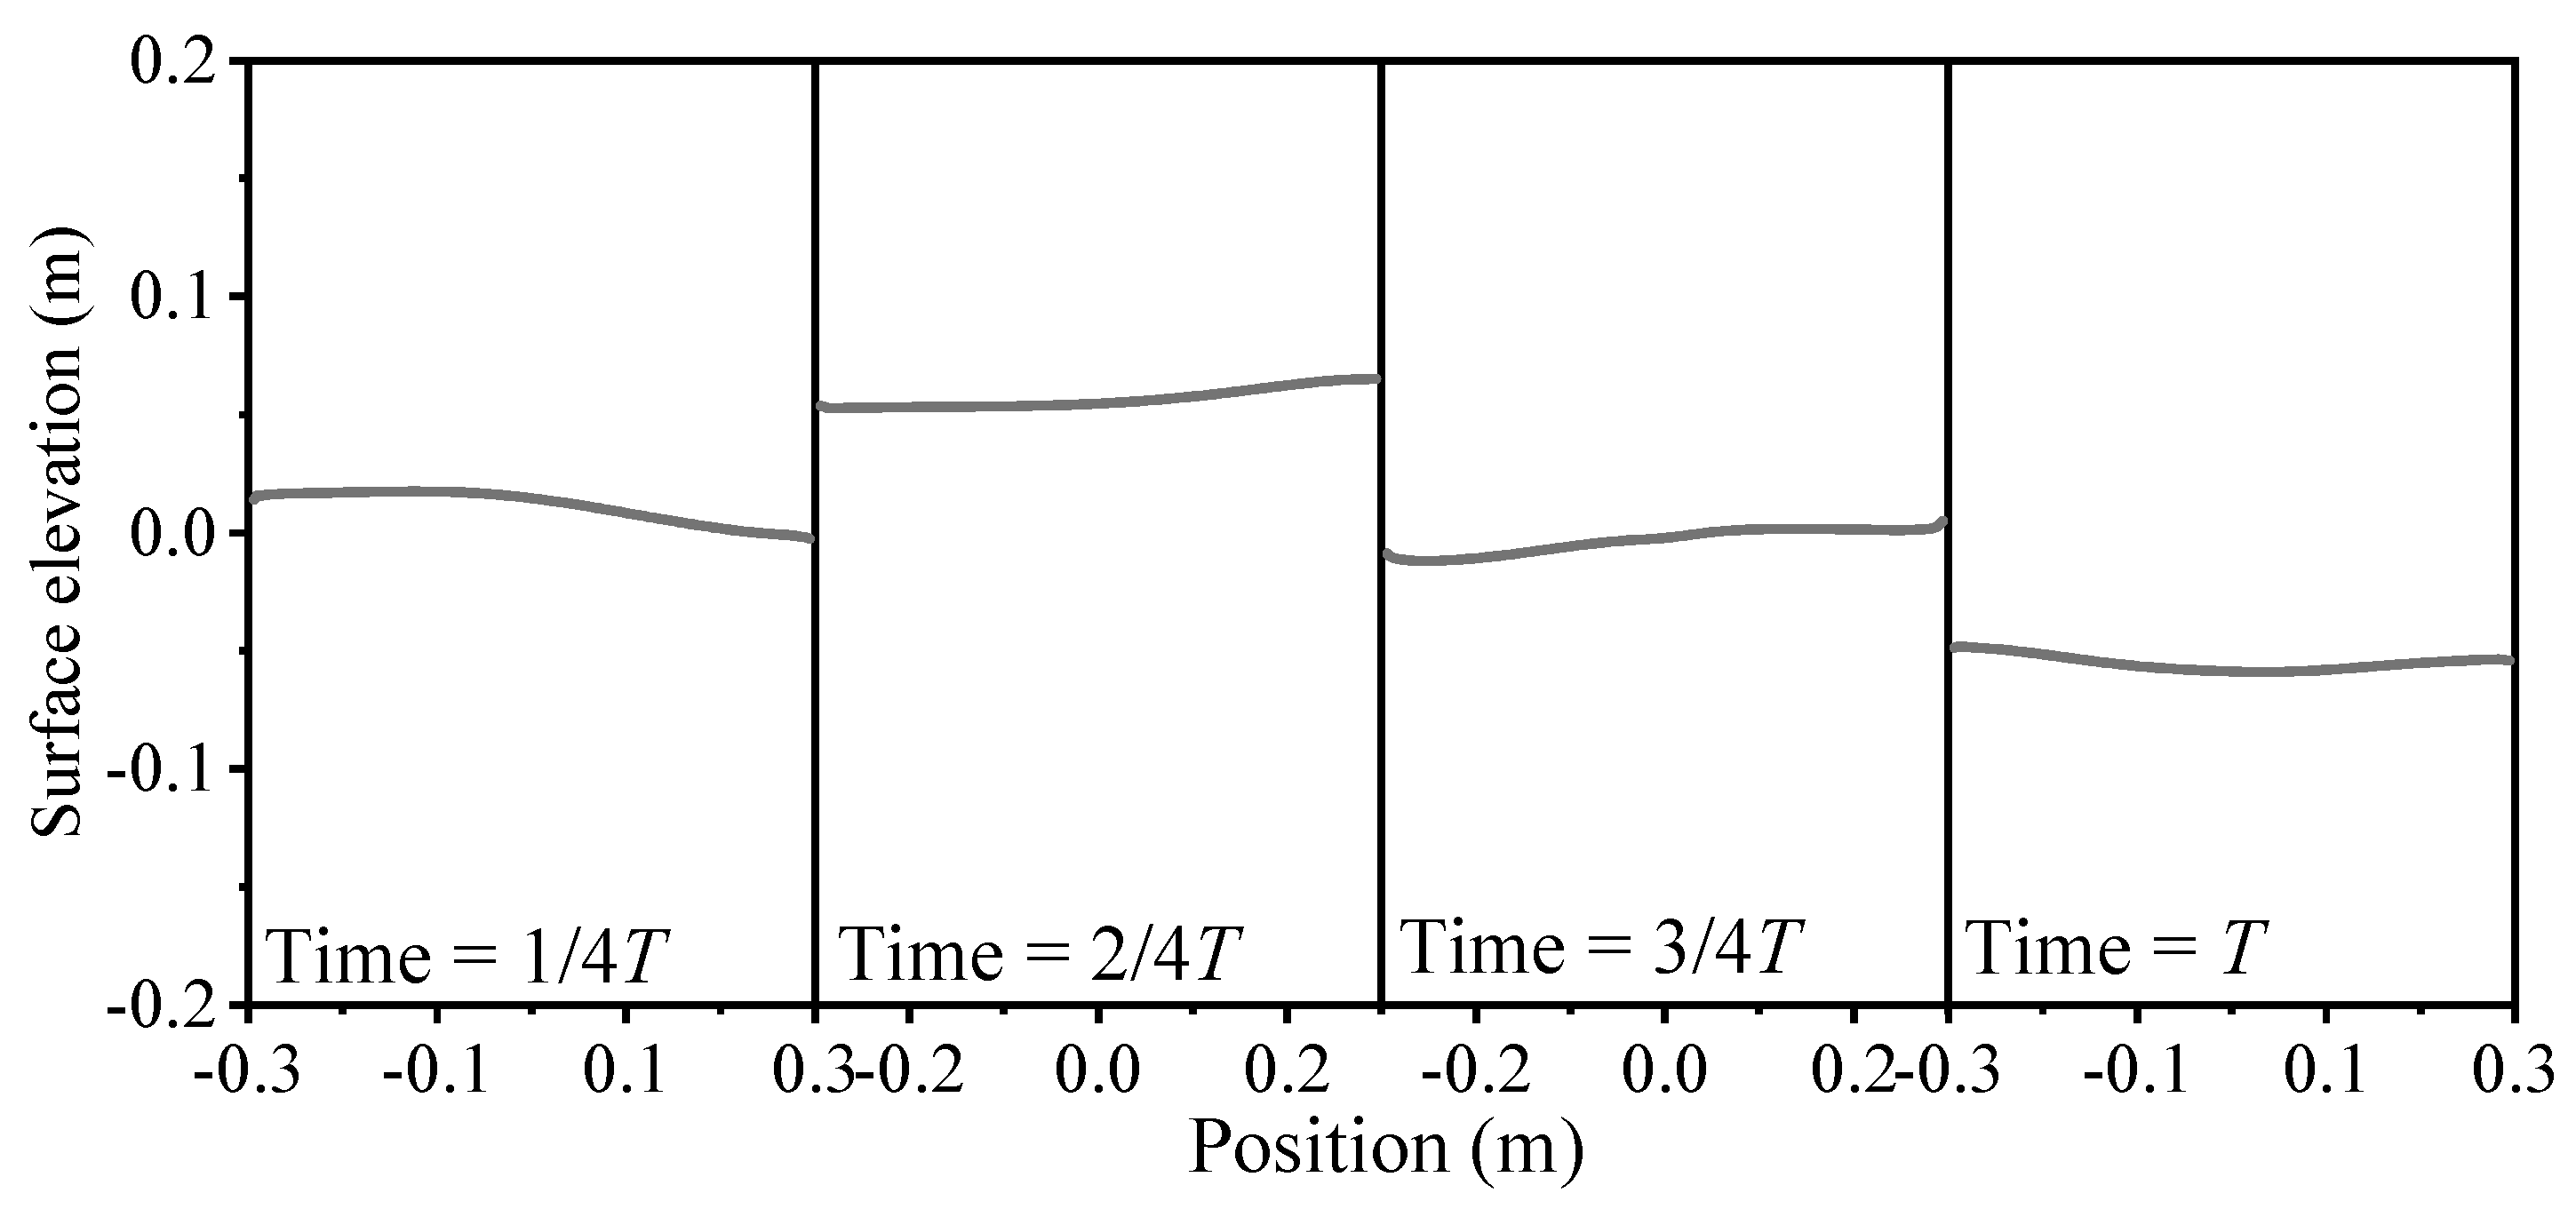
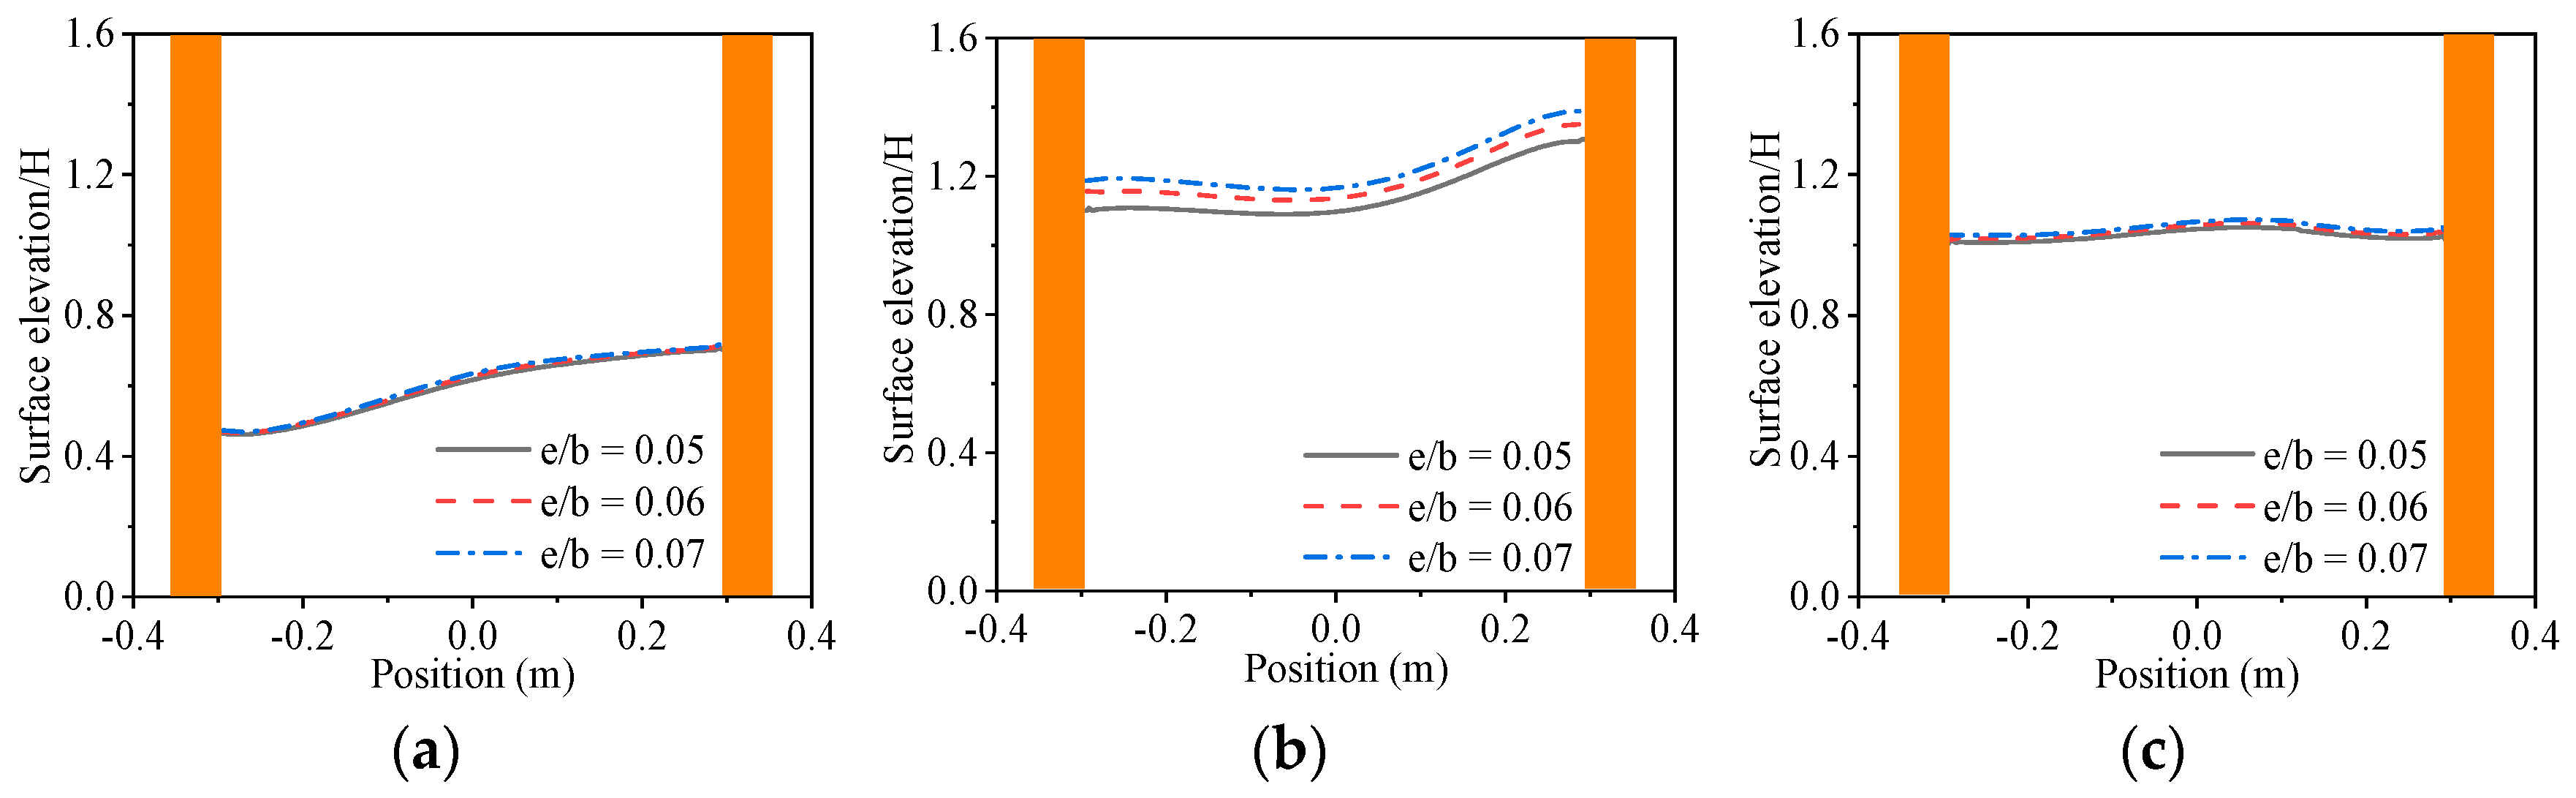
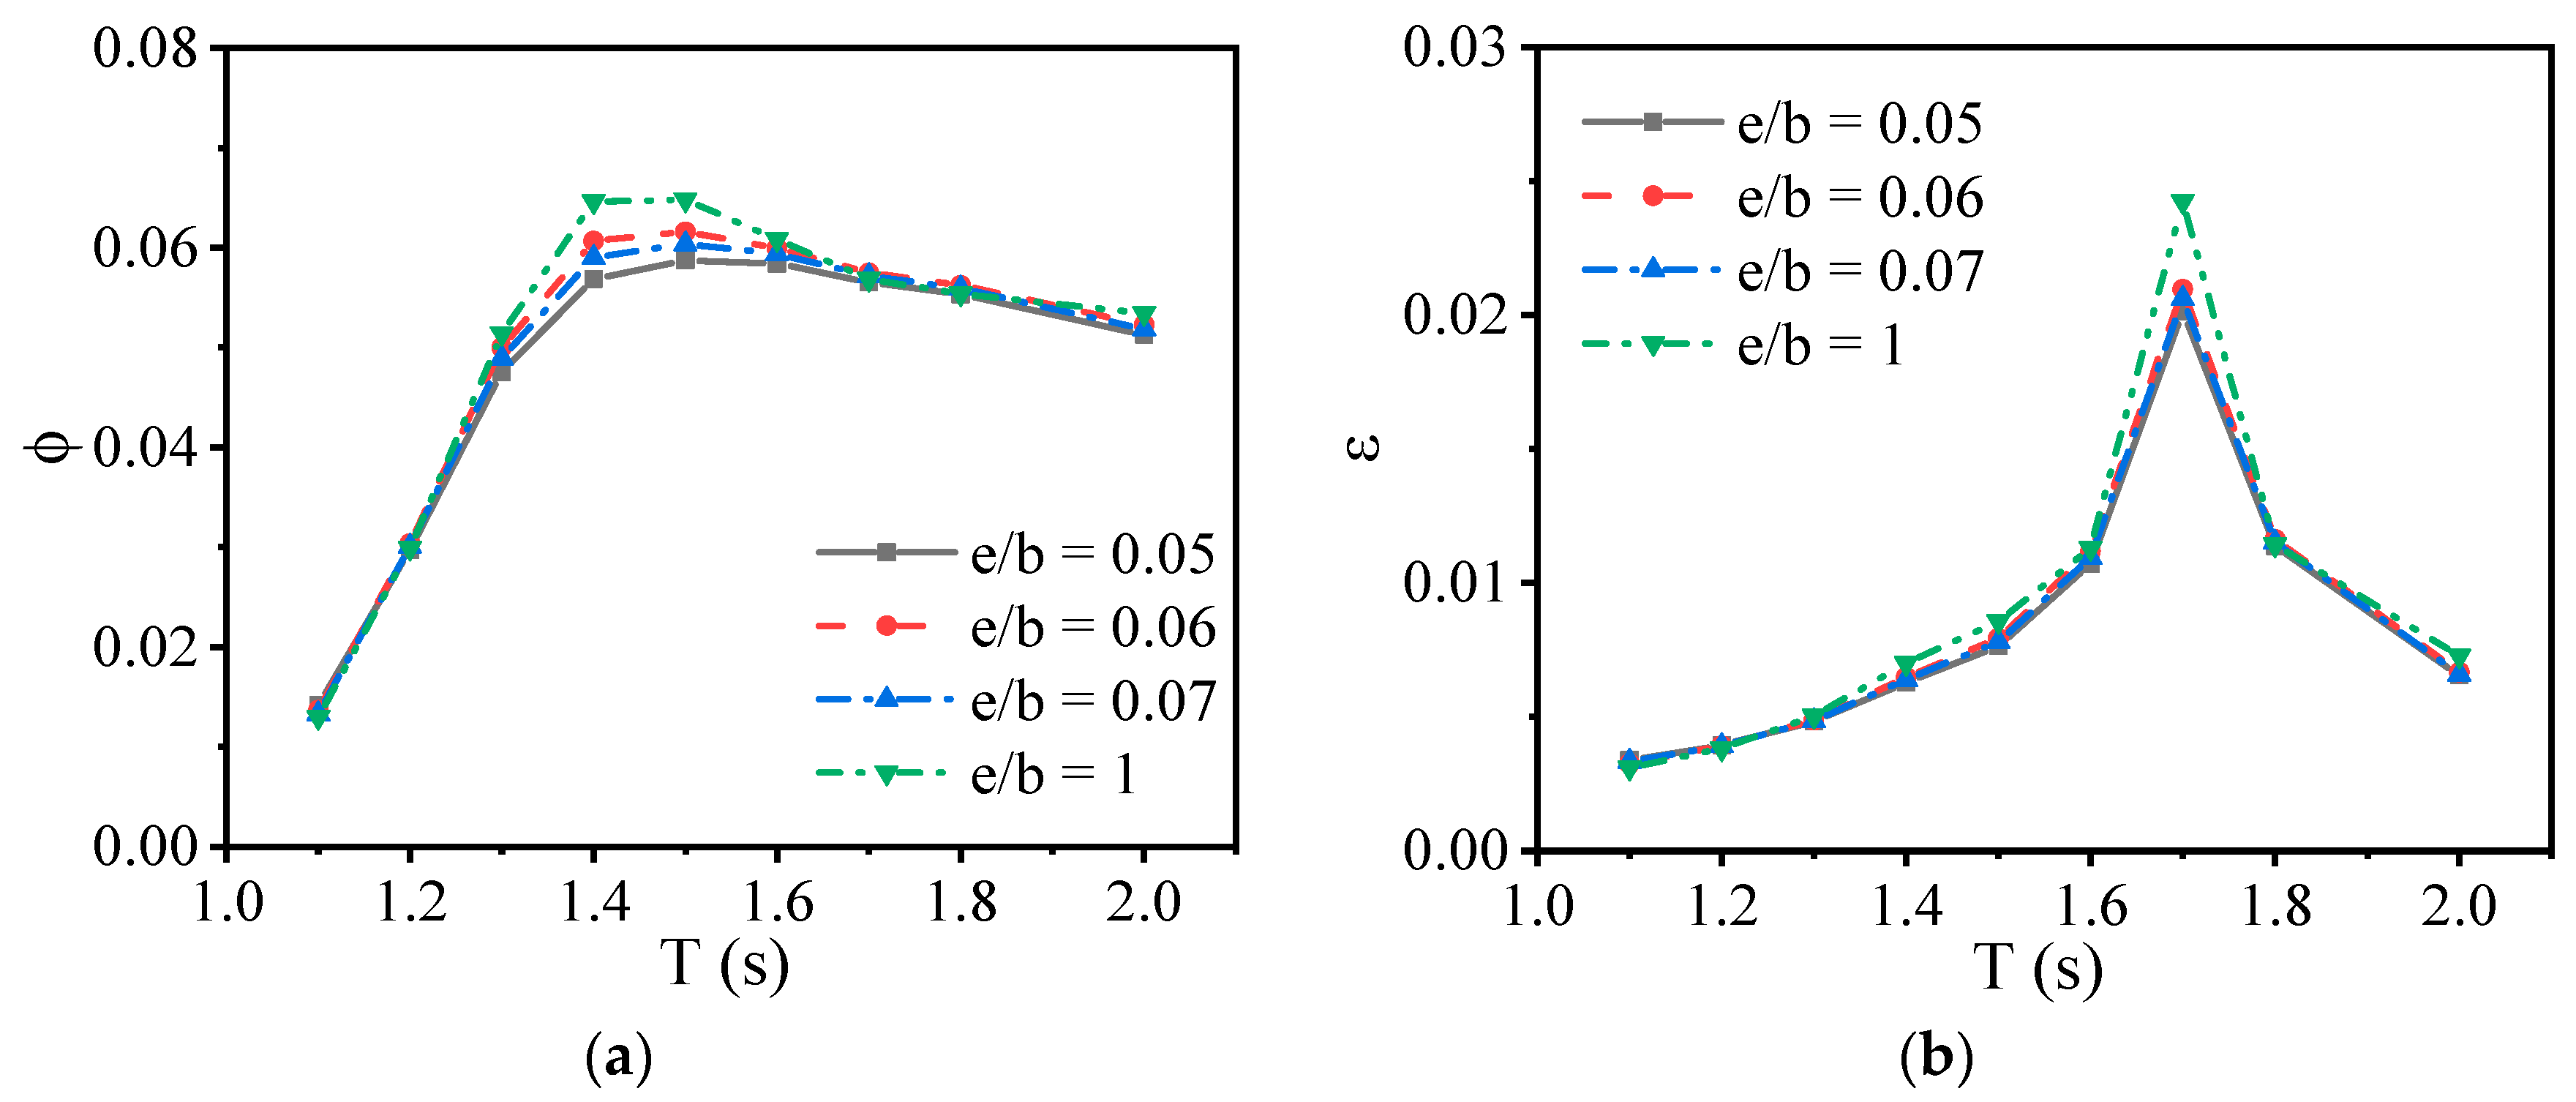
The inclination of the water column is low under both short and long waves, and the wave period corresponding to the maximum inclination is slightly greater than the resonance period of the OWC. Around the maximum inclination of the water column, multi-point measurements of the wave elevation in the chamber are necessary to reduce measurement errors caused by the spatial non-uniformity of the water column.
(3)
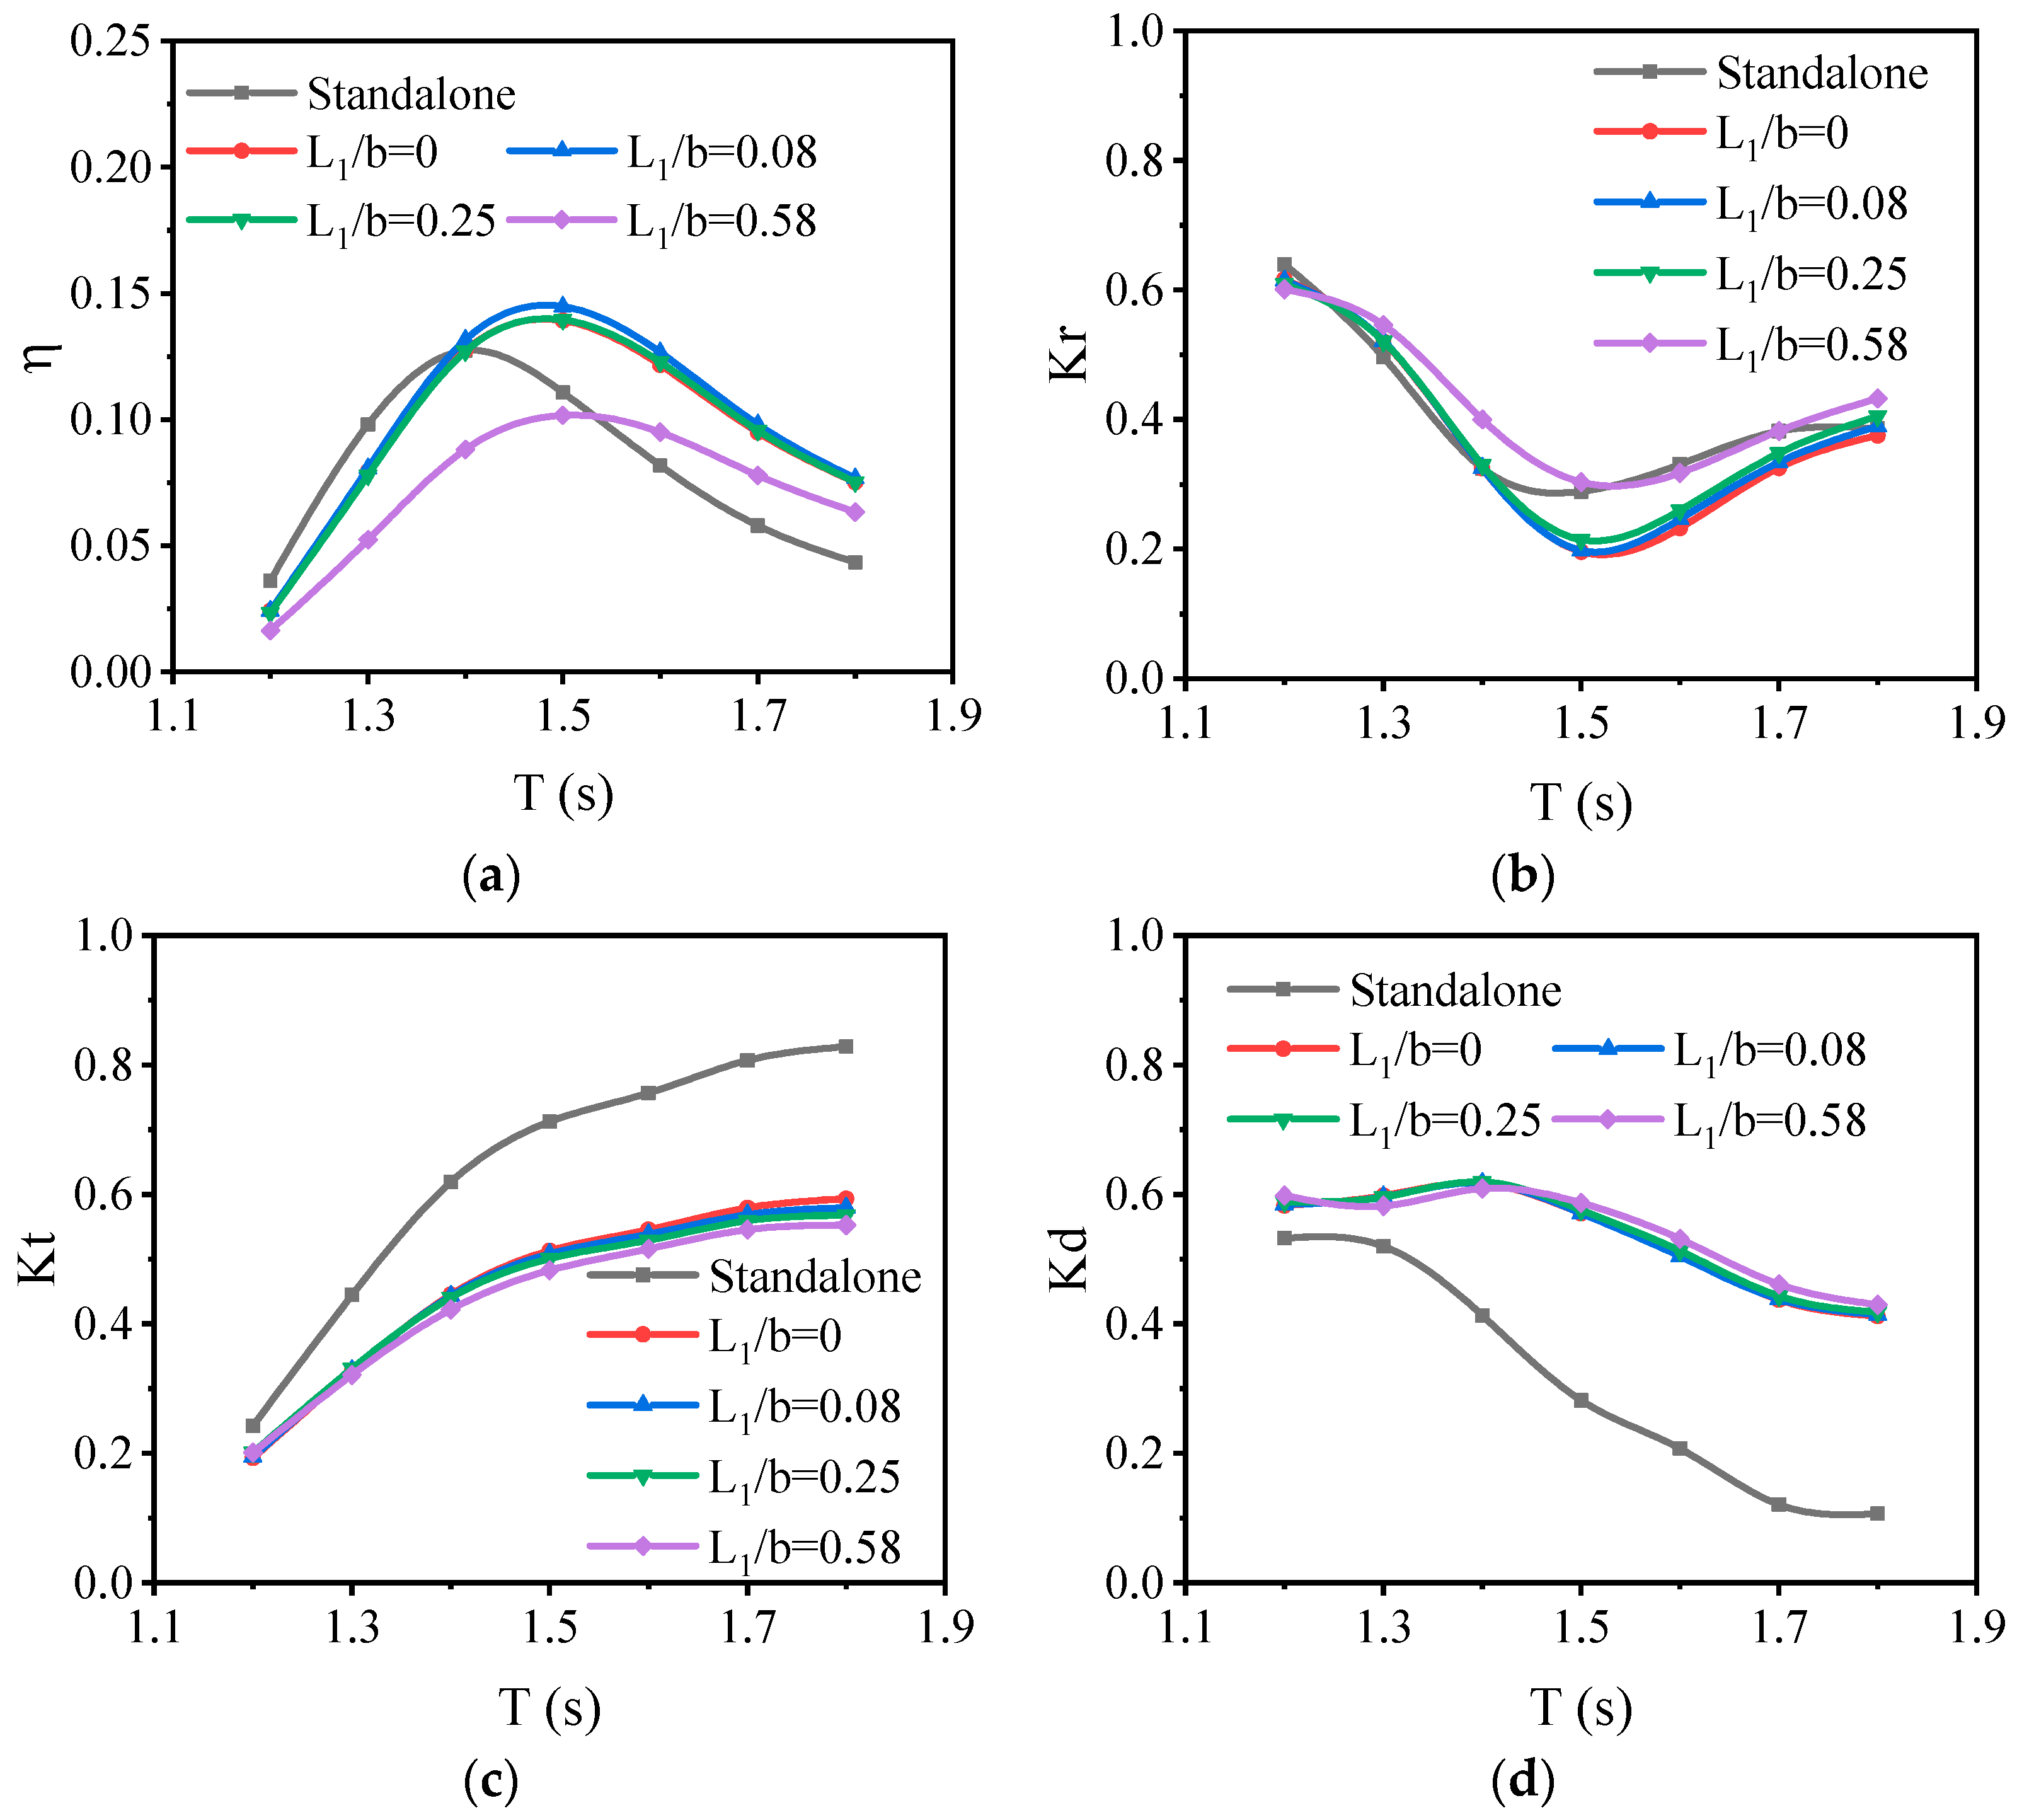
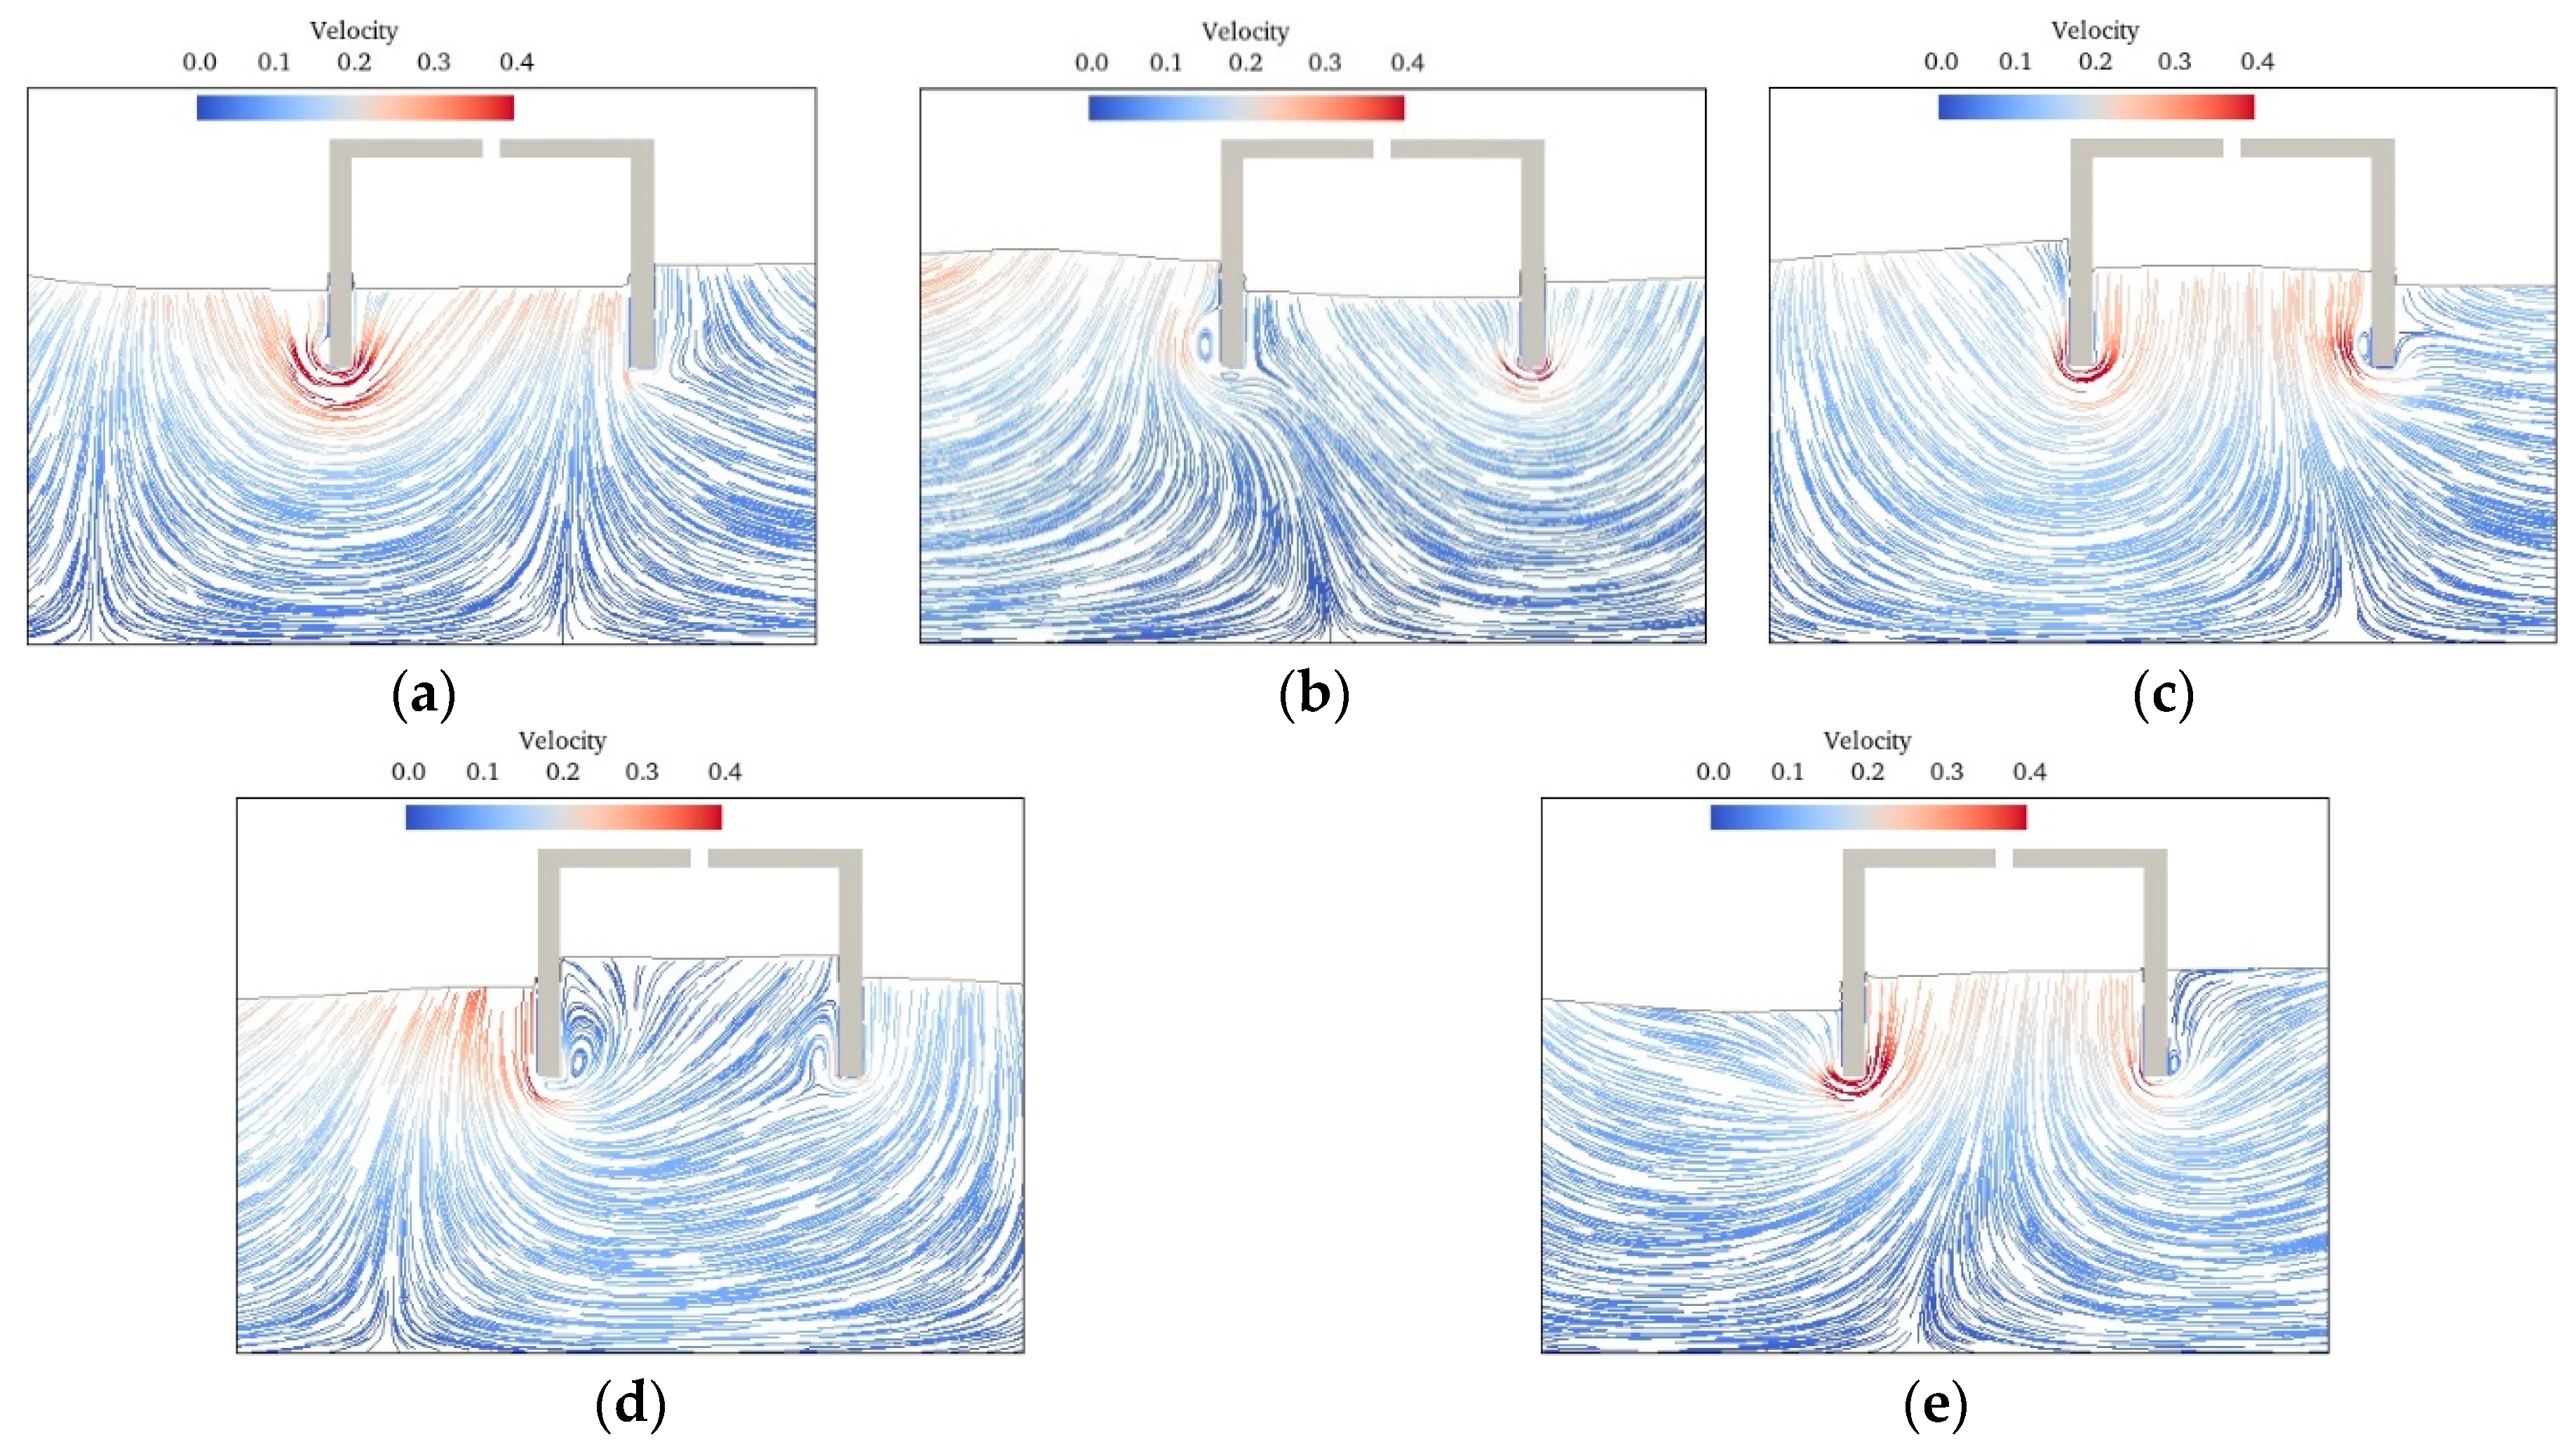
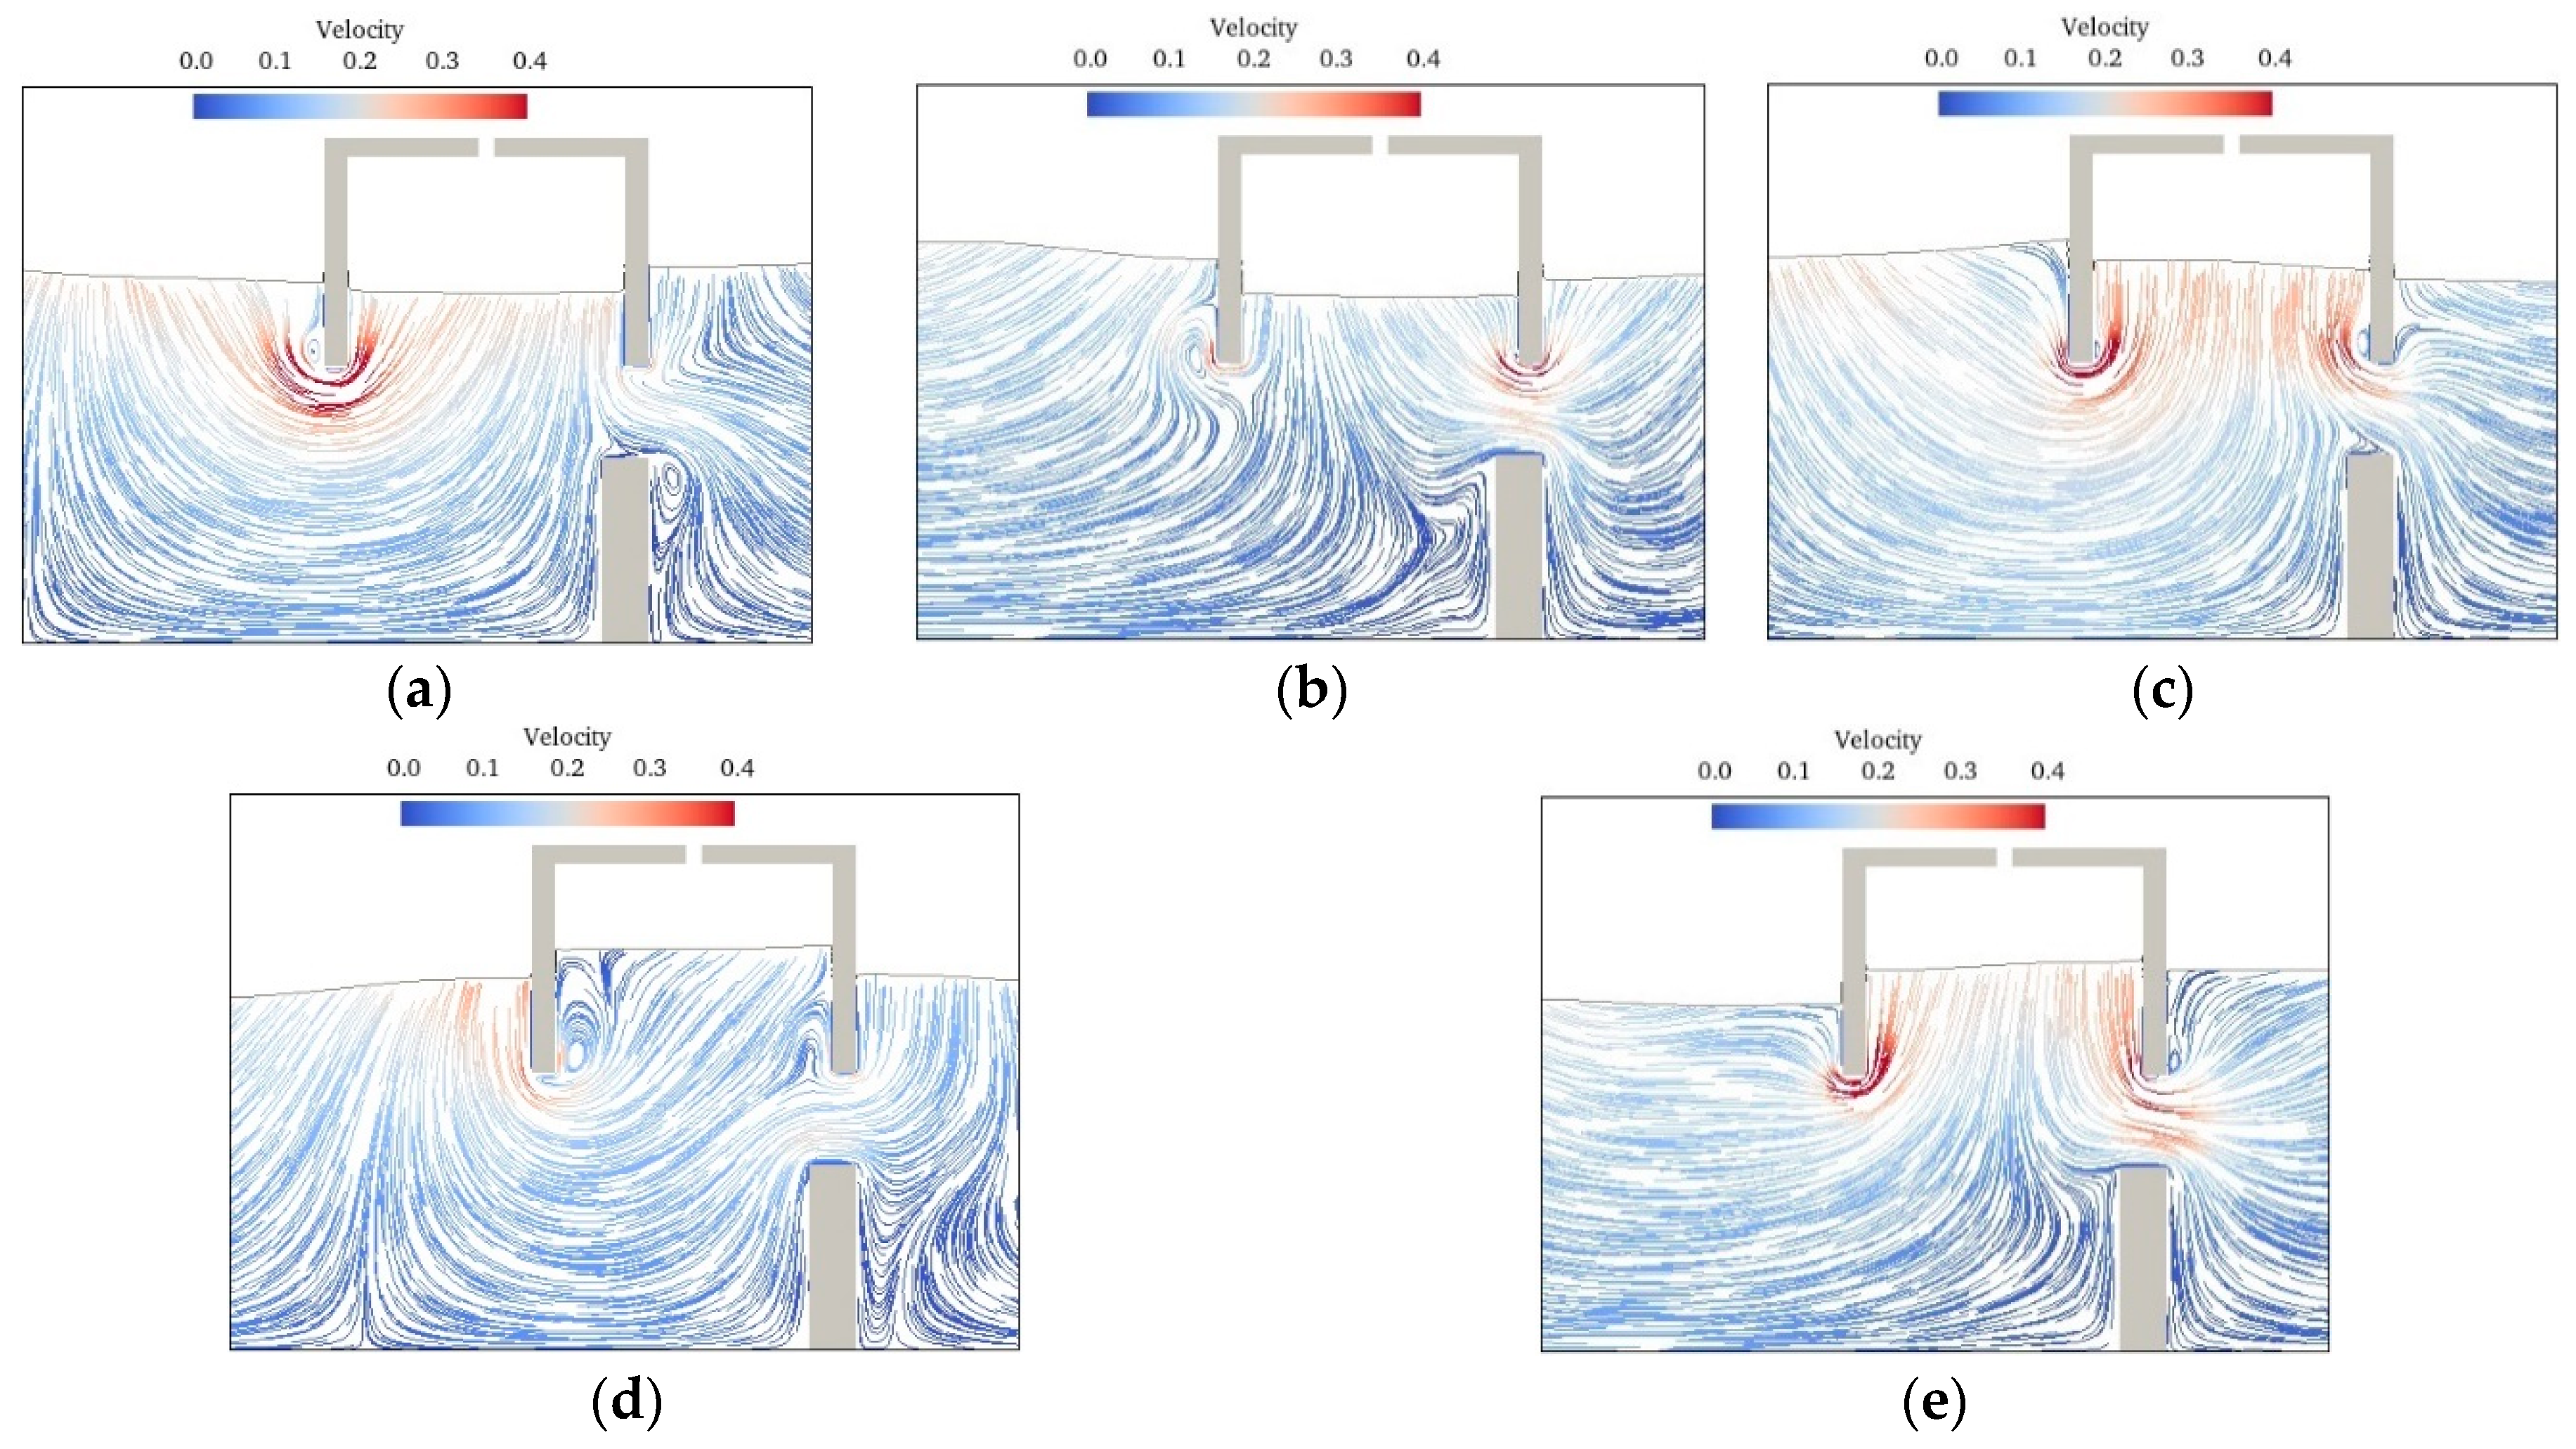
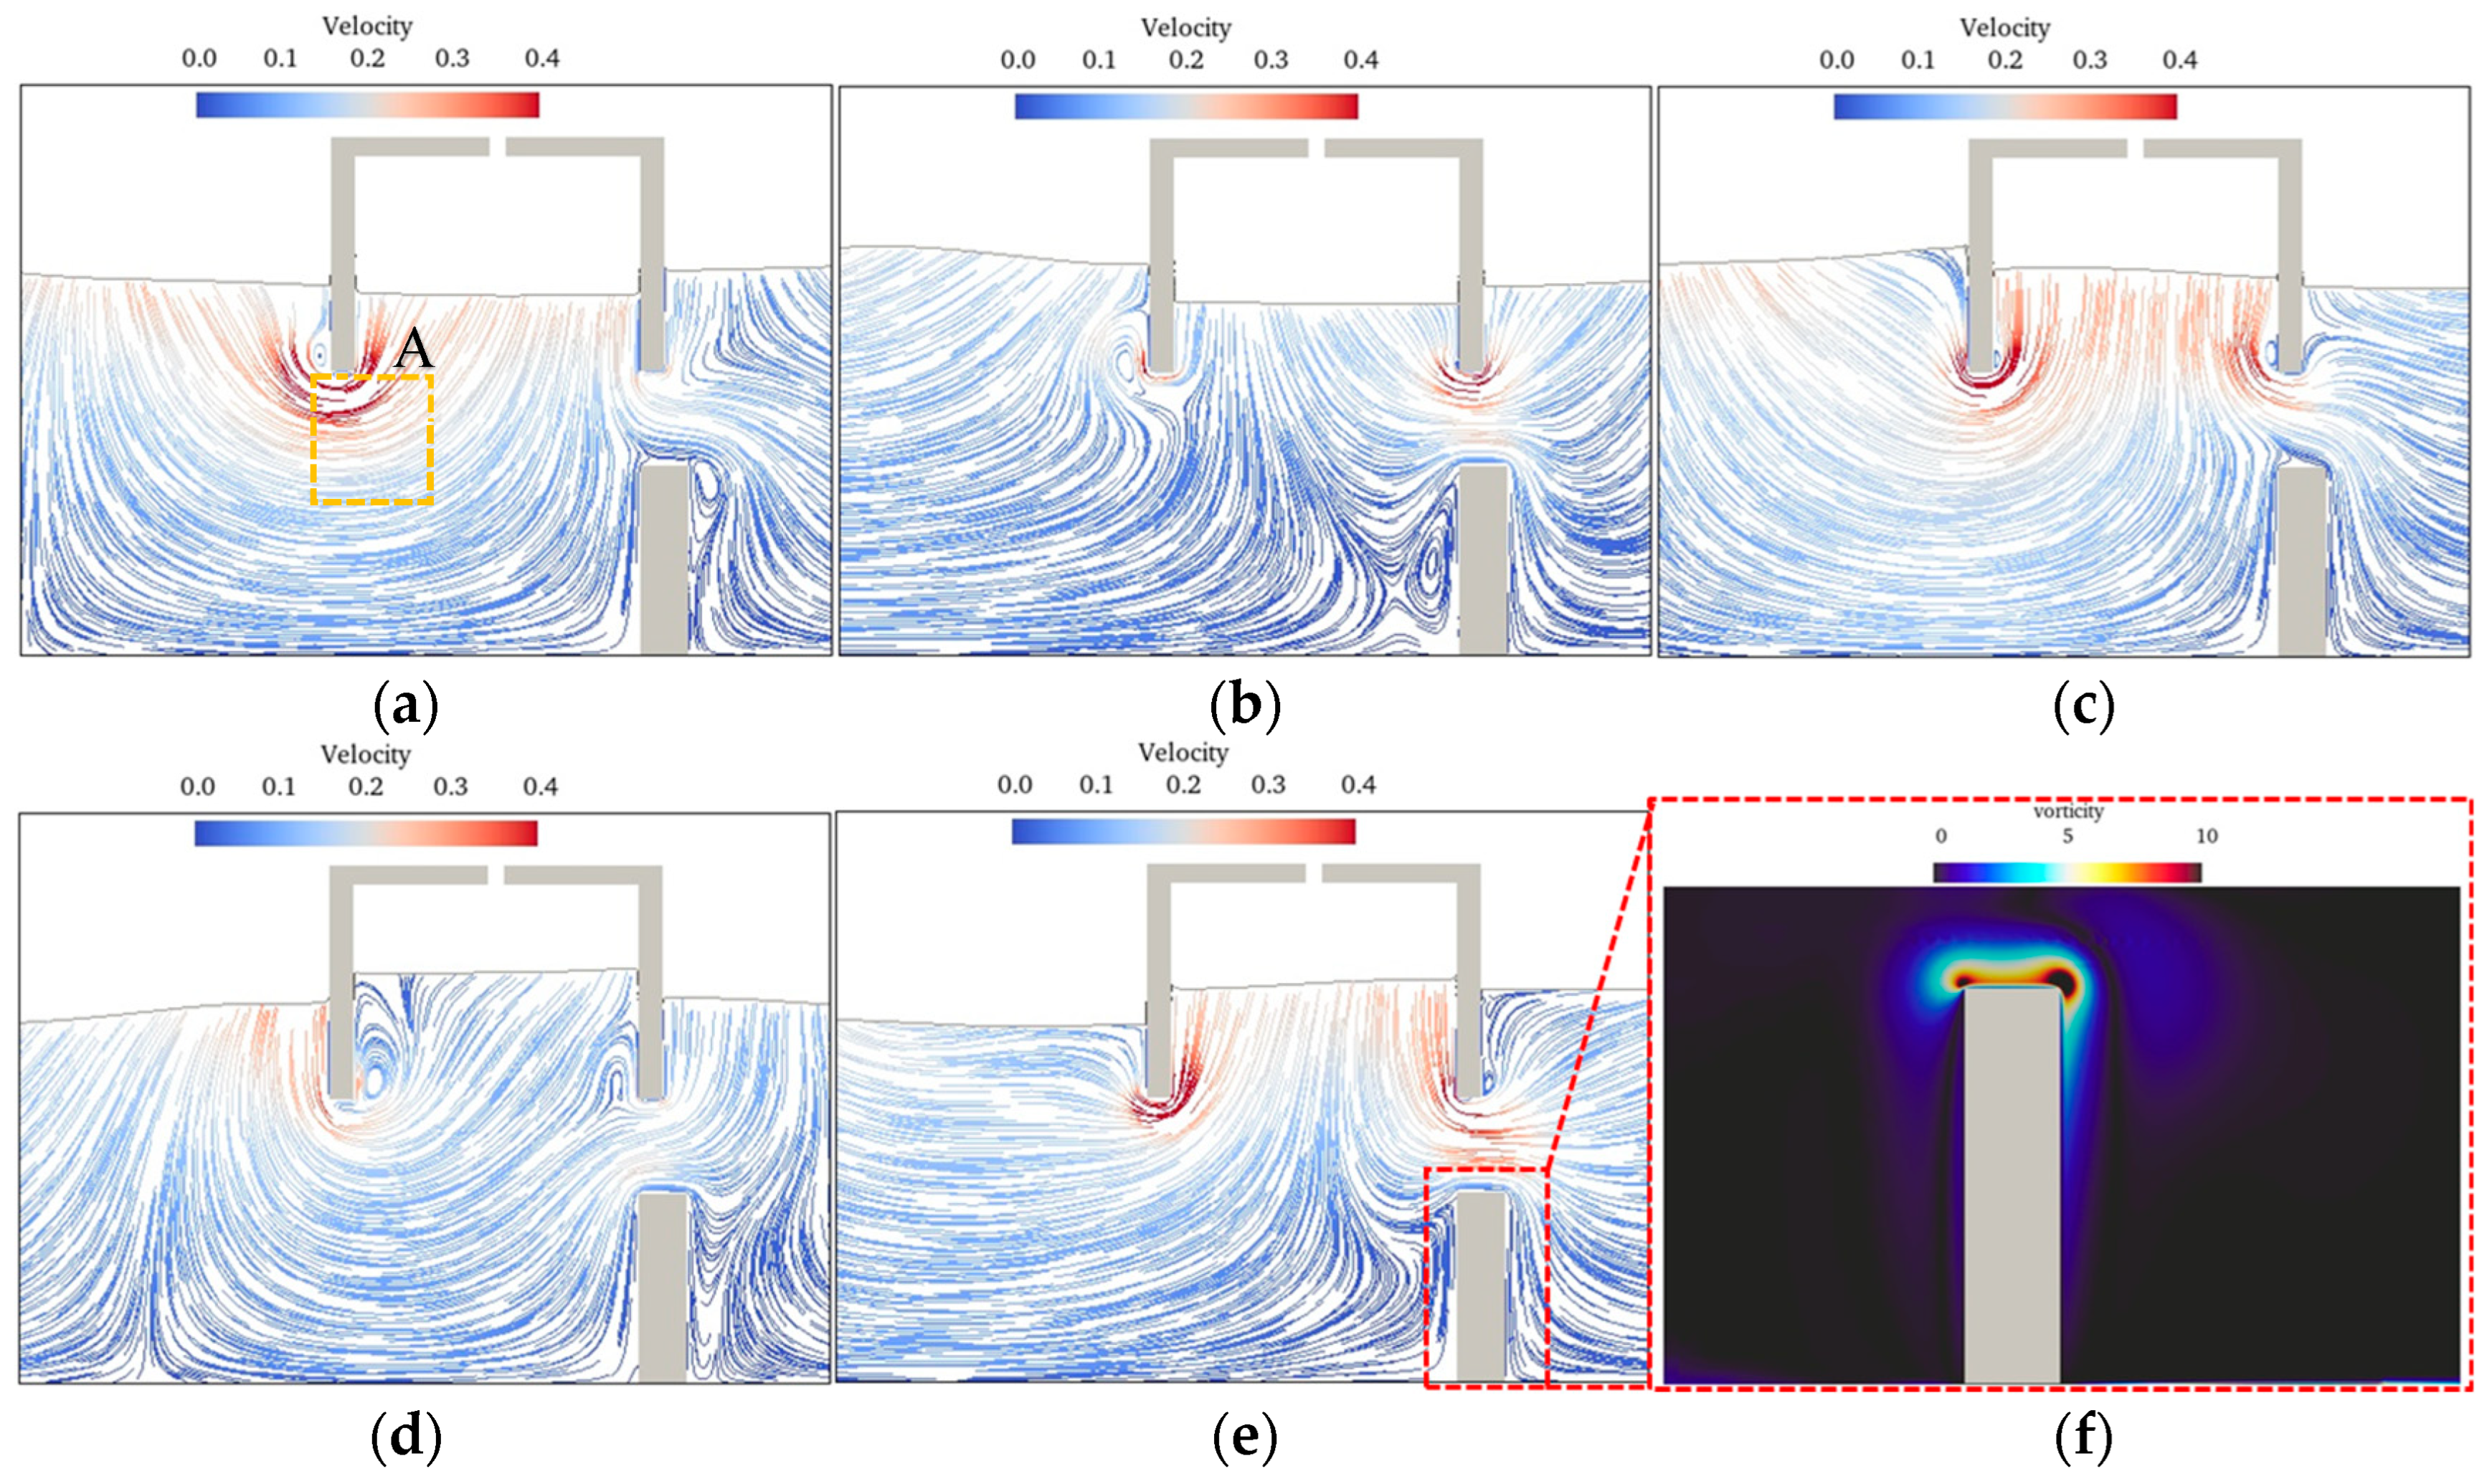
Compared to a standalone OWC, the submerged breakwater-OWC hybrid system exhibits a higher energy conversion efficiency in medium-to-long waves and superior wave attenuation performance.
(4)
When the submerged breakwater length L1 in the hybrid system is optimal and the back wall of the breakwater is aligned with the back wall of the OWC, the energy conversion efficiency is the highest. Future studies could explore the relationship between the OWC air chamber width and optimal breakwater dimensions, further optimizing the hydrodynamic performance of the integrated system.

Author Contributions

G.X.: Investigation, Validation, Conceptualization, Writing—original draft, Methodology, Software, Writing—reviewing and editing. C.H.: Investigation, Writing—original draft, Writing—reviewing and editing. D.L.: Investigation. Y.M.: Writing, reviewing, and editing. X.Z.: Investigation, Writing—original draft, Writing—reviewing and editing. Y.Z.: Writing, reviewing, and editing. All authors have read and agreed to the published version of the manuscript.

Funding

This work was supported by the National Natural Science Foundation of China (52471310, 52301356; 52001112); Guangdong Province Department of Natural Resources to promote high-quality economic development projects (GDOE[2024]44), Guangdong Laboratory of Southern Ocean Science and Engineering (Zhuhai) construction project (311020013), Basic strengthening projects (2022-JCJQ-JJ-0268).

Institutional Review Board Statement

Not applicable.

Informed Consent Statement

Not applicable.

Data Availability Statement

The data presented in this study are available on request from the corresponding author. The data are not publicly available due to intellectual property protection.

Conflicts of Interest

Author Dong Li was employed by the company CIMC Raffles Offshore Ltd. The remaining authors declare that the research was conducted in the absence of any commercial or financial relationships that could be construed as a potential conflict of interest.

References

  1. Clément, A.; McCullen, P.; Falcão, A.; Fiorentino, A.; Gardner, F.; Hammarlund, K.; Lemonis, G.; Lewis, T.; Nielsen, K.; Petroncini, S.; et al. Wave energy in Europe: Current status and perspectives. Renew. Sust. Energy Rev. 2002, 6, 405–431. [Google Scholar] [CrossRef]
  2. Crespo, A.J.C.; Altomare, C.; Domínguez, J.M.; González-Cao, J.; Gómez-Gesteira, M. Towards simulating floating offshore oscillating water column converters with Smoothed Particle Hydrodynamics. Coast. Eng. 2017, 126, 11–26. [Google Scholar] [CrossRef]
  3. Evans, D.V.; Porter, R. Hydrodynamic characteristics of an oscillating water column device. Appl. Ocean Res. 1995, 17, 155–164. [Google Scholar] [CrossRef]
  4. Mustapa, M.A.; Yaakob, O.B.; Ahmed, Y.M.; Rheem, C.; Koh, K.K.; Adnan, F.A. Wave energy device and breakwater integration: A review. Renew. Sustain. Energy Rev. 2017, 77, 43–58. [Google Scholar] [CrossRef]
  5. Elhanafi, A.; Macfarlane, G.; Fleming, A.; Leong, Z. Experimental and numerical investigations on the hydrodynamic performance of a floating–moored oscillating water column wave energy converter. Appl. Energy 2017, 205, 369–390. [Google Scholar] [CrossRef]
  6. Gao, J.; Lyu, J.; Wang, J.; Zhang, J.; Liu, Q.; Zang, J.; Zou, T. Study on Transient Gap Resonance with Consideration of the Motion of Floating Body. China Ocean Eng. 2022, 36, 994–1006. [Google Scholar] [CrossRef]
  7. Chen, J.; Wen, H.; Wang, Y.; Wang, G. A correlation study of optimal chamber width with the relative front wall draught of onshore OWC device. Energy 2021, 225, 120307. [Google Scholar] [CrossRef]
  8. Samak, M.M.; Elgamal, H.; Elmekawy, A.M.N. The contribution of L-shaped front wall in the improvement of the oscillating water column wave energy converter performance. Energy 2021, 226, 120421. [Google Scholar] [CrossRef]
  9. Çelik, A.; Altunkaynak, A. Experimental investigations on the performance of a fixed-oscillating water column type wave energy converter. Energy 2019, 188, 116071. [Google Scholar] [CrossRef]
  10. Wang, C.; Zhang, Y. Hydrodynamic performance of an offshore Oscillating Water Column device mounted over an immersed horizontal plate: A numerical study. Energy 2021, 222, 119964. [Google Scholar] [CrossRef]
  11. Ning, D.Z.; Wang, R.Q.; Zhang, C.W. Numerical Simulation of a Dual-Chamber Oscillating Water Column Wave Energy Converter. Sustainability 2017, 9, 1599. [Google Scholar] [CrossRef]
  12. Mirzaei, H.; Moghim, M.N.; Movahedian, B. Numerical Solution of Hydrodynamic Efficiency Equations for an Oscillating Water Column Wave Energy Converter Using the Method of Fundamental Solutions. Eng. Anal. Bound. Elem. 2024, 158, 270–288. [Google Scholar] [CrossRef]
  13. Kharati-Koopaee, M.; Fathi-Kelestani, A. Assessment of oscillating water column performance: Influence of wave steepness at various chamber lengths and bottom slopes. Renew. Energy 2020, 147, 1595–1608. [Google Scholar] [CrossRef]
  14. Mora, A.; Bautista, E.; Méndez, F. Influence of a tapered and slender wave collector on the increment of the efficiency of an oscillating water column wave-energy converter. Ocean Eng. 2017, 129, 20–36. [Google Scholar] [CrossRef]
  15. Rezanejad, K.; Bhattacharjee, J.; Soares, C.G. Analytical and Numerical Study of Nearshore Multiple Oscillating Water Columns. J. Offshore Mech. Arct. 2016, 138, 021901. [Google Scholar] [CrossRef]
  16. Zheng, S.; Antonini, A.; Zhang, Y.; Greaves, D.; Miles, J.; Iglesias, G. Wave power extraction from multiple oscillating water columns along a straight coast. J. Fluid Mech. 2019, 878, 445–480. [Google Scholar] [CrossRef]
  17. Boccotti, P.; Filianoti, P.; Fiamma, V.; Arena, F. Caisson breakwaters embodying an OWC with a small opening—Part II: A small-scale field experiment. Ocean Eng. 2007, 34, 820–841. [Google Scholar] [CrossRef]
  18. Wang, C.; Ma, T.; Zhang, Y. Semi-analytical study on an integrated-system with separated heaving OWC and breakwater: Structure size optimization and gap resonance utilization. Ocean Eng. 2022, 245, 110319. [Google Scholar] [CrossRef]
  19. Han, Z.; Liu, Z.; Shi, H. Numerical study on overtopping performance of a multi-level breakwater for wave energy conversion. Ocean Eng. 2018, 150, 94–101. [Google Scholar] [CrossRef]
  20. Martins-Rivas, H.; Mei, C.C. Wave power extraction from an oscillating water column along a straight coast. Ocean Eng. 2009, 36, 426–433. [Google Scholar] [CrossRef]
  21. Martins-Rivas, H.; Mei, C.C. Wave power extraction from an oscillating water column at the tip of a breakwater. J. Fluid Mech. 2009, 626, 395–414. [Google Scholar] [CrossRef]
  22. Elhanafi, A.; Macfarlane, G.; Fleming, A.; Leong, Z. Scaling and air compressibility effects on a three-dimensional offshore stationary OWC wave energy converter. Appl. Energy 2017, 189, 1–20. [Google Scholar] [CrossRef]
  23. Hirt, C.W.; Nichols, B.D. Volume of fluid (VOF) method for the dynamics of free boundaries. J. Comput. Phys. 1981, 39, 201–225. [Google Scholar] [CrossRef]
  24. Fuhrman, D.R.; Madsen, P.A.; Bingham, H.B. Numerical simulation of lowest-order short-crested wave instabilities. J. Fluid Mech. 2006, 563, 415. [Google Scholar] [CrossRef]
  25. Jacobsen, N.G.; Fuhrman, D.R.; Fredsøe, J. A wave generation toolbox for the open-source CFD library: OpenFoam®. Int. J. Numer. Methods Fluids 2012, 70, 1073–1088. [Google Scholar] [CrossRef]
  26. Xie, G.; Hu, C.; Zhao, T.; Ma, Y.; Ni, W. Coupled hydrodynamic performance investigations of a hybrid system with oscillating water column and submerged breakwater. Ocean Eng. 2023, 283, 115205. [Google Scholar] [CrossRef]
  27. Iturrioz, A.; Guanche, R.; Lara, J.L.; Vidal, C.; Losada, I.J. Validation of OpenFOAM® for Oscillating Water Column three-dimensional modeling. Ocean Eng. 2015, 107, 222–236. [Google Scholar] [CrossRef]
  28. He, F.; Huang, Z. Hydrodynamic performance of pile-supported OWC-type structures as breakwaters: An experimental study. Ocean Eng. 2014, 88, 618–626. [Google Scholar] [CrossRef]
  29. Zhang, H.; Zhou, B.; Zang, J.; Vogel, C.; Fan, T.; Chen, C. Effects of narrow gap wave resonance on a dual-floater WEC-breakwater hybrid system. Ocean Eng. 2021, 225, 108762. [Google Scholar] [CrossRef]
  30. Çelik, A.; Altunkaynak; Çelik, A.; Altunkaynak, A. Experimental and analytical investigation on chamber water surface fluctuations and motion behaviours of water column type wave energy converter. Ocean Eng. 2018, 150, 209–220. [Google Scholar] [CrossRef]
Figure 1. The flow chart of the investigation.
Jmse 12 02191 g001
Figure 2. Convergence analysis of the numerical wave tank mesh. (a) T = 1.3 s. (b) T = 1.6 s. (c) T = 2.0 s. (d) the relative differences for dz = H/15.
Jmse 12 02191 g002
Figure 3. Dimensions of the wave tank and OWC.
Jmse 12 02191 g003
Figure 4. Comparison of surface elevation for Case1 and Case2 [28].
Jmse 12 02191 g004
Figure 5. Comparison of chamber pressure for Case2 and Case3 [27].
Jmse 12 02191 g005
Figure 6. Illustration of the OWC in a numerical wave tank.
Jmse 12 02191 g006
Figure 7. The curve of conversion efficiency, reflection coefficient, transmission coefficient, and dissipation coefficient for different opening heights c/H. (a) Conversion efficiency. (b) Reflection coefficient. (c) Transmission coefficient. (d) Dissipation coefficient.
Jmse 12 02191 g007
Figure 8. Vorticity and flow field of different opening heights as c/H = 0, 0.5, and 2.0 (T = 1.5 s). (a) c/H = 0. (b) c/H = 0.5. (c) c/H = 2.0.
Jmse 12 02191 g008
Figure 9. The curves of conversion efficiency, reflection coefficient, transmission coefficient, and dissipation coefficient for different drafts a/H. (a) Conversion efficiency. (b) Reflection coefficient. (c) Transmission coefficient. (d) Dissipation coefficient.
Jmse 12 02191 g009
Figure 10. Velocity stream tracers of different drafts (a/H = 1.25, 3.75) and different periods (T = 1.3, 1.6 s). (a) a/H = 1.0 T = 1.3 s. (b) a/H = 1.0 T = 1.6 s. (c) a/H = 3.0 T = 1.3 s. (d) a/H = 3.0 T = 1.6 s.
Jmse 12 02191 g010
Figure 11. The curves of conversion efficiency, reflection coefficient, transmission coefficient, and dissipation coefficient for different chamber widths b/H. (a) Conversion efficiency. (b) Reflection coefficient. (c) Transmission coefficient. (d) Dissipation coefficient.
Jmse 12 02191 g011
Figure 12. The effect of different PTO damping on OWC energy conversion efficiency.
Jmse 12 02191 g012
Figure 13. Surface elevation at different times inside the OWC chamber (T = 1.1 s).
Jmse 12 02191 g013
Figure 14. Surface elevation at different times inside the OWC chamber (T = 1.4 s).
Jmse 12 02191 g014
Figure 15. Surface elevation at different times inside the OWC chamber (T = 2.0 s).
Jmse 12 02191 g015
Figure 16. Dimensionless elevation amplitudes inside the OWC chamber for different opening widths. (a) T = 1.1 s. (b) T = 1.4 s. (c) T = 2.0 s.
Jmse 12 02191 g016
Figure 17. The motion of the water column inside the chamber varies with the wave period under different PTO damping. (a) average amplitude. (b) inclination.
Jmse 12 02191 g017
Figure 18. Diagram of the OWC-submerged breakwater hybrid system.
Jmse 12 02191 g018
Figure 19. The curves of conversion efficiency, reflection coefficient, transmission coefficient, and dissipation coefficient for different lengths L1/b. (a) Conversion efficiency. (b) Reflection coefficient. (c) Transmission coefficient. (d) Dissipation coefficient.
Jmse 12 02191 g019
Figure 20. Velocity stream tracer of the standalone OWC (T = 1.5 s). (a) time = T/5. (b) time = T2/5. (c) time = T3/5. (d) time = T4/5. (e) time = T.
Jmse 12 02191 g020
Figure 21. Velocity stream tracer of the OWC-rectangular submerged breakwater (L1/b = 0.08) hybrid system (T = 1.5 s). (a) time = T/5. (b) time = T2/5. (c) time = T3/5. (d) time = T4/5. (e) time = T.
Jmse 12 02191 g021
Figure 22. Velocity stream tracer of the OWC-rectangular submerged breakwater (L1/b = 0.58) hybrid system (T = 1.5 s). (a) time = T/5. (b) time = T2/5. (c) time = T3/5. (d) time = T4/5. (e) time = T.
Jmse 12 02191 g022
Figure 23. The curves of conversion efficiency, reflection coefficient, transmission coefficient, and dissipation coefficient for different lengths L2/b. (a) Conversion efficiency. (b) Reflection coefficient. (c) Transmission coefficient. (d) Dissipation coefficient.
Jmse 12 02191 g023
Figure 24. Velocity stream tracer and vorticity of OWC-rectangular submerged breakwater ( L 2 b =0.08) hybrid system (T = 1.5 s). (a) time = T/5. (b) time = T2/5. (c) time = T3/5. (d) time = T4/5. (e) time = T. (f) Vorticity.
Jmse 12 02191 g024
Figure 25. Velocity stream tracer and vorticity of OWC-rectangular submerged breakwater ( L 2 b =0.58) hybrid system (T = 1.5 s). (a) time = T/5. (b) time = T2/5. (c) time = T3/5. (d) time = T4/5. (e) time = T. (f) Vorticity.
Jmse 12 02191 g025
Table 1. Wave parameters and OWC parameters for validation case.
CaseH (m)T (s)e (m)
10.081.30.05
20.081.30.009
30.082.20.009
Disclaimer/Publisher’s Note: The statements, opinions and data contained in all publications are solely those of the individual author(s) and contributor(s) and not of MDPI and/or the editor(s). MDPI and/or the editor(s) disclaim responsibility for any injury to people or property resulting from any ideas, methods, instructions or products referred to in the content.

