
Effect of the Vortex on the Movement Law of Sand Particles in the Hump Region of Pump-Turbine


Abstract
1. Introduction
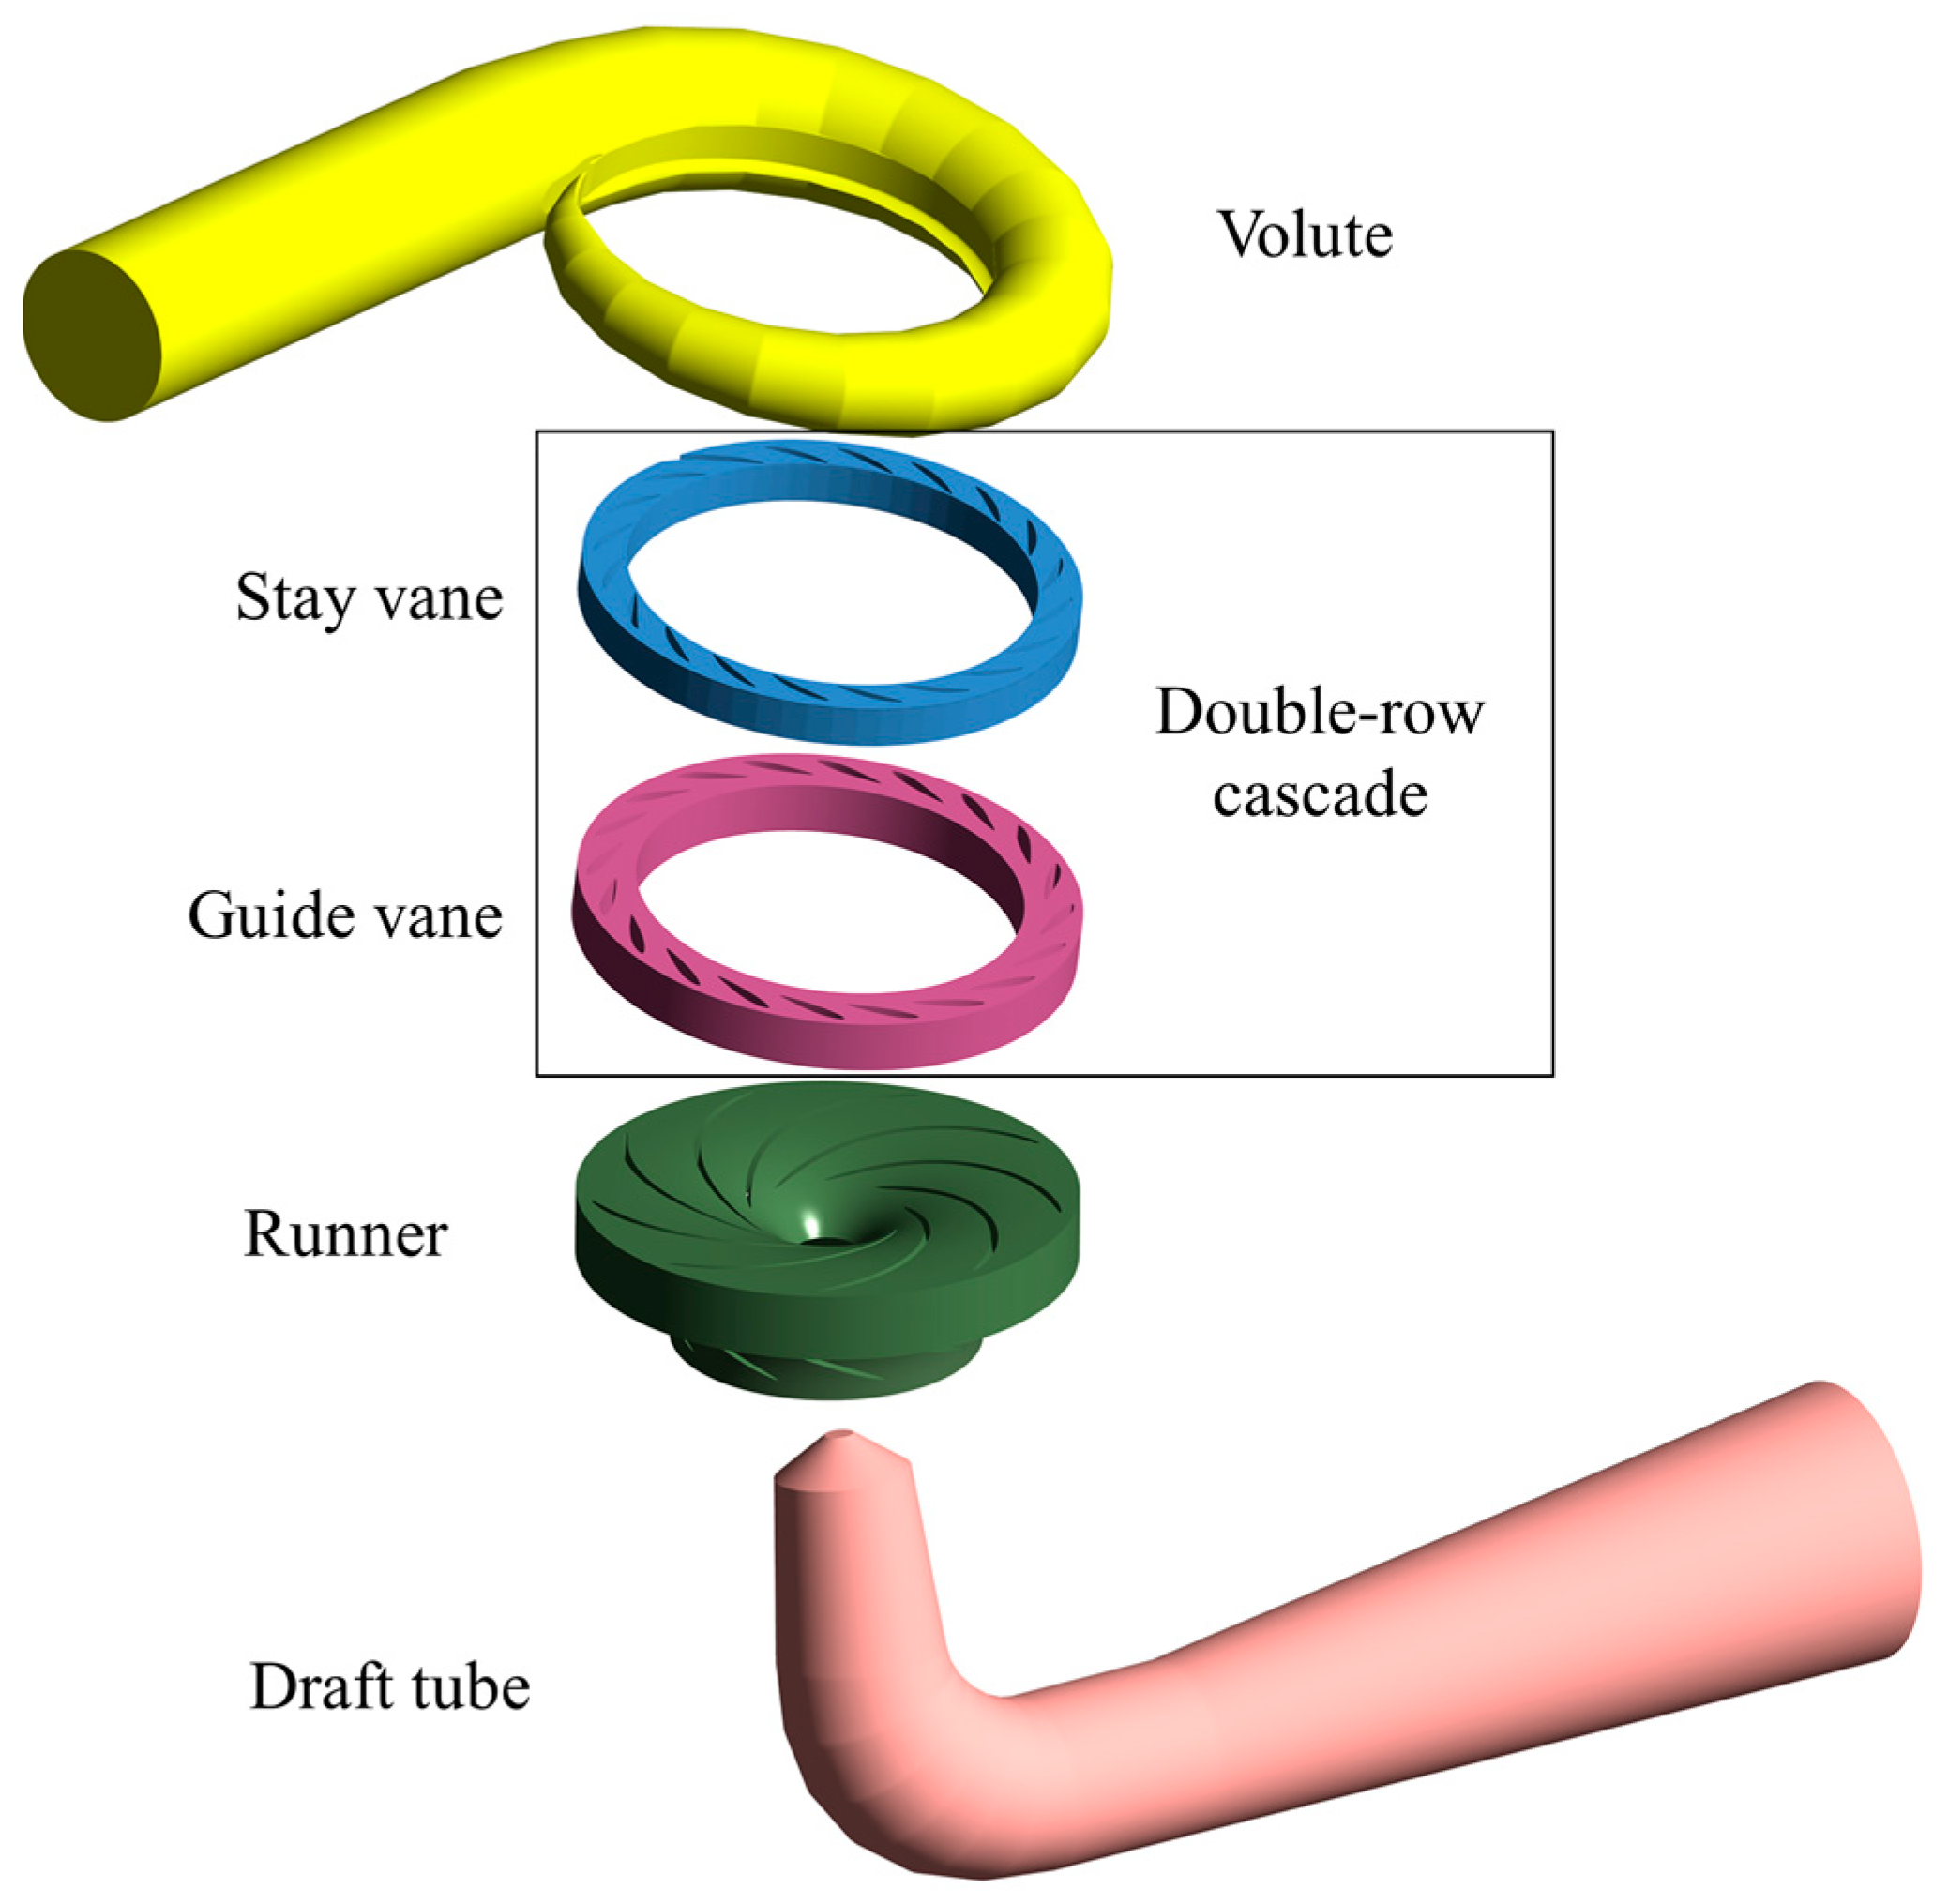
2. Research Object
3. Research Methods
3.1. Theoretical Approach
3.1.1. SST k-ω Model
3.1.2. Lagrangian Model
3.1.3. Omega Vortex Identification Method
3.2. Numerical Methods
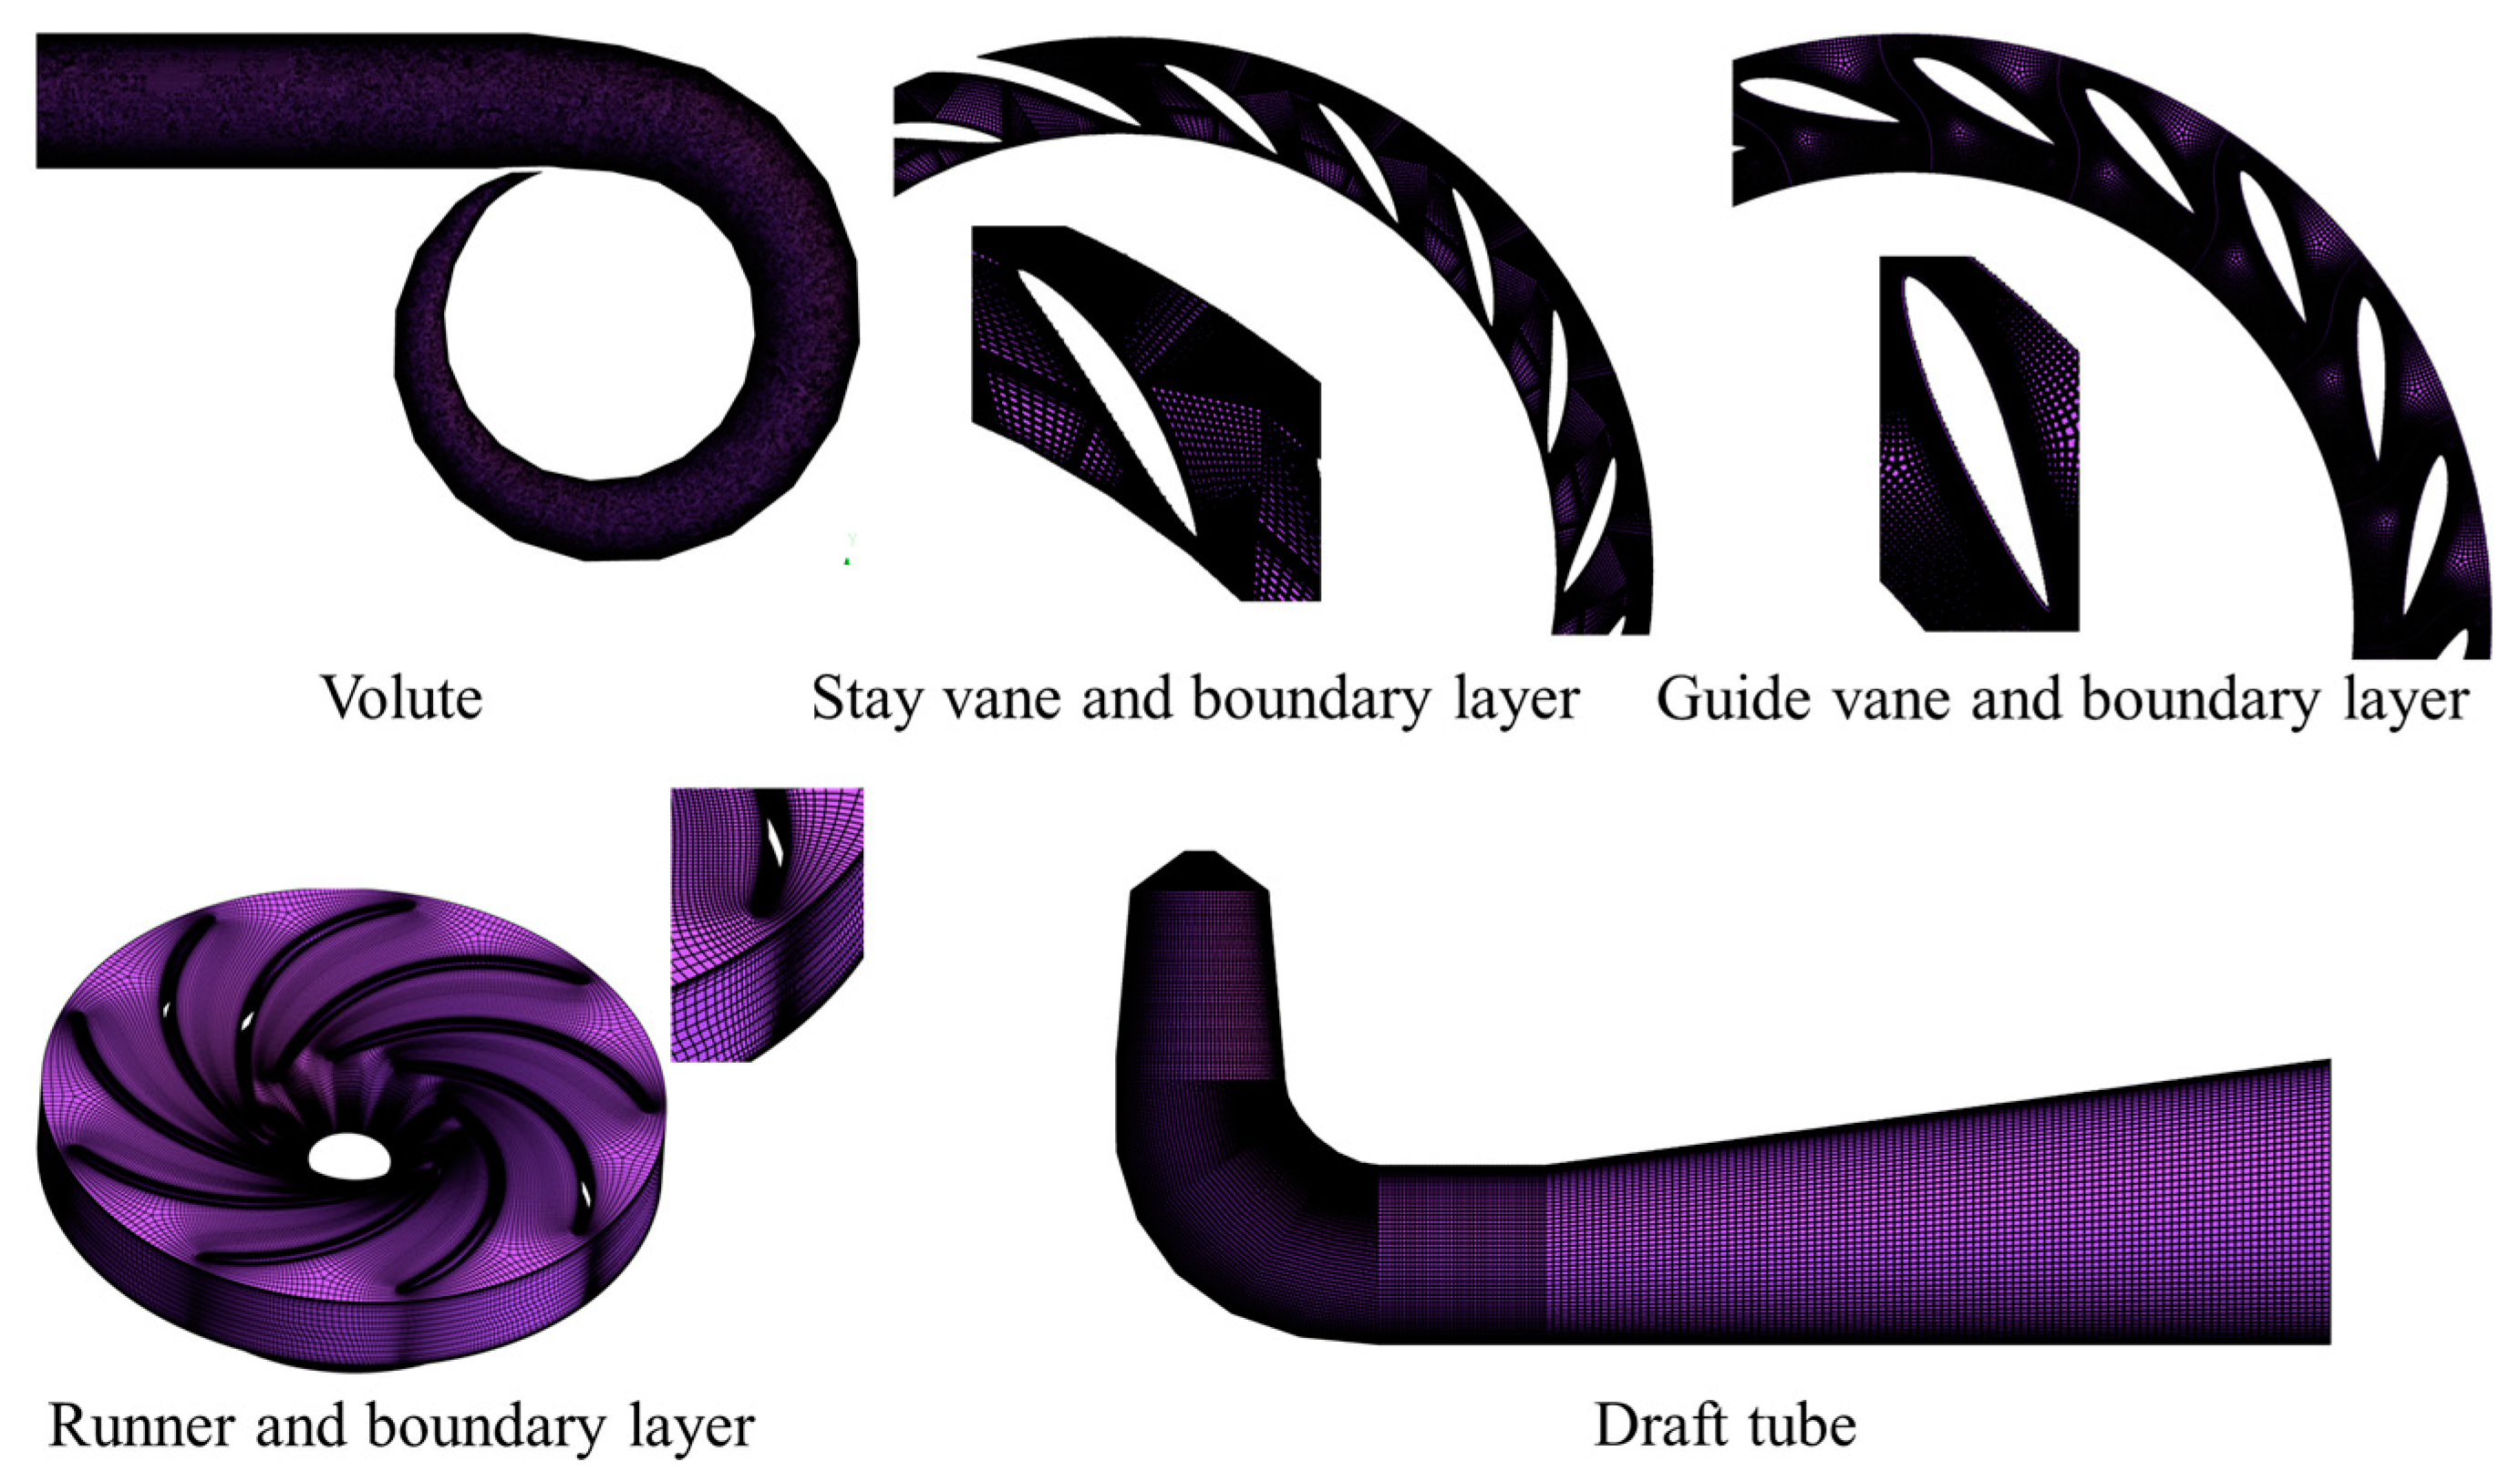
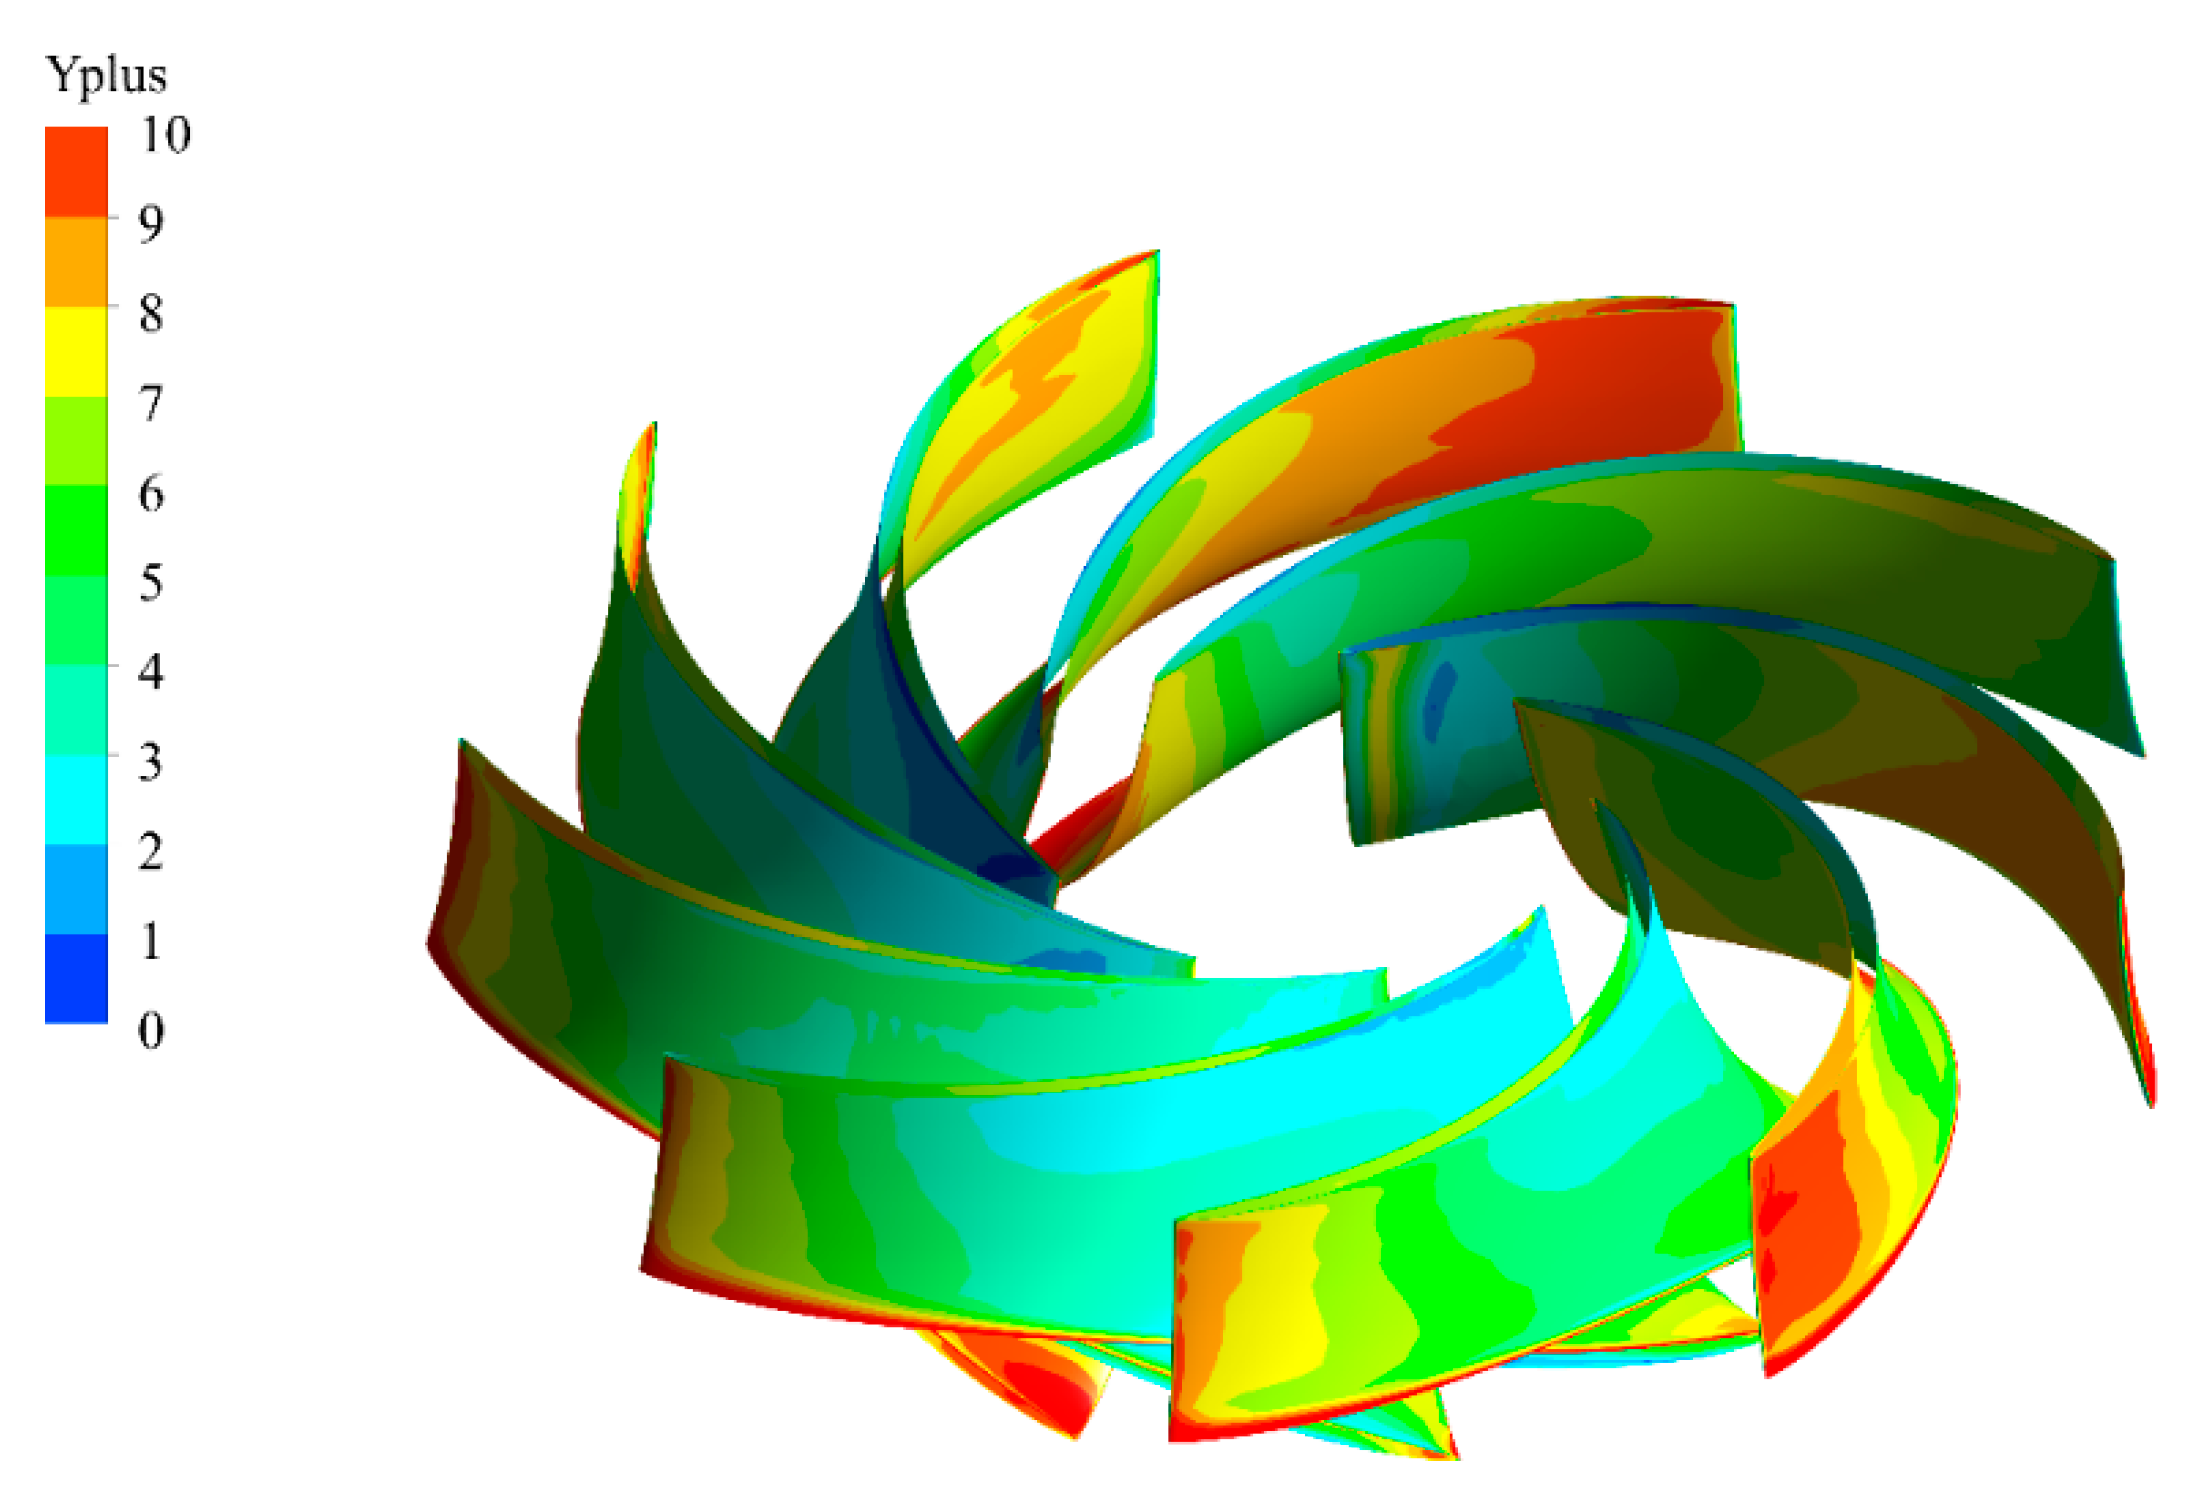
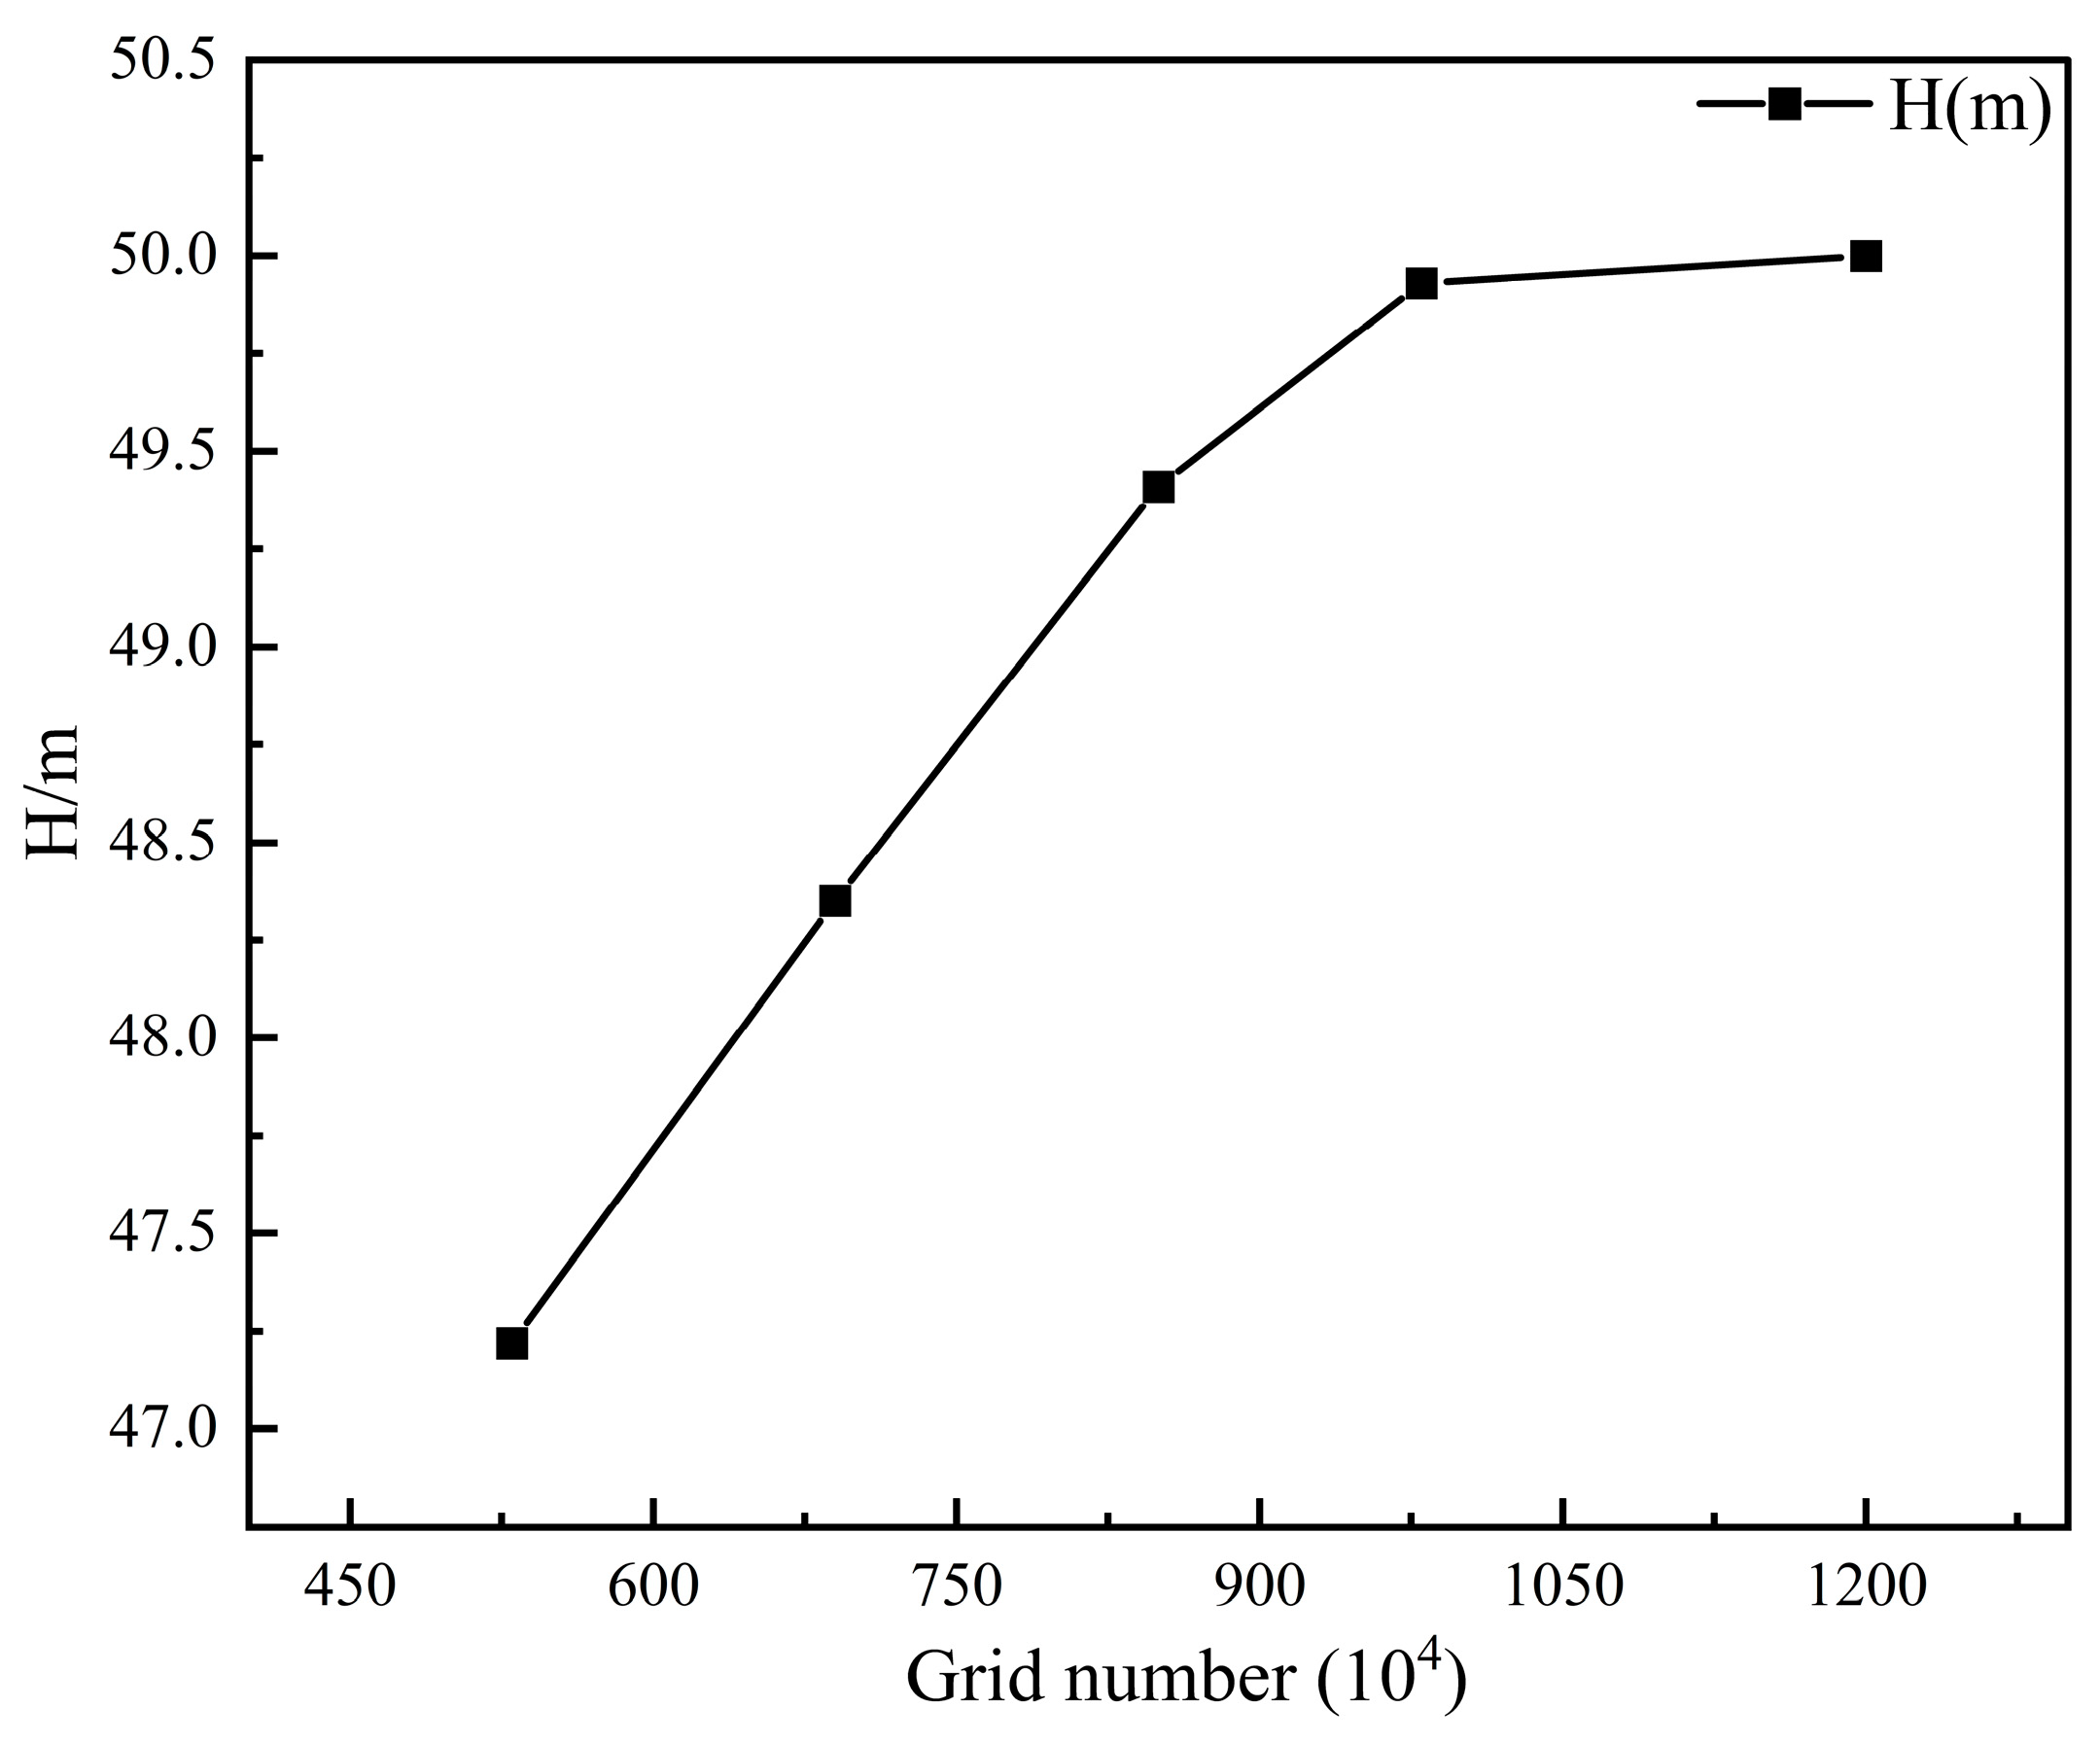
3.2.1. Grid Division and Independence Verification
3.2.2. Boundary Condition Setting
3.3. Experimental Investigation
4. Results
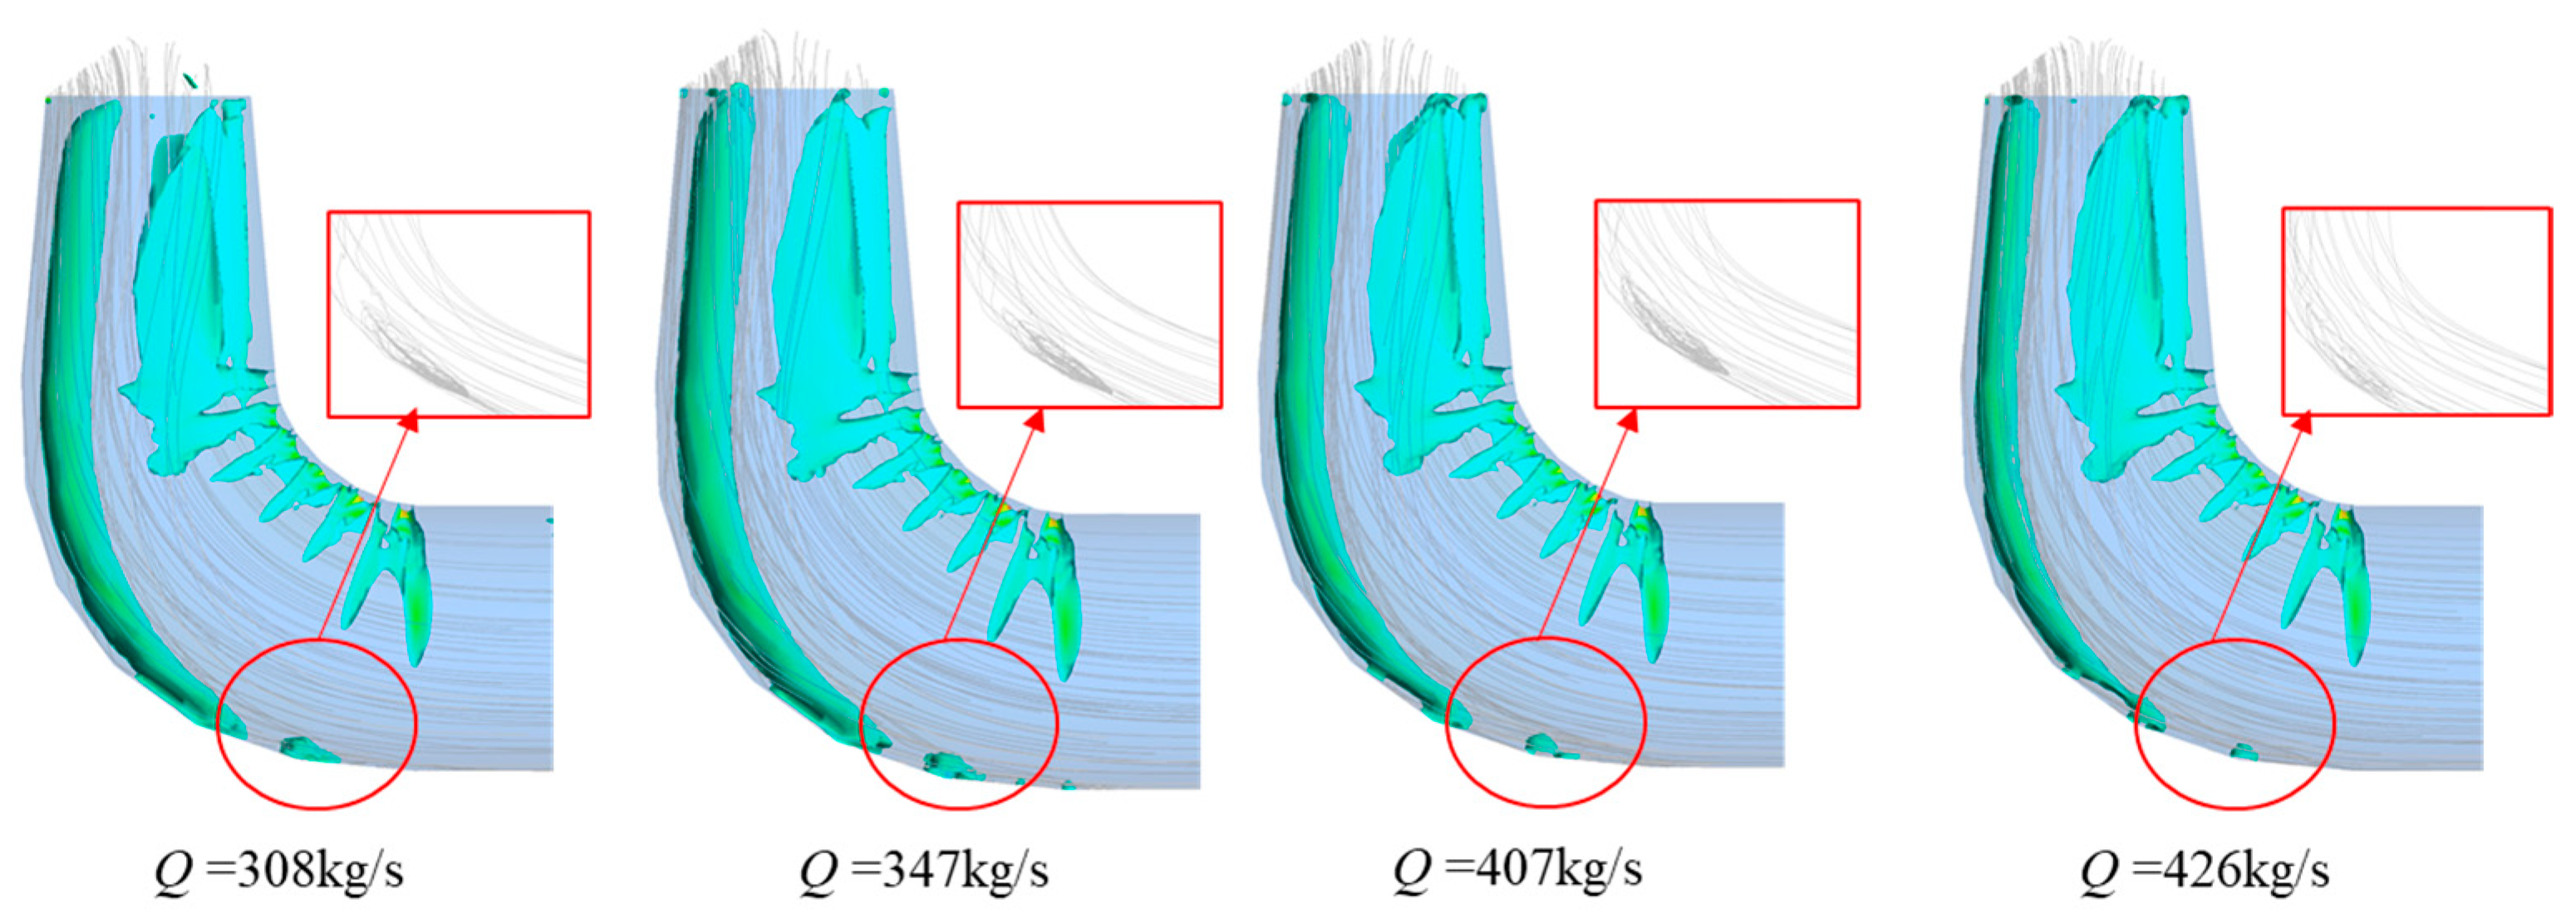
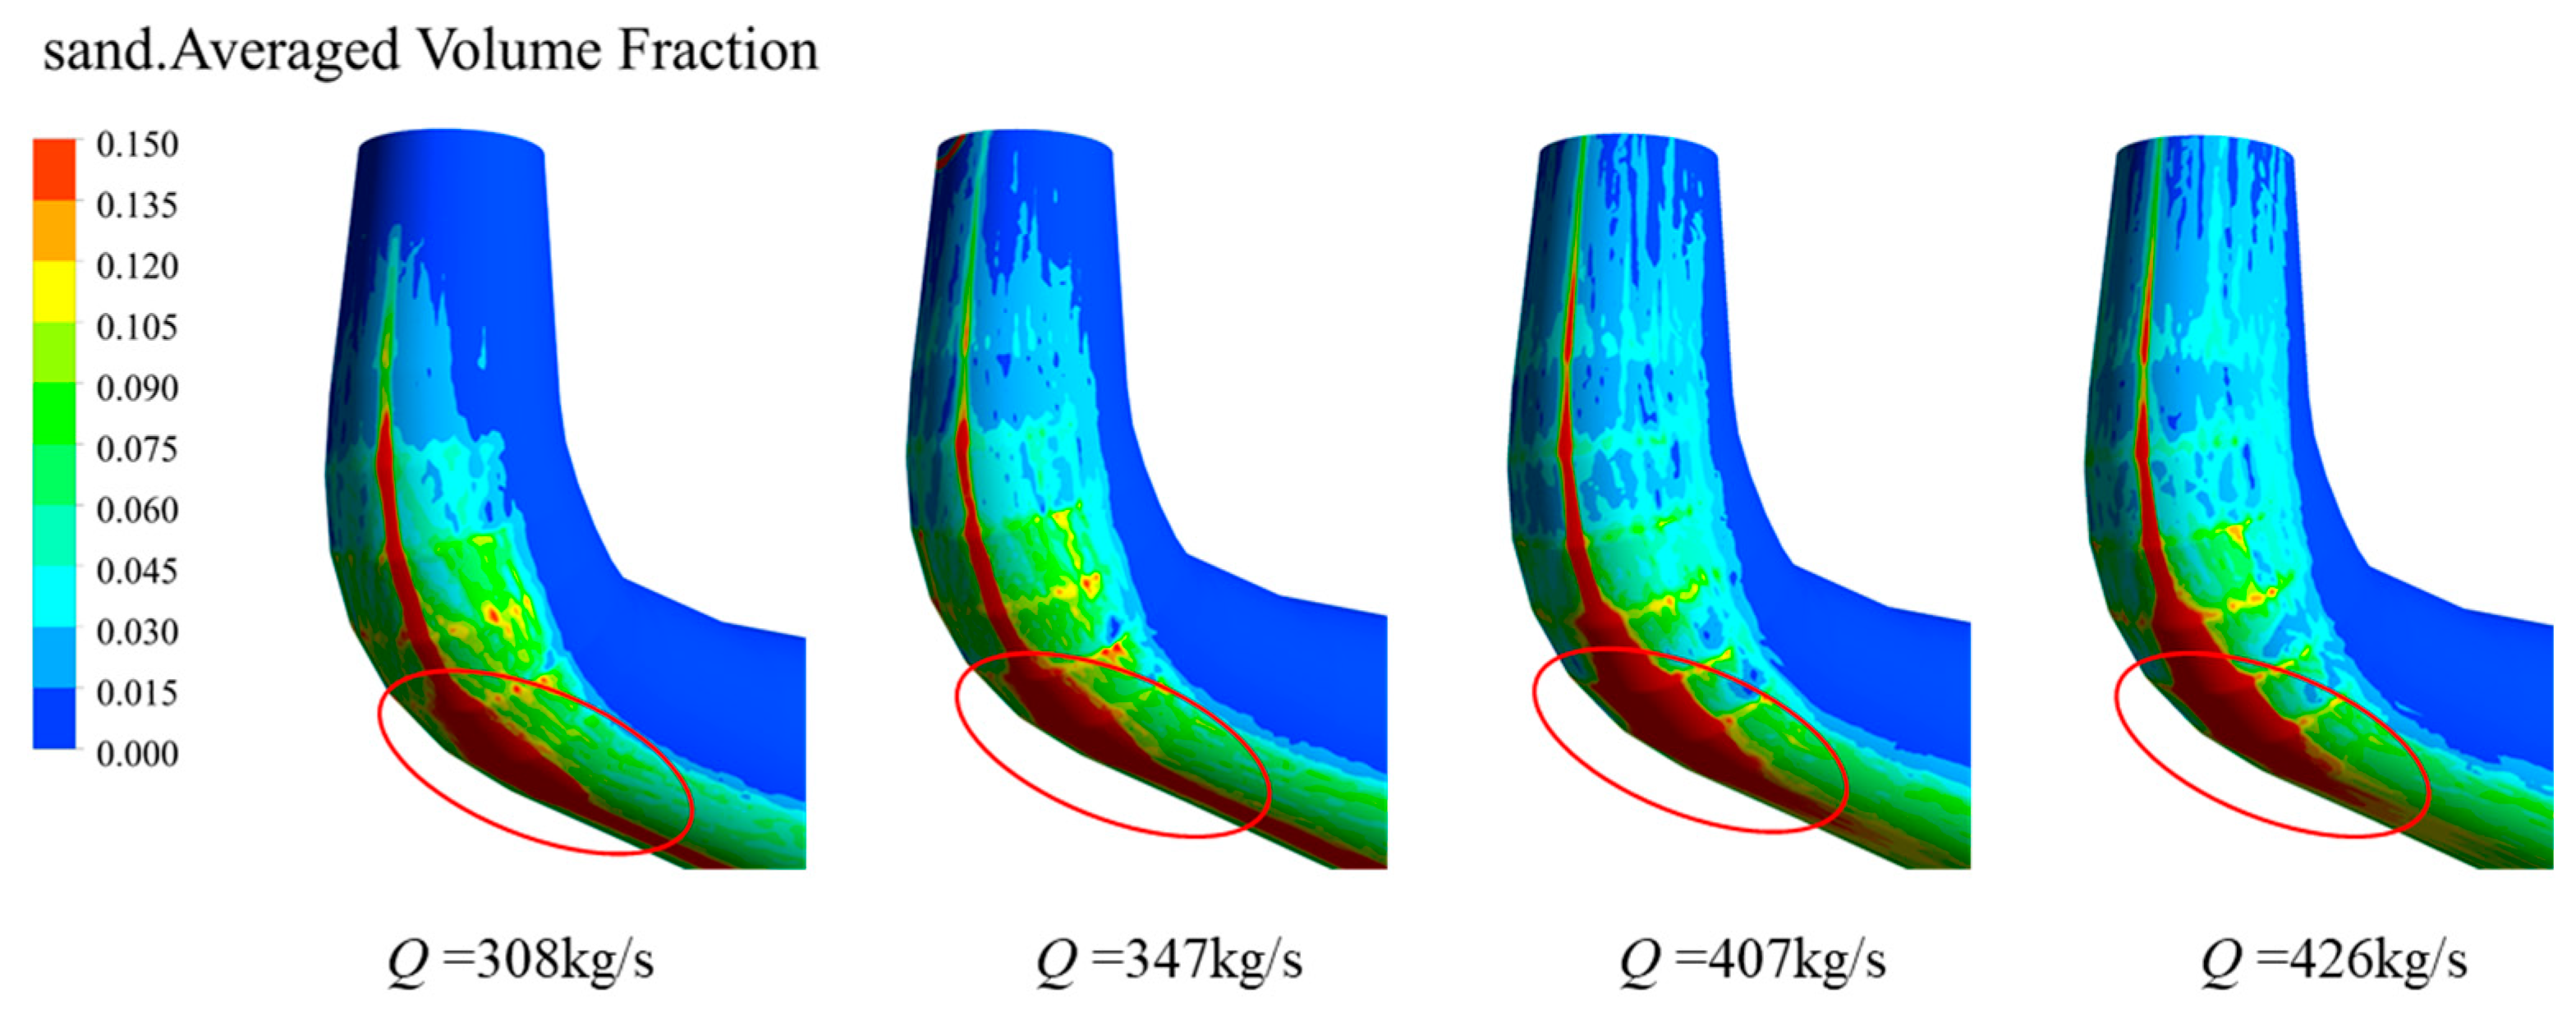
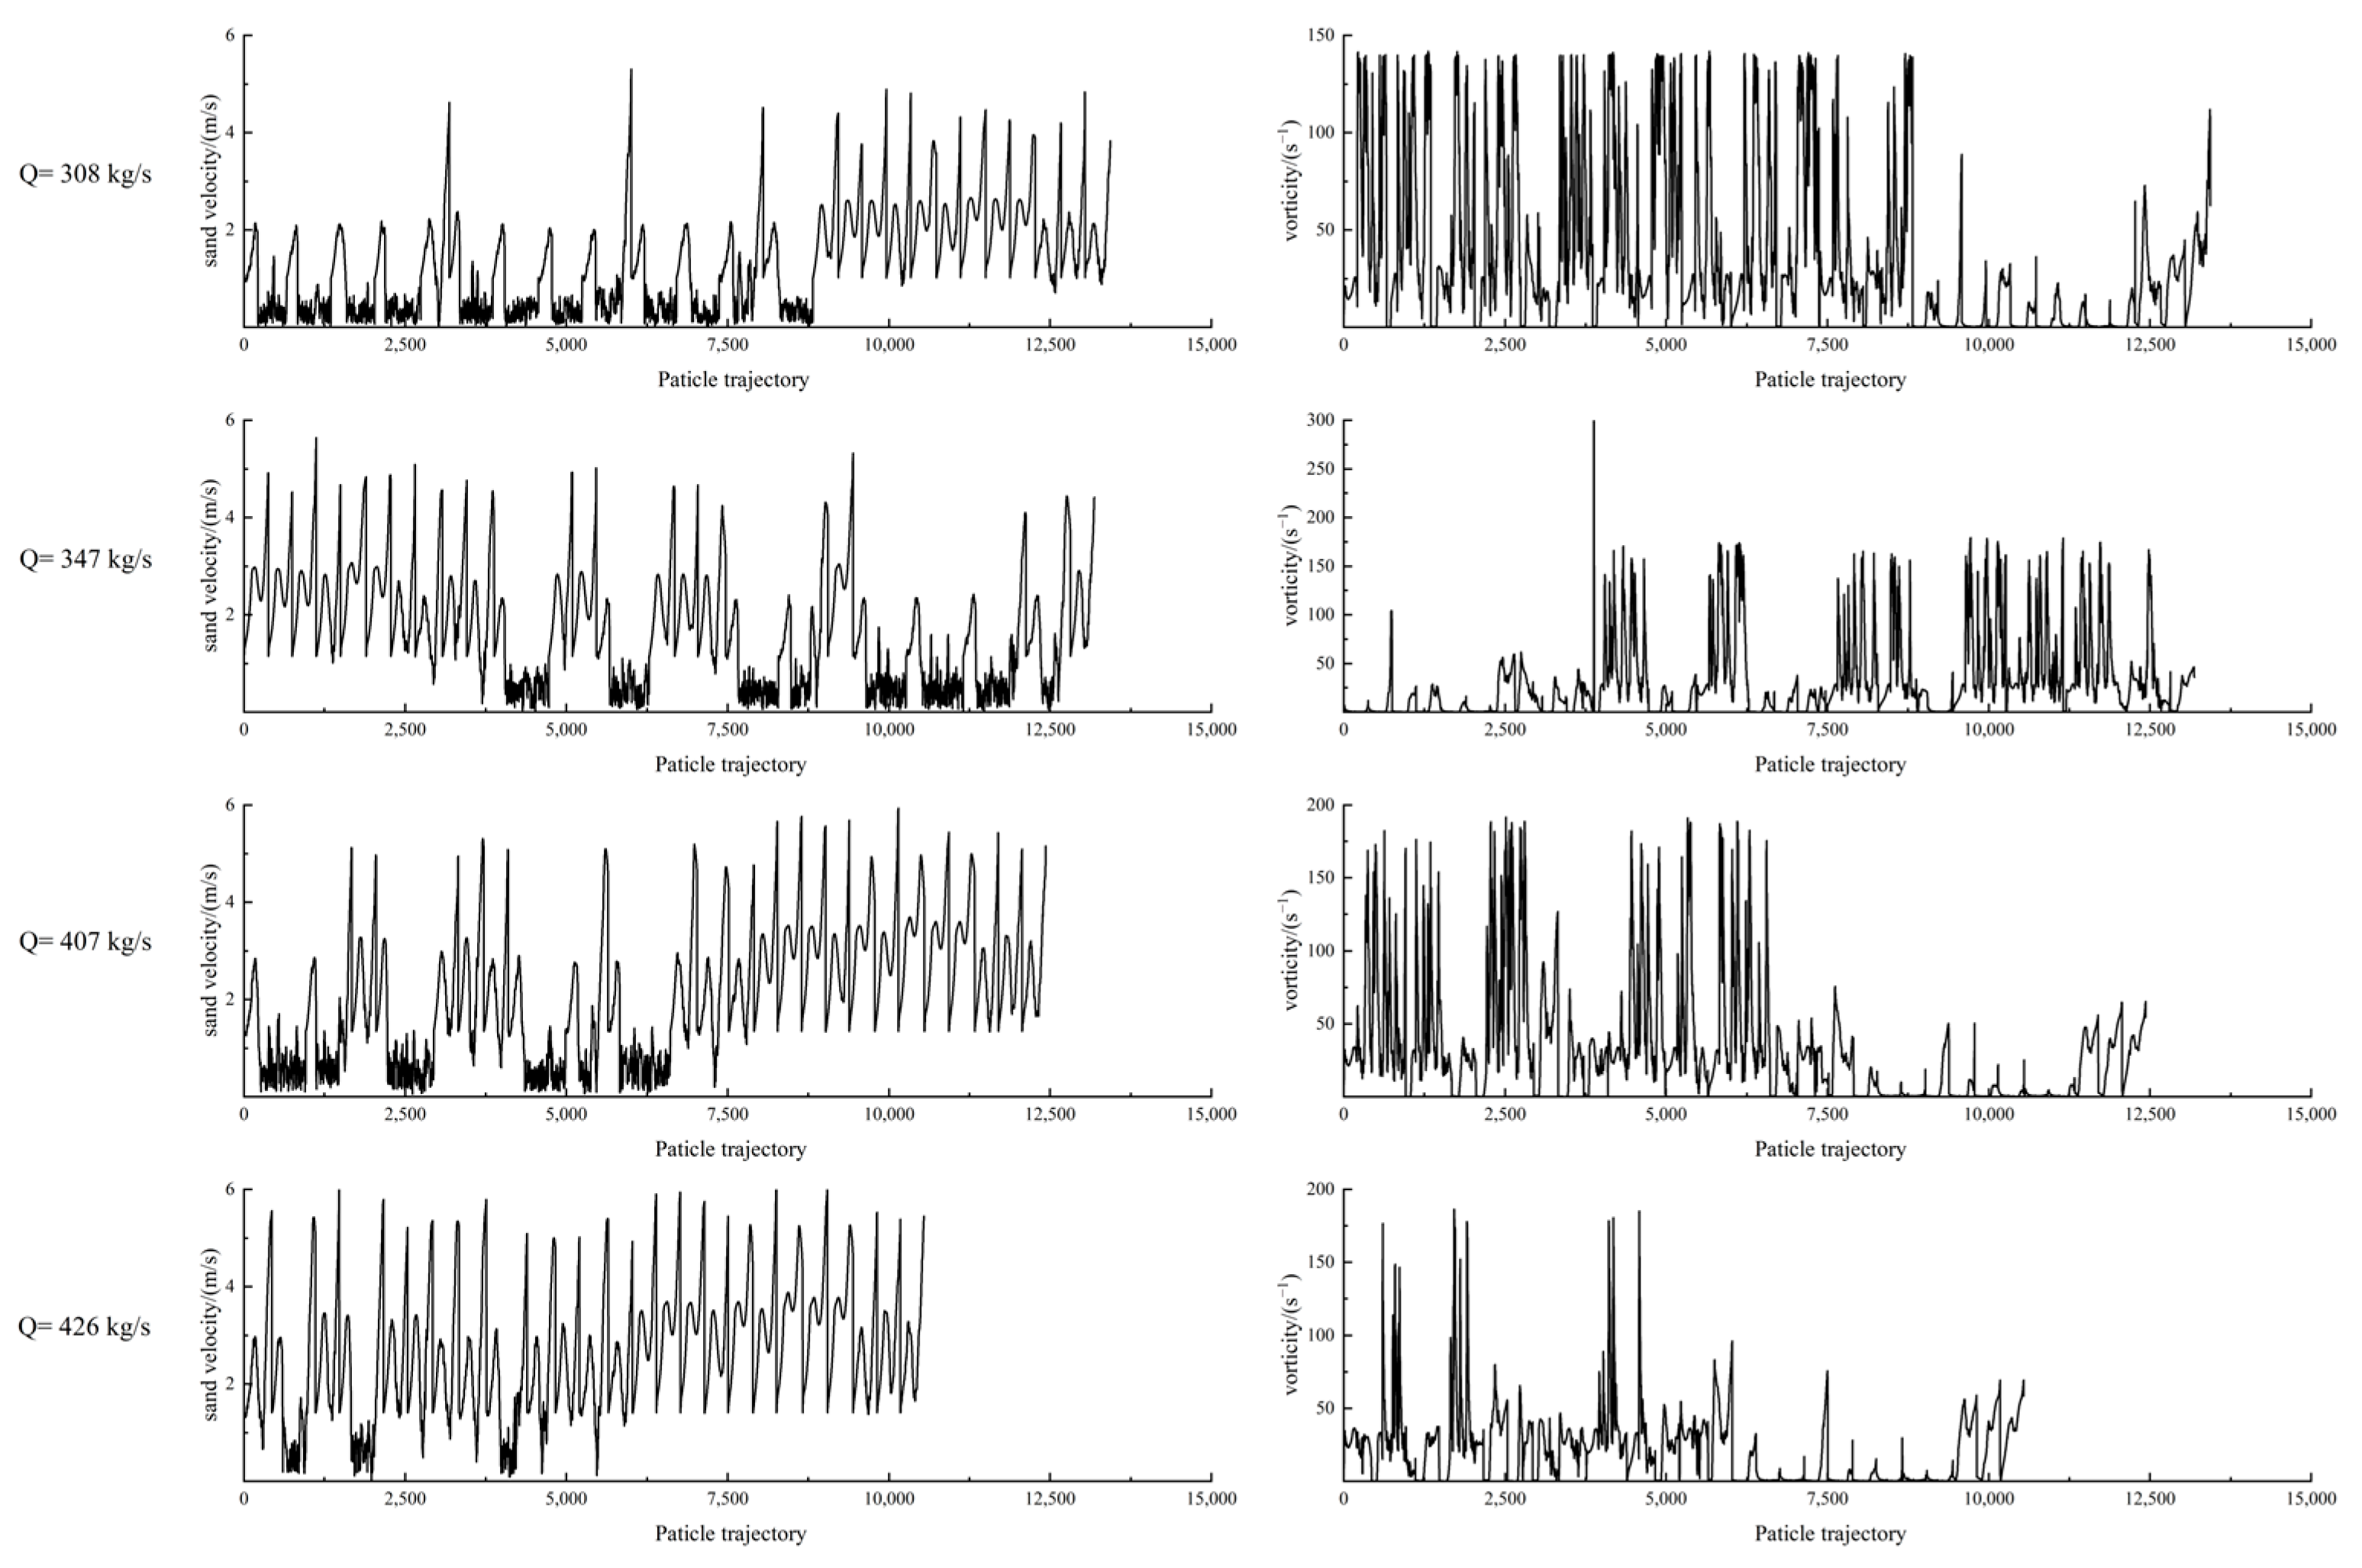
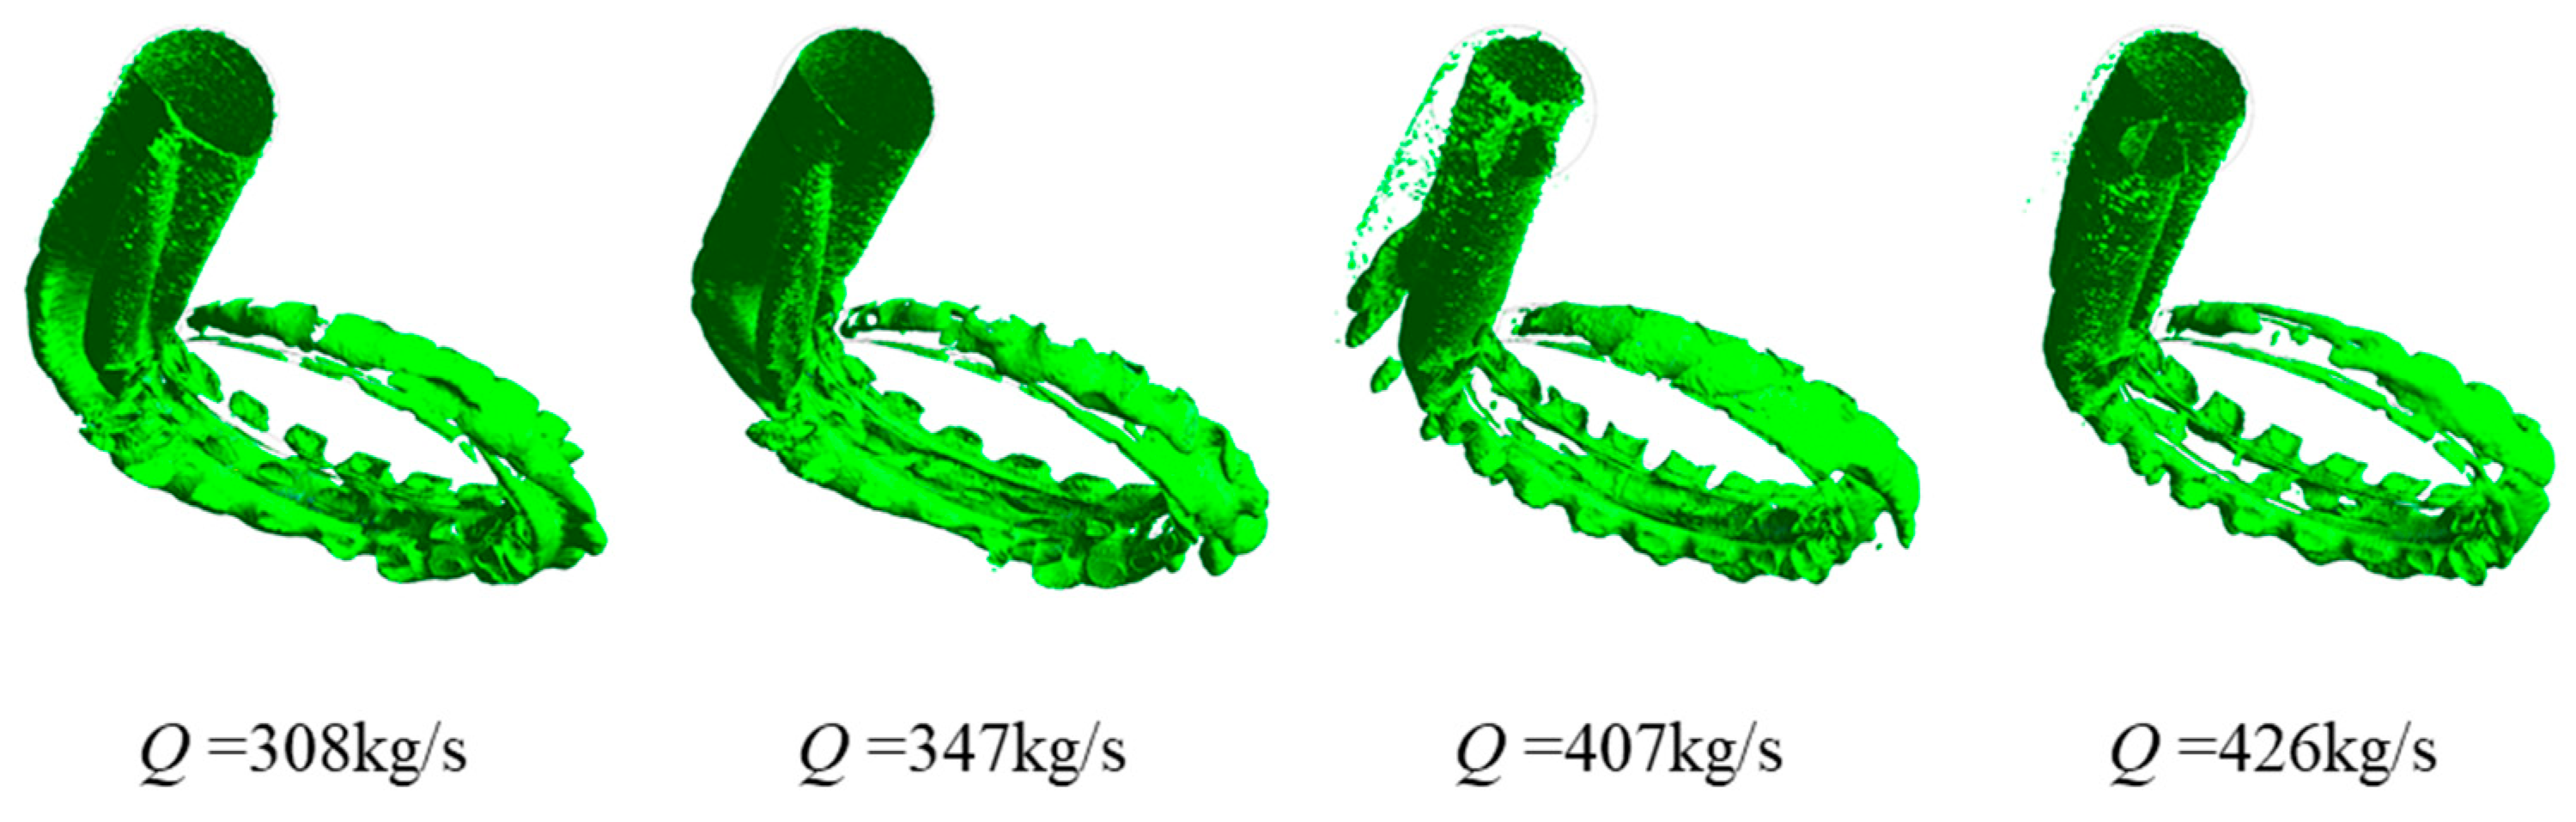
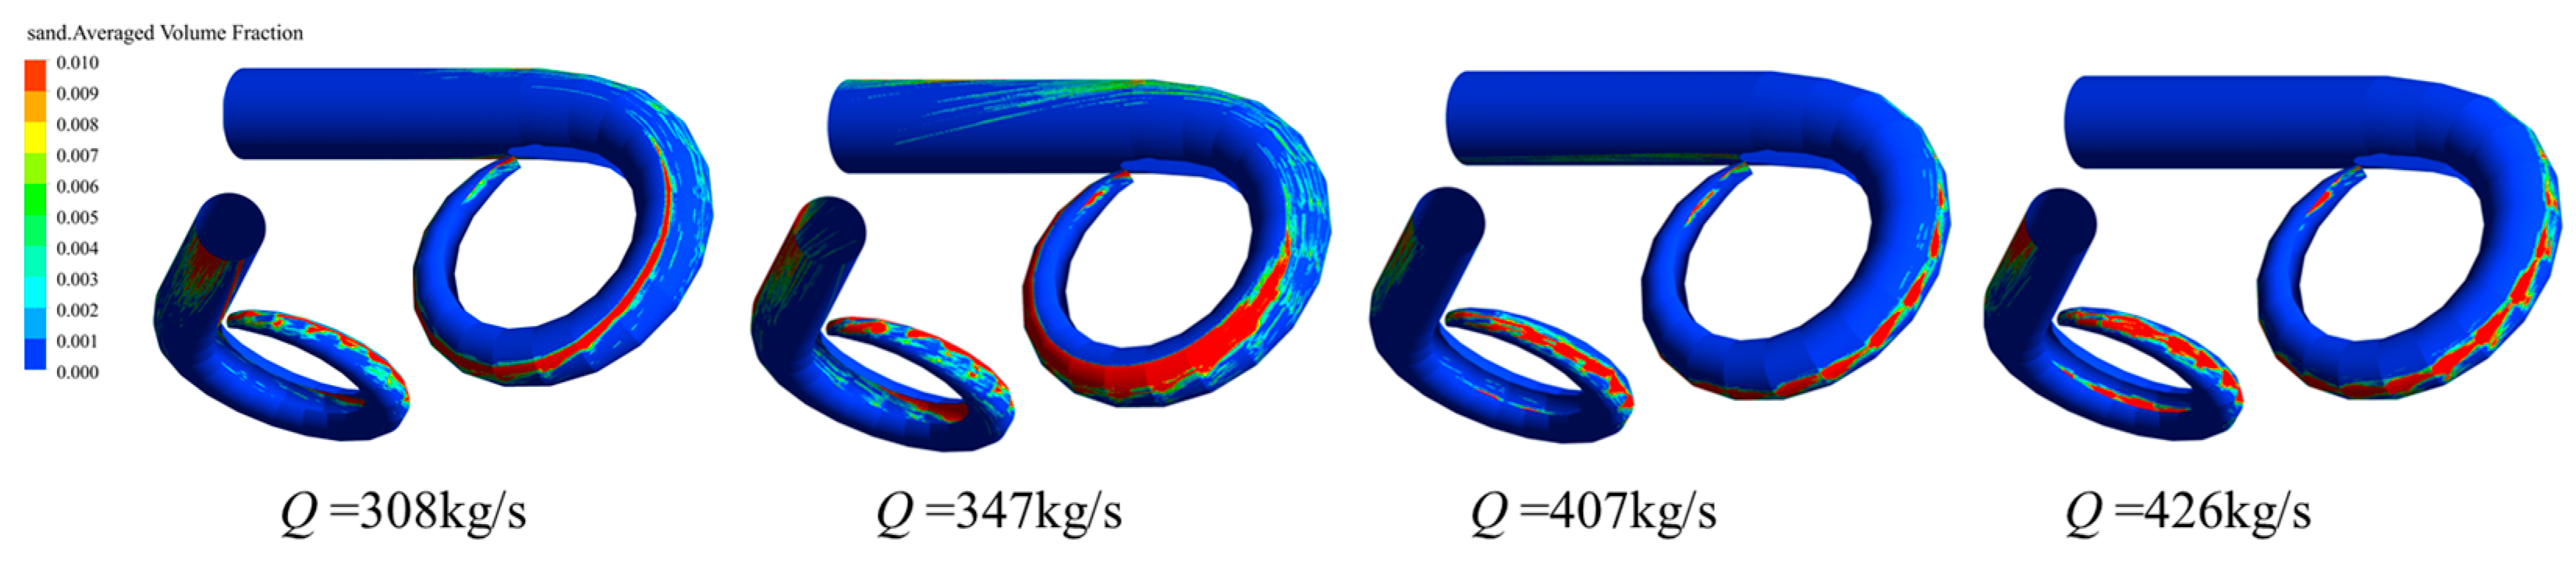
4.1. Relationship Between Vortex and Sand Distribution in the Draft Tube
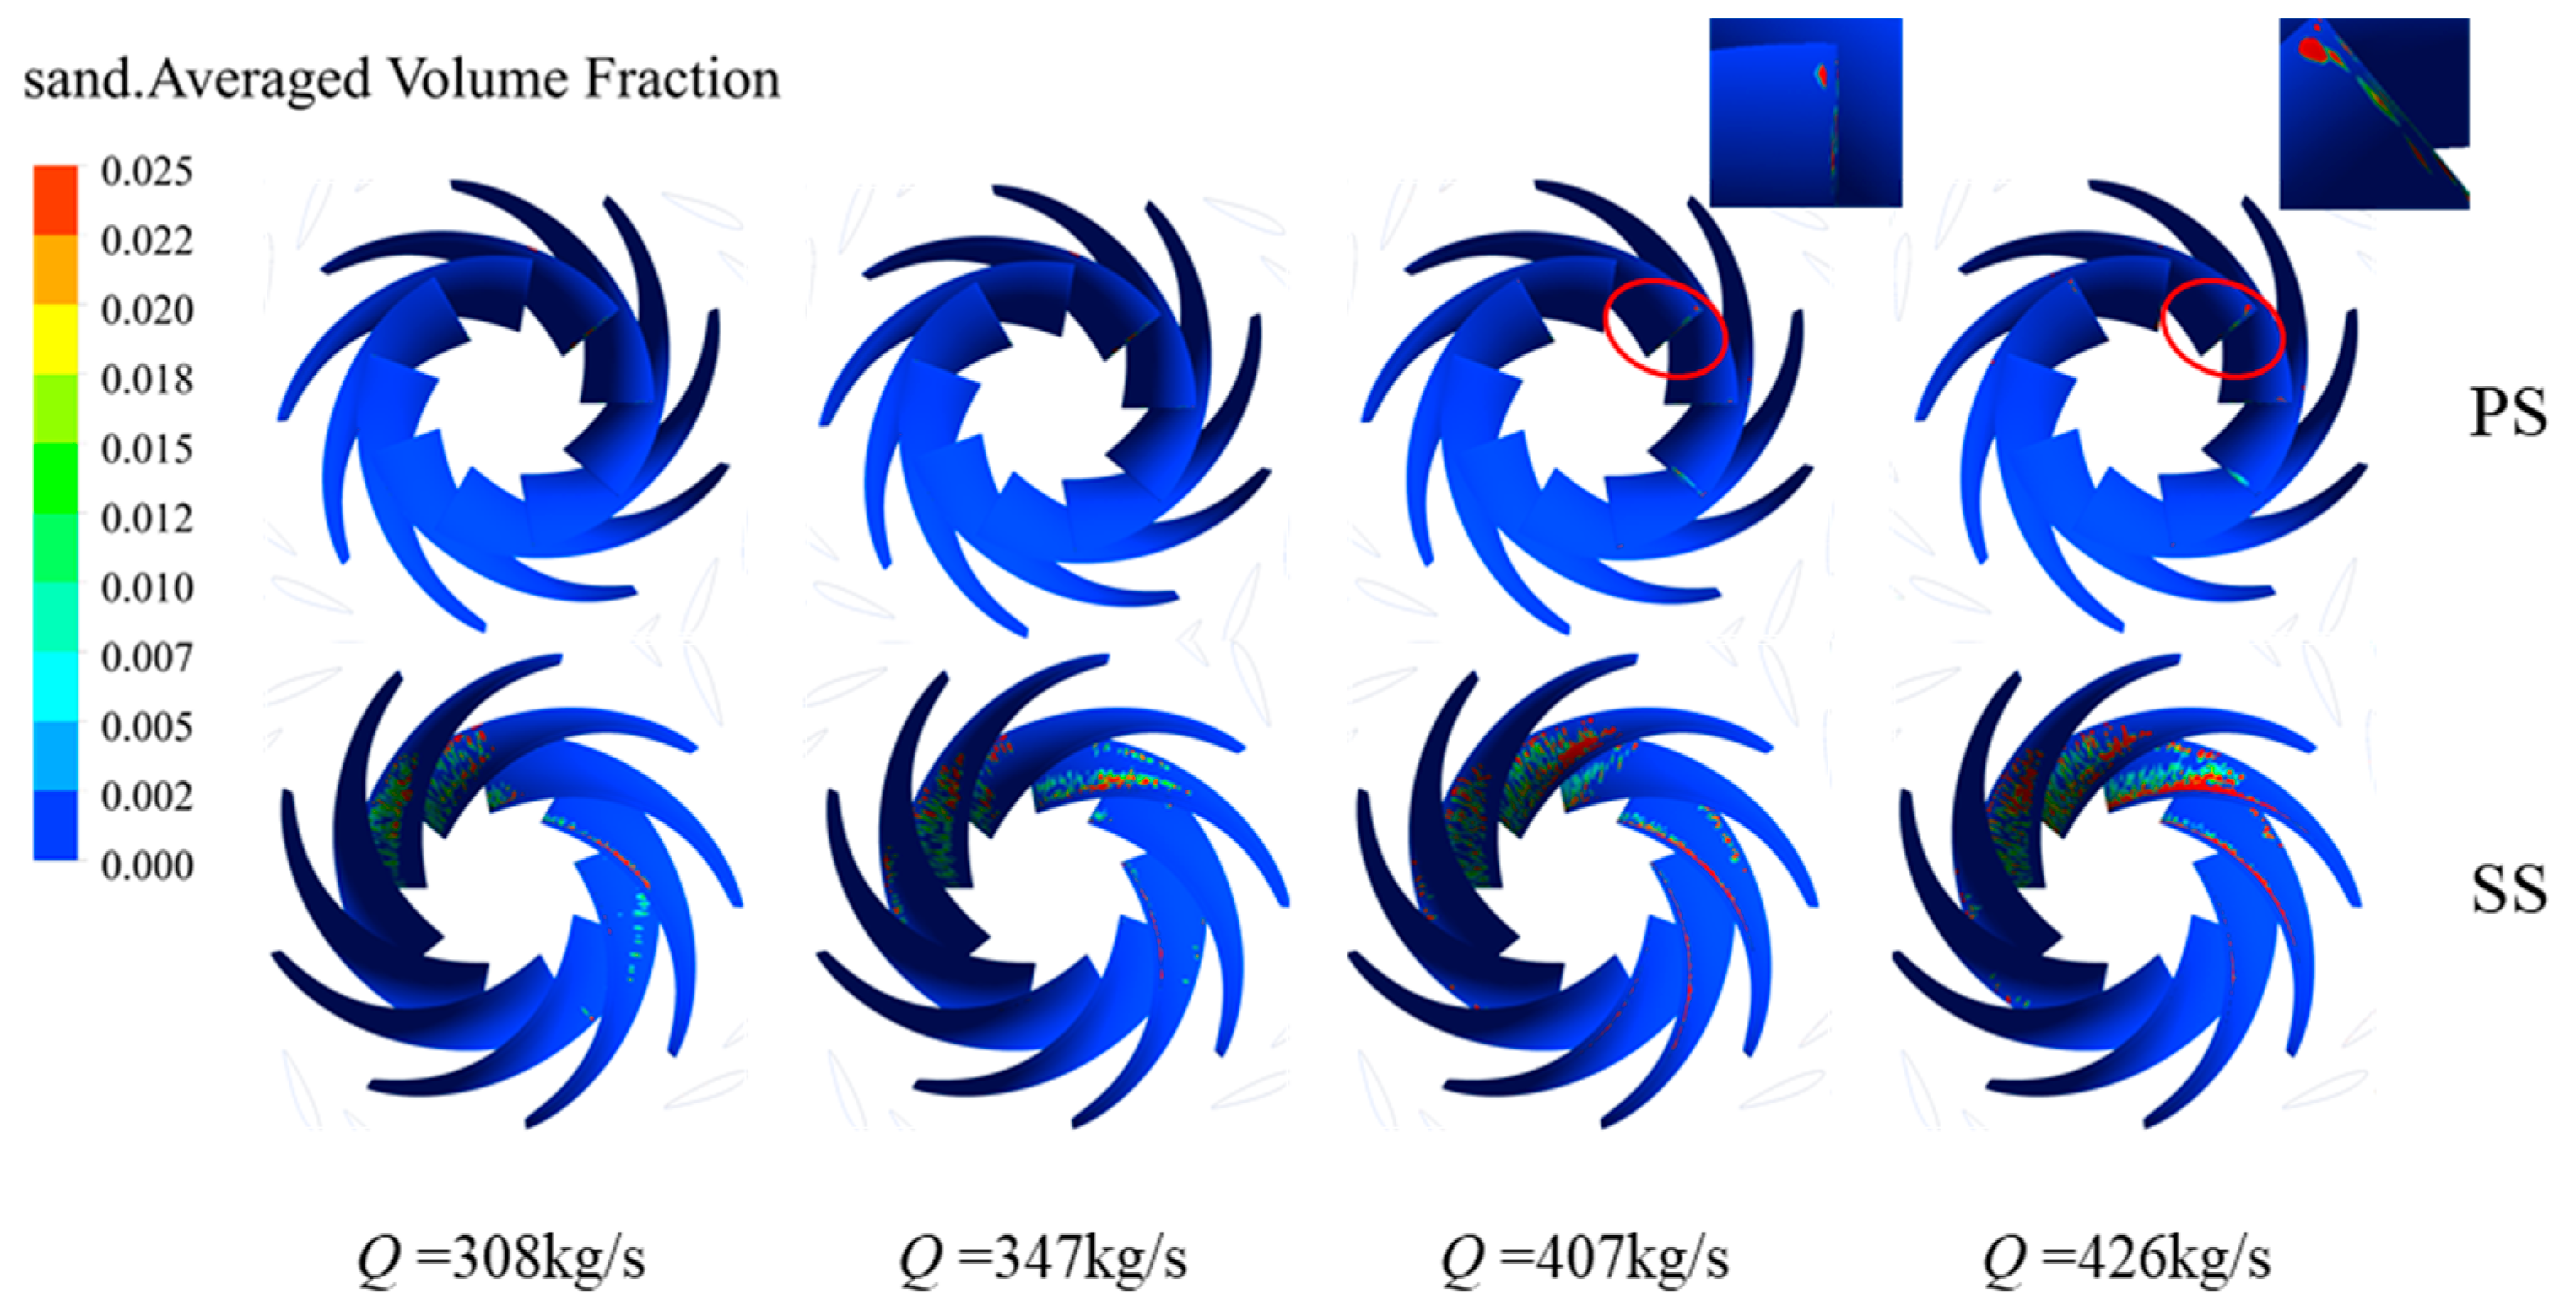
4.2. Relationship Between Vortex and Sand Distribution in the Runner
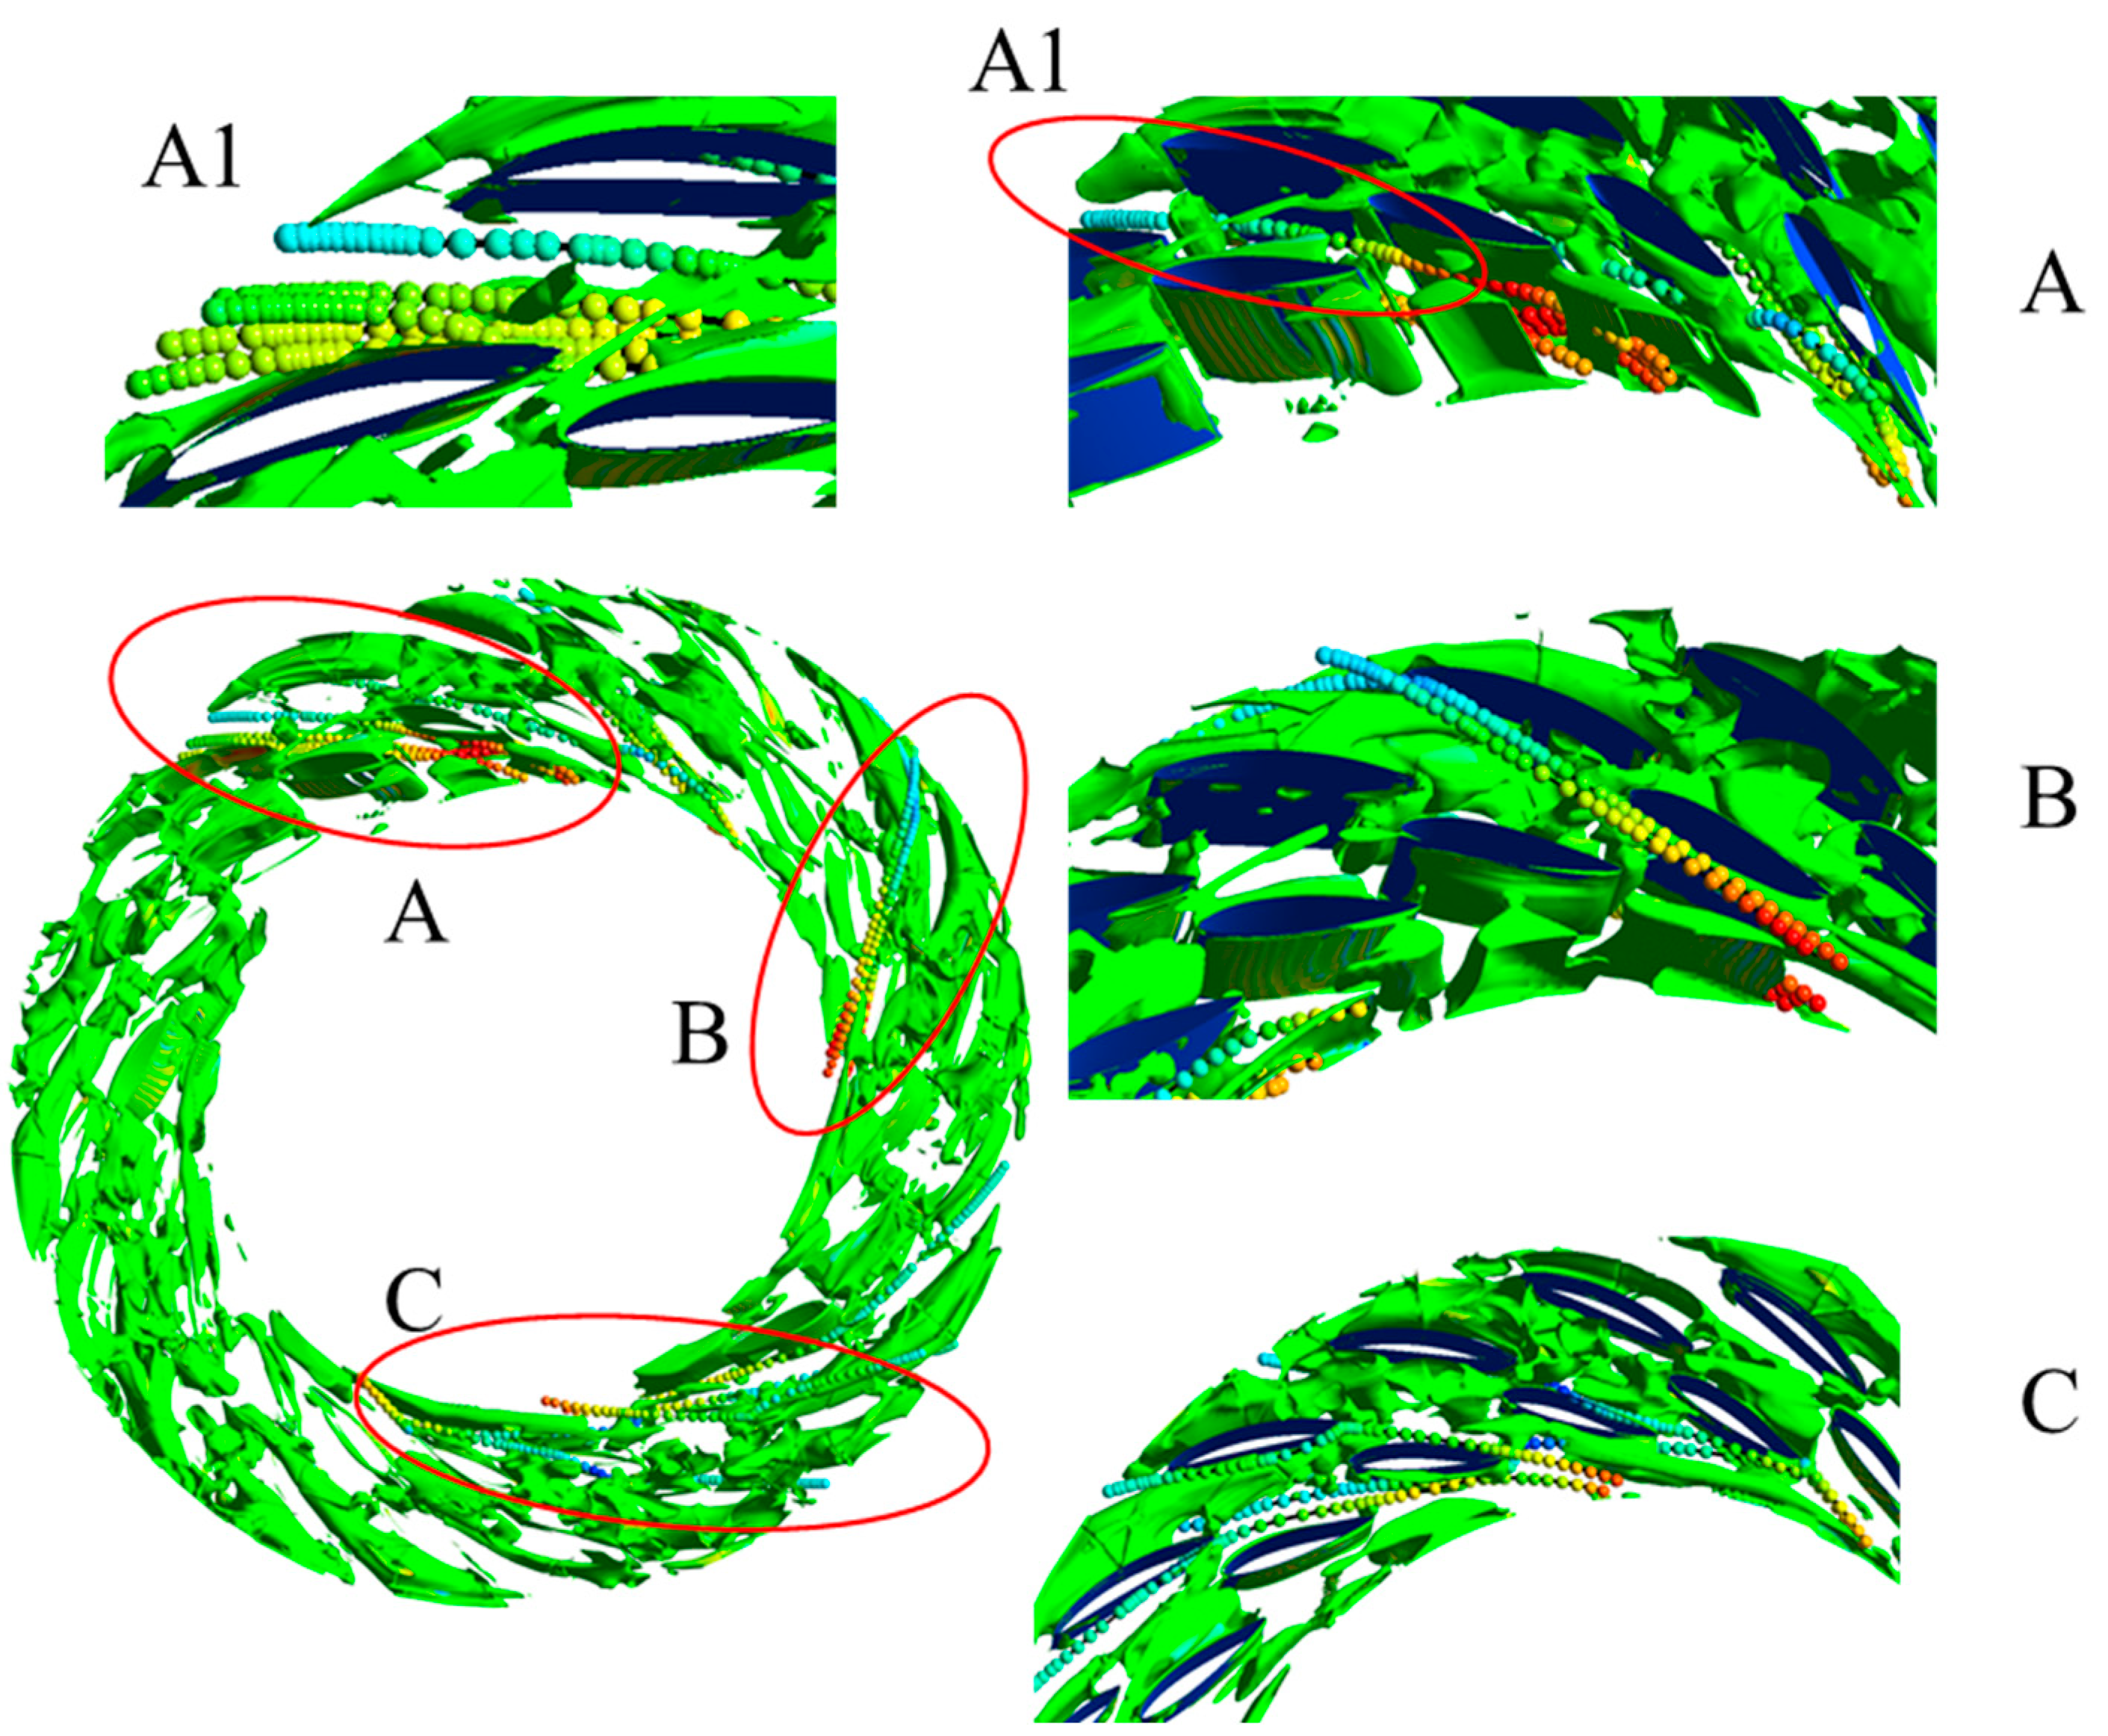
4.3. Relationship Between Vortex and Sand Distribution in the Double-Row Cascade
4.4. Relationship Between Vortex and Sand Distribution in the Volute
5. Conclusions
- (1)
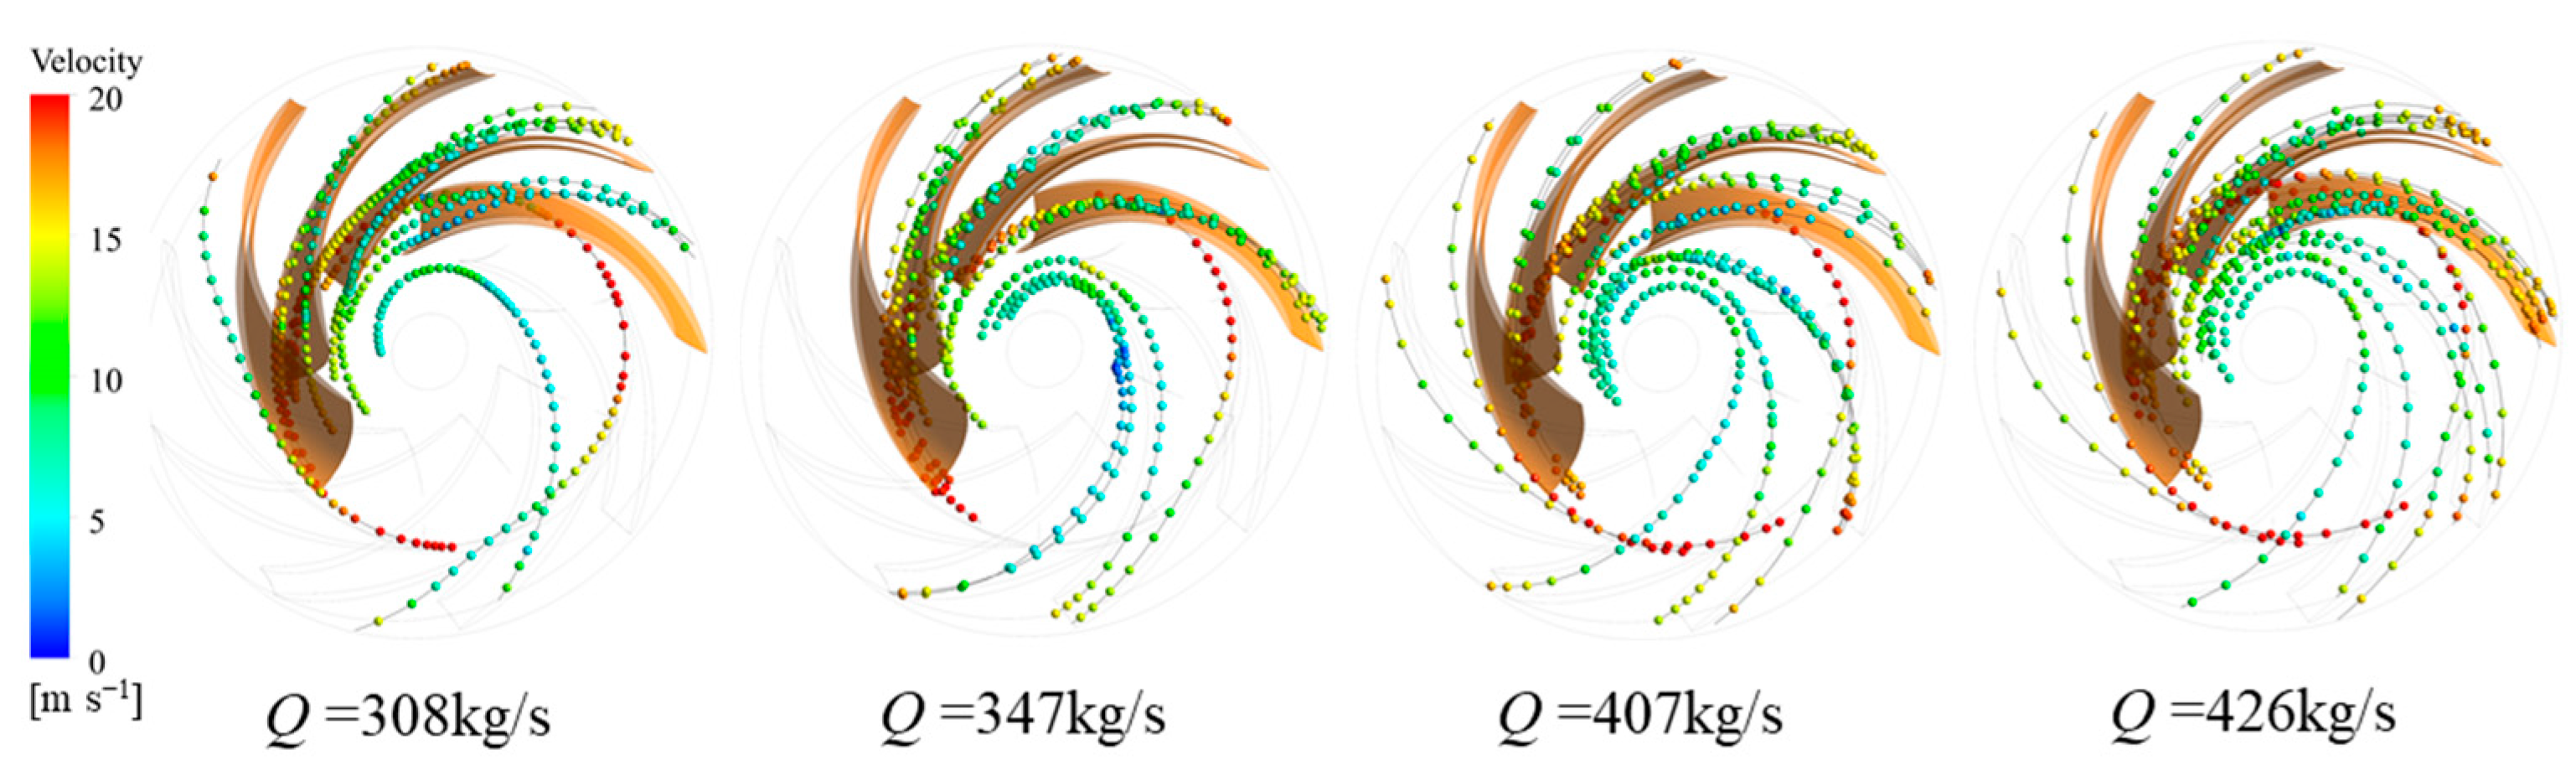
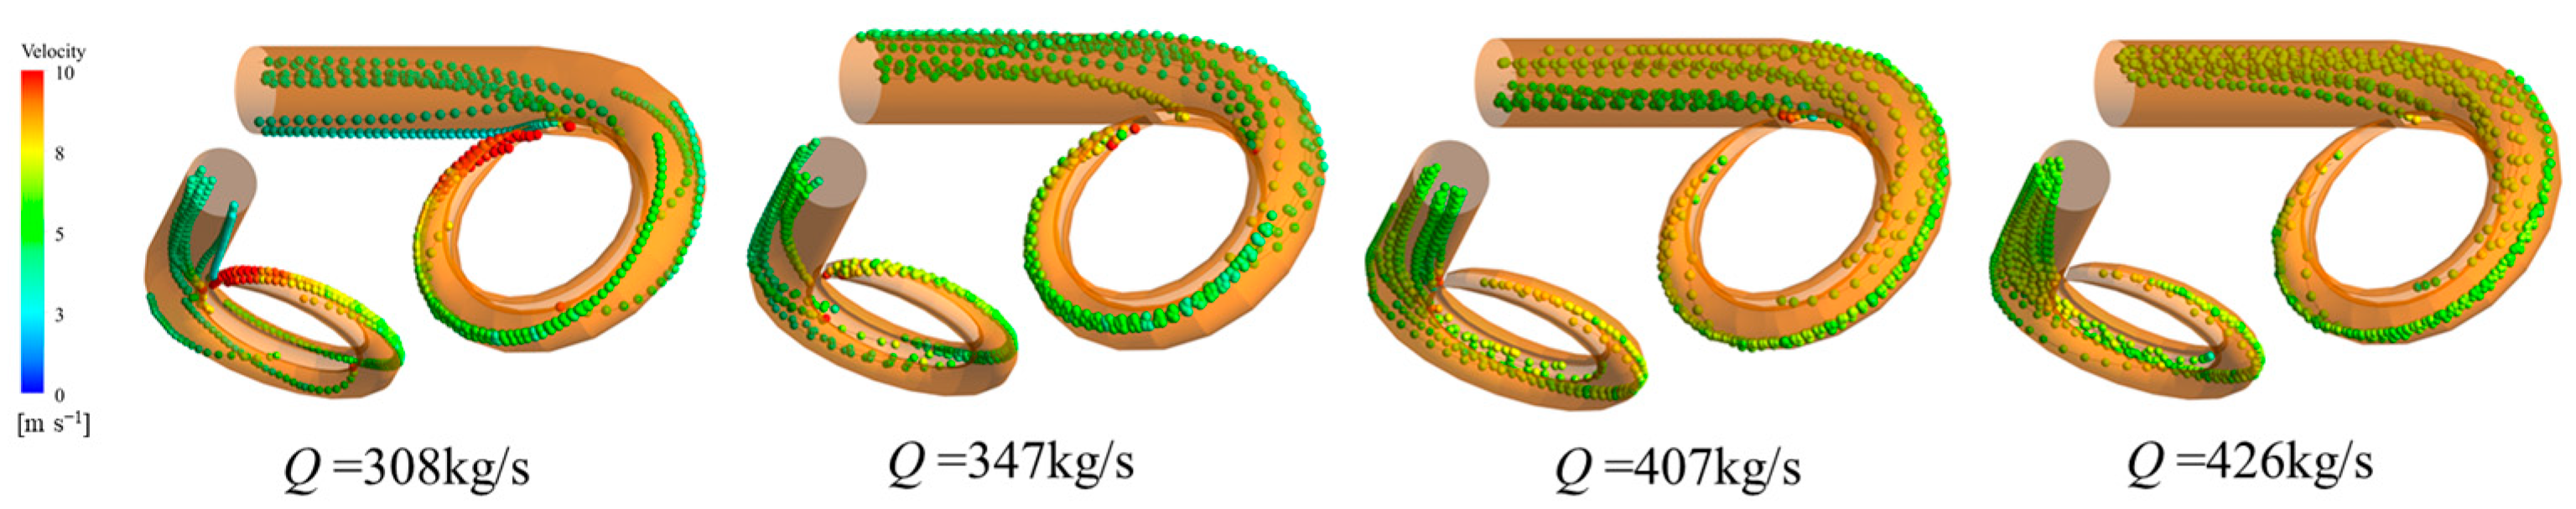
- The vortex in the draft tube mainly occurs in the form of vortex bands on the near wall surface of the straight cone elbow tube section, and in the form of a mass at the junction of the diffusion section and the elbow tube section. As the flow rate increases, the strip vortex becomes thinner and the cluster vortex gradually decreases. Sand particles accumulate mainly on the wall surface of the straight cone section and the elbow pipe section. As the flow rate increases, the sand accumulation in the straight cone section extends upwards, and the sand accumulation in the elbow pipe section extends laterally. Under these four flow conditions, the sand particles in the draft tube spiral along the outer surface of the two counter-rotating strip vortices and are thrown against the wall of the straight cone section; the mass vortex prevents the sand particles from moving to the outlet of the draft tube, resulting in a serious accumulation of sand particles on the wall of the straight cone section and the elbow tube section.
- (2)
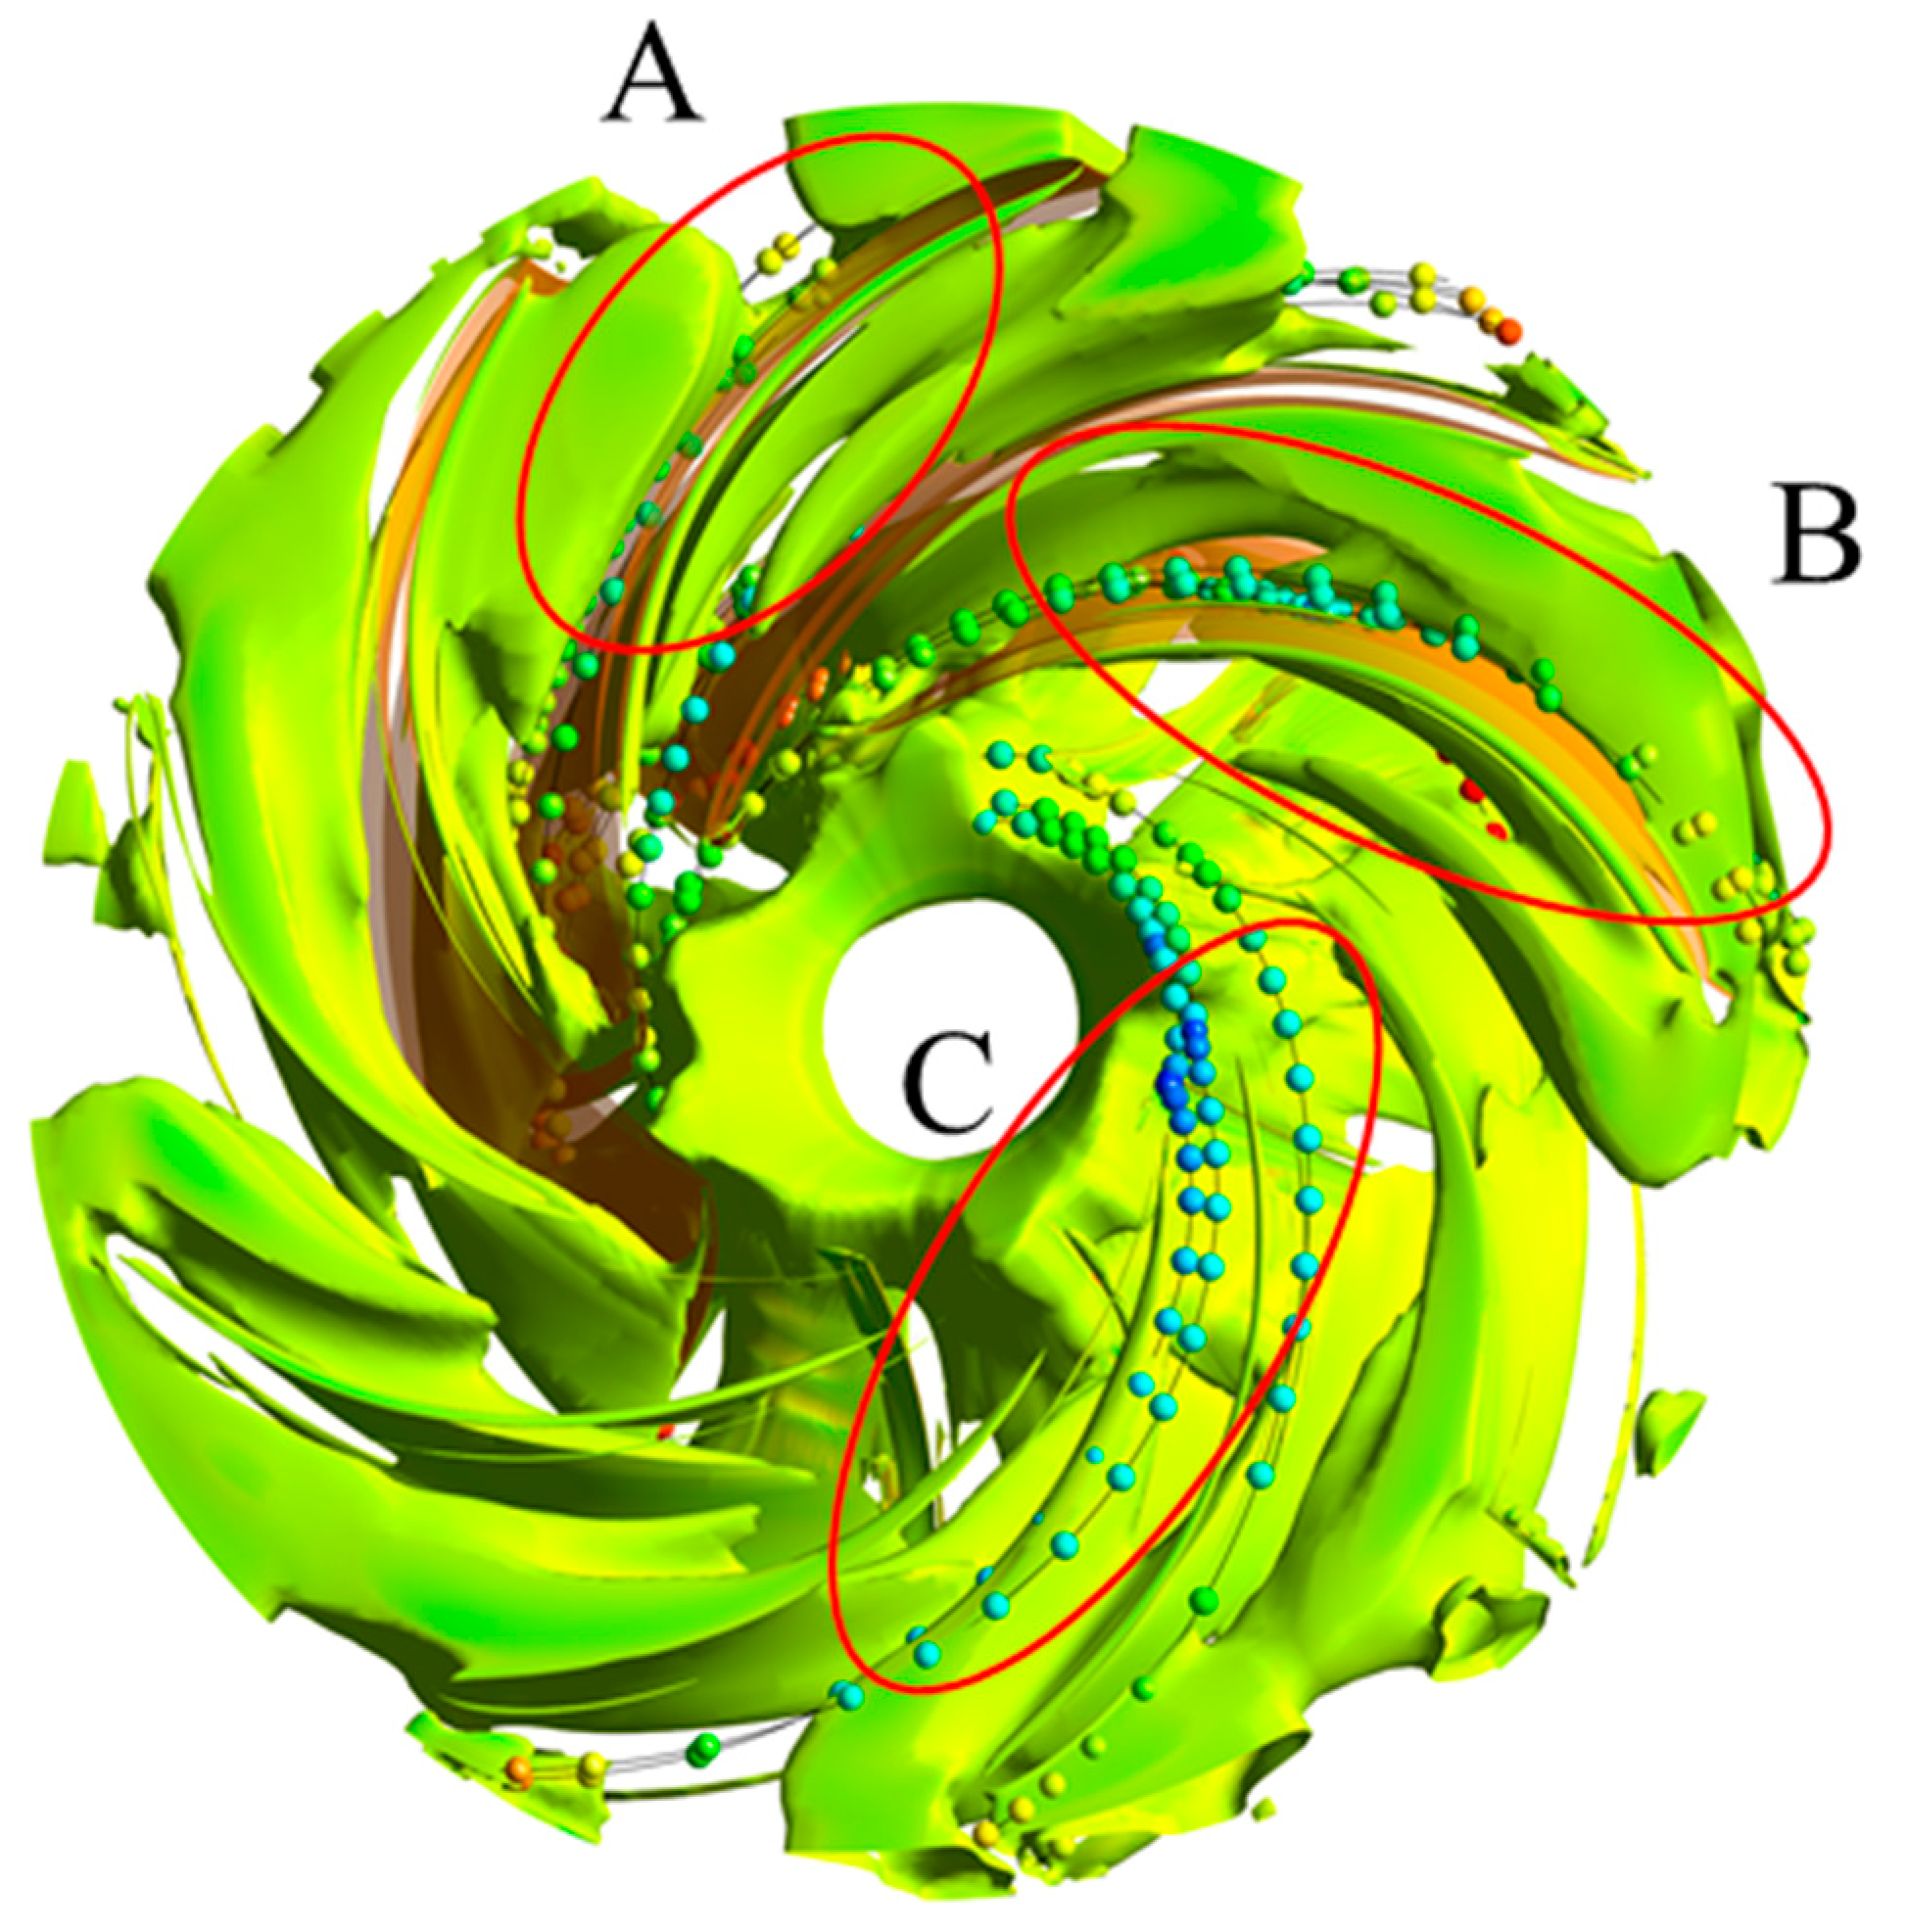
- The vortices in the runner are mainly the blade vortex and trailing edge shedding vortex close to the pressure surface. As the flow rate increases, the blade vortex gradually occupies the flow path, and the trailing edge shedding vortex decreases. Sand particles mainly accumulate at the inlet of the suction surface of the runner. As the flow rate increases, the number of blades where sand particles accumulate increases and moves up the cover. Under these four flow conditions, the blade vortex close to the pressure surface has a greater influence on the sand movement, which encourages the sand particles to move close to the suction surface, which leads to a serious accumulation of sand particles on the suction surface.
- (3)
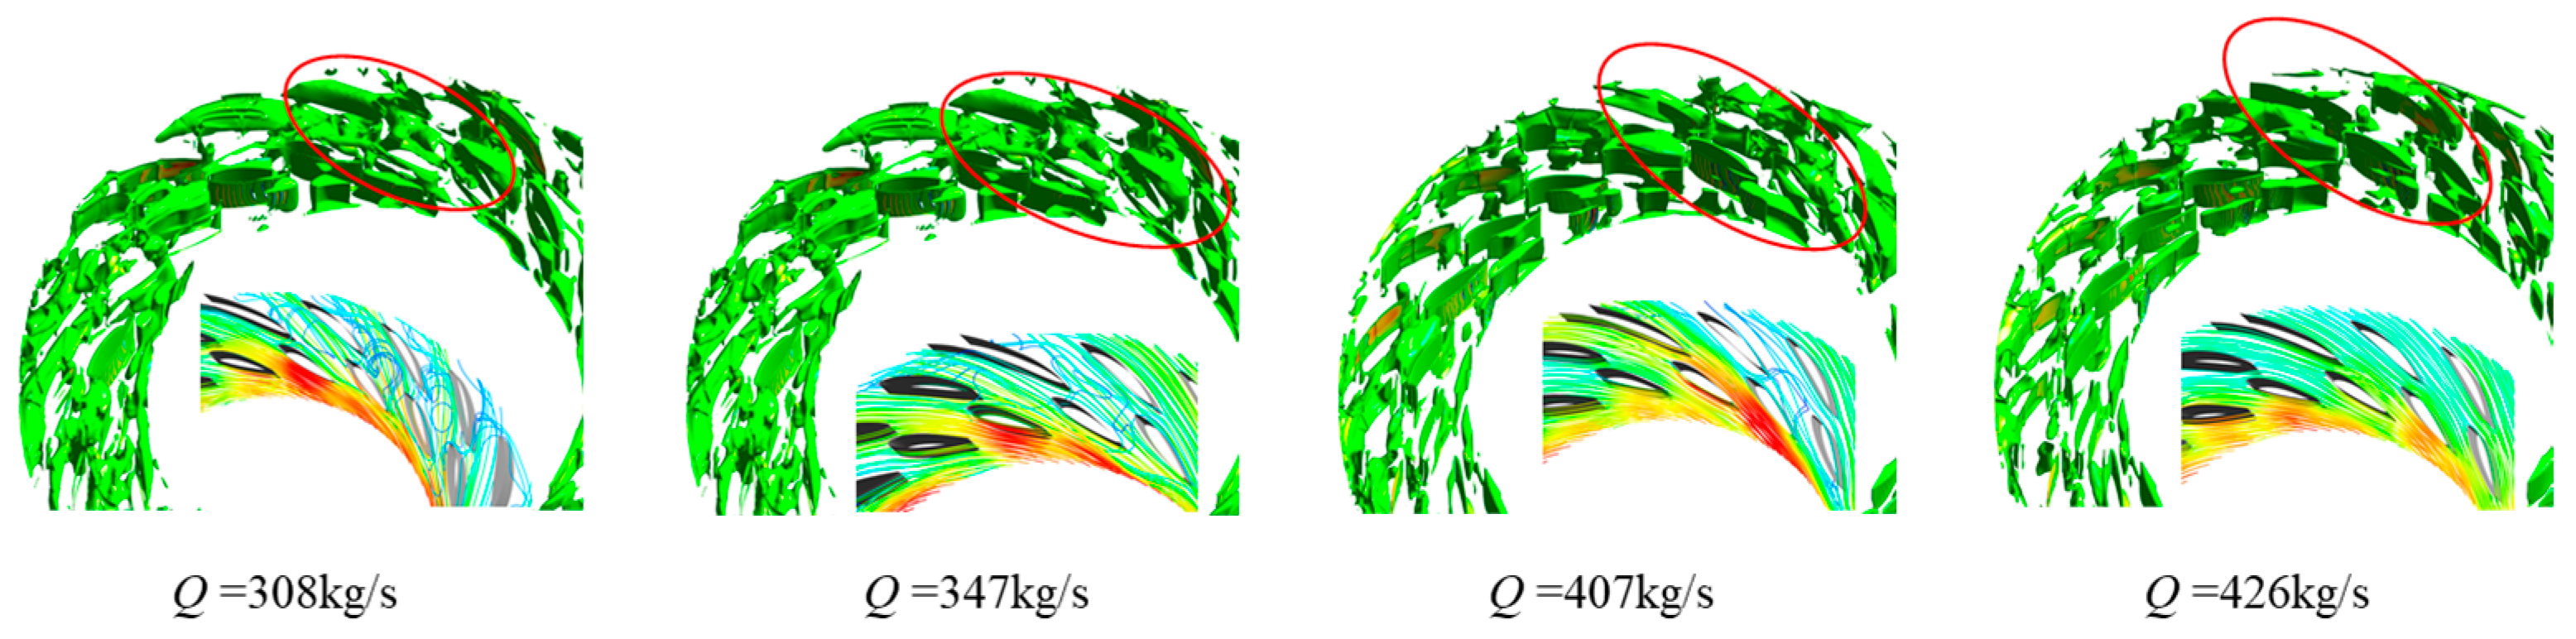
- The vortices in the double-row cascade are flow separation vortices and blade attachment vortices between the vanes. As the flow rate increases, the flow separation vortex decreases, and the blade attachment vortex does not change significantly. Sand particles were mainly accumulated at the bottom of the guide vane and the middle of the stay vane. As the flow rate increases, the sand accumulation between the stay vane increases, and the range of sand accumulation between the movable guide vanes first increases and then decreases. The separation vortex between the double-row cascade vanes has a greater influence on the sand movement under the four flow conditions, which encourages the sand movement to be concentrated in the middle and lower sections of the vanes and aggravates the movement of sand close to the blade profile.
- (4)
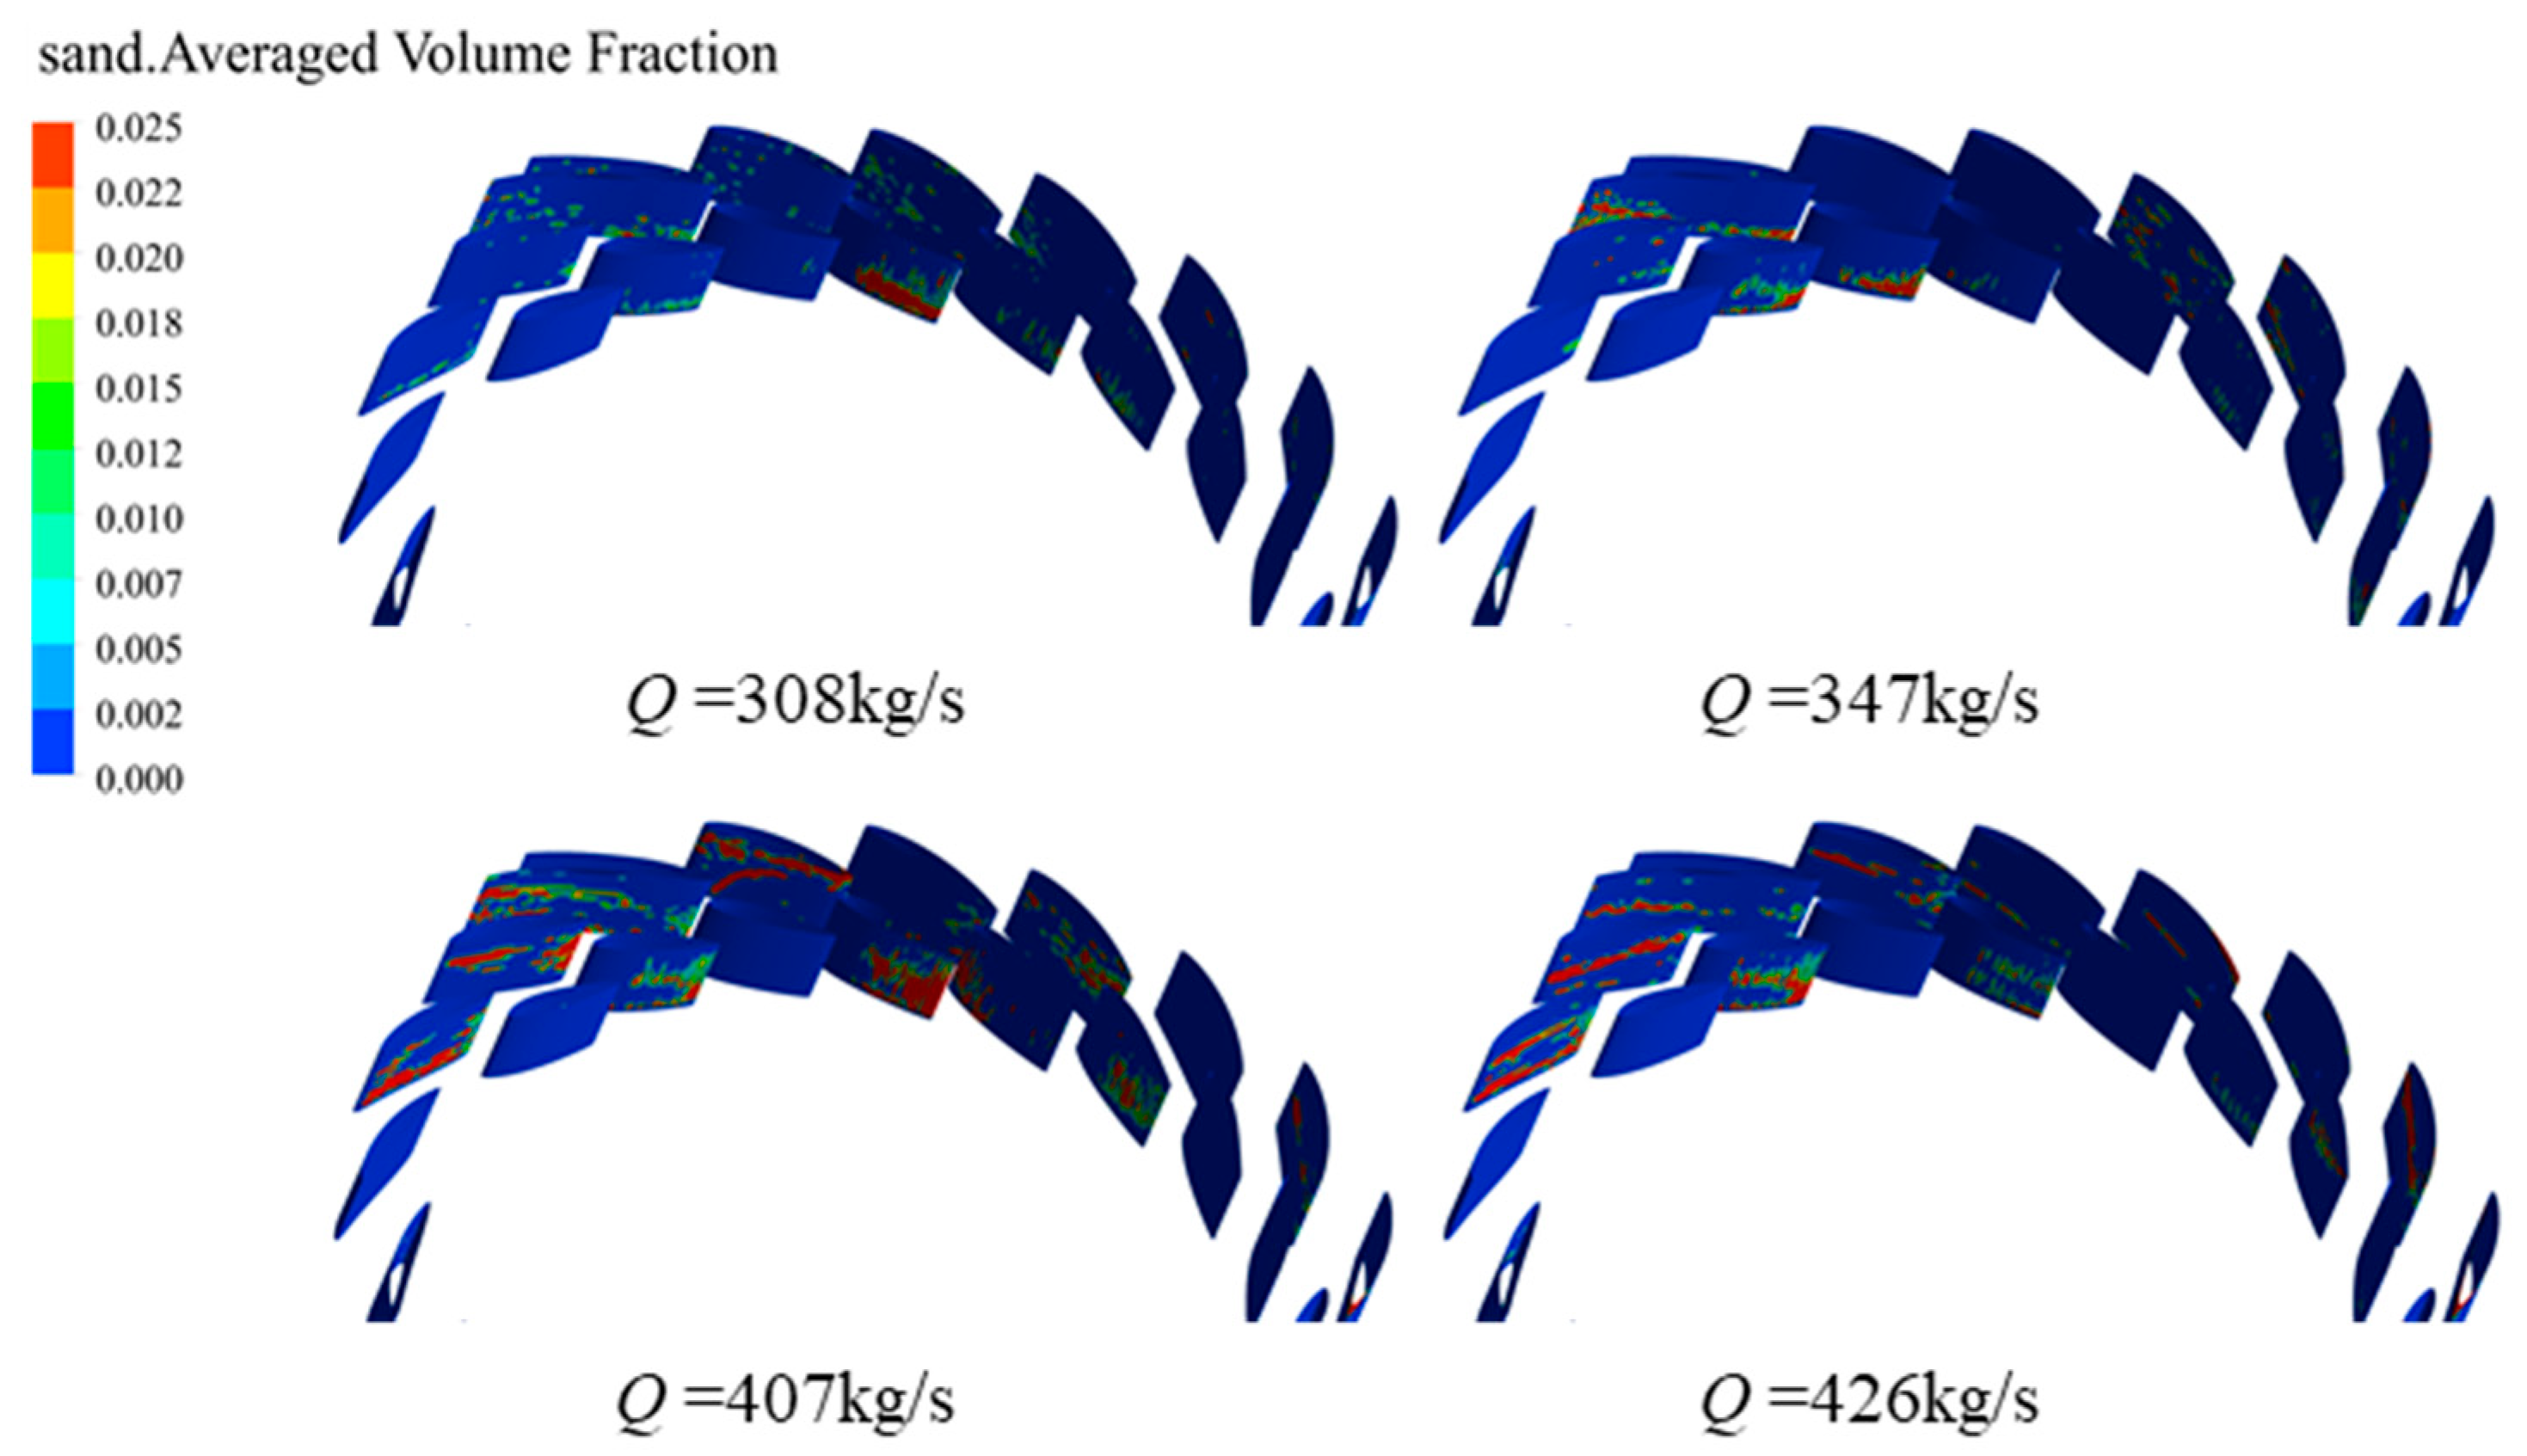
- The vortex in the volute is mainly distributed near the wall and in the form of a vortex band on the outlet extension. As the flow rate increases, the vortex at the wall gradually decreases, and the vortex zone at the outlet first decreases, then disappears and finally reappears. Sand particles accumulate on the wall surface of the volute, on the tongue and at the outlet of the extension section. As the flow rate increases, the sand accumulation at the tongue intensifies, the position of the sand accumulation at the outlet moves upward, and the sand accumulation on the wall surface changes from elongated to lumpy to elongated. Under the four flow conditions, the sand particles in the volute are squeezed by the vortex at the bottom of the wall and move upward, the sand particles are moved outward by the vortex inside the wall, and the sand particles flow out of the volute along the outer surface of the vortex band at the outlet of the expansion section.
Author Contributions
Funding
Institutional Review Board Statement
Informed Consent Statement
Data Availability Statement
Conflicts of Interest
References
- Koirala, R.; Thapa, B.; Neopane, H.P.; Zhu, B.; Chhetry, B. Sediment erosion in guide vanes of Francis turbine: A case study of Kaligandaki Hydropower Plant, Nepal. Wear 2016, 362–363, 53–60. [Google Scholar] [CrossRef]
- Kim, H.-H.; Kim, K.; Suh, S.-H.; Kim, K.Y. Numerical Study of Sediment Erosion Analysis in Francis Turbine. Sustainability 2019, 11, 1423. [Google Scholar] [CrossRef]
- Aneke, M.; Wang, M. Energy storage technologies and real life applications—A state of the art review. Appl. Energy 2016, 179, 350–377. [Google Scholar] [CrossRef]
- Zhang, L.; Guo, Y.; Wang, H.; Yang, X.; Lian, J. Research on Vibration Characteristics of an Underground Powerhouse of Large Pumped-Storage Power Station. Energies 2022, 15, 9637. [Google Scholar] [CrossRef]
- Nikolaos, P.C.; Marios, F.; Dimitris, K. A Review of Pumped Hydro Storage Systems. Energies 2023, 16, 4516. [Google Scholar] [CrossRef]
- Lai, X.; Chen, X.; Liang, Q.; Ye, D.; Gou, Q.; Wang, R.; Yan, Y. Experimental and numerical investigation of vortex flows and pressure fluctuations in a high-head pump-turbine. Renew. Energy 2023, 211, 236–247. [Google Scholar] [CrossRef]
- Hu, D.; Cheng, Y.; Zhang, P.; Wang, X.; Ding, J.; Zhang, X. Distribution Features of Flow Patterns and Pressure Pulsations of Pump-Turbine in Five Operating Modes on the Four-Quadrant Plane. Front. Energy Res. 2022, 10, 880293. [Google Scholar] [CrossRef]
- Hao, Z.; Shi, G.; Peng, X.; Chai, H.; Lv, W.; Huang, Z. Study on the influence of vortex spatial-temporal evolution on the causes of hump region of Pump-Turbine and the characteristics of vortex dynamics. J. Energy Storage 2024, 92, 112297. [Google Scholar] [CrossRef]
- Xu, L.; Kan, K.; Zheng, Y.; Liu, D.; Binama, M.; Xu, Z.; Yan, X.; Guo, M.; Chen, H. Rotating stall mechanism of pump-turbine in hump region: An insight into vortex evolution. Energy 2024, 292, 130579. [Google Scholar] [CrossRef]
- Yang, J.; Cheng, X.; Liu, X.; Feng, X.; Pan, K. Influence mechanism of impeller internal flow structure in the pump-mode hump instability of pump turbine: A compressible flow solution. J. Energy Storage 2024, 92, 112049. [Google Scholar] [CrossRef]
- Liu, Y.; Wang, D.; Ran, H. Computational research on the formation mechanism of double humps in pump–turbines. Eng. Appl. Comput. Fluid Mech. 2021, 15, 1542–1562. [Google Scholar] [CrossRef]
- Liu, D.; Xu, W.; Zhao, Y. Experimental study of the flow field of a high head model pump turbine based on PIV technique. J. Hydrodyn. 2021, 33, 1045–1055. [Google Scholar] [CrossRef]
- Li, D.; Song, Y.; Lin, S.; Wang, H.; Qin, Y.; Wei, X. Effect mechanism of cavitation on the hump characteristic of a pump-turbine. Renew. Energy 2021, 167, 369–383. [Google Scholar] [CrossRef]
- Dong, G.; Luo, Z.; Guo, T.; Zhang, X.; Shan, R.; Dai, L. The Splitter Blade Pump–Turbine in Pump Mode: The Hump Characteristic and Hysteresis Effect Flow Mechanism. Processes 2024, 12, 324. [Google Scholar] [CrossRef]
- Li, D.; Chang, H.; Zuo, Z.; Wang, H.; Li, Z.; Wei, X. Experimental investigation of hysteresis on pump performance characteristics of a model pump-turbine with different guide vane openings. Renew. Energy 2020, 149, 652–663. [Google Scholar] [CrossRef]
- Der, O.; Bertola, V. An experimental investigation of oil-water flow in a serpentine channel. Int. J. Multiph. Flow 2020, 129, 103327. [Google Scholar] [CrossRef]
- Tao, S.; Shi, G.; Xiao, Y.; Huang, Z.; Wen, H. Effect of Operating Parameters on the Coalescence and Breakup of Bubbles in a Multiphase Pump Based on a CFD-PBM Coupled Model. J. Mar. Sci. Eng. 2022, 10, 1693. [Google Scholar] [CrossRef]
- Hu, L.; Liang, A.; Li, H.; Zhang, W.; Zhu, B. Impact of rotor–stator axial spacing on the gas–liquid–solid flow characteristics of a multiphase rotodynamic pump based on the Euler multi-fluid model. Phys. Fluids 2024, 36, 063314. [Google Scholar] [CrossRef]
- Jin, Z.; Song, X.; Zhang, A.; Shao, F.; Wang, Z. Prediction for the Influence of Guide Vane Opening on the Radial Clearance Sediment Erosion of Runner in a Francis Turbine. Water 2022, 14, 3268. [Google Scholar] [CrossRef]
- Liu, J.; Pang, J.; Liu, X.; Huang, Y.; Deng, H. Analysis of Sediment and Water Flow and Erosion Characteristics of Large Pelton Turbine Injector. Processes 2023, 11, 1011. [Google Scholar] [CrossRef]
- Gao, X.; Wang, J.; Lu, H.; Shi, W.; Duan, J.; Meng, W.; Jin, J. Numerical Simulation of Solid-Liquid Two-Phase Flow in Non-Clog Pump. J. Phys. Conf. Ser. 2022, 2329, 012020. [Google Scholar] [CrossRef]
- Hong, S.; Hu, X. Experimental Study and Analysis on Wear Characteristics of Mining Pumps Transporting Solid-Liquid Two-Phase Flows. Appl. Sci. 2024, 14, 5634. [Google Scholar] [CrossRef]
- Guo, X.; Shi, G.; Xiao, Y.; Ye, X. A Study of the Relationship between Sand Movement and Flow Field Distribution and Wear Causes in a Multiphase Pump. J. Mar. Sci. Eng. 2024, 12, 1203. [Google Scholar] [CrossRef]


| Parameter and Unit | Symbolic | Value |
|---|---|---|
| Runner inlet dia. (mm) | D1 | 470 |
| Runner outlet dia. (mm) | D2 | 300 |
| Rated rotational speed (rpm) | Nd | 1300 |
| Runner blade number (-) | ZR | 9 |
| Stay vane number (-) | ZR | 20 |
| Guide vane number (-) | ZG | 20 |
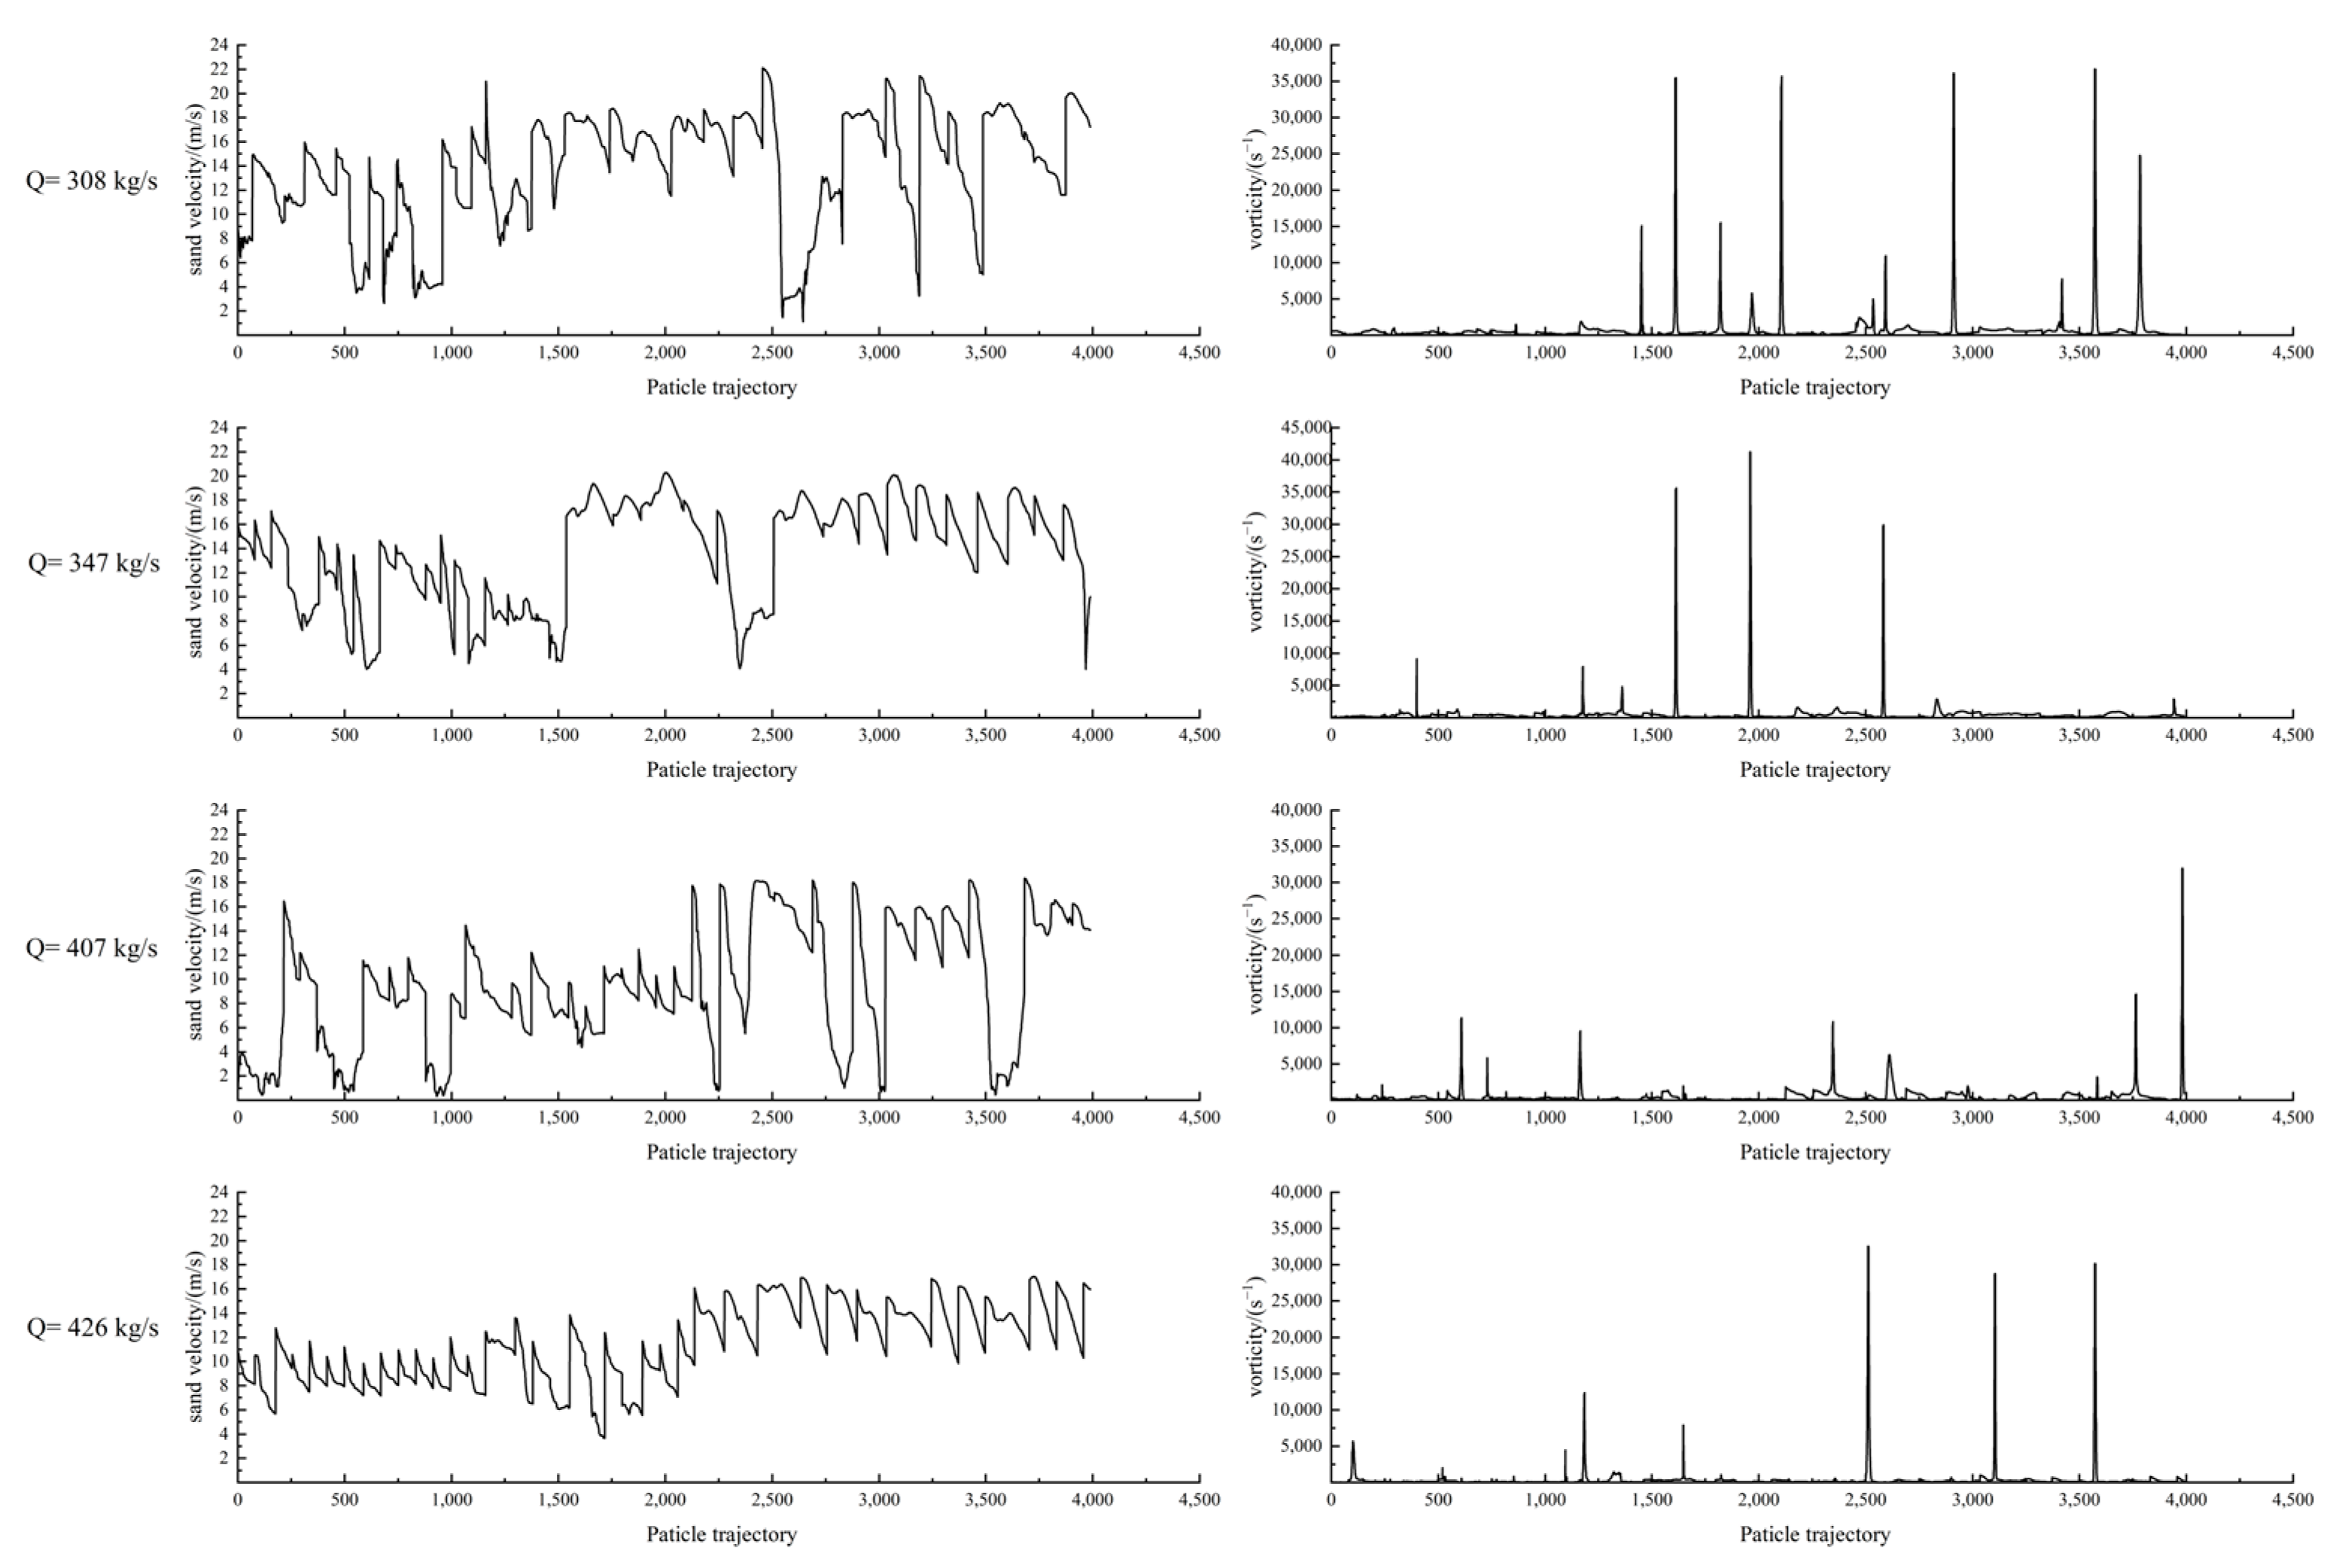
| 308 kg/s | 347 kg/s | 407 kg/s | 426 kg/s | |
|---|---|---|---|---|
| V (m/s) | 14.04 | 14.15 | 14.30 | 14.70 |
| ω (s−1) | 3214.9 | 2143.09 | 3650.29 | 3770.5 |
Disclaimer/Publisher’s Note: The statements, opinions and data contained in all publications are solely those of the individual author(s) and contributor(s) and not of MDPI and/or the editor(s). MDPI and/or the editor(s) disclaim responsibility for any injury to people or property resulting from any ideas, methods, instructions or products referred to in the content. |
© 2024 by the authors. Licensee MDPI, Basel, Switzerland. This article is an open access article distributed under the terms and conditions of the Creative Commons Attribution (CC BY) license (https://creativecommons.org/licenses/by/4.0/).
Share and Cite
Shi, G.; Ye, X.; Xiao, Y.; Guo, X.; Qin, H.; Tang, M. Effect of the Vortex on the Movement Law of Sand Particles in the Hump Region of Pump-Turbine. J. Mar. Sci. Eng. 2024, 12, 2190. https://doi.org/10.3390/jmse12122190
Shi G, Ye X, Xiao Y, Guo X, Qin H, Tang M. Effect of the Vortex on the Movement Law of Sand Particles in the Hump Region of Pump-Turbine. Journal of Marine Science and Engineering. 2024; 12(12):2190. https://doi.org/10.3390/jmse12122190
Chicago/Turabian StyleShi, Guangtai, Xunyun Ye, Yexiang Xiao, Xin Guo, Hao Qin, and Manqi Tang. 2024. "Effect of the Vortex on the Movement Law of Sand Particles in the Hump Region of Pump-Turbine" Journal of Marine Science and Engineering 12, no. 12: 2190. https://doi.org/10.3390/jmse12122190
APA StyleShi, G., Ye, X., Xiao, Y., Guo, X., Qin, H., & Tang, M. (2024). Effect of the Vortex on the Movement Law of Sand Particles in the Hump Region of Pump-Turbine. Journal of Marine Science and Engineering, 12(12), 2190. https://doi.org/10.3390/jmse12122190