Article

The Association of Benthic Infauna with Fine-Grained Organic-Rich Sediments in a Shallow Subtropical Estuary

1
Ocean Engineering and Marine Sciences, Florida Tech, Melbourne, FL 32901, USA
2
The Department of Biological Sciences, College of Science and Mathematics, Tarleton State University, Stephenville, TX 76401, USA
*
Author to whom correspondence should be addressed.
J. Mar. Sci. Eng. 2024, 12(12), 2184; https://doi.org/10.3390/jmse12122184
Submission received: 18 October 2024 / Revised: 22 November 2024 / Accepted: 26 November 2024 / Published: 28 November 2024

Abstract

:
Fine-grained organic-rich sediments (FGORSs) from anthropogenic impacts are a growing concern for bays and estuaries around the world. This study explores the relationships of infaunal community diversity and species abundances with FGORSs in the Indian River Lagoon and its tributaries. To examine these potential relationships, infauna was collected monthly using a Petite Ponar grab at 16 stations in the central Indian River Lagoon from October 2015 to August 2016. Abundant taxa in these sediments include polychaete worms (e.g., the polychaete Nereis succinea), mollusks (e.g., clam Parastarte triquetra), and arthropods (e.g., the tanaid Leptochelia dubia), with densities as high as 5.3 × 10⁴ m−2 (L. dubia in July 2016). Increasing organic matter (OM) in the sediments was inversely correlated with species richness (R2 = 0.75; p-value < 0.001), densities (R2 = 0.69; p-value < 0.001), and diversity (R2 = 0.37; p-value < 0.001). Other infaunal community and population data showed similar relationships with silt–clay (%), sediment porosity, and dissolved oxygen (mg L−1). Two thresholds of OM and correlated environmental parameters are discussed: an impairment threshold at 2% OM, above which infauna decreases precipitously, and a critical threshold at 10% OM, above which infauna is generally absent.

1. Introduction

Estuaries and coastal systems throughout the world are crucial marine habitats for primary production and the overall health of marine ecosystems [1,2]. However, their health is in decline due to negative anthropogenic impacts such as coastal construction and excess influx of pollutants and nutrients, which can drive harmful algal blooms [3,4]. Another common problem is the accumulation of fine-grained organic-rich sediment (FGORS), which comes from various sources such as runoff and sewage [5], terrestrial litter [6,7], oil and industrial waste [8], and coastal development. Organic matter (OM), although a natural part of coastal systems, is harmful to marine environments in large quantities [9,10]. When certain conditions are present, anaerobic bacterial processes can further degrade a system via mass decomposition of organic matter, resulting in hypoxia or anoxia [11], which is exacerbated when the water is static, deep, and warm [12]. These environments can be especially damaging to the microbenthic assemblages living in the water.
Invertebrate infauna plays a positive ecological role in the benthic ecosystem. Macroinvertebrates are a major contributor to sediment oxidation by particle cycling and bioturbation [13], and they help with denitrification, remineralization, and sediment recycling [14,15]. They live in close association with the benthic sediments and are dependent on them for food and habitat. Because of their immediate relationship with the sediments, they have relatively predictable patterns of assemblages in relation to the marine benthos. Thus, measuring and characterizing the sediments in a coastal system can serve as an ecological indicator for assessing the health and quality of a specific ecosystem [16,17].
The impact of OM on benthic infauna has been extensively researched. A widely accepted study conducted by Pearson and Rosenberg [10] produced a model to predict how infaunal abundance, species richness, and biomass respond to a gradient of organic pollution. The model expresses that, in general, as organic matter increases, species richness and diversity decrease. Also, in places where organic matter was highest, the model predicted that no macroinfaunal species should be found [10,17]. Recently, more efforts have been made to quantitatively examine the thresholds or critical points in the OM gradient that can result in a change in benthic community composition [9,18]. This is challenging due to the different chemical, physical, and biological factors that influence a particular coastal system, but overall patterns of OM driving community composition have been reported in similar studies [8,10,19].
The Indian River Lagoon (IRL) is plagued by many of the same stresses afflicting other estuaries, primarily nutrient pollution leading to eutrophication, which can result in hypoxic/anoxic zones that can limit population sizes and overall biodiversity. The IRL makes up 40% of the coastline on the east coast of Florida, with a range of 250 km. Because of its length and its geographical location through transitional climates, it is considered to be one of the most diverse estuaries in North America [20]. The lagoon serves as a sink for agricultural runoff from the interior of the state and supports a significant human population along its length. Consequently, the IRL is highly impacted by anthropogenic nutrient inputs, and the buildup of FGORS in the lagoon is one result of, and contributor to, the estuary’s eutrophication. This is a concern to the local marine environment and, thus, a large portion of the Florida economy. Anthropogenic nutrients and FGORS threaten seagrass growth, promote an algae-dominated system, and cause low oxygen levels and high hydrogen sulfide concentrations that can contribute to fish mortality.
The objective of this study was to find major shifts in benthic infaunal communities in association with sediment characteristics (silt–clay, porosity, and OM) and dissolved oxygen above the sediments. The purpose was to provide insight and have OM serve as an ecological indicator for restoration and mitigation projects in the Indian River Lagoon and other similar coastal systems.

2. Materials and Methods

Infauna and sediment samples were collected monthly at 16 sampling stations in Florida’s central Indian River Lagoon (IRL) from May 2015 to August 2016. Two adjacent tributary systems 4.5 km apart in the IRL were sampled at various stations in each. These two inflows have previously been dredged for navigational purposes and are consequently deeper than the average IRL depth. Additional nearby stations were also sampled in the IRL proper (Figure 1).
Grabs were collected monthly, haphazardly around each station’s coordinates. Grab samples were collected using a Wildco Petite Ponar (6″ scoop) grab [21,22]. Because the use of a single grab sampler may not capture the full spatial variability of the infaunal communities, three separate grabs (about half a meter to a meter apart) from each site were taken as a measure of accounting for species variability. The water depth above each sediment grab was between 30 cm and 180 cm, except for the muck locations (TCM and CCM), where the water was 3 m deep. Sediments were then sifted through a 0.5 mm sieve [23,24], and retained sediments and organisms were labeled and kept for lab analysis. A fourth, unsifted grab was collected at each station for sediment characterization, including % water content, % organics, and % silt and clays.
A YSI (Yellow Springs Instruments, Yellow Springs, OH, USA) gauge was used to measure the temperature, salinity, dissolved oxygen, and oxygen saturation at every location, with measurements taken at the surface and the bottom in the water column.
Sediment samples were frozen pending the identification and counting of organisms via stereomicroscopy (8–35× magnification). All organisms were counted and identified to the most specific taxonomic level possible. Some hard-shelled organisms (e.g., Ostracoda and Foraminifera) were identified using morphological details revealed via scanning electron microscopy (SEM). Mollusks, crustaceans, and annelids were identified via gross morphology, cross-referenced with known distributions and physiological tolerances [25].
The fourth grab sample collected at each station was used to characterize the sediments. To determine the water content, subsamples were weighed before and after baking at 105 °C for 24 h [26]. Organic content was determined via the mass loss on ignition (LOI) method, where ground dried sediment is weighed before and after baking at 550 °C for 4 h [26,27]. To determine silt and clay content, about 25 g of sediments [28] was weighed, sifted through a 63 µm mesh [9,22], and then re-weighed to calculate the loss of silt and clay particles (<63 µm).
To determine the degree of correlations between populations and communities and FGORS, the average number of species or individuals was regressed against organic sediment characteristics using the statistical program JMP. Where appropriate, data were log10+1-transformed to produce a linear fit and coefficient of variance (R2) value. ANCOVA was used to evaluate the differences among the three taxonomic groupings (mollusks, annelids, and crustaceans), and each was compared using a t-test and a Bonferroni correction (multiplying the p-value by the number of comparisons).
Richness was measured by counting the number of different species present, and density was measured to determine the number of individual species per unit area. However, richness does not take into account the relative abundance of the species, and density focuses solely on the concentration of a single species within a space. Therefore, the Shannon–Weiner diversity index was calculated to provide a more comprehensive picture of species diversity by taking into account both richness and evenness. The following formula was used to determine the diversity:
H = i = 1 s p i ln p i
where H′ is the species diversity index, s is the number of species, and pi is the proportion of individuals of each species belonging to the ith species of the total number of individuals.

3. Results

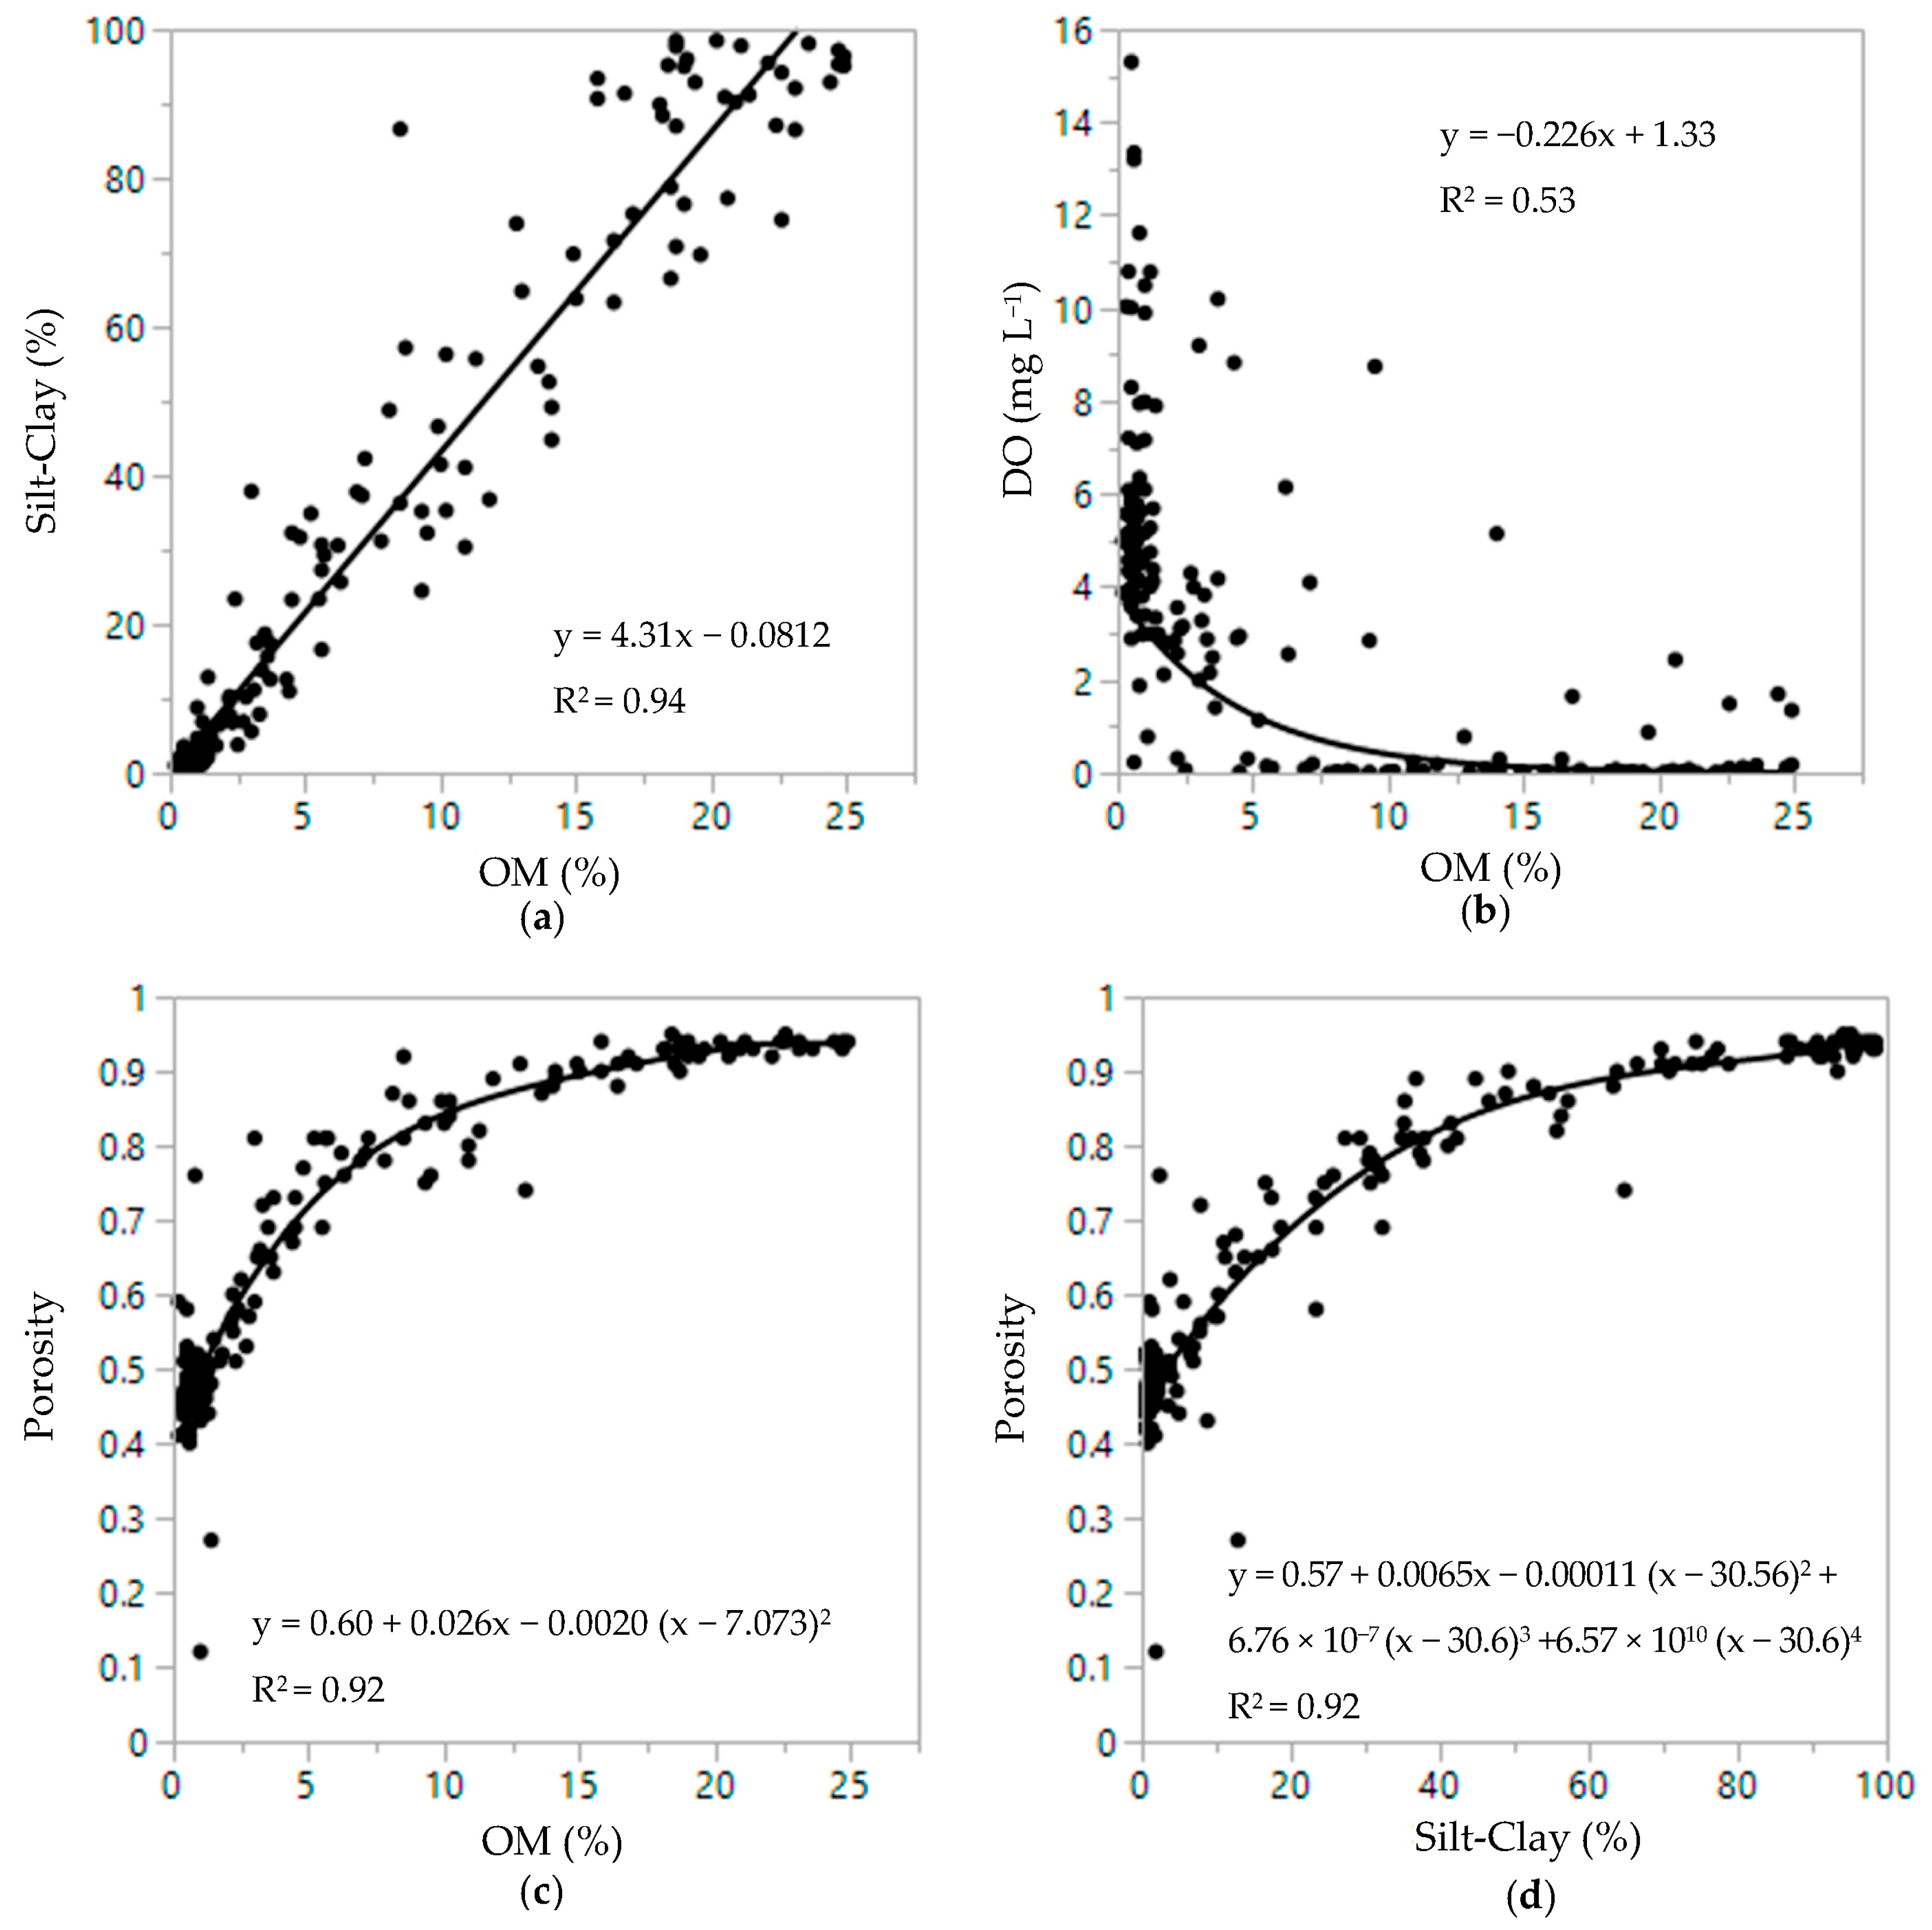
3.1. Sediment Composition and Physical Parameters

Sandier sediments were generally found at stations located in the IRL proper, whereas fine-grained organic-rich sediments (FGORSs) were found at stations located in the tributaries, especially in channels where this type of sediment was concentrated. The organic content of the sediments ranged from 0.3% to 25.9% (Figure 2). Six stations were consistently sandy and contained organic matter < 1%, with an average of 0.65% OM: CCL 2, 3, and 4; TCL 1, 3, and 4. Six stations consisted of a darker, organically richer sediment: TC 1, 2, 3, and 4; CCL 1; and TCL 2. The majority of those stations ranged from 1% to 10% OM, but TC 3 fluctuated between 3% (Oct. 2015) and 13% OM (Aug. 2016), while TC 4 fluctuated from 4% (Nov. 2015) to 23% OM (Dec. 2015). The other four stations (TCM 1 and 2, and CCM 1 and 2) always contained black, organic-rich sediments consisting of OM > 10%. Sandy stations (0.3% to 1% OM) were 0.5 m to 1 m in water depth, while more organic-rich stations (>10% OM) were 1–5 m in depth.
Sediment organic matter (Figure 3a) was correlated strongly with silt–clay content (p < 0.001). Organic matter, in turn, had an inverse logarithmic correlation with dissolved oxygen (p < 0.001, Figure 3b). Accordingly, the most organic-rich stations (TCM 1 and 2, and CCM 1 and 2) were anoxic for most of the year (mg L−1 < 0.05), with the exceptions of January and February. Sediment porosity (Figure 3c,d) also showed strong correlations with OM and silt–clay (p < 0.001).
The temperature was coldest in January (14.8 °C) and rose to a high in August (33.5 °C), with an 11-month mean of 25.8 °C. Although the temperature did not correlate with DO, cooler water has a higher dissolved-oxygen-holding capacity. The bottom salinity varied from 3.5 to 32.8, with an 11-month mean of 22.5.

3.2. Infaunal Density and Diversity Patterns

Seventy-four species of infaunal animals were found in the course of this study. These represented eight phyla: Annelida (22 species), Crustacea (23 species), Mollusca (24 species), Echinodermata (2 species), and one species from each of Chordata, Nematoda, and Sipuncula. One species of foraminifera, Ammonia parkinsoniana, was also found in the samples and included in the statistical analyses. Mollusks, crustaceans, and annelids made up 29.3%, 30.6%, and 32% of the total species found, respectively, or collectively 91.9% of species overall. Species with the highest average observed density (± 1SE) included the clam Mulinia lateralis (12,000 m2 ± 2400 in April 2016), the tanaid crustacean Leptochelia dubia (53,000 per m2 ± 14,000 in June 2016), and the polychaete Diopatra cuprea (3800 per m2 ± 1300 in May 2016). These densities were found at CCL 2, CCL 2, and TCL 4, respectively. A total of 25 species were found to average 10,000 total organisms m2 or greater over the course of this study (Table 1). The highest average species richness recorded was 19 at CCL 3 in May 2016.
A few animals captured in benthic grabs were not infauna but water-column organisms apparently near the surface of the sediment and, thus, captured in the grab. These organisms—a crab zoea, a megalopa, and the larval anchovy Anchoa mitchilli—were not included in the analysis.

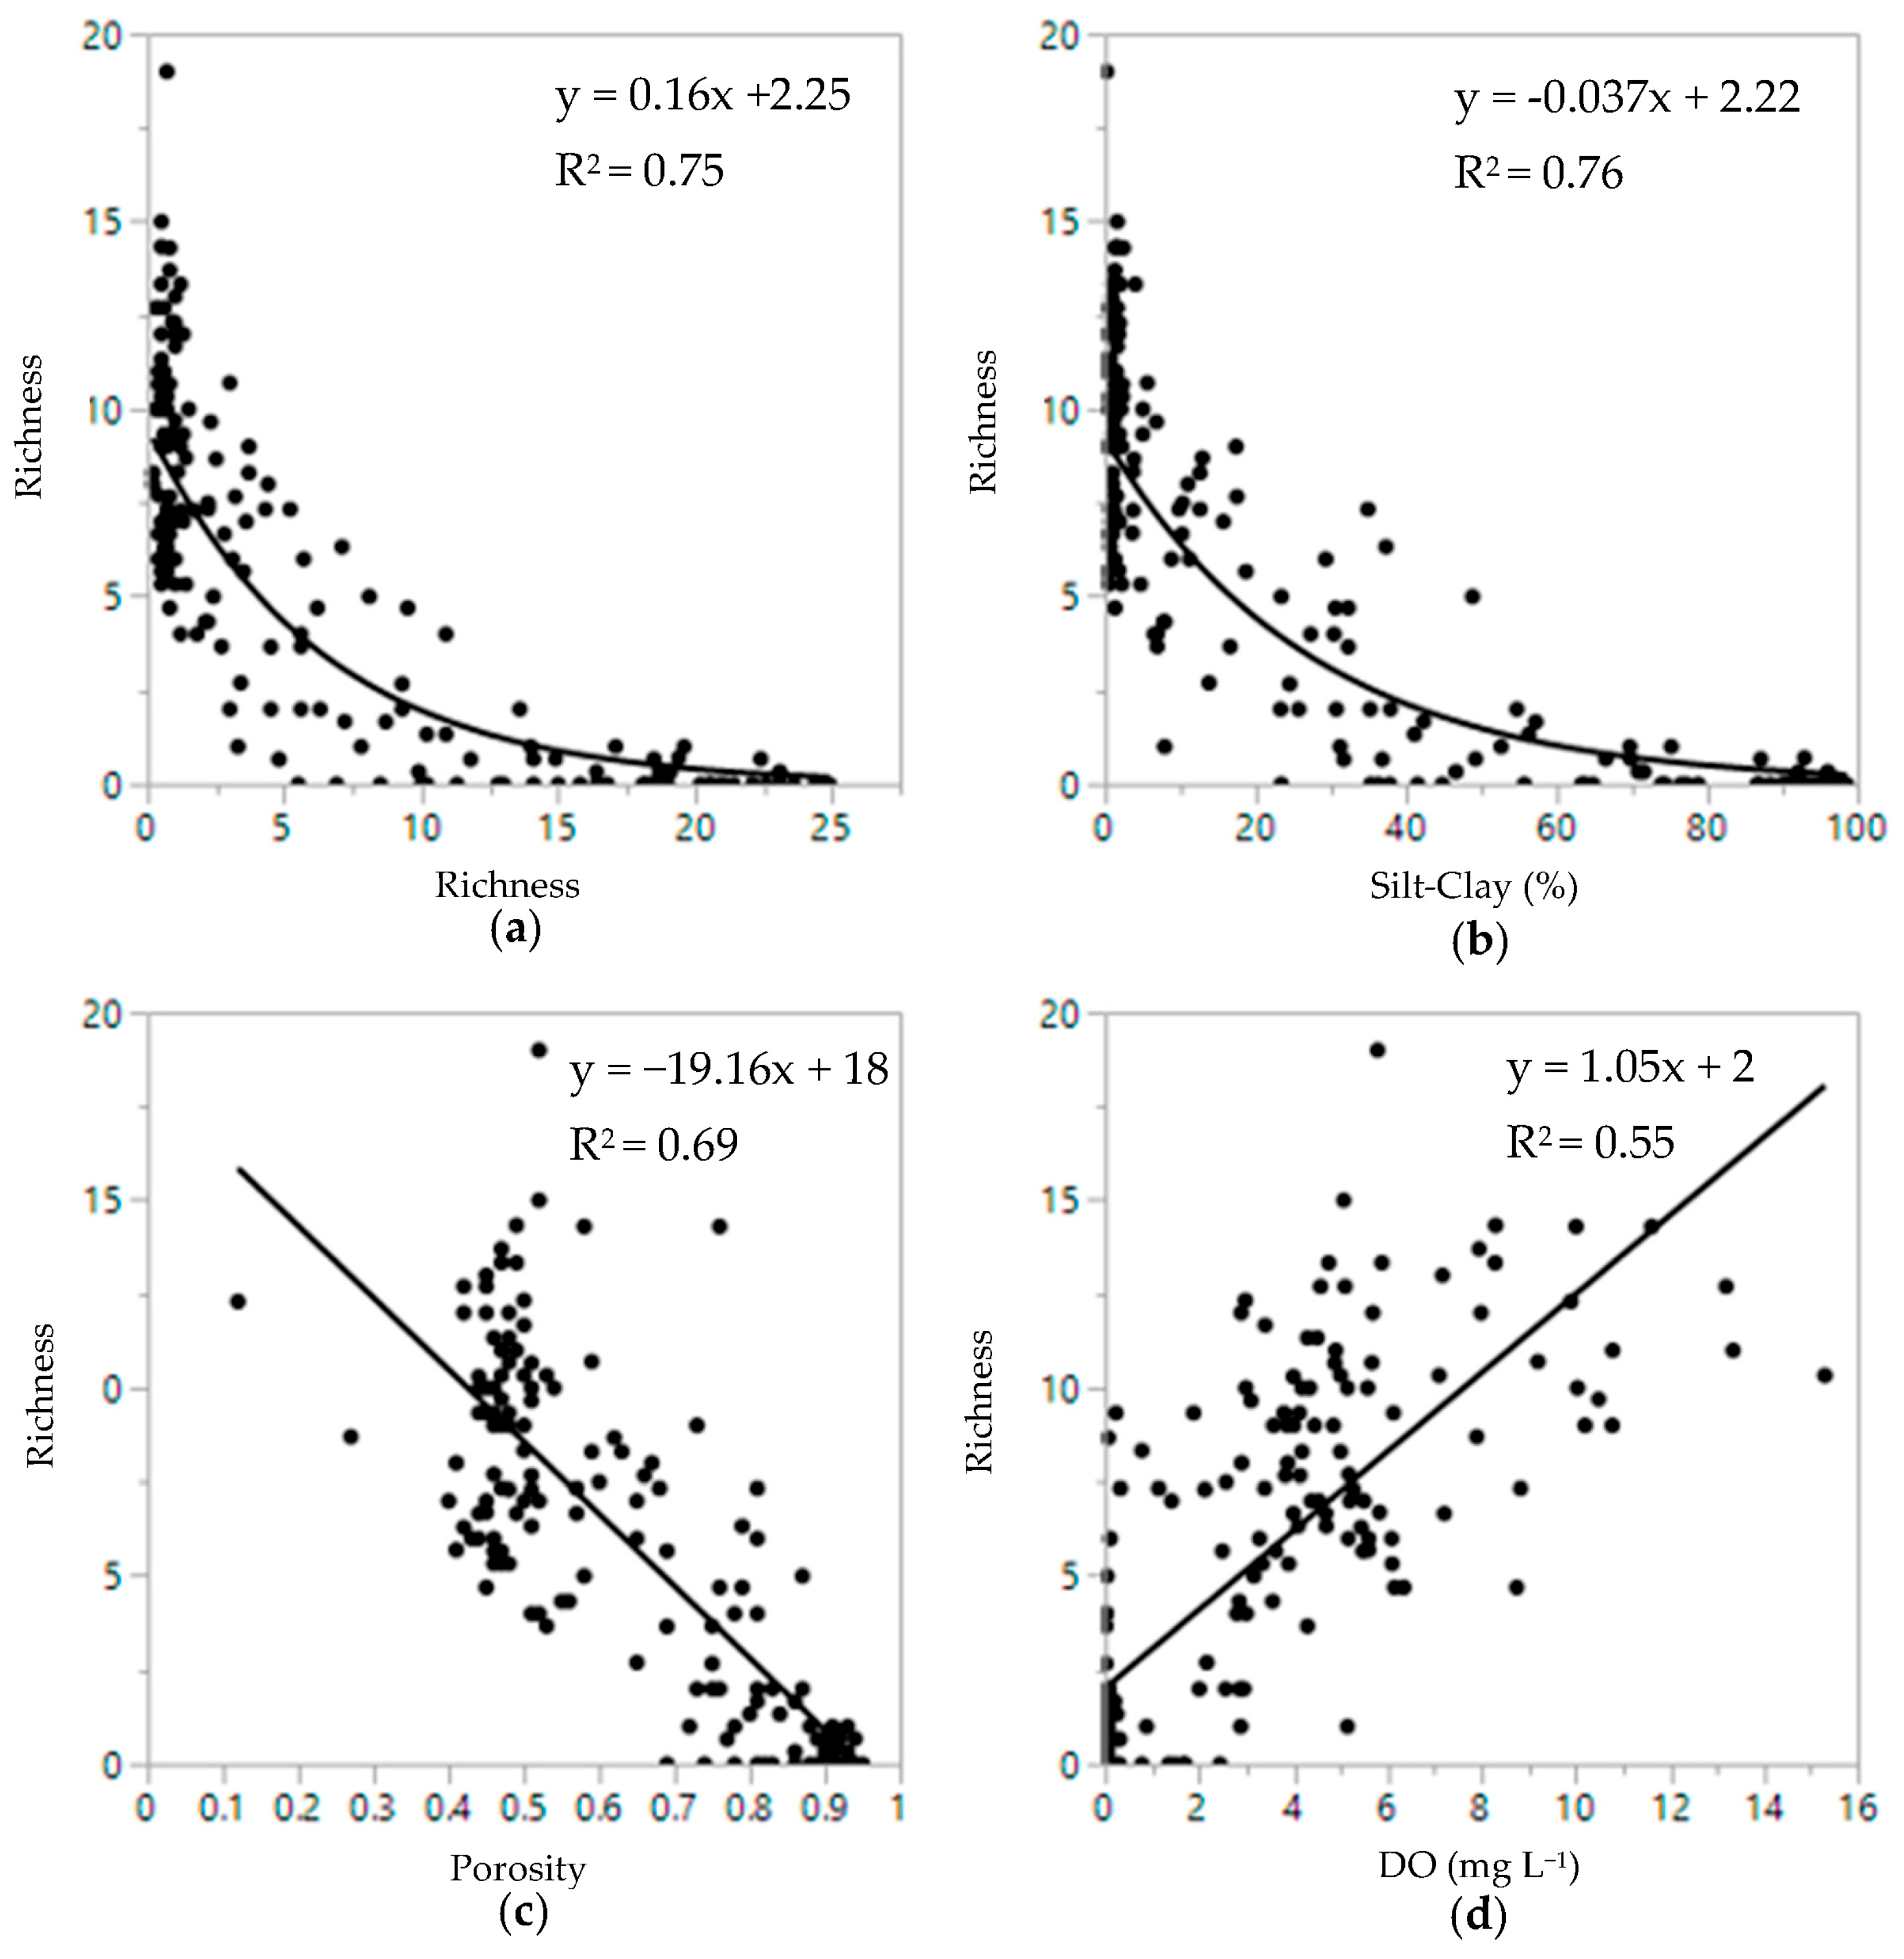
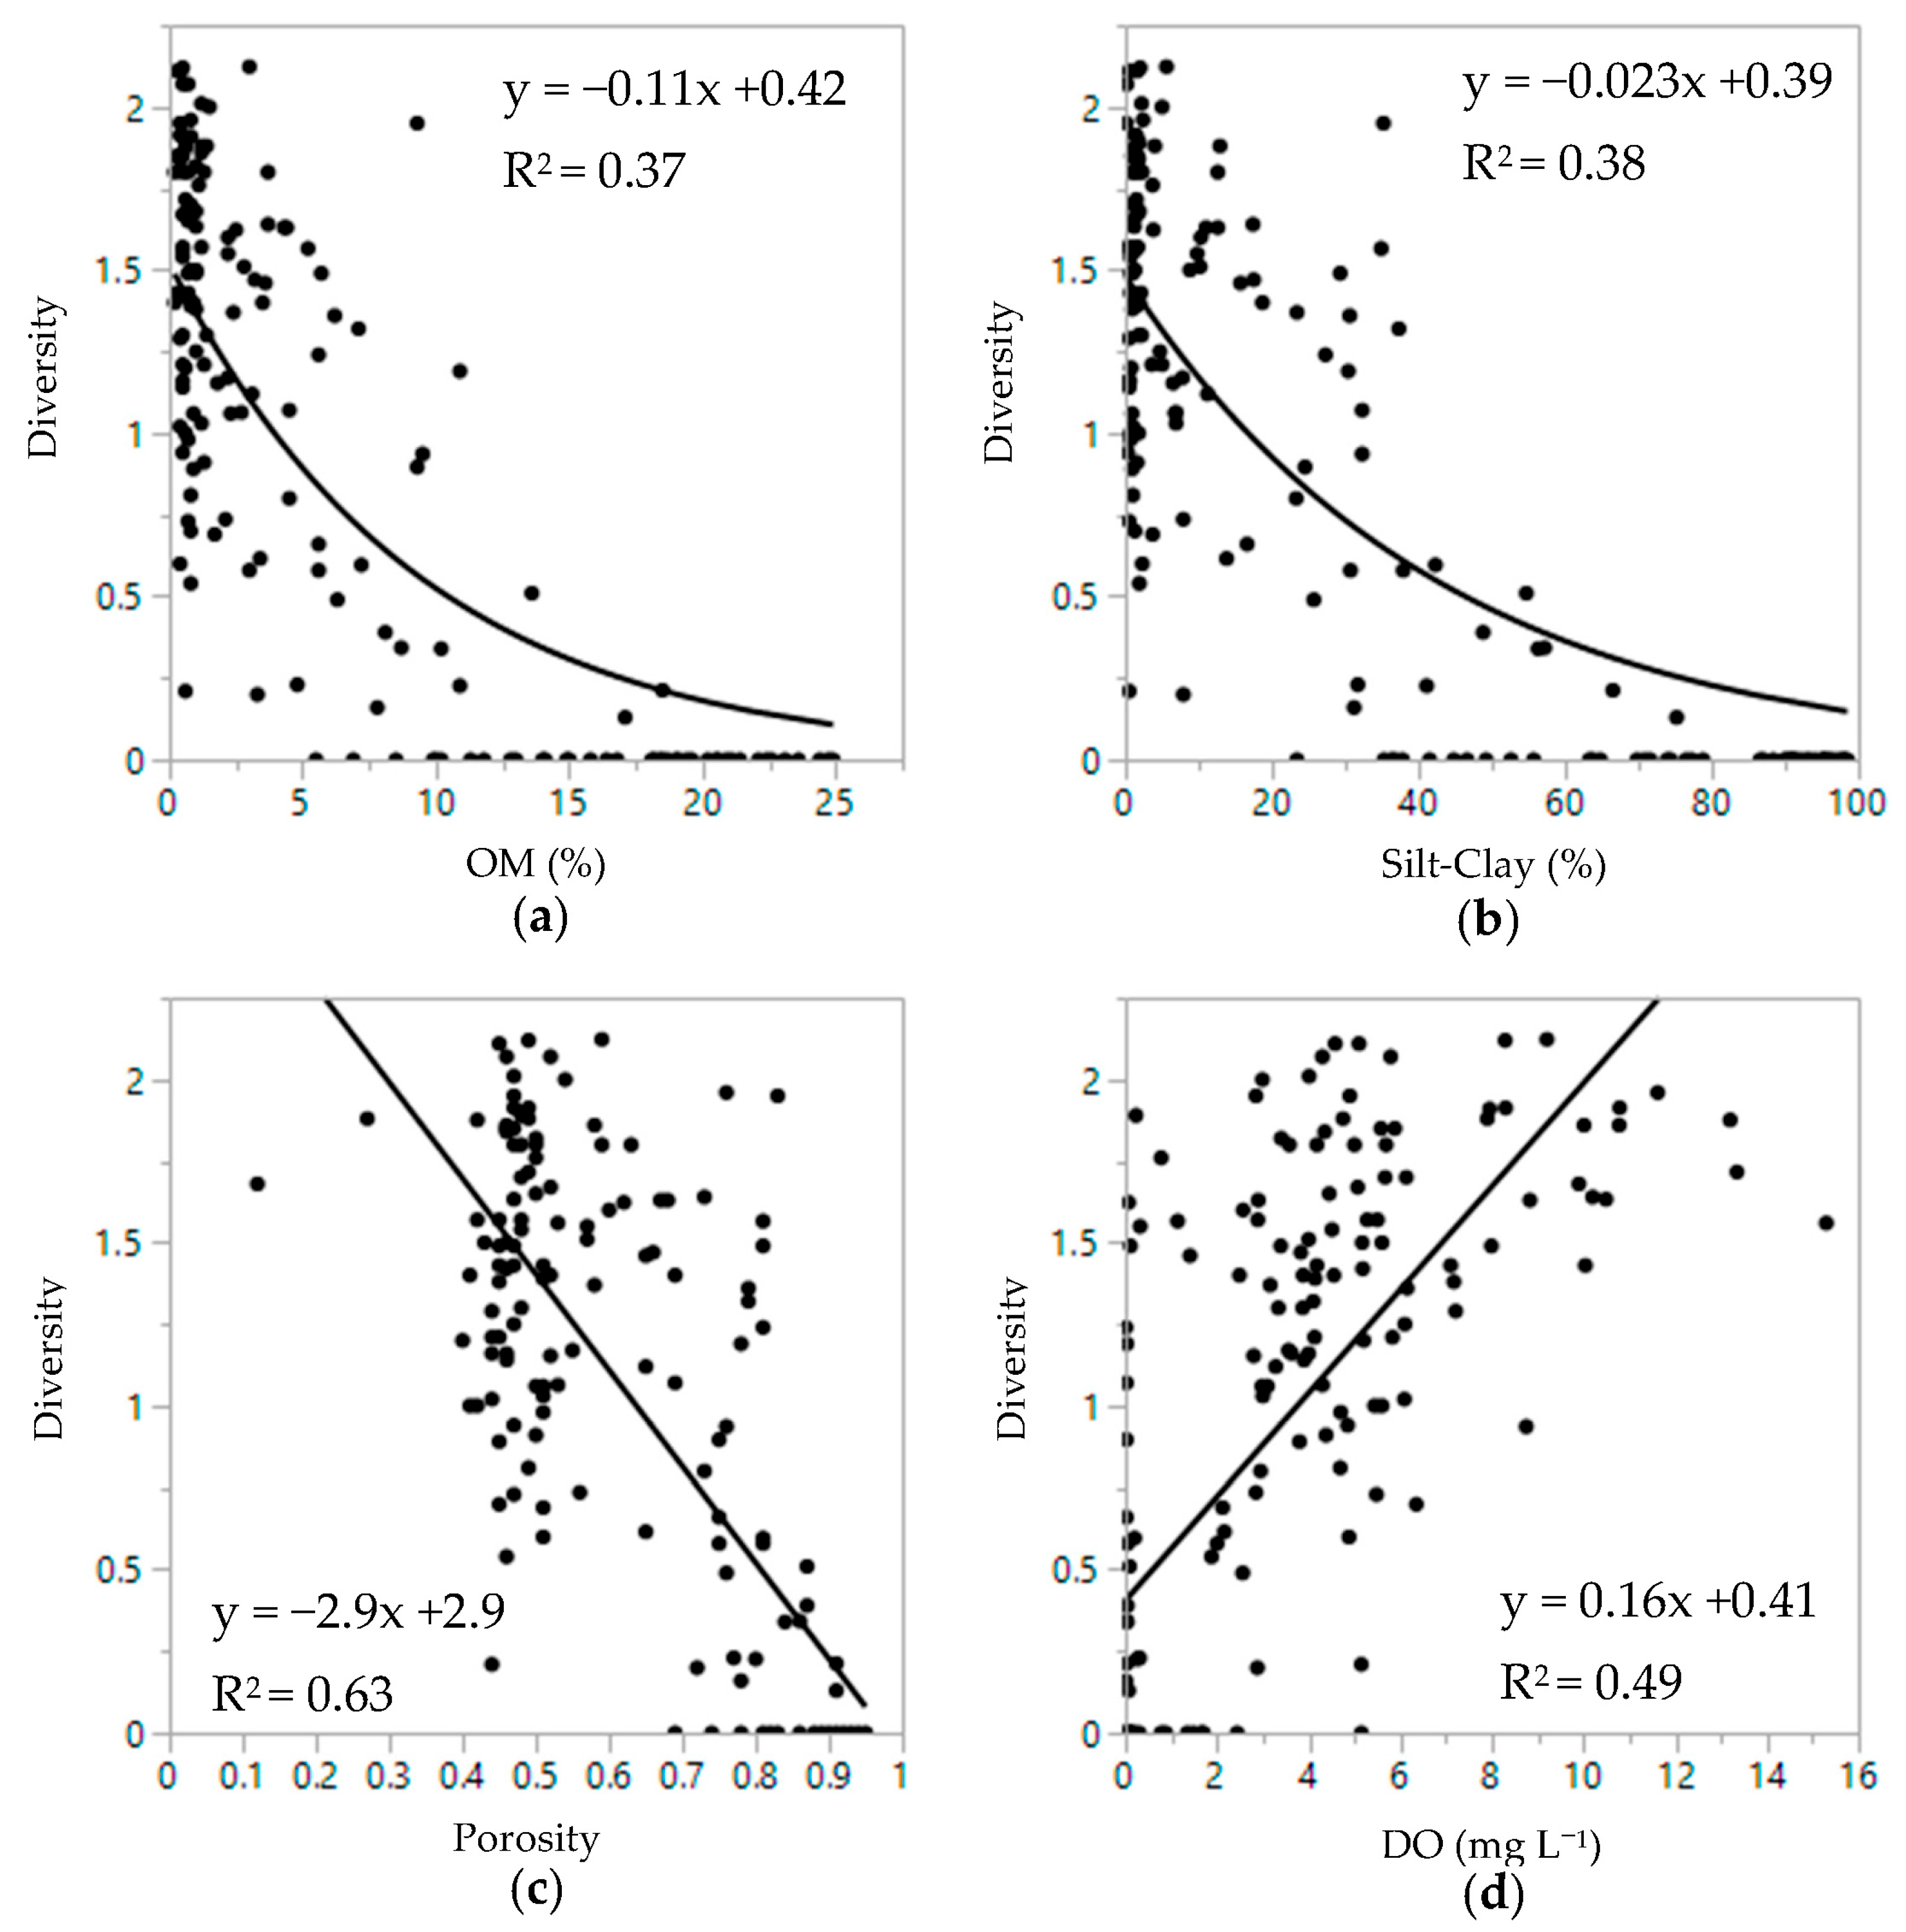
3.3. Sediment and Infauna Correlations

Regression of species richness against basic FGORS parameters yielded an inverse logarithmic correlation, consistent with OM % (Figure 4a), silt–clay content (Figure 4b), and water % (Figure 4c). Species richness showed a positive correlation with DO (Figure 4d, p < 0.001 for all four correlations).
Regression of infaunal community density against basic FGORS parameters yielded an inverse logarithmic correlation, a pattern seen with OM % (Figure 5a), silt–clay content (Figure 5b), and water % (Figure 5c). Infaunal community density showed a positive correlation with DO (Figure 5d, p < 0.001 for all four correlations).
Regression of Shannon–Weiner diversity against the basic FGORS parameters yielded an inverse logarithmic correlation, a pattern seen with OM % (Figure 6a), silt–clay content (Figure 6b), and porosity (Figure 6c). Infaunal diversity showed a positive correlation with DO (Figure 6d, p < 0.001 for all four correlations).

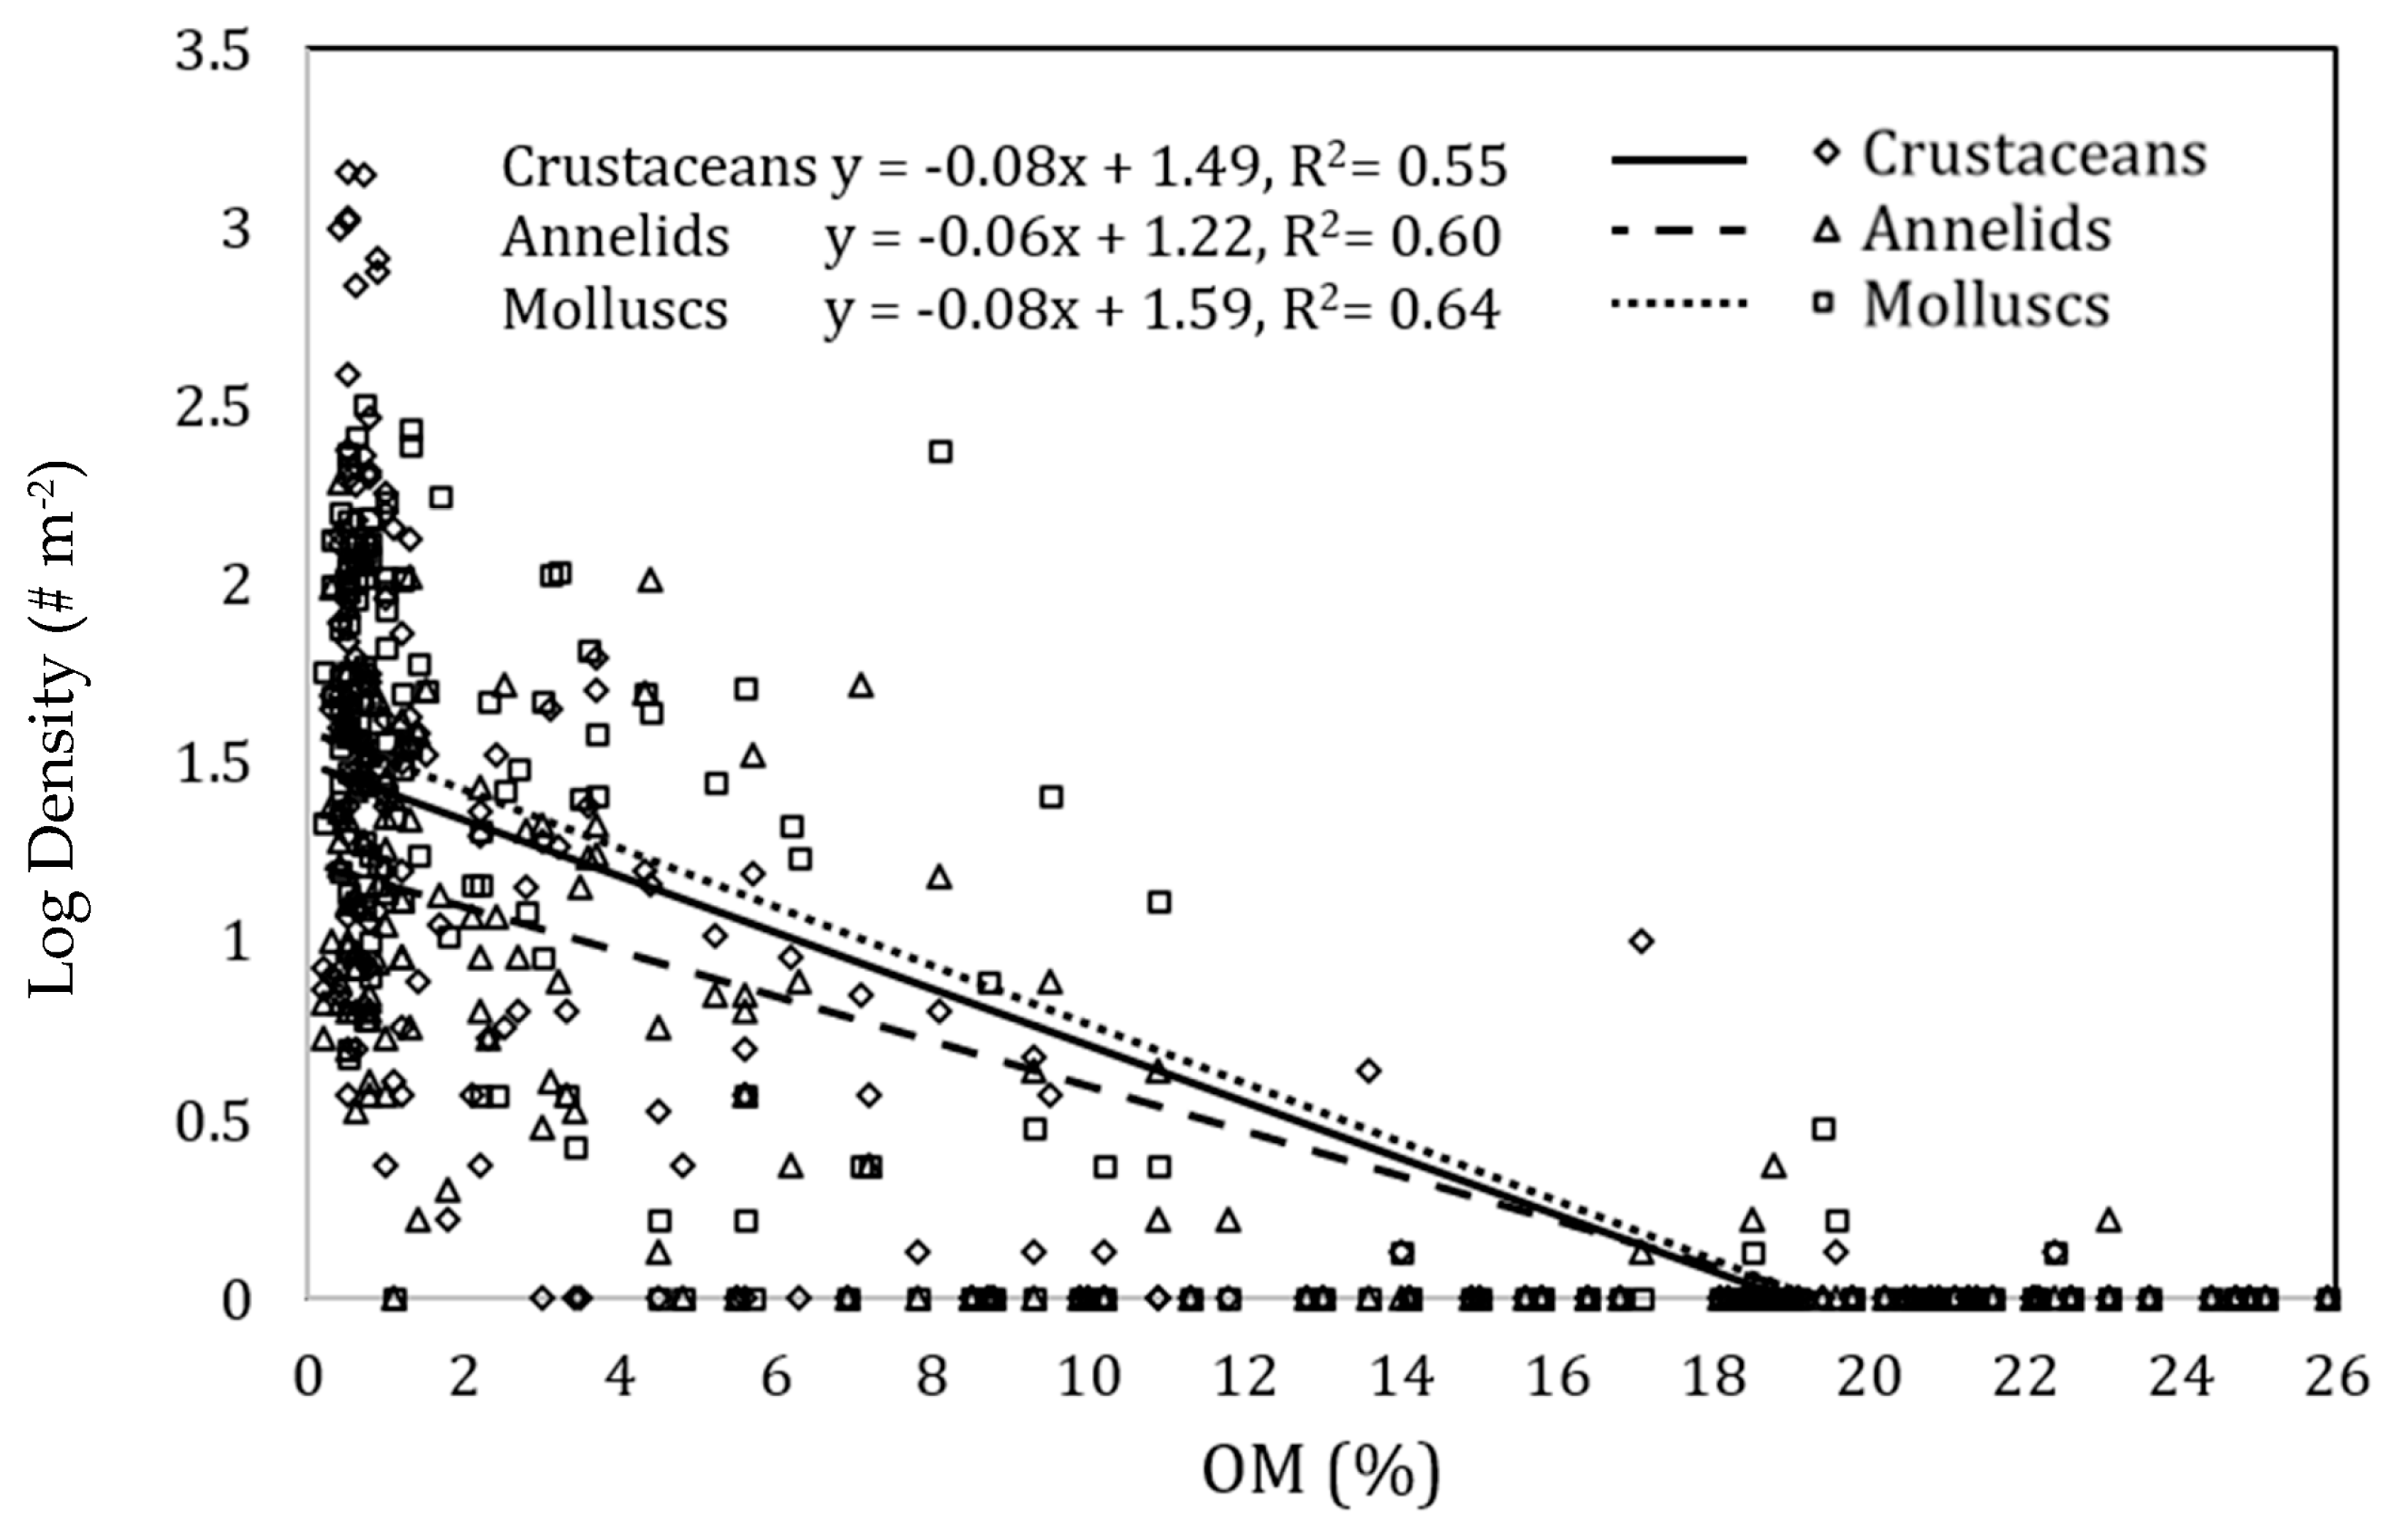
3.4. Taxonomic Sensitivity to OM

Mollusks, crustaceans, and annelids made up almost 92% of all observed organisms; 24 mollusk species, 23 crustacean species, and 22 annelid species were identified. Crustaceans were the most abundant taxa in terms of population sizes, while annelids were the least abundant among the three major phyla. Mollusks, crustaceans, and annelids all showed decreasing abundance as OM % increased (p < 0.001, Figure 7). Annelids however, were significantly less responsive to increasing OM % relative to the other two phyla (shallower slope, p < 0.016).

4. Discussion

The purpose of this study was to determine the impact of organic sediments on infaunal diversity and abundance in a shallow, diverse estuary. We also examined differences in major taxonomic groups (crustaceans, mollusks, and annelids) in responding to changes in sediment organic content. The results present a repeating pattern regarding infaunal communities in relation to sediment conditions. The relationships found may be useful in the characterization of polluted ecosystems and management decisions for eutrophic estuaries, including the Indian River Lagoon, especially because restoration of the IRL has been a top priority of the state and local government, as the waterway was estimated to have a USD 7.6 billion impact on the region. Some of the recent work has included the environmental dredging of FGORS from lagoon tributaries, purchasing and preserving land in conservation areas, and awarding millions of USD in public money towards restoration/mitigation projects. As these projects ramp up, it is important to set evidence-based restoration targets in order to ensure success while maintaining economic efficiency.
We found the basic FGORS parameters (silt–clay content, OM %, and porosity) to be inter-correlated, and these factors are known to influence benthic communities [29,30]. Sediment conditions can also influence water column chemistry, evidenced by the correlations of FGORS characteristics and dissolved oxygen in bottom water. Because organic matter has an influence on the biology and chemistry of the benthos, it is considered to be a potential proxy for benthic community health, taking correlated environmental conditions into account.
A rapid drop in infaunal species richness, abundance, and diversity results from stressful sediment conditions. As silts and clays accumulate, OM binds to the increased sediment surface areas [31,32]. Bacterial processes then decompose the OM, lowering DO and raising H2S [1]. These increasingly lethal conditions push out sensitive organisms, altering the community composition and curtailing sediment bioturbation—a mechanism of sediment oxygenation, nutrient cycling, and remineralization [14,33,34]. As this cycle escalates stressful conditions, macroinfaunal life can be driven out altogether [35]. Sediments with the highest silt–clay and organic matter contents and the lowest dissolved oxygen accumulate in the deeper pockets or channels, and it is in those locations where conditions for life become most stressful. The four deepest stations, with the highest FGORS scores, are part of channels that have been dredged for navigational purposes. It has been observed by others that deep channels act as sediment traps for accumulating silts, clays, and organic particles [36]. These “traps” hinder hydrodynamic movements needed for continual water renewal and dissolved oxygen penetration. Reduced water movement and low oxygen penetration can further compound the effect of sedimentation and decreasing DO. Low DO, coupled with high amounts of silt–clay and OM, increases the production of toxic hydrogen sulfides, particularly in static water. In high concentrations, hydrogen sulfide not only permeates fine bottom sediments but can diffuse into the overlying water column [37], likely influencing the occurrence of epibenthic and infaunal animals. The sandier stations (>85% sand) were located at shallower locations in the IRL proper, away from the dredged channels. The inverse logarithmic relationships of biological data with adverse sediment conditions are consistent with the common-sense understanding that diverse and healthy ecosystems usually thrive with abundant oxygen and low toxicity.
The abundances and diversity indicators all dropped rapidly in the same region of increasing organic matter content. The lower transition point, or impairment threshold, of OM sensitivity is close to 2% OM (Figure 8). At 2% OM and below, species richness stays above 4, with a maximum high of 19 (Figure 8a). Certain species in the IRL thrive in those conditions and reach numbers exceeding 65,000 organisms m2 (Figure 8c). Above 2% OM, richness drops rapidly, and abundances never exceed 1300 individuals m2 (a 5-fold decrease). An upper or critical threshold occurs around 10% OM (Figure 8), above which very few or no organisms live. We thus propose two thresholds: the impairment threshold at 2% OM, where organisms cease to thrive, and a critical threshold at 10% OM, where benthic populations are absent or nearly so. These thresholds are also supported by ANOVA. Binned data of 0–2%, >2% to 10%, and >10% show significant results with richness, abundance, and diversity (Figure 8d–f).
Other benthic infaunal studies show analogous thresholds, sometimes quantifying organic content as Total Organic Carbon (TOC). For comparison purposes, the calculation outlined by Leong and Tanner [38] was used by dividing the TOC from other studies by 0.33 to determine OM. The upper threshold of 10% OM is similar to patterns found by Hyland et al. [9] and Magni et al. [19], who proposed thresholds of 10.5% and 8.4% OM, respectively. Kodama et al. [39] noted in Tokyo Bay that diversity and species density were lowest in their 11.3% OM treatment—the highest OM levels in the bay. It may be no coincidence that 10% OM was the threshold used by Trefry et al. [5] to define “muck” in the Indian River Lagoon. As so defined, where there is muck present in the Indian River Lagoon, benthic communities are, for all practical purposes, absent, likely due to the low oxygen levels and high hydrogen sulfide concentration. Hyland et al. [9] and Magni et al. [19] both found 3% OM to be the threshold where organic matter starts to impair benthic populations. These thresholds appear important for most standard community measurements, including diversity [19], species richness [9], and abundances (Figure 8). Our impairment threshold of 2% is on the lower side of the thresholds suggested in the literature, but a decline in the biological community is evident in this ecosystem, particularly in richness and densities. The critical threshold of 10% is consistent with other research and represents a point of serious pollution and highly degraded infaunal community health. With regard to mitigation efforts to restore natural benthic sediments, or at least to reduce organic pollution, significant decreases in sediment organic matter will foster improved community richness.
The relationship of abundance and diversity with organic content has been observed and modeled [8,10,40]. A frequently referenced model is the Pearson–Rosenberg (P-R) model [10], which shows a pattern of early increasing richness and abundance before decreasing in response to polluted sediments. Corroborating studies show species richness and diversity increasing with OM in the range of 0.5% to 1.5% [9,19], up to 3% in the case of Kodoma et al. [39], before decreasing. These studies show a pattern very similar to a log-normal distribution [35,41]. The P-R model, however, does not state the quantitative increase in OM and is not universally applicable in all marine systems [42,43]. Puente and Diaz [36] suggested that the P-R model needs to be revised for coastal systems because the energy of the system needs to be considered, explaining that systems with less energy entail more sedimentation and less dissolved oxygen.
Hypoxia, or low dissolved oxygen, may have contributed to the patterns in this study. Because organic decay can decrease dissolved oxygen in the bottom waters, it can be difficult to determine whether OM or DO is the primary direct influence. When oxygen is not limiting, infaunal species adapted for existence in organic-rich sediments will gain an advantage over more environmentally sensitive competitors [10,41]. For example, the cosmopolitan species Capitella sp. and Polydora sp. seem to thrive in polluted sediments [10,41,44] and can occur in high numbers [45]. However, species that are tolerant to organic sediment conditions, including bio-indicator species, rapidly decline with low oxygen. In our study, Polydora sp. was altogether absent, and Capitella sp. occurred in low numbers, even though they are both endemic to this region of the Indian River Lagoon [46]. Low-oxygen conditions associated with muck sediments may explain the absence of these important species from our organic-rich stations [44]. Grizzle [46] concluded that pollution indicator species (Capitella capitata being one of them in the IRL) are as intolerant of oxygen extremes as non-indicator species. This supports conclusions [12,39,44] that low dissolved oxygen could be the main limiting factor inhibiting infaunal communities. This study found critically low DO concentrations close to the benthos. Comparing this study to published studies, OM of 9.2% [39] and exceeding 10.5% [9] could coincide with DO of 2.1 mg L1 or less. Dissolved oxygen in this study was even lower and more pervasive. While some studies have found episodic hypoxic conditions that can greatly stress organisms [39,47,48], the benthic infauna usually recovers. However, in this study, hypoxic conditions in muck-associated bottom water lasted almost year-round, leaving little or no window for recovery of the benthic community.
The Indian River Lagoon, being a microtidal, wind-driven system with little water renewal [49], might have different benthic responses to organic enrichment, especially in relatively deeper areas (3 to 5 m) with less mixing. Hyland’s [9] mean species richness shows a rise in species richness until around 1.5% OM before it drops, but the pattern used to represent the Southeastern United States, which includes the Indian River Lagoon system, appears different. There, richness starts highest at the lowest OM levels and declines from that point forward—a pattern consistent with the findings of the present study. Our research suggests that benthic infauna has the highest richness, abundance, and diversity in sediments where organic matter is low, even less than 1% OM (Figure 9). Species richness was also greater. Hyland et al. [9] reported mean global species richness of 5.3 in sediments with 3% OM or less, 4.2 with OM of 3–11.5%, and 2.4 with OM exceeding 11.5%. In contrast, this study found species richness of 9.1, 3.5, and 0.2 in those same OM ranges, respectively. The greater species richness found within the sediments with 3% OM or less in the Indian River Lagoon, compared with the estuaries measured in the Hyland study, could be a result of the high biodiversity of the IRL itself. The estuaries measured by Hyland et al. represented a temperate location (Cape Henry, VA) and a more tropical region (St. Lucie Inlet, FL). The transitional nature of the IRL results in both temperate and tropical species inhabiting the study area. The lower species richness found in the sediments with a higher OM percentage in the IRL, compared with the locations of the Hyland study, was likely due to the lower DO concentration of the water as a result of less mixing. Both the Cape Henry Estuary and the St. Lucie Inlet exhibit regular flushing from the ocean. All of the sites in this study were within the estuary, far from inlets and tidal flushing.
The 156-mile-long Indian River Lagoon was a relatively pristine estuary until about 60–80 years ago [5], when coastal development rose significantly [50,51], changing the state of the lagoon from a relatively low-nutrient system to a highly eutrophic system. Similar anthropogenic impacts have been reported in the Eastern Mediterranean Sea. Since that region is naturally oligotrophic and diverse [52,53], benthic species there might also be hypersensitive to organic enrichment [9]. While it is usually uncertain whether ecosystems have adapted to pollution or anthropogenic stressors, if one assumes that systems can respond to pollution as they would a disturbance [8,54], then productivity needs to be factored in according to Kondoh’s model [55]. High productivity yields higher richness in intermediate disturbed systems represented by a log-normal distribution, while in low-productivity systems, richness decreases as disturbance increases, creating a pattern similar to that found in the present study. According to Kondoh’s model [55], the decrease in infaunal richness in the IRL could be a result of low productivity, but that was not addressed by our data.
Sandy, oxygenated stations hosted diverse communities, while muck had little or no life. While the environmental parameters discussed above are the ultimate drivers of distributions patterns, what are the biological response mechanisms underlying these patterns? The two most likely hypotheses for the absence of macrofauna in muck go back to the inception of supply-side ecology and the debate over planktonic supply vs. post-settlement processes as the underlying mechanism of patchy distributions [56]. One possibility is that settling infauna sense hostile conditions, either in the demersal water column (low DO or H2S) or upon contact with sediment (particle sizes or organic content), and postpone settlement while awaiting friendlier benthic conditions. An alternative possibility is that infauna settles on muck and then shortly crawls away or dies. The combination of the geography of the Indian River Lagoon and the pattern of winds and currents determining the direction of the water flow could also impact settlement or recruitment [57]. Turkey Creek and Crane Creek, where the muck stations in this study are located, have narrow openings to the IRL proper, and this could limit recruitment into the creeks [58]. Also, if species are sensitive to freshwater inflow, they might have to navigate through a salt wedge to settle in the creeks.
On occasion, a few individuals were found in muck. This tended to occur when that species’ abundance in neighboring sandy habitats was unusually high. For example, at TCM 2 in July, the crustacean Leptochelia dubia was extraordinarily abundant, in fact representing the highest density of any one species throughout this study, with a density of 53,452 m2 ± 14,044 (density ± SE, July, TCL4). It was under these circumstances that 25 L. dubia were found in a single muck grab. On another occasion, the gastropod mollusk Japonactaeon punctostriatus was found in January at TCM 1 in two out of the three grabs (three individuals each). That same month, J. punctostriatus populations were peaking nearby at 466 (± 207) individuals m2 (TC stations 1–4 collectively). The organisms found in the muck could have come from planktonic settlement or benthic overspill from neighboring populations, especially if the currents and winds delivered them there with favorable dissolved oxygen. Generally, however, organisms were not found at the muck stations.
Crustaceans were the most abundant group in the sediment containing less organic matter (<2% OM), followed by mollusks, and then annelids. As organic matter increased, all taxa decreased in abundance, but the annelid decline was less rapid (Figure 7), suggesting that annelids may be slightly less sensitive to organic matter and the co-occurring stressors than either crustaceans or mollusks. Annelids are known to be opportunistic feeders, and a large number of species are deposit feeders [10,35,45]. Dauer [59] suggested that trophic and life-history strategies shift with sediment composition. An increase in sediment organic content would stress species that are better adapted for healthy, oxygenated sediments [60,61]. OM and DO (Figure 3b) could also have a profound effect on the community shift. Crustaceans, especially juveniles, are sensitive to low oxygen [62], and their growth can be stunted with DO levels under 2 to 3.5 mg L1 [44]. The highest abundances of the crustaceans Leptochelia dubia and Peratocytheridea setipunctata (Table 1) were found in sandy sediments with moderate-to-high DO throughout the year. Crustaceans as a phylum exceeded 20,000 organisms m2, much higher densities than the collective numbers of mollusks or annelids. Mollusks in general can be resilient to lower dissolved oxygen levels [44]. Gray et al. [44], in reviewing hypoxia, concluded that crustaceans were the most sensitive, followed by annelids, and finally mollusks. This is likely due to the respective metabolic adaptations of the three phyla [63,64]. Conditions correlating with OM content (small particles, H2S, porosity) may have a larger impact on mollusks than low oxygen levels alone. Very fine organic sediments can negatively impact filter-feeding organisms [44,65] and, more specifically, may clog mollusks’ feeding mechanisms [66]. While mollusks may resist physiological stress related to hypoxia, fine-grained organic sediments present additional stressful conditions that contribute to their decline and ultimate failure.

5. Conclusions

Infaunal community characteristics, including richness, density, and diversity, showed inverse logarithmic relationships with FGORS parameters. This pattern, not a traditional log-normal distribution, could result from hypoxia in boundary bottom water. We identified an impairment threshold at 2% OM, where infauna began a precipitous decline in all major community characteristics. At the higher end of the spectrum, 10% OM marked a critical threshold where infauna was generally absent. Using organic matter as a tool to assess benthic health can help environmental strategists and managers to restore ecosystems. For the Indian River Lagoon, reducing bottom sediments to <2% organic content will enhance richness, abundance, and diversity.

Author Contributions

Conceptualization, D.H., A.C., A.Z.-D. and K.B.J.; Methodology, D.H., A.C., A.Z.-D. and K.B.J.; Software, D.H.; Validation, K.B.J.; Resources, A.C. and A.Z.-D.; Data curation, A.C. and A.Z.-D.; Writing—original draft, D.H.; Writing—review & editing, D.H. and K.B.J.; Supervision, K.B.J.; Project administration, K.B.J.; Funding acquisition, K.B.J. All authors have read and agreed to the published version of the manuscript.

Funding

This research was funded by the Brevard County Natural Resources Management Department (Melbourne, FL, USA), contract number 260070-14-009 and The APC was funded by Tarleton State University (Stephenville, TX, USA).

Institutional Review Board Statement

Not applicable.

Informed Consent Statement

Not applicable.

Data Availability Statement

The original contributions presented in the study are included in the article, further inquiries can be directed to the corresponding author.

Conflicts of Interest

The authors declare no conflict of interest.

References

  1. Chapman, P.M.; Wang, F. Assessing sediment contamination in estuaries. Environ. Toxicol. Chem. Int. J. 2001, 20, 3–22. [Google Scholar] [CrossRef]
  2. Harley, C.D.; Randall Hughes, A.; Hultgren, K.M.; Miner, B.G.; Sorte, C.J.; Thornber, C.S.; Rodriguez, L.F.; Tomanek, L.; Williams, S.L. The impacts of climate change in coastal marine systems. Ecol. Lett. 2006, 9, 228–241. [Google Scholar] [CrossRef] [PubMed]
  3. Sweat, L.H.; Alexander, H.; Phlips, E.J.; Johnson, K.B. Mesozooplankton community dynamics and grazing potential across algal bloom cycles in a subtropical estuary. Front. Mar. Sci. 2021, 8, 734270. [Google Scholar] [CrossRef]
  4. Ma, X.; Jacoby, C.A.; Johnson, K.B. Grazing by the copepod Parvocalanus crassirostris on Picochlorum sp. at harmful bloom densities and the role of particle size. Front. Mar. Sci. 2021, 8, 664154. [Google Scholar] [CrossRef]
  5. Trefry, J.H.; Metz, S.; Trocine, R.P.; Iricanin, N.; Burnside, D.; Chen, N.; Webb, B. Design and Operation of a Muck Sediment Survey; Special Report SJ90-SP3; Saint Johns River Water Management District: Palatka, FL, USA, 1990. [Google Scholar]
  6. Hedges, J.I.; Keil, R.G.; Benner, R. What happens to terrestrial organic matter in the ocean? Org. Geochem. 1997, 27, 195–212. [Google Scholar] [CrossRef]
  7. Trefry, J.H.; Trocine, R.P.; Woodall, D.W. Composition and sources of suspended matter in the Indian River Lagoon, Florida. Fla. Sci. 2007, 70, 363–382. [Google Scholar]
  8. Gray, J.S.; Waldichuk, M.; Newton, A.J.; Berry, R.J.; Holden, A.V.; Pearson, T.H. Pollution-induced changes in populations [and discussion]. Philos. Trans. R. Soc. B Biol. Sci. 1979, 286, 545–561. [Google Scholar]
  9. Hyland, J.; Balthis, L.; Karakassis, I.; Magni, P.; Petrov, A.; Shine, J.; Warwick, R. Organic carbon content of sediments as an indicator of stress in the marine benthos. Mar. Ecol. Prog. Ser. 2005, 295, 91–103. [Google Scholar] [CrossRef]
  10. Pearson, T.H.; Rosenberg, R. Macrobenthic succession in relation to organic enrichment and pollution of the marine environment. Oceanogr. Mar. Biol. Ann. Rev. 1978, 16, 229–311. [Google Scholar]
  11. Viaroli, P.; Bartoli, M.; Giordani, G.; Naldi, M.; Orfanidis, S.; Zaldivar, J.M. Community shifts, alternative stable states, biogeochemical controls and feedbacks in eutrophic coastal lagoons: A brief overview. Aquat. Conserv. Mar. Freshw. Ecosyst. 2008, 18, S105–S117. [Google Scholar] [CrossRef]
  12. Diaz, R.J.; Rosenberg, R. Marine benthic hypoxia: A review of its ecological effects and the behavioural responses of benthic macrofauna. Oceanogr. Mar. Biol. Annu. Rev. 1995, 33, 3. [Google Scholar]
  13. Gibson, R.N.; Barnes, M.; Atkison, R.J.A. Functional group ecology in softsediment marine benthos: The role of bioturbation. Oceanogr. Mar. Biol. Annu. Rev. 2001, 39, 233–267. [Google Scholar]
  14. Aller, R.C. Bioturbation and remineralization of sedimentary organic matter: Effects of redox oscillation. Chem. Geol. 1994, 114, 331–345. [Google Scholar] [CrossRef]
  15. Rhoads, D.C. Organism-sediment relations on the muddy sea floor. Oceanogr. Mar. Biol. Ann. Rev. 1974, 12, 263–300. [Google Scholar]
  16. Cox, A.; Hope, D.; Angelica Zamora-Duran, M.; Johnson, K.B. Environmental factors influencing benthic polychaete distributions in a subtropical lagoon. Mar. Technol. Soc. J. 2018, 52, 58–74. [Google Scholar] [CrossRef]
  17. Mallick, N.; Johnson, K.B.; Jacoby, C.A. The effect of environmental dredging of muck on an assemblage of benthic amphipods. J. Mar. Sci. Eng. 2023, 11, 444. [Google Scholar] [CrossRef]
  18. Magni, P.; De Falco, G.; Como, S.; Casu, D.; Floris, A.; Petrov, A.N.; Perilli, A. Distribution and ecological relevance of fine sediments in organic-enriched lagoons: The case study of the Cabras lagoon (Sardinia, Italy). Mar. Pollut. Bull. 2008, 56, 549–564. [Google Scholar] [CrossRef]
  19. Gray, J.S. The Ecology of Marine Sediments; Cambridge University Press: Cambridge, UK, 1981; Volume 2. [Google Scholar]
  20. Dybas, C.L. Florida’s Indian River Lagoon: An estuary in transition. BioScience 2002, 52, 554–559. [Google Scholar] [CrossRef]
  21. Rhoads, D.C.; Germano, J.D. Interpreting long-term changes in benthic community structure: A new protocol. Hydrobiologia 1986, 142, 291–308. [Google Scholar] [CrossRef]
  22. Burd, B.; Macdonald, R.; Boyd, J. Punctuated recovery of sediments and benthic infauna: A 19-year study of tailings deposition in a British Columbia fjord. Mar. Environ. Res. 2000, 49, 145–175. [Google Scholar] [CrossRef] [PubMed]
  23. Eleftheriou, A.; Holme, N.A. Macrofauna techniques. In Methods for the Study of Marine Benthos; Wiley: Hoboken, NJ, USA, 1984; pp. 140–216. [Google Scholar]
  24. Ruso, Y.D.P.; De la Ossa Carretero, J.A.; Casalduero, F.G.; Lizaso, J.S. Spatial and temporal changes in infaunal communities inhabiting soft-bottoms affected by brine discharge. Mar. Environ. Res. 2007, 64, 492–503. [Google Scholar] [CrossRef] [PubMed]
  25. WoRMS Editorial Board. World Register of Marine Species. Available online: http://www.marinespecies.org (accessed on 30 March 2016).
  26. Heiri, O.; Lotter, A.F.; Lemcke, G. Loss on ignition as a method for estimating organic and carbonate content in sediments: Reproducibility and comparability of results. J. Paleolimnol. 2001, 25, 101–110. [Google Scholar] [CrossRef]
  27. Dean Jr, W.E. Determination of carbonate and organic matter in calcareous sediments and sedimentary rocks by loss on ignition: Comparison with other methods. J. Sediment. Res. 1974, 44, 242–248. [Google Scholar]
  28. Birchenough, S.N.; Frid, C.L. Macrobenthic succession following the cessation of sewage sludge disposal. J. Sea Res. 2009, 62, 258–267. [Google Scholar] [CrossRef]
  29. Lawless, A.S.; Seitz, R.D. Effects of shoreline stabilization and environmental variables on benthic infaunal communities in the Lynnhaven River System of Chesapeake Bay. J. Exp. Mar. Biol. Ecol. 2014, 457, 41–50. [Google Scholar] [CrossRef]
  30. Robertson, B.P.; Gardner, J.P.; Savage, C. Macrobenthic–mud relations strengthen the foundation for benthic index development: A case study from shallow, temperate New Zealand estuaries. Ecol. Indic. 2015, 58, 161–174. [Google Scholar]
  31. Milliman, J.D. Organic matter content in US Atlantic continental slope sediments: Decoupling the grain-size factor. Deep Sea Res. Part II Top. Stud. Oceanogr. 1994, 41, 797–808. [Google Scholar]
  32. Hedges, J.I.; Keil, R.G. Sedimentary organic matter preservation: An assessment and speculative synthesis. Mar. Chem. 1995, 49, 81–115. [Google Scholar] [CrossRef]
  33. Mermillod-Blondin, F.; Rosenberg, R.; François-Carcaillet, F.; Norling, K.; Mauclaire, L. Influence of bioturbation by three benthic infaunal species on microbial communities and biogeochemical processes in marine sediment. Aquat. Microb. Ecol. 2004, 36, 271–284. [Google Scholar] [CrossRef]
  34. Giblin, A.E.; Hopkinson, C.S.; Tucker, J. Benthic metabolism and nutrient cycling in Boston Harbor, Massachusetts. Estuaries 1997, 20, 346–364. [Google Scholar] [CrossRef]
  35. Gray, J.S.; Mirza, F.B. A possible method for the detection of pollution-induced disturbance on marine benthic communities. Mar. Pollut. Bull. 1979, 10, 142–146. [Google Scholar] [CrossRef]
  36. Puente, A.; Diaz, R.J. Response of benthos to ocean outfall discharges: Does a general pattern exist? Mar. Pollut. Bull. 2015, 101, 174–181. [Google Scholar] [CrossRef]
  37. Luther, G.W.; Church, T.M.; Powell, D. Sulfur speciation and sulfide oxidation in the water column of the Black Sea. Deep Sea Research Part A. Oceanogr. Res. Pap. 1991, 38, S1121–S1137. [Google Scholar]
  38. Leong, L.S.; Tanner, P.A. Comparison of methods for determination of organic carbon in marine sediment. Mar. Pollut. Bull. 1999, 38, 875–879. [Google Scholar] [CrossRef]
  39. Kodama, K.; Lee, J.H.; Oyama, M.; Shiraishi, H.; Horiguchi, T. Disturbance of benthic macrofauna in relation to hypoxia and organic enrichment in a eutrophic coastal bay. Mar. Environ. Res. 2012, 76, 80–89. [Google Scholar] [CrossRef]
  40. Warwick, R. A new method for detecting pollution effects on marine macrobenthic communities. Mar. Biol. 1986, 92, 557–562. [Google Scholar] [CrossRef]
  41. Gray, J.S.; Pearson, T.H. Objective Selection of Sensitive Species Indicative of Pollution-Induced Change in Benthic Communities. I. Comparative Methodology. Mar. Ecol. Prog. Ser. 1982, 9, 111–119. [Google Scholar] [CrossRef]
  42. Maurer, D.; Robertson, G.; Gerlinger, T. San Pedro Shelf California: Testing the Pearson-Rosenberg Model (PRM). Mar. Environ. Res. 1993, 35, 303–321. [Google Scholar] [CrossRef]
  43. Heip, C. Eutrophication and zoobenthos dynamics. Ophelia 1995, 41, 113–136. [Google Scholar] [CrossRef]
  44. Gray, J.S.; Wu, R.S.S.; Or, Y.Y. Effects of hypoxia and organic enrichment on the coastal marine environment. Mar. Ecol. Prog. Ser. 2002, 238, 249–279. [Google Scholar] [CrossRef]
  45. Tsutsumi, H. Population dynamics of Capitella capitata (Polychaeta; Capitellidae) in an organically polluted cove. Mar. Ecol. Prog. Ser. 1987, 36, 139–149. [Google Scholar] [CrossRef]
  46. Grizzle, R.E. Pollution indicator species of macrobenthos in a coastal lagoon. Mar. Ecol. Prog. Ser. 1984, 18, 191–200. [Google Scholar] [CrossRef]
  47. Lim, H.S.; Diaz, R.J.; Hong, J.S.; Schaffner, L.C. Hypoxia and benthic community recovery in Korean coastal waters. Mar. Pollut. Bull. 2006, 52, 1517–1526. [Google Scholar] [CrossRef] [PubMed]
  48. Baustian, M.M.; Rabalais, N.N. Seasonal composition of benthic macroinfauna exposed to hypoxia in the northern Gulf of Mexico. Estuaries Coasts 2009, 32, 975–983. [Google Scholar] [CrossRef]
  49. Smith, N.P. Tidal and nontidal flushing of Florida’s Indian River Lagoon. Estuaries 1993, 16, 739–746. [Google Scholar] [CrossRef]
  50. Clark, K.B. Rheophilic/oligotrophic lagoonal communities: Through the eyes of slugs (Mollusca: Opisthobranchia). Bull. Mar. Sci. 1995, 57, 242–251. [Google Scholar]
  51. De Freese, D.E. Threats to biological diversity in marine and estuarine ecosystems of Florida. Coast. Manag. 1991, 19, 73–101. [Google Scholar] [CrossRef]
  52. Tortonese, E. Distribution and ecology of endemic elements in the Mediterranean fauna (fishes and echinoderms). In Mediterranean Marine Ecosystems; Springer: New York, NY, USA, 1985; pp. 57–83. [Google Scholar]
  53. Danovaro, R.; Della Croce, N.; Eleftheriou, A.; Fabiano, M.; Papadopoulou, N.; Smith, C.; Tselepides, A. Meiofauna of the deep Eastern Mediterranean Sea: Distribution and abundance in relation to bacterial biomass, organic matter composition and other environmental factors. Prog. Oceanogr. 1995, 36, 329–341. [Google Scholar] [CrossRef]
  54. Whomersley, P.; Huxham, M.; Bolam, S.; Schratzberger, M.; Augley, J.; Ridland, D. Response of intertidal macrofauna to multiple disturbance types and intensities–an experimental approach. Mar. Environ. Res. 2010, 69, 297–308. [Google Scholar] [CrossRef]
  55. Kondoh, M. Unifying the relationships of species richness to productivity and disturbance. Proc. R. Soc. Lond. B Biol. Sci. 2001, 268, 269–271. [Google Scholar] [CrossRef]
  56. Connell, J.H. The consequences of variation in initial settlement vs. post-settlement mortality in rocky intertidal communities. J. Exp. Mar. Biol. Ecol. 1985, 93, 11–45. [Google Scholar] [CrossRef]
  57. Arnold, W.S.; Hitchcock, G.L.; Frischer, M.E.; Wanninkhof, R.; Sheng, Y.P. Dispersal of an introduced larval cohort in a coastal lagoon. Limnol. Oceanogr. 2005, 50, 587–597. [Google Scholar] [CrossRef]
  58. Johnson, D.R. Wind forced surface currents at the entrance to Chesapeake Bay: Their effect on blue crab larval dispersion and post-larval recruitment. Bull. Mar. Sci. 1995, 57, 726–738. [Google Scholar]
  59. Dauer, D.M. Biological criteria, environmental health and estuarine macrobenthic community structure. Mar. Pollut. Bull. 1993, 26, 249–257. [Google Scholar] [CrossRef]
  60. Levinton, J. Stability and trophic structure in deposit-feeding and suspension-feeding communities. Am. Nat. 1972, 106, 472–486. [Google Scholar] [CrossRef]
  61. Bayne, B.L. Phenotypic flexibility and physiological tradeoffs in the feeding and growth of marine bivalve molluscs. Integr. Comp. Biol. 2004, 44, 425–432. [Google Scholar] [CrossRef]
  62. Miller, D.C.; Poucher, S.L.; Coiro, L.; Rego, S.; Munns, W. Effects of Hypoxia on Growth and Survival of Crustaceans and Fishes of Long Island Sound; New York Sea Grant Inst.: Stony Brook, NY, USA, 1995; Volume 92. [Google Scholar]
  63. Bayne, B.L. (Ed.) Marine Mussels: Their Ecology and Physiology; Cambridge University Press: Cambridge, UK, 1976; Volume 10. [Google Scholar]
  64. Gäde, G.; Ellington, W.R. The anaerobic molluscan heart: Adaptation to environmental anoxia. Comparison with energy metabolism in vertebrate hearts. Comp. Biochem. Physiol. Part A Physiol. 1983, 76, 615–620. [Google Scholar] [CrossRef]
  65. Nepote, E.; Bianchi, C.N.; Morri, C.; Ferrari, M.; Montefalcone, M. Impact of a harbour construction on the benthic community of two shallow marine caves. Mar. Pollut. Bull. 2017, 114, 35–45. [Google Scholar] [CrossRef]
  66. Pearson, T.H. Marine pollution effects of pulp and paper industry wastes. Helgoländer Meeresunters. 1980, 33, 340–365. [Google Scholar] [CrossRef]
Figure 1. (a) Turkey Creek and adjacent sampling stations: Red = Turkey Creek Muck (TCM) stations. Yellow = Turkey Creek (TC) stations. Green = Turkey Creek Lagoon (TCL) stations. (b) Crane Creek and adjacent stations: Orange = Crane Creek Muck (CCM) sampling stations. Blue = Crane Creek Lagoon (CCL) sampling stations.
Jmse 12 02184 g001
Figure 2. (a) Crane Creek and (b) Turkey Creek sampling stations in the Indian River Lagoon, color-coded according to organic matter distribution. Green stations ranged between 0.3 and 2%, yellow stations between 1 and 10%, and red stations had organic matter > 10%.
Jmse 12 02184 g002
Figure 3. Regressions of basic FGORS indicator parameters against each other and dissolved oxygen (n = 175): (a) Silt–clay content (% dry weight), displaying a linear regression vs. organic matter (% dry weight). Organic matter increased as silt–clay increased. (b) Dissolved oxygen vs. organic matter presents an inverse logarithmic correlation. (c) Porosity vs. organic matter was best represented by a second-degree polynomial line, while (d) porosity vs. silt–clay was best represented by a quadratic-degree polynomial line.
Jmse 12 02184 g003
Figure 4. Regressions of species richness against each of the basic FGORS indicator parameters and dissolved oxygen (n = 175): (a) Species richness displaying an inverse logarithmic relationship with organic matter (% dry weight) and (b) silt–clay content. Richness was negatively correlated with (c) water % (by weight). (d) Species richness had a positive relationship with dissolved oxygen.
Jmse 12 02184 g004
Figure 5. Regressions of infaunal community density (average organisms m−2) against each of the basic FGORS indicator parameters and dissolved oxygen (n = 175): (a) Infaunal community density displaying an inverse logarithmic relationship with organic matter (% dry weight) and (b) silt–clay content. (c) Porosity yielded a negative linear relationship with density, and (d) DO had a positive linear relationship with density.
Jmse 12 02184 g005
Figure 6. Regressions of Shannon–Weiner diversity against each of the basic FGORS indicator parameters and dissolved oxygen (n = 175): (a) Species diversity displaying an inverse logarithmic relationship with organic matter % (dry weight). (b) Diversity has a negative logarithmic relationship with silt–clay and (c) a negative linear relationship with porosity, but (d) a positive linear relationship with DO.
Jmse 12 02184 g006
Figure 7. Log-transformed densities (average individuals m−2) of crustaceans, annelids, and mollusks vs. OM % (n = 175). The regression slope for annelids is significantly shallower than for both mollusks and crustaceans.
Jmse 12 02184 g007
Figure 8. Scatterplots of (a) richness, (b) density, and (c) diversity against organic matter %, with proposed visual thresholds (striped lines). The different letters (A, B, or C) on each of the bar graphs (df) suggest significant differences at the α = 0.05 level between the binned data using a one-way ANOVA.
Jmse 12 02184 g008
Figure 9. Plot of mean (a) species richness, (b) density, and (c) diversity versus increasing organic matter percentage in select groupings, showing a comparative view in contrast with the P-R model and other analogous studies. Error bars represent standard error (n = 175).
Jmse 12 02184 g009
Table 1. Dominant benthic infaunal species with total abundance greater than 10,000 individuals m−2 in the duration of the study. Patterns of absence and maximum occurrences (# m−2 ± SE) in non-muck locations (Turkey Creek—TC, Turkey Creek Lagoon—TCL, Crane Creek Lagoon—CCL). Months of absence are listed when the species was completely absent from all locations. For maximum occurrence, the location and sample month are given. With rare exceptions discussed in the text, all species were completely absent from muck locations (CCM, TCM), which are not listed or discussed here.
SpeciesComplete Absence WindowHigh Density
(# m−2 ± SE)
High DensityHigh-Density Sample Month
Leptochelia dubiaOct., Nov., Dec. (2015), and August (2016)53,000 ± 14,000TCLJune 2016
Peratocytheridea
Setipunctata
Almost always present in non-muck12,000 ± 3900TCLJuly 2016
Parastarte triquetraAlways present in non-muck3900 ± 860CCLJanuary 2016
Mulinia lateralisAlmost always present in non-muck7400 ± 1700CCLApril 2016
Ammonia parkinsonianaOctober (2015)10,000 ± 6400TCMay 2015
Nereis succineaAlways present in non-muck2500 ± 520CCLAugust 2016
Unidentified TanaidAlmost always present in non-muck1100 ± 650TCLJuly 2016
Oxyurostylis smithOctober (2015) and August (2016)2600 ± 710CCLJanuary 2016
Acteocina canaliculataAlmost always present in non-muck2000 ± 390TCLApril 2016
Unidentified Gammarid
Amphipod A
Nov. (2015), Feb., Mar., and April (2016)1600 ± 480CCLJuly 2016
Unidentified Polychaete AOct. (2015) and June (2016)1800 ± 810TCDecember 2015
Unidentified Gammarid
Amphipod B
Nov. (2015), Jan., Feb., Mar., and April (2016)1600 ± 480CCLJuly 2016
Unidentified Polychaete BAlmost always present in non-muck590 ± 270CCLMay 2015
Paradiopatra hispanicaAlmost always present in non-muck610 ± 220TCLApril 2016
Japonactaeon
Punctostriatus
May, June, July (2015)990 ± 270CCLJanuary 2016
Glycera AAlmost always present in non-muck500 ± 250CCLJanuary 2016
Pectinaria GouldiiAlmost always present in non-muck740 ± 380TCMay 2016
Diopatra cupreaAlmost always present in non-muck180 ± 80CCLMay 2016
Hemipholis elongateJuly (2016)330 ± 310CCLApril 2016
Eusirus cuspidatusJan., Feb., Jul., and August (2016)300 ± 150CCLMay 2016
Capitella capitataNov. (2015), Apr., and August (2016)410 ± 220TCLAugust 2015
Haminoaea succineaJuly (2016)190 ± 120TCLDecember 2015
Unidentified Polychaete CNov., Dec. (2015), Apr., and August (2016)400 ± 240CCLJune 2015
Hargeria rapaxNov., Dec. (2015), Mar., and August (2016)270 ± 270TCLJuly 2015
Amygdalum papyriumDec. (2015), Feb., Mar., Apr., and June (2016)150 ± 100TCJuly 2015
Disclaimer/Publisher’s Note: The statements, opinions and data contained in all publications are solely those of the individual author(s) and contributor(s) and not of MDPI and/or the editor(s). MDPI and/or the editor(s) disclaim responsibility for any injury to people or property resulting from any ideas, methods, instructions or products referred to in the content.

