Article

Numerical Study of the Hydrodynamic Performance of a Dual-Chamber Oscillating Water Column Wave Energy Converter Device

by
Peng Tang
1,
Qing Xu
2,
Shengchao Jiang
2,*,
Junlin Zhu
1,* and
Hongsheng Zhang
1
1
College of Ocean Science and Engineering, Shanghai Maritime University, Shanghai 201306, China
2
School of Naval Architecture, Dalian University of Technology, Dalian 116024, China
*
Authors to whom correspondence should be addressed.
J. Mar. Sci. Eng. 2024, 12(12), 2176; https://doi.org/10.3390/jmse12122176
Submission received: 29 October 2024 / Revised: 22 November 2024 / Accepted: 26 November 2024 / Published: 28 November 2024
(This article belongs to the Section Marine Energy)

Abstract

We investigated the hydrodynamic characteristics of a dual-chamber oscillating water column (OWC) wave energy converter (WEC) using the OpenFOAM-v1912 open-source platform and waves2Foam solver. The numerical simulations were conducted using incompressible viscous fluid theory, applying the two-dimensional Stokes equation to describe fluid motion. The displacement of the free surface was accurately captured using the volume of fluid (VOF) methodology, and the governing equations were solved using the finite volume method (FVM). The dependability of the computational method was shown by validating the numerical model, which was based on a 2D representation, against experimental data. Within the resonance zone, the energy conversion efficiency of a dual-chamber OWC was approximately 25% greater than that of a single-chamber OWC. Moreover, the dual-chamber design displayed a broader resonance bandwidth, owing to the presence of multiple resonant frequencies, which enhance the stability and energy conversion over a wider range of wave conditions. The dual-chamber OWC generated stronger internal wave dynamics and higher chamber pressures, enabling superior energy capture compared to the single-chamber variant. Additionally, the formation and persistence of vortices within the chamber are key in sustaining efficient energy conversion by promoting continuous airflow. These results offer valuable information for constructing and optimizing dual-chamber OWC systems for more efficient wave energy collecting.

1. Introduction

Ocean energy is rapidly becoming a major focus of international energy research due to its clean and renewable nature. Wave energy has the most potential as a theoretical resource among the several forms of ocean energy [1]. The OWC is one of the most used techniques for capturing wave energy. Its development potential is significant, owing to its relatively simple design, reliance on mechanical components, ease of installation and maintenance, and absence of requirements for deep water moorings or long-distance underwater cables. This study specifically focuses on fixed-structure OWC systems, which are characterized by their stationary design and strong potential for coastal applications.
Single-chamber OWC wave energy converters have been extensively researched [2,3,4,5,6]. Evans et al. [7,8] performed extensive theoretical and numerical analyses of the potential flow in both two-dimensional and three-dimensional frequency domains of OWC systems. Josset and Clément [9] employed the Constant Panel Method (CPM) to model the OWC plant located on Pico Island in the Azores in order to evaluate its hydrodynamic capture efficiency. Gomes et al. [10] simulated the hydrodynamic performance of an OWC system using a linear boundary element analysis. Zhou et al. [11] assessed a three-dimensional OWC’s hydrodynamic performance and energy conversion efficiency using a numerical approach. The energy conversion efficiency of a land-based OWC was examined by Ning et al. [12] using a time-domain higher-order boundary element method (HOBEM) with wave creation enabled by an inner-domain source. Their numerical analysis explored how factors such as immersion depth, front wall thickness, chamber width, and different wave conditions influenced the efficiency of energy conversion. Zhu et al. [13] constructed a three-dimensional numerical model using OpenFOAM to analyze the effects of wave-induced forces on the structural stability of a stationary circular OWC device. Their findings indicated that the horizontal forces exerted by waves on the OWC were roughly 6.6–7.9 times higher than the vertical forces, while the lateral forces remained comparatively minimal.
The introduction of dual-chamber OWC has enabled researchers to enhance energy conversion efficiency and expand the frequency range for wave energy capture. Hsieh et al. [14] explored the effectiveness of two adjacent chambers aligned parallel to the wave motion and confirmed that successive chambers offer a promising approach for improving performance. Rezanejad et al. [15] explored dual-chamber OWC hydrodynamic characteristics using step topography through numerical simulations and theoretical analysis. According to their research, the dual-chamber OWC design surpassed single-chamber designs with regard to efficiency throughout a wide frequency range. Ning et al. [16] and Elhanafi et al. [17] carried out additional studies on the dual-chamber offshore OWC hydrodynamic performance, revealing that these configurations widened the effective bandwidth and improved overall hydrodynamic efficiency compared to single-chamber systems. He [18] investigated the power extraction efficiency of a floating breakwater equipped with dual-chamber OWC and discovered that incorporating dual-chambers notably broadened the energy extraction bandwidth. Ning et al. [19] examined an innovative cylindrical OWC device featuring two cavities and identified three unique oscillation modes of the chamber free surface. Ning et al. [20] conducted experiments on an OWC device and observed the inner and outer cavities correlate to two different resonance frequencies, which resulted in a broader operational frequency range. Haghighi et al. [21] employed ANSYS Fluent to assess a dual-chamber OWC’s hydrodynamic performance, showing improved wave power extraction efficiency over the entire range of wavelengths studied, with the greatest impact observed at shorter wavelengths. Additionally, several studies have explored floating dual-chamber OWC concepts [18,22,23,24,25], highlighting their potential for further enhancing wave energy harvesting efficiency.
Although most current research in this field focuses on offshore dual-chamber OWC wave energy devices, comparatively few studies have explored the performance and challenges of shore- or land-based stationary OWC systems. Specifically, the hydrodynamic forces generated by wave motion create a significant pressure differential between the interior and exterior of the chambers, subjecting the walls of the dual-chamber devices to considerable dynamic water pressures. This phenomenon raises concerns regarding the structural integrity and safe operation of stationary OWC devices, especially for long-term energy harvesting applications. Falcão [26] provides a comprehensive review of wave energy technologies, detailing various types of oscillating water column (OWC) systems, including fixed-structure and breakwater-integrated OWCs. The study highlights the potential of fixed-structure OWCs for simplified designs suitable for coastal applications, while breakwater-integrated OWCs offer a multifunctional solution by combining wave energy harvesting with coastal protection. These insights provide critical theoretical support for the study of fixed-structure OWCs, emphasizing their importance in optimizing designs and enhancing performance.
By investigating a stationary, shore-based dual-chamber OWC’s hydrodynamic performance, this study seeks to address the previously described information gap. The research specifically investigates the impact of wave action on energy conversion efficiency, pressure distribution, and the overall structural integrity of the device. By examining the unique conditions encountered by stationary OWCs, such as their fixed positioning and exposure to dynamic coastal wave patterns, the present study offers new insights into the design challenges and operational safety of dual-chamber OWCs in land-based environments. The findings of this study not only extend the current understanding of OWC hydrodynamics but also offer practical recommendations for optimizing the energy capture and structural resilience of stationary WECs, making this work an innovative contribution to the broader field of wave energy research.

2. Materials and Methods

2.1. Viscous Flow Model

The viscous flow model, constructed using the open-source OpenFOAM® v12 software, employs the re-normalized group (RNG) turbulence model. It was developed within an arbitrary Lagrangian–Eulerian (ALE) reference framework. The governing equations of incompressible turbulent viscous flow can be expressed as follows:
ρ t + ρ u i x i = 0 ρ u i t + ρ ( u j u j m ) x j = ρ f i p x i + μ e x j ( u i x j + u j x i ) ,
Here, ui represents the velocity component in the ith direction, while p and fi refer to the pressure, fluid density, and external body force due to gravitational acceleration, respectively. The effective dynamic viscosity, denoted as μe, consists of two components: μm representing the molecular viscosity of the fluid, and μt signifying the turbulent viscosity. The RNG k-ε two-equation model is used to close the governing equations.
μ t = C μ k 2 ε ,
Here, Cμ represents a theoretical model constant, set to 0.0845. The following are the governing equations for the time-dependent advection-diffusion process of turbulent kinetic energy (k) and dissipation rate (ε):
ρ k t + ρ ( u j u j m ) x j = x j u t σ k k x j + μ t u i x j + u j x i u i x j ρ ε ρ ε t + ρ ( u j u j m ) ε x j = x j u t σ ε ε x j + C 1 ε u i x j + u j x i u i x j ρ C 2 ε ε 2 k ,
The constants C1ε, C2ε, σk, and σε are set to 1.42, 1.68, 0.71942, and 0.71942, respectively.
The volume of fluid (VOF) method was employed in this study to capture free surface motion [27]. Within each computational cell, the VOF fractional function, φ, was defined as follows:
φ = 0 , i n   a i r , 0 < φ < 1 , o n   f r e e   s u r f a c e , 1 , i n   w a t e r .
It also follows the advection equation shown below
φ t + ( μ i + u i m ) φ x i = 0 .
In this investigation, φ = 0.5 was used to identify the interface between the two phases. The calculations were based on an accessible friction function and averaged the fluid density and effective viscosity.
ρ = φ ρ W + 1 φ ρ A , μ = φ μ W + 1 φ μ A .
Here, the subscripts W and A denote the water and air phases, respectively.
The numerical wave flume’s relaxation zones are designed to produce incident waves and reduce reflections. Within these zones, an exponential relaxation function is employed and expressed as follows:
φ R x R = 1 exp x R 3.5 1 exp 1 1 ,   x R 0,1 ,
ϑ = φ R ϑ c + 1 φ R ϑ T ,
In this case, ϑ stands for either the water fraction indication α or the velocity u. The computed and target values are indicated by the subscripts C and T, respectively.
Hydrostatic pressure and zero velocity were the initial settings for the still-state conditions under which the simulations started. Wave velocity and a zero-pressure gradient were applied at the inlet boundary. Both the pressure and velocity gradients were set to zero for the outlet boundary. No-slip boundary conditions were applied to all solid walls, including the body surface and seabed. At the upper boundary of the numerical wave flume, a reference pressure of p = 0 is applied, and the velocity condition ∂u/∂n is imposed, where n is the outward normal unit vector. The time step for each simulation in this study is automatically modified according to the Courant–Friedrichs–Lewy (CFL) condition.
t = C r × M i n S e / u e ,
Here, Se and |ue| denote the area and absolute velocity of the computational cell, respectively. A Courant number of Cr = 0.25, which was widely adopted in previous studies and shown to be stable and accurate, was utilized in the simulations.
The OWC device hydrodynamic efficiency is determined as previously described [28].
ξ = P 0 P W ω ,
where Pw is the time-averaged energy flux of the incident waves, which, according to linear wave theory, is defined by the following:
P W = 1 2 ρ g A 2 V g ,
where A is the wave amplitude, ρ denotes the water density, g is the gravitational acceleration, and vg is the group velocity of the incident wave packet defined by vg = dw/dk. w is the width of the flume section, and P0 is the hydrodynamic energy absorbed from the waves by the OWC device during a single wave period. The time-average energy flux transferred across the interior free-surface of the chamber is given by the following:
P 0 = d E ¯ t S i P V n ¯ S ,
where Si is the cross-sectional area of the internal free-surface, while p and Vn denote the imposed hydrodynamic pressure and normal velocity of interior free-surface, respectively.
The energy conversion efficiency was calculated based on the time-averaged wave energy captured by the device. Therefore, the overall efficiency of the dual-chamber OWC was determined by combining the efficiencies of both the front and rear chambers.
ξ = ξ 1 + ξ 2 ,
Here, ξ 1 and ξ 2 represent the dual-chamber OWC’s front and rear chambers’ respective energy conversion efficiencies.

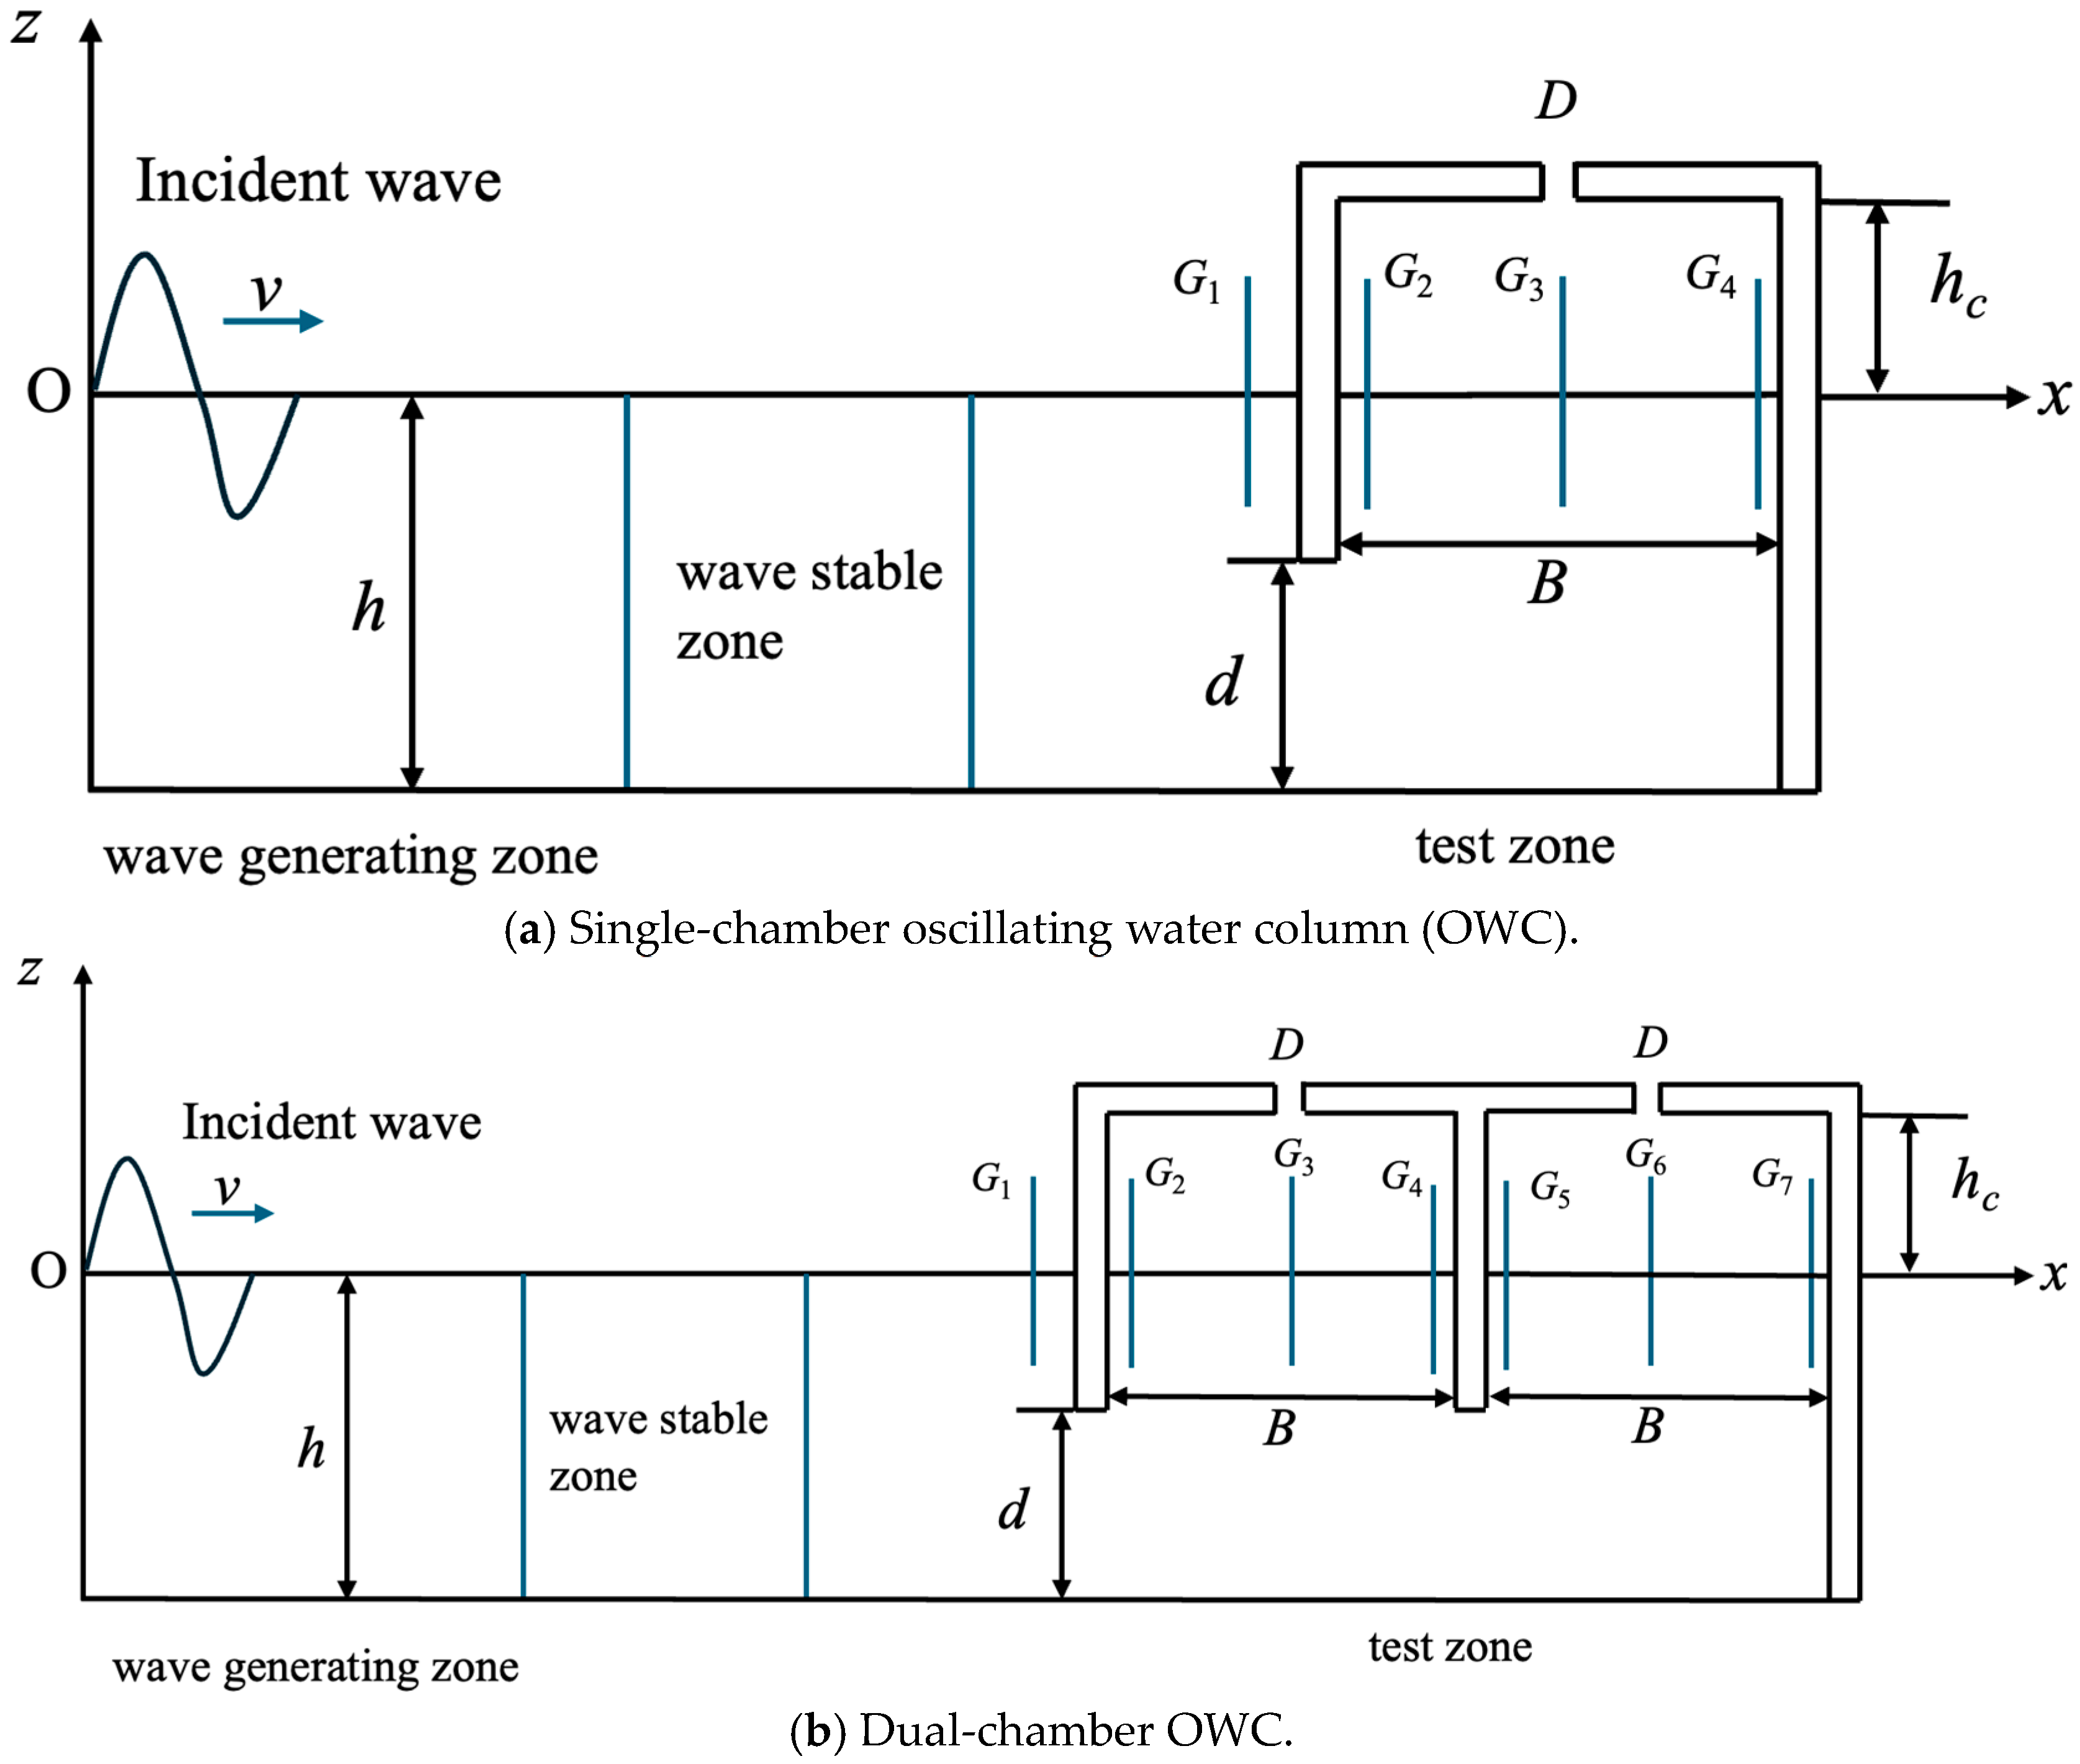
2.2. Numerical Model Setup

The numerical model setup was identical to the experimental arrangement used by Ning [4]. The 2D numerical wave tank (NWT) for single- and dual-chamber OWC is shown in Figure 1. The OWC wave energy converter was positioned at the far end of the NWT, where wave propagation was concluded. To facilitate a smooth transition of wave-structure interactions, the numerical wave flume length is configured to be 6λ (six times the incident wavelength). The wave generation zone spans 2λ, followed by a wave stabilization zone of 2λ, and a transition zone of λ to promote computational stability. OpenFOAM v12 offers built-in wave absorption conditions, eliminating the need for a wave damping zone and is allocated on the far-right side of the NWT. In the single-chamber OWC, G1–G4 wave gauges were installed. Gauges G1, G2, and G4 were placed 0.02 m from the chamber wall, whereas G3 was placed in the middle of the chamber. For the dual-chamber OWC device, seven wave gauges (G1–G7) were employed, with G1, G2, G4, G5, and G7 positioned 0.02 m from the chamber walls and G3 and G6 located at the centers of the respective chambers.
Here, B denotes the chamber width, D is the width of the air holes in the chamber, C represents the front wall thickness, and d represents the draught depth of the front wall. Moreover, hc denotes the height of the chamber. The used NWT’s length is equal to L = 24 m with a water depth of h = 0.8 m. The height inside the OWC air chamber is hc = 0.2 m, and the chamber wall thickness is C = 0.04 m. The wave parameters used in the numerical simulations and the corresponding operating conditions are presented in Table 1 and Table 2.

2.3. Numerical Results Validation

2.3.1. Convergence Test for Numerical Computational Grids
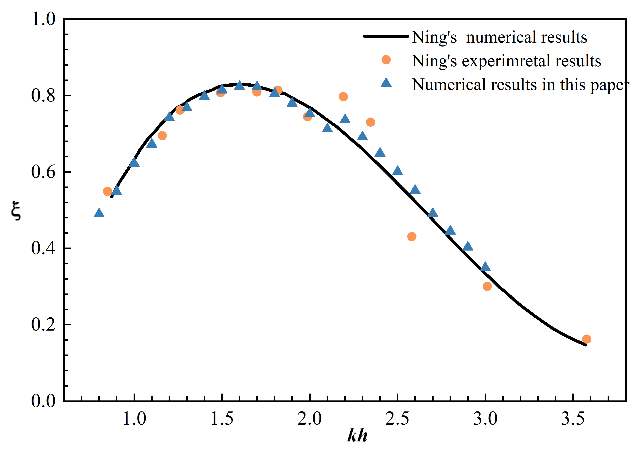
A grid independence analysis was conducted to guarantee the precision of the numerical results. Non-uniform grids were utilized in the computational domain, with the mesh 2 layout shown in Figure 2. To enhance computational efficiency, refined grids were concentrated in critical areas, such as close to the free surface along the direction of the wave height and around the chamber’s front and rear walls. This strategy reduces computational time and cost while maintaining precision. In the figures, red represents water, blue indicates air, and green denotes the interface between air and water.
The mesh configuration shown corresponds to the numerical model. A convergence test was conducted using three different grid resolutions, with incident wavelengths passing through 60, 80, and 120 grid points, as detailed in Table 3. Numerical simulations were performed using these three mesh sizes to verify grid independence and ensure the results were not affected by the mesh density.
Figure 3 illustrates the variation in the surface elevation at wave gauge G1 under the conditions of wave period T = 1.478 s, kh = 1.6, and wavelength L = 3.142 m for the three different grid subdivisions. The results indicate that all three grid configurations can accurately simulate wave dynamics with minimal errors. Considering both computational efficiency and accuracy, the simulations in this study were conducted using mesh 2.

2.3.2. Verification

Figure 4 presents the results of energy conversion efficiency ξ versus kh from the calculations for the single-chamber OWC in Case 1, compared with Ning’s experimental and numerical findings. As illustrated in Figure 4, the calculated numerical results of this paper aligned closely with Ning’s experimental and numerical findings [4]. Moreover, the numerical results demonstrate stability, suggesting that the numerical model developed in this study is precise. The single-chamber OWC device reaches a maximum value of 0.84 for energy conversion efficiency ξ at kh = 1.58.
A comparison of the experimental results [4] and the numerical calculation results for the time histories of the dimensionless wave height at the center of a single-chamber for four different wave periods (T = 1.366 s, 1.423 s, 1.610 s, and 1.735 s) is shown in Figure 5. Figure 5 shows a significant correlation between numerical results and experimental data. The phenomenon of gas–liquid coupling occurs within the gas chamber at the point of maximum energy conversion efficiency, which is observed at wave period T = 1.366 s. However, the impact on the wave surface is small; therefore, the effect on the energy conversion efficiency calculation can be neglected. Currently, the wave surface motion inside the chamber can be a first-order sloshing motion with no effect on the volume change inside the chamber. Consequently, this does not affect the calculation of the energy conversion efficiency. Therefore, the numerical model developed can predict changes in the wave surface within the chamber.
The numerical simulations given in this research show good agreement with the experimental and numerical results, indicating that the wave tank exhibits enhanced capabilities in both wave generation and dissipation. Additionally, the numerical model is capable of calculating the hydrodynamic characteristics of a dual-chamber OWC.

3. Results and Discussion

3.1. Dual-Chamber OWC Wave Surface and Pressure

To further understand the dual-chamber OWC’s hydrodynamic performance, a comparative analysis was conducted on the wave surface and pressure at the midpoint of the single-chamber and dual-chamber G3 wave gauges and the dual-chamber G3 and G6 wave gauges. The computational conditions for the numerical simulation are those specified in Cases 1 and 3 in Table 2, with an incident wave amplitude of Ai = 0.03 m and an incident wave frequency of kh = 1.5.
The wave surface and dimensionless pressure at the midpoints of the single- and dual-chambers are compared in Figure 6 for incident wave amplitudes of Ai = 0.03 m and frequency of kh = 1.5, respectively. The wave height and pressure at the single- and dual-chamber midpoints show periodic changes. Additionally, the wave surface and dimensionless pressure in the rear chamber of the dual-chamber OWC are greater than those in the front chamber. Additionally, the dual-chamber OWC’s front and rear chamber midpoints have higher wave surfaces and pressures than the single-chamber’s midpoint. The motion of the wave surface within the dual-chamber is more pronounced, the amplitude of the wave surface oscillation is greater, and the pressure within the chamber is higher; thus, a greater quantity of wave energy can be obtained from the dual-chamber OWC.
Figure 7 illustrates the variation in the relative wave height and dimensionless pressure versus kh at the midpoint of the front and rear chambers. As illustrated in Figure 7, the wave height and pressure at the midpoint of the rear chamber were larger than those at the midpoint of the front chamber within the range of kh < 2.8. This phenomenon can be attributed to the enhanced transmission capacity of the long wave at low frequencies, which enables it to traverse the front wall of the double-chambers and penetrate the front and rear sub-chambers with greater efficacy. Additionally, the reflection at the rear wall augmented the wave height and pressure within the rear chamber. As the frequency of the incident wave increases, the transmittance of the short wave deteriorates. Consequently, a part of the wave propagated to the front chamber and was reflected from the front wall of the front chamber. Following this reflection, the wave is reflected by the rear chamber’s front wall, resulting in only a small number of waves entering the interior of the rear chamber.
The propagation of an incident wave at kh = 0.8, 1.5, 2.0, and 3.0 is depicted by the wave surfaces shown in Figure 8a–d. As illustrated in Figure 8, the phase difference in the wave surface between the front and rear chambers was zero at kh = 0.8, indicating that the motion was almost synchronous. This phenomenon can be attributed to the high transmissivity of long waves, which permits relatively easy penetration into the interior of the chamber. The capacity of short waves to transmit reduced as the incident wave frequency increased. This resulted in the wave being reflected at the front wall of the front and rear chambers, with a concomitant increase in the phase difference in the wavefront motion between the front and rear chambers. At an incident wave frequency of kh = 3.0, the phase difference between the front and rear chambers reached T/2, which exerted a considerable influence on the force acting on the chamber’s front wall. As the phase difference increases, the force exerted on the front wall of the chamber also increases. Therefore, for higher incident wave frequencies, it is necessary to focus on the strength of the front wall of the chamber. In the figures, red represents water, blue indicates air.

3.2. Dual-Chamber OWC Energy Conversion Efficiency

Figure 9 shows the fluctuation of ξ, ξ1, and ξ2 with kh. ξ1 initially increases and subsequently declines with kh, whereas ξ2 initially declines and subsequently increases with kh. In the majority of instances, ξ2 is observed to exceed ξ1. At the resonance frequency, the total energy conversion efficiency ξ of the dual-chamber OWC is primarily attributable to the rear chamber.
When kh > 2.2, ξ2 steadily decreases and ξ1 gradually increases. When kh > 2.8, ξ1 is observed to exceed ξ2. The transmission capacity of the waves is responsible for this phenomenon. Specifically, long waves exhibit pronounced transmission capacity. This process involves the transfer of air from the front wall of the front air chamber into the front air chamber cavity. This operation involves transferring air from the front chamber’s front wall to the front air chamber cavity. Subsequently, the air encountered the rear wall of the chamber, where it underwent reflection. Consequently, the energy within the rear air chamber was greater than that within the front air chamber. The capacity of short waves to transmit decreased as the frequency increased. The wave propagates to the front wall of the chamber, where it is partially reflected. Only a little amount of the wave energy entered the rear chamber after being reflected from the front wall. Consequently, the energy in the front chamber gradually overcomes that in the rear chamber as the frequency increases and the magnitude of the overall energy conversion efficiency decreases.
A comparison of the energy conversion efficiency for incident wave amplitudes (Af = 0.03 m and Af = 0.015 m) is presented in Figure 10. The trends of the energy conversion efficiency changing in response to the action of the two wave amplitudes shows a high degree of resemblance, as shown in Figure 10. Within the kh = 1.5–2.2 resonance interval, the dual-chamber OWC’s energy conversion efficiency ξ can be increased by about 25%. The energy conversion efficiency ξ of the dual-chamber OWC energy conversion device is maximized at kh = 1.7, which is 0.99 and 0.81, respectively.
In this study, the total efficiency ξ is calculated using Equation (13), while the efficiencies of the individual chambers, ξ1 and ξ2, are derived based on Equation (10). It is essential to emphasize that the total efficiency ξ cannot exceed 1 (100%), as this would violate the principle of energy conservation. This constraint is inherently satisfied in the methodology, as the total absorbed power P0 is always less than or equal to the incident wave power Pw·ω. Thus, the calculated efficiencies are physically consistent and reflect the energy interactions within the system.

3.3. Dual-Chamber OWC Wave Energy Absorption

At a resonance interval kh = 2.0, the dual-chamber OWC’s front and rear chambers’ wave energy magnitudes were compared to the single-chamber OWC, as illustrated in Figure 11. The single-chamber’s wave energy capture capacity was higher than that of the dual-chamber. The peaks of the captured wave energy of the dual-chamber OWC wave energy converter alternated at intervals of several cycles owing to the asymmetry of the upward and downward oscillations of the wavefronts inside the chamber. Furthermore, the vertical motion of the wave surface produced an asymmetric pressure distribution inside the chamber. A comparison of Figure 6a with the wave height distribution at the midpoint of the single- and dual-chambers reveals that the wave surface vertical motion peaks downwards when there is a large peak in the captured wave energy, and peaks upward when there is a small peak in the captured wave energy. This phenomenon was also observed in Ning’s physical experiments.
Figure 12a–d shows the instantaneous wave energy magnitudes obtained by the dual-chamber OWC. These figures present the results for incident wave amplitudes of Ai = 0.03 m and Ai = 0.015 m and incident wave frequencies of kh = 0.8, 1.5, 2.0, and 3.0, respectively. The periodical fluctuating according to the incident wave frequency was caused by the wave energy acquired by the dual-chamber OWC’s front and rear chambers. The wave energy captured by the single-chamber was greater than that captured by the front and rear chambers of the dual-chamber OWC. When a large wave amplitude is incident, 2–3 times as much wave energy is caught by the dual-chamber as by a small wave amplitude. Figure 10 demonstrates that the energy conversion efficiency of the dual-chamber wave energy conversion device decreased as the incident wave amplitude decreased.

3.4. Dual-Chamber OWC Wave Forces on Front Wall

When designing a dual-chamber OWC, the impact of the wave force on the structure must be considered. The chamber’s front wall is a pivotal component of the device structure because it bears the brunt of the wave force. The front walls of the front and rear chambers were subjected to disparate wave forces. A comprehensive analysis of the pressure and meticulous optimization of the design of the front wall can effectively mitigate the risk of rupture or collapse of the dual-chamber OWC under the influence of wave forces. This approach can also enhance the service life and reliability of the devices. The optimized design can effectively mitigate the risk of rupture or collapse of a dual-chamber OWC under wave forces thereby enhancing its service life and reliability.
Figure 13 illustrates the variation in the magnitude of the dimensionless horizontal wave force Fh and dimensionless vertical wave force Fv versus the incident wave frequency kh on the front walls of the front and rear chambers of the dual-chamber OWC. Figure 13 demonstrates that the magnitudes of the dimensionless horizontal wave force Fh and dimensionless vertical wave force Fv vary with the incident wave frequency kh on the front walls of the front and rear chambers, respectively. Conversely, the vertical wave force Fv on the front wall of the front chamber initially decreases, followed by an increase with increasing incident wave frequency kh. The horizontal wave force Fh acting on the rear chamber’s front wall demonstrated an increasing trend with the incident wave frequency kh, whereas the vertical direction pressure Fv exerted on the rear chamber’s front wall exhibited a decreasing pattern with increasing incident wave frequency kh. The maximum horizontal wave force Fh on the front chamber’s front wall was significantly greater than the vertical wave force Fv. Furthermore, the horizontal wave force on the front chamber’s front wall was marginally greater than that on the rear chamber’s front wall. Therefore, while designing a dual-chamber OWC, the front chamber’s front wall should be the main focus.
For two cases with different incident wave amplitudes (Ai = 0.03 m and Ai = 0.015 m), Figure 14 demonstrates that the dimensionless horizontal wave force on the front chamber’s front wall and the rear chamber’s front wall varies with respect to the incident wave frequency, kh. As illustrated in the figure, the horizontal wave force exhibited a consistent trend across the varying incident wave amplitudes. With an increase in the incident wave amplitude, the magnitude of the horizontal wave force acting on the front walls of the front and rear chambers also increased in proportion.

3.5. Dual-Chamber OWC Internal Flow Field

Tecplot 360 2023 R1 visual data analysis software was used to obtain the flow field inside the dual-chamber OWC’s front and rear chambers at different times in the resonance interval kh = 1.5. The vortex contours of the front and rear chamber flow fields at different moments of the complete cycle are shown in Figure 15a–h. As shown in Figure 15a–h, raising the wave surface inside the front chamber from the bottom causes the external body of water to flow into the chamber through the front wall, creating vortex A at the lower part of the front wall of the chamber. After T1/2, the wave surface in Figure 15e–h reaches the highest point and starts to descend. The water in the front chamber flows out through the partition, and the water under the front wall of the chamber reverses, while vortex B is generated. As shown in Figure 15e,f, as the newly created vortex B gradually increased to its maximum size, vortex A gradually dissipated with the flow of water outside the air chamber. Simultaneously, vortex B, created inside the front chamber, moved outwards along with vortex A as the water surface inside the chamber decreased. Vortices A and B were of equal size and flowed out of the front air chamber in opposite directions. In the figure, the colors represent the magnitude of the physical variable under analysis. Warm colors (such as red and yellow) indicate higher magnitudes, while cool colors (such as blue) correspond to lower magnitudes.
Compared with the front chamber, the rear chamber was isotropic. As illustrated in Figure 15a–d, the flow of water in the rear chamber through the double-chamber partition wall into the rear chamber results in the formation of vortex C when it reaches the lower portion of the rear chamber’s front wall. Following the completion of T1/2, as shown in Figure 15e–h, the wave surface attains its maximum elevation before commencing descent. Concurrently, the water within the rear air chamber was displaced through the double air chamber partition wall, and the water flow beneath the front wall of the rear air chamber was reversed, resulting in the generation of vortex D. The addition of an intermediate partition wall to the single-chamber effectively transformed it into a double-chamber. The increase in the rear chamber, in turn, generated vortices C and D, which consequently influenced the energy dissipation within the chamber.
As illustrated in Figure 15a,b, the formation of two small vortices in opposite directions is observed at the wave surface of the rear gas chamber. As the wave surface began to fall, the pressure inside the gas chamber increased, allowing gas from the outside to enter the chamber through the air holes. This resulted in the simultaneous generation of two vortices of the same size and in opposite directions at the same time in the middle of the chamber, corresponding to the air holes. As the wave surface of the chamber increased, gas was discharged from the gas holes, whereupon the two vortices converged into vortex E. Vortex E was then removed from the gas chamber, and the gas was removed from the gas holes. Consequently, vortex E is perpetually situated within the posterior interior of the gas chamber, preventing its dissipation into the rear wall. This phenomenon has the potential to enhance energy conversion efficiency.
The use of a 2D numerical model in this study offers a simplified and computationally efficient approach to investigating the hydrodynamic performance of the dual-chamber OWC system. However, we acknowledge its limitations, particularly in capturing 3D effects such as wave diffraction, lateral energy dissipation, and complex flow patterns around the chamber edges. These 3D phenomena can influence the distribution of wave energy, pressure fields, and ultimately the hydrodynamic efficiency of the system.
While the 2D model provides valuable insights into the general trends and key performance parameters, the results may overestimate or underestimate efficiency due to the exclusion of lateral interactions. Future work should incorporate 3D modeling to better understand these effects, particularly for offshore or non-uniform wave conditions, where 3D dynamics play a more significant role.

4. Conclusions

The performance and hydrodynamic properties of a dual-chamber OWC under varied wave situations were examined in this work. The key findings are as follows:
(1)
Compared to the single-chamber setup, the dual-chamber OWC’s energy conversion efficiency was noticeably higher. In the resonance zone, energy conversion efficiency increased by about 25% in the dual-chamber OWC.
(2)
Compared to the single-chamber OWC, the dual-chamber OWC had a wider resonance bandwidth, particularly within the wavenumber range of kh = 2–3. This wider resonance range can be attributed to the presence of two or more resonant frequencies in the dual-chamber configuration, which leads to a more consistent improvement in efficiency compared to the single-chamber design.
(3)
Compared to the single-chamber arrangement, the dual-chamber OWC had increased internal chamber pressure and wave surface elevation. Higher chamber pressure and larger oscillation amplitudes indicate enhanced internal wave motion, which enables the dual-chamber OWC to absorb more wave energy and increase energy conversion efficiency.
(4)
Although the single-chamber OWC captured more wave energy per unit chamber than the individual sub-chambers of the dual-chamber OWC, the dual-chamber system demonstrated alternating peaks in energy capture over multiple cycles. This behavior was likely due to the asymmetric oscillations of the water surface within the chambers.
(5)
Two vortices of equal size and opposite directions were generated near the air vents of the chamber. These vortices merged to form a stable vortex (vortex E) that remained in the rear chamber without dissipating against the rear wall. This persistent vortex enhances the energy conversion efficiency by maintaining continuous air movement within the chamber thereby significantly influencing the surface wave behavior.
It is essential to note that the time evolution of the air pressure signal within the OWC chamber is significantly influenced by air compressibility, a critical parameter that governs air–water interactions and affects the overall system dynamics. Reliable data from field studies or large-scale laboratory models are crucial for accurately analyzing the response of the OWC under realistic loading conditions, underscoring the importance of evaluating scaling effects to ensure model applicability in real-world implementations. Additionally, the stability of the OWC must be verified under intermediate resonant conditions, especially when the peak values of air pressure inside the chamber are out of phase with the forcing orbital pressures at the front wall, as such discrepancies can induce structural instabilities. While the dual-chamber design offers approximately a 25% increase in energy conversion efficiency within the resonance zone, it also raises construction costs. This trade-off has implications for practical applications, as the levelized cost of energy (LCOE) must be carefully considered in real-world designs to ensure economic viability. These considerations highlight the need for a comprehensive approach that addresses dynamic performance, structural stability, and economic feasibility in the development of efficient OWC systems.

Author Contributions

P.T.: Writing—Editing, Conceptualization, Funding Acquisition. Q.X.: Writing—Original Draft, Formal Analysis, Software. S.J.: Writing—Review, Conceptualization, Methodology, Formal Analysis. J.Z.: Validation, Software, Investigation. H.Z.: Conceptualization, Writing—Reviewing and Editing. All authors have read and agreed to the published version of the manuscript.

Funding

This research was funded by the National Natural Science Foundation of China, (Grant Nos. 51679132, and U22A20216) and the Science and Technology Commission of Shanghai Municipality (Grant No. 21ZR1427000).

Data Availability Statement

Data are contained within the article.

Conflicts of Interest

The authors declare no conflicts of interest.

References

  1. Qing, L.U.; Shi, H.-d. Progress and future trend of wave energy technology in China. Coast. Eng. 2022, 41, 1–12. [Google Scholar]
  2. Falnes, J. Radiation impedance matrix and optimum power absorption for interacting oscillators in surface waves. Appl. Ocean Res. 1980, 2, 75–80. [Google Scholar] [CrossRef]
  3. John Ashlin, S.J.; Sundar, V.; Sannasiraj, S.A. Effects of bottom profile of an oscillating water column device on its hydrodynamic characteristics. Renew. Energy 2016, 96, 341–353. [Google Scholar] [CrossRef]
  4. Ning, D.Z.; Wang, R.Q.; Zou, Q.P.; Teng, B. An experimental investigation of hydrodynamics of a fixed OWC Wave Energy Converter. Appl. Energy 2016, 168, 636–648. [Google Scholar] [CrossRef]
  5. Deng, Z.; Ou, Z.; Ren, X.; Zhang, D.; Si, Y. Theoretical analysis of an asymmetric offshore-stationary oscillating water column device with bottom plate. J. Waterw. Port Coast. Ocean Eng. 2020, 146, 04020013. [Google Scholar] [CrossRef]
  6. Nader, J.R.; Zhu, S.P.; Cooper, P.; Stappenbelt, B. A finite-element study of the efficiency of arrays of oscillating water column wave energy converters. Ocean Eng. 2012, 43, 72–81. [Google Scholar] [CrossRef]
  7. Evans, D.V. The oscillating water column wave-energy device. IMA J. Appl. Math. 1978, 22, 423–433. [Google Scholar] [CrossRef]
  8. Evans, D.V.; Porter, R. Hydrodynamic characteristics of an oscillating water column device. Appl. Ocean Res. 1995, 17, 155–164. [Google Scholar] [CrossRef]
  9. Josset, C.; Clément, A.H. A time-domain numerical simulator for oscillating water column wave power plants. Renew. Energy 2007, 32, 1379–1402. [Google Scholar] [CrossRef]
  10. Gomes, R.; Henriques, J.; Gato, L.; Falcão, A. Hydrodynamic optimization of an axisymmetric floating oscillating water column for wave energy conversion. Renew. Energy 2012, 44, 328–339. [Google Scholar] [CrossRef]
  11. Zhou, Y.; Ning, D.; Liang, D.; Cai, S. Nonlinear hydrodynamic analysis of an offshore oscillating water column wave energy converter. Renew. Sustain. Energy Rev. 2021, 145, 111086. [Google Scholar] [CrossRef]
  12. Dezhi, N.; Jin, S.H.I.; Bin, T.; Haitao, Z. Numerical simulation of a land-based oscillating water column wave energy conversion device. J. Harbin Eng. Univ. 2014, 7, 789–794. [Google Scholar]
  13. Zhu, J.L.; Tang, P.; Zhang, H.S.; Zheng, P.B. Numerical study of hydrodynamic characteristics of a three-dimensional oscillating water column wave-power device. J. Mar. Sci. Eng. 2024, 12, 1161. [Google Scholar] [CrossRef]
  14. Hsieh, M.-F.; Lin, H.; Dorrell, D.G.; Hsieh, M.-J.; Lin, C.-C. Development of a wave energy converter using a two chamber oscillating water column. IEEE Trans. Sustain. Energy 2012, 3, 482–497. [Google Scholar] [CrossRef]
  15. Rezanejad, K.; Bhattacharjee, J.; Guedes Soares, C.G. Analytical and numerical study of dual-chamber oscillating water columns on stepped bottom. Renew. Energy 2015, 75, 272–282. [Google Scholar] [CrossRef]
  16. Ning, D.; Wang, R.; Chen, L.; Sun, K. Experimental investigation of a land-based dual-chamber OWC wave energy converter. Renew. Sustain. Energy Rev. 2019, 105, 48–60. [Google Scholar] [CrossRef]
  17. Elhanafi, A.; Macfarlane, G.; Ning, D. Hydrodynamic performance of single–chamber and dual–chamber offshore–stationary Oscillating water Column devices using CFD. Appl. Energy 2018, 228, 82–96. [Google Scholar] [CrossRef]
  18. He, F.; Leng, J.; Zhao, X. An experimental investigation into the wave power extraction of a floating box-type breakwater with dual pneumatic chambers. Appl. Ocean Res. 2017, 67, 21–30. [Google Scholar] [CrossRef]
  19. Ning, D.; Zhou, Y.; Zhang, C. Hydrodynamic modeling of a novel dual-chamber OWC wave energy converter. Appl. Ocean Res. 2018, 78, 180–191. [Google Scholar] [CrossRef]
  20. Ning, D.; Zhou, Y.; Mayon, R.; Johanning, L. Experimental investigation on the hydrodynamic performance of a cylindrical dual-chamber Oscillating water Column device. Appl. Energy 2020, 260, 114252. [Google Scholar] [CrossRef]
  21. Taherian Haghighi, A.T.; Nikseresht, A.H.; Hayati, M. Numerical analysis of hydrodynamic performance of a dual-chamber Oscillating water Column. Energy 2021, 221, 119892. [Google Scholar] [CrossRef]
  22. Rezanejad, K.; Guedes Soares, C. Hydrodynamic investigation of a novel concept of oscillating water column type wave energy converter device. J. Offshore Mech. Arct. Eng. 2021, 143, 042003. [Google Scholar] [CrossRef]
  23. Rezanejad, K.; Gadelho, J.F.M.; Xu, S.; Guedes Soares, C. Experimental investigation on the hydrodynamic performance of a new type floating Oscillating water Column device with dual-chambers. Ocean Eng. 2021, 234, 109307. [Google Scholar] [CrossRef]
  24. Xu, S.; Guedes Soares, C.G. Experimental investigation on short-term fatigue damage of slack and hybrid mooring for wave energy converters. Ocean Eng. 2020, 195, 106618. [Google Scholar] [CrossRef]
  25. Xu, S.; Rezanejad, K.; Gadelho, J.F.M.; Guedes Soares, C. Influence of the power take-off damping of a dual chamber floating oscillating water column on the mooring fatigue damage. Ocean Eng. 2022, 249, 110832. [Google Scholar] [CrossRef]
  26. Falcão, A.F.D.O. Wave energy utilization: A review of the technologies. Renew. Sustain. Energy Rev. 2010, 14, 899–918. [Google Scholar] [CrossRef]
  27. Hirt, C.W.; Nichols, B.D. Volume of fluid (VOF) method for the dynamics of free boundaries. J. Comput. Phys. 1981, 39, 201–225. [Google Scholar] [CrossRef]
  28. Morris-Thomas, M.T.; Irvin, R.J.; Thiagarajan, K.P. An investigation into the hydrodynamic efficiency of an oscillating water column. J. Offshore Mech. Arct. Eng. 2007, 129, 273–278. [Google Scholar] [CrossRef]
Figure 1. Diagram of the 2D numerical wave tank.
Jmse 12 02176 g001
Figure 2. Schematic diagram of mesh subdivision in computational domain.
Jmse 12 02176 g002
Figure 3. Numerical convergence results for three different grid resolutions.
Jmse 12 02176 g003
Figure 4. Single-chamber oscillating water column (OWC) energy conversion efficiency ξ versus kh [4].
Jmse 12 02176 g004
Figure 5. Comparison of numerical calculation results with experimental results for time histories of dimensionless wave height. ((a): T = 1.366 s; (b): T = 1.423 s; (c): T = 1.610 s; (d); T = 1.735 s).
Jmse 12 02176 g005
Figure 6. Wave surface and dimensionless pressure comparison between single-chamber and dual-chamber midpoints.
Jmse 12 02176 g006
Figure 7. Relative wave height and dimensionless pressure versus kh.
Jmse 12 02176 g007
Figure 8. Wave surface at different incident wave frequencies.
Jmse 12 02176 g008aJmse 12 02176 g008b
Figure 9. Energy conversion efficiency (ξ, ξ1, and ξ2) versus kh.
Jmse 12 02176 g009
Figure 10. Comparison of energy conversion efficiency for incident wave amplitude.
Jmse 12 02176 g010
Figure 11. A comparison of the magnitude of the wave energy captured by the dual-chamber oscillating water column (OWC) and single-chamber OWC.
Jmse 12 02176 g011
Figure 12. Histories of wave energy captured by dual-chamber OWC at different incident wave frequencies (kh = 0.8, 1.5, 2.0, and 3.0).
Jmse 12 02176 g012aJmse 12 02176 g012b
Figure 13. A comparison of the front wall of the front chamber and rear chamber of a dual-chamber oscillating water column (OWC).
Jmse 12 02176 g013
Figure 14. The horizontal wave force of the front wall of the front and rear chamber versus kh.
Jmse 12 02176 g014
Figure 15. Vortex contours of the front and rear chamber of a complete cycle.
Jmse 12 02176 g015
Table 1. Numerical calculation of wave parameters.
T (s)0.91.01.11.21.31.41.51.61.71.81.9
kh2.232.061.911.791.701.611.541.481.421.371.33
T (s)2.02.12.22.32.42.52.62.72.82.93.0
kh1.291.261.221.201.171.141.121.101.081.061.04
Table 2. Numerical calculation of working conditions.
Chamber TypeChamber Width
B (m)
Chamber Height
hc (m)
Wave Height
H (m)
Wave Period
T (s)
Holes Width
D (m)
Case 1single-chamber0.550.020.060.8–3.00.064
Case 2single-chamber0.550.020.030.8–3.00.064
Case 3dual-chamber0.550.020.060.8–3.00.064
Case 4dual-chamber0.550.020.030.8–3.00.064
Case 5dual-chamber0.2550.020.060.8–3.00.064
Case 6dual-chamber0.2550.020.030.8–3.00.064
Case 7single-chamber0.550.020.060.8–3.00.160
Case 8single-chamber0.550.0250.060.8–3.00.064
Table 3. Three different mesh sizes.
GridMesh 1Mesh 2Mesh 3
grid subdivision6080120
grid size (m)0.040.0310.02
Total grids (×104)9.112.218.2
Disclaimer/Publisher’s Note: The statements, opinions and data contained in all publications are solely those of the individual author(s) and contributor(s) and not of MDPI and/or the editor(s). MDPI and/or the editor(s) disclaim responsibility for any injury to people or property resulting from any ideas, methods, instructions or products referred to in the content.

