1. Introduction
Floods or tsunamis on bridges represent a critical intersection of natural forces and human infrastructures, often leading to complex and challenging scenarios. Bridges, as vital components of transportation networks, connect communities, facilitate trade, and enable the flow of goods and services. However, they are also vulnerable to the destructive forces of flooding, which can result from heavy rainfall, storm surges, or even tsunami events. Engineers and researchers [
1] are increasingly concerned with the hydrodynamic forces acting on coastal structures under conditions in which waves and currents interact. In order to predict the behavior of bridges under flooding actions, several experimental studies have been developed, mostly to identify the characteristics of tsunamis, such as wave generation and evolution, and the induced forces on the bridge deck. In particular, the experimental setup involves large-scale bridge superstructures, with configurations based on two different approaches: isolated waves or dam-break waves. Isolated waves are typically created in a wave flume using a piston-type wavemaker. Typically, solitary waves or superpositions of positive or negative waves are utilized to evaluate hydrodynamic actions on a rigid geometry [
2,
3,
4,
5,
6]. Alternatively, experimental analyses are developed by using the dam-breaking loading scheme, in which a water tank is released to produce a wave front [
7,
8,
9]. However, there is ongoing discussion about determining the most suitable method for simulating tsunamis or flooding actions, and thus active research is currently underway on this subject. The majority of research has focused on examining the changes in horizontal and vertical forces applied to flat plates, T- or I-shapes, or box girders across various water depths, wave heights, and submergence depths [
10,
11,
12]. Most of the investigations have proved that the greatest vertical uplift and most positive horizontal forces occur when the underside of the deck is positioned just above the water surface, whereas the uplift forces can also be up to 20–30% larger than the weight of the bridge deck [
13,
14]. The air entrapment and vorticity of the fluid flow on the deck forces have also been observed to play important roles. However, the experimental setups are designed with specific scales of analysis, which are considerably larger in relation to the spatial and temporal characteristics of the tsunami or flood events [
14,
15,
16].
Simulations of a bridge response to flood or tsunami loads have also been investigated from a numerical point of view. Typically, the analysis aims to simulate the generation and propagation of wave run-up with the purpose of estimating the hazard zone in terms of wave characteristics [
17]. However, 3D models, including the structural system, are quite rare due to the computational complexities of the fluid flow analysis, structural deformability, and the Fluid–Structure Interaction (FSI) equations to be solved [
18]. The spatial and temporal scales defined by the generation of tsunami-like waves are much larger than those required to simulate the FSI. These effects are captured only by detailed descriptions of both the structural and fluid systems and thus involve prohibitive computational costs. In the literature, the most common formulations are based on a shallow water approximation, where complex topographical characteristics such as the river width and depth, riverbed gradient, and estuary shape are considered to predict tsunami evolution [
19]. Existing simulations in 3D frameworks are mainly concerned with the analysis of very small regions located in proximity to the structural system, in which simplified hypotheses regarding wave formation, fluid flow, and structural characteristics are typically employed [
20]. As a result, hybrid models based on 3D–2D approaches are often required to simulate the propagation of waves by means of 2D formulations, while the target area is modeled using a refined description of the structural system [
21]. In the literature, most of the analyses developed using the CFD framework are devoted to evaluating the hydrodynamic forces involved in tsunami or flooding events, where the bridge is assumed to involve simplified geometries. Typically, advanced formulations, based on particle or 2D–Lagrangian vortex methods, large eddy simulation, and the Volume of Fluid (VOF) scheme, implemented in conjunction with multi-phase field approximations, are implemented [
22,
23]. Although the papers referred to above investigate the influence of the submerged height [
24], the wave flow characteristics [
25], or the lateral restraining stiffness effect [
7], the bridge structure can only be modeled by considering a cross section with simplified rectangular geometries in a fixed or mobile configuration based on equivalent supports. Thus, the model does not really capture the actual fluid–structure interaction behavior of 3D structural systems.
Recently, the influence of bridge geometry has been considered in refined and advanced formulations, wherein the structural system is analyzed with the actual cross-section typology. Specifically, bridge decks with T-shaped geometries and varying numbers of girders affected by extreme impact waves have been investigated using an arbitrary Lagrangian–Eulerian numerical model [
26,
27]. The influence of section details such as railing, air vents, or fairings was investigated in [
28,
29], which analyzed the effects of tsunami-like waves with various conditions, including the wave height and submersion depth, on bridges. In addition, the entrapped air between the bridge girders can significantly affect the fluid flow–bridge interaction, leading to amplifications of the uplift forces at small wave heights [
30,
31]. From the design perspective, an evaluation of the maximum drag and lift forces on bridge decks was proposed in [
10], in which two different scenarios, namely initial impact and inundation, were introduced. Analytical expressions of the uplift, drag, and downward forces were provided in terms of the tsunami fluid flow characteristics for several girder cross-section shapes. The results show that the position of the bridge relative to the initial sea level has a serious impact on the forces on the bridge when the tsunami-like wave passes through it.
Although several studies have been proposed to identify the hydrodynamic forces, very few analyses have been concerned with identifying the structural vulnerability under flooding actions, taking into account the influence of the structural deformability and the dynamic interaction between fluid and structural systems in terms of inertial distribution. Typically, the structural assessment is developed by the finite element method, in which static forces are applied to the structural system without considering any FSI effects. The deck is modeled by a linear elastic formulation, since failure mechanisms, as shown in the literature [
32], affect the superstructure by a rigid overturning. The source of damage can be recovered in the substructural system of the bridge, namely caps or piers, which are modeled by using the nonlinear material constitutive law [
33]. Moreover, the bearing system is modeled by means of perfect or imperfect interfaces depending on the deck–piers connection typology [
32]. To the best of the authors’ knowledge, in this framework, the structural assessment was developed by means of uncoupled analyses based on different scales. Specifically, results at the basin or hydrographic level were generated to identify wave characteristics. These served as input data for defining the hydrodynamic forces to be applied to the structural system [
34].
Although previous studies have advanced our comprehension of the impact of tsunamis on bridge structures, much emphasis has been placed on investigating the fluid flow characteristics for hydrodynamic force identification. The structural system is defined as a fixed geometry without taking into account the flexibility of the cross section, the connections with the substructure, and the inertial interaction between the two subsystems. The present paper proposes a multiscale 2D/3D model for the fluid and structural systems. The concept of multiscale analysis and its potential for improving our understanding of flooding events is analyzed, emphasizing its strengths and limitations. The fluid description is based on a multiphase RANS model, which was coupled with the structural system on the basis of the mesh technique based on ALE formulation. The FSI is considered using constrain equations, which are able to connect the 2D and 3D variables. The proposed methodology was validated by comparing it with the numerical and experimental data available in the literature. The objective of the present paper is to quantify the dynamic amplification effects produced by the fluid flow on the structure system. Moreover, a parametric study in terms of the fluid flow and structural characteristics was developed to identify the worst scenarios and, thus, aid designers in better understanding bridge behavior in the presence of tsunami or flood actions.
2. Theoretical Formulation and Numerical Implementation
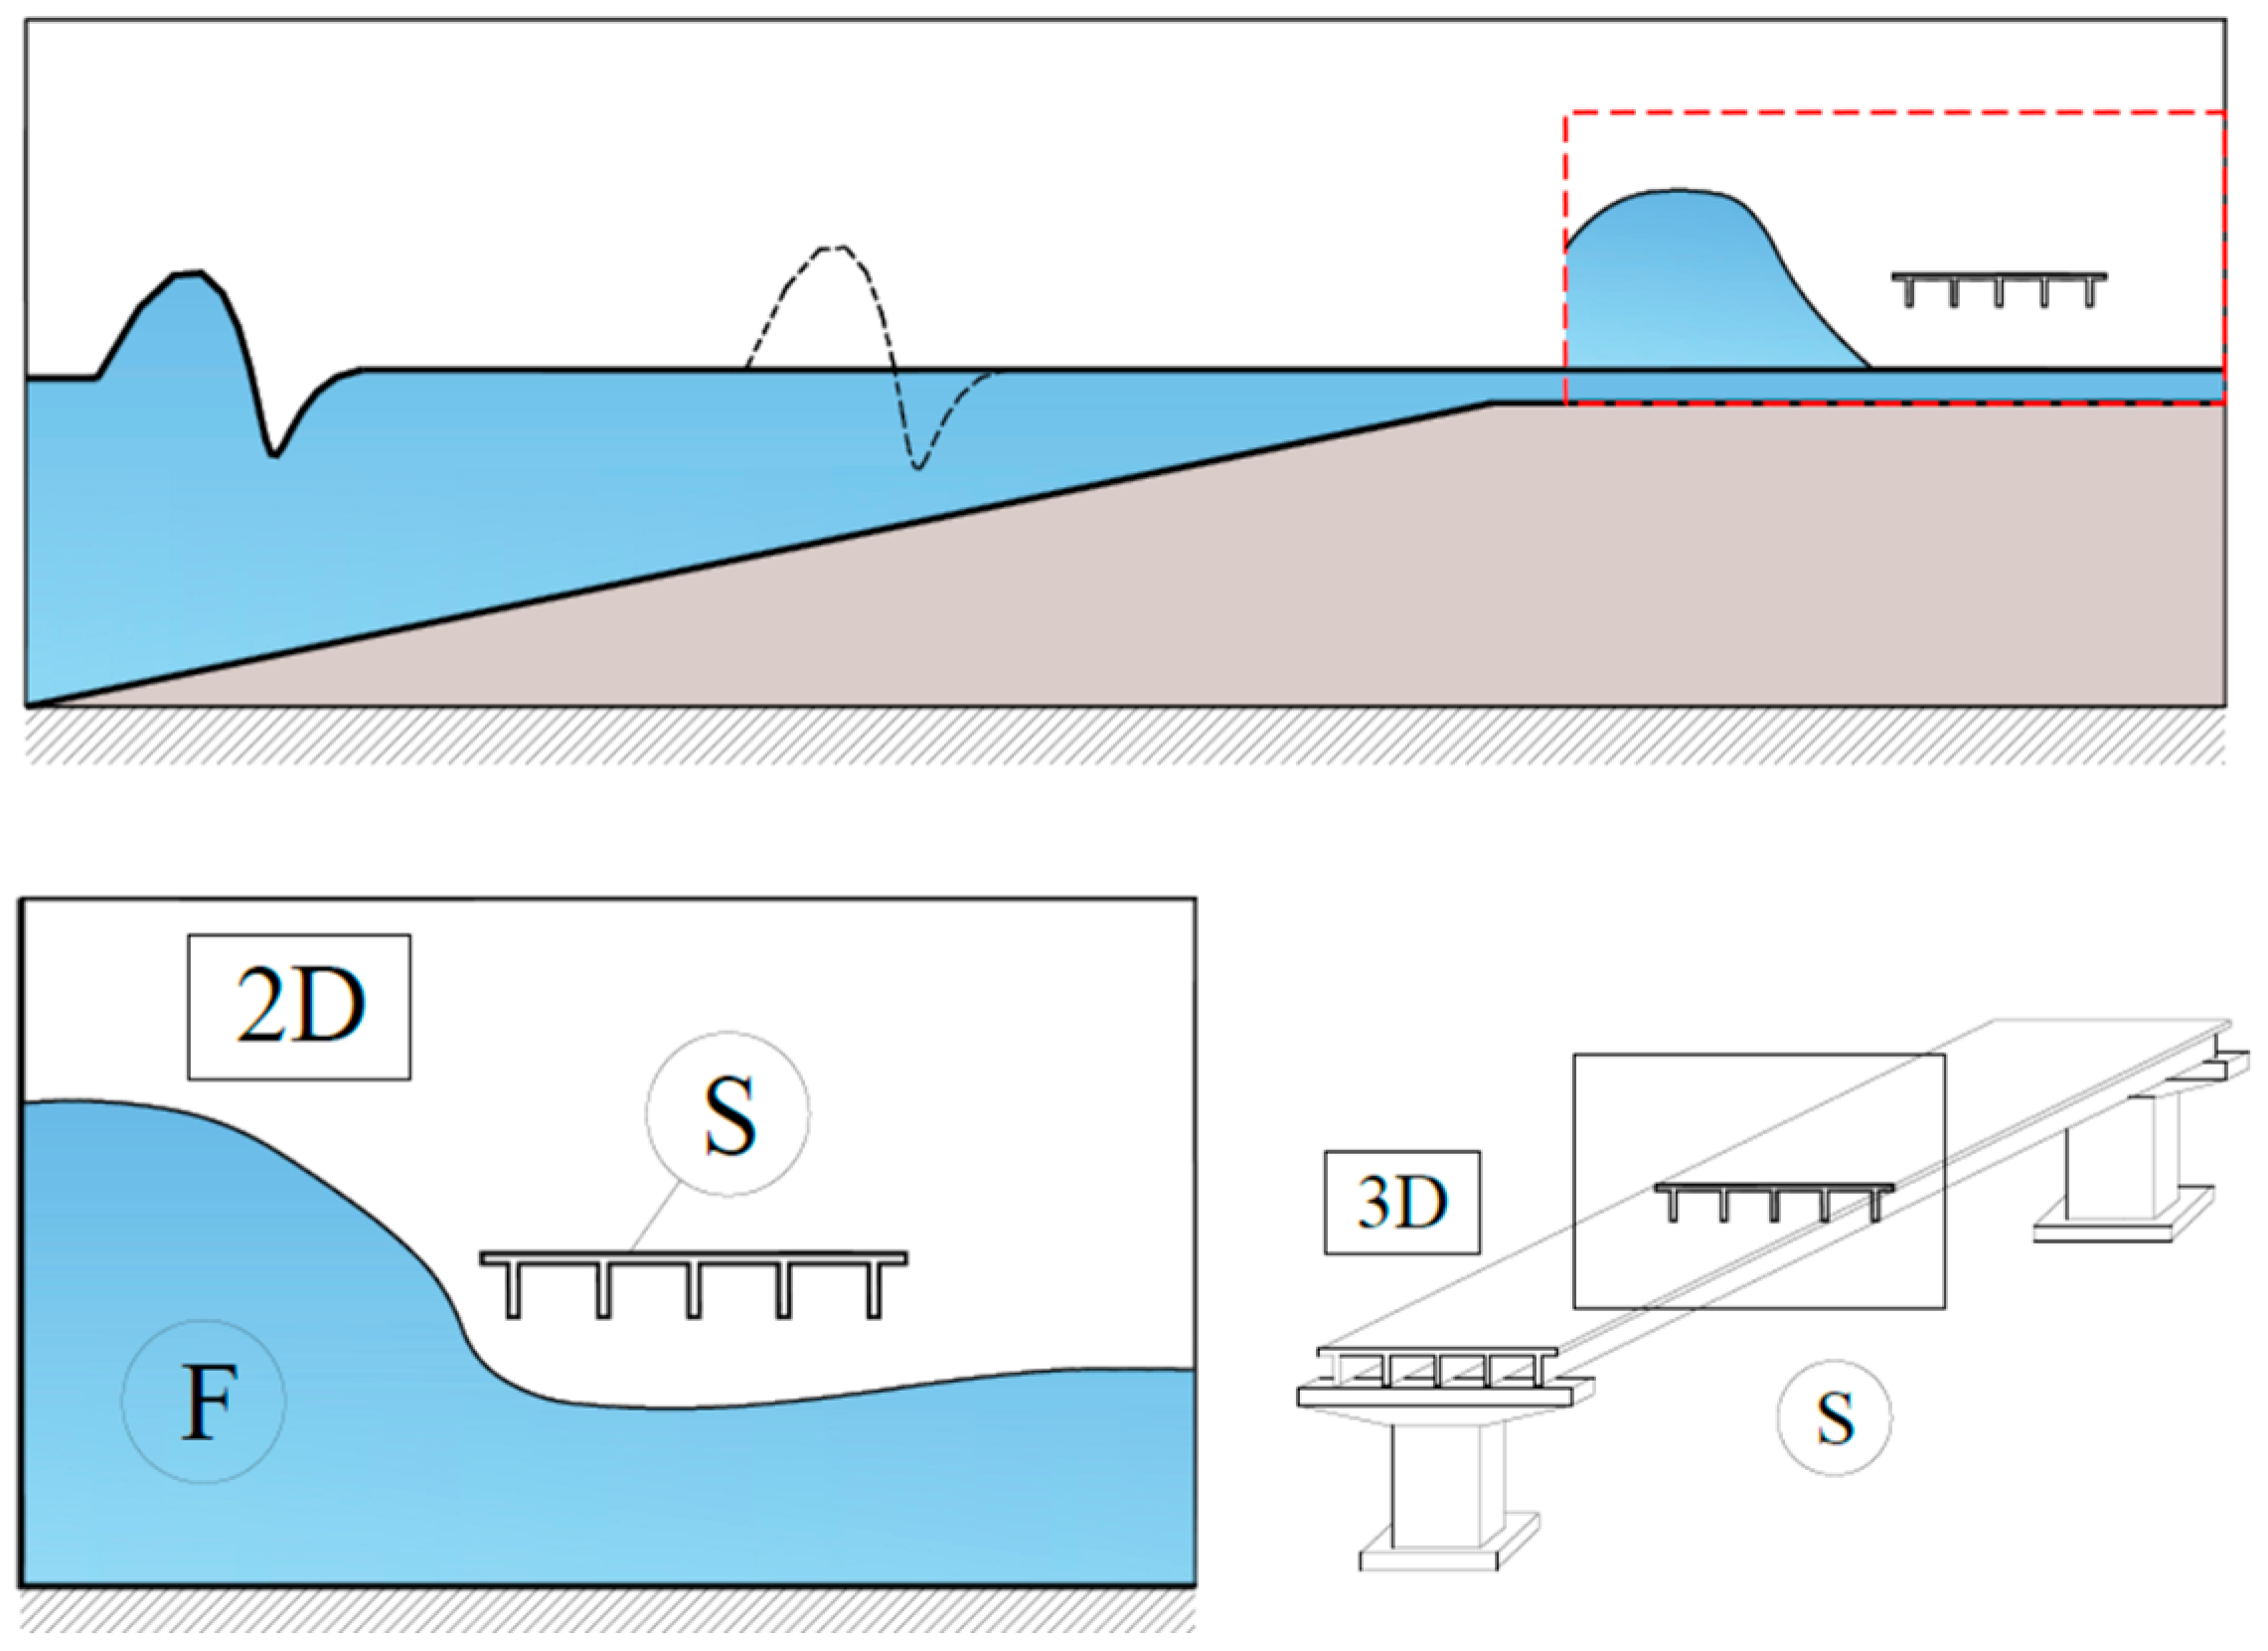
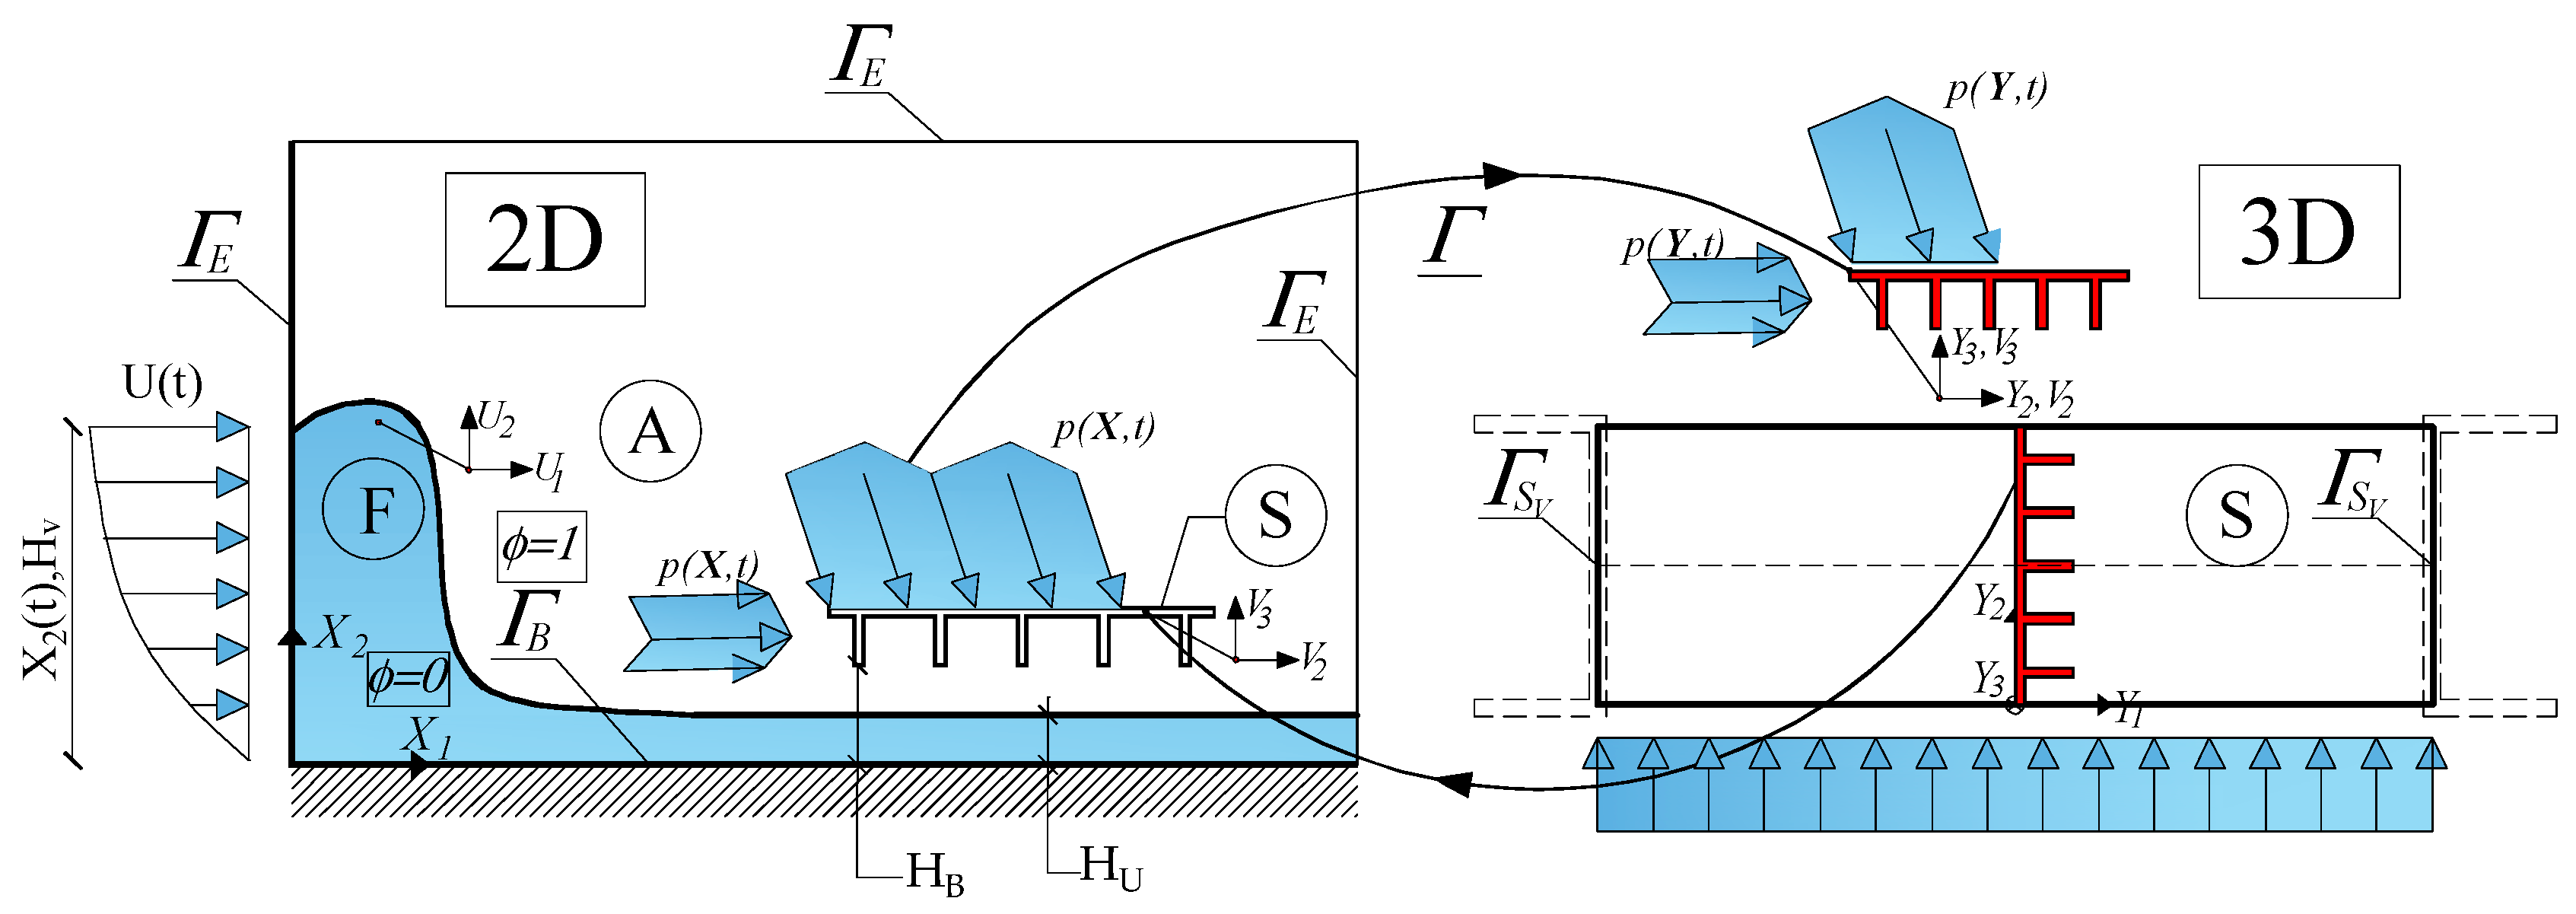
Flood or tsunami events are typically analyzed from the hydraulic/hydrologic point of view at a scale, i.e., territory or urban, which is relatively larger than the one defined for the structural system. Since the primary attention of the present research is devoted to evaluating the effects on the structural system produced by flood or tsunami fluid flow, a multiscale analysis is implemented. In particular, the fluid flow is analyzed by means of a 2D formulation, in which a two-phase level set with RANS turbulent flow is utilized. The analysis is restricted to a region close to the structure, in which proper boundary conditions are able to correctly reproduce the wave characteristics obtained at a larger scale of analysis. The structural system was developed in a 3D framework by means of continuous solid mechanics theory for a better description of the FSI. The coupling between the 2D and 3D scales was achieved through multiple constraint operators based on a moving mesh strategy developed within the framework of Arbitrary Lagrangian–Eulerian (ALE) formulation. It allows the transfer of the pressure distribution on the structural system as applied load and enables modification of cross-section boundaries based on the bridge displacements. A synoptic representation of the 3D/2D multiscale model is shown in
Figure 1.
The equations governing the fluid dynamics are described by the incompressible Navier–Stokes formulation:
where
is the velocity vector function (averaged),
is the fluctuating part,
is the identity matrix,
are the density and viscosity of the fluid, respectively, and
p is the pressure function. The level set method is utilized to track the interfaces of the multi-phase fluid flow:
where
γ is the reinitialization parameter (equal to 1), and
ε is the interface thickness controlling parameter, equal to the maximum mesh element size in the region through which the interface passes.
Equations (1) and (2) are completed by initial or boundary conditions. In particular, open and wall slip conditions are presented along the external and bottom contours, namely
and
. Furthermore, moving wall conditions are enforced on the cross-section boundaries based on the displacements of the bridge cross section obtained by solving the structural mechanics problem. The inlet distribution for time-dependent initial height and speed is defined by the following functions derived from wave characteristics:
where
is the Heaviside function,
and
are the inlet speed and water depth function of the wave loads, and
is the level set value related to the inlet water flow (
Figure 2). For the structural system, the solid mechanics equations refer to a 3D continuum linear elastic formulation based on a minor strain assumption. The displacement vector function
is defined by solving the following PDE equations:
where
is the displacement vector function,
is the elastic matrix,
is the symmetric gradient of
,
is a 3 × 3 identity matrix,
is the self-weight load vector, and
is the mass density of the structure. Additionally, boundary conditions are imposed for the normal and tangential components of the fluid forces acting on the cross section, as well as the support conditions dependent on the bearing system:
where
is the surface force vector on the external surface
equal to the pressure function obtained by solving Equation (1), and
is the vector of the prescribed displacements applied at the bridge extremities, namely
(see
Figure 2), based on the design bearing scheme. A moving mesh technique using an Arbitrary Lagrangian–Eulerian (ALE) formulation is applied to manage boundary motion. In line with the ALE approach, regularity conditions for the mesh velocity at computational nodes should be established through a smoothing algorithm to minimize grid distortions as the flow evolves [
35].
The previous equations were solved using the finite element (FE) method, using a customized version of COMSOL Multiphysics developed in the Model Builder application [
36]. Specifically, the numerical procedure addresses the resolution of the Navier–Stokes and turbulence equations to derive the pressure field or monitor the movement of fluid particles. Fluid equations are coupled with a two-phase flow based on a level set approach. Importantly, equations related to fluid, ALE, and structural issues are interconnected at the boundaries. In particular, the stress distribution on the moving wall boundaries is connected to the structural deformability via the ALE formulation. The interaction between the structural and fluid domains is introduced through weak boundary terms, represented by extrusion variable maps, which act as one-to-one functions between the 2D and 3D domains. The kinematic and static variables on the cross-section boundaries, i.e.,
p and
on
, are transferred from the structural to the fluid domain and vice versa by means of the flowing mapping operator and its inverse:
with
representing the variable transferred from the fluid
and structural systems
. From an analytical point of view, the function
is considered as a homeomorphism, since the mapping is assumed to be a one-to-one mapping that is continuous in both directions. To ensure accuracy in defining the mapping function, the “closed point method” was employed. This method is a special function utilized by the Comsol software 6.2 [
36] to map an expression from the source to destination mesh; in particular, it involves establishing a tolerance criterion for the projection of each variable, particularly in the transition area with a refined discretization of the mesh. The mapping process fails if there is no source mesh within the distance specified by the value in the extrapolation tolerance field. Specifically, for the fluid boundary layer mesh refinement, a dense mesh along the normal direction of the boundaries was utilized, whereas, for the structural system, a classical discretization was employed. The structural configuration was established using the governing equations from the finite element (FE) solid model. Linear interpolation functions were utilized for the fluid, Arbitrary Lagrangian–Eulerian (ALE), and structural variables. The mesh discretization was optimized through convergence studies to ensure precision while minimizing computational costs. Initially, a range of uniformly distributed mesh points, varying from 1 cm to 1 mm, was used. Then, non-uniform discretization with transition elements was applied in regions requiring greater accuracy, such as at moving wall conditions, thus reducing the overall computational expense of the numerical model.
3. Validation of the Proposed Model
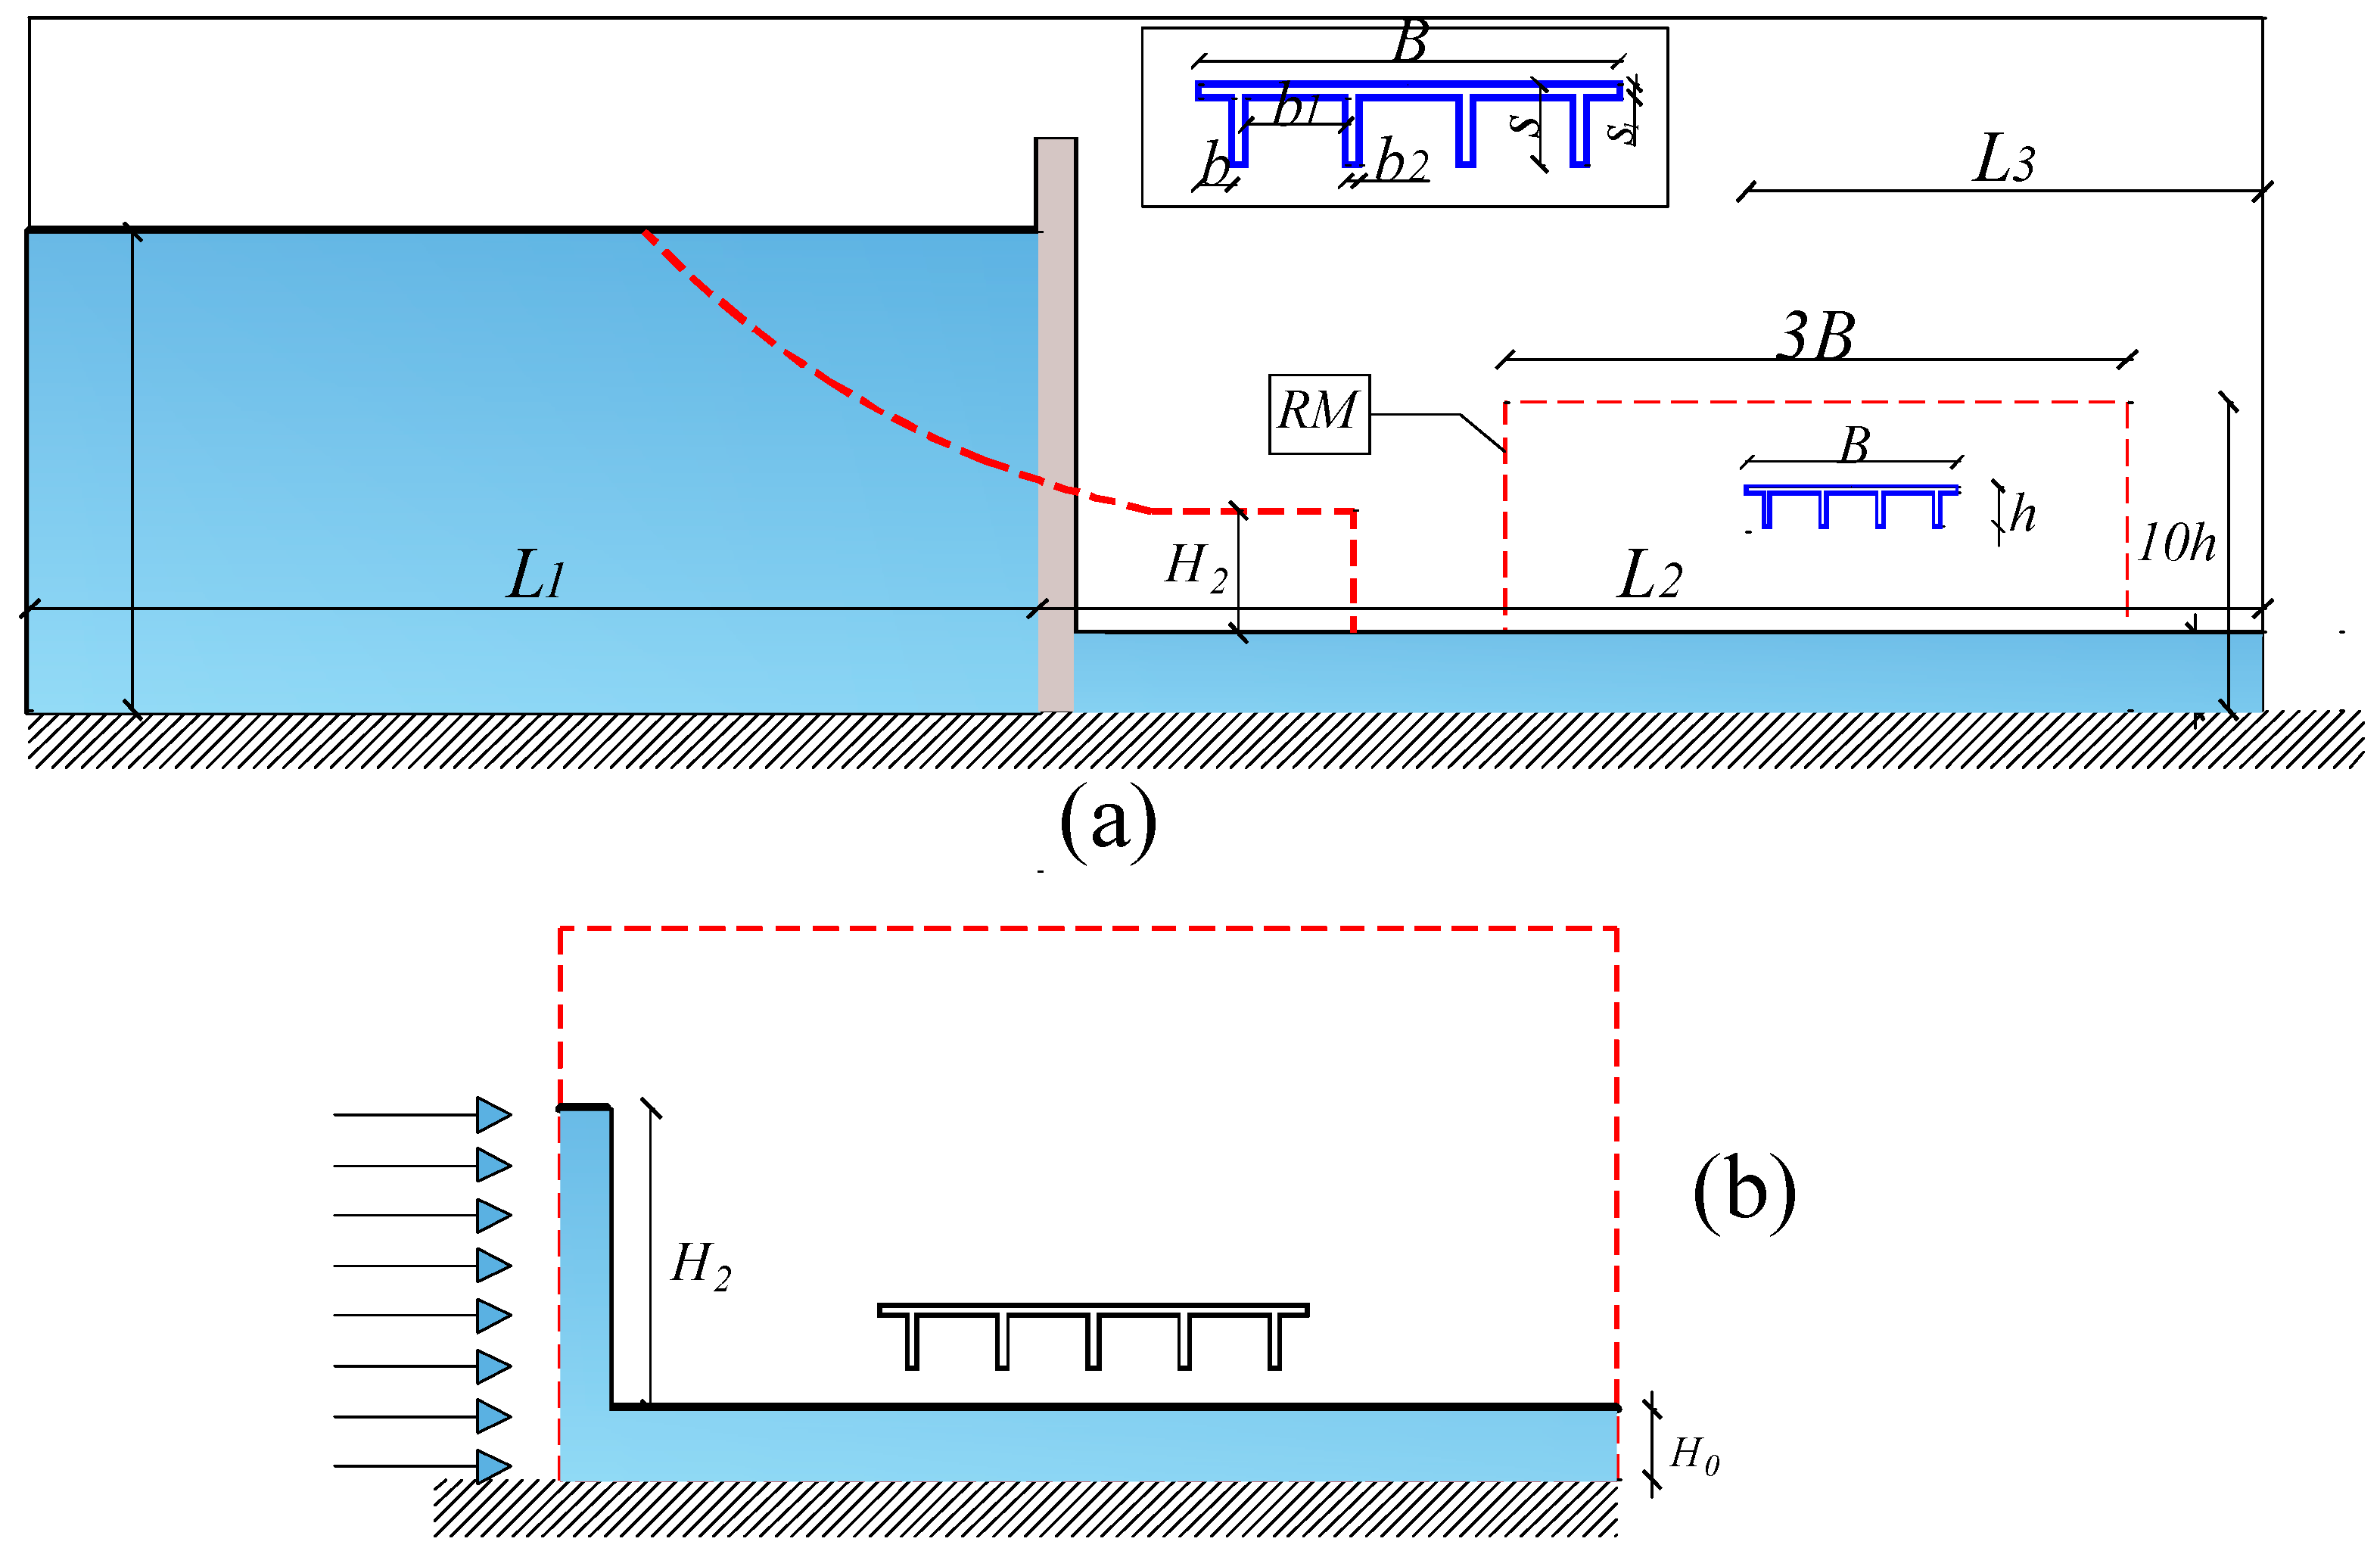
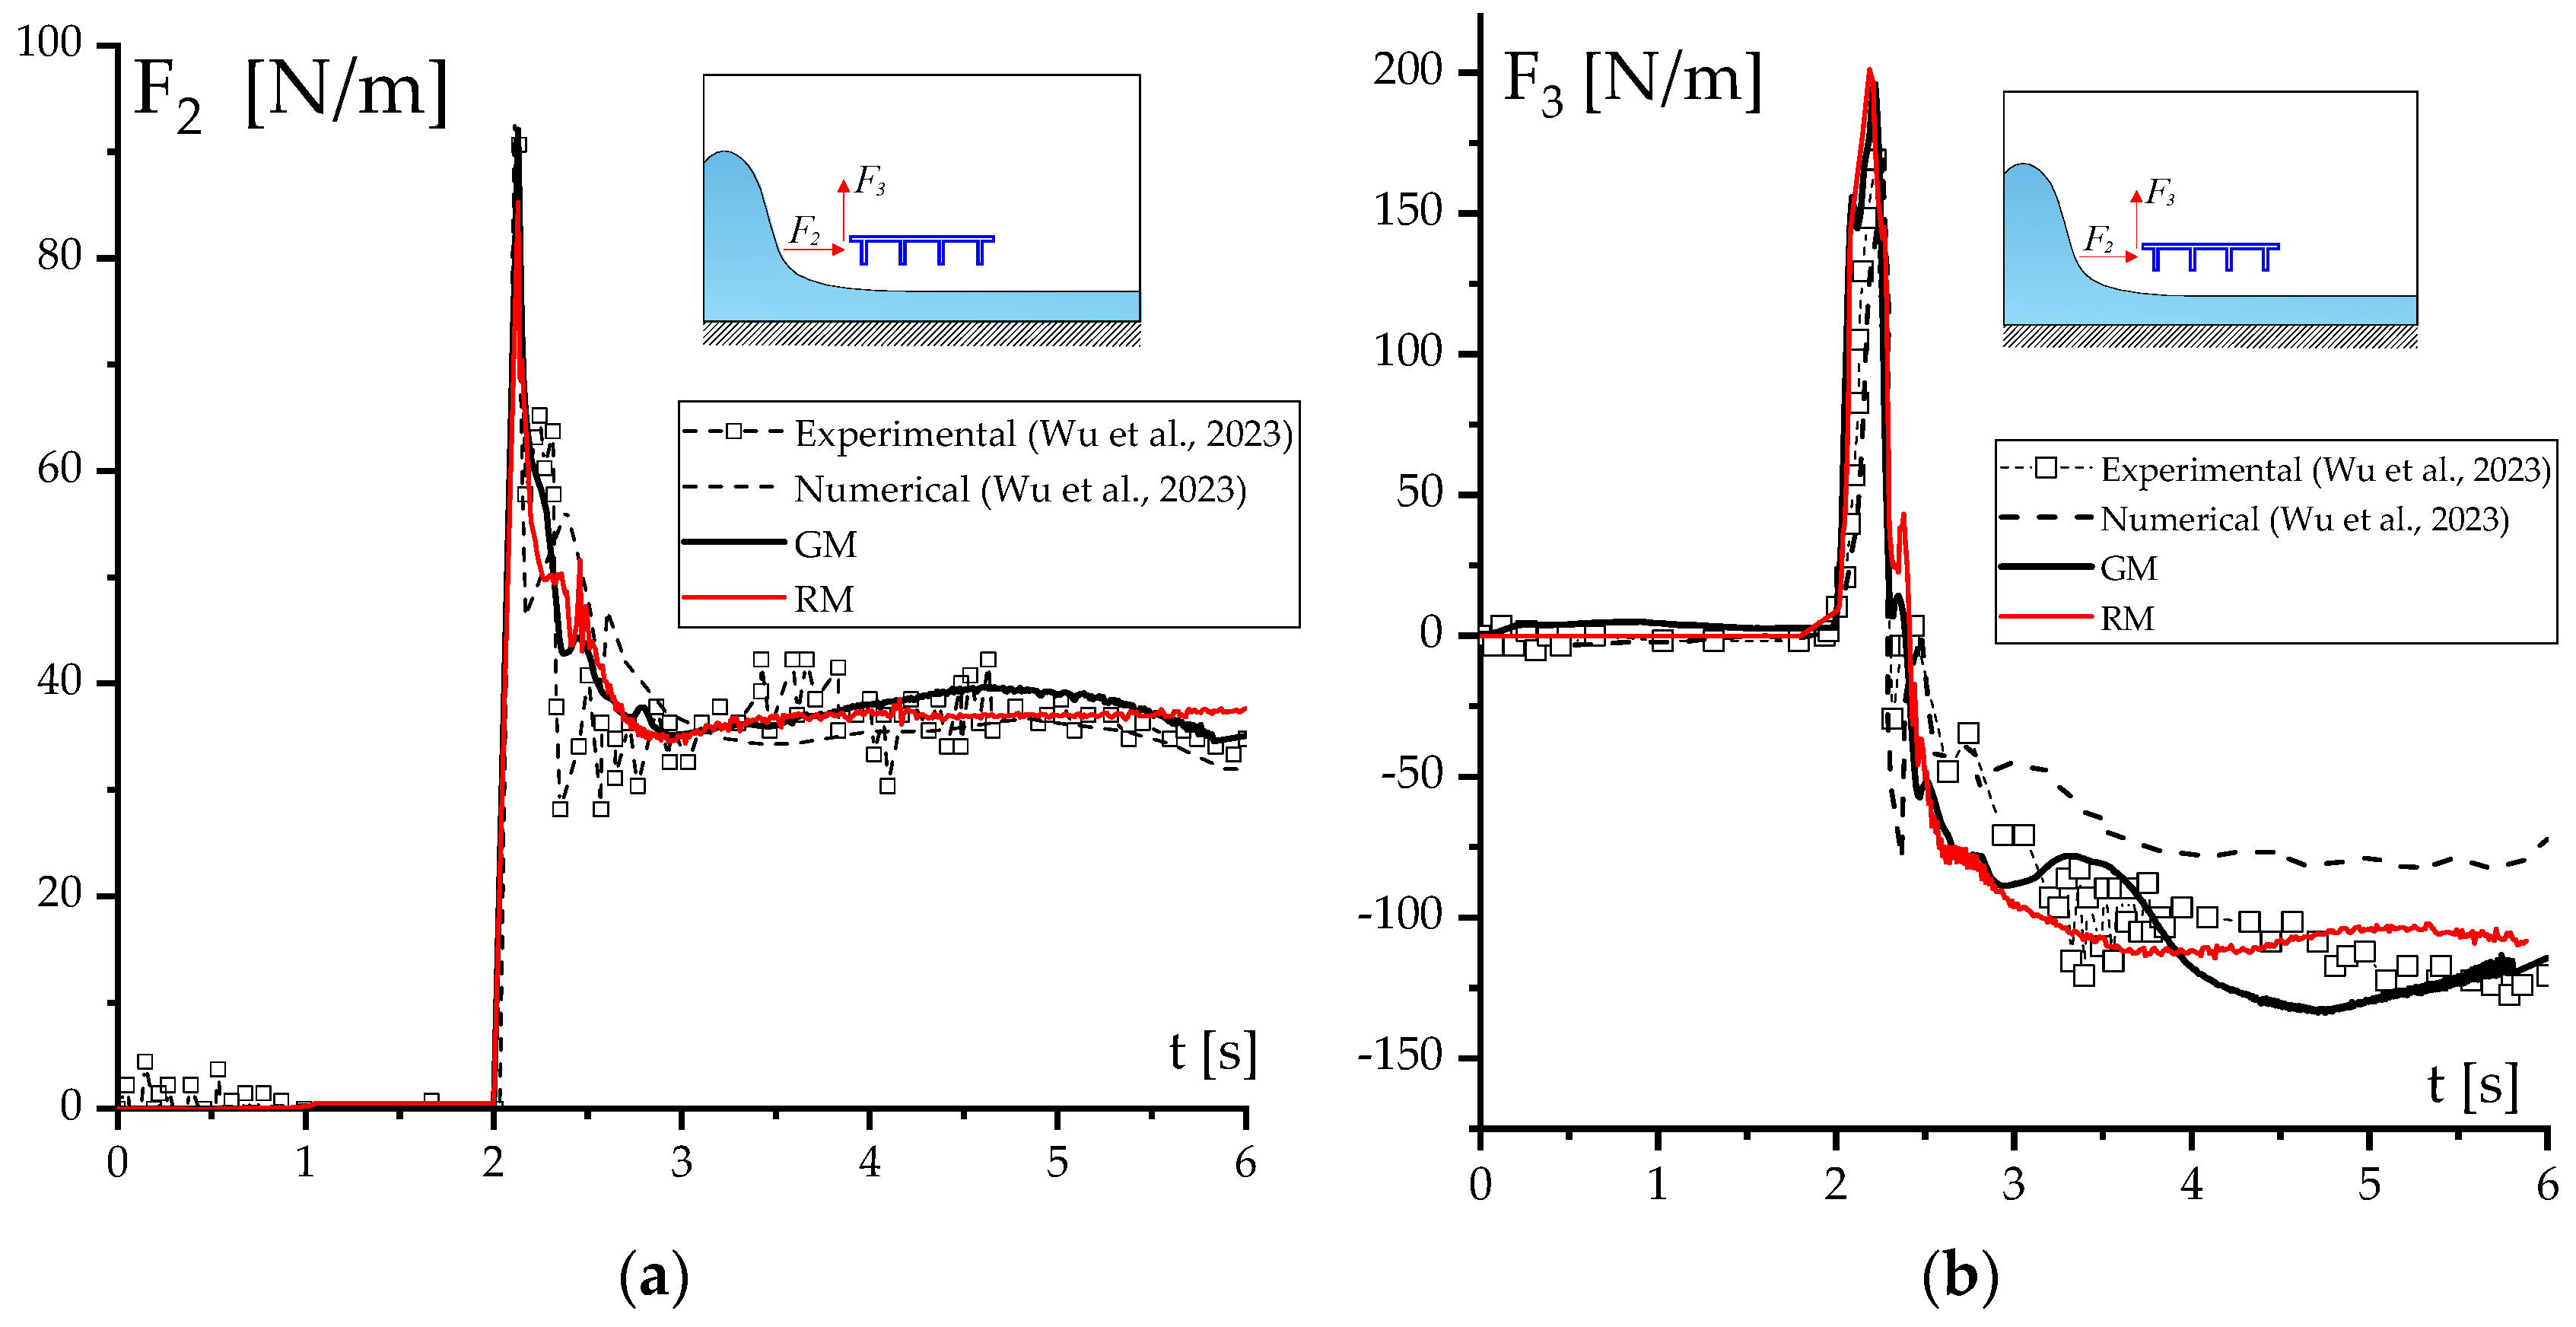
The model’s capability was verified by comparing its results with both the numerical and experimental data concerning a dam-break loading scenario on a T-shaped bridge deck. Although existing models are based on isolated or solitary waves, dam-break scenarios are often employed to simulate tsunami waves. This is because dam-break scenarios provide a reasonable approximation of the speed and height variability characteristic of tsunamis [
37]. The flume was partitioned into two distinct regions: upstream and downstream. In the upstream region, the gate was rapidly released to generate dam-breaking waves. The structure comprised a six-girder cross section rigidly connected to the external boundaries of the gate, with a width and height of 10.45 m and 1.35 m, respectively. However, due to the size of the experimental setup, the tested models were designed based on Froude similarity, using a geometric ratio of 1:30. An overview of the schematic test configuration is depicted in
Figure 3a, whereas the input data are reported in
Table 1.
The results in terms of the time history of the horizontal and vertical forces acting on the bridge deck are presented in
Figure 4a,b. These results include comparisons with the experimental data and numerical predictions based on a “fine mesh” proposed in [
38]. The proposed model was evaluated with respect to two different geometrical schemes: the “Global Model” (GM), which exactly replicated the geometry of the experimental setup, encompassing the entire wave flume. Additionally, the “Reduced Model” (RM) assumed a smaller portion of the experimental setup near the structure, with appropriate boundary conditions in terms of the inlet speed and height introduced to simulate the advancing dam-break wave. The RM was based on the data obtained by Stoker’s solution, which accurately predicts the wavefront celerity and the wave height behind the wavefront (see [
39] for more details and comparisons). As shown in
Figure 3b, the region to consider in the definition of the geometry of the RM was between 2 or 3 times the length of the bridge cross section. Proper boundary conditions defined by Equation (3) were introduced to take into account the speed and the height, based on solitary wave propagation, to simulate the initial runup of a solitary wave profile through an analytical function [
40]. The results, presented in terms of hydrodynamic horizontal and vertical forces (
Figure 4a,b), were in good agreement with those presented in [
38], which refer to both numerical and experimental data.
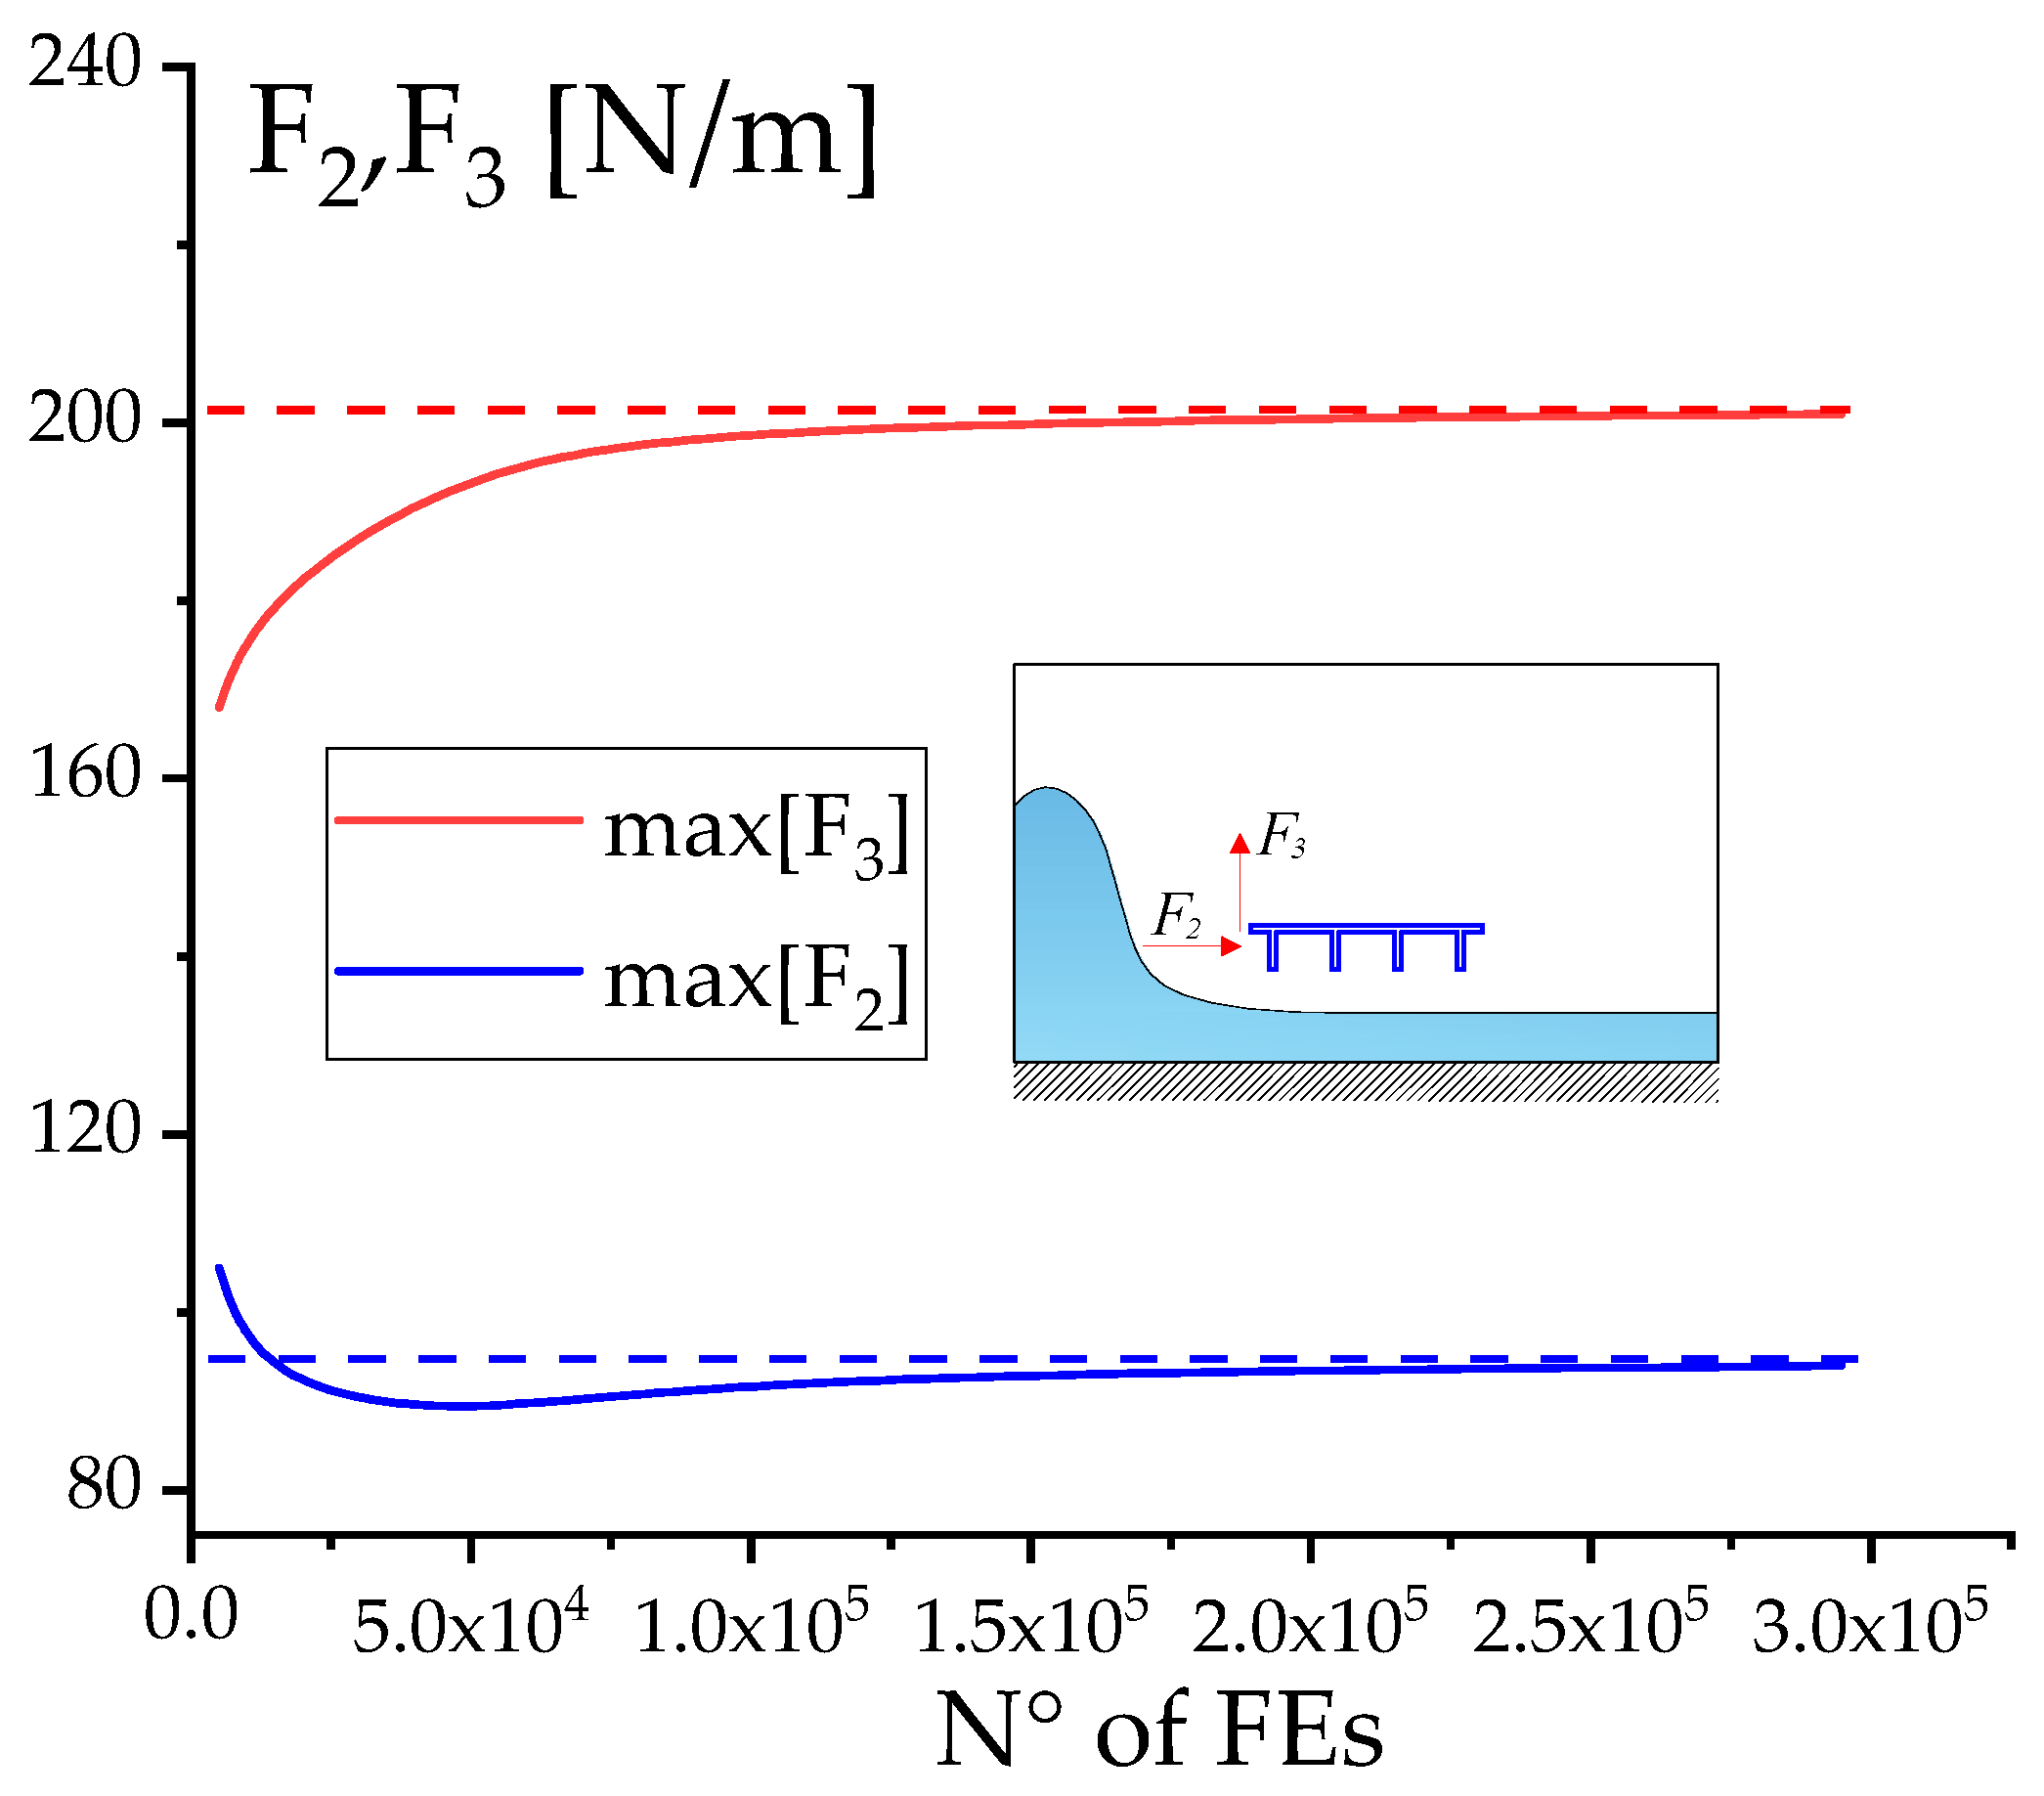
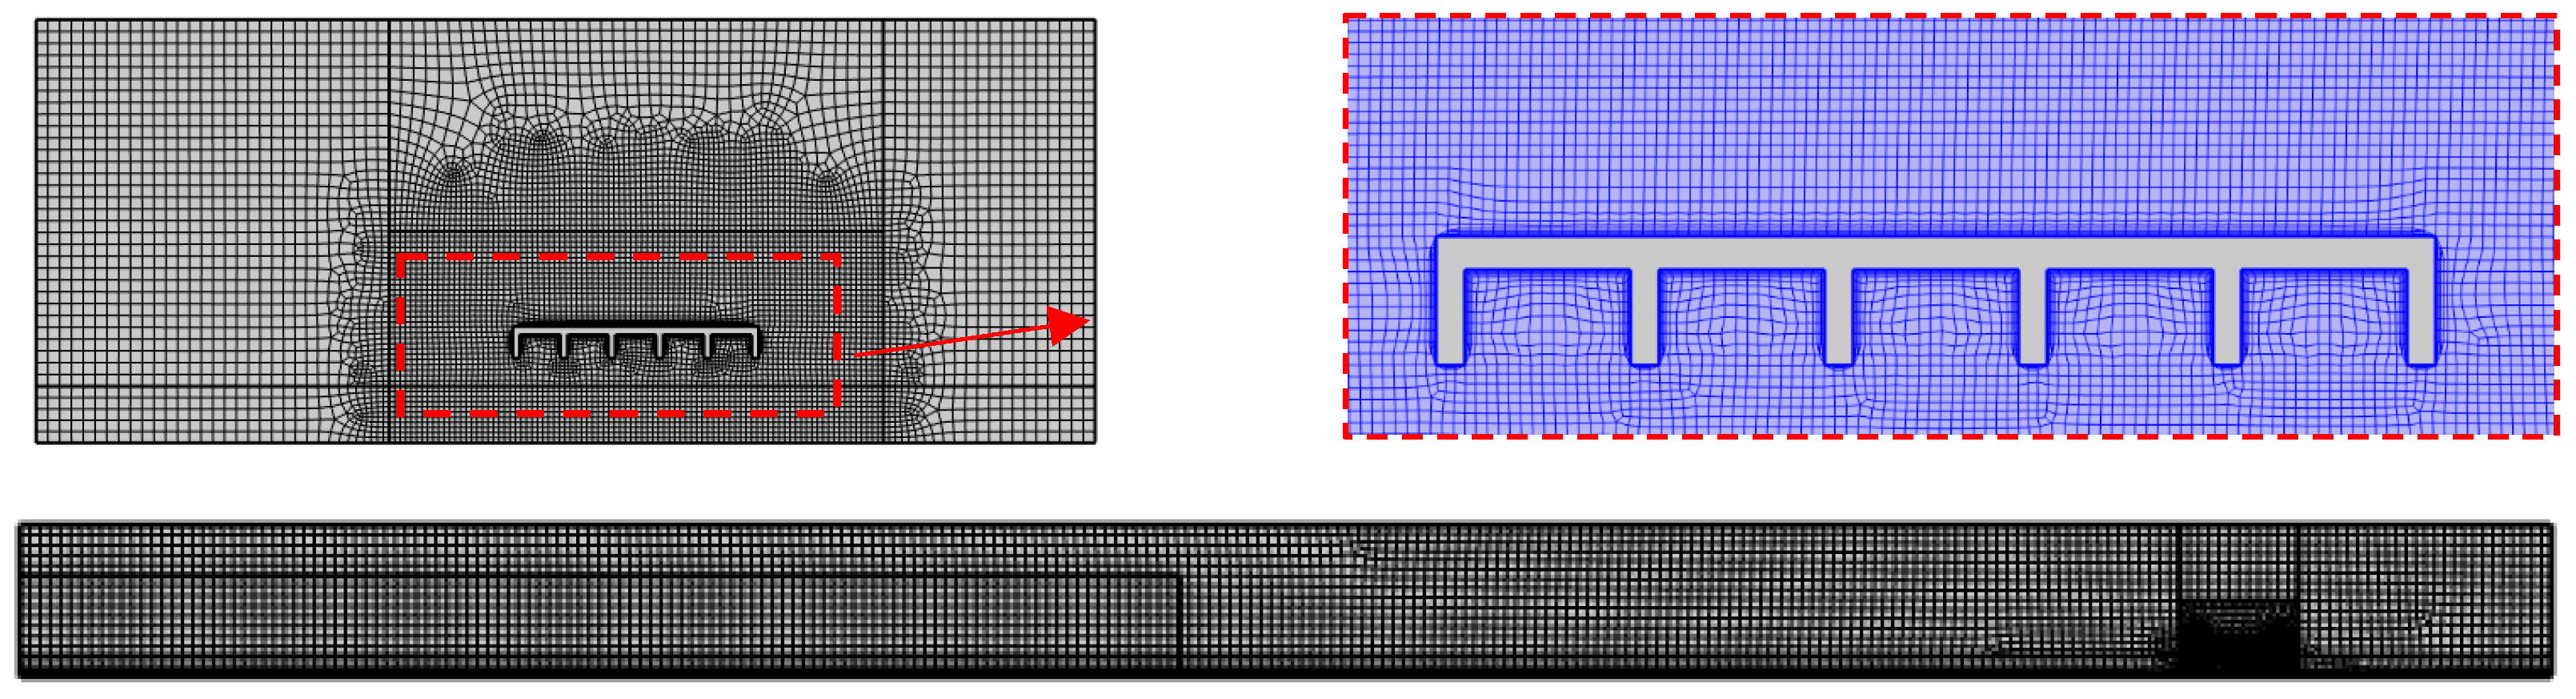
The curves exhibited an oscillatory behavior with large peak values, particularly during the impact phase produced by the impulsive nature of the fluid flow. Subsequently, both the experimental and numerical results presented a regime phase with a stationary behavior. At such a stage, the hydrodynamic forces were much lower than those observed at the impact phase. It is worth noting that both the GM and RM predicted the experimental results with better accuracy than the numerical model proposed in the literature, essentially based on the Finite Volume Method. The RM formulation presented a lower complexity in terms of computational costs with a reduced number of FE compared to GM, i.e., lower than 1/10. In particular, the total number of mesh elements used in the GM and RM were equal to 97,350 and 8100 respectively. A representation of the mesh with details of the discretization around the bridge is reported in
Figure 5, whereas the convergence behavior of the solution is discussed in
Appendix A.
4. Numerical Results: Parametric Analysis
Numerical results were proposed to investigate the dynamic behavior under wave loads for a classical simply supported bridge configuration. In particular, a concrete precast single span I-girder was considered, with its material, geometric, and inertial characteristics reported in
Table 2 and described in
Figure 3. The results are expressed in terms of the following dimensionless parameters, which identify the wave characteristics and the structural properties:
where
and
are the inundation and blockage ratios, respectively,
and
are the heights of the water and the lower chord cross section with respect to the ground, respectively,
is the initial water height,
s is the height of the bridge,
is the flow speed,
g is the gravitational acceleration, and
is the deformability parameter defined as the ratio between height and length of the bridge (
LB).
The results are presented to investigate the effects of the dynamic amplifications produced by bridge vibrations on fundamental design bridge parameters. The basic idea is to evaluate quantitatively the dynamic amplification effects of a generic variable,
X, by means of the following definition:
where
is the static value, and
T is the observation period. In the present study, the static values were determined by introducing design forces provided by the current codes and refined formulations existing in the literature [
10,
41], applied statically in a time-independent analysis. At first, a parametric study was developed in terms of the inundation ratio
taking a fixed normalized fluid flow speed
. In particular, in
Figure 6, the variability of the Dynamic Amplification Factors (DAFs) related to centroid displacements of the midspan cross section is reported for two different values of the inlet fluid flow. The DAFs increased with the inundation ratios except for the downward vertical displacement, which presented a decreasing behavior, mainly produced by the overtopping of the fluid flow on the bridge section.
In
Figure 6, the results show that the vertical displacements, upward and downward, obtained by a static analysis may produce large underestimations of the actual bridge deformability. It is worth noting that the different signs refer to variables evaluated in the vertical direction (3) in the positive (upward) or negative (downward) direction. The DAFs present values much larger than the unity, in the range equal to 1.13–3.4 or 1.61–2.86 for downward or upward vertical directions, respectively. Some values regarding the downward DAFs are not reported because, for small values of the inundation parameter, the overtopping bridge flow is quite insignificant, producing very low vertical displacements. Along the transverse direction, the DAFs are typically close to the unity with a maximum value equal to 1.09.
These results show how the major amplifications are observed along the vertical direction, in which the suggested equivalent static forces are responsible for a general underestimation of the maximum/minimum kinematic variables. Similar results, shown in
Figure 6b, were obtained for the case involving a larger value of inlet speed equal to
U* = 0.7. For these analyses, the observed DAFs may reach the ranges of 1.62–3.93 and 1.54–4.66 for the upward and downward vertical displacements. Moreover, for the horizontal displacements, the DAFs are typically lower than the unity. In
Figure 6, the maximum values of the DAFs, also expressed in terms of the applied forces on the structural systems, produced by the fluid flow along the horizontal and vertical (upward/downward) directions are reported. This quantity identifies the difference between dynamic and static descriptions of the forces, acting on the bridge, produced only by the fluid flow impact. However, this definition differs from the DAFs of bridge variables, i.e., midspan displacements, in which the contributions of the internal stiffness and inertial distribution are considered. From the results reported in
Figure 6, the DAFs of the transverse forces are typically below the unity, whereas larger values are observed along the vertical direction. The trend is in agreement with the DAFs of the kinematic variables, mainly in the transverse and vertical (downward) directions. Contrarily, large differences are observed for the upward direction, mainly produced by the pressure distribution on the cross section extrados due to slamming vertical forces.
The variability of the DAFs was investigated in terms of the inlet speed of the fluid flow. The results are reported in
Figure 7a,b for two different values of inundation ratios, namely
H* = 3 and
H* = 4, respectively. The results show how, as far as the inlet speed tended to grow, the contribution of the hydrodynamic forces increased, leading to lower values of DAFs. However, the DAFs related to the vertical displacements were much larger than the unity, reaching maximum values equal to 2.34 and 3.95 for the downward and upward directions, respectively; for the transverse displacement, the DAFs were affected by a decreasing evolution, leading to values below unity at large inlet speeds. Similarly, the DAFs of the transverse and vertical (uplift) forces reached values close to unity, mostly at high speeds. The results show that the Dynamic Amplification Factors (DAFs) in the horizontal direction were nearly unity for both the displacement and hydrodynamic forces, suggesting that maximum effects can be reliably assessed through static analysis. In contrast, the vertical direction exhibited significantly higher DAF values, both positive and negative, indicating substantial amplifications compared to the static estimates.
Notable dynamic amplifications were observed for the downward vertical forces because of the inertial effects produced by the fluid overtopping phase. It is worth noting that the differences are motivated by the difficulty in evaluating vertical downward forces, specifically in the definition of the effective length of the bridge deck for vertical slamming [
10]. The analysis was extended to evaluate the influence of bridge deformability on the DAFs. In particular, a parametric study was proposed, as shown in
Figure 8a,b, in which the DAFs of midspan displacements are expressed as a function of the normalized bridge height (
s*) for different values of the inlet fluid flow speed. The results indicate that the Dynamic Amplification Factors (DAFs) for horizontal displacements tended to increase as the bridge’s deformability grew. At high inlet speeds, the static solution significantly overestimated the actual response. This phenomenon was not observed at low inlet speeds, where the dynamic amplifications can reach values much greater than unity. These findings align with previous studies, which also reported larger amplifications compared to the static solution at low inlet speeds. For vertical displacements, the DAFs displayed an oscillating behavior relative to the bridge’s stiffness. Upward vertical displacements exhibited greater amplification, with maximum values ranging between 3.0 and 5.0. In all the investigated cases, the DAFs consistently exceeded unity, highlighting notable dynamic amplification effects compared to the static solution.
The impact of the fluid flow was investigated to verify the safety conditions of the bearing system. Most of the studies available from the literature have shown that in the presence of tsunami or flood scenarios, the most vulnerable elements of the bridge are the connections with the substructures since they are affected by large uplift forces, leading to failure mechanisms involving deck overturning. To this end, the time histories of the horizontal and vertical reaction forces were analyzed for a typical fluid flow scenario with varying inlet speeds and inundation ratios. The vertical and horizontal reaction forces were normalized with respect to the corresponding values observed under self-weight loads. It is worth noting that most of the support systems of existing bridges are designed with respect to downward vertical forces since the effect of the self-weight loads is larger than conventional load cases arising from upward accidental loads, namely wind or seismic actions.
Code recommendations have recently introduced specific loading conditions in the presence of tsunami or flood action, including loading scenarios to prevent overturning mechanisms. As a consequence, uplift forces at bridge supports are responsible for dangerous loading conditions, which may produce a superstructure failure mechanism. As shown in
Figure 9a,b, we conducted a parametric study in terms of time histories normalized on the first vertical period of the structure (T1) of the vertical reaction forces normalized on the value observed under permanent loads for several values of the inlet speed and inundation ratios.
The curves present initially positive values mainly produced by the pressure distribution on the intrados area of the section, whose stress resultants were much larger than corresponding ones observed under dead loads. Once the complete inundation was generated, the bridge was affected by negative downward forces whose magnitude was comparable to the permanent loads. It is worth noting that, in ordinary ribbed slab and slab–girder decks, the ratio between accidental (moving) and permanent loads is typically much lower than the unity, below 0.3–0.4 [
42]. As a consequence, the actions produced by tsunami or flood scenarios along vertical downward versus may generate worse load configurations than those assumed for design purposes and related to the traffic loading conditions.
The proposed analysis was extended to quantify the effects produced by the horizontal actions. Typically, the conventional short/medium length bridges in reinforced concrete, precast, or mixed steel/concrete materials are designed with respect to seismic actions, which are responsible for the worst effects on the support system. Depending on the site of construction, the horizontal seismic forces are expressed considering a fraction of peak ground acceleration (PGA) based on the horizontal acceleration response spectrum. However, for ordinary bridge structures, the peak values observed in design elastic acceleration spectra may range between 0.1 and 0.3 g or 0.5 and 0.7 g, under medium or severe seismic actions. As shown in
Figure 10a,b, the time histories of total horizontal support reaction, normalized on the girder weight, were analyzed in terms of the fluid flow characteristics, i.e., the inundation ratio and inlet speed, respectively. This quantity, which dimensionally corresponds to an equivalent acceleration, was determined to check the severity of the fluid flow action with that involved in the presence of a seismic event. The results show that the fluid flow can affect the bridge with large spectra acceleration, which can be considered a “severe” seismic scenario. The largest values were observed during the impact phase, mainly due to the impulsive nature of the external loads. Subsequently, during the time evolution, the evolution of the horizontal reaction forces presented a stationary phase with reduced magnitude.
The study presented in the previous section investigated bridge behavior under flood or tsunami actions, where the superstructure connection was perfectly restrained with fixed, uni-, or multidirectional supports. However, bridges may be isolated or protected seismically by means of elastomeric devices or dampers. In both cases, the seismic forces transferred to bridge substructures are reduced, increasing the flexibility of the structures mainly dominated by the displacements at the moving supports. A parametric study of bearing system stiffness was proposed to assess the influence of the support conditions on bridge behavior in the presence of fluid flow actions. Furthermore, for a fixed value of the inundation parameter, the variability of the bridge kinematics was investigated in terms of the inlet speed. It is worth noting that the stiffness of the bearing system (
KISO), consistent with common design procedures for isolated bridges [
43], was determined in such a way that the representative period of vibration was equal to 2.0 s.
As shown in
Figure 11, the centroid midspan displacements along the vertical and horizontal directions were analyzed in terms of the stiffness support. Moreover, the time histories of the horizontal and vertical displacements for isolated or fixed configurations are shown in
Figure 12. The results show how the stiffness variation mostly affected the transverse displacements, which presented a marked decreasing evolution. The downward or upward displacements were basically unaffected by the support stiffness variability. However, an increment in the inlet speed was responsible for a large bridge deformability, since all the displacements presented increasing values. The time histories of displacements, normalized on the maximum values, presented in
Figure 12, showed marked differences with respect to the fixed configuration. In particular, the curves presented an oscillatory behavior, mostly in the horizontal direction, in which the stiffness reduction was more significant.
In
Figure 13a,b, the variability in the reaction forces at support connections along transverse and vertical directions is shown in terms of the inlet speed and support stiffness ratio normalized with respect to an isolated bridge system. The results are expressed in terms of the min/max values observed during the time histories normalized on the mass deck of the bridge (
Mb). For both directions, i.e., transverse and vertical, the forces in the bridge connections presented a decreasing behavior with respect to the support stiffness. The largest values were observed for the isolated bridge configuration because of the deck deformability, which affected the structure by notable inertial forces. However, similar to the fixed bridge configuration, the magnitude of the reaction forces still remained relevant, especially along the upward vertical direction, since the values were much larger than the self-weight ones, leading to overturning damage mechanisms. In the same figures, the maximum values of the ratio between the reactions arising at the support conditions and the applied forces are also reported in terms of the bearing stiffness. This quantity may be considered as a measure of the dynamic inertial forces involved in the analysis. For the isolated bridge configuration, the action on the bearing system differed from the applied forces due to the fluid flow, since relevant dynamic amplification effects were observed. Conversely, for the fixed bridge configuration, the forces at the supports tended to coincide globally with the external ones.


