Article

Experimental Investigation on Wave and Bed Profile Evolution in a Sandbar-Lagoon Coast with Submerged Vegetation

1
Department of Hydraulic Engineering, School of Civil Engineering, Tongji University, Shanghai 200092, China
2
The Eighth Geological Brigade, Hebei Geological and Mineral Exploration Development Bureau, Qinhuangdao 066001, China
3
The Lyell Centre for Earth and Marine Science and Technology, Institute for Infrastructure and Environment, Heriot-Watt University, Edinburgh EH14 4AS, UK
*
Authors to whom correspondence should be addressed.
These authors contributed equally to this work.
J. Mar. Sci. Eng. 2024, 12(12), 2126; https://doi.org/10.3390/jmse12122126
Submission received: 29 October 2024 / Revised: 18 November 2024 / Accepted: 18 November 2024 / Published: 21 November 2024
(This article belongs to the Section Coastal Engineering)

Abstract

:
Better understanding of the hydro- and morphodynamic processes within vegetated sandbar-lagoon coasts is important for assessing the coastal protection capability of vegetation meadow for the coastal environments. Eighteen flume tests were conducted in a mobile-bed sandbar-lagoon with mimicked submerged vegetation under different water depths and wave conditions. It was found that wave attenuation by submerged vegetation near the breaking point is significant. An empirical linear expression for the total wave energy change ratio is proposed with a determination coefficient of 0.84. Moreover, the quantitative formulae for the erosion volume and maximum erosion thickness of sandbars and foredunes, as well as the total sediment transport volume, were proposed to demonstrate the implications of submerged vegetation meadows. These findings provide scientific references for coastal management and conservation planning, especially for sandbar-lagoon coasts. Nevertheless, additional physical experiments or field data are necessary to further validate those formulae.

1. Introduction

Coastal zones account for a major part of the value of the world’s ecosystem services and natural capital [1]. Among these, 13% of the coastlines are lagoon coasts, which have become severely degraded and highly vulnerable due to the impacts of human activities and climate change [2,3]. The conservation and restoration of these coastal ecosystems are of immediate urgency. Unlike hard engineering structures, besides protecting the coast, vegetation plays an essential role in ecological balance and economic benefits [4]. Despite this, there is a lack of understanding of the habitat contributions to the restoration of coastal ecosystems under dynamic geomorphological changes. The mechanisms through which vegetation interacts with coastal geomorphodynamics is crucially important for evaluating the role of vegetation in coastal ecosystems.
The interplay between vegetation and wave dynamics and morphodynamics is pivotal in wave attenuation and coastal erosion. Within the context of physical model experiments, the morphological traits of different plant species can be effectively mimicked using materials such as wooden or plastic rods [5]. According to Zhu and Zou’s [6] and Zhu et al.’s [7] generalized analytical solution and Chen and Zou’s [8] coupled OpenFOAM hydrodynamics model with an immersed element model of flexible vegetation, vegetation density, height, leaf length, submergence, and flexibility significantly influence the vegetation attenuation of wave energy. Concurrently, forcing factors such as wave action, tidal currents, and water depth are all important to the complex dynamics of vegetation–wave interactions [9,10,11,12,13]. Simple mathematical relationships for wave attenuation were also proposed including wave damping [14,15,16] and transmission models [17] for different vegetation types. Most existing studies focused only on flat or sloping bed and did not clearly describe the wave propagation characteristics at a specific coast system, especially vegetated sandbar-lagoon coasts.
The past sediment transport studies have focused on sediment concentration and resuspension properties [18,19,20,21,22,23,24], bed erosion and deposition patterns [25,26,27,28,29], and regional morphodynamic evolutions [30,31,32,33,34]. It is well accepted that vegetation plays an important role in reducing erosion and facilitating deposition. However, some observations [35,36,37] demonstrated that emergent vegetation can exacerbate coastal erosion under severe wave conditions due to plant uprooting, discontinuities in the erosion and accretion patterns along the dune slope, and enhanced water penetration into the sediment bed by vegetation. This is against the traditional perceptions that people have held about vegetation. Regarding submerged vegetation, the authors have not yet found reports on whether extreme wave conditions could lead to the uprooting of plants on the nearshore side, ultimately contributing to increased erosion. However, the aforementioned research indicates that the flow-vegetation remains a hot topic. Additionally, the evolution of artificial sandbars, submerged berms, and sandbar-beach-dune systems has recently attracted considerable attention owing to their complexity and significance [38,39,40,41,42,43,44,45,46]. Furthermore, much efforts have been dedicated to the bed profile evolution influenced by vegetation [47,48,49,50,51,52,53]. Nevertheless, the cross-shore beach profile evolution as shaped by in sandbar-lagoon vegetation is not well understood and the quantitative analysis of the associated sediment transport is not well established.
To better protect and restore the sandbar-lagoon coasts, we have conducted a series of experimental studies on wave propagation and bed profile changes in a typical sandbar-lagoon coast with different types of vegetation [54,55]. This study aimed to develop mathematical expressions for wave attenuation and cross-shore profile evolution influenced by mimicking submerged vegetation under varying water depths and irregular wave conditions. Given the expressions proposed in this study still have a certain level of applicability, it can be improved with additional physical experiments or field data.

2. Methodology

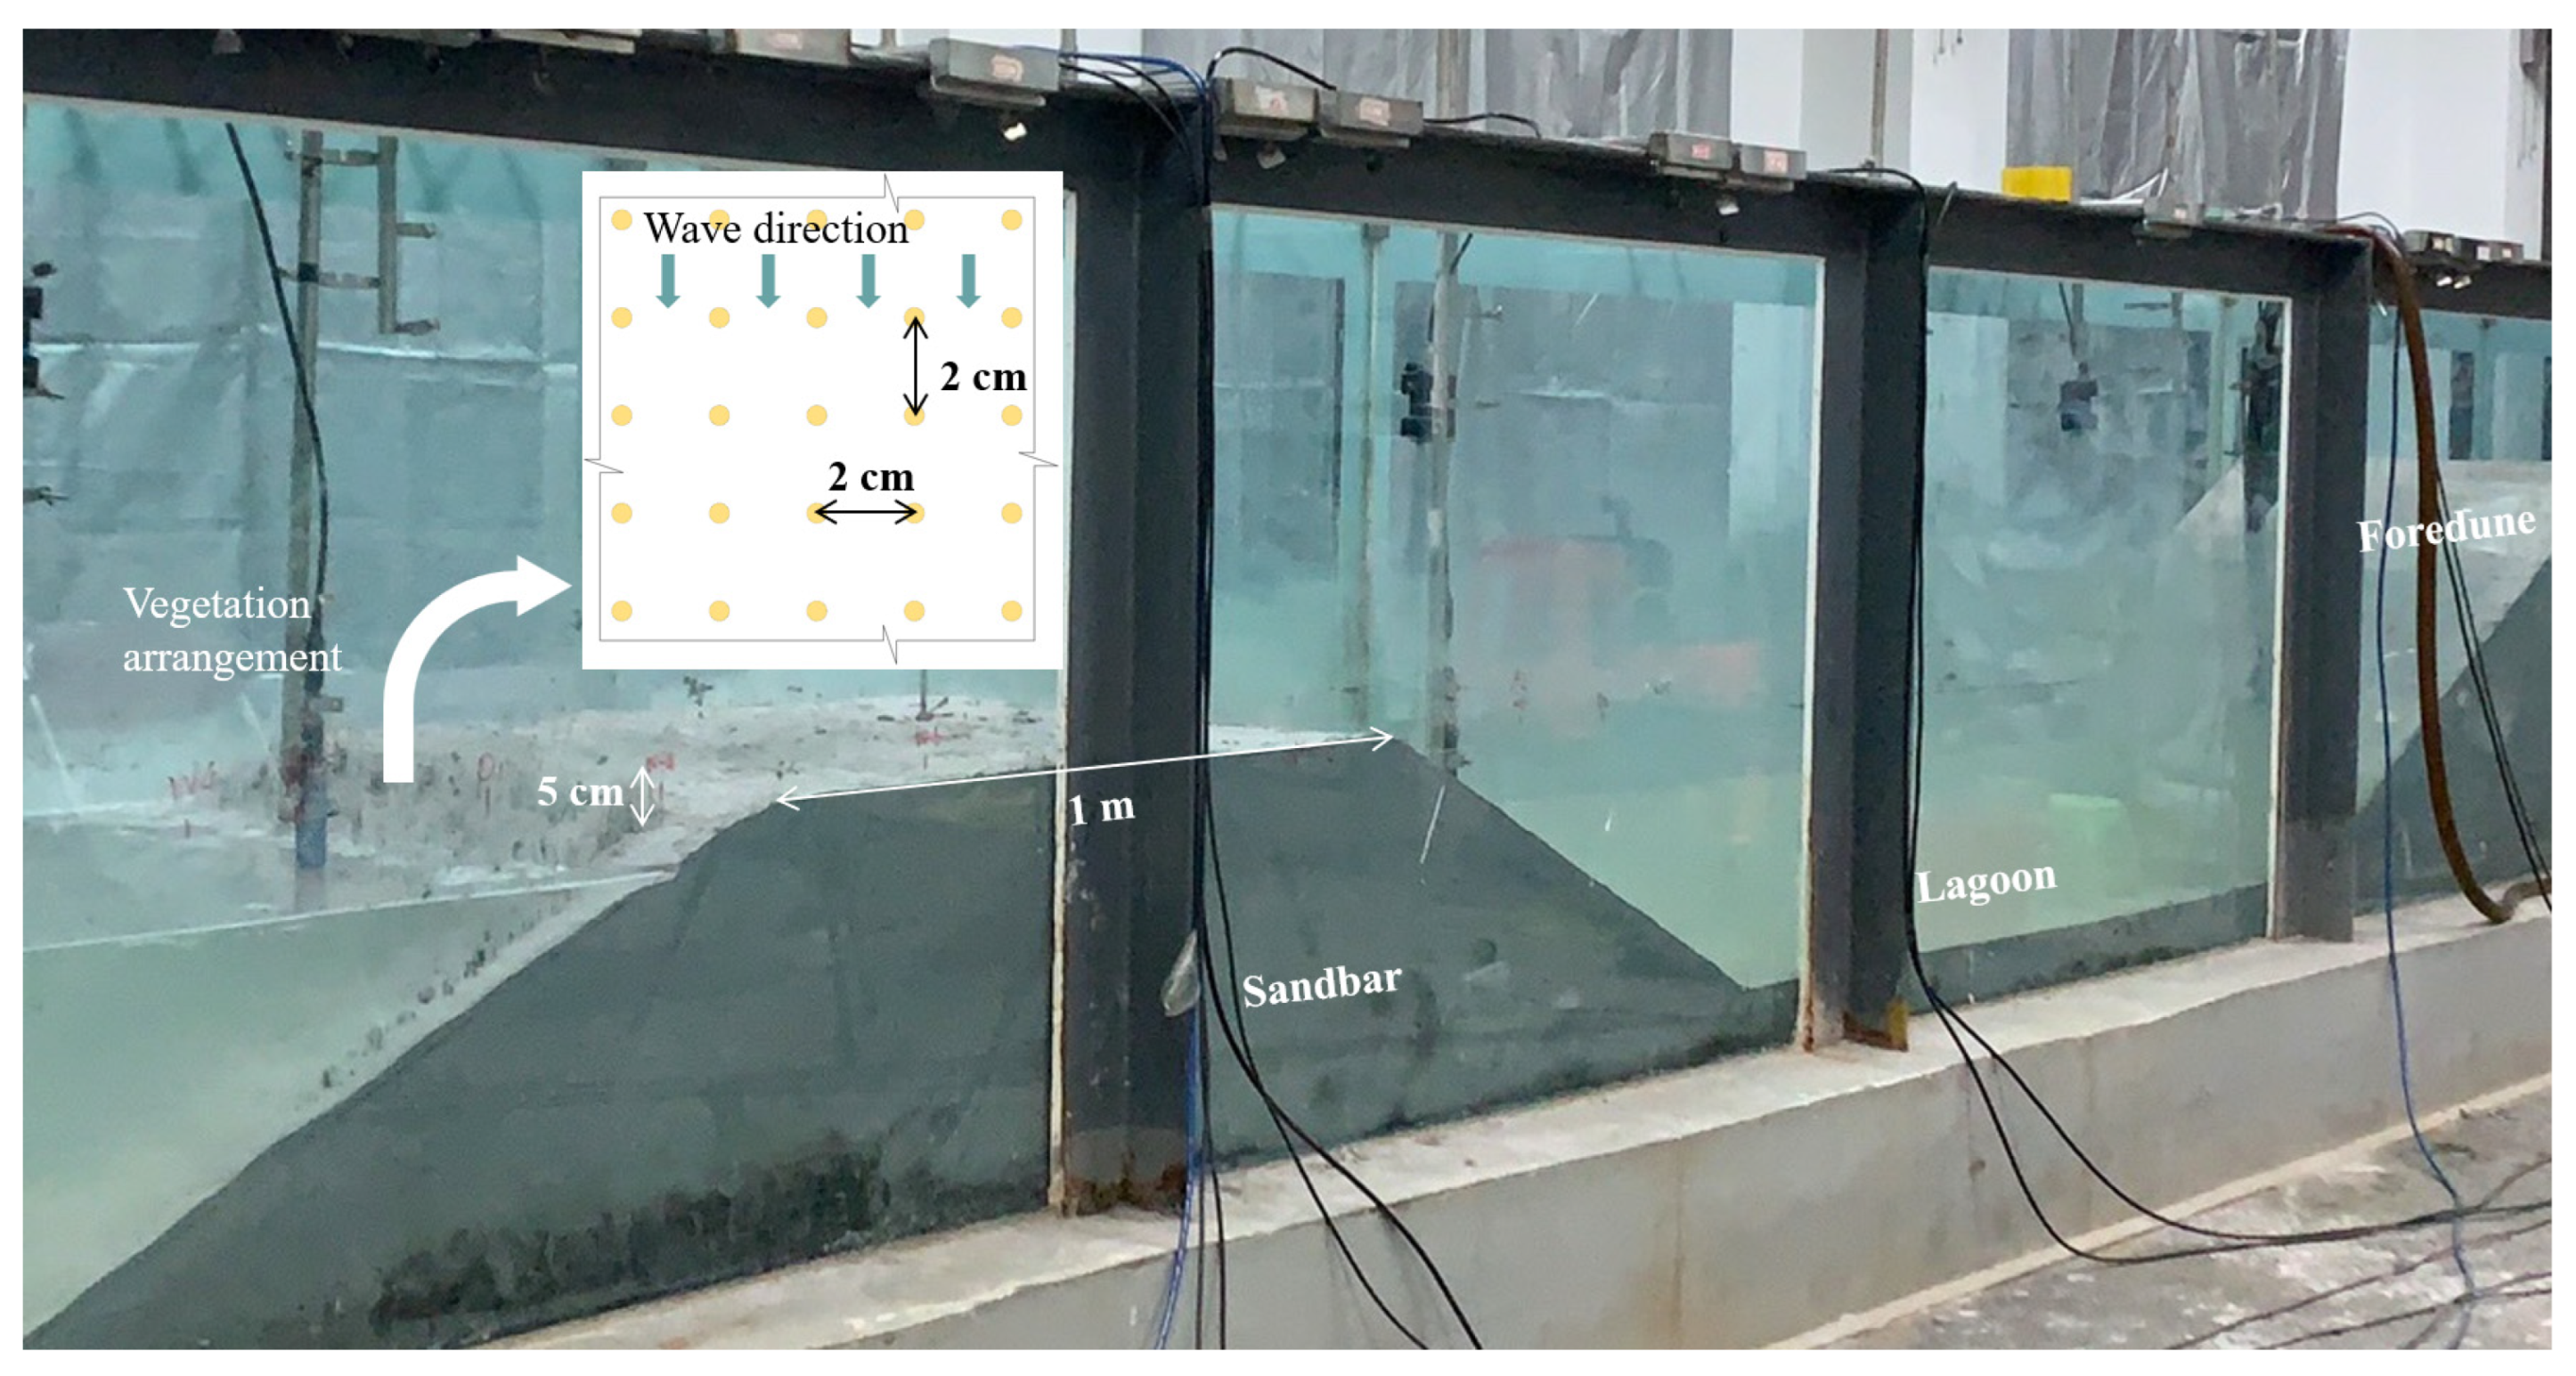
2.1. Experimental Setup

The experiment employing a mobile-bed model, was conducted in the wave flume (50 m long, 0.8 m wide, and 1.2 m high) at the Laboratory of Hydraulic and Harbor Engineering of Tongji University. The existing material in the laboratory included lightweight resin sand with a median particle size of 0.15–0.18 mm and a density of 1.40–1.45 g/cm3. The principles of hydrodynamic similarity, sediment incipient similarity, and settling similarity—specifically, the maintenance of equal Froude, Shields, and Rouse numbers—were applied, with consideration given to a local similarity approach [56,57]. Based on the measured data of waves and sediments near Qilihai lagoon, along with the equipment conditions of the wave flume, a series of dimensional analyses yielded the scale relationships (further details were provided in Cong et al. [54]). The length scale, relative density scale, particle size scale, and settling velocity scale must satisfy the relationships as shown in Equations (1) and (2) below, ultimately determining an experimental scale of 1:10.
λ l 0.48 λ D 0.48 = λ s 1 λ D 0.66 λ s 1 0.22 = 1
λ ω = λ l 0.24 λ D 0.26
where λl, λs−1, λD, and λω are the scales (dimensionless) of the length, the relative density, the particle size, and the sediment settling velocity, respectively.
The experimental setup is shown in Figure 1. The sandbar crest has a length of 1 m along the direction of wave propagation and a fixed height of 0.48 m. The lagoon has a substrate thickness of 0.10 m. All slopes were set to 0.5, and the landward side of the coastal foredune was supported by a 0.8 m high polypropylene (PP) board. Wave data were obtained from seven capacitance-type wave gauges (W1–W7) and four acoustic wave gauges (Wa–Wd). Before the measurement, it was necessary to zero the instruments (with the still water surface as the zero reference), and the sampling frequency was set to 50 Hz for all samples. The specific locations of the wave gauges are indicated in Figure 1. The experimental process was recorded by 3 digital single-lens reflex cameras positioned near the sandbar, lagoon, and coastal foredune, respectively. The vegetation was arranged in the area of the fore slope of the sandbar, 0.68 m horizontally outward from the sea-side margin of the sandbar crest. During the data processing, the following coordinate system was used: the horizontal coordinate x takes the position of W1 as the zero reference, and the vertical coordinate z takes the bottom of the flume as the zero reference (Figure 1). The actual bed morphology in the flume is shown in Figure 2.
Based on the dominant seagrass species in China’s temperate marine regions, Zostera spp. [58], and taking into account the observed distribution densities (12–617 shoots/m2) and growth heights (218–1105 mm) of diverse Zostera spp. in the Changshan Islands, Dalian [59], the experimental design for simulated submerged vegetation was formulated. Combining this with the model scale at 1:10, the vegetation was arranged with a density of 2500 shoots/m2 and a spacing of 2 cm between each plant in an idealized rectangular configuration (Figure 2). The model was constructed from optical fibers, rubber sleeves, and plexiglass tubes. They were fixedly inserted into a prefabricated polypropylene board at the base of the sandbar fore slope. After being buried in sand, only the optical fiber part was exposed. The simulated leaf (optical fiber) had a diameter of 0.50 mm with an exposed length of 5 cm. Every eight optical fibers were bundled together through a rubber sleeve to form one plant fixed within a plexiglass tube. Since the plastic board was horizontally placed beneath the fore slope of the sandbar, the thickness of the sand layer on the board varied. Therefore, plants with different lengths of plexiglass tubes were designed according to the thickness of the sand layer.
The experiment designed five incident wave heights (irregular waves generated by the JONSWAP spectrum; unless otherwise specified, the wave heights mentioned in this paper refer to the significant wave heights), considered two water depth conditions, and conducted tests under scenarios with and without submerged vegetation. A water depth of 0.48 m corresponds to the scenario where the sandbar is level with the still water surface, while a water depth of 0.55 m corresponds to the scenario where the sandbar is submerged. The specific test conditions are shown in Table 1.

2.2. Data Processing

According to the physical experiment scale of 1:25, Zhu et al. [60] set the low and high cutoff frequencies to 0.02 Hz and 0.20 Hz, respectively, corresponding to natural frequencies of 0.004 Hz and 0.04 Hz. In this study, based on the length scale of 1:10 and the prototype high cutoff frequency of 0.05 Hz, the wave surface was separated into two parts: long waves (LW, infragravity waves, where the frequency f < 0.16 Hz) and short waves (SW, sea-swell waves, where f ≥ 0.16 Hz). The detailed calculations are based on the spectral analysis method, as follows in Equations (3) and (4).
H LW = 4 0 0.16 S f d f
H SW = 4 0.16 S f d f
where HLW represents the long-wave height (cm); HSW represents the short-wave height (cm); and Sf denotes the wave energy density (cm2/Hz) obtained through the fast Fourier transform method. The total wave energy ET is defined as the area (cm2) enclosed by the spectral and coordinate axes.
The wave reflection coefficient can be determined using the separation technique proposed by Goda and Suzuki [61]. Based on the wave time series data at the positions of wave gauges W2 and W3, the amplitudes ai (m) of each incident wave component and the amplitudes ar (m) of each reflected wave component can be obtained separately. The wave reflection coefficient Kr can then be calculated using Equation (5).
K r = m = 1 M a r 2 m / m = 1 M a i 2 m 1 / 2
where M represents half of the total number of sampling points (dimensionless); m is the serial number (dimensionless).
The wave height change ratios are all based on the positions of W7 or Wa, and the wave height change ratio can be expressed as ksv = (HvHnv)/Hnv, where Hv and Hnv are the wave heights with and without vegetation, respectively. Similarly, the wave energy change ratio can be expressed as ke = (EvEnv)/Env, where Ev and Env are the total wave energies with and without vegetation, respectively. Wave propagation characteristics are analyzed by incorporating 8192 sampling points of water surface elevation. The final bed profile data are obtained from the video at the corresponding time of 163.84 s (8192 × 0.02 s, where 0.02 s is the sampling time interval). Upon analyzing the extracted profile data to investigate sediment transport variations across different sub-sections of the sandbar-lagoon coast, the entire bed profile is divided into three distinct regions, corresponding to the following horizontal coordinate ranges: sandbar (x = 6.88–9.60 m), lagoon (x = 9.60–11.44 m), and foredune (x = 11.44–12.74 m). The erosion and deposition characteristic values for each region also employ a change ratio calculation method, which is consistent with that used for wave height or wave energy change ratios.
The bed profile changes and sediment transport calculations are obtained through image pixel analysis methods. Initially, contour morphology images corresponding to characteristic moments in the video are captured and corrected, followed by the use of a single-pixel red point to delineate the profile contour of the sandbar-lagoon coast in each image. MATLAB R2023a is then utilized to extract the coordinates of the red single-pixel points, converting pixel coordinates into an actual coordinate system, thereby ascertaining the characteristics of the bed profile change. By calculating the area enclosed by the profile morphology and its initial state, the variation characteristics of the unit width sediment transport volume can be derived. The detailed processing and code can be found in the recently published article by Kuang et al. [55]. It should be noted that both erosion and deposition volumes are positive, while sediment transport volumes can be either positive or negative: a positive value indicates deposition and a negative value indicates erosion. The shoreline receding distance is the horizontal difference between the intersection points of the still water level with the final foredune morphology in scenarios with and without vegetation.

3. Results

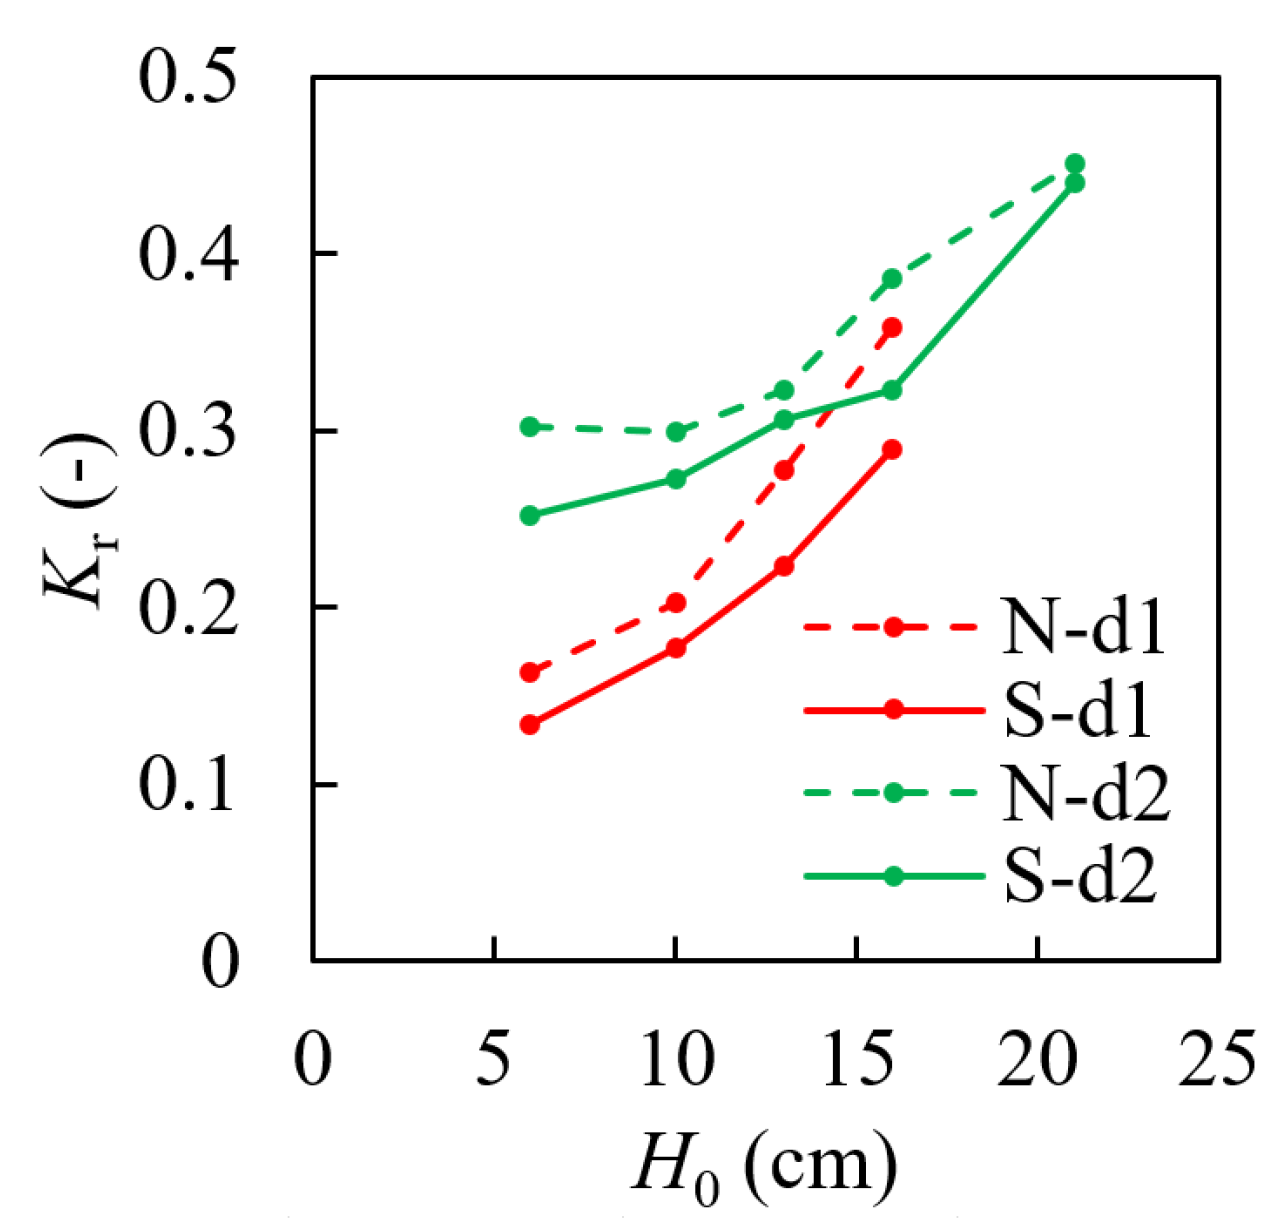
3.1. Wave Propagation
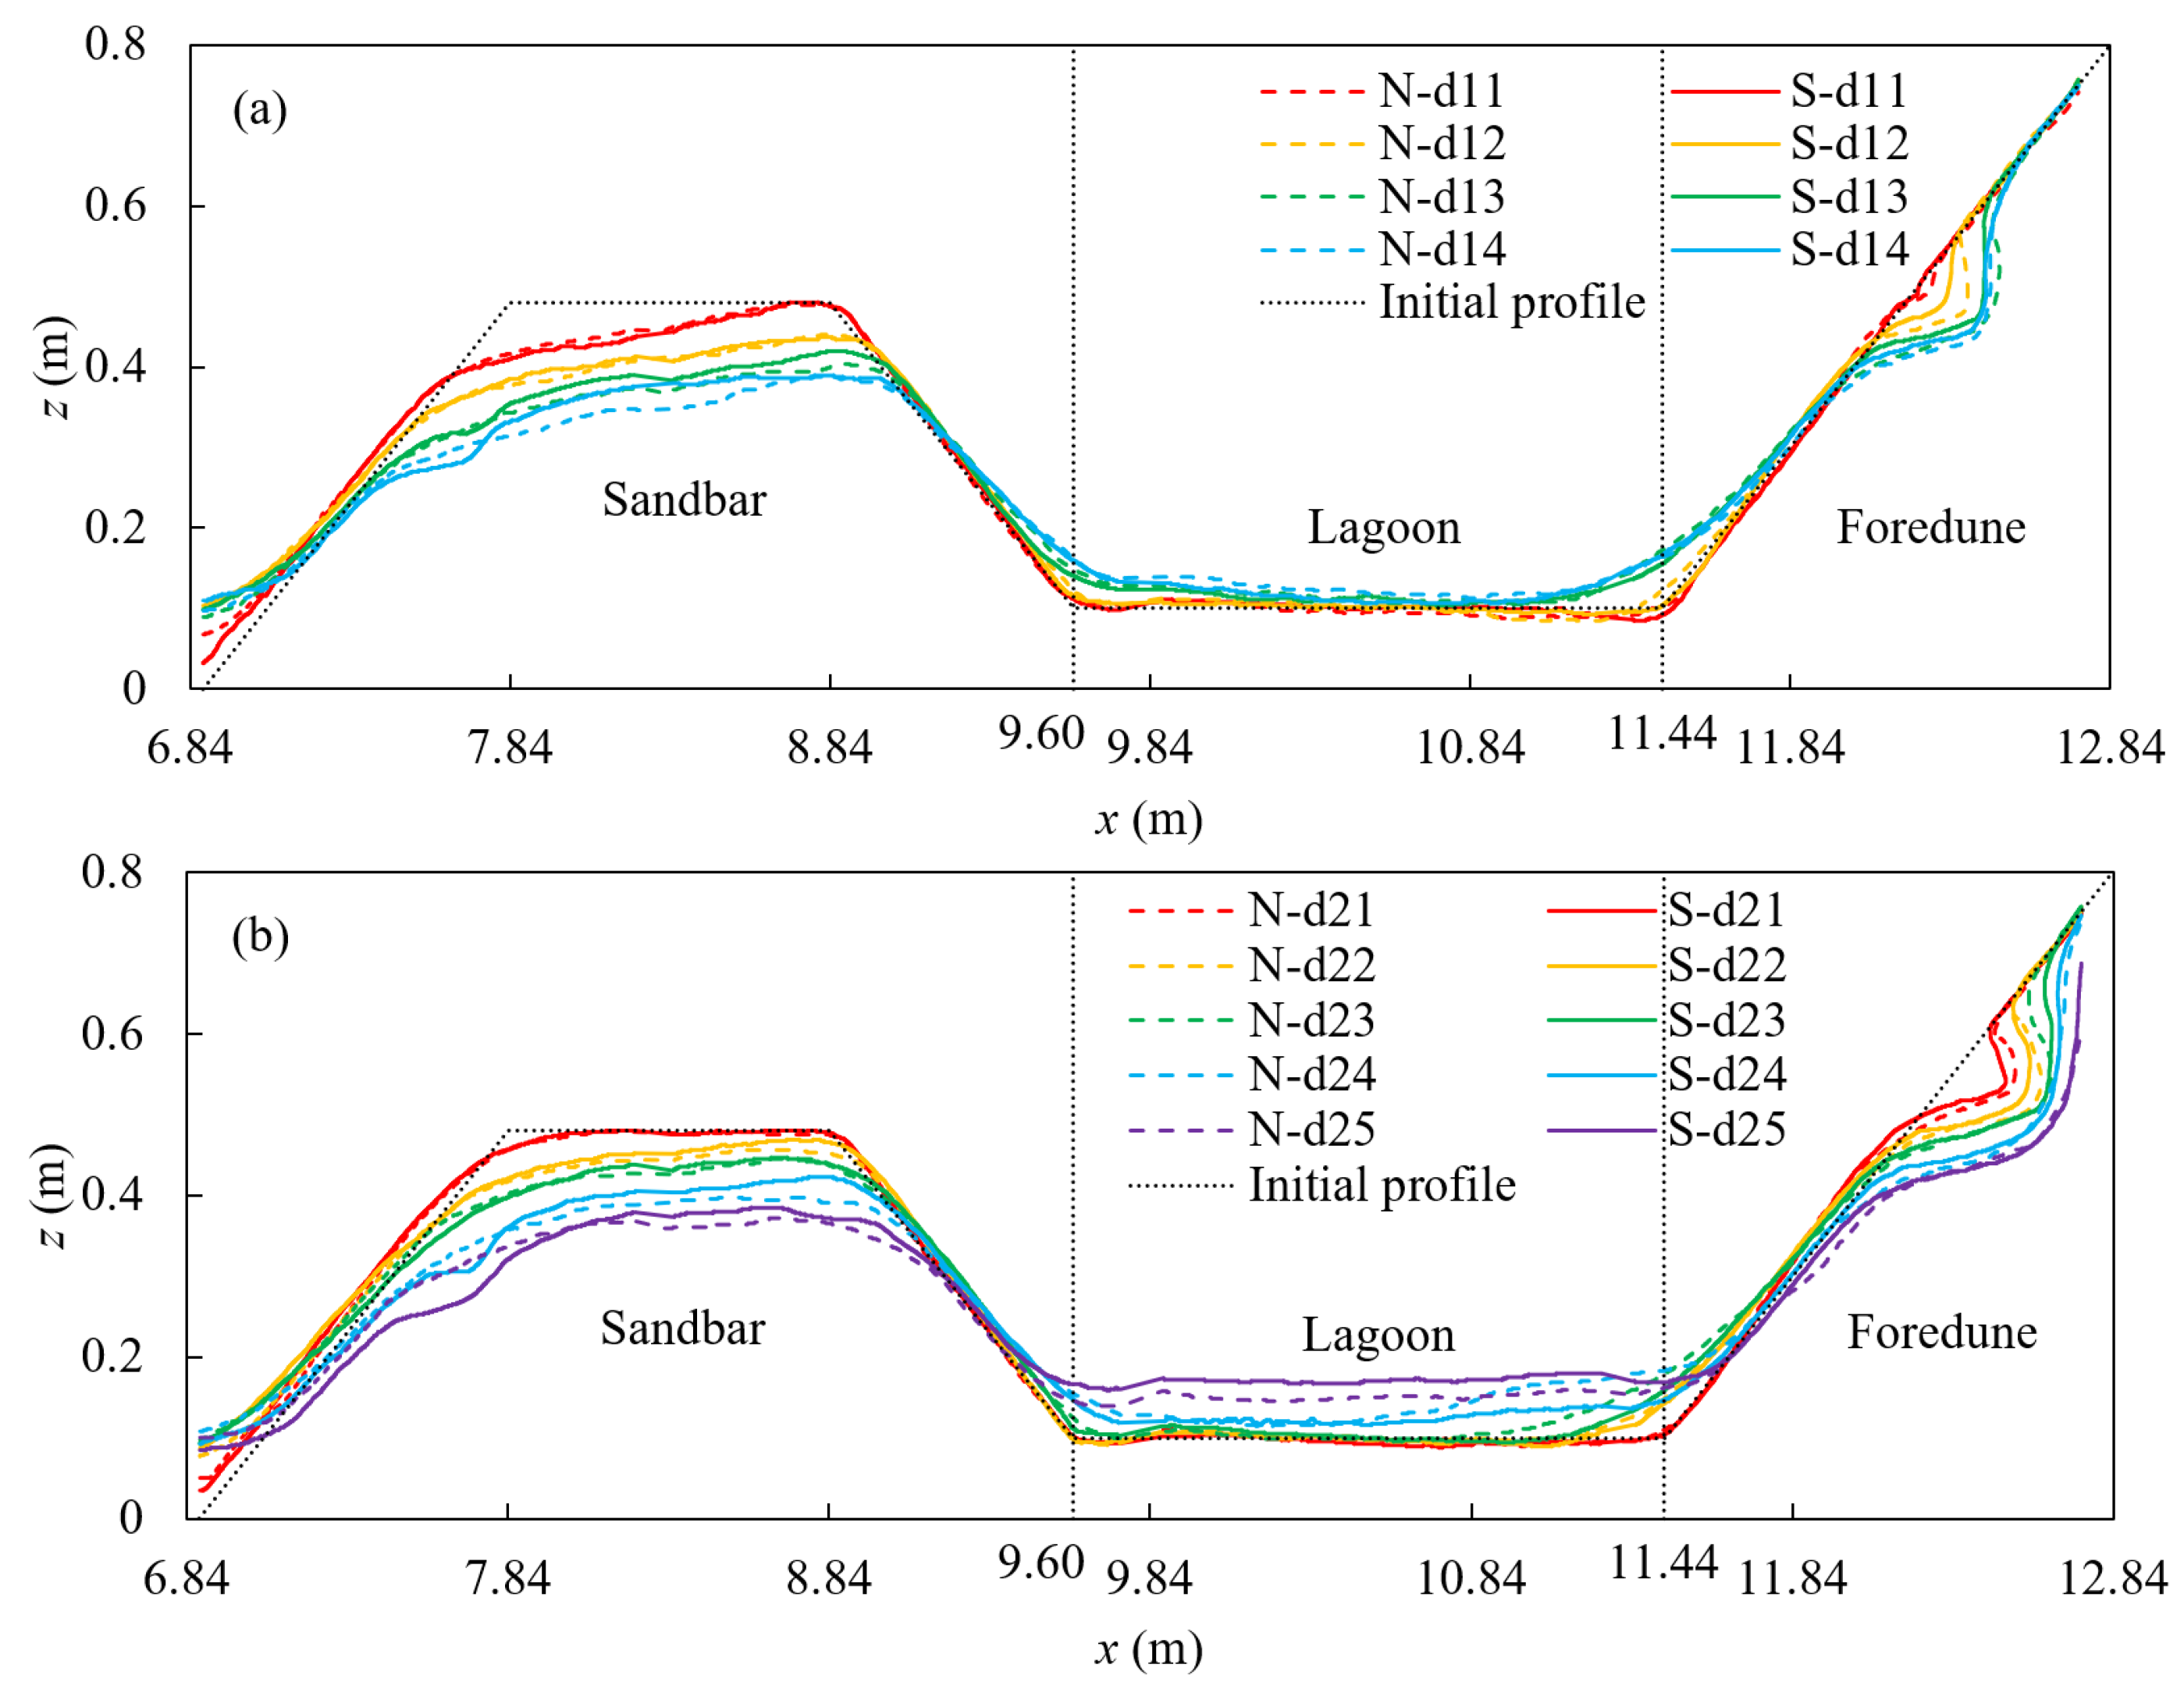
The characteristics of wave propagation along the flume are shown in Figure 3, which generally exhibit the following trends: the fore slope of the sandbar first slightly decreases, then increases to a peak value at the top of the sandbar, followed by a sharp decrease, and then slightly increases again near the foredune. Table 2 presents the quantitative changes in wave propagation based on the positions of Wa and W7.
For short-wave heights, the amplitude of the increases in short-wave heights on the fore slope of the sandbar significantly decreases after planting submerged vegetation. Taking the data at position Wa as a reference, the wave height attenuation ratio (the absolute value of the wave height change ratios) caused by vegetation has an average of 9.27% at the water depth (d) of 0.48 m (Figure 3a and Table 2) and 7.15% at d = 0.55 m (Figure 3b and Table 2). After the wave passes the sandbar, vegetation also significantly weakens the wave height. Using the data at position W7 as a reference, the average wave height attenuation ratio caused by vegetation is 25.81% at d = 0.48 m (Figure 3a and Table 2) and 6.58% at d = 0.55 m (Figure 3b and Table 2). When the sandbar crest is level with the still water surface (d = 0.48 m), the attenuation effect of vegetation on wave heights behind the sandbar is pronounced. Overall, submerged vegetation not only weakens the short-wave heights near the wave breaking point but also plays a role in attenuating the wave heights behind the sandbar.
As shown in Figure 3, long wave (infragravity wave) was amplified by sandbar in this paper. This result is consistent with the bispectral analysis results in Figure 5 of Zou and Peng [62] which demonstrated that nonlinear difference interactions increase over the top crest of low crested structure such as sandbar and then are further enhanced over the rear slope after that. Submerged vegetation causes an average long wave height attenuation ratio of 32.69% near the breaking point (Wa) at d = 0.48 m (Figure 3c and Table 2) and 18.94% at d = 0.55 m (Figure 3d and Table 2). The attenuation ratios vary significantly with different incident wave heights. The influence of vegetation on the wave height behind the sandbar (W7) is particularly significant when the sandbar is submerged (d = 0.55 m), with an average wave height attenuation ratio of 10.63%. However, when the still water depth is level with the sandbar crest (d = 0.48 m), the vegetation-induced wave attenuation is less stable due to the occurrence of an abnormally large value (Figure 3c, S-d11).
The analysis above indicates that when the sandbar crest is level with the still water level (d = 0.48 m; Figure 3a,c,e), as shown in Table 2, submerged vegetation has a better attenuating effect on short waves behind the sandbar (25.81%) and long waves on the fore slope of the sandbar (32.69%). When the sandbar is submerged (d = 0.55 m; Figure 3b,d,f), the attenuating effect of submerged vegetation on long waves on the fore slope of the sandbar (18.94%) is notably significant. Figure 3e,f display the changes in total wave energy along the flume, which includes both high- and low-frequency components. After the installation of submerged vegetation, there is a varying degree of attenuation in the total wave energy near the breaking point and behind the sandbar, with a larger attenuation of the total wave energy near the breaking point on the fore slope. Overall, the submerged vegetation-indued attenuation in wave energy near the breaking point is more pronounced than that behind the sandbar, mainly reflected in the attenuation ratio of long waves (Table 2). The attenuation ratio increases as the incident wave height increases and decreases slightly with an increase in water depth.
Figure 4 presents the wave reflection coefficients for various conditions, showing that the reflection coefficients when the sandbar is submerged (green line; d = 0.55 m) are generally higher than those when the sandbar crest is level with the still water level (red line; d = 0.48 m) under the same incident wave height conditions. The presence of submerged vegetation significantly reduces the wave reflection coefficients, with an average reduction percentage of 17.34% at d = 0.48 m and 9.90% at d = 0.55 m.

3.2. Bed Profiles

Figure 5 illustrates the characteristic changes in the longitudinal profiles of the sandbar, lagoon, and foredune. It is evident that the sandbar crest experienced substantial erosion, the lagoon exhibited a trend of sediment deposition, and the foredune featured the formation of steep scarps due to a wave attack. Under the same conditions, when the wave height is larger, there is more erosion at the sandbar, more deposition within the lagoon, and a greater vertical erosion thickness of the scarp. Submerged vegetation generally reduces erosion of the sandbar, deposition within the lagoon, and the erosion thickness of the scarp. However, at the sea-side shoulder of the sandbar, a strong scouring area appears when submerged vegetation is installed, especially when the incident wave height is large. With increasing erosion, the plexiglass tubes under the mimicked vegetation are exposed, causing a local strong flow turbulence phenomenon. As the exposed height increases, the sway amplitude of the plexiglass tubes with the waves increases, making it easier for incipient sediment motion. The gradually exposed landward plexiglass tubes act similarly to the seaward emergent vegetation discussed by Cong et al. [54], where significant erosion is observed at sites with vigorous vegetation motion. The difference is in the location where erosion increases; in this paper, it is the onshore edge of the submerged vegetation, while in the reference literature, it is the offshore edge of the emergent vegetation.
Notably, when the sandbar is submerged (d = 0.55 m), and the incident wave height reaches an extreme storm wave (H0 = 0.21 m, S-d25), the presence of submerged vegetation causes severe erosion on the seaward side of the sandbar and significantly increases the thickness of deposition within the lagoon. This indicates that the existence of submerged vegetation at this time results in a substantial amount of the sediment being transported from the seaward side of the sandbar into the lagoon. The wave propagation characteristics mentioned earlier also highlight the peculiarity of this situation, where the reduction in the reflection coefficient is not significant (Figure 4), and the wave height attenuation at the fore slope of the sandbar (Wa) also deviates from the overall trend (Table 2). This coincidence suggests that the wave energy is consumed in the kinetic energy required to transport some of the sediment into the lagoon. Therefore, in practical engineering applications, the role of submerged vegetation under extreme storm wave conditions is worthy of in-depth research and attention.
Figure 6 presents the shoreline receding distance (Dsr), maximum deposition (Tss) and erosion thickness (Tes) of the sandbar, the maximum deposition (Tsd) and erosion thickness (Ted) of the foredune, and the maximum deposition thickness within the lagoon (Tsl) under conditions with and without vegetation. Table 3, on the other hand, displays the change ratios of various erosion and deposition characteristic values. The ratios for the shoreline receding distance, maximum erosion thickness of the sandbar and foredune, and maximum deposition thickness of the lagoon and foredune are mostly negative, with the maximum deposition thickness of the sandbar being mostly positive. This indicates that submerged vegetation reduces the shoreline receding distance, maximum erosion thickness of the sandbar and foredune, and maximum deposition thickness of the lagoon and foredune, with a pronounced reduction ratio when the sandbar is level with the water level still (d = 0.48 m) (except for the maximum erosion thickness of the sandbar); only the maximum deposition thickness of the sandbar (at the toe of the sandbar fore slope) increases due to the influence of vegetation (change ratios are basically positive), suggesting that submerged vegetation has the function of promoting local deposition in the sandbar area. It is worth noting that under extreme storm wave conditions (S-d25), consistent with the introduction above, vegetation causes a significant increase in the deposition volume within the lagoon.

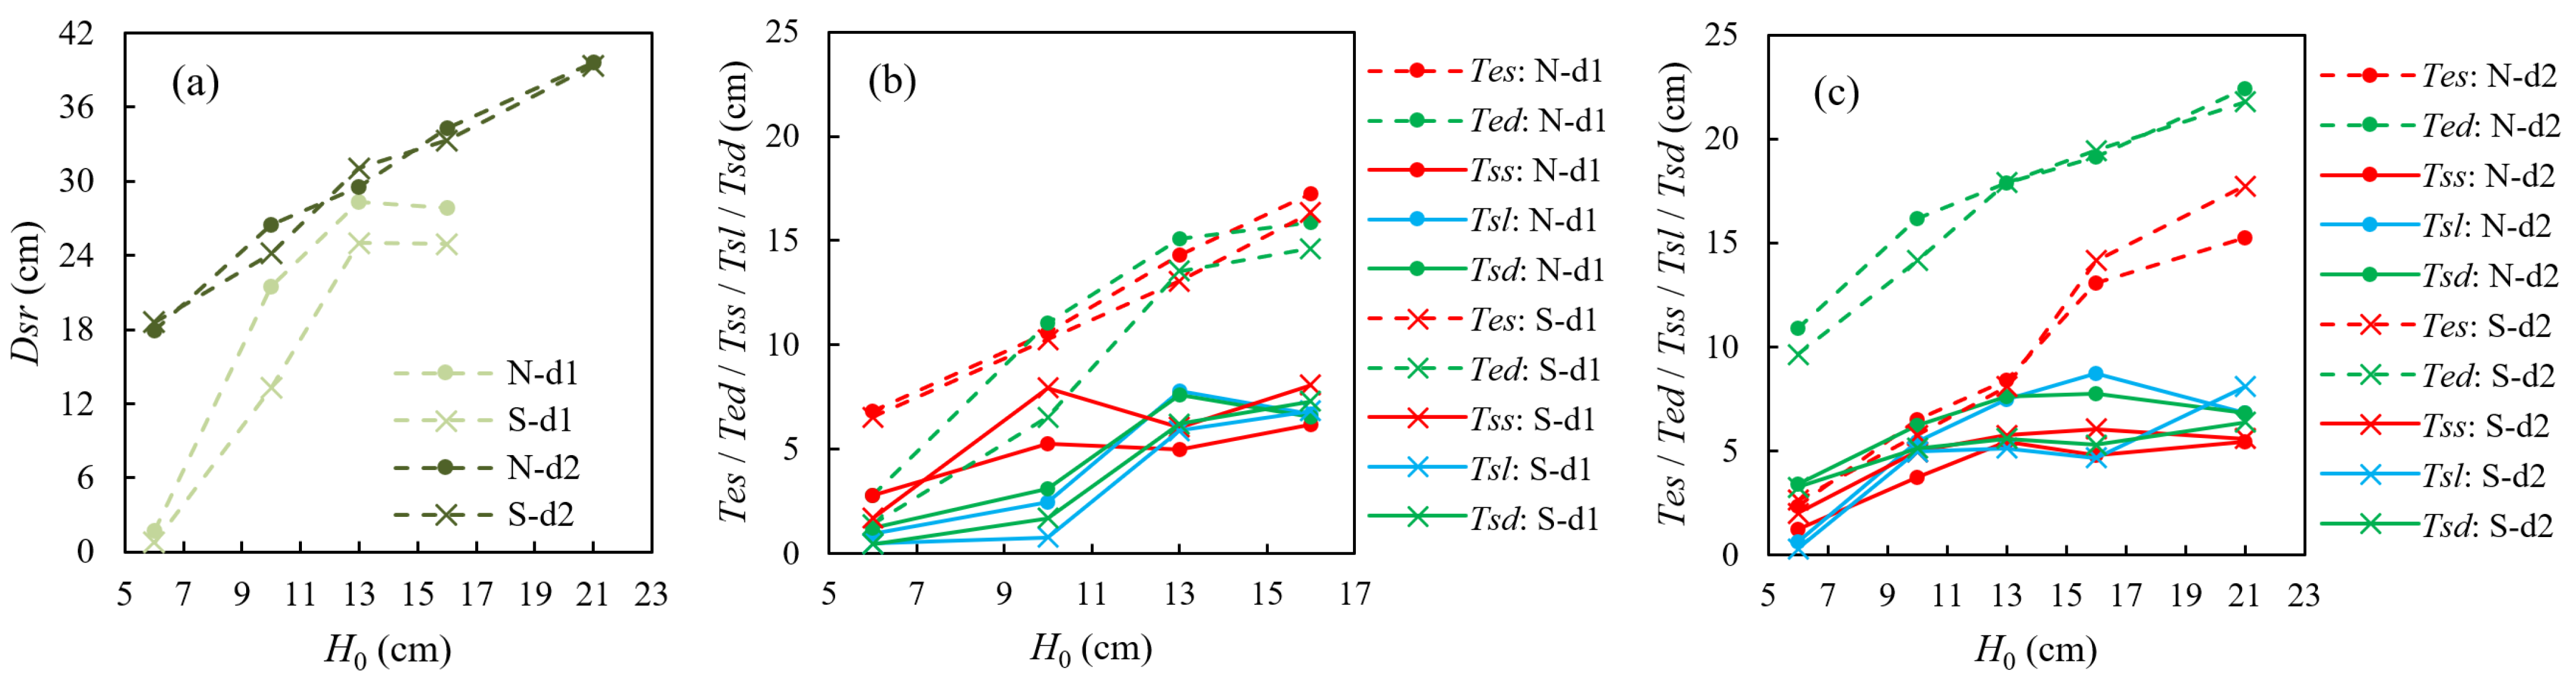
3.3. Sediment Transport

Figure 7 and Table 4 present the erosion (Evs) and deposition (Dvs) volume of the sandbar, the erosion (Evd) and deposition (Dvd) volume of the foredune, the sediment transport volumes of the sandbar (Svs), lagoon (Svl), and foredune (Svd), the total sediment transport volume (Tsv), and the change ratios for some of these parameters across various regions under different test conditions. The data presented in Table 4 reveal that submerged vegetation has a complex impact on erosion and deposition processes.
Firstly, the reduction in erosion volume of the foredune (Evd) is significant when the sandbar crest is level with the still water surface (Figure 7a), with an average reduction ratio of 39.53%, which is higher than the average reduction ratio of 12.35% (excluding positive values) observed when the sandbar is submerged (Figure 7b). The reduction influenced by vegetation in the foredune erosion volume ranges from 6% to 62%, similar to a vegetation-induced beach erosion reduction of 7–63% [52] and 5–85% [51]. The average reduction is (39.53% + 12.35%)/2 = 25.9%, which is basically consistent with 26.5%, as observed by Gong et al. [53]. Secondly, submerged vegetation leads to an increase in the deposition volume of the sandbar (Dvs) in most conditions, highlighting its role in promoting sedimentation. Conversely, the deposition volume of the foredune (Dvd) tends to decrease overall (Table 4).
As shown in Figure 7c,d, the sandbar and foredune typically exhibit erosion with negative values, while the lagoon consistently shows deposition with positive values. This means that the sediment transport volume of the lagoon is equal to its deposition volume. The consistently negative total sediment transport volume signifies that the sediment is generally transported seaward. The change ratios for erosion and deposition in the sandbar are complex (Table 4), as shown by the intersecting curves in Figure 7. The sediment transport volume of the foredune (Svd, negative value) in the tests with vegetation is generally above that in the tests without vegetation, while the sediment transport volume of the lagoon (Svl, positive value) in the tests with vegetation is generally below that in the tests without vegetation (Figure 7c,d). This means that submerged vegetation reduces the deposition within the lagoon and the net erosion of the foredune. The curves for the sediment transport volume of the sandbar (Svs) and the total sediment transport volume (Tsv) both exhibit a clear pattern of intersection, and the crossing forms are similar (Figure 7c,d). This indicates that the sediment transport characteristics of the sandbar directly affect the changes in offshore sediment transport and also highlights the complexity of the nonlinear interactions between vegetation and the sediment. Overall, vegetation can reduce the lagoon deposition and net erosion of the foredune, providing enhanced protection for the coastline, but the changes in sediment transport of the sandbar and offshore sediment transport are complex.

4. Discussion

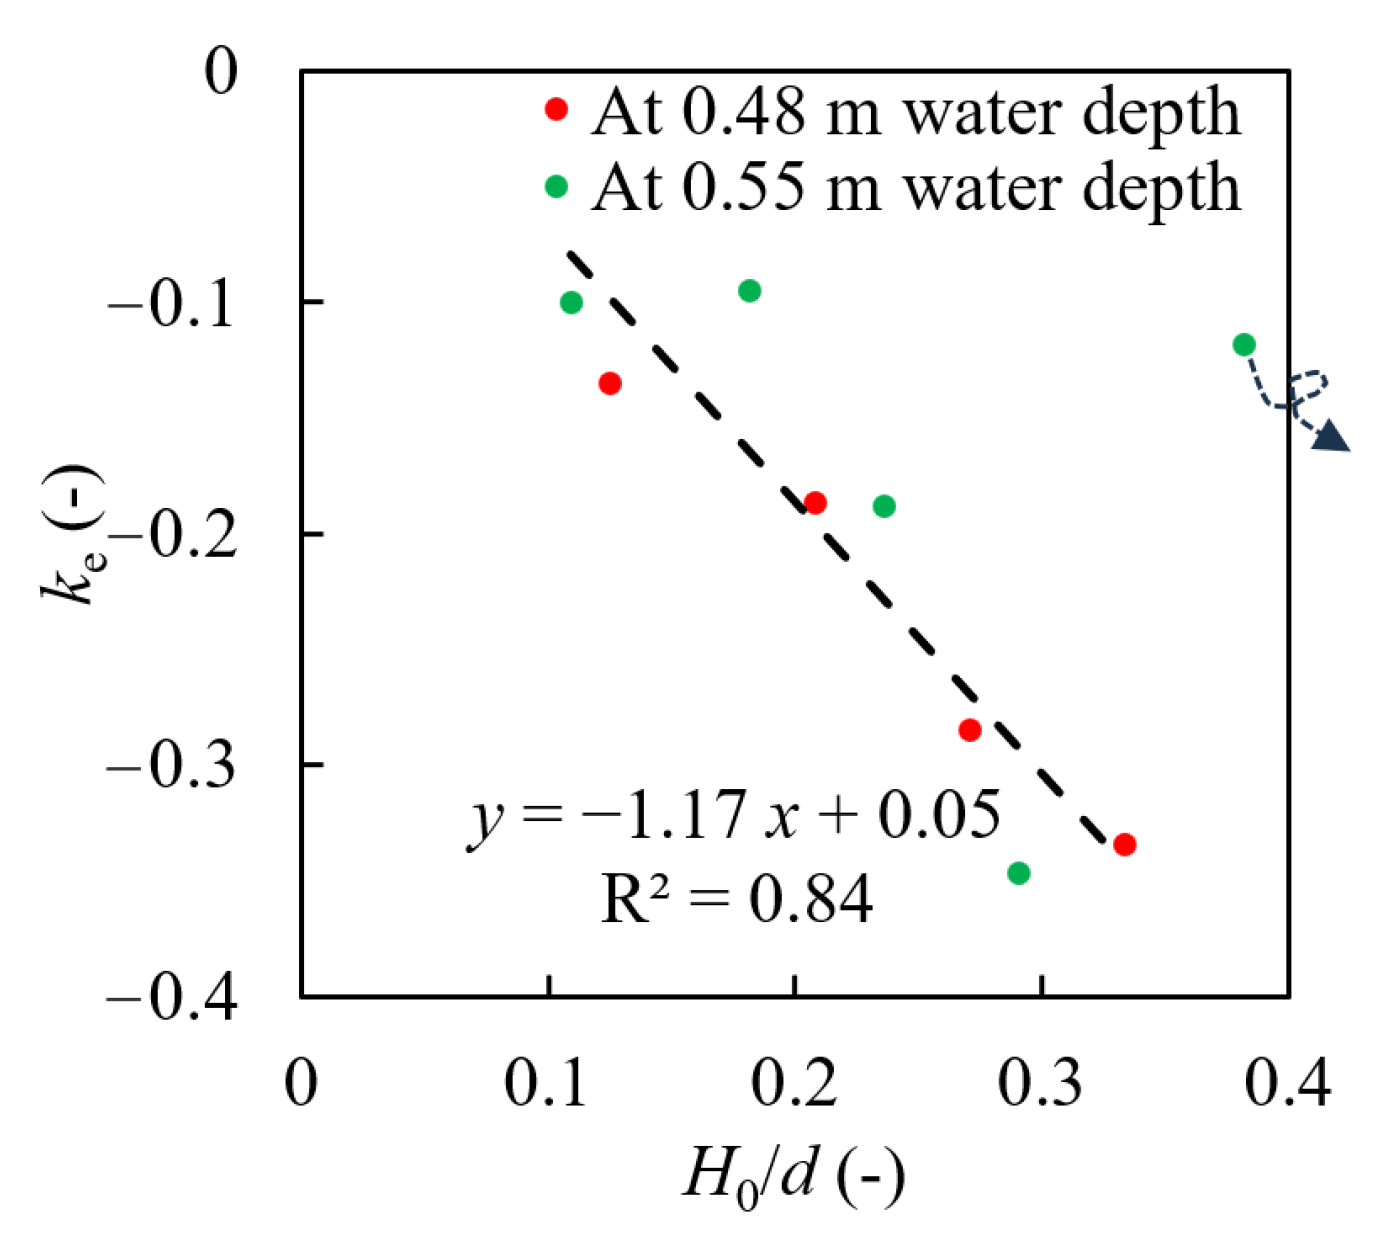
4.1. Linear Relationship Between the Change Ratio in Wave Energy and the Relative Incident Wave Height

As detailed in Section 3.1, it has been established that the attenuation induced by submerged vegetation near the wave breaking point is significant (Table 2). Moreover, for the total wave energy change ratio at W7, the incident wave height has little influence, but the water depth has a greater impact. When the sandbar crest is level with the still water surface, the attenuation ratio is basically maintained at 20–24%, except for the smallest incident wave height; when the sandbar is submerged, the attenuation ratio is maintained at 10–16% (Table 2). Thus, this subsection focuses on the analysis of wave energy change near the breaking point.
The relative incident wave height (H0/d) is selected as the horizontal axis, and the total wave energy change ratio (ke) at Wa is taken as the vertical axis, as shown in Figure 8. The point enclosed by the black dashed line in the figure is significantly different from the other scatter points. This point relates to the test with a large water depth and high incident wave height (S-d25). In other words, when an extreme storm with strong waves and a high water level occurs, the energy attenuation effect of submerged vegetation becomes more intricate, and Section 3.2 also highlights the unusual impact of vegetation on profile changes under this condition. After removing this outlier, the remaining points can be fitted to a linear curve with a strong correlation, with a determination coefficient R2 = 0.84. This linear relationship can be expressed as follows:
k e = e 1 H 0 / d + e 0 e 1 < 0
where ke is the total wave energy change ratio (dimensionless), calculated at the location Wa; e0 and e1 are the fitting coefficients (dimensionless); H0 is the incident wave height (m); and d is the water depth (m).
The total wave energy change ratio proposed in this paper is based on the location near the wave breaking point (Wa), which is different from the wave height attenuation ratio behind the sandbar (W7) proposed by Cong et al. [54]. This is mainly because the submerged vegetation has a more significant attenuation effect on the wave energy near the breaking point. Additionally, unlike Cong et al. [54], who considered the density of emergent vegetation in the fitting relationship, it is not considered in this study mainly because only one vegetation density is presented. Moreover, this paper only characterizes the vegetation density by the number of plants per square meter. Maza et al. [15] combined parameters, such as biomass, vegetation height, and vegetation band width, to characterize the distribution characteristics of complex and real vegetation. Gong et al. [53] excluded biomass, making it a dimensionless parameter involving only vegetation height and band width. These studies focused on a flat bed with vegetation. Subsequently, Gong et al. [52] planted vegetation on a mild slope (1:10) without considering the influence of the slope on the vegetation effect. However, in this paper, the submerged vegetation was arranged on a steeper slope, and if the parameters of the submerged vegetation are to be quantified, they are affected by the slope, and the swing amplitude of the vegetation (material properties) also affects the experimental results. The simple linear relationship obtained in this study lays the foundation for understanding how submerged vegetation affects the evolution of typical coastal dynamic geomorphology.

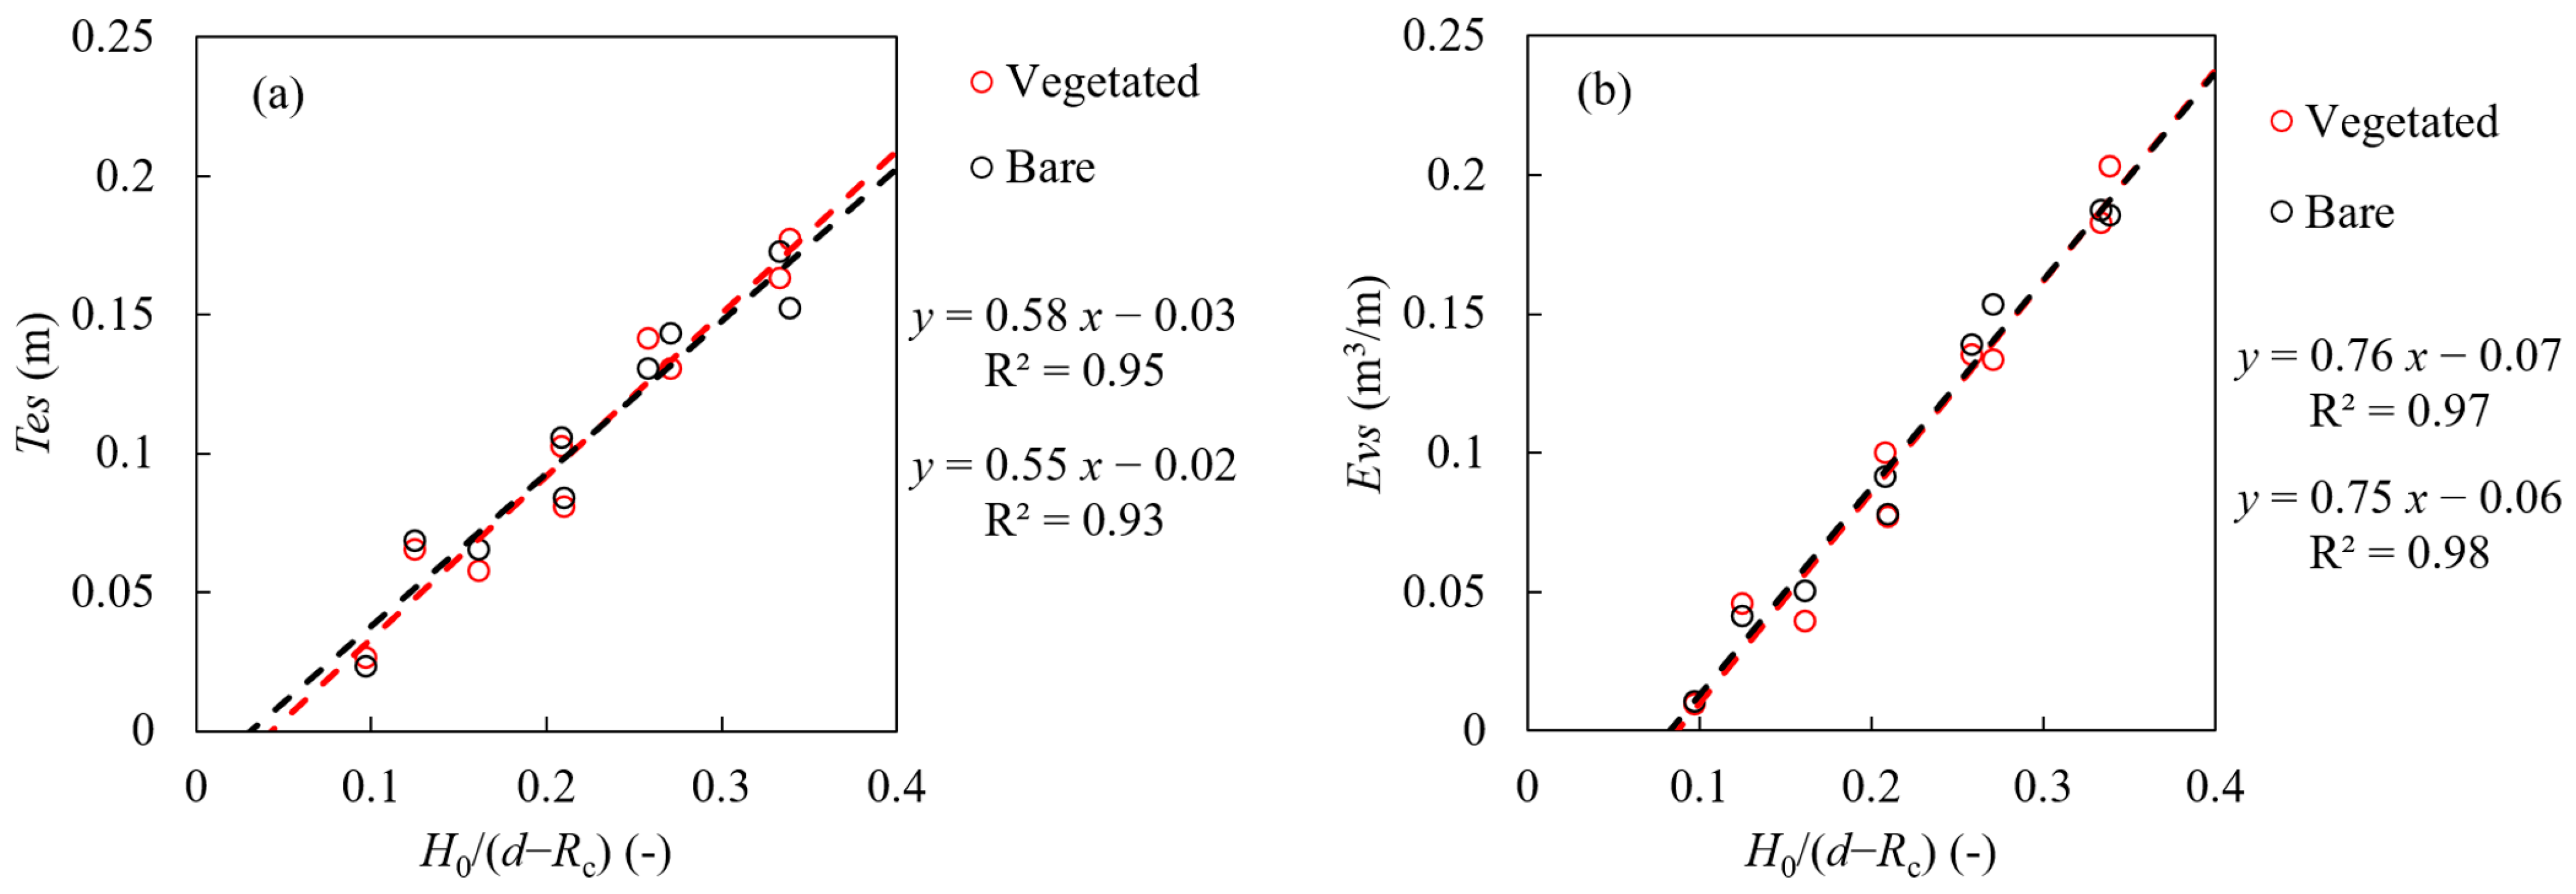
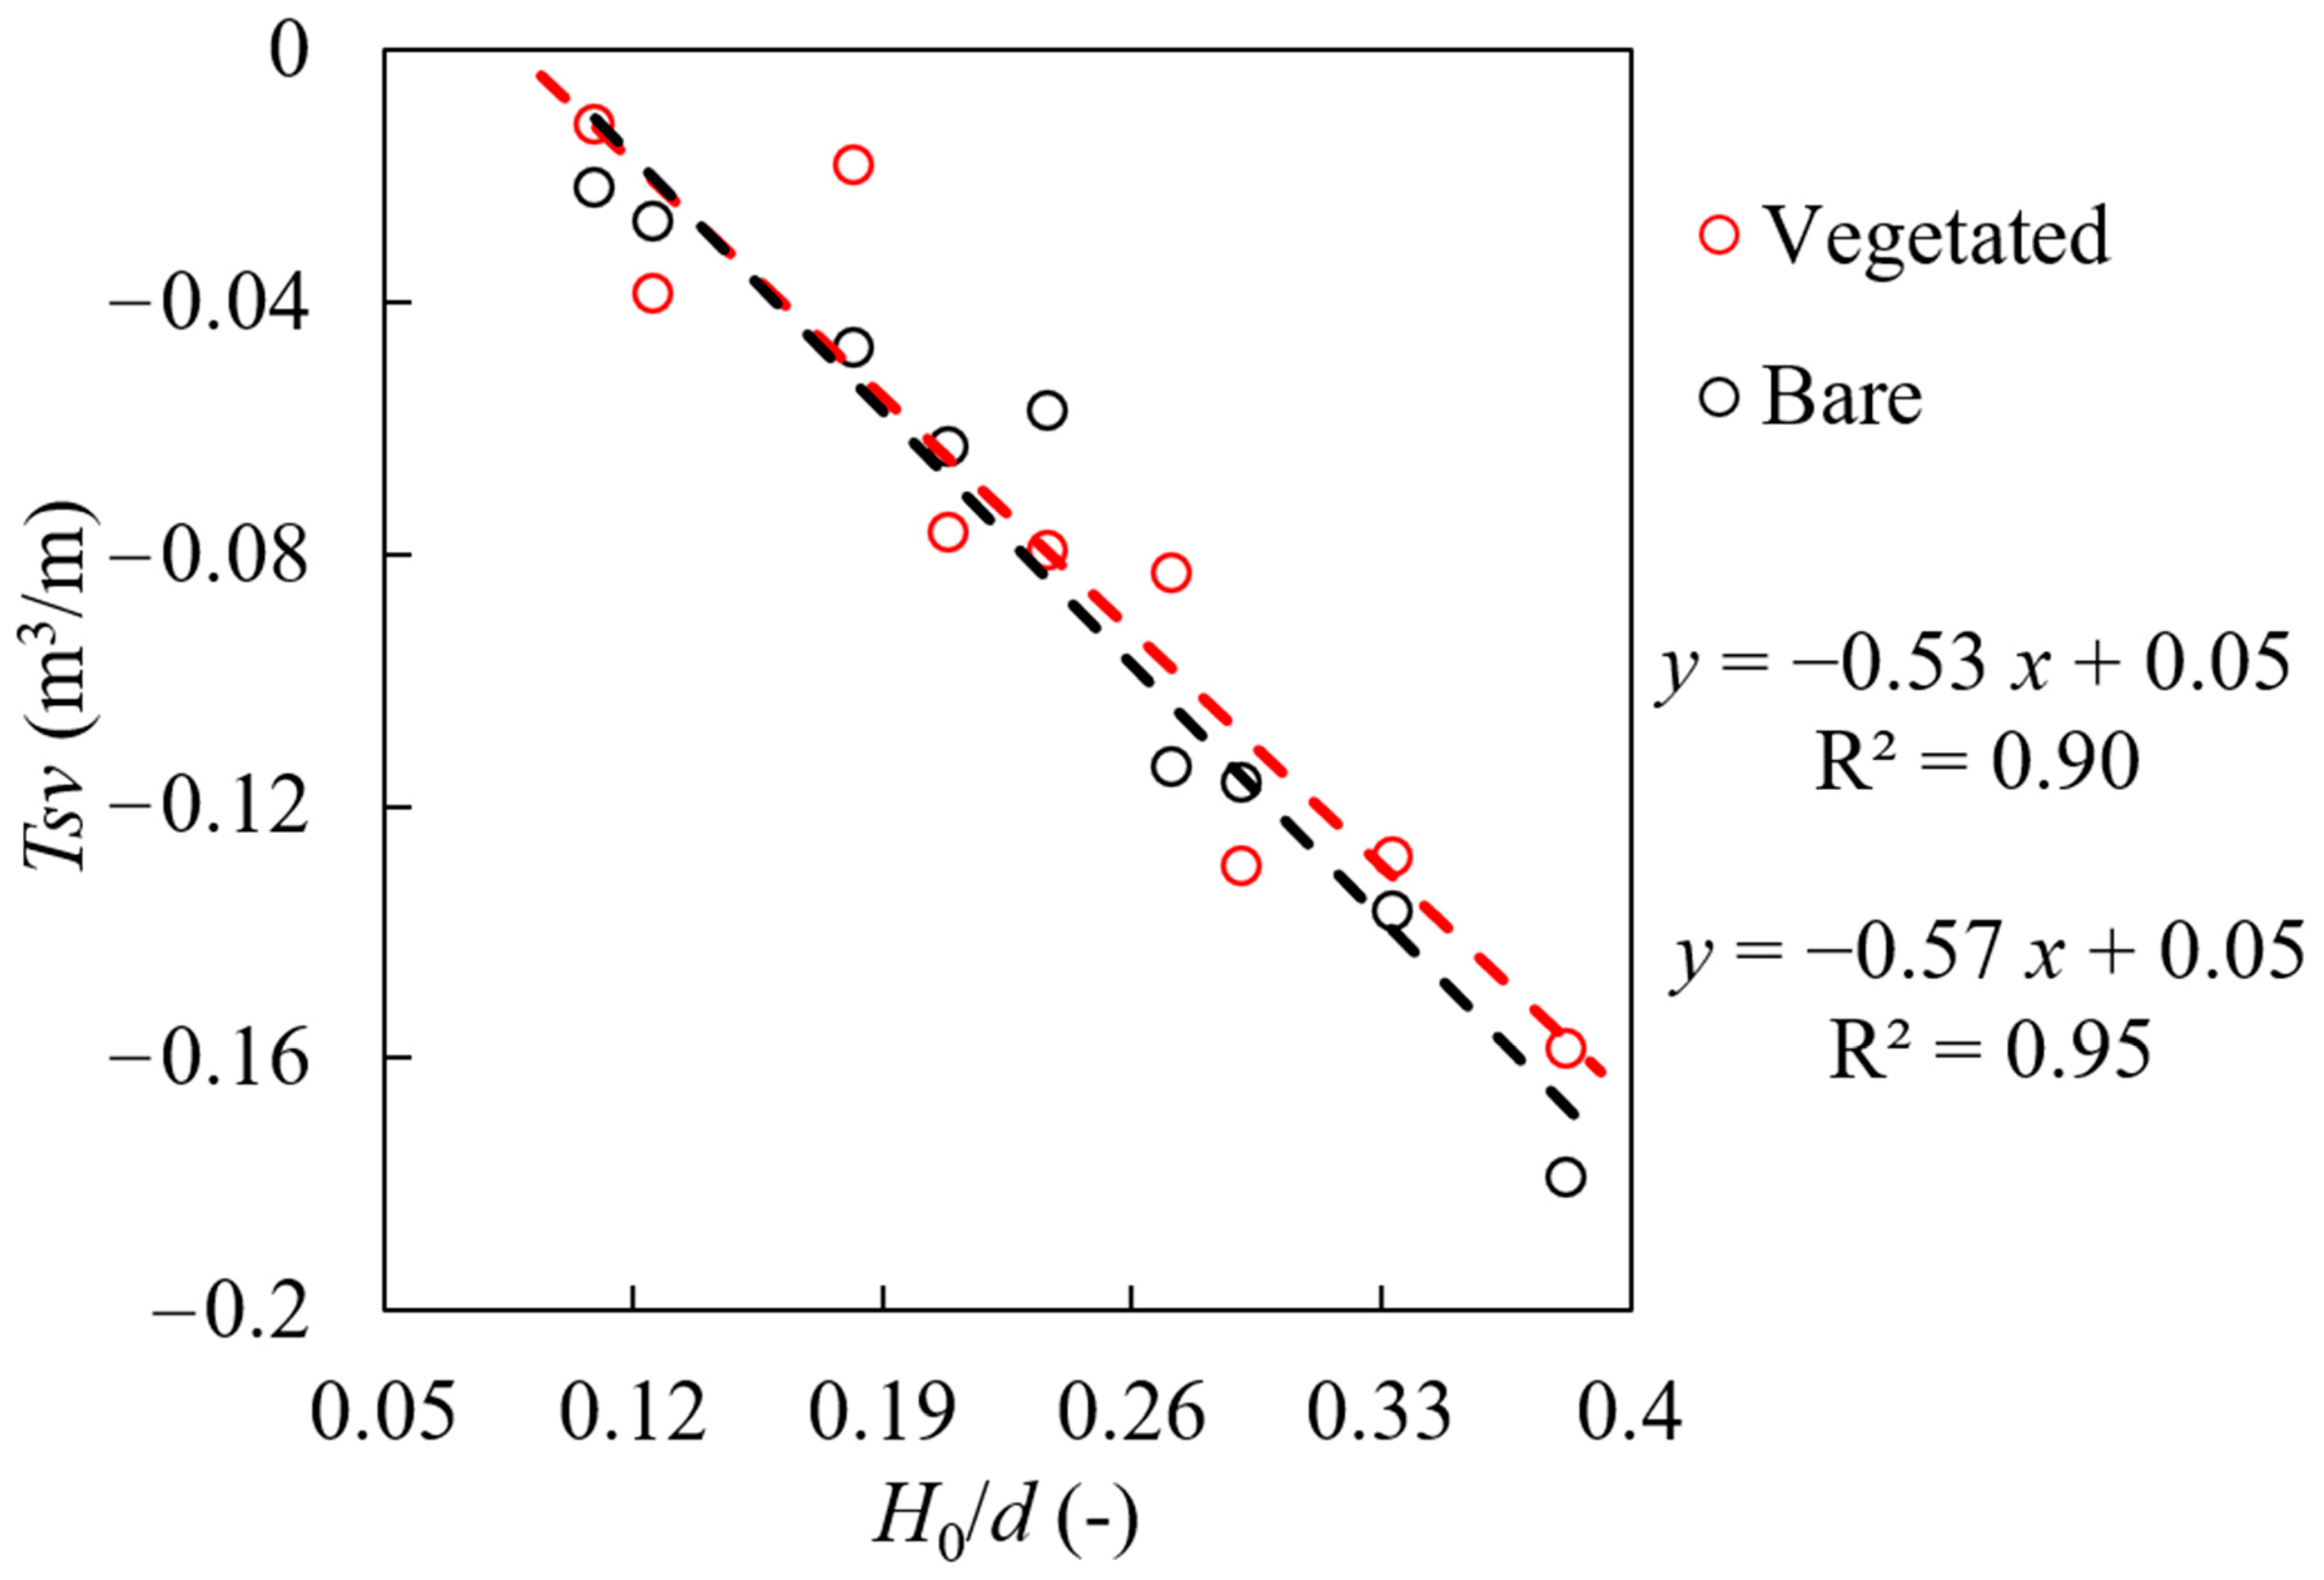
4.2. Mathematical Expressions for Sediment Transport

A quantitative expression for sediment transport characteristics is established based on the parameter introduced by Cong et al. [54]. Figure 9 shows the fitted curve between the maximum erosion thickness of the sandbar (Tes) and the erosion volume of the sandbar (Evs), which can be represented by the following mathematical expression.
T e s E v s = n 1 ζ + n 0 = n 1 H 0 d i R c + n 0 ( n 1 > 0 )
where n1 and n0 are fitting coefficients (dimensionless); ζ = H0/(diRc) is the introduced parameter (dimensionless); d is the water depth (m); Rc is the freeboard of the sandbar (m); and i is a constant, taken as i = 1. It should be noted that the parameter i was chosen as an integer value at which the coefficient of determination achieves its maximum value, or when any further increment results in only marginal improvements.
Figure 9a is the fitted curves for the maximum erosion thickness of the sandbar (Tes). The curve without vegetation intersects with the curve with vegetation around ζ = 0.23. When ζ < 0.23, the curve without vegetation lies above the curve with vegetation, meaning that submerged vegetation reduces the maximum erosion thickness of the sandbar. When ζ > 0.23, the curve with vegetation is above the curve without vegetation, indicating that submerged vegetation increases the maximum erosion thickness of the sandbar. For the erosion volume of the sandbar (Evs), the fitted curves with and without vegetation are essentially coincident, suggesting that submerged vegetation has little effect on the erosion volume of the sandbar. However, submerged vegetation changes the local erosion thickness (Figure 5). This indicates that the increased erosion area will deposit the sediment in other eroded parts of the sandbar, resulting in no change in the overall erosion volume.
Figure 10 shows the fitted curves for the maximum erosion thickness (Ted) and the erosion volume of the foredune (Evd), which can be described by the following mathematical expressions.
T e d = m 1 δ ζ 0 + m 0 = m 1 H 0 L 0 ( d i R c ) + m 0 ( m 1 > 0 )
E v d = d 1 H 0 ζ 0 + d 0 = d 1 H 0 ( d i R c ) + d 0 ( d 1 < 0 )
where m0, m1, d0, and d1 are fitting coefficients (dimensionless); ζ0 = diRc is the introduced parameter (m); δ = H0/L0 is the wave steepness; i is a constant with i = 3 in Equation (8) and i = 5 in Equation (9).
For both the maximum erosion thickness (Ted) and the erosion volume (Evd) of the foredune, the fitted curves under the scenario with submerged vegetation lie below those without vegetation, indicating that submerged vegetation reduces both the maximum erosion thickness and the erosion volume of the foredune. The difference is that the different independent variables indicate that the maximum erosion thickness of the foredune is closely related to wave steepness, while the erosion volume is mainly controlled by water depth and incident wave height. Additionally, as the independent variable increases, the gap between the two fitted curves for the maximum erosion thickness decreases significantly, indicating that the larger the independent variable δ (d − 3Rc) (i.e., the greater the water depth, the degree of submergence of the sandbar, and the wave steepness), the smaller the difference in the maximum erosion thickness of the foredune between scenarios with and without vegetation. This highlights the complex interplay between environmental factors and the influence of vegetation on coastal erosion processes. In terms of erosion volume, although the slope of the curve with vegetation also increases slightly (0.61 > 0.60), this increase is minimal, and the curves are almost parallel.
The issue of coastal erosion has always been a core concern. Gong et al. [52,53] proposed quantitative descriptions of the impact of vegetation on beach erosion on flat beds and slopes, respectively. More comprehensive influencing factors were considered, including vegetation height, the arrangement band width, and sediment settling velocity. Furthermore, mathematical expressions in exponential form were obtained, which are more complex than the linear forms presented in this study and have slightly lower determination coefficients. Additionally, further research in this paper also needs to expand the range of vegetation density considerations, and integrating vegetation density into the linear empirical formula still requires more extensive work.
Figure 11 is the fitted line for the total sediment transport volume (Tsv), which can be described by the following expressions.
T s v = v 1 H 0 / d + v 0 ( v 1 < 0 )
where v1 and v0 are fitting coefficients. Although the curve changes (Figure 7c,d) in the aforementioned text are relatively complex, the overall trend after fitting is quite clear.
The fitted curve for the scenario with vegetation lies above that for the scenario without vegetation, intersecting near the origin. This suggests that submerged vegetation typically reduces the offshore sediment transport volume, which is generally consistent with research by Astudillo et al. [50], showing that a significantly smaller sediment volume was transported offshore when seagrass meadows were present. The effect of vegetation becomes more pronounced with the increase in the incident wave height and the decrease in water depth. This is because the smaller the water depth and the greater the incident wave height, the more the waves can act on the submerged vegetation. The stronger the action, the more the bottom turbulence dissipates, resulting in a reduction in the sediment transport distance. However, sediment transport is indeed influenced by various factors. This study only considered the impact of mimicked submerged vegetation under pure wave action. Kuang et al. [55] studied the real sparse emergent vegetation and found an increase in offshore sediment transport volume due to vegetation. Field observations in salt marsh areas [63] have shown that the net sediment transport depends on the combination of tidal and wave conditions. These combined effects can vary depending on the characteristics of different research areas, which fully illustrates the complexity of the research and the need for a more fundamental quantitative study. Furthermore, the morphologies of geomorphological units, such as the sandbar, lagoon, and foredune, exert an influence on wave propagation and sediment transport dynamics. The mathematical expressions discussed in this paper consider only the water depth and sandbar freeboard without taking into account the influence of other geometric aspects. These expressions require further validation or expansion with a supplementary physical models or field data.

5. Conclusions

The primary objective of this study was to evaluate quantitatively the effects of mimic submerged vegetation on wave propagation and bed profile evolution. Experimental investigations were conducted utilizing plastic mimic vegetation inserted into a prefabricated polypropylene board at the base of the sandbar fore-slope under different water depths and wave conditions. Wave gauges were used to measure the short-wave height, long-wave height, and total wave energy. Furthermore, cross-shore bed profile measurements were taken in the presence of with and without submerged vegetation (9 + 9 = 18 tests) to examine sediment transport under different wave conditions. The following conclusions can be drawn from these experimental results:
Wave attenuation ratio by submerged vegetation increases with increasing incident wave height and decreases slightly with increasing water depth. Wave reflection coefficient decreases significantly in the presence of vegetation by an amount that varies with water depths. An empirical linear expression for the total wave energy change ratio (ke) is proposed and the relative incident wave height (H0/d) is selected as the independent variable. After removing an outlier, the determination coefficient R2 reaches 0.84. Typically, submerged vegetation can reduce lagoon deposition and net erosion of the foredune. However, wave attenuations during extreme storm wave conditions are worthy of in-depth research in the presence of submerged vegetation. Moreover, this study established mathematical expressions for sandbar erosion volume and maximum erosion thickness (with H0/(dRc)), foredune erosion volume (with H0(d − 5Rc)), maximum erosion thickness (with δ(d − 5Rc)), and total sediment transport volume (with H0/d). These relationships further demonstrate the ability of submerged vegetation to mitigate and prevent the coastal disaster. Understanding these conclusions has essential significance in nature-based solutions based on submerged vegetation and could provide valuable guidance for coastal management and conservation planning, especially for the valuable sandbar-lagoon coast. However, more field observations are required for validation, and more experimental studies are needed to consider more factors, including vegetation density, vegetation type, and bed morphology.

Author Contributions

Conceptualization, W.X., X.C. and C.K.; methodology, W.X., X.C. and C.K.; formal analysis, X.C., W.X., C.K. and Q.Z.; investigation, X.C., W.X., D.W. and Z.A.; writing—original draft preparation, X.C. and W.X.; writing—review and editing, C.K. and Q.Z.; supervision, C.K.; funding acquisition, C.K. and Q.Z. All authors have read and agreed to the published version of the manuscript.

Funding

This study was funded by the National Key Research and Development Program of China (No. 2022YFC3106205) and the National Natural Science Foundation of China (No. 41976159). Qingping Zou has been supported by the Natural Environment Research Council of the UK (Grant No. NE/V006088/1).

Institutional Review Board Statement

Not applicable.

Informed Consent Statement

Not applicable.

Data Availability Statement

The raw data supporting the conclusions of this article will be made available by the authors on request.

Conflicts of Interest

The authors declare no conflicts of interest.

References

  1. Costanza, R.; D’arge, R.; Groot, R.D.; Farber, S.; Grasso, M.; Hannon, B.; Limburg, K.; Naeem, S.; O’neill, R.V.; Paruelo, J.; et al. The value of the world’s ecosystem services and natural capital. Nature 1997, 387, 253–260. [Google Scholar] [CrossRef]
  2. Clara, I.; Dyack, B.; Rolfe, J.; Newton, A.; Borg, D.; Povilanskas, R.; Brito, A.C. The value of coastal lagoons: Case study of recreation at the Ria de Aveiro, Portugal in comparison to the Coorong, Australia. J. Nat. Conserv. 2018, 43, 190–200. [Google Scholar] [CrossRef]
  3. Suresh, K.; Khanal, U.; Wilson, C. Stakeholders’ use and preservation valuation of lagoon ecosystems. Econ. Anal. Policy 2021, 71, 123–137. [Google Scholar] [CrossRef]
  4. Morris, R.L.; Konlechner, T.M.; Ghisalberti, M.; Swearer, S.E. From grey to green efficacy of eco-engineering solutions for nature-based coastal defence. Glob. Chang. Biol. 2018, 24, 1827–1842. [Google Scholar] [CrossRef]
  5. Kuang, C.P.; Cong, X.; Fan, J.D.; Li, H.Y. Review of physical experiments on mechanisms of coastal protection by vegetation. J. Tongji Univ. (Nat. Sci.) 2024, 52, 378–387. [Google Scholar]
  6. Zhu, L.H.; Zou, Q.P. Three-layer analytical solution for wave attenuation by suspended and nonsuspended vegetation canopy. In Proceedings of the 35th International Conference on Coastal Engineering Proceeding, Antalya, Turkey, 17–20 November 2016. [Google Scholar] [CrossRef]
  7. Zhu, L.; Huguenard, K.; Zou, Q.; Fredriksson, D.W.; Xie, D. Aquaculture farms as nature-based coastal protection: Random wave attenuation by suspended and submerged canopies. Coast. Eng. 2020, 160, 103737. [Google Scholar] [CrossRef]
  8. Chen, H.; Zou, Q. Eulerian–lagrangian flow-vegetation interaction model using immersed boundary method and openfoam. Adv. Water Resour. 2019, 126, 176–192. [Google Scholar] [CrossRef]
  9. Anderson, M.E.; Smith, J.M. Wave attenuation by flexible, idealized salt marsh vegetation. Coast. Eng. 2014, 83, 82–92. [Google Scholar] [CrossRef]
  10. Maza, M.; Lara, J.; Losada, I.; Ondiviela, B.; Trinogga, J.; Bouma, T. Large-scale 3-D experiments of wave and current interaction with real vegetation. Part 2: Experimental analysis. Coast. Eng. 2015, 106, 73–86. [Google Scholar] [CrossRef]
  11. Wang, X.Y.; Xie, W.M.; Zhang, D.; He, Q. Wave and vegetation effects on flow and suspended sediment characteristics: A flume study. Estuar. Coast. Shelf Sci. 2016, 182, 1–11. [Google Scholar] [CrossRef]
  12. Rupprecht, F.; Möller, I.; Paul, M.; Kudella, M.; Spencer, T.; Wesenbeeck, B.K.V.; Wolters, G.; Jensen, K.; Bouma, T.J.; Miranda-lange, M.; et al. Vegetation-wave interactions in salt marshes under storm surge conditions. Ecol. Eng. 2017, 100, 301–315. [Google Scholar] [CrossRef]
  13. Lei, J.R.; Nepf, H. Wave damping by flexible vegetation: Connecting individual blade dynamics to the meadow scale. Coast. Eng. 2019, 147, 138–148. [Google Scholar] [CrossRef]
  14. Zhang, X.; Lin, P.; Nepf, H. A simple wave damping model for flexible marsh plants. Limnol. Oceanogr. 2021, 66, 4182–4196. [Google Scholar] [CrossRef]
  15. Maza, M.; Lara, J.L.; Losada, I.J. A paradigm shift in the quantification of wave energy attenuation due to saltmarshes based on their standing biomass. Sci. Rep. 2022, 12, 13883. [Google Scholar] [CrossRef]
  16. Mendez, F.J.; Losada, I.J. An empirical model to estimate the propagation of random breaking and nonbreaking waves over vegetation fields. Coast. Eng. 2004, 51, 103–118. [Google Scholar] [CrossRef]
  17. Zhao, Y.; Peng, Z.; He, Q.; Ma, Y.X. Wave attenuation over combined salt marsh vegetation. Ocean Eng. 2023, 267, 113234. [Google Scholar] [CrossRef]
  18. Liu, C.; Shan, Y. Impact of an emergent model vegetation patch on flow adjustment and velocity. Proc. Inst. Civ. Eng.—Water Manag. 2021, 175, 55–66. [Google Scholar] [CrossRef]
  19. Liu, C.; Shan, Y.; Nepf, H. Impact of stem size on turbulence and sediment resuspension under unidirectional flow. Water Resour. Res. 2021, 57, e2020WR028620. [Google Scholar] [CrossRef]
  20. Tinoco, R.O.; Coco, G. A laboratory study on sediment resuspension within arrays of rigid cylinders. Adv. Water Resour. 2016, 92, 1–9. [Google Scholar] [CrossRef]
  21. Yi, Y.J.; Tang, Y.J.; Tang, C.H.; Zhang, S.H. Effect of stem-generated turbulence on sediment resuspension within rigid vegetation canopies in waves. J. Lake Sci. 2020, 32, 1827–1836. [Google Scholar]
  22. Xu, Y.; Nepf, H. Suspended sediment concentration profile in a Typha latifolia canopy. Water Resour. Res. 2021, 57, e2021WR029902. [Google Scholar] [CrossRef]
  23. Marin-diaz, B.; Bouma, T.J.; Infantes, E. Role of eelgrass on bed-load transport and sediment resuspension under oscillatory flow. Limnol. Oceanogr. 2019, 65, 426–436. [Google Scholar] [CrossRef]
  24. Lou, S.; Chen, M.; Ma, G.F.; Liu, S.G.; Wang, H. Sediment suspension affected by submerged rigid vegetation under waves, currents and combined wave-current flows. Coast. Eng. 2022, 173, 104082. [Google Scholar] [CrossRef]
  25. Yagci, O.; Celik, M.F.; Kitsikoudis, V.; Kirca, V.O.; Hodoglu, C.; Valyrakis, M.; Duran, Z.; Kaya, S. Scour patterns around isolated vegetation elements. Adv. Water Resour. 2016, 97, 251–265. [Google Scholar] [CrossRef]
  26. Yamasaki, T.N.; Jiang, B.; Janzen, J.G.; Nepf, H.M. Feedback between vegetation, flow, and deposition: A study of artificial vegetation patch development. J. Hydrol. 2021, 598, 126232. [Google Scholar] [CrossRef]
  27. Shan, Y.; Zhao, T.; Liu, C.; Nepf, H. Turbulence and bed load transport in channels with randomly distributed emergent patches of model vegetation. Geophys. Res. Lett. 2020, 47, e2020GL087055. [Google Scholar] [CrossRef]
  28. Zhang, J.; Lei, J.; Huai, W.; Nepf, H. Turbulence and particle deposition under steady flow along a submerged seagrass meadow. J. Geophys. Res. Ocean. 2020, 125, e2019JC015985. [Google Scholar] [CrossRef]
  29. Hu, Z.; Lei, J.; Liu, C.; Nepf, H. Wake structure and sediment deposition behind models of submerged vegetation with and without flexible leaves. Adv. Water Resour. 2018, 118, 28–38. [Google Scholar] [CrossRef]
  30. Bennett, W.G.; Horrillo-caraballo, J.M.; Fairchild, T.P.; van Veelenkarun, T.J.; Karunarathna, H. Saltmarsh vegetation alters tidal hydrodynamics of small estuaries. Appl. Ocean Res. 2023, 138, 103678. [Google Scholar] [CrossRef]
  31. Zhu, Q.; Wiberg, P.L.; Reidenbach, M.A. Quantifying seasonal seagrass effects on flow and sediment dynamics in a back-barrier bay. J. Geophys. Res. Ocean. 2021, 126, e2020JC016547. [Google Scholar] [CrossRef]
  32. Nardin, W.; Lera, S.; Nienhuis, J. Effect of offshore waves and vegetation on the sediment budget in the Virginia Coast Reserve (VA). Earth Surf. Process. Landf. 2020, 45, 3055–3068. [Google Scholar] [CrossRef]
  33. Garzon, J.L.; Miesse, T.; Ferreira, C.M. Field-based numerical model investigation of wave propagation across marshes in the Chesapeake Bay under storm conditions. Coast. Eng. 2019, 146, 32–46. [Google Scholar] [CrossRef]
  34. Yin, K.; Xu, S.; Huang, W.; Li, R.; Xiao, H. Modeling beach profile changes by typhoon impacts at Xiamen coast. Nat. Hazards 2019, 95, 783–804. [Google Scholar] [CrossRef]
  35. Feagin, R.A.; Lozada-bernard, S.M.; Ravens, T.M.; Ller, I.M.; Yeager, K.M.; Baird, A.H. Does vegetation prevent wave erosion of salt marsh edges? Proc. Natl. Acad. Sci. USA 2009, 106, 10109–10113. [Google Scholar] [CrossRef]
  36. Feagin, R.; Furman, M.; Salgado, K.; Martinez, M.; Innocenti, R.; Eubanks, K.; Figlus, J.; Huff, T.; Sigren, J.; Silva, R. The role of beach and sand dune vegetation in mediating wave run up erosion. Estuar. Coast. Shelf Sci. 2019, 219, 97–106. [Google Scholar] [CrossRef]
  37. Feagin, R.A.; Innocenti, R.A.; Bond, H.; Wengrove, M.; Huff, T.P.; Lomonaco, P.; Tsai, B.; Puleo, J.; Pontiki, M.; Figlus, J.; et al. Does vegetation accelerate coastal dune erosion during extreme events? Sci. Adv. 2023, 9, eadg7135. [Google Scholar] [CrossRef]
  38. Cong, X.; Kuang, C.P.; Zheng, Y.H.; Han, X.J.; Fan, J.D.; Zhao, F.; Yu, L. Experimental observation on wave propagation and geomorphological evolution in a sandbar-lagoon system. Appl. Ocean Res. 2023, 141, 103785. [Google Scholar] [CrossRef]
  39. Li, Y.; Zhang, C.; Cai, Y.; Xie, M.; Qi, H.; Wang, Y. Wave dissipation and sediment transport patterns during shoreface nourishment towards equilibrium. J. Mar. Sci. Eng. 2021, 9, 535. [Google Scholar] [CrossRef]
  40. Li, Y.; Zhang, C.; Dai, W.Q.; Chen, D.K.; Sui, T.T.; Xie, M.X.; Chen, S.G. Laboratory investigation on morphology response of submerged artificial sandbar and its impact on beach evolution under storm wave condition. Mar. Geol. 2022, 443, 106668. [Google Scholar] [CrossRef]
  41. Pan, Y.; Yin, S.; Chen, Y.P.; Yang, Y.B.; Xu, C.Y.; Xu, Z.S. An experimental study on the evolution of a submerged berm under the effects of regular waves in low-energy conditions. Coast. Eng. 2022, 176, 104169. [Google Scholar] [CrossRef]
  42. Pan, Y.; Qu, X.K.; Yang, Y.B.; Zhang, J.B.; Wang, G.; Yin, S.; Chen, Y.P. Laboratory experiments on the evolution of a submerged berm driven by low-energy irregular waves. Coast. Eng. 2023, 182, 104301. [Google Scholar] [CrossRef]
  43. Marmoush, R.Y.; Mulligan, R.P. A three-dimensional laboratory investigation of beach morphology change during a storm event. Geomorphology 2020, 363, 107224. [Google Scholar] [CrossRef]
  44. Pye, K.; Blott, S. Assessment of beach and dune erosion and accretion using LiDAR: Impact of the stormy 2013–14 winter and longer term trends on the Sefton Coast, UK. Geomorphology 2016, 266, 146–167. [Google Scholar] [CrossRef]
  45. Casamayor, M.; Alonso, I.; Valiente, N.G.; Sánchez-garcía, M. Seasonal response of a composite beach in relation to wave climate. Geomorphology 2022, 408, 108245. [Google Scholar] [CrossRef]
  46. Wang, J.; You, Z.J.; Liang, B.; Wang, Z.; Yang, B. The physical processes of sandy beach evolution under storm and non-storm wave conditions simulated in wave flume. Mar. Geol. 2023, 462, 107065. [Google Scholar] [CrossRef]
  47. Keijsers, J.G.S.; de Groot, A.V.; Riksen, M.J.P.M. Vegetation and sedimentation on coastal foredunes. Geomorphology 2015, 228, 723–734. [Google Scholar] [CrossRef]
  48. Durán, O.; Moore, L.J. Vegetation controls on the maximum size of coastal dunes. Proc. Natl. Acad. Sci. USA 2013, 110, 17217–17222. [Google Scholar] [CrossRef]
  49. Odériz, I.; Knöchelmann, N.; Silva, R.; Feagin, R.A.; Martínez, M.L.; Mendoza, E. Reinforcement of vegetated and unvegetated dunes by a rocky core: A viable alternative for dissipating waves and providing protection? Coast. Eng. 2020, 158, 103675. [Google Scholar] [CrossRef]
  50. Astudillo, C.; Gracia, V.; Cáceres, I.; Sierra, J.P.; Sanchez-arcilla, A. Beach profile changes induced by surrogate Posidonia Oceanica: Laboratory experiments. Coast. Eng. 2022, 175, 104144. [Google Scholar] [CrossRef]
  51. Lee, J.; Jeong, Y.; Jeong, J.; Hur, D. An experimental study on the effect of cross-sectional changes in rigid and flexible submerged vegetation on beach erosion control. J. Coast. Res. 2024, 116, 643–647. [Google Scholar] [CrossRef]
  52. Gong, S.P.; Xu, S.D.; Li, M.X.; Wang, Y.R.; Yin, K.; Chen, Y.M. Experimental study on wave attenuation and beach profile evolution under the protection of submerged flexible vegetation. J. Hydrol. 2024, 638, 131478. [Google Scholar] [CrossRef]
  53. Gong, S.P.; Xu, S.D.; Yin, K.; Chen, Y.M.; Chen, J.; Lei, J.R. Experimental study on wave attenuation and cross-shore profiles by submerged flexible vegetation. Ocean Eng. 2024, 307, 118218. [Google Scholar] [CrossRef]
  54. Cong, X.; Kuang, C.P.; Huang, G.W.; Zou, Q.P.; Han, X.J.; Shen, C.; Gu, J. Experimental study on the morphodynamic evolution of sandbar-lagoon system with emergent vegetation. Coast. Eng. 2023, 184, 104340. [Google Scholar] [CrossRef]
  55. Kuang, C.P.; Cong, X.; Gong, L.X.; Liu, J.T.; Han, X.J.; Xing, W. Cross-shore profile evolution induced by real emergent vegetation in a sandbar-lagoon coast: Laboratory experiments. Geomorphology 2024, 468, 109500. [Google Scholar] [CrossRef]
  56. Ma, Y.; Kuang, C.P.; Han, X.J.; Niu, H.B.; Zheng, Y.H.; Shen, C. Experimental study on the influence of an artificial reef on cross-shore morphodynamic processes of a wave-dominated beach. Water 2020, 12, 2947. [Google Scholar] [CrossRef]
  57. Yin, S.; Pan, Y.; Chen, Y.P. Scale design based on local curve fitting method for low-energy sandy beach. Hydro-Sci. Eng. 2017, 4, 43–51. [Google Scholar]
  58. Zhou, Y.; Jiang, Z.J.; Qiu, G.L.; Zhang, P.D.; Xu, S.C.; Zhang, X.M.; Liu, S.L.; Li, W.T.; Wu, Y.C.; Yue, S.D.; et al. Distribution status, degradation reasons and protection countermeasures of seagrass resources in China. Oceanol. Limnol. Sin. 2023, 54, 1248–1257. [Google Scholar]
  59. Zhi, K.T.; Yang, J.; Yin, Z.Q.; Wang, Y.; Li, X.L.; Chen, L.; Wei, H.F.; Wang, Y.J.; Yu, L.J.; Sun, Q.; et al. Distribution characteristics of seagrass, algae, and attached organisms in the seagrass beds of Changshan Islands, Dalian. Mar. Fish. 2024, 46, 297–306. [Google Scholar]
  60. Zhu, G.; Ren, B.; Dong, P.; Wang, G.; Chen, W. Experimental investigation on the infragravity wave on different reef systems under irregular wave action. Ocean Eng. 2021, 226, 108851. [Google Scholar] [CrossRef]
  61. Goda, Y.; Suzuki, Y. Estimation of incident and reflected waves in random wave experiments. In Proceedings of the 15th International Conference on Coastal Engineering, Honolulu, HI, USA, 11–17 July 1976; pp. 828–845. [Google Scholar]
  62. Zou, Q.; Peng, Z. Evolution of wave shape over a low-crested structure. Coast. Eng. 2011, 58, 478–488. [Google Scholar] [CrossRef]
  63. Sun, J.W.; van prooijen, B.; Wang, X.Y.; Xie, W.M.; Xu, F.; He, Q.; Wang, Z.B. Conditional effects of tides and waves on sediment supply to salt marshes. J. Geophys. Res. Earth Surf. 2024, 129, e2024JF007686. [Google Scholar] [CrossRef]
Figure 1. Experimental setup diagram.
Jmse 12 02126 g001
Figure 2. Actual bed morphology and vegetation configuration within the flume.
Jmse 12 02126 g002
Figure 3. Changes in short-wave height (a,b), long-wave height (c,d), and wave energy (e,f). HSW is the short-wave height; HLW is the long-wave height; ET is the total wave energy. The light green indicates the vegetation zone. N indicates “without vegetation”, S signifies “with vegetation”, d1 denotes a water depth of 0.48 m, d2 denotes a water depth of 0.55 m, and the final numbers 1–5 represent incident wave heights ranging from low to high (Table 1).
Jmse 12 02126 g003
Figure 4. Wave reflection coefficients at different water depths and incident wave heights.
Jmse 12 02126 g004
Figure 5. Longitudinal profiles at different scenarios. (a) d = 0.48 m; (b) d = 0.55 m.
Jmse 12 02126 g005
Figure 6. Comparison of shoreline receding distance Dsr (a) and maximum erosion (Tes for sandbar, Ted for foredune) /deposition (Tss for sandbar, Tsl for lagoon, Tsd for foredune) thickness (b,c) with and without submerged vegetation. H0 is the incident wave height.
Jmse 12 02126 g006
Figure 7. Comparison of local erosion (Evs for sandbar, Evd for foredune) /deposition (Dvs for sandbar, Dvd for foredune) volume (a,b), local sediment transport volume (Svs for sandbar, Svl for lagoon, Svd for foredune), and total sediment transport volume Tsv (c,d) with and without submerged vegetation. H0 is the incident wave height. N indicates “without vegetation”, S signifies “with vegetation”, d1 denotes a water depth of 0.48 m, d2 denotes a water depth of 0.55 m, and the final numbers 1–5 represent incident wave heights ranging from low to high (Table 1).
Jmse 12 02126 g007
Figure 8. Correlation between change ratio of wave energy and relative incident wave height. H0 is the incident wave height; d is the water depth. The dashed line represents the fitted curve after removing the outlier near the arrow.
Jmse 12 02126 g008
Figure 9. Fitted curves for the maximum erosion thickness of the sandbar Tes (a) and the erosion volume of the sandbar Evs (b) with and without submerged vegetation. H0 is the incident wave height; Rc is the sandbar freeboard; d is the water depth. The red and black dashed lines represent the fitted curves for scenarios with and without vegetation, respectively.
Jmse 12 02126 g009
Figure 10. Fitted curves for the maximum erosion thickness of the foredune (a) and the erosion volume of the foredune (b) with and without submerged vegetation. The red and black dashed lines represent the fitted curves for scenarios with and without vegetation, respectively.
Jmse 12 02126 g010
Figure 11. Fitted curves for the total sediment transport volume Tsv with and without submerged vegetation. H0 is the incident wave height; d is the water depth. The red and black dashed lines represent the fitted curves for scenarios with and without vegetation, respectively.
Jmse 12 02126 g011
Table 1. Experimental tests. H0 is the incident wave height; T0 is the wave period; and d is the water depth.
Test NamesH0 (m)T0 (s)Vegetation Density (shoots/m2)
d = 0.48 md = 0.55 m
N-d11N-d210.061.330
N-d12N-d220.101.600
N-d13N-d230.131.680
N-d14N-d240.161.800
-N-d250.212.120
S-d11S-d210.061.332500
S-d12S-d220.101.602500
S-d13S-d230.131.682500
S-d14S-d240.161.802500
-S-d250.212.122500
“-” indicates that the situation was not considered.
Table 2. Change ratios of wave heights and total wave energy.
Test NamesChange Ratios
of the Short-Wave Height (-)
Change Ratios
of the Long-Wave Height (-)
Change Ratios
of the Total Wave Energy (-)
WaW7WaW7WaW7
S-d11−4.54%−55.91%−36.89%70.28%−13.54%42.17%
S-d12−7.72%−15.53%−28.80%−5.24%−18.68%−21.17%
S-d13−12.54%−20.77%−25.88%0.08%−28.48%−23.57%
S-d14−12.26%−11.06%−39.17%−12.60%−33.44%−22.71%
Average−9.27%−25.81%−32.69%−8.92%−23.54%−22.48%
S-d21−5.11%−6.86%−5.53%−14.15%−9.99%−14.07%
S-d22−3.95%−7.24%−19.23%−13.08%−9.51%−16.01%
S-d23−9.29%−6.70%−12.51%−6.49%−18.83%−12.70%
S-d24−13.84%−3.91%−42.39%−11.44%−34.69%−10.08%
S-d25−3.57%−8.20%−15.04%−7.98%−11.82%−15.58%
Average−7.15%−6.58%−18.94%−10.63%−16.97%−13.69%
Average results are calculated by only negative ratios. N indicates “without vegetation”, S signifies “with vegetation”, d1 denotes a water depth of 0.48 m, d2 denotes a water depth of 0.55 m, and the final numbers 1–5 represent incident wave heights ranging from low to high (Table 1).
Table 3. Change ratios of maximum erosion and deposition thickness.
Test NamesShoreline Receding Distance (-)Maximum Erosion Thickness (-)Maximum Deposition Thickness (-)
SandbarForeduneSandbarLagoonForedune
S-d11−54.55%−4.55%−50.00%−38.89%−50.00%−62.50%
S-d12−38.32%−2.94%−40.85%50.00%−68.04%−45.00%
S-d13−11.63%−8.70%−10.31%21.88%−24.00%−18.37%
S-d14−10.42%−5.41%−7.84%30.37%2.33%11.90%
Average−28.73%−5.40%−27.25%34.08%−47.35%−41.96%
S-d213.49%13.33%−11.43%62.50%−50.00%−4.55%
S-d22−8.88%−11.90%−12.50%33.33%−8.57%−17.50%
S-d235.04%−3.70%0.00%5.71%−31.25%−26.53%
S-d24−2.97%8.33%1.63%25.81%−46.43%−32.00%
S-d25−0.59%16.33%−2.78%2.86%18.18%−6.82%
Average−4.15%−7.80%−6.68%26.04%−34.06%−17.48%
When the average result is negative, only negative values are considered. Conversely, when it is positive, only positive values are considered. N indicates “without vegetation”, S signifies “with vegetation”, d1 denotes a water depth of 0.48 m, d2 denotes a water depth of 0.55 m, and the final numbers 1–5 represent incident wave heights ranging from low to high (Table 1).
Table 4. Change ratios of erosion and deposition volume between scenarios with and without submerged vegetation.
Test NamesChange Ratios of Erosion Volume (-)Change Ratios of Deposition Volume (-)Change Ratios of Lagoon Deposition Volume (-)
SandbarForeduneSandbarForedune
S-d1110.66%−61.51%−42.96%−82.20%−55.03%
S-d129.49%−48.32%−7.61%−44.55%−50.77%
S-d13−12.94%−29.37%8.91%−3.43%−4.06%
S-d14−2.41%−18.92%16.98%48.48%−20.37%
Average−7.67%−39.53%12.95%−43.39%−32.56%
S-d21−10.48%−15.03%69.13%3.15%−3.09%
S-d22−21.31%−17.68%47.73%−1.51%30.08%
S-d23−1.09%8.21%−10.83%−17.04%−44.30%
S-d24−2.70%−10.32%3.61%−29.99%−29.63%
S-d259.53%−6.36%21.72%31.10%28.15%
Average−8.90%−12.35%35.55%−16.18%−25.67%
When the average result is negative, only negative values are considered. Conversely, when it is positive, only positive values are considered. N indicates “without vegetation”, S signifies “with vegetation”, d1 denotes a water depth of 0.48 m, d2 denotes a water depth of 0.55 m, and the final numbers 1–5 represent incident wave heights ranging from low to high (Table 1).
Disclaimer/Publisher’s Note: The statements, opinions and data contained in all publications are solely those of the individual author(s) and contributor(s) and not of MDPI and/or the editor(s). MDPI and/or the editor(s) disclaim responsibility for any injury to people or property resulting from any ideas, methods, instructions or products referred to in the content.

