Article

Prediction of Beach Sand Particle Size Based on Artificial Intelligence Technology Using Low-Altitude Drone Images

1
Department of Coastal Management, Geosystem Research Corp., Gunpo 15807, Republic of Korea
2
Department of Civil Engineering, Kookmin University, Seoul 02707, Republic of Korea
3
Numerical Model Research Institute, Geosystem Research Corp., Gunpo 15807, Republic of Korea
4
Department of Geospatial Information, Geosystem Research Corp., Gunpo 15807, Republic of Korea
*
Author to whom correspondence should be addressed.
J. Mar. Sci. Eng. 2024, 12(1), 172; https://doi.org/10.3390/jmse12010172
Submission received: 13 December 2023 / Revised: 8 January 2024 / Accepted: 12 January 2024 / Published: 16 January 2024

Abstract

:
Coastal erosion is caused by various factors, such as harbor development along coastal areas and climate change. Erosion has been accelerated recently due to sea level rises, increased occurrence of swells, and higher-power storm waves. Proper understanding of the complex coastal erosion process is vital to prepare measures when they are needed. Monitoring systems have been widely established around a high portion of the Korean coastline, supported by several levels of governments, but valid analysis of the collected data and the following preparation of measures have not been highly effective yet. In this paper, we use a drone to obtain bed material images, and an analysis system to predict the representative grain size of beach sands from the images based on artificial intelligence (AI) analysis. The predicted grain sizes are verified via field samplings. Field bed material samples for the particle size analysis are collected during two seasons, while a drone takes photo images and the exact positions are simultaneously measured at Jangsa beach, Republic of Korea. The learning and testing results of the AI technology are considered satisfactory. Finally, they are used to diagnose the overall stability of Jangsa beach. A beach diagnostic grade is proposed here, which reflects the topography of a beach and the distribution of sediments on the beach. The developed beach diagnostic grade could be used as an indicator of any beach stability on the east coast of the Republic of Korea. When the diagnostic grade changes rapidly at a beach, it is required to undergo thorough investigation to understand the reason and foresee the future of the beach conditions, if we want the beach to function as well as before.

1. Introduction

Coastal erosion is caused by various factors, such as the development of coastal areas and climate change. In recent years, the rate of erosion has been accelerating due to the rise in sea levels and the increased occurrence of flurry hazards [1,2]. The coastal area is of high economic value as a tourism resource. Coastal erosion reduces its value through the loss of white sand as well as threatens the safety of structures around the coast [3,4]. Coastal erosion involves complex processes, which has hindered qualitative or quantitative understanding and design of accurate countermeasures in many countries [5]. Big data says that the population in coastal areas is increasing, especially near risky zones, thanks to sea level rise. This will inevitably cause more disasters along coasts in the future [6,7].
Located in the center of Northeast Asia at 33~43 degrees north latitude and 124~132 degrees east longitude, between China to the west and Japan to the east, the Republic of Korea has been conducting video monitoring and regular on-site surveys at the national level since 2004 to investigate the status of coastal erosion in the country. Currently, 250 locations across the country are surveyed every year [8]. However, in the case of field surveys, human resources are needed to collect samples and obtain coastal lines, beach widths, beach sand particle sizes, and basic data, so surveys are conducted by smaller coastal area units rather than the overall beach area due to the limitations of time and cost. For the sustainable conservation and utilization of the coastal environment, a coastal monitoring and diagnostic technology using the latest advanced technologies should be first developed [4].
To understand coastal erosion, we need to understand the dynamics of sediment transport processes, which combine complex processes between coastal external forces and the marine environment [4]. One of the key indicators of importance for this is the characterization of sediments. Depending on the complexity of the model, the particle size distribution is analyzed via the characteristic diameter (e.g., average diameter) or using sediment grade distribution curves [9]. The sediment particle size is important not only because of the initial movement of the sediment but also because it can help understand the roughness of the beach and the friction stress using the empirical formula, etc. [10,11]. Collecting the correction data necessary to explain the various compositions of sands distributed on the actual beach is time-consuming and expensive. This is because even within the spatial distribution, there may be places where the sediment characteristics are different and the characteristics themselves are classified locally, such as a mixture of sand and silt.
Traditional mechanical sieving for classifying sediments requires a significant amount of skilled labor, and the entire process of digging, transporting, and sieving is time-consuming, expensive, and very difficult to dispose of experimental sands. Therefore, the process of collecting and interpreting actual sands under the current situation is included in several parts of sediment analysis, although there are doubts about its productivity.
A solid idea to accelerate data collection is to estimate the particle size distributions in images. The so-called photoreceptor method, which manually measures gravel sizes in ground images, was first proposed in the late 1970s and needed some supplementation in terms of accuracy, but it was a groundbreaking attempt at efficient analysis of sampling data [12,13]. Since then, many researchers have attempted to analyze particle sizes automatically. There have been some similar attempts to predict particle size on the coast [14,15,16,17,18,19].
Classifying the types of bottom sediments using the ground image of the seabed as convolutional neural network (CNN) learning data revealed the close relationship between the bottom sedimentation and fish ecology and proposed the establishment of a sediment mapping and fish ecology prediction system using CNN in the future [20]. When a CNN was used to predict the morphological properties of sand, five types of individual images with different particle size shapes, such as the representative particle size, spherical, convex, and aspect ratio, were collected to extract the size and shape, and the individual particle size shape was predicted after learning the CNN [21]. The importance of normalization was emphasized in the pre-processing process, such as image segmentation and segmentation. In the laboratory, individual particles of 32 to 1000 size obtained from optical microscopes were predicted with a CNN, and there was also a study that experimented with various classification modules of a CNN to suggest an optimal prediction method for recognizing individual particle size [22]. Research on classifying six types of rocks through deep CNN models by acquiring rock cross-sections and texture images in the field emphasizes the importance of the resolution of input images and suggests that the process of linking with high-resolution unmanned aerial vehicle (UAV) is needed to increase the digital precision analysis and surveying efficiency in the future [23]. Many attempts have been made to overcome the possibility of mapping the sediment distribution through data-based approaches and the limitations of field sampling by monitoring the sediment distribution in river sands using high-resolution, low-coast UAV in rivers and learning them via a CNN [24]. Despite these existing studies, attempts to predict image-based marine sand and actual use cases of sand were insufficient. In these preceding studies, it was confirmed that image-based sediment particle size analysis has sufficient possibility, and attempts to predict image-based beach sand and actual sand utilization studies were judged to be insufficient. In the sand particle size prediction study using the most recently attempted ideal particle size image, we referred to the research case that minimized unnecessary preprocessing and predicted the sand particle size effectively by attempting to standardize the image.
In this study, a low-altitude drone flight method, an image-based sand particle size prediction, and a beach safety diagnosis prediction process were established to effectively collect sand particle size images from actual beaches. Image-based sand particle size prediction includes efficient research content that calculates the representative particle size through AI techniques while all the particle sizes are included in the image. Section 2 describes the materials and methods and Section 3 shows the analysis. Section 4 is the conclusion, which includes the results of this paper and future research contents.

2. Materials and Methods
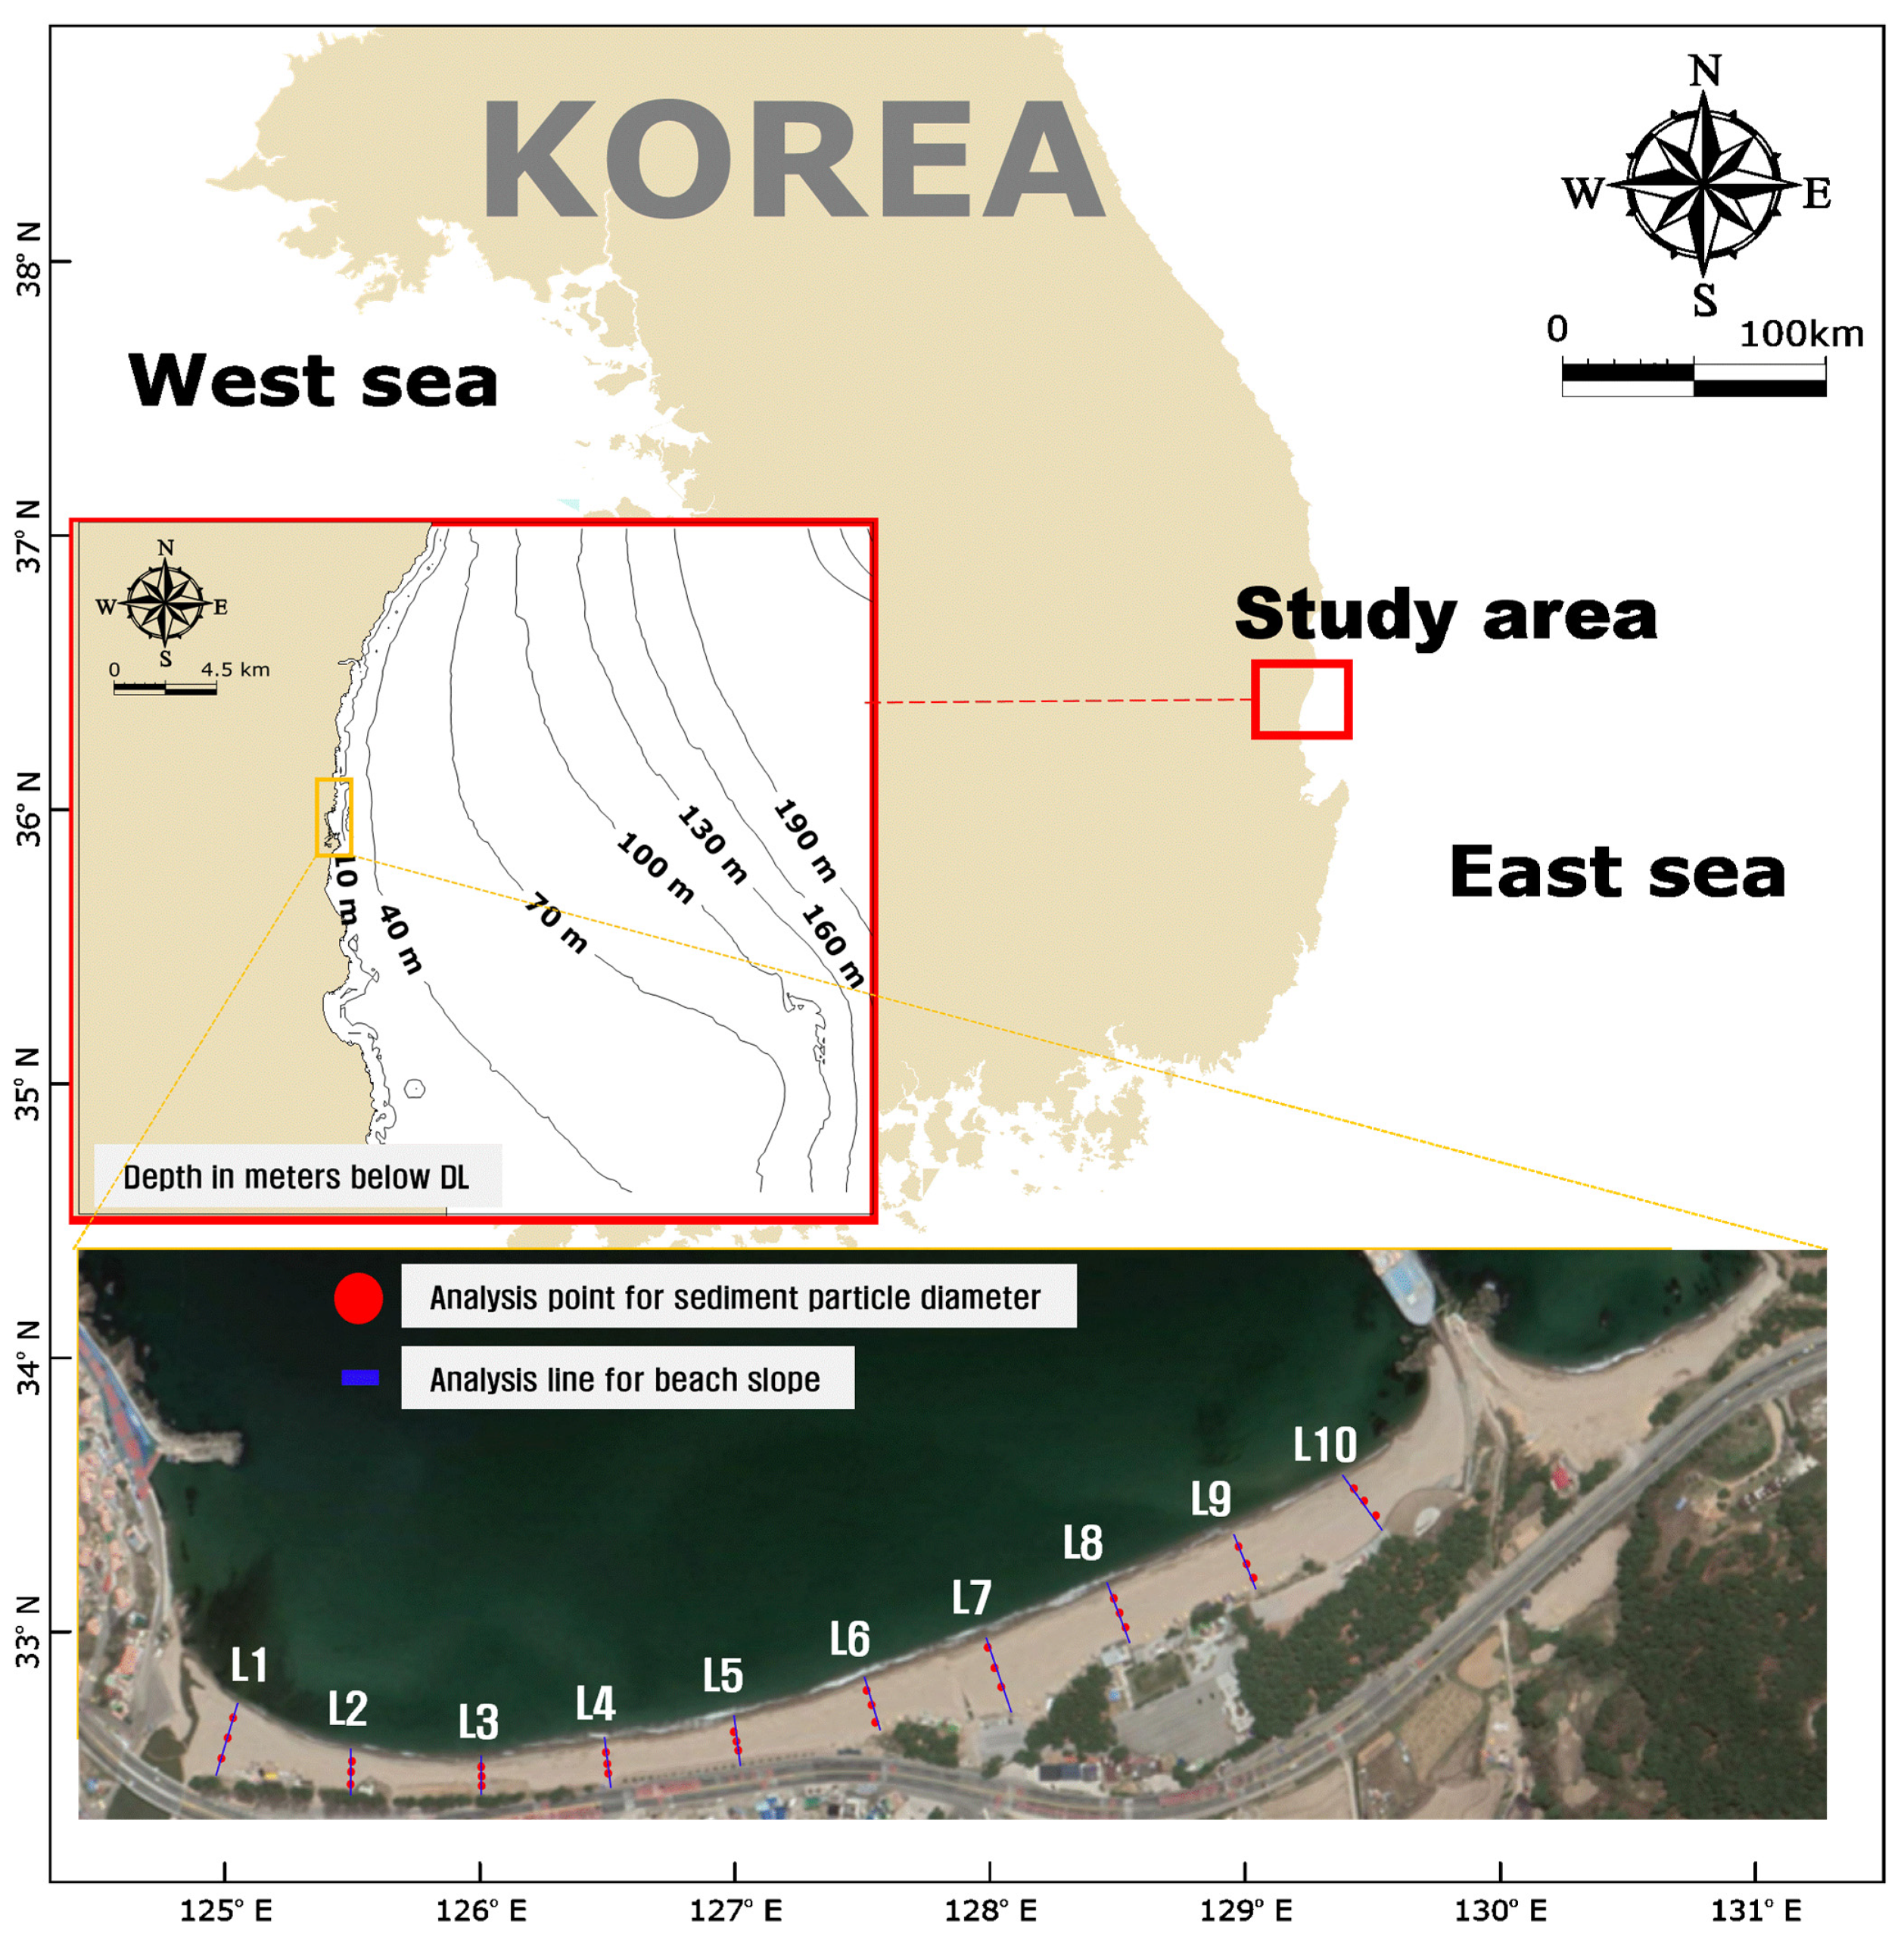
2.1. Study Area

The study site was Jangsa beach, Yeongdeok-gun, Gyeongbuk which is located on the east coast of the Republic of Korea (129°22′32″ E, 36°16′58″ N) (Figure 1). It is located on the coast of Uljin county, so many tourists enjoy the various facilities and leisure activities in the summer. There was an erosion prevention facility behind the beach, and a rail bike facility was in operation after that. The alongshore length was about 1.45 km in the south and north directions, and the beach sand particle diameter was mostly sand, with an average of about 1 mm. The beach widths were about 25–60 m, and the average berm height was up to 4 m. The small river flowing into the target seawall was the Jangsa river on the south side of the north breakwater, and a drainage path and a floodgate with a width of approximately 3 m were installed in the seawall.

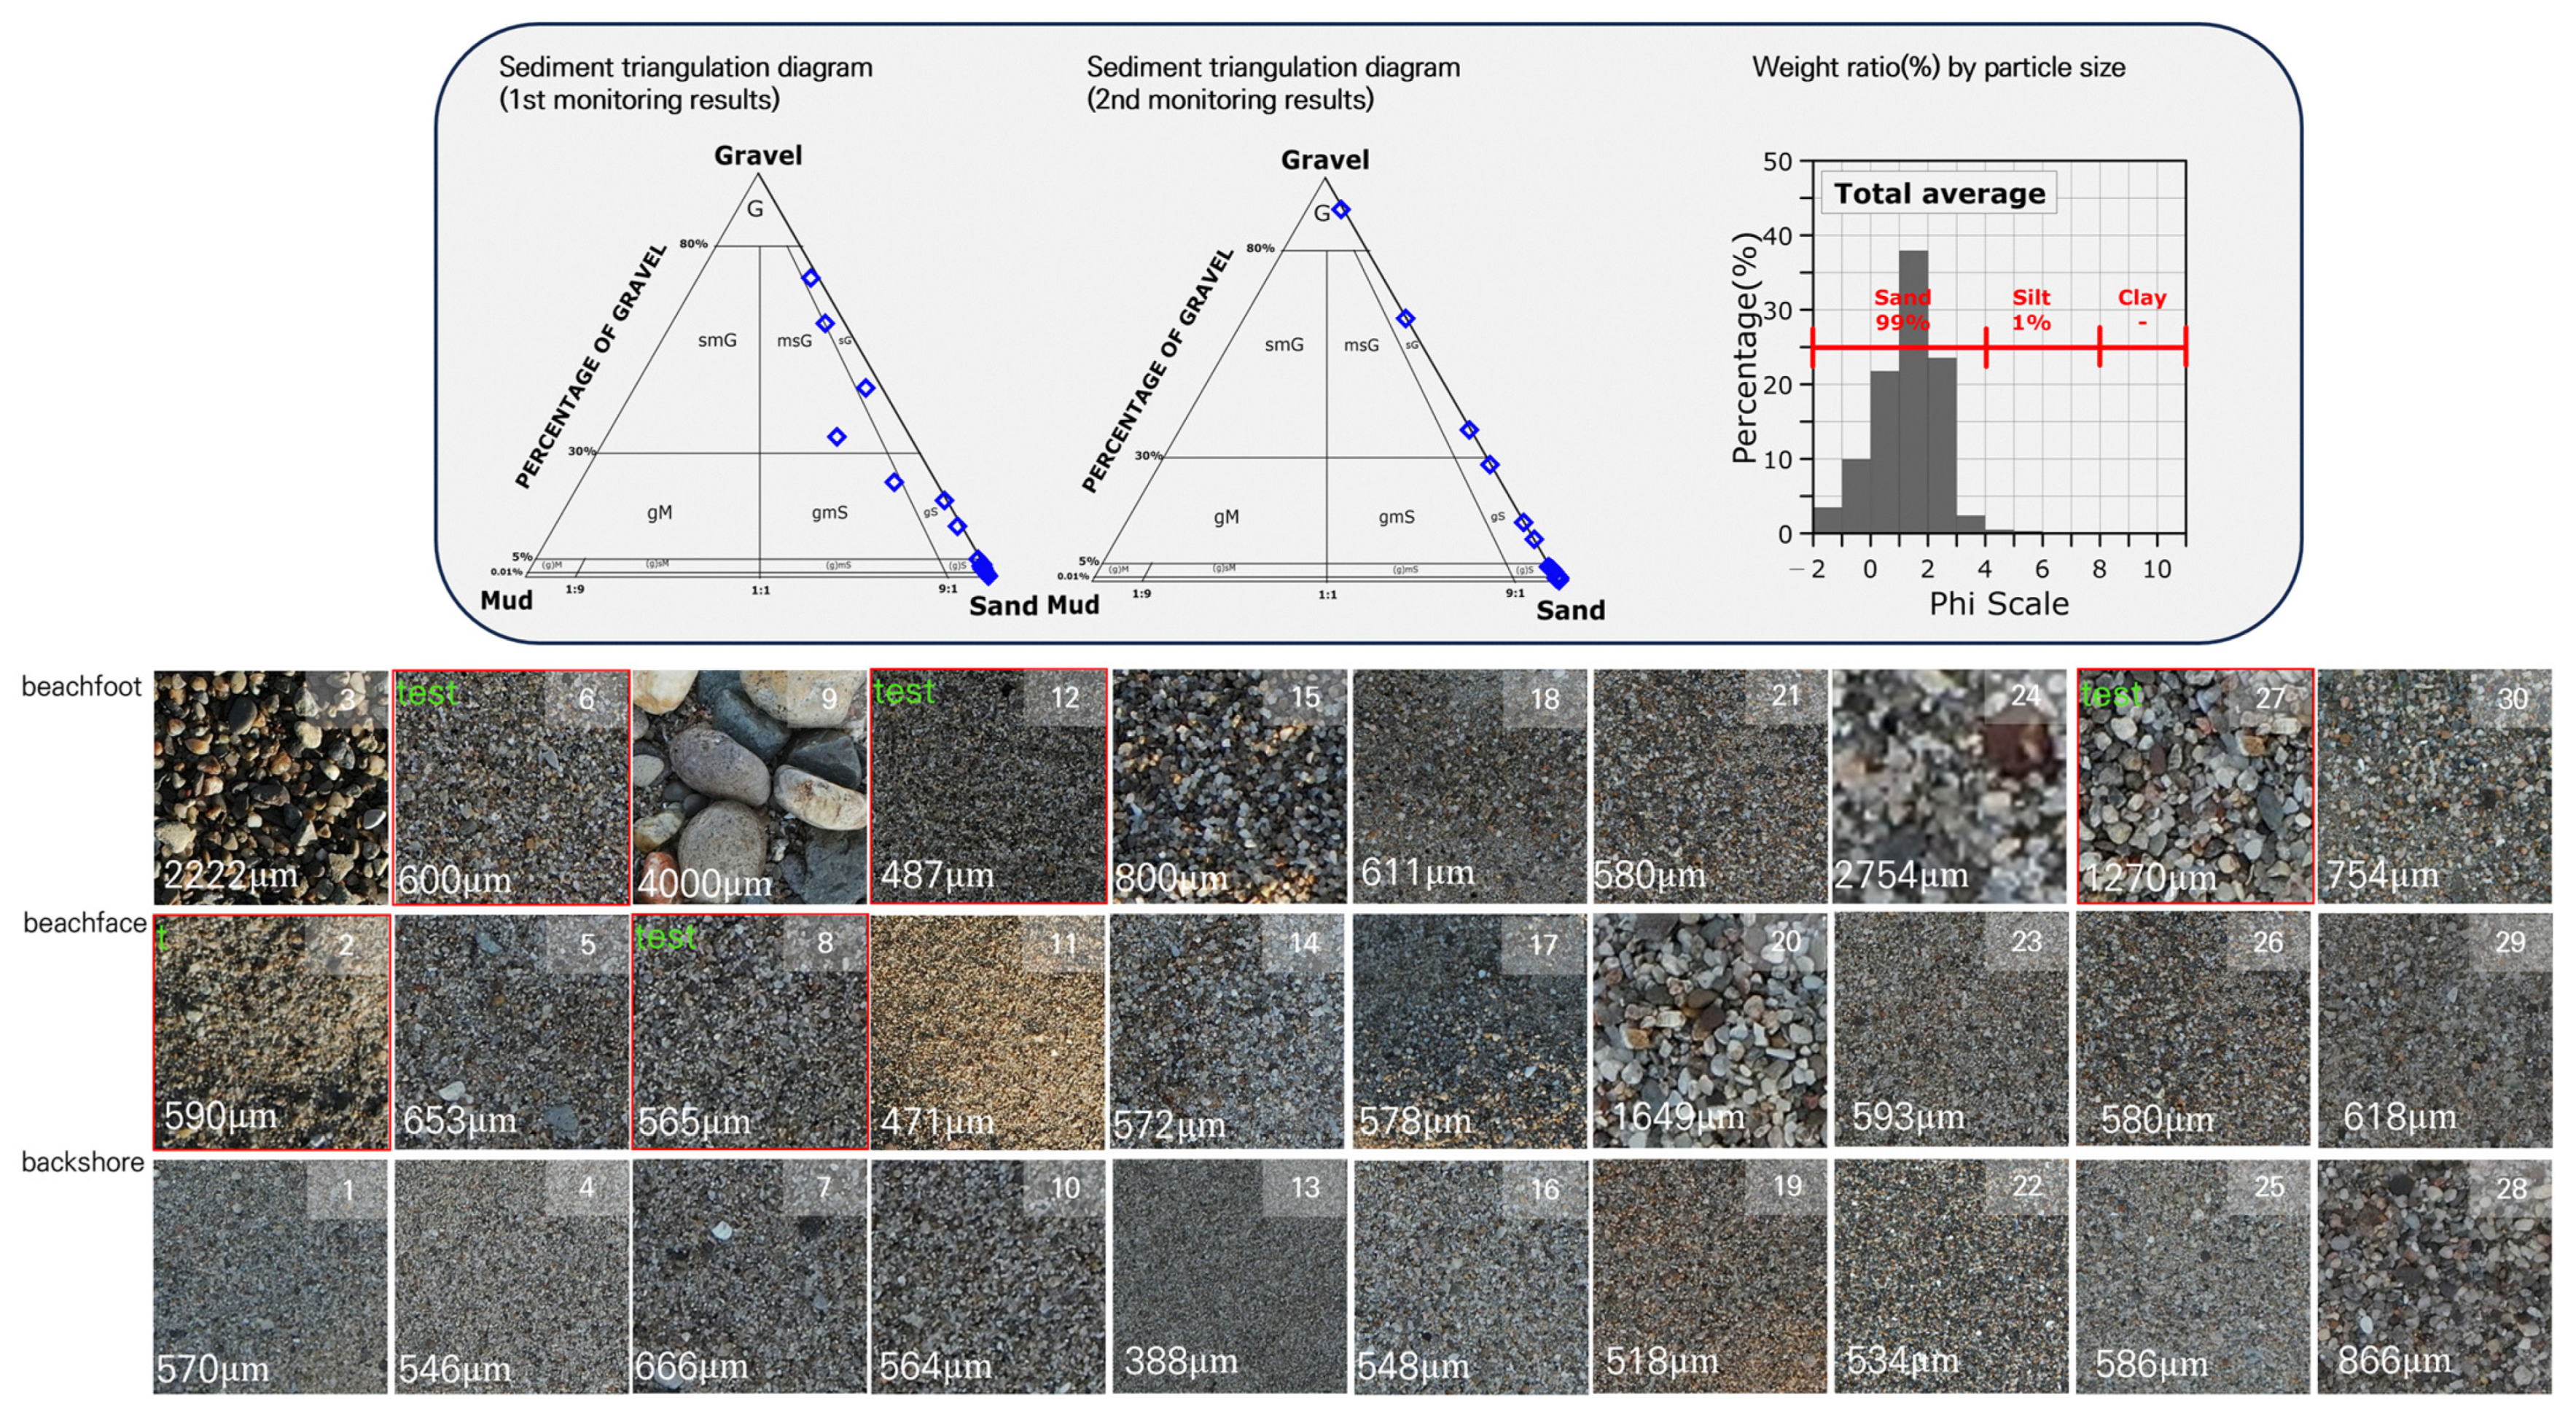
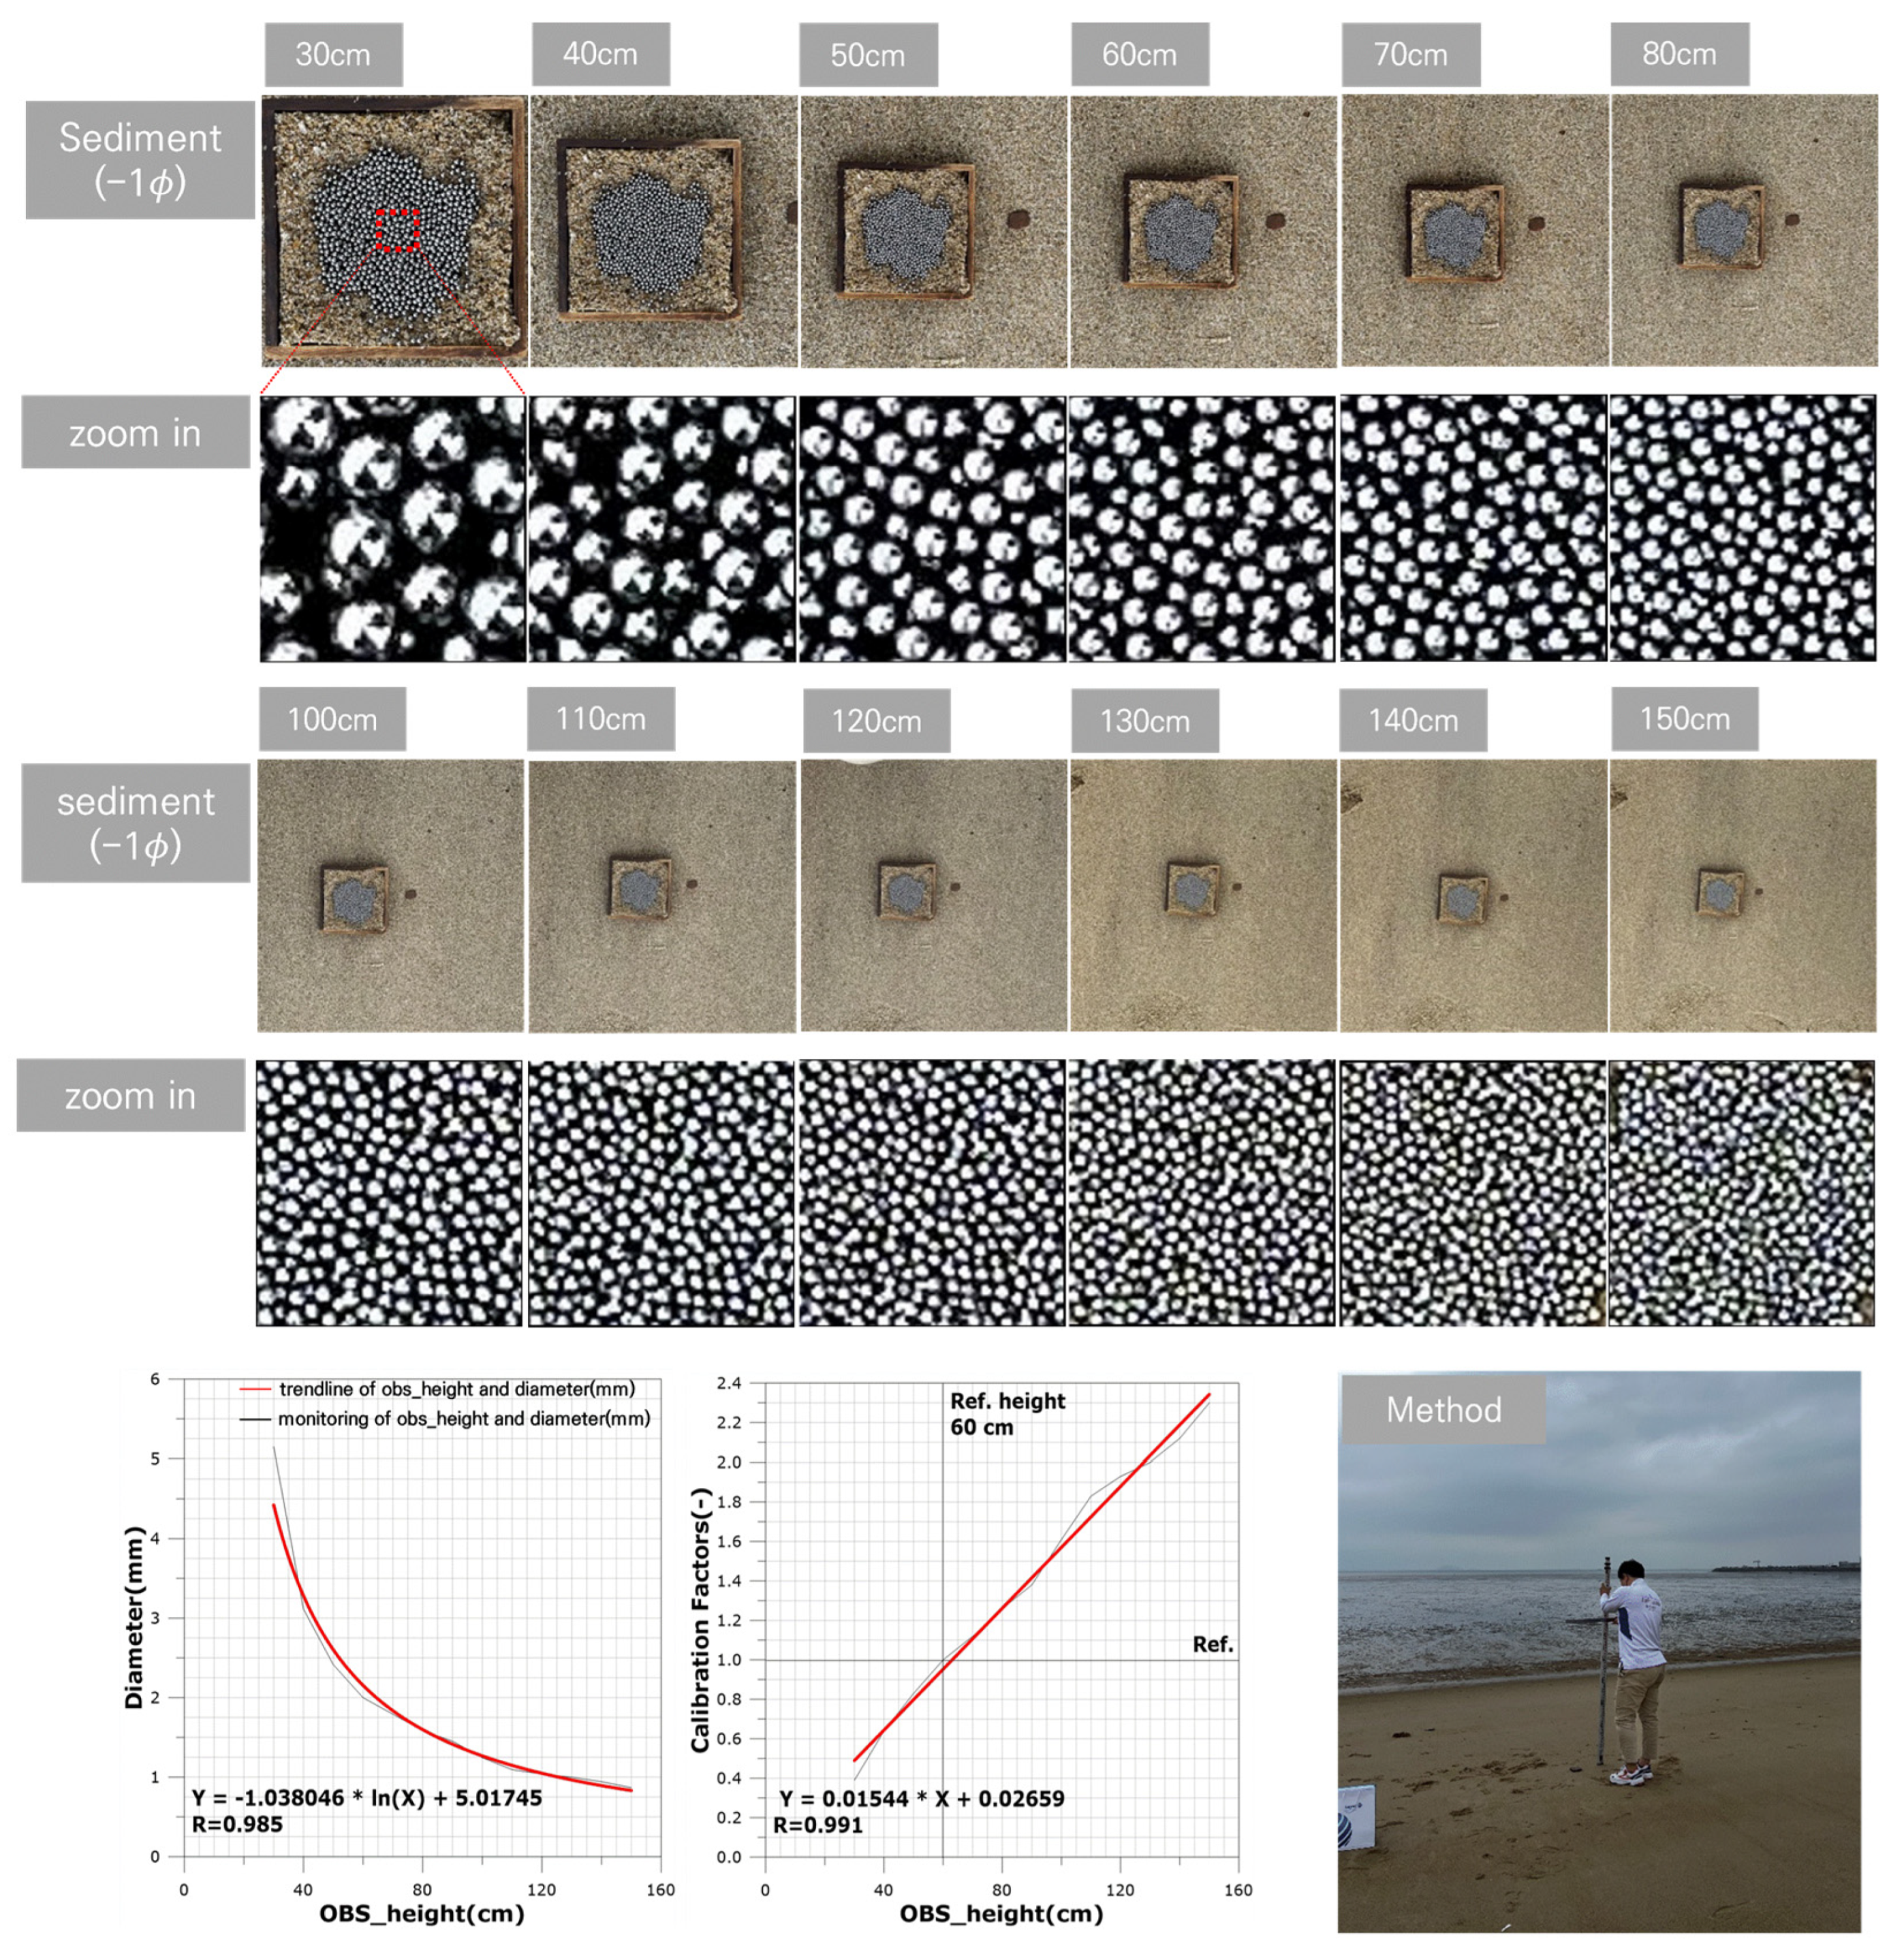
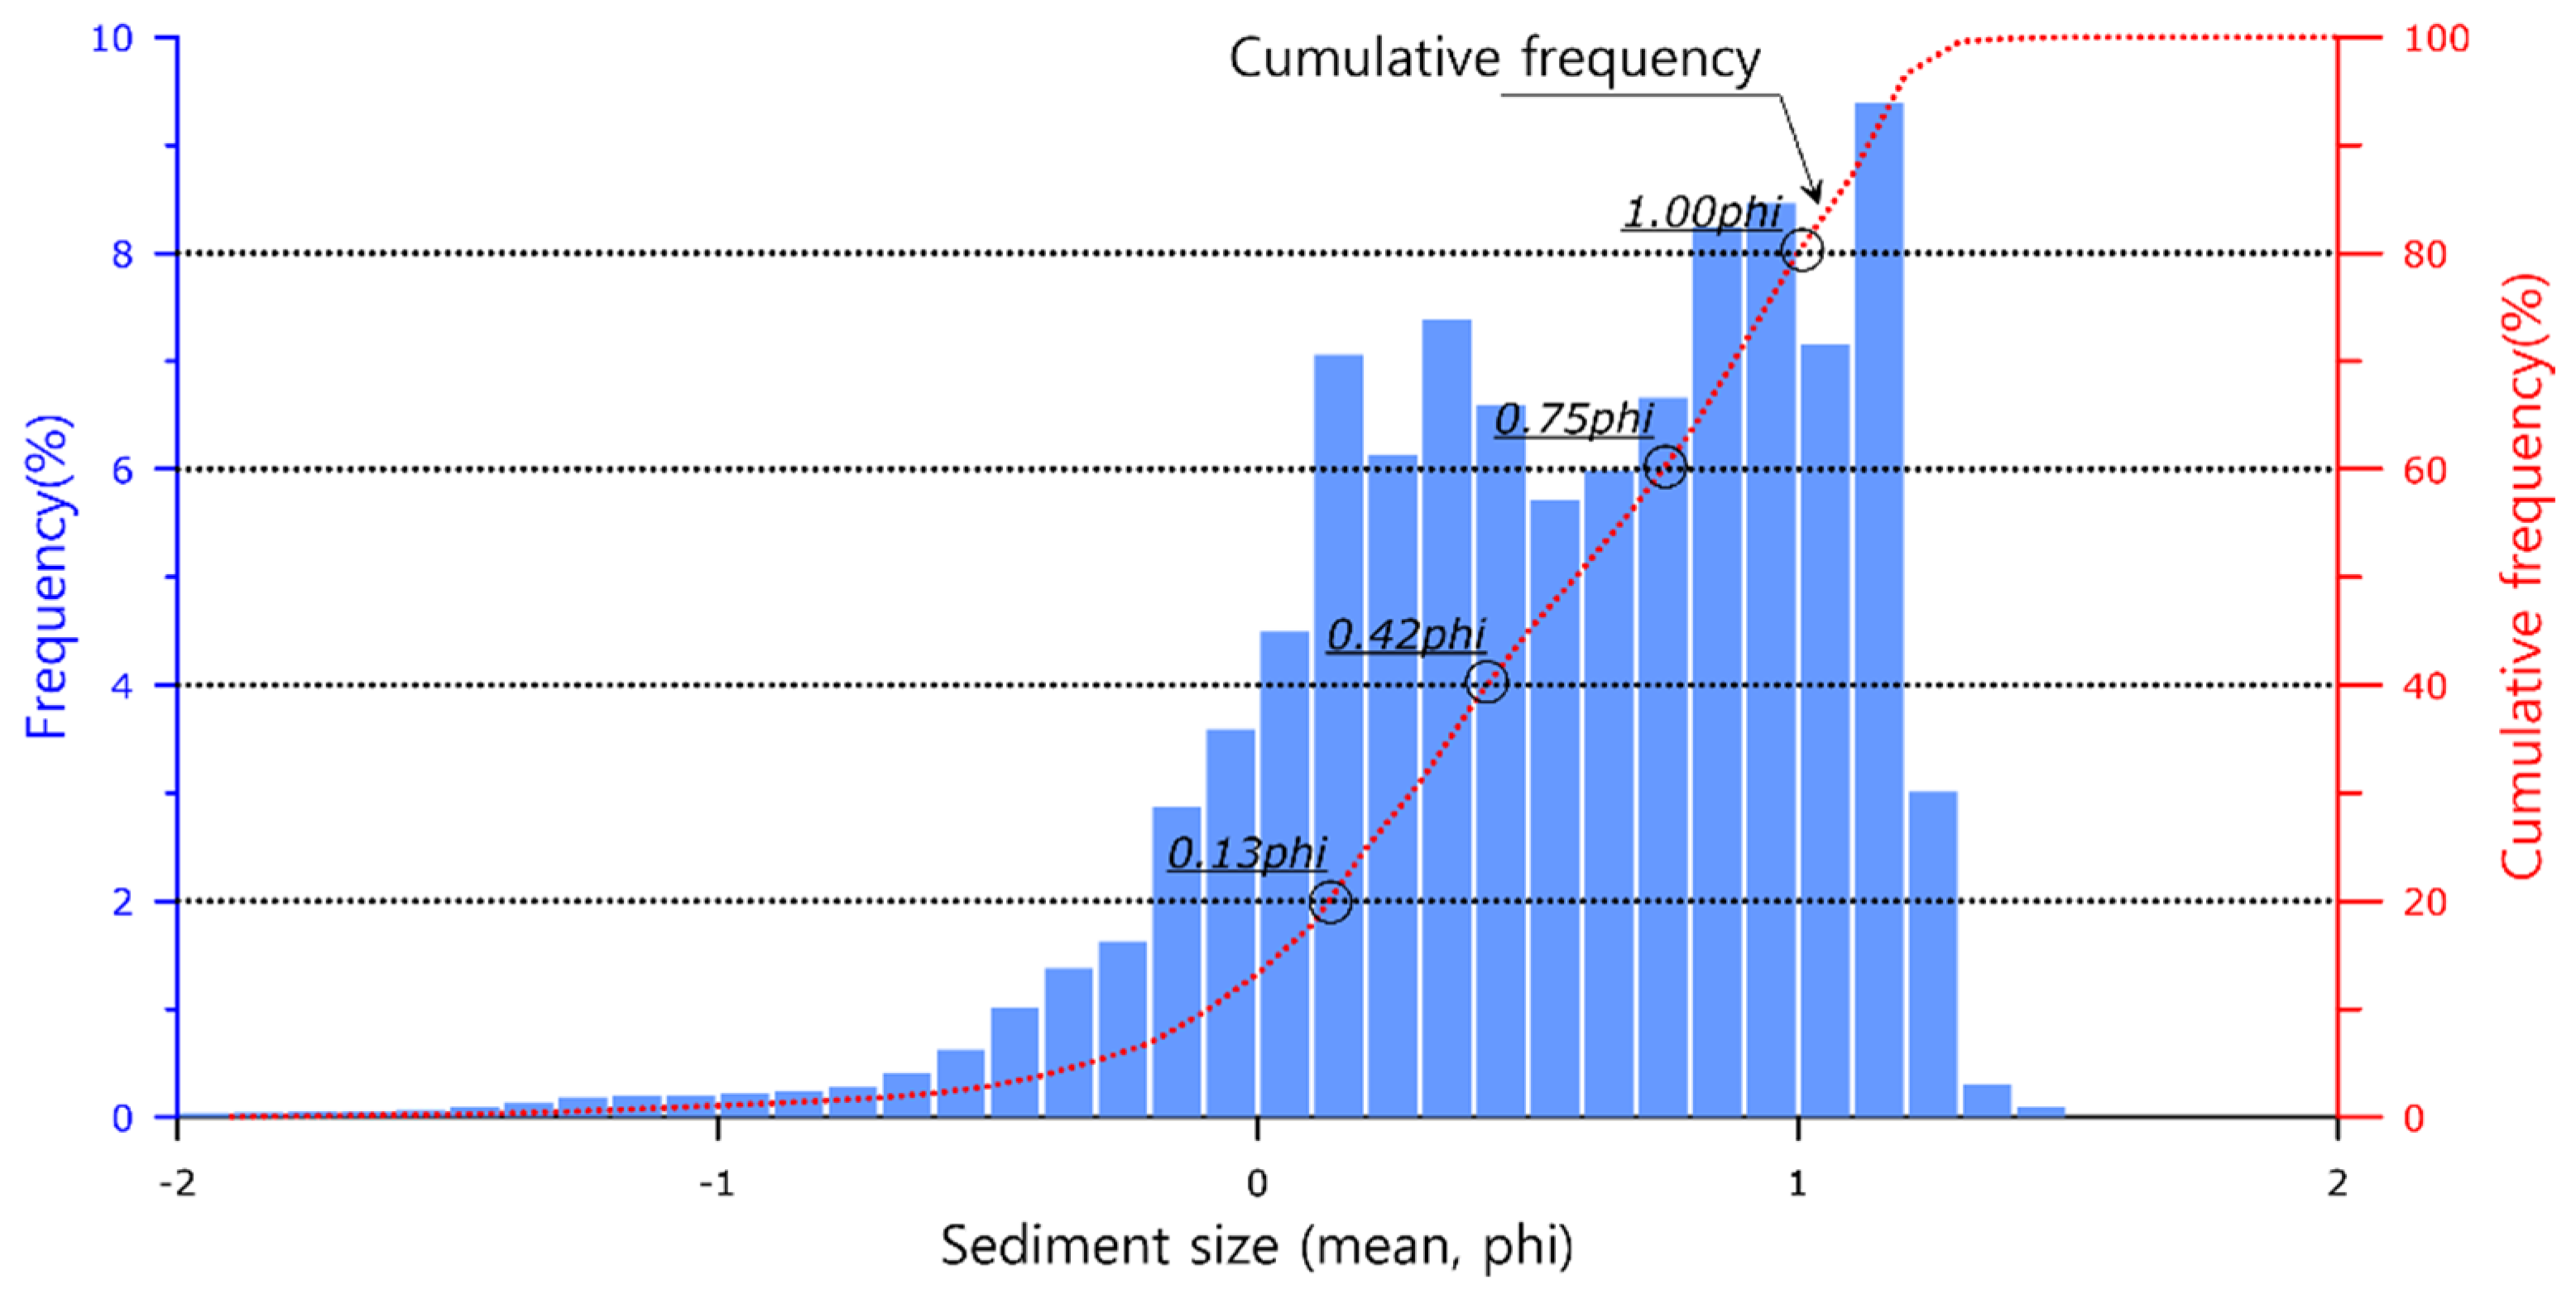
2.2. Sediment Collection and Analysis

Collecting sediment particle images using drones for SNN learning, and collecting sediment particle at the same location, were performed at 30 points in July and November 2022. Sieve analysis was generally performed in the laboratory, and the particle size analysis method of Fork and Ward (1957) was used for the classification [25]. The analysis results are shown in Figure 2. Most of the sediment was sand in the range of −2 ϕ to 2 ϕ , and the particle size was dominant around 1 ϕ . The particle size was large on the coast and gradually became uniform through the beachface and backshore.
Sediment particle images were generalized and analyzed using the same standard. The drone used was a DJI Matrice 300 RTK, and the camera lens used an effective pixel of 45 m. The initial image taken of the sediment was 4000 × 3000 pixels. At this resolution, the drone image had a large amount of sediment images, and the region of interest (ROI) was set as an area containing common particle size images for the normalization of images and machine learning analysis. The ROI size was 300 × 300 pixels. The drone flight went through numerous trials and errors. When the drone was unable to stay still and kept moving, there was a disadvantage that the image was shaken and smoothed, so the optimal decision was to acquire information by continuously shooting instantaneous images with the move and stop technique. The point of the shooting was recorded with the log on the drone’s body, and the instantaneous image was acquired after the drone moved to the point of the shooting, and this was saved as an image (jpg) and an ASCII file. The drone shooting altitude was the biggest problem in setting the ROI and analyzing the image accurately. If the altitude was 1.5 m or higher, the grains of sand was smoothed, making the crystal unclear, and if it was 0.6 m or less, the focus was unclear. It was confirmed that photographing and acquiring images entirely depended on the camera performance. In this study, drone images near the low altitude (1 m) were acquired for optimal judgment. Elevation correction and generalization of images were performed from the acquired image, and data were collected by referring to previous studies, see Figure 3 [26].

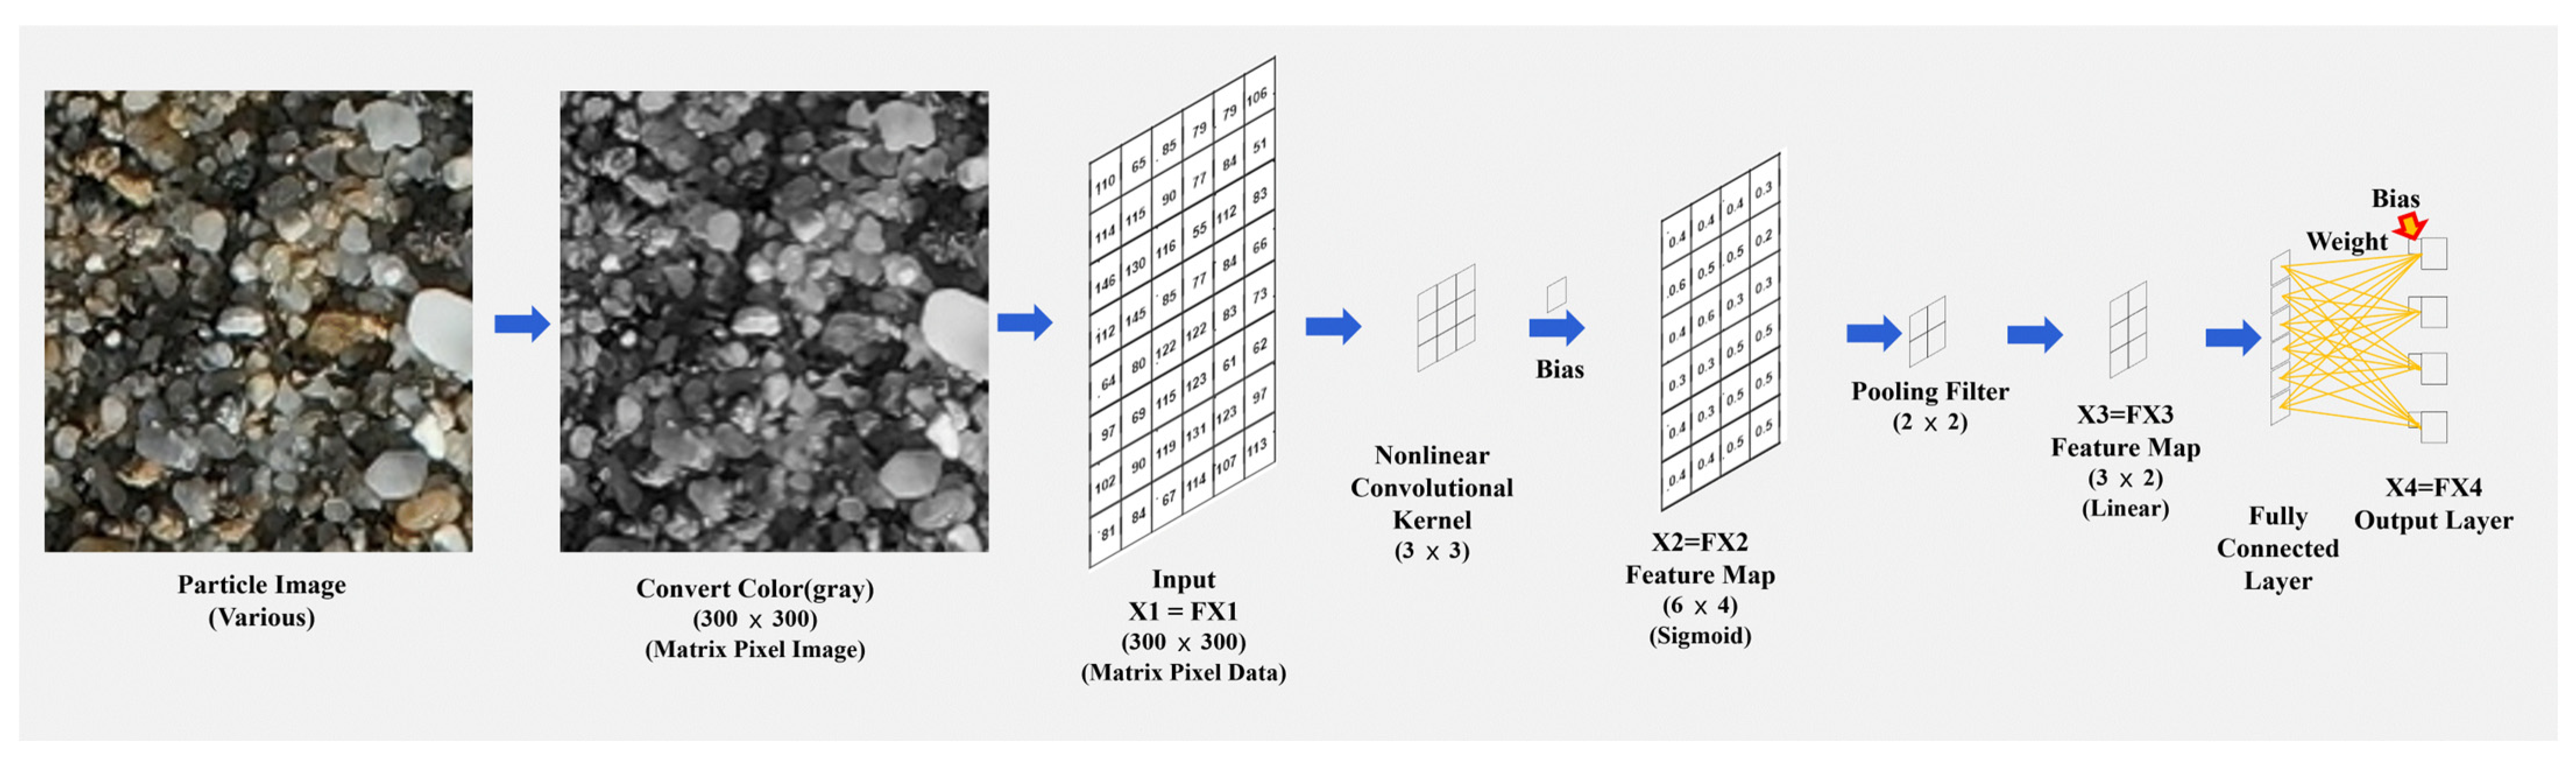
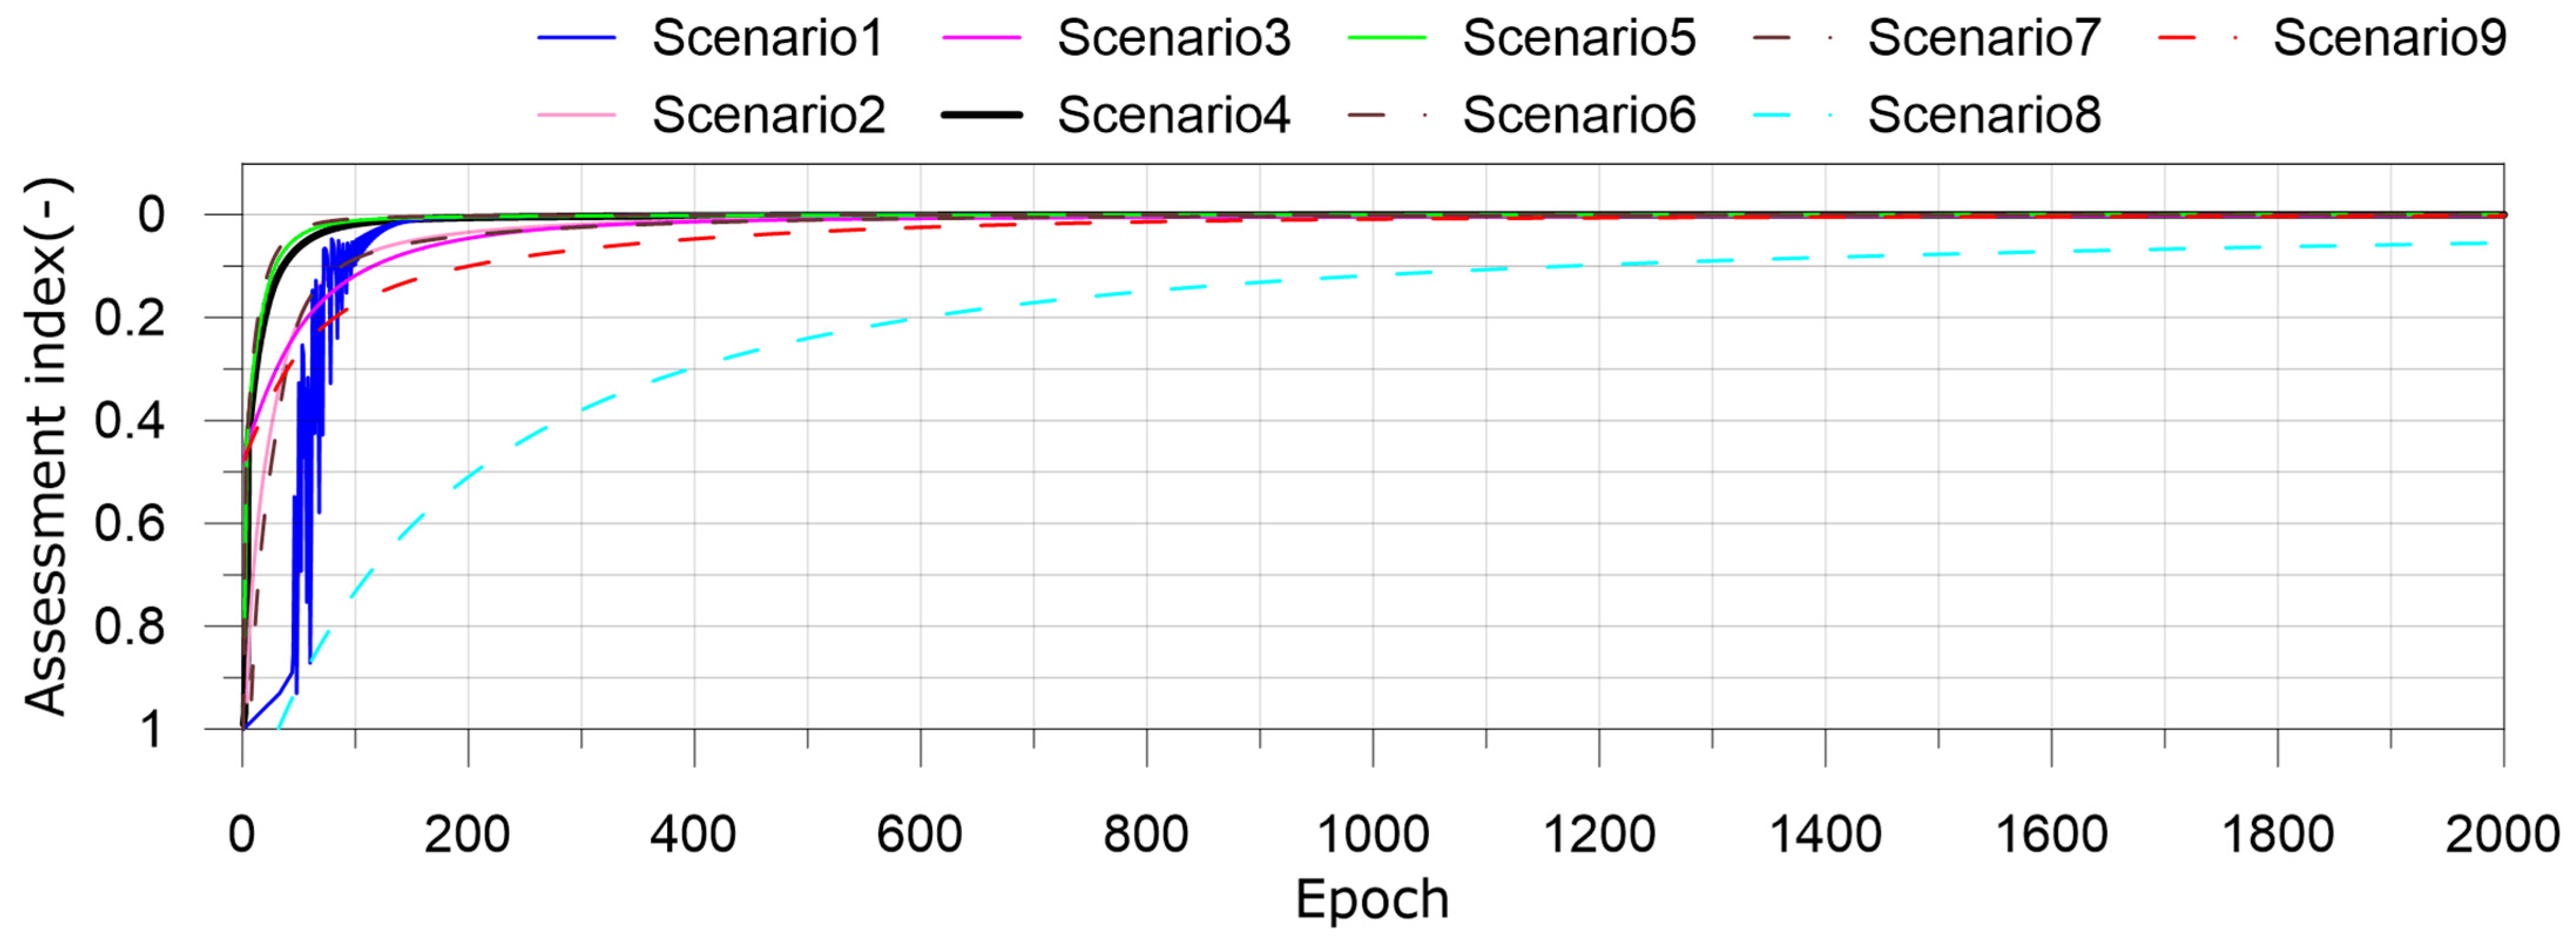
2.3. Machine Learning Modeling

A nonlinear subtraction kernel neural network (SNN) was applied to the deep learning convolutional neural network [27,28]. The SNN introduces modifications to the classic convolutional neural network (CNN) and applies nonlinear kernels. A new subtractive kernel was used via a nonlinear relationship between the input pixel values and the kernel weight coefficients. A typical advantage of the SNN was that compared to the convolutional layer solution of the existing CNN, the iteration number was significantly reduced at high speed and converged to more accurate results. We constructed the SNN architecture by applying a new convolutional layer, kernel, and pooling layer.
The new kernel between the input pixel and the feature map is composed of the weight coefficients to provide a positive role to the output, which is shown in Equation (1):
X 2 K F , I 2 , J 2 = B F K F I F J F F X 1 K F , I 1 , J 1 N F K F , I F , J F 2
where X2 is the feature map, KF is the kernel serial index, IF and JF are the two-dimensional kernel matrix indices, BF is the bias of each kernel, FX1 is the pixel input data matrix, and I 1 and J 1 are the corresponding input image pixel indices. The two-dimensional matrix element index NF is the kernel coefficient matrix for subtraction. Equation (1) shows the nonlinear relationship between FX1 and NF. The pooling layer is configured only once in the current architecture, while the coupled convolutional and pooling layers have been frequently used in existing models. As shown in Equation (2), training on the kernel coefficient involves the total error E t and bias BF of each NF. The error function is first calculated from Equation (1). Then, for NF, the differentiation with respect to X2 requires the kernel coefficient of NF and the pixel input data FX1 matrices, as shown in Equation (4):
E t N F K F , I F , J F = f X 2 K F , I 2 , J 2 N F K F , I F , J F
E t B F K F = f X 2 K F , I 2 , J 2 B F K F
X 2 K F , I 2 , J 2 N F K F , I F , J F = 2 F X 1 K F , I 1 , J 1 N F K F , I F , J F
The architecture of the SNN is obtained through the processes of image transformation, image matrix construction, nonlinear convolutional kernels, feature maps, pooling filters, and full connectivity with weights and biases. The architecture of the SNN is shown in Figure 4.

2.4. Design of Beach Safety Diagnostic Predictions

The particle size and slope of the beach are important clues to understand the trend of erosion and deposition of the beach [29]. The sediment particle size is a fundamental characteristic of beaches. It is used for simple primary classification (e.g., sand beaches, gravel beaches, and rock beaches), but it is also used to define beach conditions in a more sophisticated way. It has been a long-standing adage that coarser sediment sizes are associated with steeper beach slopes. In terms of beach tourism resources, most users prefer a terrain with fine sediments and a gentle slope and do not prefer a terrain with very assembled sediments and a steep slope. In terms of the topographic stability of the beach, a terrain consisting of generally assembled sediment particles is stable even on a relatively steep slope. However, a terrain consisting of fine sediment particles can be easily lost or collapsed on a steep slope.
The beach slope is a major concern for engineers because it affects the dynamics of uplift and backflow and, consequently, sediment concentration and transport. It is a key parameter in many engineering formulations, such as surf scaling and surf similarity parameters [30,31]. Additionally, a generalized understanding of the relationship between the beach slope and grain size is important. Rapid changes in both conditions can lead to evidence that erosion and deposition are active and insufficient for safety.
We propose a matrix-based stability grade under the concept that if there is a sediment grain size and slope topography throughout the beach, two key variables can be indexed through correlation. For the sediment grain size and slope type, data from the same area were obtained throughout the seasonal survey (July and November 2022). The slope of the beach was investigated from the dune to the mean sea level, and the data were collected using a drone. Figure 5 shows the data for a cross-section of the same location as the particle size analysis. For the grain size at the three vertices of the mean sea level, the beach face, and dune were investigated at the slope measurement location, as shown in Figure 1.
The gradient used to establish the concept of the stability correlation function using gradient-gradient introduces the terrain slope [32]. The terrain slope is represented as a slope angle S T in degrees, in keeping with the terrain modeling, and the equation is as shown in Equation (5):
S T   360 2 π × a r c t a n Z E Z W 2 x 2 + Z N Z S 2 y 2

3. Analysis Results

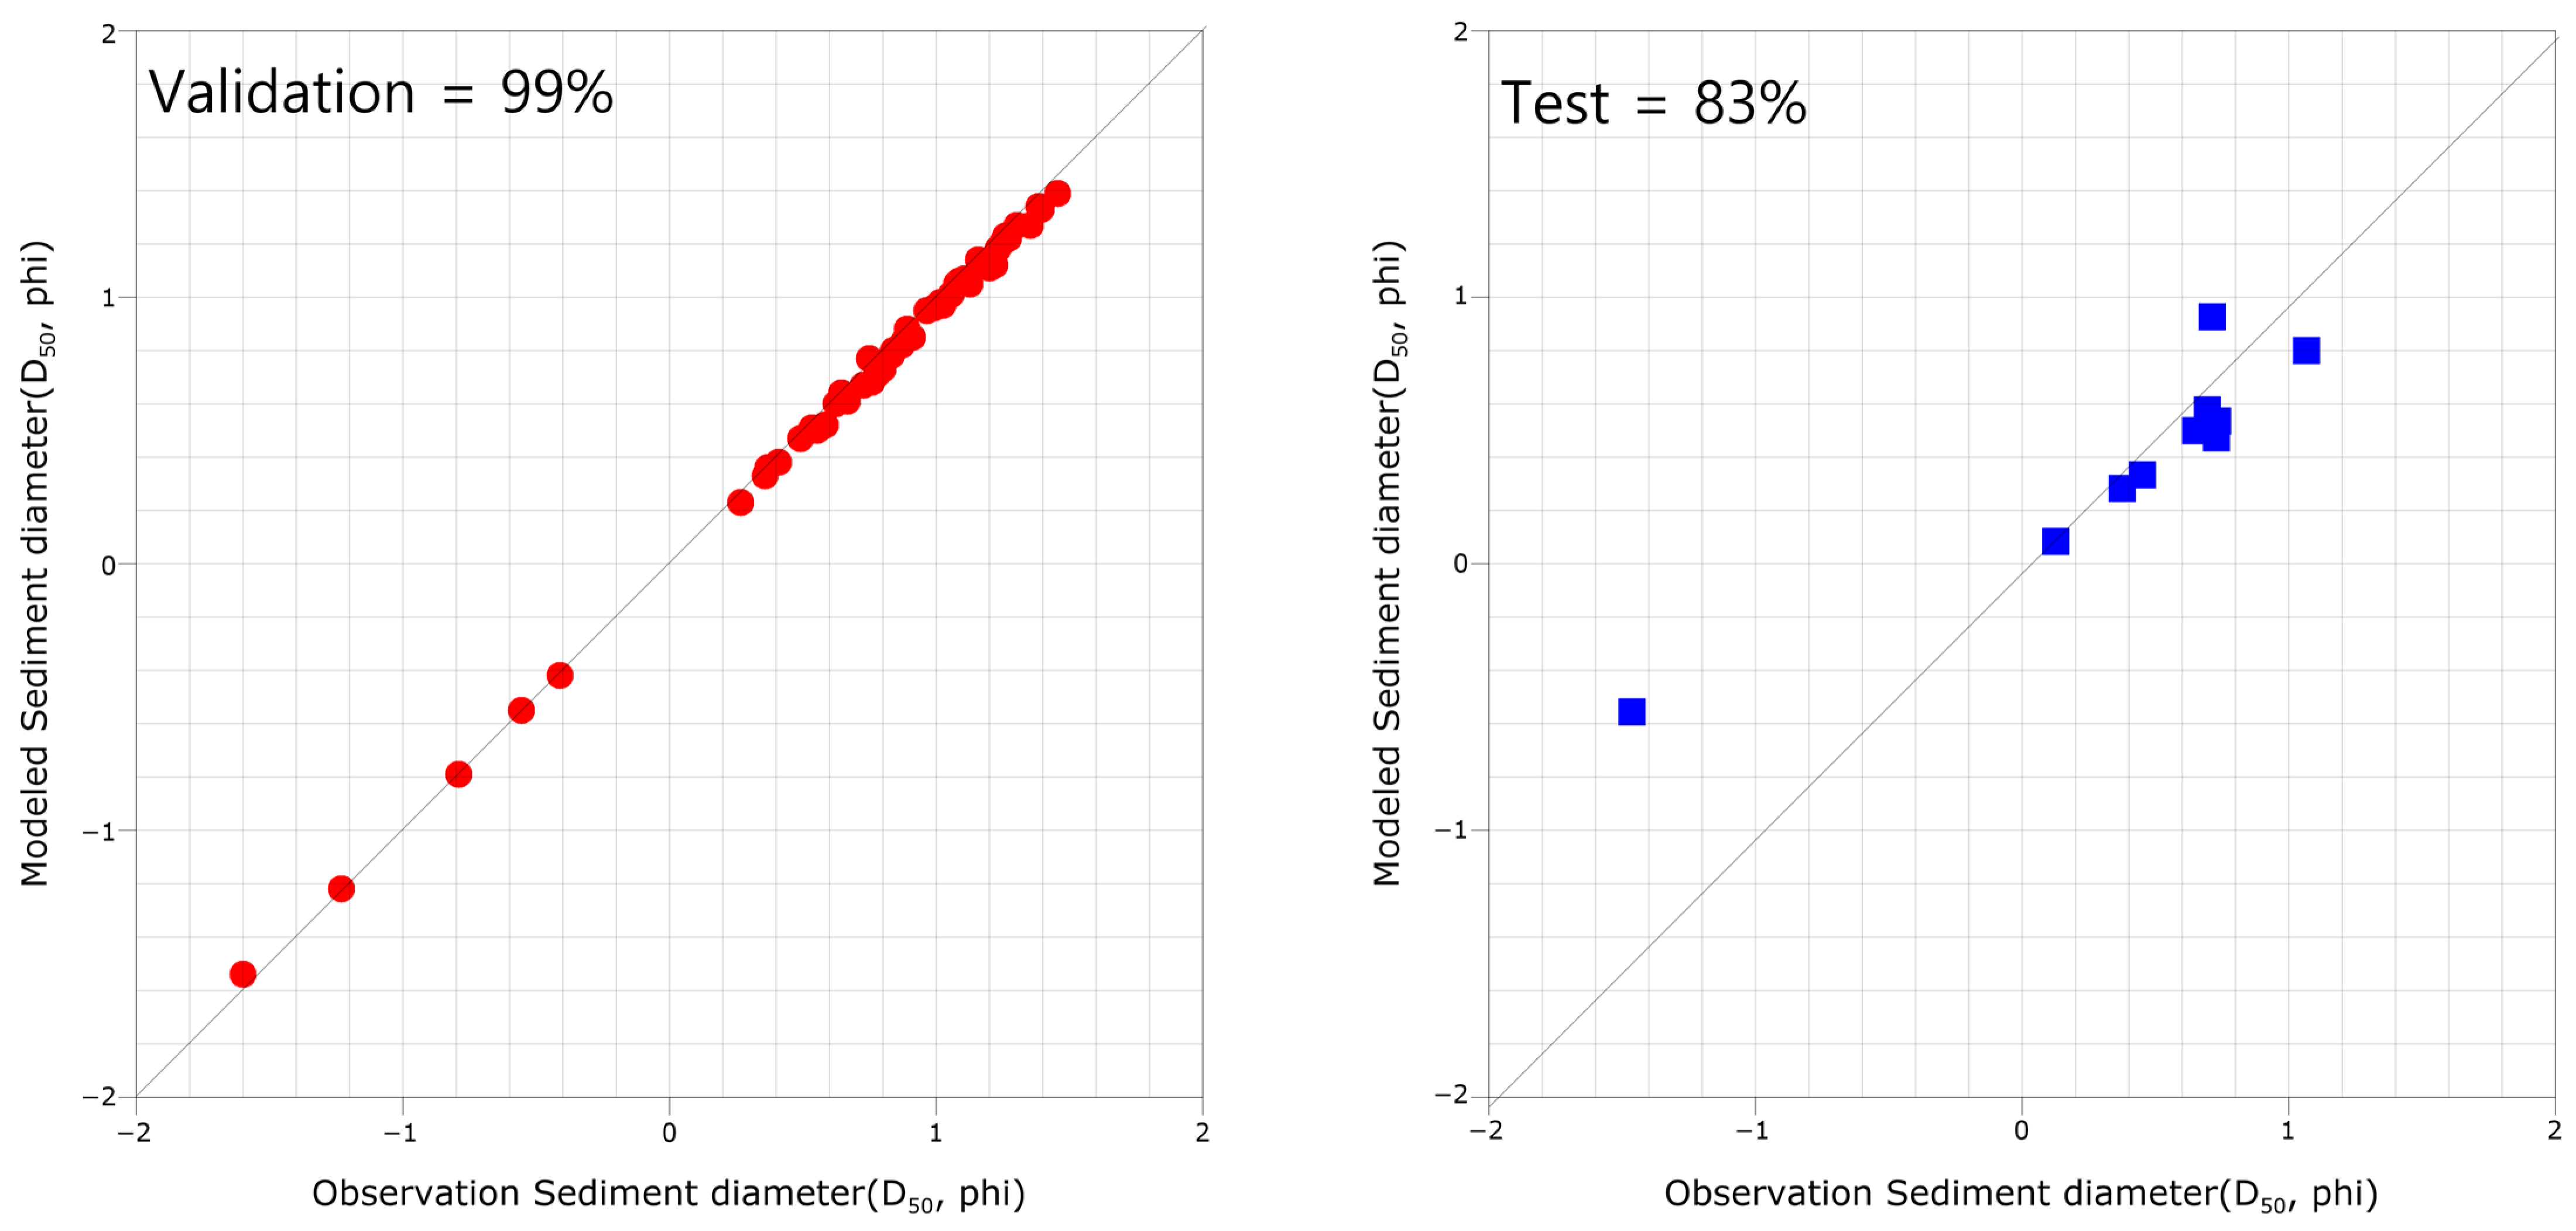
3.1. Calibration for Sediment Particle Diameter Using SNN Model and Particle Image

For the optimal verification of the neural network, scenario experiments, validation, and test experiments were performed, as shown in Table 1. A total of 60 data were obtained by collecting data on 30 particle sizes from Jangsa by season. The representative particle size was the sand and was distributed from −2 ϕ to 2 ϕ via sediment laboratory analysis.
The particle size analysis data were converted into digital images, 50 were used as training data, and 10 were used as data for the test. The digital image was converted into a gray scale mixed with R, G, and B information after altitude correction, stored as ASCII, and used for modeling. The epoch of the SNN was set to 2000 times to secure stability, and the linear method was applied to the full connected layer. The self-assessment of the training results after training was completed as presented in Figure 6, and a comparison of the observation sediment particle size and SNN model is presented in Figure 7, and the validation and test experimental results are presented in Table 1.
Validation refers to the training data and indicates how well the model recognizes the representative granularity used during learning. Test refers to a prediction process using data not included in the training data after learning is completed. Reproducibility was evaluated using the accuracy (%) of the model values compared to the observed values. The self-assessment time series means that as it converges to zero, the training accuracy approaches 100%. In most scenarios, the tracing accuracy converges to zero under an epoch of 1000 times, and the subsequent training was performed repeatedly to a degree close to zero. After 2000 epoch operations, the training error was very small, in the range of 0.002 to 0.00003. The optimal experimental conditions depend on the epoch of the neural network, the number of parameters according to the construction of input data, the rate of change in total training error, and the test accuracy. As a result of the optimal parameter experiment, as shown in scenario 3, the number of convolution layers was 4, the convolution filter was 3 × 3 matrix, and the pooling layer was 2 × 2 matrix, and the validation and test were high, and the reproducibility was 99% and 81%, respectively, which are considered sufficient verification.

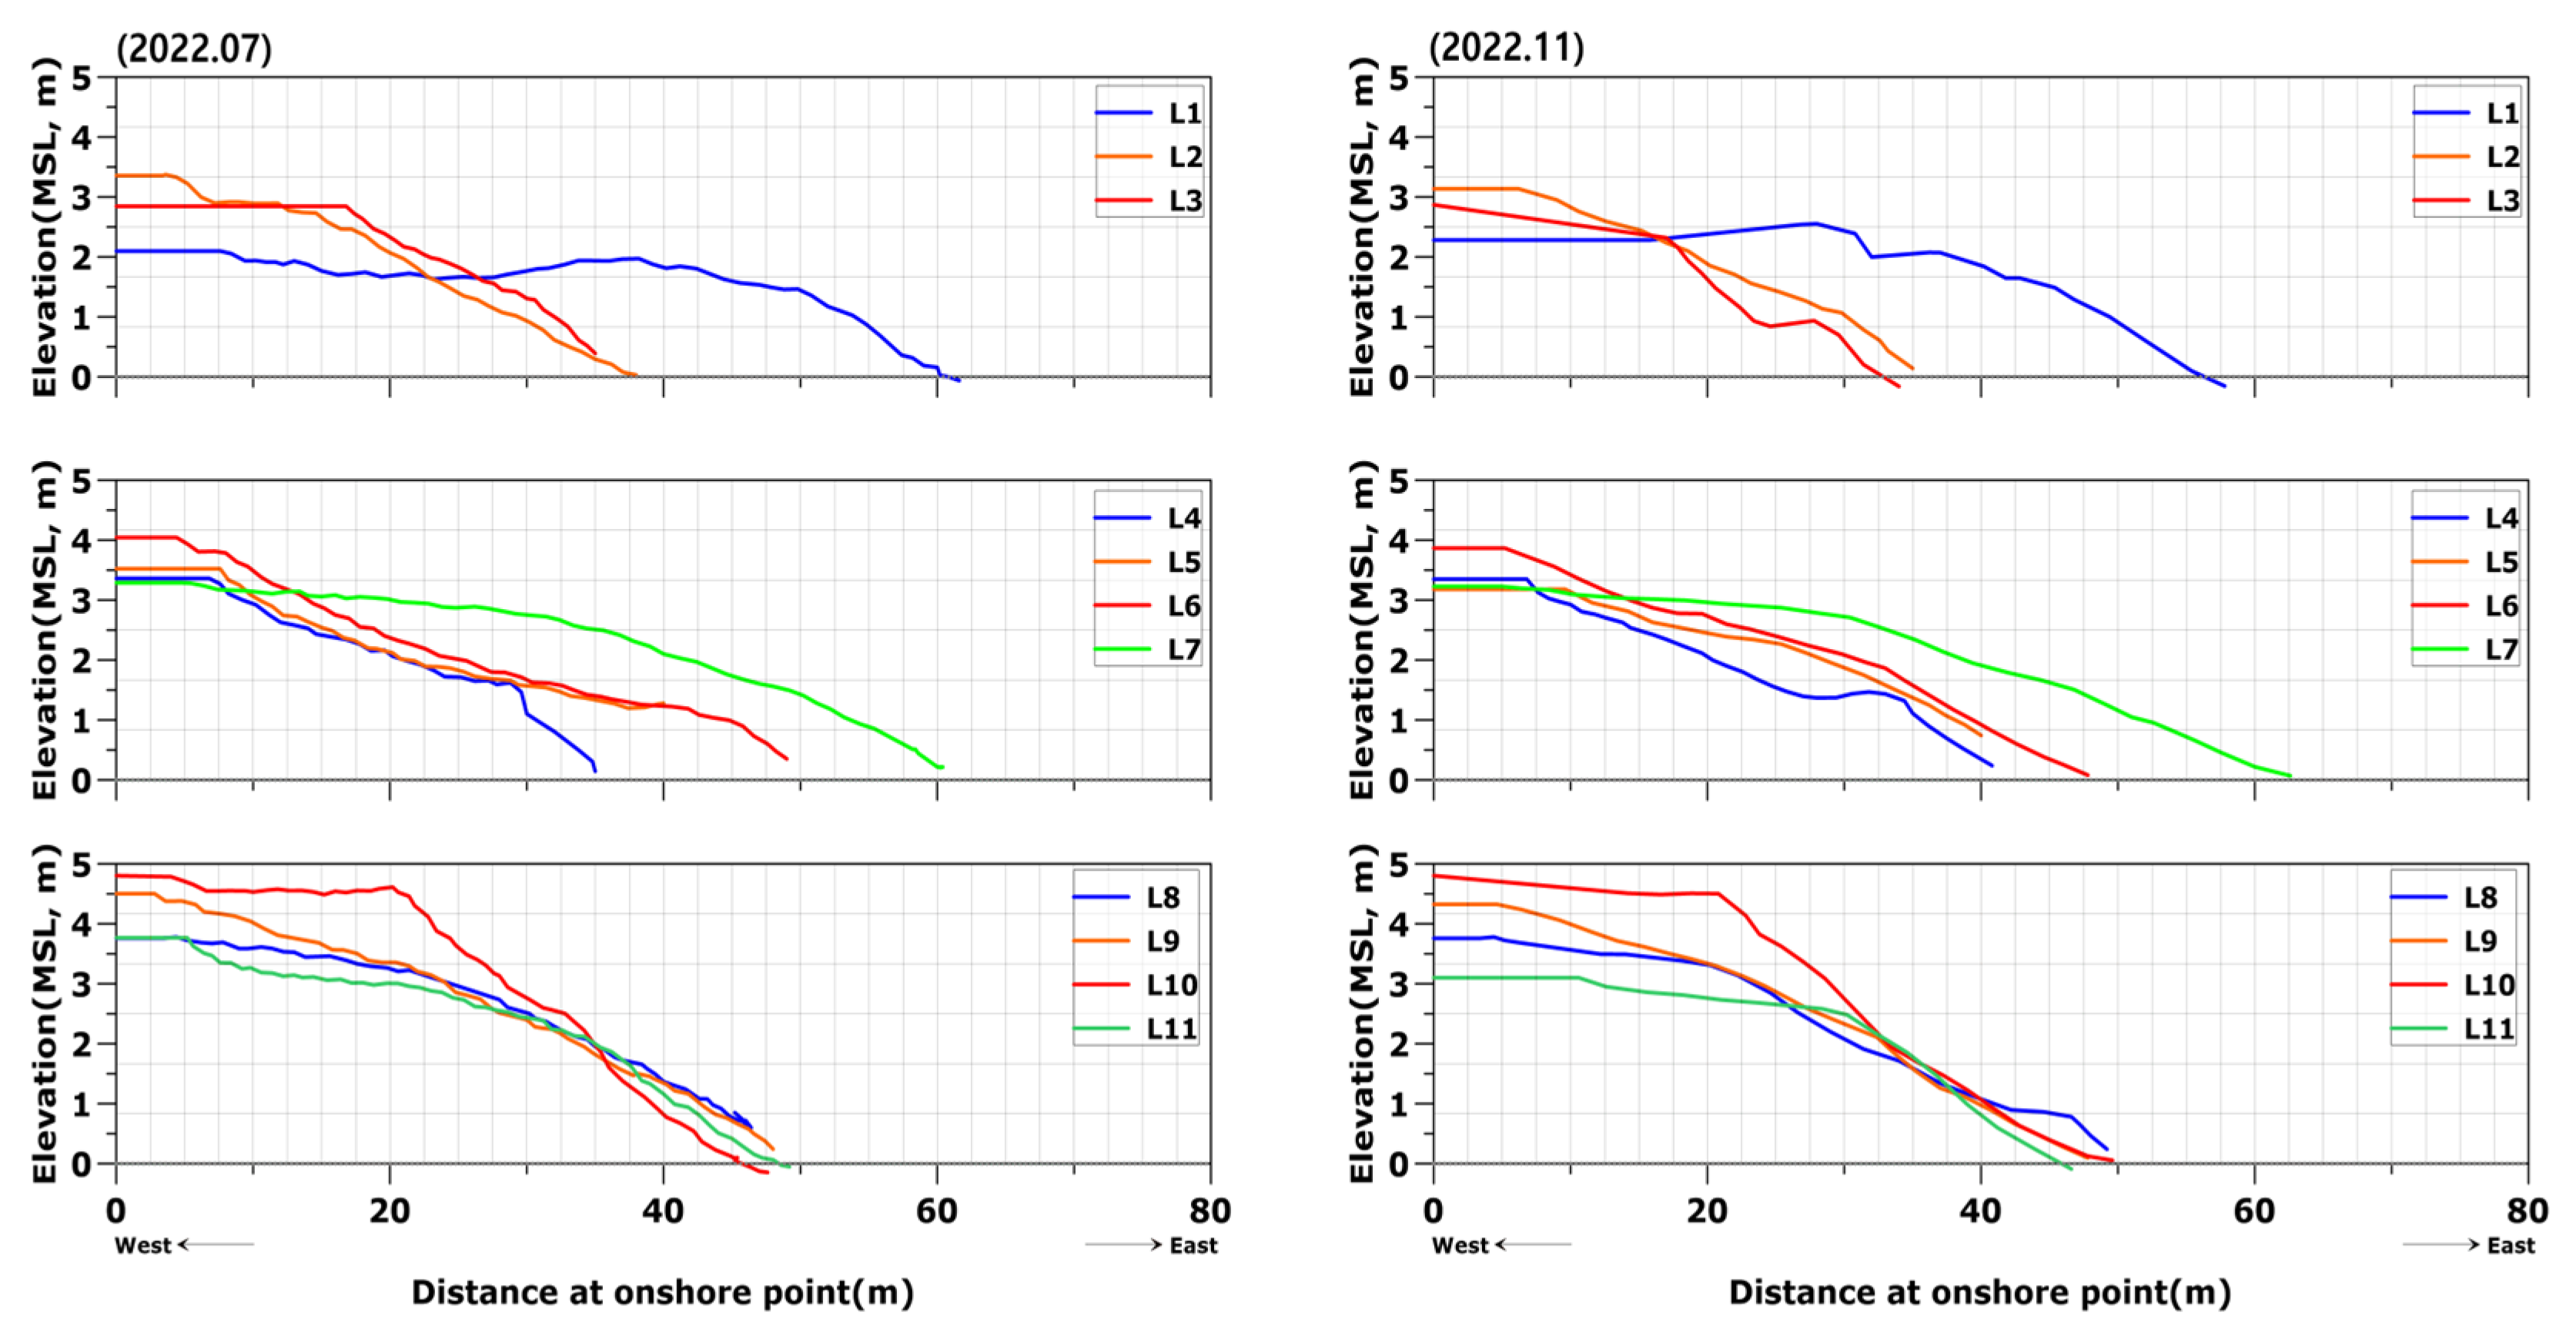
3.2. Analysis of Beach Stability by Season at Jangsa

We evaluated the beach stability of Jangsa in the Republic of Korea. Beach observation data were collected over two surveys, and through these data, the frequency distribution and cumulative curve of beach slope were analyzed, as shown in Figure 8. The frequency distribution and cumulative curve of the beach sediment particle size are shown in Figure 9. Figure 10 and Figure 11 show the results of monitoring conducted in July and November 2022. For two seasons, beach elevation data at 0.5 m intervals were obtained from drone survey data, converted to DEM data, mapped, and presented in Figure 10a and Figure 11a. The beach slope is data expressing the beach topography using the terrain slope technique and is presented in Figure 10b and Figure 11b. The sediment particle size distribution was extrapolated to the entire beach using data calculated for each vertex through the SNN model and is presented in Figure 10c and Figure 11c.
As a result of the comprehensive analysis, the slope was frequently within the range of 0 to 10 degrees, and the maximum value was below 5 degrees, indicating a generally gentle slope, as in Figure 9. In some areas, the slope was over 20 degrees, and the slope over 30 degrees increases intermittently, which mainly occurred in the mean sea level and the northern beach. This meant that bathymetry changes clearly occurred and that it needs to be carefully examined through continuous monitoring. The majority of sediment particle representative sizes were between 0 ϕ and 1 ϕ , and sediment sizes close to gravel were also distributed.
Bathymetry changes mainly occurred in the northern beach and in parts of the southern beach. The northern beach appeared to be closely related to the seasonal movement of coastal sediments, and this needs to be determined by accumulating appropriate monitoring data. The slope in November was gentler than in the south, and the grain size was analyzed to be coarse-grained.
In order to determine the coastal erosion of the beach, the equilibrium beach profile model uses the particle size of sand and the shape of the beach cross-section as the main parameters [33]. In addition, the 3D bathymetry change Xbeach numerical model determines the sediment transport based on the mean particle diameter. Therefore, the slope of the bathymetry and the sand particle diameter are very important parameters for the stability of the beach [34]. We calculated a beach stability grade using the grain size–slope relationship, classified each index into five levels, and designated the area containing the index and its meaning, as in Figure 12. This content is at a stage where no standardization has been performed and will be added to in the future. We state that there is a possibility of modification through investigation and content supplementation. In the grade, 1 to 2 mean a stable beach area, 3 to 4 are beach areas that should be included in the monitoring interest, and 5 is a beach area that requires precise monitoring and an urgent response. The beach stability analysis results for each season of Jangsa calculated through the index are presented in Figure 13, and the analysis results by grade for the entire beach are presented in Figure 14. The range and distribution of the grades between the two seasons were very different. July 2022 showed a high proportion of magnitudes 4 and 5, occurring across the entire southern and northern coasts. November 2022 showed high levels of levels 1 and 2, with levels 4 and 5 occurring sporadically on the north coast. This is closely related to the change in the topography of the beach, and in fact, it is included in cases where the length of the beach is rather short, the steep slope is fine, and the grain size is fine. Therefore, it is judged that intensive monitoring is necessary of the sand beach as the analysis data are accumulated.

4. Conclusions

We establish a beach stability assessment system with sustainable monitoring and data analysis procedures. The beach altitude data used in the beach stability system are collected using drones, and digital images are extracted from the drone images. The particle size of the beach sand is analyzed using an SNN model. We define five level indices for the beach diagnostic and apply the theory to Jangsa beach over two seasons in 2022.
The developed system is composed of drone measurements, extracting sediment size from images, and assessing the beach stability. The seasonal change trends of the index need to be examined in connection with the external force conditions of the analysis period. In this study, the beach diagnostic is analyzed to be in level 4 or 5 in July 2022, and in level 1 or 2 in November 2022, which is relatively stable. The coast undergoes seasonal changes, annual changes, and long-term changes of more than 10 years. Accordingly, coastal erosion and sedimentation processes change. Therefore, it is necessary to continuously calculate the beach diagnostic indicators and examine the change trends in the indicators. In this procedure, appropriate intervention is needed for areas where the beach width decreases or the diagnostic grade changes.
Sediment particle size analysis using drone digital images goes through a lot of trial and error to generalize digital images. In our study, we used low-altitude drone images to minimize the errors and suggest an appropriate altitude (less than 1.5 m) between the bed and drone image acquisitions. We went through a lot of trial and error to acquire digital images, and we secured clear images and used them in this study to improve the quality of the SNN learning. In the particle size analysis step, we followed the standard sieve analysis of Fork and Ward (1957), calculated the representative particle sizes, and used them as guides for learning. For the safety of many beach tourists and flights, digital image collection through low-altitude drone flights needs to be improved to increase the altitude. In addition, beach geometry is very different site by site, so selection of the drone altitude requires trial and error. The beach slope is another obstacle for image gathering. Images on non-flat bed can produce errors during scale-converting toward flat images. The control problem of drones over slopes needs further study. Nevertheless, the particle size analysis results of the beach sand through the current image are satisfactory. We focused on initial research on the generalization of digital images for the purpose of acquiring particle size data. In our study, the reproduction particle size of sediments was limited to between −2 ϕ and 2 ϕ . Collection and testing of a wider range of digital sand particle size images will be conducted in follow-up studies based on this study. Recently, advanced development of measurement equipment, with the function of zoom-in even at altitudes of 2 m or higher is underway, and we plan to examine its applicability in follow-up research.
The beach stability indicators are appropriately classified and used in this study. The beach diagnostic grade is considered appropriate for evaluating the stability of beaches by using parameters closely related to topographical changes on the coast. Follow-up research will be conducted to compare and review the beach diagnostic grade proposed in this study with other indicators from previous studies. The beach diagnostic grade could further be studied with existing deterministic prediction models or theories.

Author Contributions

Conceptualization, K.-Y.B.; methodology, H.-J.Y. and T.-S.K.; software, H.-J.Y. and H.K.; validation, H.-J.Y. and M.-S.P.; formal analysis, H.-J.Y.; investigation, H.-J.Y., K.-H.K., J.-B.K. and M.-S.P.; resources, K.-H.K. and J.-B.K.; data curation, H.-J.Y. and H.K.; writing-original draft preparation, H.-J.Y. and H.K.; writing-review and editing, H.-J.Y. and T.-S.K.; visualization, K.-Y.B. and H.-J.Y.; supervision, H.-J.Y.; project administration, K.-Y.B. and H.-J.Y. All authors have read and agreed to the published version of the manuscript.

Funding

This research was supported by the Korea Institute of Marine Science and Technology Promotion (KIMST) funded by the Ministry of Oceans and Fisheries (RS-2023-00256687). This research was partly supported by the Korea Technology & Information Promotion Agency for SMEs grant funded by Ministry of SMEs and Startups (Grant S3251997).

Institutional Review Board Statement

Not applicable.

Informed Consent Statement

Not applicable.

Data Availability Statement

The data presented in this study are available in article.

Acknowledgments

The authors gratefully appreciated the Korea Institute of Marine Science and Technology Promotion (KIMST) funded by the Ministry of Oceans and Fisheries (RS-2023-00256687). This research was partly supported by the Korea Technology & Information Promotion Agency for SMEs grant funded by Ministry of SMEs and Startups (Grant S3251997).

Conflicts of Interest

Authors Ho-Jun Yoo, Tae-Soon Kang, Ki-Hyun Kim, Ki-Young Bang, Jong-Beom Kim, Moon-Sang Park were employed by the company Geosystem Research Corp. The remaining authors declare that the research was conducted in the absence of any commercial or financial relationships that could be construed as a potential conflict of interest.

References

  1. Depountis, N.; Apostolopoulos, D.; Boumpoulis, V.; Christodoulou, D.; Dimas, A.; Fakiris, E.; Leftheriotis, G.; Menegatos, A.; Nikolakopoulos, K.; Papatheodorou, G.; et al. Coastal Erosion Identification and Monitoring in the Patras Gulf (Greece) Using Multi-Discipline Approaches. J. Mar. Sci. Eng. 2023, 11, 654. [Google Scholar] [CrossRef]
  2. Bunce, M.; Brown, K.; Rosendo, S. Policy Misfits, Climate Change and Cross-Scale Vulnerability in Coastal Africa: How Development Projects Undermine Resilience. Environ. Sci. Policy 2010, 13, 485–497. [Google Scholar] [CrossRef]
  3. Gowthaman, R.; Kumar, V.S.; Dwarakish, G.S.; Shanas, P.R.; Jena, B.K.; Singh, J. Nearshore waves and longshore sediment transport along Rameshwaram Island off the east coast of India. Int. J. Nav. Archit. Ocean. Eng. 2015, 7, 939–950. [Google Scholar] [CrossRef]
  4. Neumann, B.; Vafeidis, A.T.; Zimmermann, J.; Nicholls, R.J. Future coastal population growth and exposure to sea-level rise and coastal flooding—A global assessment. PLoS ONE 2015, 10, e0131375. [Google Scholar] [CrossRef]
  5. Roelvink, D.; Huisman, B.; Elghandour, A.; Ghonim, M.; Reyns, J. Efficient Modeling of Complex Sandy Coastal Evolution at Monthly to Century Time Scales. Front. Mar. Sci. 2018, 7, 535. [Google Scholar] [CrossRef]
  6. Ferro-Azcona, H.; Espinoza-Tenorio, A.; Calderon-Contreras, R.; Ramenzoni, V.C.; Pais, M.D.L.M.G.; Mesa-Jurado, M.A. Adaptive Capacity and Social-Ecological Resilience of Coastal Areas: A Systematic Review. Ocean Coast. Manag. 2019, 173, 36–51. [Google Scholar] [CrossRef]
  7. Gibbs, M.T. Consistency in Coastal Climate Adaption Planning in Australia, and the Importance of Understanding Local Political Barriers to Implementation. Ocean Coast. Manag. 2019, 173, 131–138. [Google Scholar] [CrossRef]
  8. Ministry of Oceans and Fisheries. Coastal Erosion Survey Report; Ministry of Oceans and Fisheries: Sejong-si, Republic of Korea, 2020.
  9. Habersack, H.; Hengl, M.; Huber, B.; Lalk, P.; Tritthart, M. Fließgewässermodellierung—Arbeitsbehelf Feststofftransport und Gewässermorphologie, Austrian Federal Ministry of Agriculture, Forestry, Environment and Water Management and Österreichischer Wasser-und Abfallwirtschaftsverband ÖWAV, Vienna. 2011. Available online: https://scholar.google.com/scholar_lookup?&title=Flie%C3%9Fgew%C3%A4ssermodellierung%20%E2%80%93%20Feststofftransport%20und%20Gew%C3%A4ssermorphologie&publication_year=2011&author=Habersack%2CH&author=Badura%2CH&author=Gabriel%2CH&author=Hengl%2CM&author=Huber%2CB&author=J%C3%A4ger%2CG&author=Knoblauch%2CH&author=Krouzecky%2CN&author=Lalk%2CP&author=Mandl%2CC&author=Moser%2CM&author=Reindl%2CR&author=Rickenmann%2CD&author=Sattler%2CS&author=Sch%C3%B6berl%2CF&author=Tritthart%2CM (accessed on 11 January 2024).
  10. Bascom, W.N. The relationship between sand size and beach-face slope. Eos. Trans. AGU 1951, 32, 866–874. [Google Scholar] [CrossRef]
  11. Buscombe, D.; Masselink, G. Concepts in gravel beach dynamics. Earth Sci. 2006, 79, 33–52. [Google Scholar] [CrossRef]
  12. Adams, J. Gravel size analysis from photographs. J. Hydr. Eng. Div. ASCE 1979, 105, 1247–1255. [Google Scholar] [CrossRef]
  13. Ibbeken, H.; Schleyer, R. Photo-sieving: A method for grain-size analysis of coarse-grained, unconsolidated bedding surfaces. Earth Surf. Proc. Land 1986, 11, 59–77. [Google Scholar] [CrossRef]
  14. Butler, J.B.; Lane, S.N.; Chandler, J.H. Automated extraction of grain-size data from gravel surfaces using digital image processing. J. Hydraul. Res. 2001, 39, 519–529. [Google Scholar] [CrossRef]
  15. Graham, D.J.; Reid, I.; Rice, S.P. Automated sizing of coarse-grained sediments: Image-processing procedures. Math. Geol. 2005, 37, 1–28. [Google Scholar] [CrossRef]
  16. Detert, M.; Weitbrecht, V. Automatic object detection to analyze the geometry of gravel grains: A free stand-alone tool, River Flow 2012. In Proceedings of the International Conference on Fluvial Hydraulics, José, Costa Rica, 5–7 September 2012; Taylor & Francis Group: London, UK, 2012; pp. 595–600. [Google Scholar]
  17. Buscombe, D. Transferable wavelet method for grain-size distribution from images of sediment surfaces and thin sections, and other natural granular patterns. Sedimentology 2013, 60, 1709–1732. [Google Scholar] [CrossRef]
  18. Buscombe, D. SediNet: A configurable deep learning model for mixed qualitative and quantitative optical granulometry. Earth Surf. Proc. Land 2019, 5, 638–651. [Google Scholar] [CrossRef]
  19. Purinton, B.; Bookhagen, B. Introducing PebbleCounts: A grain-sizing tool for photo surveys of dynamic gravel-bed rivers. Earth Surf. Dynam. 2019, 7, 859–877. [Google Scholar] [CrossRef]
  20. Kitagawa, J.; Enomoto, K.; Toda, M.; Miyoshi, K. A Study of Bottom-sediment Classification System Using Seabed Images. J. Sens. Mater. 2018, 31, 810–823. [Google Scholar] [CrossRef]
  21. Machairsas, N.; Li, L.; Iskander, M. Application of Dynamic Image Analysis to Sand Particle Classification Using Deep Learning. J. Geotech. Spec. Publ. 2020, 317, 612–621. [Google Scholar]
  22. Maitre, J.; Bouchard, K.; Bedard, L.P. Mineral grains recognition using computer vision and machine learning. J. Comput. Geosci. 2019, 130, 84–93. [Google Scholar] [CrossRef]
  23. Ran, X.; Xue, L.; Zhang, Y.; Liu, Z.; Sang, X.; He, X. Rock Classification from Field Image Patches Analyzed Using a Deep Convolutional Neural Network. Mathematics 2019, 7, 755. [Google Scholar] [CrossRef]
  24. Lang, N.; Irniger, A.; Rozniak, A.; Hunziker, R.; Wegner, J.D.; Schindler, K. GRAINet: Mapping grain size distributions in river beds from UAV images with convolutional neural networks. Hydrol. Earth Syst. Sci. 2021, 25, 2567–2597. [Google Scholar] [CrossRef]
  25. Fork, R.L.; Ward, W.C. Brazos river bar: A study in the significance of grain size parameters. J. Sed. Res. 1957, 27, 3–26. [Google Scholar]
  26. Kim, K.; Bang, K.Y.; Han, J.H.; Choi, Y.H.; Yoo, H.; Nam, G.Y. Predicting Method the Representive Sand Diameter by Survey Height Using UAV. In Proceedings of the 2022 10th Conference on Korean Society of Coastal Disaster Prevention (KSCDP), Yeosu, Republic of Korea, 1 August 2022. [Google Scholar]
  27. Kim, H.; Yoo, H.; Lee, J.; Lee, S. Convolution layer with nonlinear kernel of square of subtraction for dark-direction-free recognition of images. J. Math. Models Eng. 2020, 6, 147–159. [Google Scholar] [CrossRef]
  28. Kim, H.; Yoo, H.J.; Lee, J.L. Nonlinear Kernel Convolutional Neural Network to find median sand particle size. J. Coast. Res. 2021, 1–5. [Google Scholar] [CrossRef]
  29. Bujan, N.; Cox, R.; Masselink, G. From fine sand to boulders: Examining the relationship between beach-face slope and sediment size. Mar. Geol. 2019, 417, 106012. [Google Scholar] [CrossRef]
  30. Battjes, J. Surf Similarity. In Coastal Engineering; American Society of Civil Engineers: Copenhagen, Denmark, 1974; pp. 466–480. [Google Scholar]
  31. Guza, R.T.; Inman, D.L. Edge waves and beach cusps. J. Geophys. Res. 1975, 80, 2997–3012. [Google Scholar] [CrossRef]
  32. Moore, I.D.; Lewis, A.; Gallant, J.C. Terrain Attributes: Estimation Methods and Scale Effects. In Modelling Change in Environmental Systems; Jakeman, A.J., Beck, M.B., McAleer, M.J., Eds.; John Wiley and Sons: New York, NY, USA, 1993; pp. 189–214. [Google Scholar]
  33. Dean, R.G. Equilibrium Beach Profiles: U.S. Atlantic and Gulf Coasts; Ocean Engineering Report No. 12; Department of Civil Engineering, University of Delaware: Newark, Delaware, 1977; 45p. [Google Scholar]
  34. McCall, R.T.; Masselink, G.; Poate, T.G.; Roelvink, J.A.; Almeida, L.P.; Davidson, M.; Russell, P.E. Modelling storm hydrodynamics on gravel beaches with XBeach-G. Coast. Eng. 2014, 91, 231–250. [Google Scholar] [CrossRef]
Figure 1. Location, bathymetry and reference profiles of Jangsa beach, Republic of Korea.
Jmse 12 00172 g001
Figure 2. Particle size analysis and triangular diagram of the size distribution in July 2022 and November, weight ratio by particle size during all periods, and sediment images at the mean sea level, beach face, and dune using a drone.
Jmse 12 00172 g002
Figure 3. Drone images from various altitudes scale correction is needed (modified after Kim et al., 2022) [26].
Jmse 12 00172 g003
Figure 4. SNN architecture for recognizing the sand diameter from different size images.
Jmse 12 00172 g004
Figure 5. Beach slope extraction for seasonal cross-section measurements using RTK-GNSS.
Jmse 12 00172 g005
Figure 6. Comparison of scenarios on the assessment index as the epoch repeats: value 0 means 100% accuracy.
Jmse 12 00172 g006
Figure 7. Comparison of the observation sediment particle sizes and SNN model predictions.
Jmse 12 00172 g007
Figure 8. Frequency distribution and cumulative curves of the be ach slopes.
Jmse 12 00172 g008
Figure 9. Frequency distribution and cumulative curves of the beach sediment particle sizes.
Jmse 12 00172 g009
Figure 10. July 2022 survey results: (a) beach elevation using drones, (b) beach slope, and (c) mean particle size distribution spatially mapped from the SNN simulation results.
Jmse 12 00172 g010
Figure 11. November 2022 survey results: (a) beach elevation using drones, (b) beach slope, and (c) mean particle size distribution spatially mapped from the SNN simulation results.
Jmse 12 00172 g011
Figure 12. Calculation of the beach diagnostic grade using the grain size-slope relationship and classifying into 5 grades.
Jmse 12 00172 g012
Figure 13. Beach diagnostic grade distribution at Jangsa based on the particle size and slope spatial mapping data.
Jmse 12 00172 g013
Figure 14. Percentage for each grade statistically analyzed from the beach diagnostic grade distribution.
Jmse 12 00172 g014
Table 1. Validation and test results for the optimization of the modeling scenario experiments.
ScenarioConditionAccuracy (%)
Convolution LayerConvolution FilterPooling FilterValidationTest
123 × 32 × 29175
225 × 52 × 29962
343 × 32 × 29983
463 × 34 × 49877
583 × 34 × 49973
6103 × 34 × 49576
745 × 52 × 29959
847 × 72 × 27729
943 × 38 × 88780
Disclaimer/Publisher’s Note: The statements, opinions and data contained in all publications are solely those of the individual author(s) and contributor(s) and not of MDPI and/or the editor(s). MDPI and/or the editor(s) disclaim responsibility for any injury to people or property resulting from any ideas, methods, instructions or products referred to in the content.

