
Morphodynamic Response of Open and Embayed Beaches to Winter Conditions: Two Case Studies from the North Atlantic Iberian Coast

 , , ,
, , ,  , ,
, ,
Abstract
1. Introduction
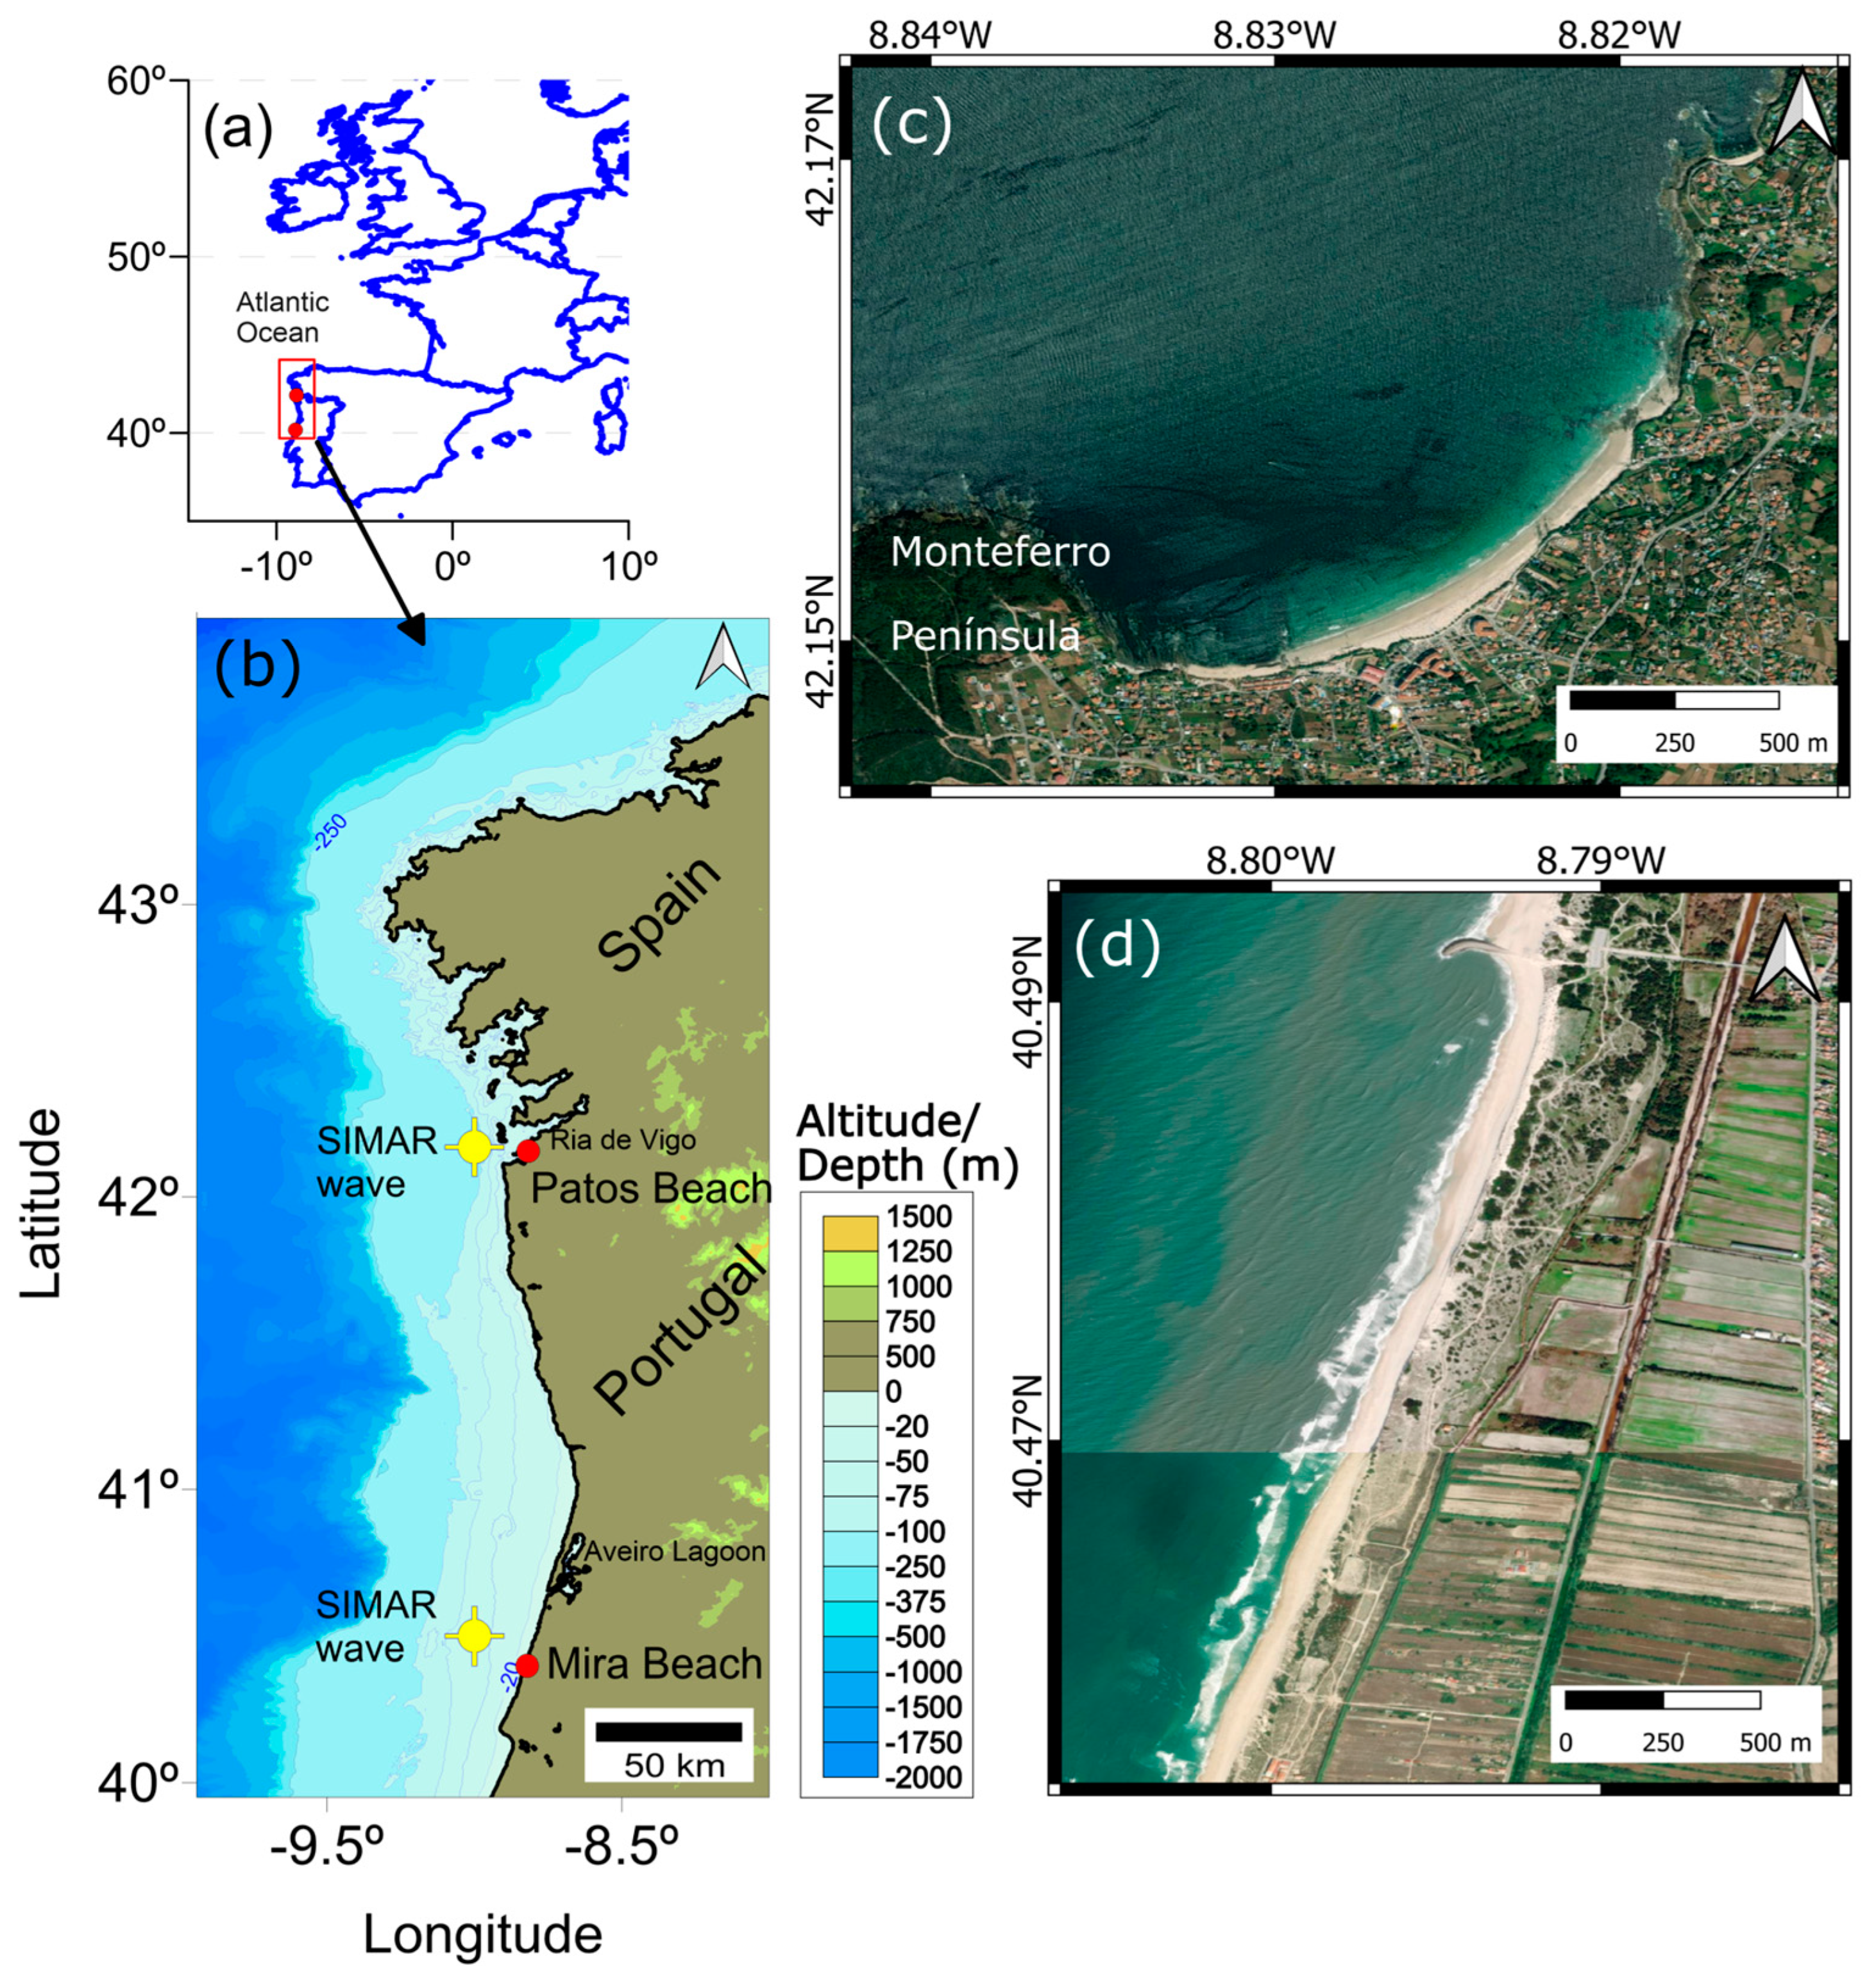
2. Regional Setting and Study Areas

| Beach | Type | D50 (mm) | Beach Slope (°) | Beach Width (m) | Berm Height (m) |
|---|---|---|---|---|---|
| Patos | Embayed | 0.2–0.3 | 0.02–0.07 | 70–100 | 3–4 |
| Mira | Open | 0.4–0.6 | 0.05–0.15 | 40–80 | 3–5 |
3. Methods
3.1. Offshore Hydrodynamic Data
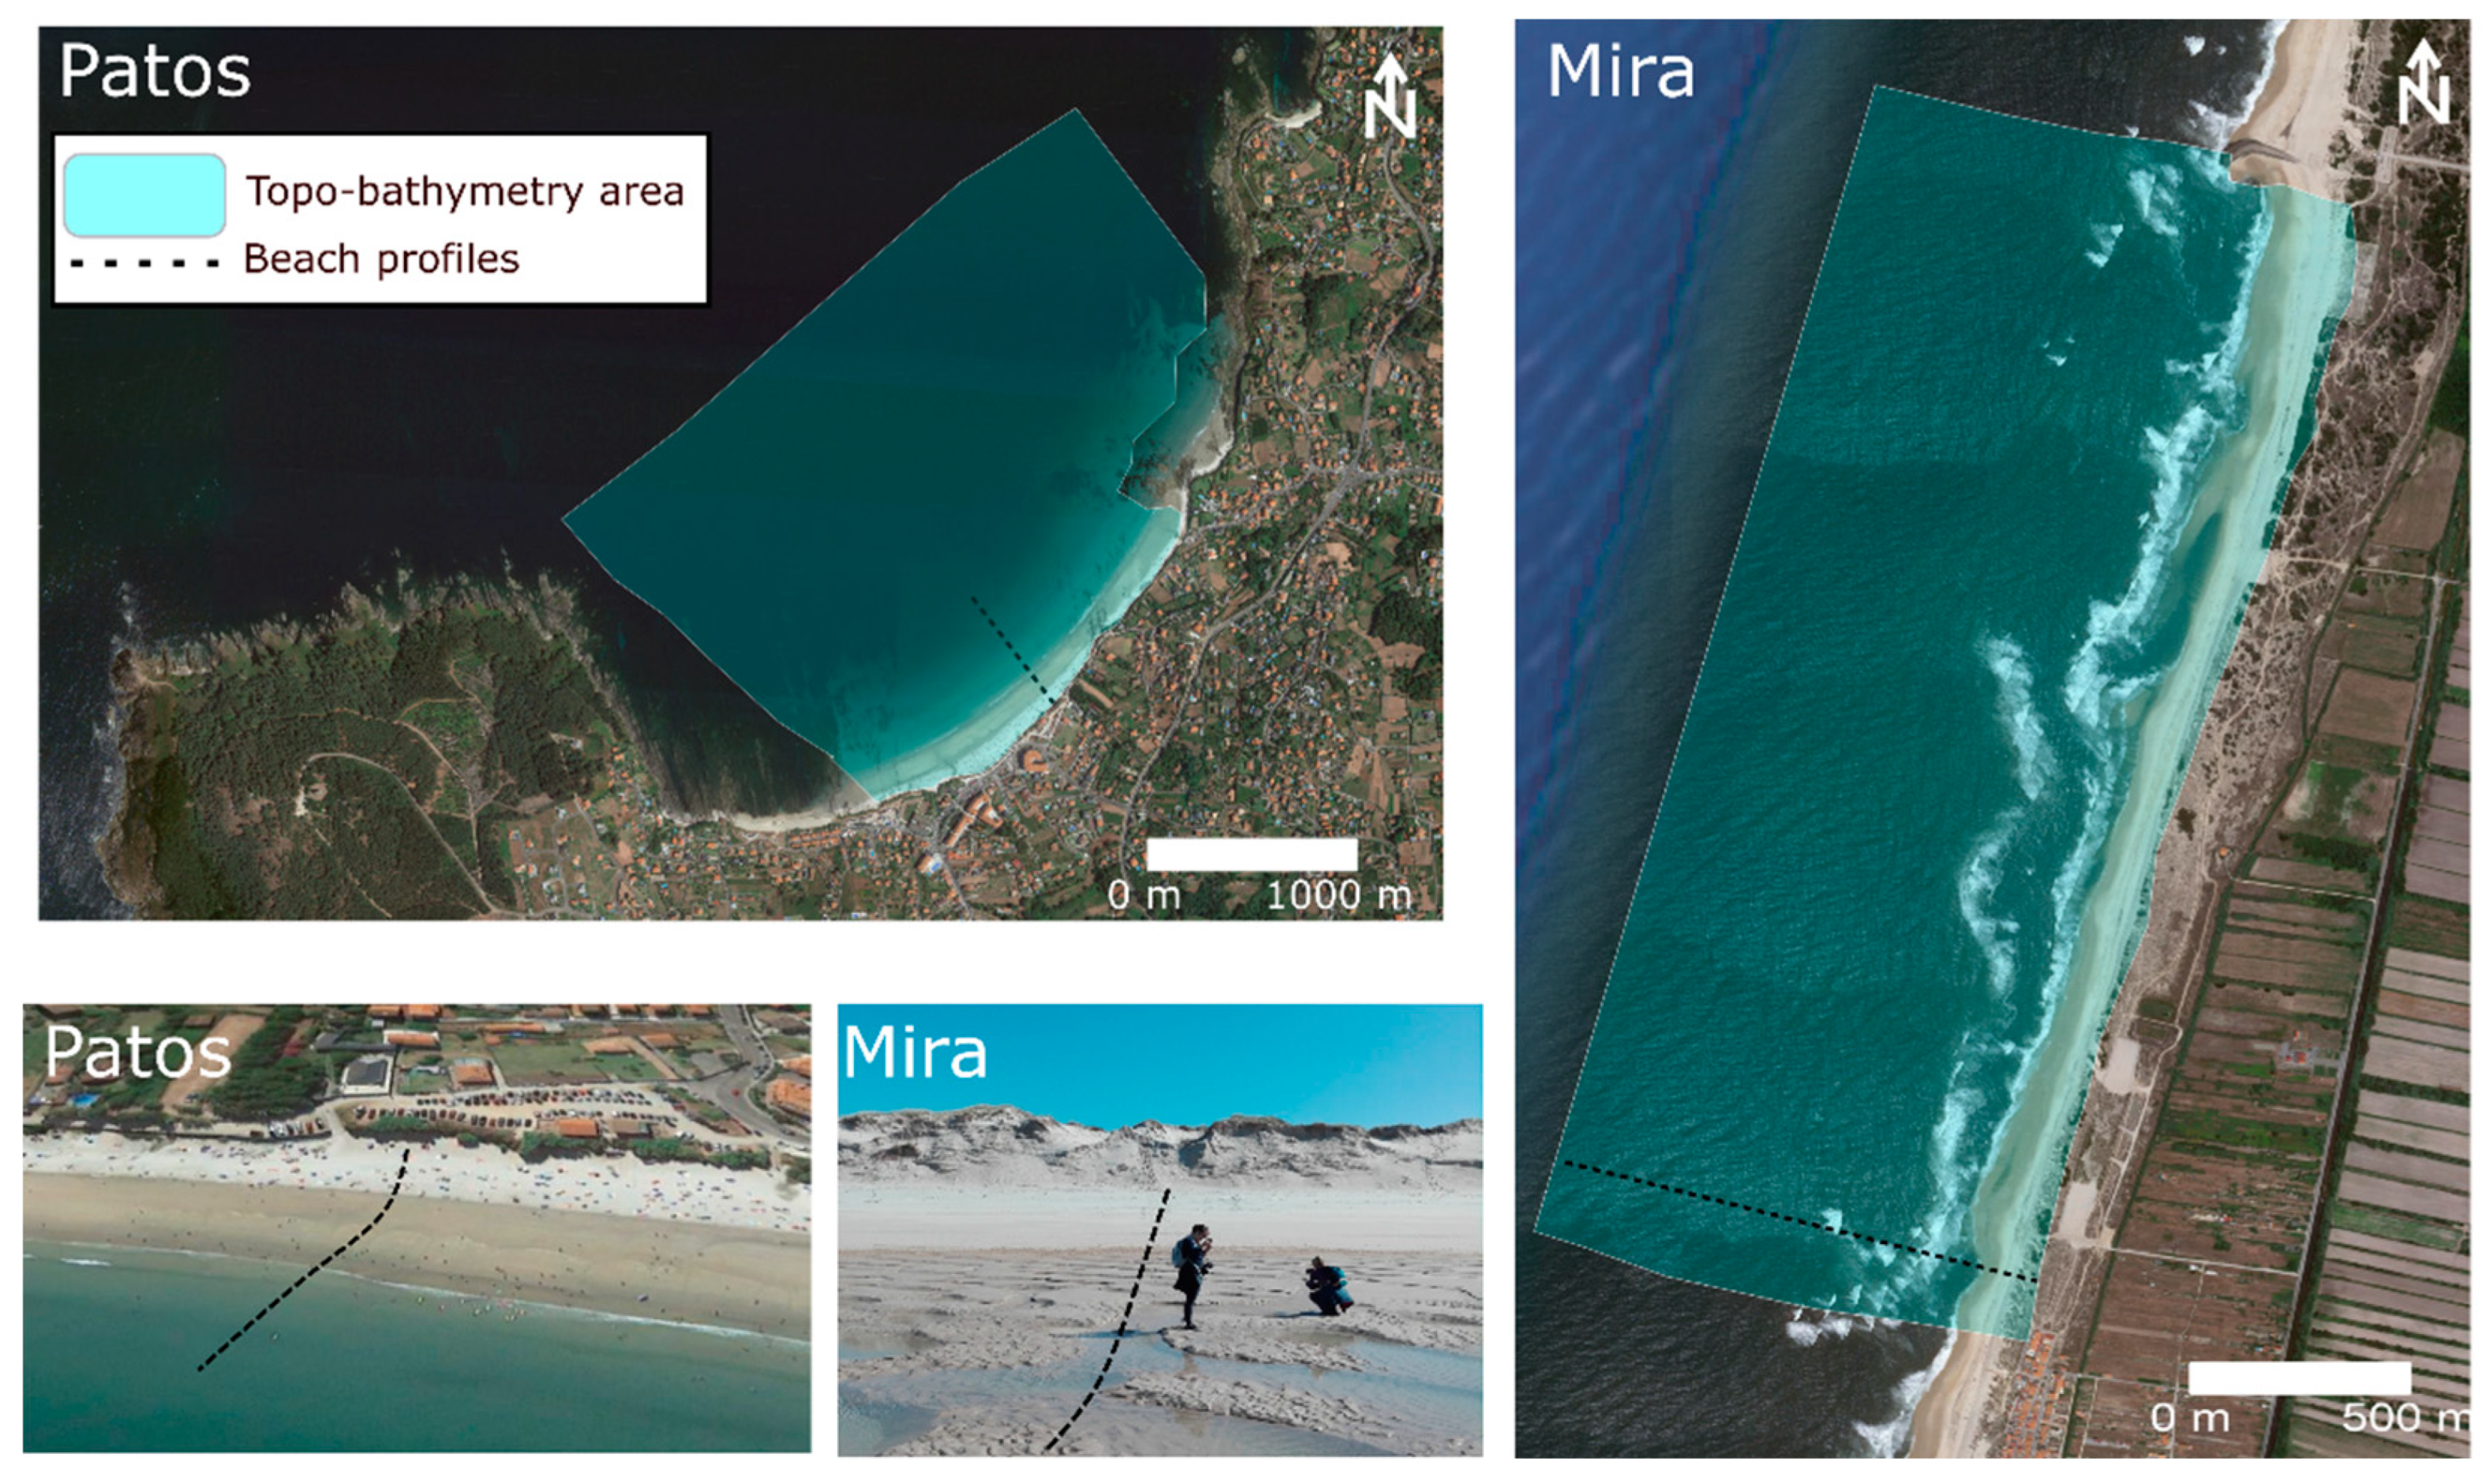
3.2. Field Surveys (Data Collection) and Processing
4. Results
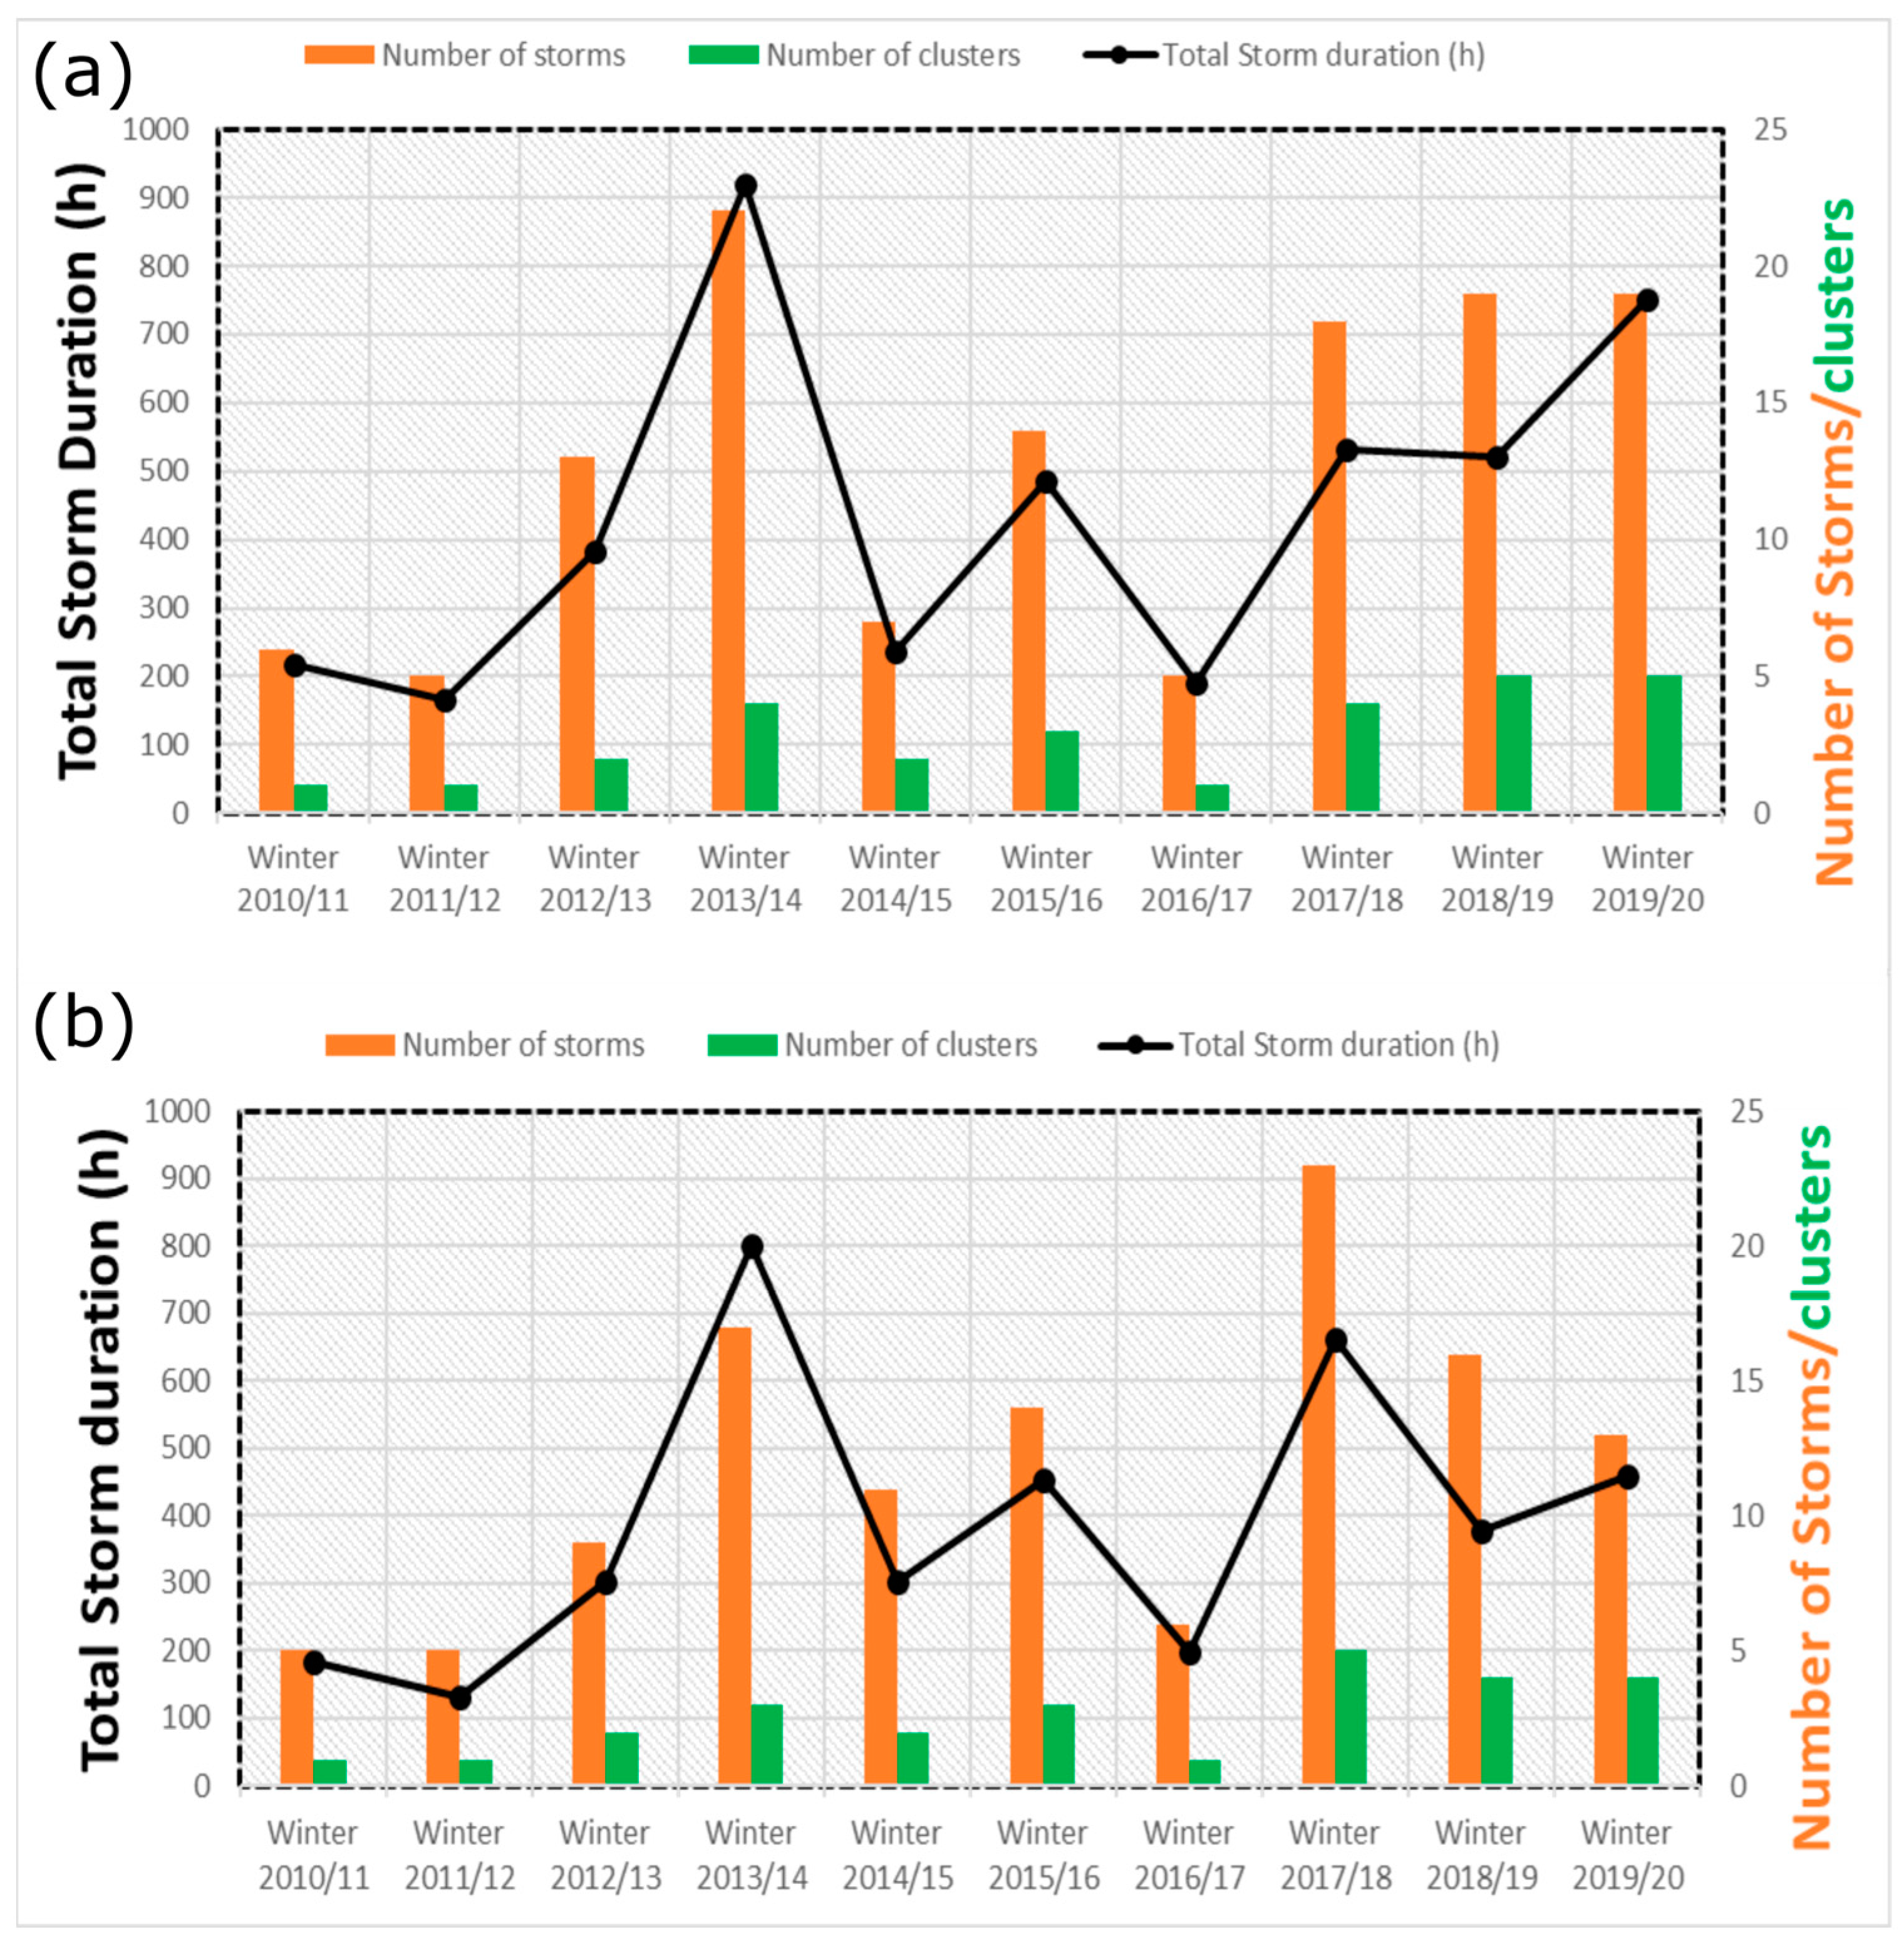
4.1. Decadal Wave Hydrodynamics
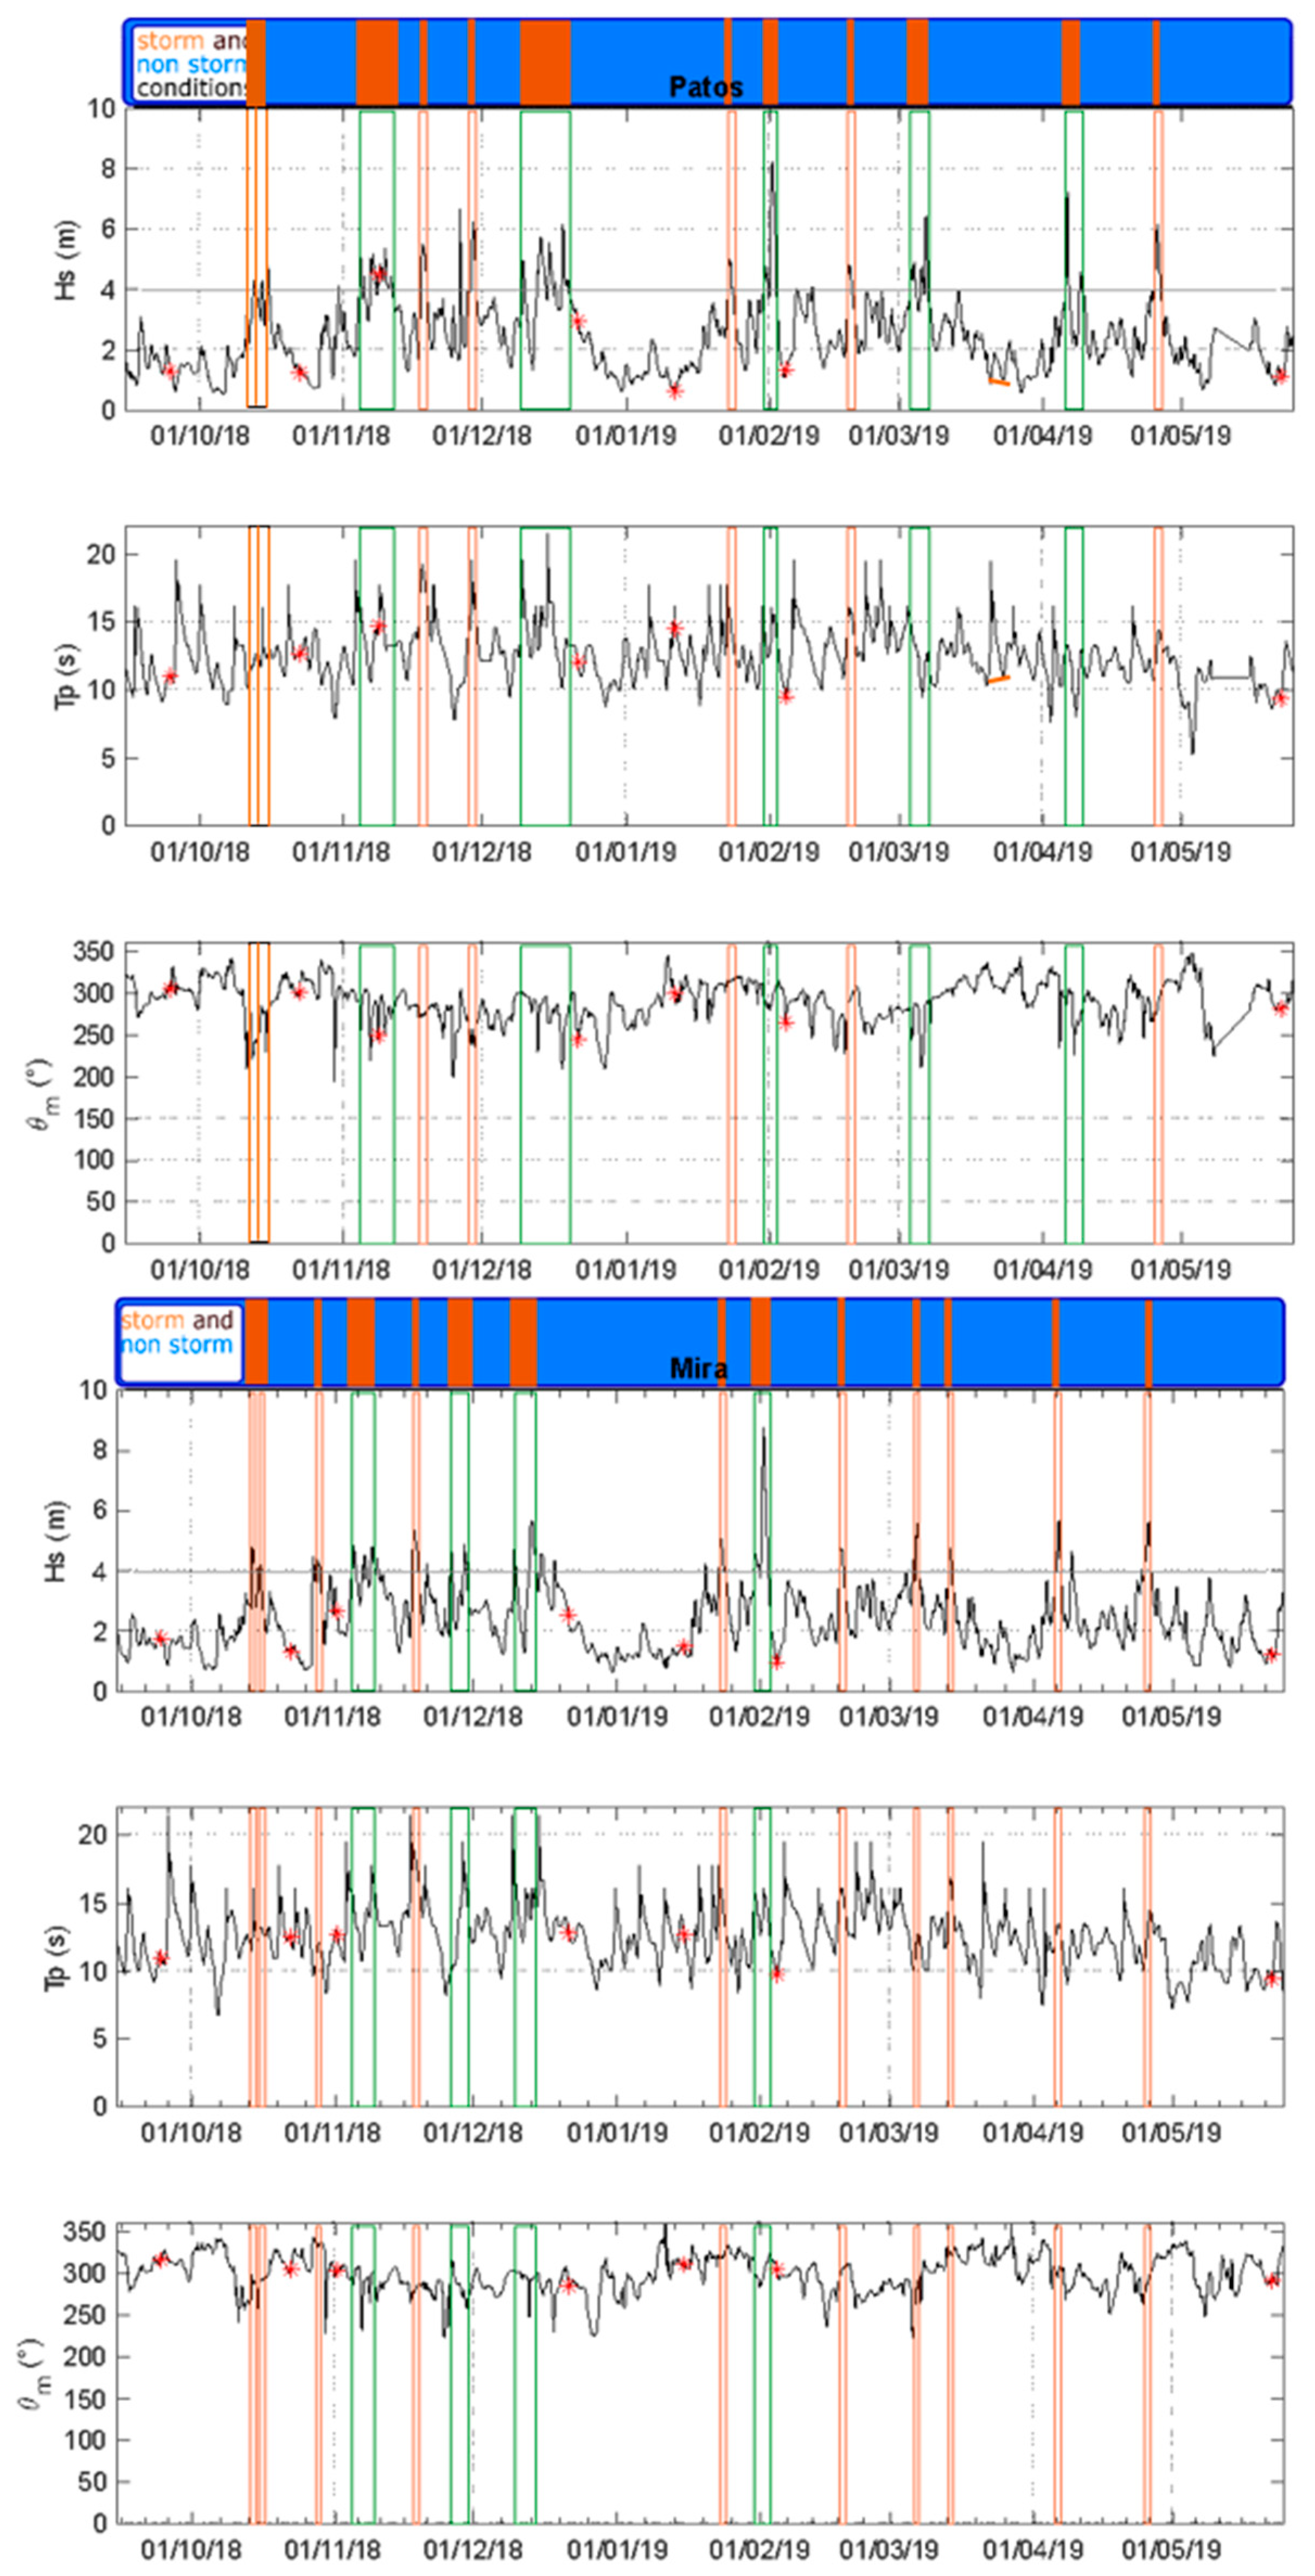
4.2. Wave Hydrodynamics of Winter 2018/19
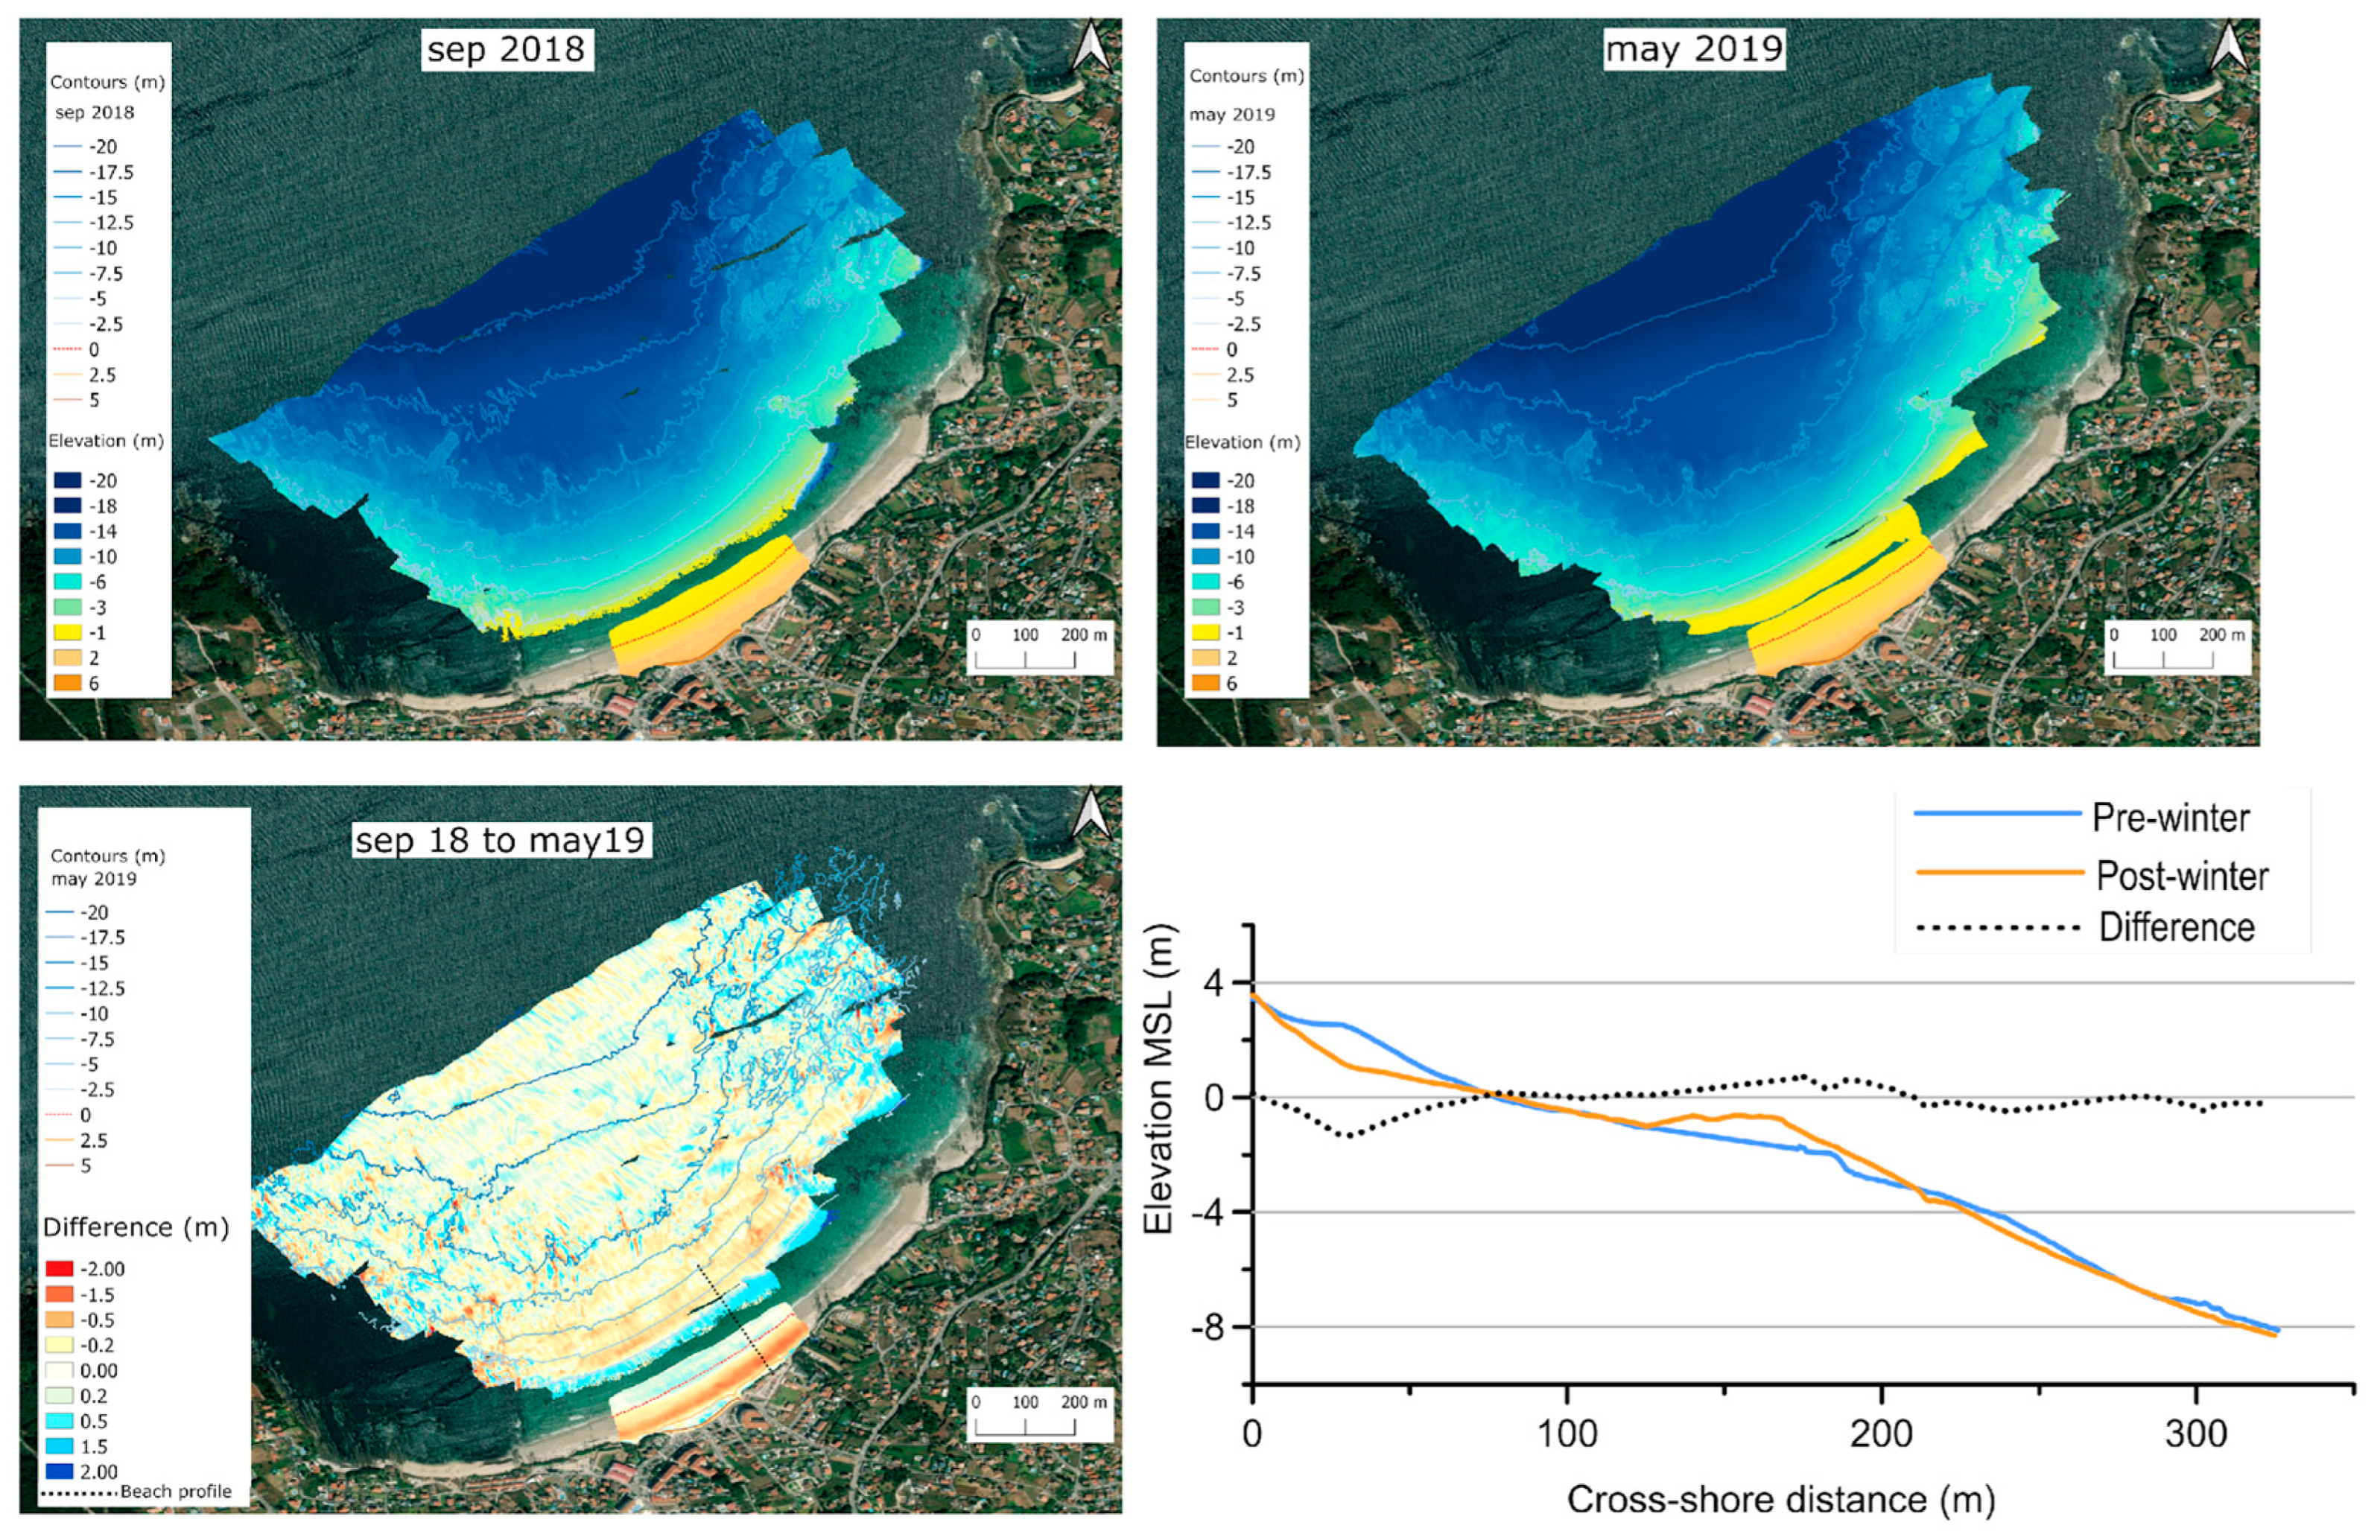
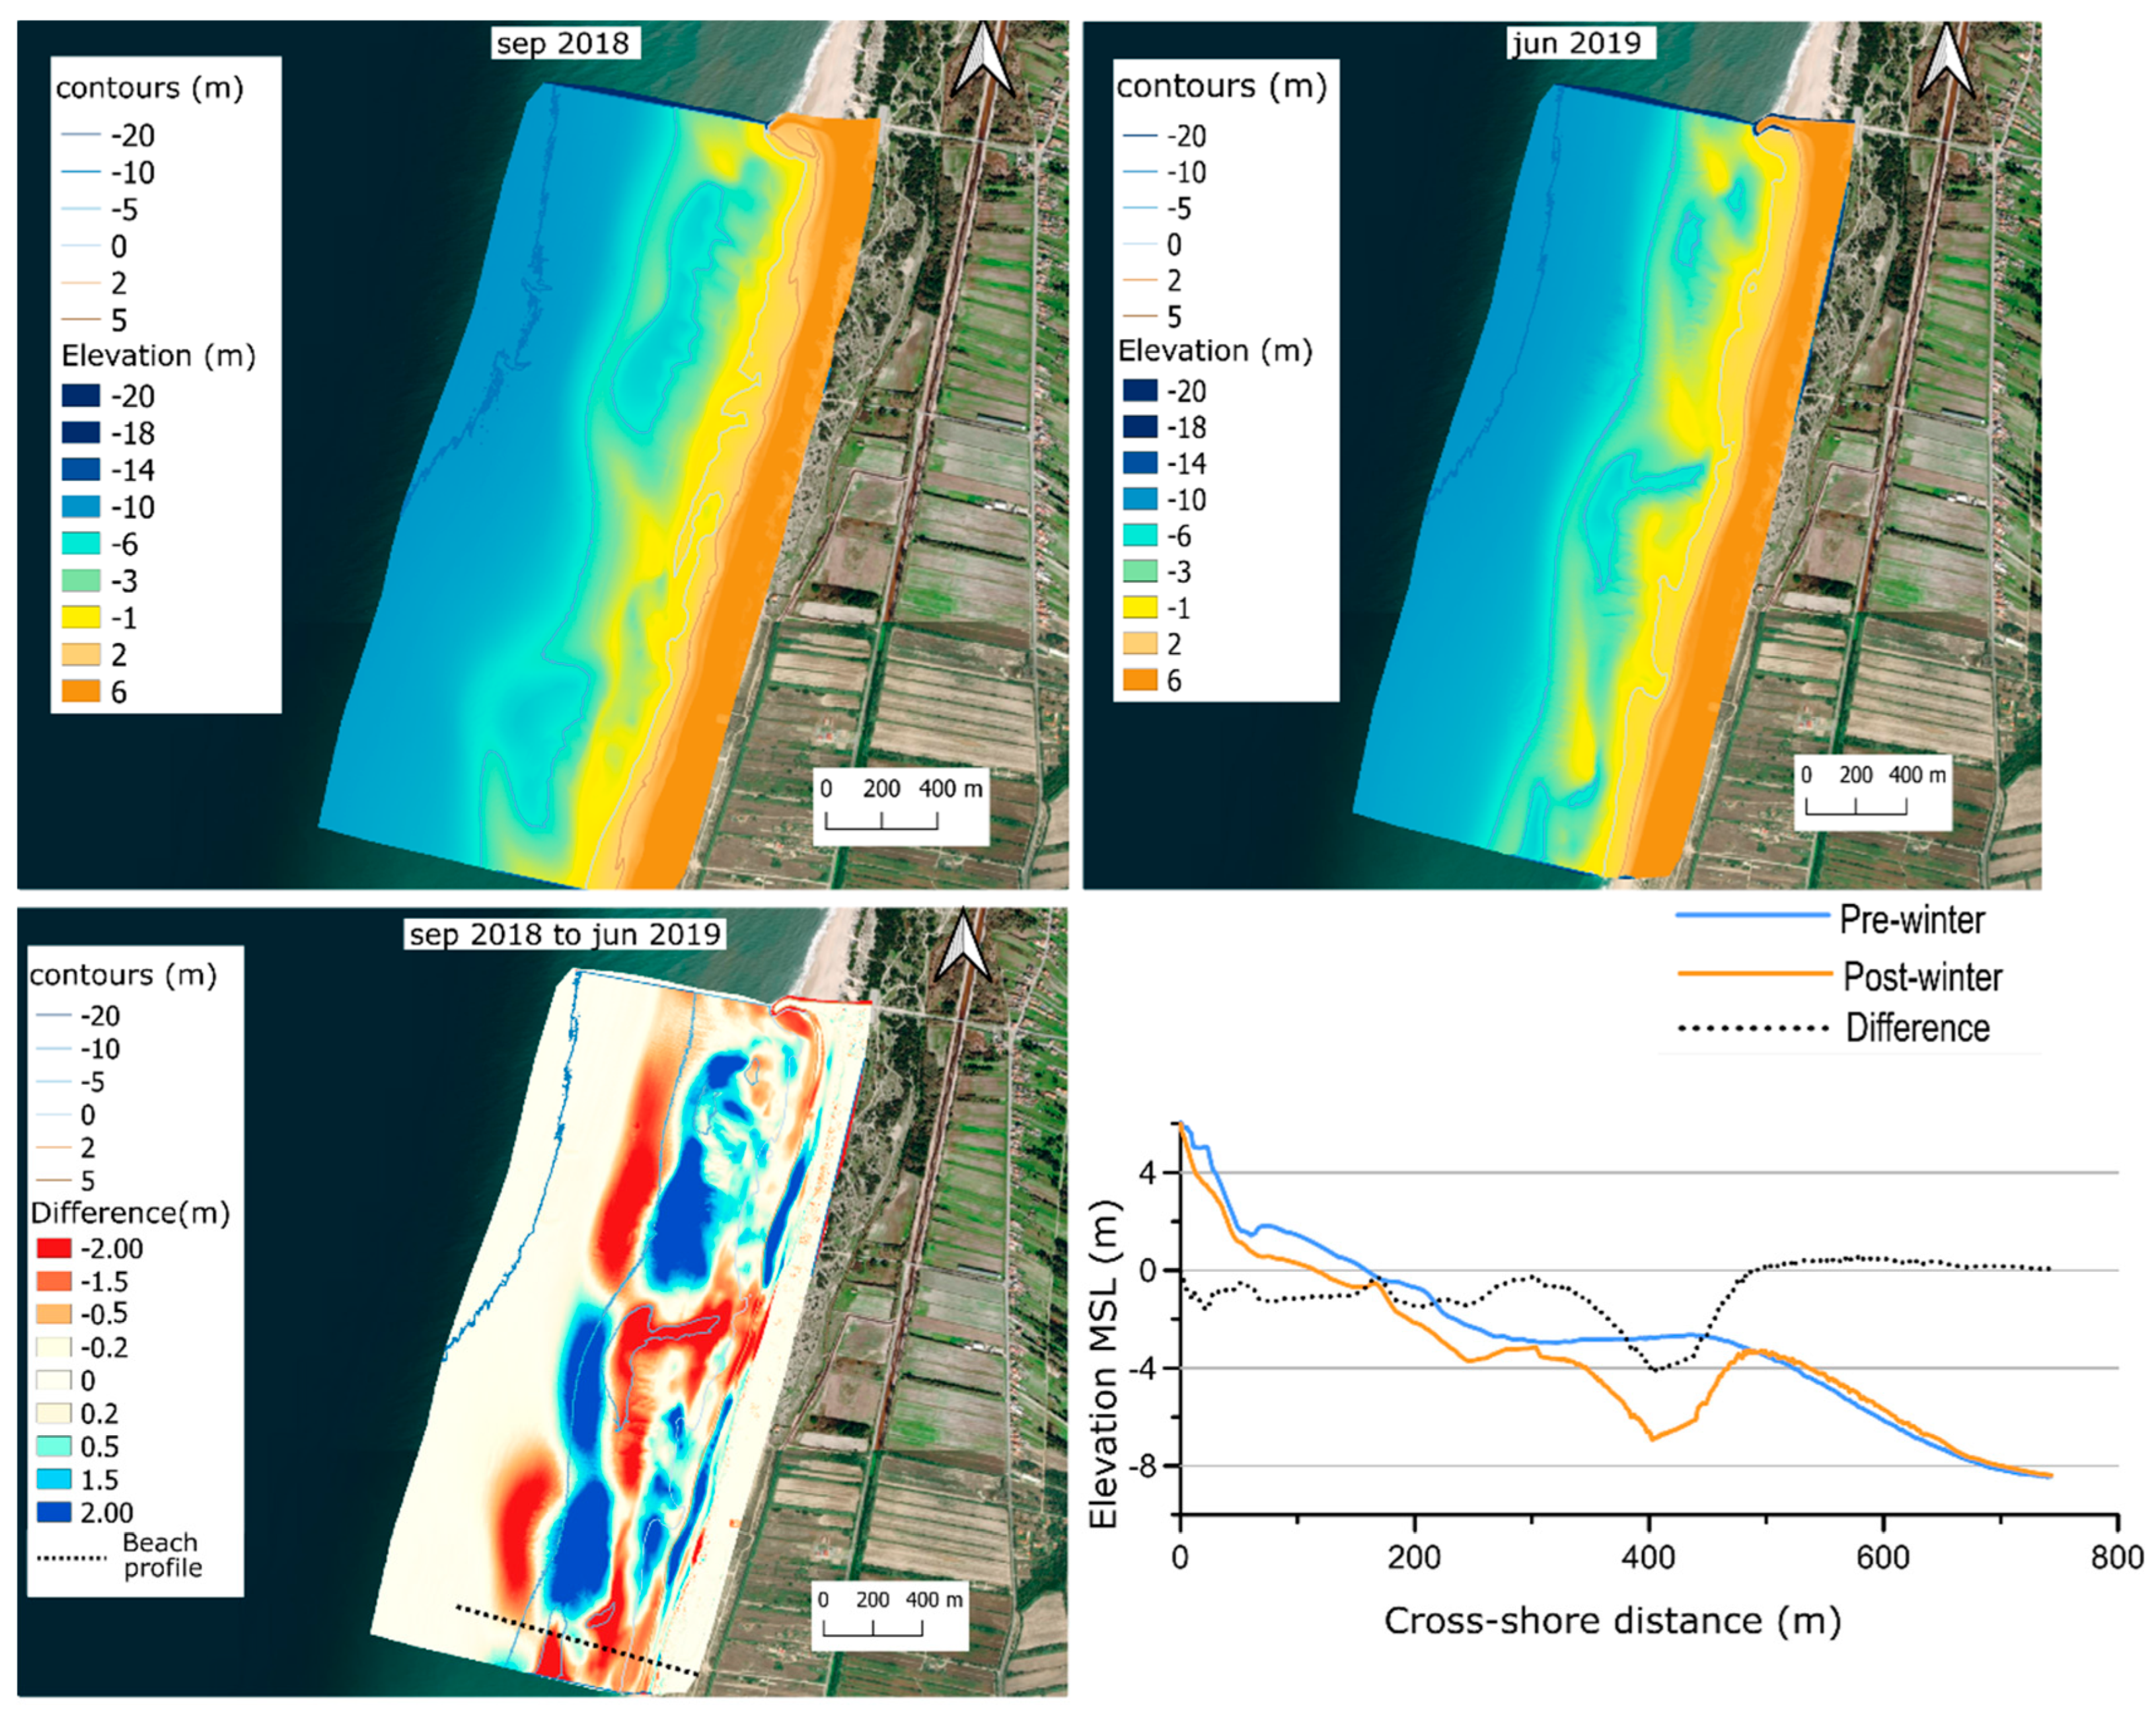
4.3. Topo-Bathymetric Changes
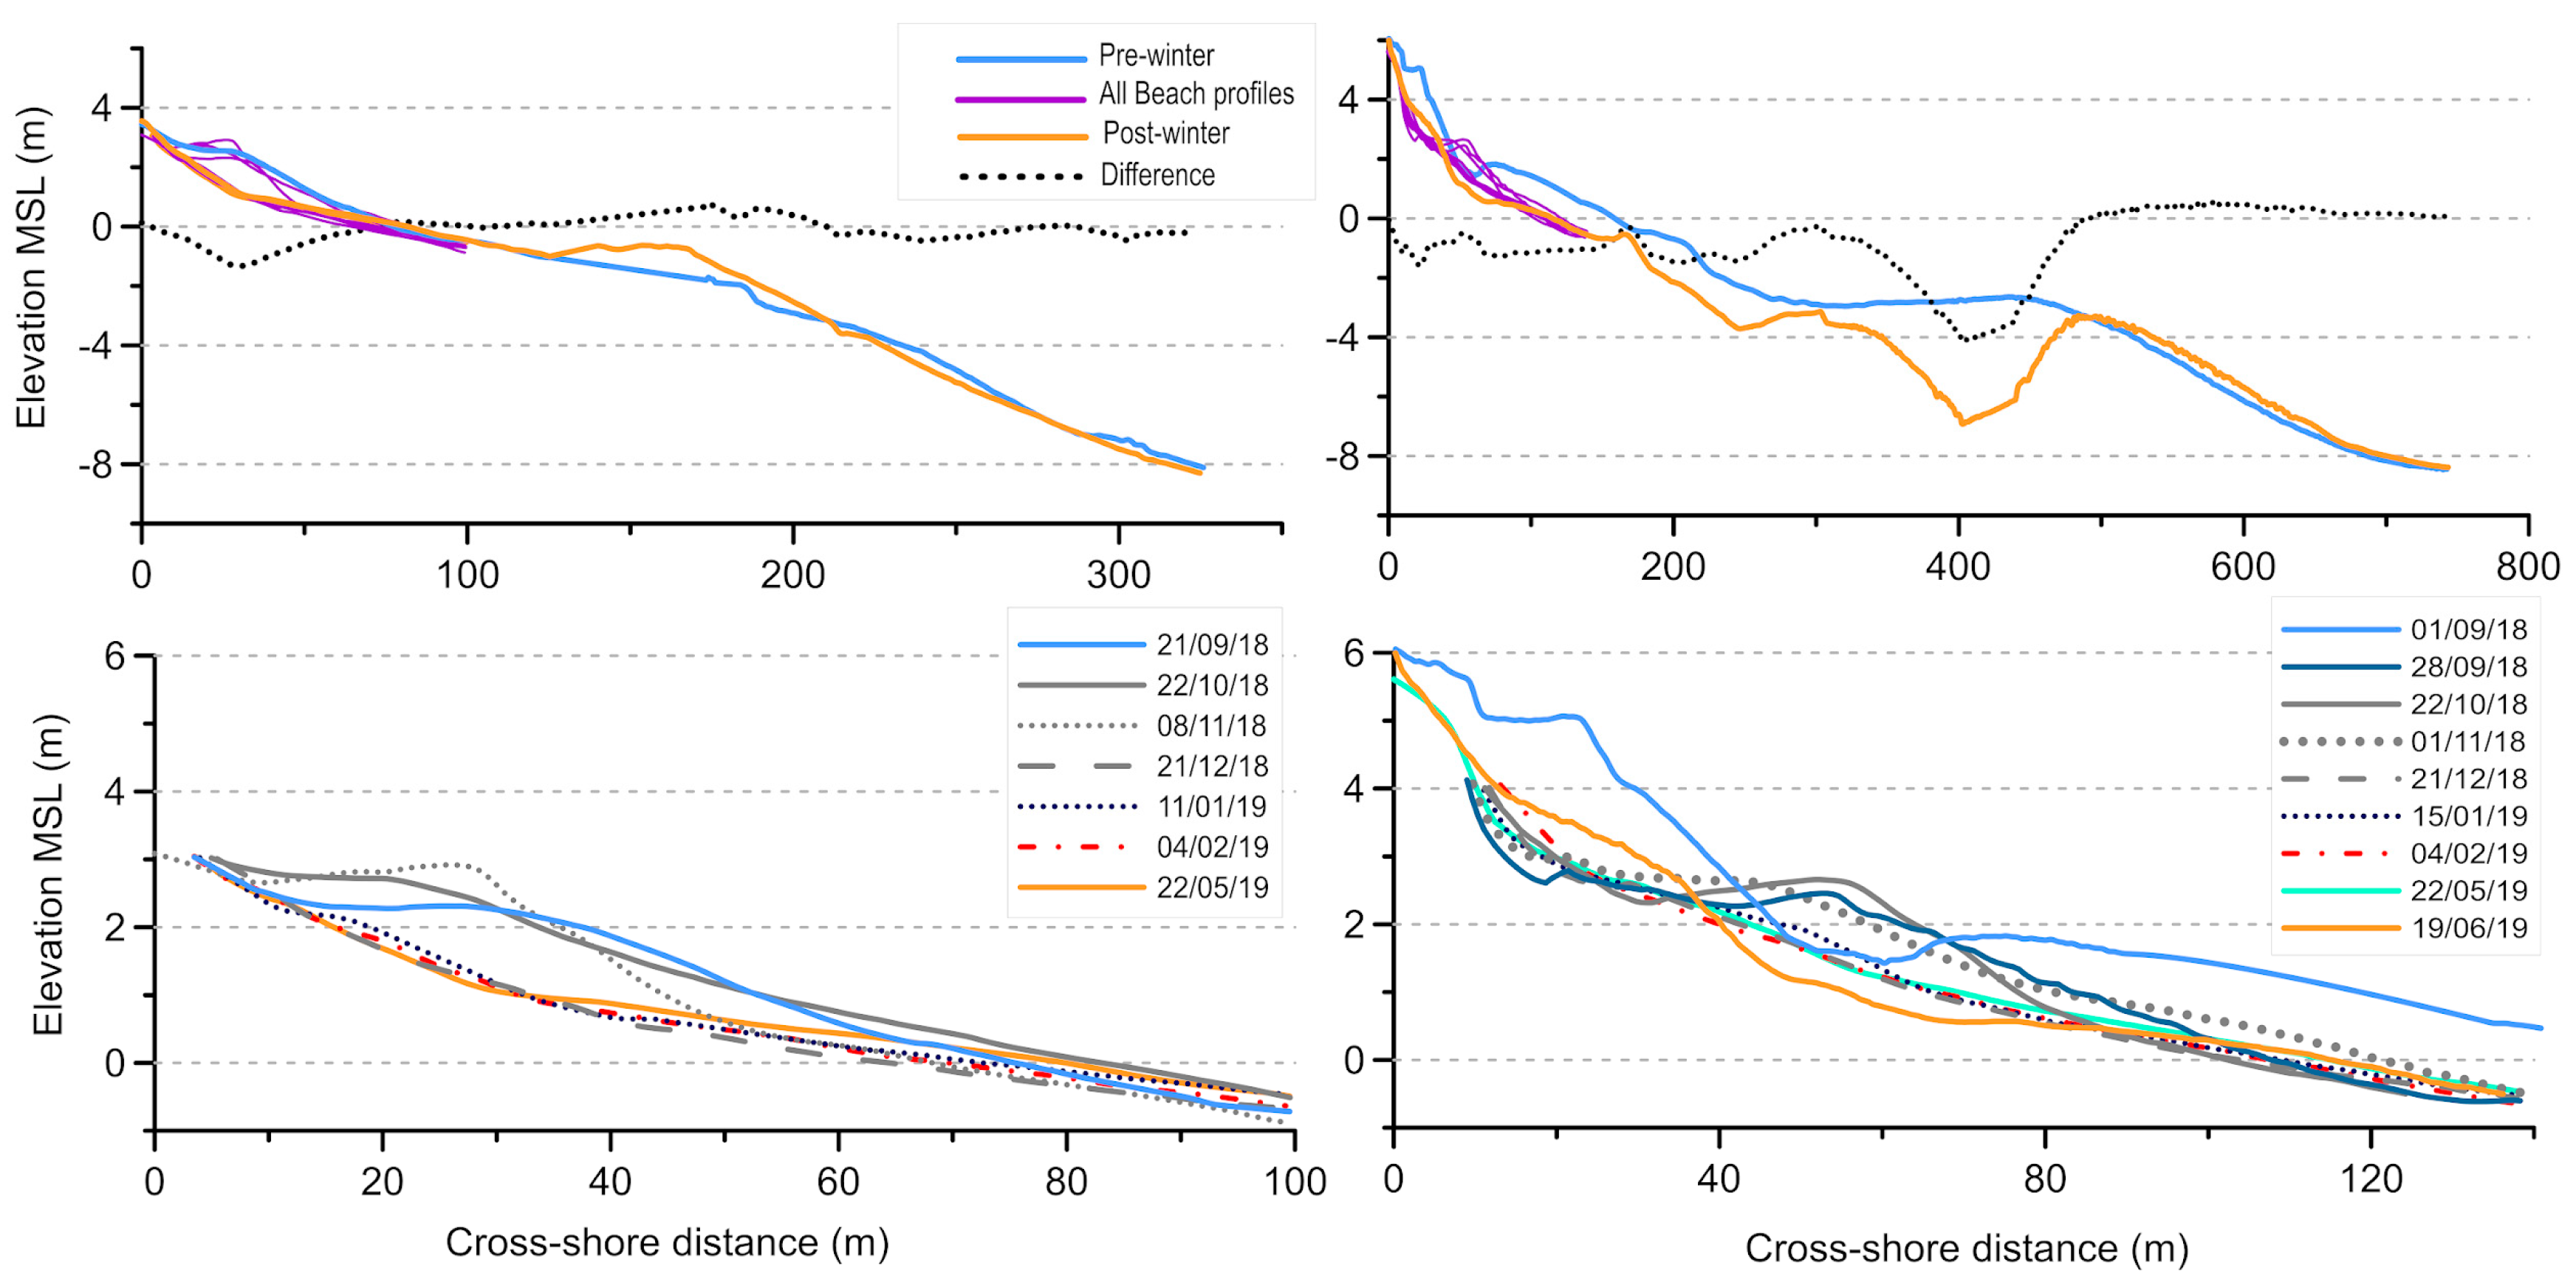
4.4. Beach Profile Response to Winter 2018/19
5. Discussion
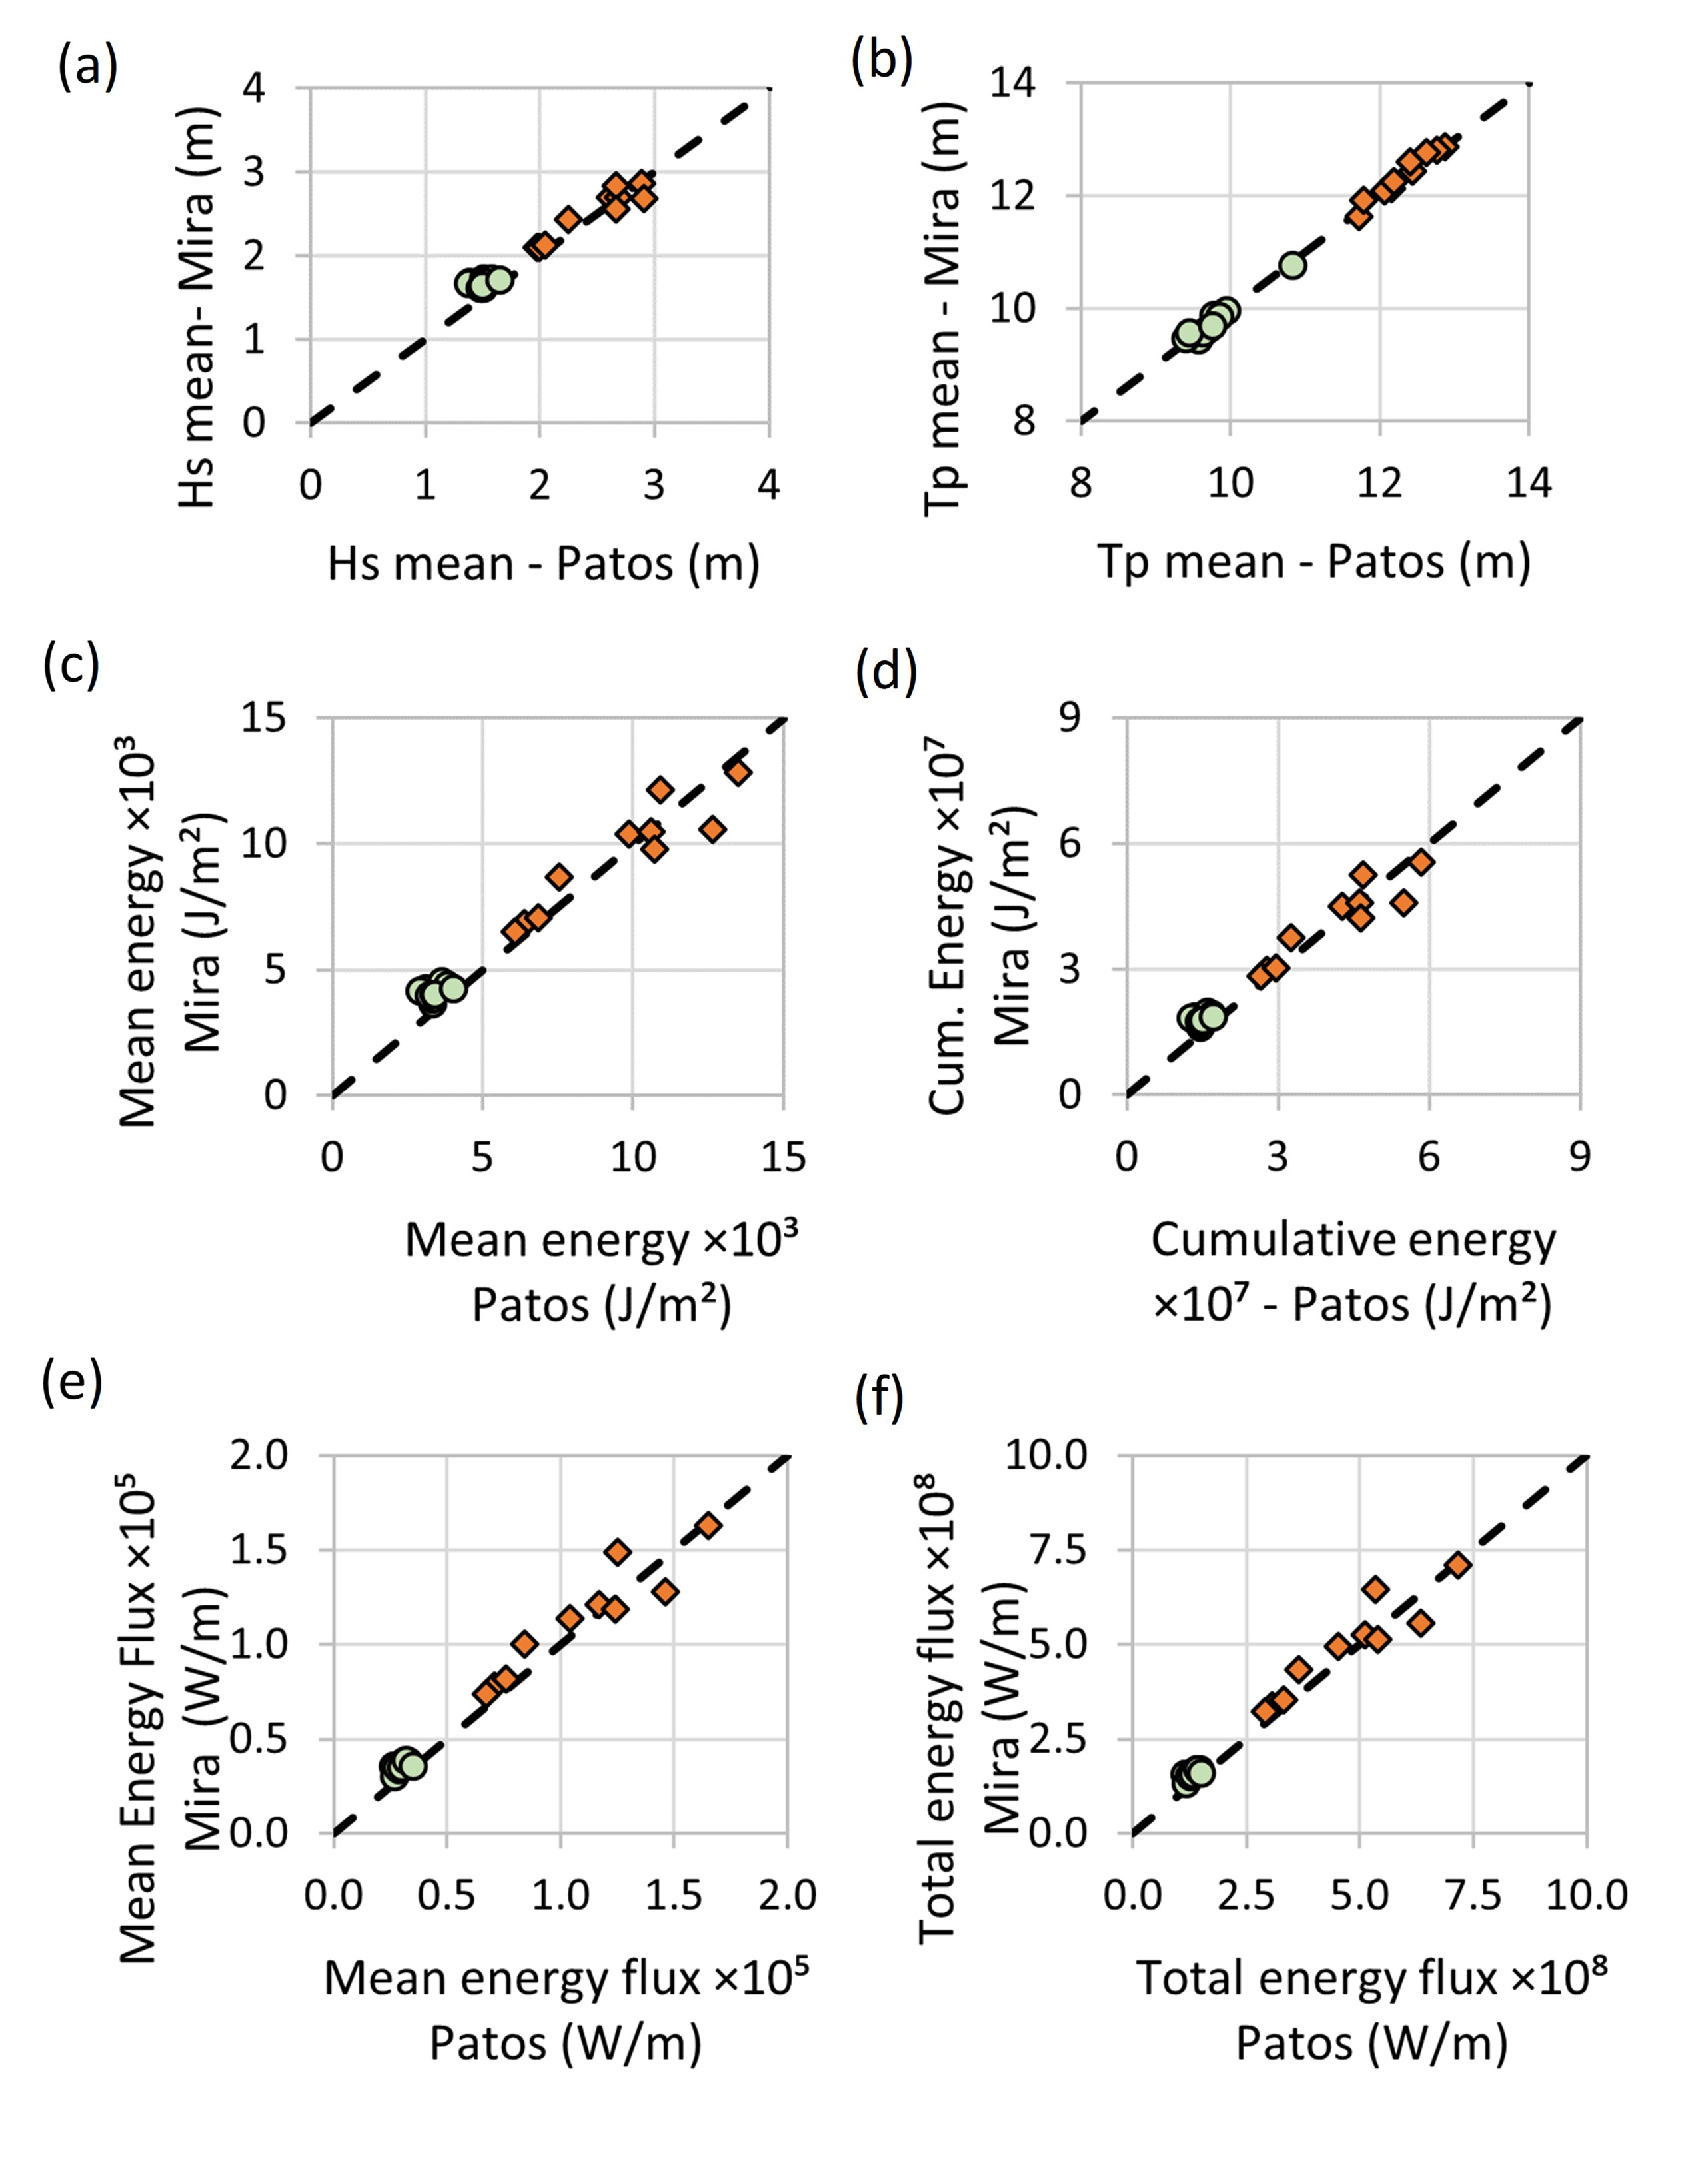
5.1. Wave Forcing
5.2. Beach Response to Winter Conditions
6. Conclusions
Supplementary Materials
Author Contributions
Funding
Institutional Review Board Statement
Informed Consent Statement
Data Availability Statement
Acknowledgments
Conflicts of Interest
References
- Masselink, G.; Pattiaratchi, C.B. Seasonal changes in beach morphology along the sheltered coastline of Perth, Western Australia. Mar. Geol. 2001, 172, 243–263. [Google Scholar] [CrossRef]
- Wright, L.D.; Short, A.D. Morphodynamic variability of surf zones and beaches: A synthesis. Mar. Geol. 1984, 56, 93–118. [Google Scholar] [CrossRef]
- Andriolo, U.; Gonçalves, G. Is coastal erosion a source of marine litter pollution? Evidence of coastal dunes being a reservoir of plastics. Mar. Pollut. Bull. 2022, 174, 113307. [Google Scholar] [CrossRef] [PubMed]
- Barnard, P.L.; Short, A.D.; Harley, M.D.; Splinter, K.D.; Vitousek, S.; Turner, I.L.; Allan, J.; Banno, M.; Bryan, K.R.; Doria, A.; et al. Coastal vulnerability across the Pacific dominated by El Niño/Southern Oscillation. Nat. Geosci. 2015, 8, 801–807. [Google Scholar] [CrossRef]
- Jackson, N.L.; Nordstrom, K.F.; Feagin, R.A.; Smith, W.K. Coastal geomorphology and restoration. Geomorphology 2013, 199, 1–7. [Google Scholar] [CrossRef]
- Román-Rivera, M.A.; Ellis, J.T. A synthetic review of remote sensing applications to detect nearshore bars. Mar. Geol. 2019, 408, 144–153. [Google Scholar] [CrossRef]
- Garnier, E.; Ciavola, P.; Spencer, T.; Ferreira, O.; Armaroli, C.; McIvor, A. Historical analysis of storm events: Case studies in France, England, Portugal and Italy. Coast. Eng. 2018, 134, 10–23. [Google Scholar] [CrossRef]
- Karunarathna, H.; Pender, D.; Ranasinghe, R.; Short, A.D.; Reeve, D.E. The effects of storm clustering on beach profile variability. Mar. Geol. 2014, 348, 103–112. [Google Scholar] [CrossRef]
- Loureiro, C.; Ferreira, Ó.; Cooper, J.A.G. Extreme erosion on high-energy embayed beaches: Influence of megarips and storm grouping. Geomorphology 2012, 139–140, 155–171. [Google Scholar] [CrossRef]
- Phillips, M.S.; Harley, M.D.; Turner, I.L.; Splinter, K.D.; Cox, R.J. Shoreline recovery on wave-dominated sandy coastlines: The role of sandbar morphodynamics and nearshore wave parameters. Mar. Geol. 2017, 385, 146–159. [Google Scholar] [CrossRef]
- Senechal, N.; Coco, G.; Castelle, B.; Marieu, V. Storm impact on the seasonal shoreline dynamics of a meso- to macrotidal open sandy beach (Biscarrosse, France). Geomorphology 2015, 228, 448–461. [Google Scholar] [CrossRef]
- Burvingt, O.; Masselink, G.; Russell, P.; Scott, T. Classification of beach response to extreme storms. Geomorphology 2017, 295, 722–737. [Google Scholar] [CrossRef]
- Vousdoukas, M.I.; Mentaschi, L.; Feyen, L.; Voukouvalas, E. Earth’s Future Extreme sea levels on the rise along Europe’s coasts Earth’s Future. Earth’s Futur. 2017, 5, 304–323. [Google Scholar] [CrossRef]
- Short, A.D. Australian beach systems: Are they at risk to climate change? Ocean Coast. Manag. 2022, 224, 106180. [Google Scholar] [CrossRef]
- Woolf, D.K.; Challenor, P.G.; Cotton, P.D. Variability and predictability of the North Atlantic wave climate. J. Geophys. Res. Ocean. 2002, 107, 9-1–9-14. [Google Scholar] [CrossRef]
- Lozano, I.; Devoy, R.J.N.; May, W.; Andersen, U. Storminess and vulnerability along the Atlantic coastlines of Europe: Analysis of storm records and of a greenhouse gases induced climate scenario. Mar. Geol. 2004, 210, 205–225. [Google Scholar] [CrossRef]
- Burvingt, O.; Castelle, B. Storm response and multi-annual recovery of eight coastal dunes spread along the Atlantic coast of Europe. Geomorphology 2023, 435, 108735. [Google Scholar] [CrossRef]
- Castelle, B.; Dodet, G.; Masselink, G.; Scott, T. A new climate index controlling winter wave activity along the Atlantic coast of Europe: The West Europe Pressure Anomaly. Geophys. Res. Lett. 2017, 44, 1384–1392. [Google Scholar] [CrossRef]
- Bertin, X.; Prouteau, E.; Letetrel, C. A significant increase in wave height in the North Atlantic Ocean over the 20th century. Glob. Planet. Chang. 2013, 106, 77–83. [Google Scholar] [CrossRef]
- Castelle, B.; Dodet, G.; Masselink, G.; Scott, T. Increased Winter-Mean Wave Height, Variability, and Periodicity in the Northeast Atlantic Over 1949–2017. Geophys. Res. Lett. 2018, 45, 3586–3596. [Google Scholar] [CrossRef]
- Ferreira, Ó.; Plomaritis, T.A.; Costas, S. Process-based indicators to assess storm induced coastal hazards. Earth-Sci. Rev. 2017, 173, 159–167. [Google Scholar] [CrossRef]
- Masselink, G.; Van Heteren, S. Response of wave-dominated and mixed-energy barriers to storms. Mar. Geol. 2014, 352, 321–347. [Google Scholar] [CrossRef]
- Roberts, T.M.; Wang, P.; Puleo, J.A. Storm-driven cyclic beach morphodynamics of a mixed sand and gravel beach along the Mid-Atlantic Coast, USA. Mar. Geol. 2013, 346, 403–421. [Google Scholar] [CrossRef]
- Eichentopf, S.; Alsina, J.M.; Christou, M.; Kuriyama, Y. Storm sequencing and beach profile variability at Hasaki, Japan. Mar. Geol. 2020, 424, 106153. [Google Scholar] [CrossRef]
- Ciavola, P.; Ferreira, O.; Haerens, P.; Van Koningsveld, M.; Armaroli, C.; Lequeux, Q. Storm impacts along European coastlines. Part 1: The joint effort of the MICORE and ConHaz Projects. Environ. Sci. Policy 2011, 14, 912–923. [Google Scholar] [CrossRef]
- Dehouck, A.; Dupuis, H.; Sénéchal, N. Pocket beach hydrodynamics: The example of four macrotidal beaches, Brittany, France. Mar. Geol. 2009, 266, 1–17. [Google Scholar] [CrossRef]
- Gallop, S.L.; Vila-Concejo, A.; Fellowes, T.E.; Harley, M.D.; Rahbani, M.; Largier, J.L. Wave direction shift triggered severe erosion of beaches in estuaries and bays with limited post-storm recovery. Earth Surf. Process. Landf. 2020, 45, 3854–3868. [Google Scholar] [CrossRef]
- Fellowes, T.E.; Vila-Concejo, A.; Gallop, S.L.; Harley, M.D.; Short, A.D. Wave shadow zones as a primary control of storm erosion and recovery on embayed beaches. Geomorphology 2022, 399, 108072. [Google Scholar] [CrossRef]
- Da Fontoura Klein, A.H.; Benedet Filho, L.; Schumacher, D.H. Short-term beach rotation processes in distinct headland bay beach systems. J. Coast. Res. 2002, 18, 442–458. [Google Scholar]
- Rey, S.; Alejo, I.; Alcántara-Carrió, J.; Vilas, F. Influence of Boundary Conditions on Morphodynamics and Sedimentology of Patos Beach (Ría de Vigo, Nw of Spain). In Littoral 2002, The Changing Coast; EUROCOAST/EUCC: Porto, Portugal, 2002; pp. 277–280. [Google Scholar]
- Vilas, F.; Bernabeu, A.M.; Méndez, G. Sediment distribution pattern in the Rias Baixas (NW Spain): Main facies and hydrodynamic dependence. J. Mar. Syst. 2005, 54, 261–276. [Google Scholar] [CrossRef]
- Bernabeu, A.M.; Lersundi-Kanpistegi, A.V.; Vilas, F. Gradation from oceanic to estuarine beaches in a ría environment: A case study in the Ría de Vigo. Estuar. Coast. Shelf Sci. 2012, 102–103, 60–69. [Google Scholar] [CrossRef]
- Rey, S.; Alejo, I.; Alonso, I.; Alcantara-Carrio, J. Field determination of sediment transport patterns: A case study from Patos Beach (Northwest Spain). J. Coast. Res. 2006, 2004, 607–610. [Google Scholar]
- Fontán-Bouzas, Á.; Andriolo, U.; Silva, P.A.; Baptista, P. Wave Impact Analysis on a Beach-Dune System to Support Coastal Management and Nourishment Works: The Showcase of Mira, Portugal. Front. Mar. Sci. 2022, 9, 861569. [Google Scholar] [CrossRef]
- Silva, R.; Baptista, P.; Veloso-Gomes, F.; Coelho, C.; Taveira-Pinto, F. Sediment grain size variation on a coastal stretch facing the North Atlantic (NW Portugal). J. Coast. Res. 2009, I, 762–766. [Google Scholar]
- Stronkhorst, J.; Huisman, B.; Giardino, A.; Santinelli, G.; Santos, F.D. Sand nourishment strategies to mitigate coastal erosion and sea level rise at the coasts of Holland (The Netherlands) and Aveiro (Portugal) in the 21st century. Ocean Coast. Manag. 2018, 156, 266–276. [Google Scholar] [CrossRef]
- Fernández-Fernández, S.; Ferreira, C.C.; Silva, P.A.; Baptista, P.; Romão, S.; Fontán-Bouzas, Á.; Abreu, T.; Bertin, X. Assessment of Dredging Scenarios for a Tidal Inlet in a High-Energy Coast. J. Mar. Sci. Eng. 2019, 7, 395. [Google Scholar] [CrossRef]
- Baptista, P.; Coelho, C.; Pereira, C.; Bernardes, C.; Veloso-Gomes, F. Beach morphology and shoreline evolution: Monitoring and modelling medium-term responses (Portuguese NW coast study site). Coast. Eng. 2014, 84, 23–37. [Google Scholar] [CrossRef]
- López-Olmedilla, L.; Almeida, L.P.; de Figueiredo, S.A.; Fontán-Bouzas, Á.; Silva, P.A.; Alcántara-Carrió, J. Effect of alongshore sediment supply gradients on projected shoreline position under sea-level rise (northwestern Portuguese coast). Estuar. Coast. Shelf Sci. 2022, 271, 107876. [Google Scholar] [CrossRef]
- Marinho, B.; Coelho, C.; Larson, M.; Hanson, H. Short- and long-term responses of nourishments: Barra-Vagueira coastal stretch, Portugal. J. Coast. Conserv. 2018, 22, 475–489. [Google Scholar] [CrossRef]
- Pinto, C.A.; Silveira, T.M.; Teixeira, S.B. Beach nourishment practice in mainland Portugal (1950–2017): Overview and retrospective. Ocean Coast. Manag. 2020, 192, 105211. [Google Scholar] [CrossRef]
- Antunes, C.; Taborda, R. Sea level at cascais tide gauge: Data, analysis and results. J. Coast. Res. 2009, 56, 218–222. [Google Scholar]
- Pilar, P.; Soares, C.G.; Carretero, J.C. 44-year wave hindcast for the North East Atlantic European coast. Coast. Eng. 2008, 55, 861–871. [Google Scholar] [CrossRef]
- Dolan, R.; Davis, R. Coastal Storm Hazards. J. Coast. Res. 1994, 12, 103–114. [Google Scholar]
- Biausque, M.; Senechal, N. Seasonal morphological response of an open sandy beach to winter wave conditions: The example of Biscarrosse beach, SW France. Geomorphology 2019, 332, 157–169. [Google Scholar] [CrossRef]
- Castelle, B.; Bujan, S.; Ferreira, S.; Dodet, G. Foredune morphological changes and beach recovery from the extreme 2013/2014 winter at a high-energy sandy coast. Mar. Geol. 2017, 385, 41–55. [Google Scholar] [CrossRef]
- Castelle, B.; Marieu, V.; Bujan, S.; Splinter, K.D.; Robinet, A.; Sénéchal, N.; Ferreira, S. Impact of the winter 2013-2014 series of severe Western Europe storms on a double-barred sandy coast: Beach and dune erosion and megacusp embayments. Geomorphology 2015, 238, 135–148. [Google Scholar] [CrossRef]
- Scott, T.; Masselink, G.; O’Hare, T.; Saulter, A.; Poate, T.; Russell, P.; Davidson, M.; Conley, D. The extreme 2013/2014 winter storms: Beach recovery along the southwest coast of England. Mar. Geol. 2016, 382, 224–241. [Google Scholar] [CrossRef]
- Flor-Blanco, G.; Alcántara-Carrió, J.; Jackson, D.W.T.; Flor, G.; Flores-Soriano, C. Coastal erosion in NW Spain: Recent patterns under extreme storm wave events. Geomorphology 2021, 387, 107767. [Google Scholar] [CrossRef]
- Oliveira, T.C.; Cagnin, E.; Silva, P.A. Wind-waves in the coast of mainland Portugal induced by post-tropical storms. Ocean Eng. 2020, 217, 108020. [Google Scholar] [CrossRef]
- Gomes, M.P.; Santos, L.; Pinho, J.L.; Do Carmo, J.S.A. Hazard assessment of storm events for the portuguese northern coast. Geosciences 2018, 8, 178. [Google Scholar] [CrossRef]
- Antunes, C.; Rocha, C.; Catita, C. Coastal flood assessment due to sea level rise and extreme storm events: A case study of the atlantic coast of Portugal’s mainland. Geosciences 2019, 9, 6–8. [Google Scholar] [CrossRef]
- Masselink, G.; Castelle, B.; Scott, T.; Konstantinou, A. Role of Atmospheric Indices in Describing Shoreline Variability Along the Atlantic Coast of Europe. Geophys. Res. Lett. 2023, 50, e2023GL106019. [Google Scholar] [CrossRef]
- Ferreira, C.C.; Silva, P.A.; Bernabeu, A.M.; Fontán-Bouzas, Á.; Fernández-Fernández, S.; Abreu, T. Tracking fluorescent tracer to monitor grain size-selective dispersion in subtidal zone: Patos Beach case study (NW Iberian Peninsula). Reg. Stud. Mar. Sci. 2024, 69, 103303. [Google Scholar] [CrossRef]
- Cooper, J.A.G.; Pilkey, O.H. Sea-level rise and shoreline retreat: Time to abandon the Bruun Rule. Glob. Planet. Change 2004, 43, 157–171. [Google Scholar] [CrossRef]
- Jackson, D.W.T.; Cooper, J.A.G.; Del Rio, L. Geological control of beach morphodynamic state. Mar. Geol. 2005, 216, 297–314. [Google Scholar] [CrossRef]
- Gallop, S.L.; Kennedy, D.M.; Loureiro, C.; Naylor, L.A.; Muñoz-Pérez, J.J.; Jackson, D.W.T.; Fellowes, T.E. Geologically controlled sandy beaches: Their geomorphology, morphodynamics and classification. Sci. Total Environ. 2020, 731, 139123. [Google Scholar] [CrossRef] [PubMed]
- Fontán-Bouzas, A.; Ferreira, C.C.; Abreu, T.; Bernabeu, A.; Silva, P.A.; Alcántara-Carrió, J.; Portz, L.; Manzolli, R. The role of the Cíes Islands on the wave regime and morphodynamics of the pocket beaches (Vigo Ria, Northwestern Iberian Peninsula). In Proceedings of the XI Coastal Geomorphology Conference, Santiago de Compostela, Spain, 27–29 July 2022; pp. 85–89. [Google Scholar]
- Villacieros-Robineau, N.; Gilcoto, M.; Pardo, P.C.; Barton, E.D. Wave regime and wave-current coupling in an upwelling–driven bay: Seasonal and inter-annual variability. J. Geophys. Res. Ocean. 2021, 126, e2021JC017540. [Google Scholar] [CrossRef]
- Harley, M.D.; Turner, I.L.; Short, A.D. New insights into embayed beach rotation: The importance of wave exposure and cross-shore processes. J. Geophys. Res. Earth Surf. 2015, 120, 1470–1484. [Google Scholar] [CrossRef]
- Ojeda, E.; Guillén, J. Shoreline dynamics and beach rotation of artificial embayed beaches. Mar. Geol. 2008, 253, 51–62. [Google Scholar] [CrossRef]
- Loureiro, C.; Ferreira, Ó. Mechanisms and Timescales of Beach Rotation; Elsevier Ltd.: Amsterdam, The Netherlands, 2020; ISBN 9780081029275. [Google Scholar]
- Castelle, B.; Robinet, A.; Idier, D.; D’Anna, M. Modelling of embayed beach equilibrium planform and rotation signal. Geomorphology 2020, 369, 107367. [Google Scholar] [CrossRef]
- Fellowes, T.E.; Vila-Concejo, A.; Gallop, S.L. Morphometric classification of swell-dominated embayed beaches. Mar. Geol. 2019, 411, 78–87. [Google Scholar] [CrossRef]
- Bowman, D.; Rosas, V.; Pranzini, E. Pocket beaches of Elba Island (Italy)—Planview geometry, depth ofclosure and sediment dispersal. Estuar. Coast. Shelf Sci. 2014, 138, 37–46. [Google Scholar] [CrossRef]
- Ponte Lira, C.; Silva, A.N.; Taborda, R.; De Andrade, C.F. Coastline evolution of Portuguese low-lying sandy coast in the last 50 years: An integrated approach. Earth Syst. Sci. Data 2016, 8, 265–278. [Google Scholar] [CrossRef]
- Andriolo, U.; Gonçalves, G.; Sobral, P.; Fontán-Bouzas, Á.; Bessa, F. Beach-dune morphodynamics and marine macro-litter abundance: An integrated approach with Unmanned Aerial System. Sci. Total Environ. 2020, 749, 141474. [Google Scholar] [CrossRef] [PubMed]
- Vitousek, S.; Buscombe, D.; Vos, K.; Barnard, P.L.; Ritchie, A.C.; Warrick, J.A. The future of coastal monitoring through satellite remote sensing. In Cambridge Prisms: Coastal Futures; Cambridge University Press: Cambridge, UK, 2022; Volume 1. [Google Scholar]
- Santos, D.; Fernández-Fernández, S.; Abreu, T.; Silva, P.A.; Baptista, P. Retrieval of nearshore bathymetry from Sentinel-1 SAR data in high energetic wave coasts: The Portuguese case study. Remote Sens. Appl. Soc. Environ. 2022, 25, 100674. [Google Scholar] [CrossRef]
- Mendes, D.; Pais-Barbosa, J.; Baptista, P.; Silva, P.A.; Bernardes, C.; Pinto, C. Beach Response to a Shoreface Nourishment (Aveiro, Portugal). J. Mar. Sci. Eng. 2021, 9, 1112. [Google Scholar] [CrossRef]

| Patos Beach | Mira Beach | Measurement | RMSE (m) |
|---|---|---|---|
| 1 September 2018 | Topo-bathy COSMO | 0.3 | |
| 21 September 2018 | 28 September 2018 | Topo-bathy MBES | 0.4 |
| 22 October 2018 | 22 October 2018 | DGPS | 0.05 |
| 8 November 2018 | 1 November 2018 | DGPS | 0.05 |
| 21 December 2018 | 21 December 2018 | DGPS | 0.05 |
| 11 January 2019 | 15 January 2019 | DGPS | 0.05 |
| 4 February 2019 | 4 February 2019 | DGPS | 0.05 |
| 22 May 2019 | 22 May 2019 | DGPS | 0.05 |
| 22 May 2019 | - | Topo-bathy MBES | 0.4 |
| 19 June 2019 | Topo-bathy COSMO | 0.3 |
| Hs Max (m) | Hs Mean (m) | Tp Max (s) | Tp Mean (s) | Cg Max (m/s) | Mean Energy (J/m2) ×10³ | Total Energy Flux (W/m) ×10⁸ | Mean Wave Steep. | ||
|---|---|---|---|---|---|---|---|---|---|
| Summer | 2010 | 6.6 | 1.4 | 18.2 | 9.6 | 16.9 | 3.1 | 1.2 | 0.009 |
| Winter | 2010/11 | 6.9 | 2.0 | 19.5 | 11.7 | 18.3 | 6.4 | 3.1 | 0.009 |
| Summer | 2011 | 5.5 | 1.4 | 19.6 | 9.7 | 18.4 | 2.9 | 1.2 | 0.009 |
| Winter | 2011/12 | 6.2 | 2.0 | 20.5 | 12.2 | 19.1 | 6.1 | 2.9 | 0.009 |
| Summer | 2012 | 4.6 | 1.5 | 19.3 | 9.4 | 18.1 | 3.3 | 1.2 | 0.011 |
| Winter | 2012/13 | 6.7 | 2.6 | 18.4 | 12.1 | 17.2 | 9.9 | 4.5 | 0.011 |
| Summer | 2013 | 5.6 | 1.5 | 19.5 | 9.6 | 18.2 | 3.6 | 1.4 | 0.010 |
| Winter | 2013/14 | 8.5 | 2.9 | 20.5 | 12.9 | 19.1 | 13.5 | 7.2 | 0.011 |
| Summer | 2014 | 5.6 | 1.5 | 19.1 | 9.4 | 17.8 | 3.3 | 1.3 | 0.010 |
| Winter | 2014/15 | 6.0 | 2.3 | 20.9 | 12.4 | 19.5 | 7.5 | 3.7 | 0.009 |
| Summer | 2015 | 4.7 | 1.6 | 19.0 | 9.8 | 17.8 | 3.8 | 1.5 | 0.010 |
| Winter | 2015/16 | 7.0 | 2.7 | 20.2 | 12.2 | 18.9 | 10.6 | 5.1 | 0.012 |
| Summer | 2016 | 4.6 | 1.5 | 17.7 | 10.0 | 16.4 | 3.2 | 1.3 | 0.009 |
| Winter | 2016/17 | 8.9 | 2.0 | 18.8 | 11.8 | 17.5 | 6.8 | 3.3 | 0.009 |
| Summer | 2017 | 4.9 | 1.5 | 17.2 | 9.9 | 15.9 | 3.4 | 1.3 | 0.010 |
| Winter | 2017/18 | 8.9 | 2.7 | 21.5 | 12.4 | 20.0 | 10.9 | 5.4 | 0.011 |
| Summer | 2018 | 4.8 | 1.5 | 19.5 | 10.8 | 18.3 | 3.4 | 1.4 | 0.008 |
| Winter | 2018/19 | 8.3 | 2.7 | 21.5 | 12.8 | 20.0 | 10.7 | 5.4 | 0.011 |
| Summer | 2019 | 4.4 | 1.7 | 21.5 | 9.8 | 20.0 | 4.1 | 1.5 | 0.011 |
| Winter | 2019/20 | 9.7 | 2.9 | 21.5 | 12.6 | 20.0 | 12.6 | 6.3 | 0.012 |
| Hs Max (m) | Hs Mean (m) | Tp Max (s) | Tp Mean (s) | Cg Max (m/s) | Mean Energy (J/m²) ×10³ | Total Energy Flux (W/m) ×10⁸ | Mean Wave Steep. | ||
|---|---|---|---|---|---|---|---|---|---|
| Summer | 2010 | 6.6 | 1.7 | 18.2 | 9.5 | 17.0 | 4.3 | 1.6 | 0.012 |
| Winter | 2010/11 | 7.9 | 2.1 | 19.7 | 11.6 | 18.2 | 6.9 | 3.4 | 0.010 |
| Summer | 2011 | 5.2 | 1.7 | 19.4 | 9.6 | 18.0 | 4.1 | 1.6 | 0.011 |
| Winter | 2011/12 | 5.6 | 2.1 | 20.7 | 12.1 | 18.9 | 6.5 | 3.2 | 0.009 |
| Summer | 2012 | 4.0 | 1.6 | 18.8 | 9.5 | 17.5 | 3.7 | 1.3 | 0.011 |
| Winter | 2012/13 | 10.3 | 2.7 | 19.0 | 12.1 | 17.7 | 10.4 | 5.0 | 0.012 |
| Summer | 2013 | 4.9 | 1.7 | 20.6 | 9.6 | 18.8 | 4.5 | 1.7 | 0.012 |
| Winter | 2013/14 | 7.7 | 2.9 | 20.7 | 12.9 | 18.9 | 12.8 | 7.1 | 0.012 |
| Summer | 2014 | 5.0 | 1.6 | 19.3 | 9.6 | 17.9 | 3.8 | 1.5 | 0.011 |
| Winter | 2014/15 | 5.7 | 2.4 | 21.0 | 12.4 | 19.1 | 8.7 | 4.3 | 0.010 |
| Summer | 2015 | 4.6 | 1.7 | 19.5 | 9.9 | 18.1 | 4.4 | 1.7 | 0.011 |
| Winter | 2015/16 | 7.0 | 2.7 | 20.8 | 12.2 | 19.0 | 10.5 | 5.3 | 0.012 |
| Summer | 2016 | 4.6 | 1.7 | 17.6 | 10.0 | 16.5 | 4.0 | 1.6 | 0.011 |
| Winter | 2016/17 | 7.8 | 2.1 | 19.0 | 11.9 | 17.7 | 7.0 | 3.5 | 0.010 |
| Summer | 2017 | 4.5 | 1.7 | 16.3 | 9.9 | 15.2 | 4.0 | 1.6 | 0.011 |
| Winter | 2017/18 | 8.7 | 2.8 | 21.5 | 12.6 | 19.4 | 12.2 | 6.5 | 0.012 |
| Summer | 2018 | 4.8 | 1.6 | 21.5 | 10.8 | 19.4 | 4.0 | 1.7 | 0.009 |
| Winter | 2018/19 | 8.8 | 2.6 | 21.5 | 12.8 | 19.4 | 9.8 | 5.2 | 0.010 |
| Summer | 2019 | 3.8 | 1.7 | 21.5 | 9.7 | 19.4 | 4.2 | 1.6 | 0.011 |
| Winter | 2019/20 | 7.7 | 2.7 | 21.5 | 12.8 | 19.4 | 10.6 | 5.6 | 0.011 |
| Shoreline Position | Beach Slope | Berm Height | Submerged Bars | Subaerial Volume Changes | Sediment Transport | |
|---|---|---|---|---|---|---|
| Embayed Patos Beach | Quasi stable | Gradual decrease and uniform alongshore | Gradual decrease | Development of only 1 bar | Low erosional trend | Mainly cross-shore |
| Open Mira Beach | More dynamic (retreat) | Rapid changes and variable alongshore | Abrupt decrease | Migration of several bars | High erosional trend | Long-shore and cross-shore |
Disclaimer/Publisher’s Note: The statements, opinions and data contained in all publications are solely those of the individual author(s) and contributor(s) and not of MDPI and/or the editor(s). MDPI and/or the editor(s) disclaim responsibility for any injury to people or property resulting from any ideas, methods, instructions or products referred to in the content. |
© 2024 by the authors. Licensee MDPI, Basel, Switzerland. This article is an open access article distributed under the terms and conditions of the Creative Commons Attribution (CC BY) license (https://creativecommons.org/licenses/by/4.0/).
Share and Cite
Fontán-Bouzas, Á.; Abreu, T.; C. Ferreira, C.; Silva, P.A.; López-Olmedilla, L.; Guitián, J.; Bernabeu, A.M.; Alcántara-Carrió, J. Morphodynamic Response of Open and Embayed Beaches to Winter Conditions: Two Case Studies from the North Atlantic Iberian Coast. J. Mar. Sci. Eng. 2024, 12, 168. https://doi.org/10.3390/jmse12010168
Fontán-Bouzas Á, Abreu T, C. Ferreira C, Silva PA, López-Olmedilla L, Guitián J, Bernabeu AM, Alcántara-Carrió J. Morphodynamic Response of Open and Embayed Beaches to Winter Conditions: Two Case Studies from the North Atlantic Iberian Coast. Journal of Marine Science and Engineering. 2024; 12(1):168. https://doi.org/10.3390/jmse12010168
Chicago/Turabian StyleFontán-Bouzas, Ángela, Tiago Abreu, Caroline C. Ferreira, Paulo A. Silva, Laura López-Olmedilla, José Guitián, Ana M. Bernabeu, and Javier Alcántara-Carrió. 2024. "Morphodynamic Response of Open and Embayed Beaches to Winter Conditions: Two Case Studies from the North Atlantic Iberian Coast" Journal of Marine Science and Engineering 12, no. 1: 168. https://doi.org/10.3390/jmse12010168
APA StyleFontán-Bouzas, Á., Abreu, T., C. Ferreira, C., Silva, P. A., López-Olmedilla, L., Guitián, J., Bernabeu, A. M., & Alcántara-Carrió, J. (2024). Morphodynamic Response of Open and Embayed Beaches to Winter Conditions: Two Case Studies from the North Atlantic Iberian Coast. Journal of Marine Science and Engineering, 12(1), 168. https://doi.org/10.3390/jmse12010168