Abstract
Remote sensing has been widely used for oil spill monitoring in open waters. However, research on remote sensing monitoring of oil spills in ice-infested sea waters (IISWs) is still scarce. The spectral characteristics of oil-contaminated sea ice (OCSI) and clean sea ice (CSI) and their differences are an important basis for oil spill detection using visible/near-infrared (VNIR) remote sensing. Such features and differences can change with the observation geometry, affecting the identification accuracy. In this study, we carried out multi-angle reflection observation experiments of oil-contaminated sea ice (OCSI) and proposed a kernel-driven bidirectional reflectance distribution function (BRDF) model, Walthall–Ross thick-Litransit-Lisparse-r-RPV (WaRoLstRPV), which takes into account the strong forward-scattering characteristics of sea ice. We also analyzed the preferred observation geometry for oil spill monitoring in IISWs. In the validation using actual measured data, the proposed WaRoLstRPV performed well, with RMSEs of 0.0031 and 0.0026 for CSI and OCSI, respectively, outperforming the commonly used kernel-driven BRDF models, Ross thick-Li sparse (R-LiSpr), QU-Roujean (Qu-R), QU-Lisparse R-r-RPV (Qu-LiSpr-RrRPV), and Walthall (Wa). The observation geometry with a zenith angle around 50° and relative azimuth ranging from 250° to 290° is preferred for oil spill detection in IISWs.
1. Introduction
With the development of high-latitude maritime routes and the exploitation of oil and gas resources, oil spills have become a significant risk in ice-infested sea waters (IISWs). The Northeast Passage in the Arctic has achieved regular commercial operations, gradually increasing the number of vessels passing through it [1]. Coastal nations in the Arctic region are exploring and developing marine oil and gas resources. The Bohai Sea in China is influenced by cold air, resulting in three to four months of ice formation during winter. The Liaodong Bay, which is located at the southern edge of the ice-covered area in the Northern Hemisphere, is home to major oil fields, such as the Liaohe and Dagang oil fields. Ports along the northern coast, including the Yingkou Port and Jinzhou Port, are vital import hubs for crude oil in China. The presence of sea ice poses severe hazards to oil production and transportation, including damage to passing vessels, oil platforms, pipelines, and an increased likelihood of oil spill accidents.
Once an oil spill occurs in an IISW, the cleanup process becomes challenging and prolonged and can lead to severe ecological disasters. The risk of oil spills from vessels operating in IISWs has become a focal point in Arctic development and protection. To address this concern, the International Maritime Organization (IMO) has developed the “Polar Code”, with Part II-A, Chapter I, specifically outlining the mandatory measures for preventing oil pollution. The accurate monitoring of oil spills is crucial in providing precise information support for spill clean-up. This is an essential aspect of emergency response.
Currently, most oil spill monitoring efforts are focused on open waters. Remote sensing technologies used for oil spill monitoring in open waters include visible/near-infrared (VNIR) remote sensing [2], thermal infrared remote sensing [3], and synthetic-aperture radar (SAR)/marine radar [4,5,6]. Among these, VNIR remote sensing is one of the primary techniques for observing oil spills in open waters due to its simplicity, ease of access in obtaining remote sensing images, and low cost. A theoretical basis for oil spill detection using VNIR remote sensing lies in the spectral differences between oil and seawater reflections. Research has been conducted on the spectral characteristics of different types of oil spills [7], which vary in thicknesses [8,9,10] and have different degrees of weathering [11]. Currently, most studies have focused on the spectral characteristics of oil slicks in open waters to effectively identify and differentiate oil slick regions. However, the spectral characteristics of oil slicks on clean sea ice (CSI) are more complex than those in open waters. The spectral features obtained from open waters cannot be directly applied to detect and identify oil-contaminated sea ice (OCSI). Therefore, studying the spectral characteristics of CSI and OCSI is necessary to distinguish oil slicks on sea ice, which is essential for oil spill identification.
However, there is limited research on remote sensing monitoring of oil spills in IISWs. To investigate the distribution characteristics of petroleum and hydrocarbon substances within and beneath snow, Bradford et al. [12] utilized ground-penetrating radar to detect oil leakage within snow, and found that ground-penetrating radar can be a powerful tool to significantly improve the monitoring of oil spill characteristics in IISWs and guide actual spill response operations. Building upon this, Bradford et al. [13] developed a targeted algorithm for ground-penetrating radar waveform inversion, enabling quantification of the geometric shapes of oil leakage beneath and within sea ice. Based on experimental and measured data, Asihen et al. [14] demonstrated that the backscattering effects of C-band radar can effectively identify the differential characteristics of CSI and OCSI, facilitating the identification of oil spills on sea ice surfaces. Dickins et al. [15] conducted a series of experiments to test the capabilities of some remote sensing methods in detecting oil spills in IISWs. They tested SAR, infrared, VNIR, and laser fluorescence sensors. The results indicated that multispectral and hyperspectral VNIR remote sensing could be used to detect oil spills among ice packs and on ice surfaces. To explore the reflectance spectral characteristics of oil spills in IISWs, Li et al. [16] conducted experiments to measure the reflectance of oil films under different seawater, broken ice, and solid ice backgrounds. They extracted the spectral features for detecting oil spills in the VNIR range. Using the spectral characteristics of oil contamination and sea ice, Liu et al. [17] researched the inversion of the oil spill area ratio on ice surfaces. An important basis for monitoring oil spills in IISWs is the existence of spectral differences between CSI and OCSI; these differences show the spectral characteristic bands that can distinguish OCSI and CSI, which can vary with changes in the observation geometry and affect identification accuracy. These kinds of changes could be described by using the bidirectional reflectance distribution function (BRDF).
BRDF is a function closely related to the view zenith angle (VZA), solar zenith angle (SZA), and sensor–sun relative azimuth angle. It describes the spatial characteristics of non-Lambertian surface reflectance concerning the changing directions of incident and viewing angles. The initial development of reflectance fitting based on the BRDF function was primarily focused on surface types, such as vegetation and soil, where backscattering is stronger than forward scattering. BRDF-based bidirectional reflectance models have been proposed and developed to characterize strong backscattering surfaces. These models can be broadly classified into three categories: (1) Physical models: examples include the Discrete Ordinate Radiative Transfer (DISORT) model [18], the Cook–Torrance model [19], and the Asymptotic Radiative Theory (ART) developed by Kokhanovsky et al. based on snow-covered surfaces [20]. (2) Empirical models: common examples are empirical formulas that provide straightforward calculations of reflected light, such as the Walthall model [21]. (3) Semi-empirical models: The Rahman–Pinty–Verstraete (RPV) model developed by Pinty et al., which combines physical relationships with measured data [22], and the RossThick-LiSparse-Reciprocal (RTLSR) coupled model developed by Roujean et al. based on a linear kernel-driven model [23].
There is limited research on the bidirectional reflectance of sea ice, and few studies have investigated that of CSI and OCSI. The forward-scattering intensity of ice and snow is significantly greater than the backward-scattering intensity, but the classical BRDF models have paid limited attention to these scattering characteristics. Traditional linear kernel-driven models cannot accurately describe the scattering behavior of ice surfaces. For surfaces with strong forward scattering, such as ice and snow, there is currently no dedicated volume scattering kernel or geometric-optical scattering kernel established. Ice and snow exhibit a forward-scattering characteristic that is significantly different from that of vegetation surfaces. Therefore, when constructing BRDF models for these types of surfaces, it is common to borrow from the volume scattering kernel and geometric-optical scattering kernel used for vegetation and introduce a forward scattering kernel to adjust and capture the scattering characteristics of ice and snow. Qu et al. [24] proposed a method tailored to such a strong forward-scattering capability. They modified the traditional linear kernel function by introducing a forward scattering kernel to better reflect the characteristics of ice and snow. Jiao et al. [25] proposed a new snow kernel based on the ART model, which modified the traditional RTLSR model to describe the anisotropic reflection of snow surfaces. The experimental data showed that this model effectively simulated the anisotropy of pure snow-covered surfaces. Ding et al. [26] evaluated the fitting capability of the RossThick-LiSparseReciprocal-Snow (RTLSRS) model for ice and snow bidirectional reflectance using multi-angle reflectance data from POLDER. The results demonstrated that the model achieved a high accuracy in characterizing the directional scattering of ice and snow, outperforming the fitting results of the ART model. However, the RTLSRS model requires detailed physical parameters of ice and snow as its input, which are often difficult to obtain in practical applications. The above-mentioned BRDF models are focused on clean ice and snow surfaces. They do not take into account the scenario of OCSI. To accurately describe the directional spectral features of OCSI, it is necessary to establish a BRDF model suitable for OCSI and select appropriate observation angles for oil spill detection, thereby improving the accuracy of oil spill detection in IISWs.
In this study, we conducted multi-angle reflectance measurements on OCSI to investigate its spectral characteristics and angular variations. Based on the extracted spectral features for oil-contaminated identification, we developed a Walthall–Ross thick-Litransit-Lisparse-r-RPV (WaRoLstRPV) BRDF model. It is designed explicitly for OCSI, taking into account the characteristics of the classical BRDF models. Simulations and analyses were performed to compare the reflectance differences between CSI and OCSI under different observation geometries. These analyses allowed us to determine the range of optimal observation geometries for oil spill detection in IISWs.
2. Data and Methods
2.1. Measurement of Reflectance
The anisotropy of surface reflectance refers to the variation of reflection characteristics in objects, which change with wavelengths and spatial features, such as viewing angle and azimuth. This phenomenon is commonly represented by the BRDF. However, other measurements beyond a direct measurement of the BRDF are needed, and therefore, researchers often employ the bidirectional reflectance factor (BRF) as a substitute in their studies.
The multi-angle observation experiment was conducted using an ASD FieldSpec®3 spectroradiometer (Malvern Panalytical Ltd., Malvern, UK). The spectral measurement range is from 350 to 2500 nm. The spectral resolution is 1.4 nm in the 350–1000 nm range and 2.0 nm in the 1000–2500 nm range. The spectroradiometer is equipped with a fiber-optic probe as the front-end sensor, and the probe’s field of view is 8°. In this experiment, the ASD FieldSpec®3 probe (Malvern Panalytical Ltd., Malvern, UK) was mounted on a multi-angle observation platform for reflectance measurement. The sensor is approximately 50 cm above the ice surface, and at a VZA of 0°, the observed area is a circular region with a diameter of about 7 cm (indicated by the solid line in Figure 1a). When VZA is not 0°, the observed area forms an elliptical region (indicated by the dashed line in Figure 1a).
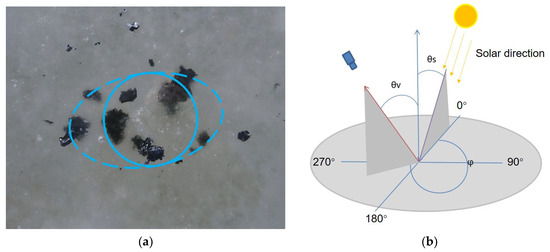
Figure 1.
Diagram of observation geometry, (a) the schematic diagram of OCSI and the observation range is as follows, (b) ground platform for multi-angular observations.
The experiment was conducted under clear, cloudless weather conditions with temperatures around −10 °C. To ensure the comparability of data from different dates, measurements were made at similar solar elevation angles whenever possible.
The sea ice used in the experiment was formed naturally from seawater off the coast in the Yellow Sea, with an approximate thickness of 10 cm.
The oil used in the experiment was heavy diesel fuel from the vessel “Yukun”. The average thickness of the oil layer was about 2 mm, with some parts covered by thin ice. Under different observation zenith angle conditions, the fraction of the oil within the field of view ranged from 27.6% to 30.9%.
We represent the observation geometry using the relative azimuth angle (RAZ), SZA, and VZA between the sensor and the sun. When the sensor’s observation direction aligns with the sun’s incident direction, the RAZ is 0 degrees. Then, the RAZ increases in a clockwise direction. Regarding the RAZ, the data collection primarily focused on the principal plane (0°–180°) and the principal perpendicular plane (90°–270°). In the following sections, specific observation angles are represented using the RAZ/VZA notation. For example, if the relative azimuth angle is 0 degrees and the observation zenith angle is 30 degrees, it is expressed as 0/30. The observation angles on each plane ranged from 0° to 50°, and data were collected at 10° intervals (Figure 1). For each angle, 10 sets of data were obtained. Out of these, 6 sets were averaged to represent the results under that specific observation geometry and used for constructing the BRDF model. The remaining 4 sets were utilized to evaluate the fitting performance of the model.
During data collection with the spectroradiometer, the average of every 10 measurements was taken to generate one valid data point. This process was repeated 10 times. The observed values of sea ice () and the reference panel () were recorded separately. The reflectance of the measurement target was calculated using the ratio method.
In the equation, represents the reflectance of CSI or OCSI; represents the reflectance of the referee panel; is the value obtained by the spectrometer; represents CSI or OCSI observations; represents the reference panel observations; and represents the central wavelength of the spectral sampling point.
Due to the similarity in spectral characteristics for the same object at different observation angles, it is challenging to select characteristic bands from the original spectral curves directly. In this study, we proposed to perform an envelope removal operation on the multi-spectral measured data, amplifying the spectral feature differences between the CSI and oil spills. Finally, we employed a spectral standard deviation analysis method to confirm the characteristic wavelength.
2.2. Spectral Standard Deviation Analysis
In this study, we used a spectral standard deviation analysis method to identify the wavelength with the largest spectral feature difference. Feature extraction [27] can be operated on the active ingredient present in spectral reflectance measurement data to extract valid data. The extraction of characteristic bands is closely related to the quality and accuracy of subsequent spectral data processing. In the data processing phase, we employed an envelope removal method to obtain the spectrally separable range. Subsequently, we utilized the spectral standard deviation analysis method. Then, based on the absolute difference between the spectral reflectance of CSI and OCSI at a specific wavelength λ, we compared it to the sum of the standard deviations of the two surfaces at that wavelength. Specifically, if the absolute difference is greater than the sum of the standard deviations, then
where represents the absolute difference between OCSI and CSI in spectral reflectance; represents the sum of the spectral reflectance standard deviations between OCSI and CSI; represents the spectral reflectance standard deviations of CSI; and represents the spectral reflectance standard deviations of OCSI.
Under such circumstances, it can be assumed that CSI and OCSI can be differentiated based on the spectral curve at wavelength λ. The wavelength λ represents the hyperspectral characteristic wavelength that distinguishes between the two types of objects. In this case, an appropriate bidirectional reflectance model can be selected to fit the spectral data.
2.3. BRDF Model
Ice and snow surfaces exhibit a stronger forward-scattering intensity and a rough and uneven texture. When sunlight illuminates such a surface, it undergoes diffuse scattering in various directions. In light of the scattering characteristics of sea ice coverage, this study proposed a semi-empirical kernel-driven WaRoLstRPV BRDF model. The formula for the constructed kernel-driven model is as follows:
The symbol represents the BRF at a given solar zenith angle , view zenith angle , relative azimuth angle , and wavelength . , , , and represent the volume scattering kernel, the geometric-optical scattering kernel, the forward scattering kernel, and the empirical kernel, respectively.
The coefficients , , , , and correspond to the weights assigned to the isotropic scattering kernel, volume scattering kernel, geometric-optical scattering kernel, forward scattering kernel, and empirical kernel functions, respectively. These coefficients determine the contribution of each component to the overall scattering behavior.
The isotropic scattering kernel function represents a constant term, and its corresponding coefficient reflects the reflectance values in the zenith illumination and reflection direction. The volume scattering kernel function primarily accounts for the randomly distributed leaf components within a canopy. It is used to describe the BRDF of bowl-shaped hotspots and uneven leaf canopies. Commonly used volume scattering kernel functions include the Ross-thick (RT) kernel [28] and the Ross-thick–Maigna (RTM) kernel derived by Maigna et al. [29] based on Jupp and Strahler’s theory of mutual shadowing. Although commonly used models are mainly aimed at vegetation scattering, simulation of strong forward-scattering features is insufficient. However, its kernel function can be used as the basis, and by introducing the forward scattering kernel, snow, and ice scattering characteristics can be better simulated. Since this study disregarded hotspot effects, the selected volume scattering kernel function is as follows [25]
where is the scattering phase angle, which is related only to the observed solar zenith angle , the observed azimuth angle , and the relative azimuth angle .
The geometric-optical kernel function describes the strong shadowing effects caused by sparsely distributed tree crowns or other opaque vegetation canopies. It captures the geometric-optical scattering resulting from the discrete three-dimensional structure of vegetation and its shadowing effects. Commonly used geometric-optical kernel functions include the Roujean kernel, Lisparse kernel, LiDense kernel, and LiTransit kernel. The LiTransit kernel represents a transitional form of the Lisparse kernel. To ensure the applicability of the proposed model to various surface conditions while considering that oil patches on a sea ice surface tend to aggregate, as well as to account for non-sparse surface coverage in observations, the Lisparse kernel and LiTransit kernel are combined to form a comprehensive geometric-optical kernel function. The kernel function is expressed as follows [29]
where quantifies the horizontal distance between the sun and the view direction. The calculation determines the bulk scattering kernel and the geometric-optical kernel.
The characteristics of strong forward scattering on sea ice surfaces are difficult to describe using traditional kernel-driven models. To represent the characteristics of strong forward scattering, we introduced a forward-scattering factor into the model. In this study, the RPV radiative transfer model [24] was selected. The influence of hotspots was neglected, and the parameters k and g in the model were adjusted to typical values that favor forward scattering. By incorporating these modifications, a corrected RPV kernel function (r-RPV) was obtained, which serves as the forward-scattering parameter kernel. The formula is expressed as follows [24]
where k = 0.846, and g = 0.0667.
The Walthall (Wa) model is suitable for representing surfaces with strong diffuse scattering effects. Considering the scattering variations caused by gaps on sea ice surfaces, the modified Wa model [29] was introduced for local correction. The modified Wa model was incorporated as an empirical kernel function for model construction. The formula for the empirical kernel function is as follows [29]
where:
For CSI and OCSI, the feasibility of and differences between the model proposed in this study and other models were compared. The following BRDF models were employed for comparison: Ross thick-Li sparse (R-LiSpr) [30], QU-Roujean (Qu-R) [31], QU-Lisparse R-r-RPV (Qu-LiSpr-RrRPV) [24], Wa [29], and WaRoLstRPV. The Qu kernel is a modification of the Ross-thick volume scattering kernel. Although Qu-R and R-LiSpr models share similar simplified expressions, there are differences in their geometric-optical and volume scattering kernels (Table 1). These models were fitted to the data obtained from CSI and OCSI, respectively. By doing so, the study explored the multi-angle spectral characteristics of sea ice reflection and determined the range of observation angles. These findings could guide practical oil spill monitoring efforts.

Table 1.
Fitting method of sea ice surface bidirectional reflection factor.
3. Result
3.1. Spectral Characteristics of OCSI
In this study, multi-angle reflectance spectral data of CSI and OCSI were collected through experiments using the visible-to-thermal-infrared wavelength range. The data were obtained at 11 observation angles, both in the principal and principal perpendicular planes. By analyzing the measured reflectance spectra of CSI and OCSI, it was observed that the reflectance data exhibit a generally decreasing trend in the visible-to-near-infrared range, while in the infrared range and more extended wavelength range, the spectra show irregular variations due to noise. Overall, the reflectance of OCSI is lower than that of CSI. The reflectance spectrum of OCSI is smoother, with only a reflection peak at around 760 nm. On the other hand, CSI exhibits an absorption trough at around 1000 nm and a small reflection peak at around 1100 nm. Therefore, based on the distribution pattern of the measured spectral data, this study focused on investigating the spectral features using the measured data of CSI and OCSI within the visible-to-near-infrared wavelength range. During the measurements in the principal plane and vertical plane, we separately measured the reflectance of CSI and OCSI at a zenith angle of 0 degrees. There was a difference in time between these two measurements, resulting in a change in the SZA. This variation in the SZA may be the cause of the difference in reflectance between (a–b) and (c–d) at 0 degrees [32].
For the spectral characteristics of CSI, the reflectance features in the azimuthal range of 0°–180° were studied. As the VZA decreases, the received reflectance by the sensor increases due to the laws of optical propagation. When the VZA approaches the critical point of 0°, the reflectance change in the forward-scattering region exhibits a completely different trend compared to the backscattering region, as shown in Figure 2b. In the forward-scattering region, within the range of [180°/50°, 180°/0°], as the VZA approaches 0°, the received reflectance by the sensor decreases. When the VZA is 0°, the sensor receives the minimum reflectance in the forward-scattering region. This reflectance characteristic only applies to the azimuthal range of 0°–180°. For azimuth angles between 90° and 270°, the reflectance also increases as the VZA increases. At azimuth angles of 90° and 270°, and with the VZA around 50°, the measured reflectance of CSI remains at its maximum in that region.
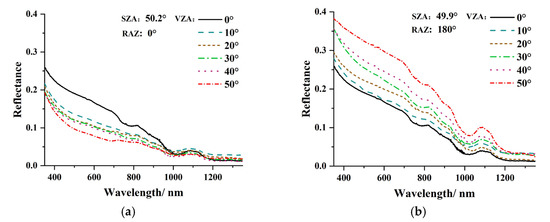
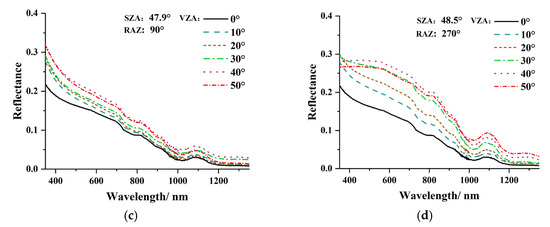
Figure 2.
The reflection spectrum of CSI under different geometric conditions, (a) RAZ = 0°, (b) RAZ = 180°, (c) RAZ = 90°, and (d) RAZ = 270°.
As shown in Figure 3, it can be observed that for OCSI, within the azimuthal range of 0°–180° in the forward-scattering region, the measured reflectance of contaminated ice reaches its maximum when the VZA is equal to the SZA. As the VZA approaches 0°, the received reflectance by the sensor decreases, reaching its minimum at a VZA of 0°. In the backscattering region, when the VZA is 0°, the sensor’s received reflectance reaches its maximum. As the VZA gradually approaches the SZA, the received reflectance decreases. When the VZA is close to the SZA, the reflectance value reaches its minimum. The spectral response of contaminated sea ice exhibits a similar trend to that of CSI. Like CSI, this spectral response trend applies only to the principal plane. When the azimuth angle is between 90° and 270° at a VZA of 0°, the received reflectance by the sensor is at its minimum. As the VZA increases, the received reflectance also increases, reaching its maximum at the maximum VZA.
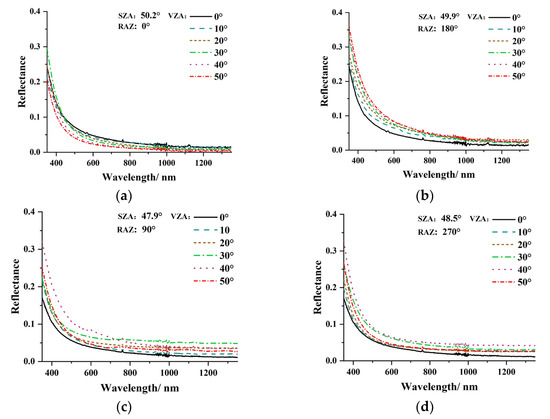
Figure 3.
The reflection spectrum of OCSI under different geometric conditions, (a) RAZ = 0°, (b) RAZ = 180°, (c) RAZ = 90°, and (d) RAZ = 270°.
After exploring the spectral response characteristics of CSI and OCSI, it was found that sea ice exhibits different spectral response characteristics in different situations. To identify suitable spectral bands for effective discrimination of sea ice before and after pollution, this study employed the spectral standard deviation analysis method described in the previous section to identify characteristic wavelengths. The results are shown in Figure 4, where the solid line is the absolute difference in reflectance between OCSI and CSI, and the part of the dashed line is the sum of their standard deviations. In these characteristic wavelengths, the spectral features of sea ice exhibit significant variations corresponding to changes in the observation angles. Combining these results with the reflectance difference map shows that the reflectance of OCSI is significantly lower than that of CSI in the 400 nm–1300 nm range. Within this range, the reflectance difference is maximized at around 560 nm wavelength. Based on this method, the 560 nm wavelength was selected as the characteristic wavelength, and the measured data in this wavelength were used to fit various BRDF models to further investigate the fitting performance of each model.
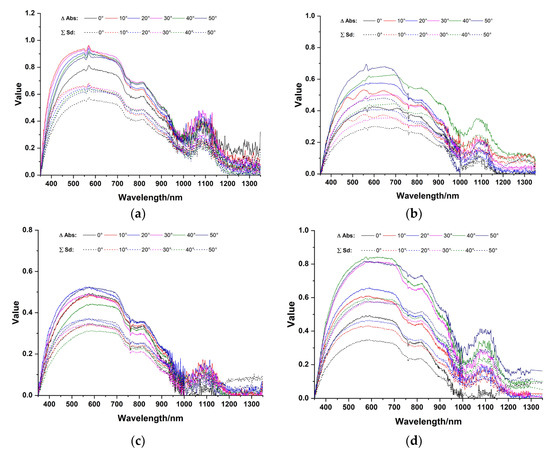
Figure 4.
Results of the spectral standard deviation analysis method, (a) RAZ = 0°, (b) RAZ = 180°, (c) RAZ = 90°, and (d) RAZ = 270°.
3.2. BRDF Fitting Results
When constructing a model, the reflectivity value at the wavelength with the largest difference is selected under different observation geometries, which is taken as the dependent variable, while the observation geometric angle is taken as the independent variable, and the kernel coefficients corresponding to each kernel function of the model are finally determined. The measured data used in this analysis are the reflectance measurements at the 560 nm wavelength. The fitting performance of the five models for the reflectance data of CSI and OCSI was compared and analyzed. Firstly, the models were simulated for CSI, and the results are shown in Figure 5. When the observed azimuth angle is in the range of 0°–180°, it can be observed from Figure 5a that all five models exhibit spectral response characteristics consistent with CSI in the entire principal plane in the forward-scattering region. When the observation is in the backward-scattering region, the reflectance decreases as the VZA approaches the SZA. Among the five models, only the Wa and WaRoLstRPV models satisfy this trend, which is consistent with the measured data. The other models show similar reflectance variations corresponding to the measured data in the forward-scattering region. However, in the backward-scattering region, the R-LiSpr, Qu-R, and Qu-LiSpr-RrRPV models show an increasing trend in reflectance with increasing observation angle, which is different from the measured data. As shown in Figure 5b, when the observed azimuth angle is in the range of 90°–270°, all five models can effectively fit the spectral response variations of CSI at this azimuth angle. They exhibit a minimum value at 0° observation and increased fitted reflectance values as the VZA increases. However, when comparing the five models, it can be observed that only the proposed kernel-driven model in this study shows a high level of consistency with the measured reflectance data in this plane. Among the other models, only the Wa model roughly matches the measured data, but there are still differences between the fitted data and the measurements at certain VZA. Comparing the fitting results of the Wa model and the WaRoLstRPV model, it can be seen that there is no significant difference in the fitting of the two models to the measured data in the forward-scattering region. Both models overlap well with the measured data. However, in the backward-scattering region, the WaRoLstRPV model shows the best fitting performance to the measured data between the two models.
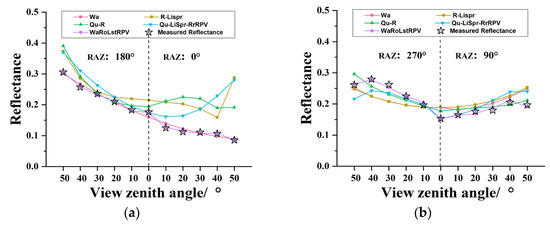
Figure 5.
Fitting performance of BRDF models for reflectance of CSI, (a) RAZ = 0°–180° and (b) RAZ = 90°–270°.
To verify the fitting performance of these models for the reflectance data of oil-polluted sea ice, this study combined the measured data of oil-polluted sea ice to examine the consistency and differences between the fitted data and the measured data. As shown in Figure 6a, when the azimuth angle is in the range of 0°–80°, the measured reflectance decreases throughout the entire observation range as the VZA changes from 180/50 to 0/50; however, the rate of decrease in reflectance is not consistent across different observation intervals. In the forward-scattering region, the reflectance decreases significantly as the VZA increases. In the backward-scattering region, the measured reflectance changes with a minor trend. When comparing the fitted data obtained from different models, only the WaRoLstRPV model exhibits the same trend and highly overlaps with the measured data at each observation angle. Although the Wa model shows a similar trend in its fitted data to the measured data in the forward-scattering region, it does not work well in the backward-scattering region. While the remaining models follow an overall trend of decreasing reflectance with an increasing angle in all observation intervals, they do not match the decreasing trend of the measured data. The fitted data from these models also do not maintain a high consistency with the measured data at each observation point.
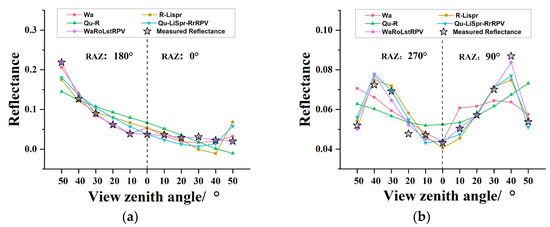
Figure 6.
Fitting performance of BRDF models for reflectance of OCSI, (a) RAZ = 0°–180° and (b) RAZ = 90°–270°.
As shown in Figure 6b, when considering an azimuth angle range of 90–270°, the observed reflectance of vertically contaminated sea ice exhibits a distinct variation pattern from that of the main plane. Notably, it demonstrates a symmetric behavior around a VZA of 0°, in which the reflectance changes in the forward- and backward-scattering regions show an opposite trend. Within the forward-scattering region, the measured reflectance attains its maximum value at a VZA of 40°. As the VZA gradually approaches 0°, the reflectance values progressively decrease, reaching a minimum at 0°. Conversely, as the VZA increases, the reflectance values exhibit an opposite trend, gradually increasing. In the vicinity of 40° within the backward-scattering region, the reflectance values peak and subsequently experience a substantial decrease with further increases in the VZA. Based on the observed reflectance values and the fitted data trends of the five models, it is evident that the R-LiSpr, WaRoLstRPV, and Qu-LiSpr-RrRPV models can better capture the observed data trends. On the other hand, the remaining two models do not align with the observed data trends. Among the three models that exhibit the desired data trends, the WaRoLstRPV model demonstrates the best-fitting performance.
Based on the above analyses, it is established that the WaRoLstRPV model, developed within this study, exhibits good fitting performance for both CSI and OCSI reflectance spectral data. To validate the fitting effectiveness of the proposed kernel-driven model specifically for CSI, an absolute difference calculation was performed by comparing the measured data before and after ice contamination with the corresponding fitting results. This approach further illustrates the high fitting accuracy achieved by the constructed kernel-driven model.
As shown in Figure 7a, the proposed WaRoLstRPV model in this study exhibits a stable absolute difference between the fitting and observed data, with values hovering around zero and fluctuating within a small range across the entire range of observations. When the VZA is 180/50 or 0/50, the difference between the measured values of CSI and the fitting values of the model is minimal and can be considered negligible. For other observation angles, the fitting values are approximately equal to the measured values, aligning with expectations. The fitting performance of the Wa model surpasses that of other commonly used models for CSI surfaces. The difference in reflectance between the fitting and measured values of the Wa model also fluctuates within a small range around zero; however, it can be observed that there are certain discrepancies between the fitting performance of the Wa model and the WaRoLstRPV model at certain observation angles. Models such as the R-LiSpr, Qu-R, and Qu-LiSpr-RrRPV exhibit significant differences when fitting their reflectance values of CSI to the measured values. The absolute difference between the reflectance fitting and measured values is relatively low when the VZA is near 0°. However, when the VZA increases specifically at 180/50 or 0/50, the absolute difference reaches its maximum value, which deviates significantly from the overall trend simulated by the proposed WaRoLstRPV model.
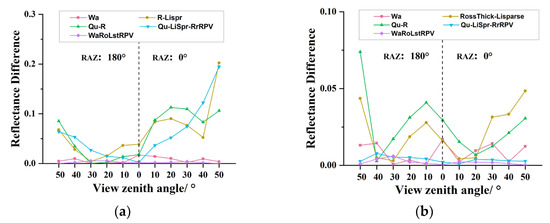
Figure 7.
The fitting error of BRDF models in the RAZ of 0°–180°, (a) = CSI and (b) = OCSI.
The difference between the measured data and the fitting data for OCSI is shown in Figure 7b. It can be observed that the WaRoLstRPV model exhibits a similar fitting performance to CSI across all observation ranges. The absolute difference between the observed and fitted values for polluted sea ice fluctuates around zero with a small magnitude. For the Wa model, the fitting values are roughly similar to the measured values when the VZA ranges from 270/30 to 270/10; however, noticeable differences exist for other VZA. Regarding the R-LiSpr and Qu-R models, the absolute difference between the fitting and observed values is highest when the VZA is 270/50. When the VZA is 270/40, the fitting values of both models are nearly equal to the measured values, resulting in the slightest difference. As the VZA gradually approaches 0°, the absolute difference in reflectance increases. When the VZA is 270/10, the reflectance difference exhibits a small peak. With increasing VZA, the reflectance difference reaches its minimum around 90/20 and then gradually increases. The correlation coefficient between the WaRoLstRPV model constructed in this study and the measured value is significant at a p-value less than 0.05.
4. Discussion and Analysis
4.1. Spectral Analysis
By combining the measured spectral data of CSI and OCSI shown in Figure 2 and Figure 3, a comparative analysis reveals that across the entire visible/near-infrared spectrum, in the 350 nm–1200 nm range, the reflectance values decrease with increasing wavelength. Within the VNIR range, CSI exhibits a smooth decreasing trend with increasing wavelength. At around 740 nm, there is an absorption feature in the reflectance spectrum of CSI; however, OCSI does not exhibit a distinct absorption feature in that range. This feature could potentially be used to distinguish between CSI and OCSI. Beyond 1200 nm, the reflectance of CSI is very low. In this range, CSI behaves similarly to a total absorber, with little change in reflectance as the wavelength varies. On the other hand, for polluted sea ice, there is no prominent absorption peak in the spectral curve, regardless of the changes in azimuth angle or VZA. This is due to the lack of significant absorption characteristics in polluted sea ice throughout the wavelength range. Within the 350–500 nm range, the measured reflectance decreases significantly with wavelength, while in the 500–1200 nm range, the decrease in reflectance is relatively gradual and the values slowly approach zero. Thus, polluted sea ice can also be considered as a total absorber in this range.
The main difference between CSI and OCSI lies in the presence of a distinct absorption dip at around 1000 nm in the reflectance spectra of CSI observed at various azimuth angles. In contrast, polluted sea ice does not exhibit this absorption dip feature throughout the entire wavelength range, which can be attributed to the presence of oil that alters the physical properties of the ice surface. From the perspective of observation angle, the spectral values of CSI show significant variations with changes in the VZA. However, for polluted sea ice, changing the VZA does not significantly impact the spectral values, and the overall trend remains relatively smooth. When the azimuth angle is in the range of 0°–180°, both CSI and OCSI exhibit the characteristic of maximum reflectance values in the forward-scattering region at angles approximately equal to the VZA. As the VZA gradually approaches the backward-scattering region, the measured reflectance values decrease. When the azimuth angle is in the range of 90°–270°, there is no common characteristic describing both CSI and OCSI. This is precisely because the measured reflectance values of CSI and OCSI exhibit different behaviors in terms of wavelength, VZA, and azimuth angle. Therefore, it is necessary to research angle specificity and determine suitable wavelengths for distinguishing between pre- and post-pollution sea ice before conducting field monitoring of oil spills.
4.2. Comparison of BRDF Models
To compare the differential fitting performance of the models for CSI and OCSI, this study calculated the absolute difference between the observed data and the simulated data separately for CSI and OCSI, and the results are shown in Figure 7.
When the observed surface is CSI, the absolute differences are shown in Figure 7a. In contrast to the WaRoLstRPV model, the semi-empirical models, such as R-LiSpr and Qu-R, cannot effectively fit the observed data throughout the observation range. This is because these semi-empirical models are primarily designed for vegetation surfaces where backscattering is stronger than forward scattering, and they do not consider the characteristics of strong forward scattering on ice and snow surfaces. As a result, these models cannot accurately fit the ice surface data, and their trend generally exhibits an inverted V shape. In contrast, the WaRoLstRPV model provides an excellent fit to the measured reflectance of CSI across the entire observation range and maintains consistent fitting performance. The proposed model exhibits significant differences in fitting when compared to the Qu-LiSpr-RrRPV model. This disparity arises from the use of Lisparse as a geometric-optical kernel function, which assumes that the observed surface consists of numerous identical convex points to calculate the geometric scattering component. This kernel function strongly depends on the azimuth angle, resulting in a reduction in forward scattering compared to other geometric-optical kernel functions and a significant enhancement in backscattering. In contrast, the proposed model incorporates an influencing factor that considers the forward-scattering region, enabling it to better fit the overall area rather than solely focusing on the backscattering region. This consideration allows the WaRoLstRPV model to fit the observed data well. Although the Qu-LiSpr-RrRPV model accounts for the strong forward scattering in CSI, its fitting performance could be more satisfactory. However, by incorporating additional parameters to address the forward-scattering region, the Qu-LiSpr-RrRPV model could achieve better simulation results for sea ice data. The Wa model, which is not semi-empirical, does not depend on the relative azimuth angle between the sun and the observation direction. Instead, it takes into account only the VZA and the SZA, and its fitting mechanism differs from other semi-empirical models. As shown in Figure 5, when using this model to fit the reflectance values across the entire observation range, there is no significant variation in fitting performance. The fitting performance of the Wa model surpasses that of the other semi-empirical models by a large margin. However, there is still some disparity when compared to the WaRoLstRPV model at certain observation angles. To further investigate the performance of the constructed model in simulating the observed data in the sea ice region, the root mean square error (RMSE) between the simulated values of each model and the observed values were calculated, and the results are shown in Figure 8a. As depicted in the RMSE plot, the proposed WaRoLstRPV model in this study achieves an RMSE value of 0.0031. The Wa model, which exhibits superior performance in fitting the reflectance of CSI in the model fitting plot, attains an RMSE value of 0.0087, significantly outperforming other models; however, a noticeable gap exists between the Wa model and the model proposed in this study.
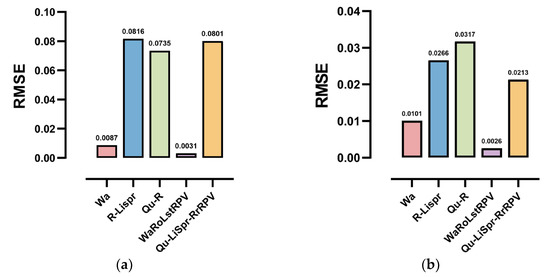
Figure 8.
The RMSE for these BRDF models on the different situations, (a) = CSI and (b) = OCSI.
As shown in Figure 7b, when the observed surface is OCSI, the WaRoLstRPV model proposed in this study exhibits the best validation performance among the five models; this is similar to CSI. The absolute differences are generally centered around zero, indicating the excellent fitting performance of the model for both CSI and OCSI throughout the entire observation range. This is attributed to the addition of Litransit as another geometric-optical kernel function in the model. This function compensates for the weak fitting ability of Lisparse for high-density coverings and the discrepancy in inferred equation parameters; therefore, the WaRoLstRPV model is capable of providing good simulations for OCSI. In contrast, the semi-empirical Qu-LiSpr-RrRPV model shows different fitting results for OCSI surfaces. The Qu-LiSpr-RrRPV model, with the addition of the RPV kernel-driven function, demonstrates good simulation performance for OCSI, with absolute differences fluctuating around zero. This is in stark contrast to its performance in simulating CSI. The significant improvement is mainly attributed to the RPV function, which addresses the issue of excessive forward scattering in ice and snow surfaces, thus enhancing the model’s ability to simulate OCSI measurements. On the other hand, the Wa model, which performs well in fitting CSI, exhibits relatively poorer performance in simulating OCSI. This is because polluted sea ice’s surface conditions are more complex than CSI. However, being an empirical model, the applicability of the Wa model to various targets is limited due to its empirical nature, resulting in more significant limitations. For other semi-empirical models that do not include the RPV function or consider the influence of forward scattering as a parameter, their ability to fit measurements of OCSI is greatly diminished. The plots of the differences between fitted and observed values for these models exhibit a W-shaped pattern.
To demonstrate the effectiveness of the proposed model in simulating OCSI, a comparison of the RMSE values for the five models was conducted. As depicted in Figure 8b, it is evident that the WaRoLstRPV model achieves an RMSE of 0.0026, significantly outperforming the other models.
4.3. Optimal Observation Geometry Analysis
The occurrence of oil spills on ice surfaces is typically sudden, and timely monitoring of such incidents often requires the utilization of satellites for data acquisition. This enables further determination of the oil spill area and guides practical actions. In this study, commonly used oceanic satellites were selected based on the abovementioned purpose, leveraging the knowledge obtained in this research. The common satellite parameters are presented in Table 2.

Table 2.
Common satellite parameters.
The selected satellites are commonly used for ocean surface remote sensing. From their central wavelength and maximum VZA, it can be observed that the WaRoLstRPV model proposed in this study can effectively distinguish between CSI and OCSI in the vicinity of the 560 nm wavelength. This model can differentiate whether sea ice is contaminated or not. The model performs best in the backward-scattering region near 180/40, corresponding to the SZA. As mentioned above, the central wavelength and VZA designed for the satellites are suitable for the proposed model. Therefore, this model can effectively use real-time observational data obtained from popular satellite sensors and can be applied successfully in practical oil spill monitoring activities on sea surfaces.
The reflectance obtained by the sensors varies depending on the observation geometry. In this study, the WaRoLstRPV model was used to simulate the reflectance of OCSI and CSI at specific wavelengths under different observation geometries. The difference in reflectance between OCSI and CSI was calculated (Figure 9). A larger difference in reflectance between OCSI and CSI indicates a greater potential for distinguishing between them.
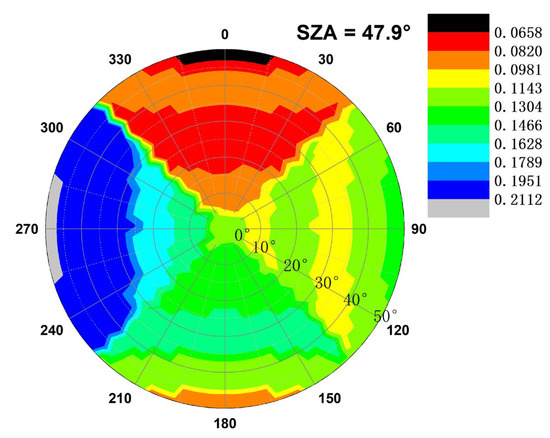
Figure 9.
Difference between the simulated values of CSI and OCSI.
Figure 9 demonstrates the reflectance difference between OCSI and CSI, and the value varies with different observation geometries. The reflectance difference between CSI and OCSI is significant, particularly in the characteristic wavelength range, indicating higher reflection energy in that direction. This makes it more effective in distinguishing whether sea ice is contaminated by oil. As shown in the figure, it can be observed that the reflectance difference of contaminated sea ice is slight in the principal vertical plane, while within the relative azimuth angle range of 250° to 290° and at a VZA of 50°, the reflectance difference is the largest. The overall trend shows that as the VZA increases, the reflectance difference also increases. Therefore, for monitoring OCSI, larger observation angles are more suitable, particularly within the relative azimuth angle range of 250° to 290°.
Based on the model fitting and the calculated values shown in Figure 9, we analyzed the values at the wavelength of 560 nm. Figure 9 demonstrates that, at this particular wavelength, there is a relatively large difference in reflectance between CSI and OCSI under certain observation geometries, indicating the potential of using optimal observation geometry for distinguishing between CSI and OCSI. However, it is important to note that in practical observations, differentiating oil-contaminated sea ice cannot solely rely on the reflectance difference at a single wavelength. Instead, it is necessary to consider the reflectance differences at multiple wavelengths and combine them in order to achieve effective detection of oil-contaminated sea ice.
Please note that when SZA changes, the reflectance values of OCSI and CSI also vary, leading to changes in their difference under different observation geometries. Consequently, this can result in different optimal observation zenith and relative azimuth angles. Therefore, when we refer to the “optimal observation geometry” in this context, we specifically mean the optimal observation geometry under the fixed SZA condition. This limitation should be considered when interpreting the results.
4.4. Future Research Directions
In future research, we aim to explore more remote sensing features that can be used to differentiate between CSI and OCSI by considering polarization characteristics and infrared emission spectra. Additionally, we aim to enhance the capability of remote sensing for oil spill detection in IISWs by integrating reflectance spectra, polarization, and infrared emission spectra. Given that the construction of the proposed BRDF model in this study utilized observations only from RAZ angles of 0°, 90°, 180°, and 270°, we aim to further validate the model’s fitting performance on other planes. To achieve this, we plan to refine the observation angles, such as reducing the RAZ interval to 30° and VZA interval to 5°.
For spectral features within the visible-to-near-infrared range, we primarily utilize the distinct reflectance spectral differences between OCSI and CSI at the same wavelengths to further identify oil pollution. Under the influence of sun glint, the spectral features of OCSI and CSI at the same wavelengths are significantly affected by the glare from the sun. However, polarization characteristics [33,34] can effectively reduce or even eliminate the impact of sun glint, allowing OCSI and CSI to exhibit distinct spectral features at the same wavelengths and facilitating their differentiation. In practical oil spill monitoring in IISWs, sunlight conditions are often weak, resulting in low reflectance energy for both OCSI and CSI, making it challenging to differentiate them in the visible-to-near-infrared range. Thermal infrared emissivity [7] does not depend on external light sources but relies on the emission characteristics of OCSI itself. Therefore, it can serve as a complementary method for oil spill detection in the visible-to-near-infrared range under low-light conditions and improve the capability of remote sensing for oil spill monitoring in IISWs. In addition, by incorporating a large amount of data, deep learning [35,36] can be used for model construction and analysis.
5. Conclusions
In this study, we conducted experiments to measure the reflectance of OCSI under different observational geometries. We obtained distinct spectral features of sea ice reflectance before and after oil contamination. By employing spectral standard deviation, the spectral characteristics of CSI and OCSI were analyzed, identifying the optimal wavelengths within the VNIR range for distinguishing CSI and OCSI. Based on the analysis of the reflectance of CSI and OCSI at different observation angles, we proposed a semi-empirical linear kernel-driven model, the WaRoLstRPV model, to describe the directional characteristics of the reflectance of CSI and OCSI. We compared the performance of the proposed model with the R-LiSpr, Qu-R, Qu-LiSpr-RrRPV, and Wa models, which are some commonly used kernel-driven BRDF models. The fitting results demonstrated that the proposed model performed significantly superior compared to the other models. By simulating the differential reflectance in all directions, the optimal observation geometry to detect OCSI was analyzed. This optimal observation geometry could provide a reference for oil spill detection in IISWs.
There are certain limitations in this study. Although our sea ice was formed by freezing real seawater under natural conditions, we did not consider the influence of different ice thicknesses on the research results. Additionally, we did not take into account the impact of different types of oil on the research results, which requires further in-depth study in the future. Finally, it is important to note that in practical oil spill monitoring, not only the differences in spectral reflectance need to be considered, but also the influence of spatial resolution.
Author Contributions
Conceptualization, B.L. and Y.L.; methodology, Y.D. and P.L.; validation, P.C. and J.X.; writing—original draft preparation, Y.D.; writing—review and editing, B.L.; project administration, P.L.; funding acquisition, Y.L. All authors have read and agreed to the published version of the manuscript.
Funding
This work was supported by the National Natural Science Foundation of China under Grant 52271359, the China National Key R&D Program under Grant 2020YFE0201500 and the Fundamental Research Funds for the Central Universities under Grant 3132023018.
Institutional Review Board Statement
Not applicable.
Informed Consent Statement
Not applicable.
Data Availability Statement
Data are private, not available to public.
Conflicts of Interest
The authors declare no conflict of interest.
References
- Liu, J.; Han, B.; Wu, Z.; Zhu, Y. Design of Communication and Navigation Support System for Arctic Shipping Routes. J. Shanghai Ship Shipp. Res. Inst. 2023, 46, 6–12+32. [Google Scholar] [CrossRef]
- Lu, Y.; Chen, J.; Bao, Y.; Han, W.; Li, X.; Tian, Q.; Zhang, X. Using HJ-1 satellite CCD data for remote sensing analysis and information extraction in oil spill scenarios. China Acad. J. Electron. Publising House 2011, 41, 193–201. [Google Scholar] [CrossRef]
- Leifer, I.; Lehr, W.J.; Simecek-Beatty, D.; Bradley, E.; Clark, R.; Dennison, P.; Hu, Y.; Matheson, S.; Jones, C.E.; Holt, B.; et al. State of the Art Satellite and Airborne Marine Oil Spill Remote Sensing: Application to the BP Deepwater Horizon Oil Spill. Remote Sens. Environ. 2012, 124, 185–209. [Google Scholar] [CrossRef]
- Li, Y.; Li, G.; Cui, C. Research progress of oil spill detection based on the spaceborne SAR. Mar. Sci. Bull. 2017, 36, 241–249. [Google Scholar] [CrossRef]
- Fan, J.; Liu, C. Multitask GANs for Oil Spill Classification and Semantic Segmentation Based on SAR Images. IEEE J. Sel. Top. Appl. Earth Observ. Remote Sens. 2023, 16, 2532–2546. [Google Scholar] [CrossRef]
- Fingas, M.; Brown, C. Review of Oil Spill Remote Sensing. In Proceedings of the Forty-Fifth AMOP Technical Seminar on Environmental Contamination and Response, Edmonton, AL, Canada, 6–8 June 2023. [Google Scholar]
- Guo, G.; Liu, B.; Liu, C. Thermal Infrared Spectral Characteristics of Bunker Fuel Oil to Determine Oil-Film Thickness and API. J. Mar. Sci. Eng. 2020, 8, 135. [Google Scholar] [CrossRef]
- Jiang, Z.; Ma, Y.; Yang, J. Inversion of the Thickness of Crude Oil Film Based on an OG-CNN Model. J. Mar. Sci. Eng. 2020, 8, 653. [Google Scholar] [CrossRef]
- Zhou, Y.; Jiang, L.; Lu, Y.; Zhan, W.; Liu, Y. Thermal Infrared Contrast Between Different Types of Oil Slicks on Top of Water Bodies. IEEE Geosci. Remote Sens. Lett. 2017, 14, 1042–1045. [Google Scholar] [CrossRef]
- Jiao, J.; Lu, Y.; Hu, C.; Shi, J.; Liu, Y. Quantifying Ocean Surface Oil Thickness Using Thermal Remote Sensing. Remote Sens. Environ. 2021, 261, 112513. [Google Scholar] [CrossRef]
- Kasimu, A.; Wu, D.D.; Bian, Y. System Dynamic-Based Oil Weathering Processes: Simulation and Analysis. IEEE Syst. J. 2020, 14, 1375–1383. [Google Scholar] [CrossRef]
- Bradford, J.H.; Dickins, D.F.; Brandvik, P.J. Assessing the Potential to Detect Oil Spills in and under Snow Using Airborne Ground-Penetrating Radar. Geophysics 2010, 75, G1–G12. [Google Scholar] [CrossRef]
- Bradford, J.H.; Babcock, E.L.; Marshall, H.-P.; Dickins, D.F. Targeted Reflection-Waveform Inversion of Experimental Ground-Penetrating Radar Data for Quantification of Oil Spills under Sea Ice. Geophysics 2016, 81, WA59–WA70. [Google Scholar] [CrossRef][Green Version]
- Asihene, E.; Desmond, D.S.; Harasyn, M.L.; Landry, D.; Veenaas, C.; Mansoori, A.; Fuller, M.C.; Stern, G.; Barber, D.G.; Gilmore, C.; et al. Toward the Detection of Oil Spills in Newly Formed Sea Ice Using C-Band Multipolarization Radar. IEEE Trans. Geosci. Remote Sens. 2022, 60, 1–15. [Google Scholar] [CrossRef]
- Dickins, D.F.; Andersen, J.H.; Brandvik, P.J.; Singsaas, I.; Buvik, T.; Bradford, J.; Hall, R.; Babiker, M.; Kloster, K.; Sandven, S. Remote Sensing for the Oil in Ice Joint Industry Program 2007–2009. In Proceedings of the 33rd Arctic and Marine Oilspill Program (AMOP) Technical Seminar, Halifax, NS, Canada, 7–9 June 2010. [Google Scholar]
- Li, Y.; Liu, B.; Lan, G.; Ma, L.; Gao, C. Study on Spectrumof Oil Fil min Ice-Infested Waters. Spectrosc. Spectr. Anal. 2010, 30, 1018–1021. [Google Scholar] [CrossRef]
- Liu, B.; Li, Y.; Liu, C.; Xie, F.; Muller, J.-P. Hyperspectral Features of Oil-Polluted Sea Ice and the Response to the Contamination Area Fraction. Sensors 2018, 18, 234. [Google Scholar] [CrossRef] [PubMed]
- Acharya, P.K.; Berk, A.; Anderson, G.P.; Anderson, G.P.; Larsen, N.F.; Tsay, S.C.; Stamnes, K.H. MODTRAN4: Multiple Scattering and Bidirectional Reflectance Distribution Function (BRDF) Upgrades to MODTRAN. In Optical Spectroscopic Techniques and Instrumentation for Atmospheric and Space Research III; SPIE: Bellingham, MA, USA, 1999; p. 354. [Google Scholar]
- Cook, R.L. A Reflection Model for Computer Graphics. Comput. Graph. 1981, 15, 307–315. [Google Scholar] [CrossRef]
- Kokhanovsky, A.A.; Zege, E.P. Scattering Optics of Snow. Appl. Opt. 2004, 43, 1589. [Google Scholar] [CrossRef]
- Walthall, C.L.; Norman, J.M.; Welles, J.M.; Campbell, G.; Blad, B.L. Simple Equation to Approximate the Bidirectional Reflectance from Vegetative Canopies and Bare Soil Surfaces. Appl. Opt. 1985, 24, 383. [Google Scholar] [CrossRef]
- Pinty, B.; Ramond, D. A Simple Bidirectional Reflectance Model for Terrestrial Surfaces. J. Geophys. Res. 1986, 91, 7803–7808. [Google Scholar] [CrossRef]
- Lucht, W.; Roujean, J.-L. Considerations in the Parametric Modeling of BRDF and Albedo from Multiangular Satellite Sensor Observations. Remote Sens. Rev. 2000, 18, 343–379. [Google Scholar] [CrossRef]
- Qu, Y.; Liu, Q.; Liu, S. A Forward Kernel Function for Fitting in Situ Measured Snow Bidirectional Reflectance Factor. Guang Pu Xue Yu Guang Pu Fen Xi = Guang Pu 2016, 36, 2749–2754. [Google Scholar] [CrossRef] [PubMed]
- Jiao, Z.; Ding, A.; Kokhanovsky, A.; Schaaf, C.; Bréon, F.-M.; Dong, Y.; Wang, Z.; Liu, Y.; Zhang, X.; Yin, S.; et al. Development of a Snow Kernel to Better Model the Anisotropic Reflectance of Pure Snow in a Kernel-Driven BRDF Model Framework. Remote Sens. Environ. 2019, 221, 198–209. [Google Scholar] [CrossRef]
- Ding, A.; Jiao, Z.; Dong, Y.; Zhang, X.; He, D.; Cui, L.; Yin, S.; Chang, Y. Performance assessment of the operational MODIS BRDF model for snow/ice cover type. J. Remote Sens. 2019, 23, 1147–1158. [Google Scholar] [CrossRef]
- Yang, J.; Wan, J.; Ma, Y.; Jiang, Z.; Hu, Y. Accuracy assessments of hyperspectral characteristic waveband for common marine oil spill types identification. Mar. Sci. 2021, 45, 97–105. [Google Scholar] [CrossRef]
- Jiao, Z.; Zhang, X.; Bréon, F.-M.; Dong, Y.; Schaaf, C.B.; Román, M.; Wang, Z.; Cui, L.; Yin, S.; Ding, A.; et al. The Influence of Spatial Resolution on the Angular Variation Patterns of Optical Reflectance as Retrieved from MODIS and POLDER Measurements. Remote Sens. Environ. 2018, 215, 371–385. [Google Scholar] [CrossRef]
- Maignan, F.; Bréon, F.-M.; Lacaze, R. Bidirectional Reflectance of Earth Targets: Evaluation of Analytical Models Using a Large Set of Spaceborne Measurements with Emphasis on the Hot Spot. Remote Sens. Environ. 2004, 90, 210–220. [Google Scholar] [CrossRef]
- Yan, L.; Wang, Y.; Xu, Y. An Improved MODIS BRDF Radiometric Calibration Approach. Geomat. Inf. Sci. Wuhan Univ. 2004, 29, 788–790+804. [Google Scholar] [CrossRef]
- Snyder, W.C.; Wan, Z. BRDF Models to Predict Spectral Reflectance and Emissivity in the Thermal Infrared. IEEE Trans. Geosci. Remote Sens. 1998, 36, 214–225. [Google Scholar] [CrossRef]
- Leshkevich, G.A.; Deering, D.W.; Eck, T.F.; Ahmad, S.P. Diurnal Patterns of the Bi-Directional Reflectance of Fresh-Water Ice. Ann. Glaciol. 1990, 14, 153–157. [Google Scholar] [CrossRef][Green Version]
- Sun, Z.; Zhang, J.; Zhao, Y. Laboratory Studies of Polarized Light Reflection From Sea Ice and Lake Ice in Visible and Near Infrared. IEEE Geosci. Remote Sens. Lett. 2013, 10, 170–173. [Google Scholar] [CrossRef]
- Sun, Z.; Zhao, Y.; Yan, G.; Li, S. Study on the Hyperspectral Polarized Reflection Characteristics of Oil Slicks on Sea Surfaces. Chin. Sci. Bull. 2011, 56, 1596–1602. [Google Scholar] [CrossRef]
- Mustaqeem; Ishaq, M.; Kwon, S. A CNN-Assisted Deep Echo State Network Using Multiple Time-Scale Dynamic Learning Reservoirs for Generating Short-Term Solar Energy Forecasting. Sustain. Energy Technol. Assess. 2022, 52, 102275. [Google Scholar] [CrossRef]
- Vasconcelos, R.N.; Lima, A.T.C.; Lentini, C.A.D.; Miranda, J.G.V.; De Mendonça, L.F.F.; Lopes, J.M.; Santana, M.M.M.; Cambuí, E.C.B.; Souza, D.T.M.; Costa, D.P.; et al. Deep Learning-Based Approaches for Oil Spill Detection: A Bibliometric Review of Research Trends and Challenges. J. Mar. Sci. Eng. 2023, 11, 1406. [Google Scholar] [CrossRef]
Disclaimer/Publisher’s Note: The statements, opinions and data contained in all publications are solely those of the individual author(s) and contributor(s) and not of MDPI and/or the editor(s). MDPI and/or the editor(s) disclaim responsibility for any injury to people or property resulting from any ideas, methods, instructions or products referred to in the content. |
© 2023 by the authors. Licensee MDPI, Basel, Switzerland. This article is an open access article distributed under the terms and conditions of the Creative Commons Attribution (CC BY) license (https://creativecommons.org/licenses/by/4.0/).