Abstract
This study examined the seasonal and spatial changes in the marine algal community structure in the outer and inner areas of the intertidal zone of Yeongil Bay. A seasonal survey was conducted at 13 intertidal sites in Yeongil Bay between August 2021 and July 2022. Algal samples were collected using a destructive approach, and the marine algal community was analyzed based on species composition, biomass, and the important value (IV) index. To confirm the differences between the outer and inner areas, ANOSIM and SIMPER analyses were conducted based on the biomass and IV indices of the marine algal species. The marine algal communities in the outer and inner areas of Yeongil Bay differed because of the high contribution of Ulva spp., as determined using the IV index. Our findings suggest that there was an influx of nutrients into Yeongil Bay from the Hyeongsan River, which had remained in the inner area for an extended period because of the slow current. This allowed Ulva spp., an opportunistic species, to bloom quickly and dominate the marine algal communities in the inner area. These results indicate a difference in the structure of marine algal communities between the outer and inner areas owing to the proliferation of Ulva spp. Therefore, Ulva spp. can be used as a target species to monitor the marine environment of Yeongil Bay.
1. Introduction
Marine algae, as primary producers in marine ecosystems, provide food sources for various marine organisms, such as invertebrates and fish, perform photosynthesis and material circulation, and serve as suitable habitats, spawning grounds, and shelters for marine organisms [1,2,3,4]. Given that the structure of the algal community changes in response to natural and anthropogenic factors such as pollution and other disturbances, the structure of marine algal communities can be used as a bioindicator to evaluate the condition of the coastal environment [5,6,7]. The coastal intertidal zone is a sea area that is submerged during high tides and exposed to the surface during low tides [8]. It provides various habitats for marine life via the movement and exchange of materials between the open sea and terrestrial ecosystems [9]. Environmental factors, such as tides, exposure, substrate, and biological factors, can affect various live marine organisms in the intertidal zone [10].
Coastal development provides various benefits to humans, such as land use, economy, and leisure activities, but disturbs intertidal stability. Owing to the linearity and uniformity of the intertidal zone, changes in the coastal environment (waves, salinity, nutrients, etc.) can cause habitat changes and alter the diversity and density of marine life in the intertidal zone [11]. It seems likely that coastal development may cause environmental changes in the intertidal zone, thereby altering the community structure of marine algae. For example, when the environment of a stable sea area changes due to eutrophication, the occurrence and biomass of green algae (e.g., Ulva spp.), an opportunistic species, tends to increase, whereas those of brown and red algae tend to decrease [6,12].
Compared with other waters, Yeongil Bay, located on the east coast of Korea, has a relatively consistent sea level. Yeongil Bay is surrounded by a coastline rich in organic matter and nutrients and has high secondary productivity due to the inflow of freshwater into the Hyeongsan River [13,14]. This bay is characterized by a high density of marine organisms and high productivity. Yeongil Bay is a coastal city, large-scale trade port, and maritime industrial complex; therefore, coastal development is continuously being carried out. As a result, the ecosystem along the coast of Yeongil Bay is exposed to disturbances and pollution and is used as a representative model to demonstrate the state of coastal pollution as a by-product of industrial development [15].
Previous studies on marine algal ecology in Yeongil Bay have been conducted by researchers [16,17,18,19,20,21], but most of them were qualitative studies. Other fields of study have been conducted on the environment and community structure of the inner area of Yeongil Bay, including research on seawater flow structure, oceanographic characteristics, and the distribution of phytoplankton [22,23,24]. These studies explained the specific characteristics of the inner area of Yeongil Bay. Despite the characteristics of the inner area of Yeongil Bay, there has been no study comparing the outer and inner areas of the marine algal community structure. The marine algal community may change due to nutrients and pollution [6,12] caused by human activities and continuous development, which can be a way to check the marine environment. In addition, it can be used as basic data to monitor the change process of the marine ecosystem for intertidal zone restoration.
This study was conducted to analyze the structure of marine algal communities in the inner and outer areas of Yeongil Bay based on species composition, biomass, and the importance of marine algae by conducting seasonal community studies in 13 intertidal zones of Yeongil Bay, thus providing important data on the spatial characteristics of marine algal ecology.
2. Materials and Methods
2.1. Sample Collection and Marine Algal Community
Seasonal surveys were conducted from August 2021 to July 2022 at 13 sites (seven in the outer area and six in the inner area) in the intertidal zone of Yeongil Bay (Figure 1). Samples were collected quantitatively using four 50 cm × 50 cm quadrats at low tide, and four 25 cm × 25 cm quadrats were used in Songdo, where the marine algal cover was low. The marine algal coverage (%) and frequency were recorded while sequentially collecting for each layer, such as the upper, second, and lower layers, after installing a quadrat, and photographs were taken simultaneously using an underwater camera (Olympus Tough TG-5, Tokyo, Japan). Later, the field records and photographs were compared, verified, and converted into coverage rates per unit area (%/m2).
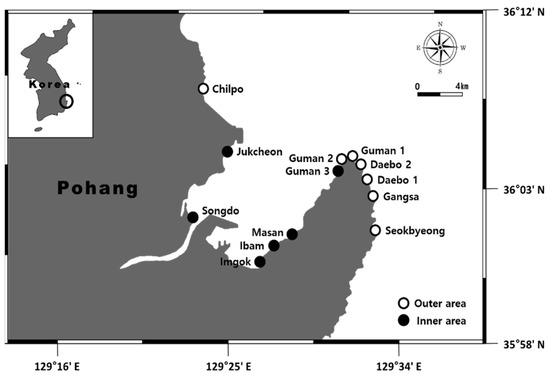
Figure 1.
A map showing the study sites in the outer and inner areas of Yeongil Bay.
Marine algae are classified as green, brown, red, or unidentified crustose coralline algae (CCA). The collected samples were thoroughly washed with fresh water to remove impurities and observed under a microscope (Olympus SZX9, Olympus BX50, Tokyo, Japan), classified, and identified. For the samples identified to species, all surface moisture was removed with a towel, and fresh weight was measured using an electronic scale (CAS, CBL3200H, Seoul, Republic of Korea) and converted into fresh weight per unit area (g/m2). To calculate the importance value (IV) for the analysis of dominant species, coverage, and frequency were analyzed using pictures of the quadrats taken in the field.
- fi: frequency of the ith species in the quadrat
2.2. Environmental Factors
Water quality parameters such as surface water temperature, pH, and salinity were measured and recorded at each site using a portable water-quality multiparameter instrument (YSI ProDSS). Nutrients data, such as dissolved inorganic nitrogen (DIN), ammonia nitrogen (NH4-N), nitrite nitrogen (NO2-N), and nitrate nitrogen (NO3-N), were collected from marine environmental monitoring system measured from 1997 to 2021 in the ocean data in grid framework (http://www.khoa.go.kr/oceangrid/khoa/intro.do, accessed on 1 August 2021.) by Korea Hydrographic and Oceanographic Agency (KHOA).
2.3. Data Analysis
To analyze the ecological value of marine algal clusters by study site and spatial distribution, ecological indices such as abundance [25], evenness [26], diversity [27], and dominance [28] were calculated based on species occurrence and biomass. Two-way analysis of similarity (ANOSIM) and similarity percentages (SIMPER) [29] were used to compare the aforementioned indices based on the amount and importance of species in the seaweed community structures in the outer and inner areas of Yeongil Bay. All analyses were conducted using PRIMER (Plymouth routines multivariate ecological research) version 6.0 and PERMANOVA+ [30].
3. Results
3.1. Marine Environment
The average water temperature and pH were similar in the inner and outer areas, and the salinity was lower in the inner area than in the outer area. Analysis of the seasonal parameters of water quality indicated that the average surface water temperature was 18.0 °C in the outer area and 18.5 °C in the inner area, the average pH was 8.4 in the outer area and 8.5 in the inner area, and the average salinity was 35.3 psu in the outer area and 33.4 psu in the inner area (Table 1).

Table 1.
Marine environment parameters of the outer and inner areas measured from 2021 to 2022.
From 1997 to 2021, the mean DIN was 59.83 μg/L in the outer area and 109.35 μg/L in the inner area, and the mean NH4-N was 16.82 μg/L in the outer area and 28.63 μg/L in the inner area. The mean NO2-N was 3.97 μg/L in the outer area and 6.08 μg/L in the inner area, and the mean NO3-N was 39.64 μg/L in the outer area and 74.51 μg/L in the inner area. Since the sum of NH4-N, NO2-N, and NO3-N is the DIN, comparing the DIN in the outer and inner areas showed that the inner area had a higher trophic level than the outer area (Figure 2).
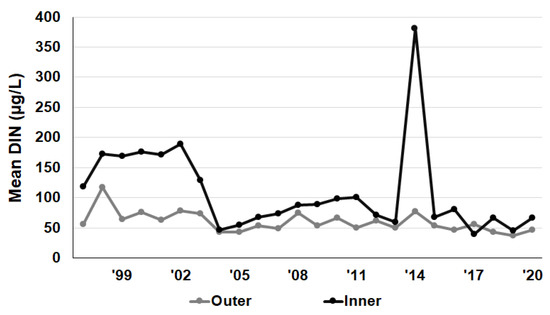
Figure 2.
Mean value of DIN (μg/g) in the outer and inner areas of Yeongil Bay from 1997 to 2021.
The average seasonal changes in DIN in the inner area were 130.51 μg/L in February, 47.59 μg/L in May, 144.63 μg/L in August, and 108.39 μg/L in November. The outer area changes were 92.39 μg/L in February, 23.18 μg/L in May, 44.35 μg/L in August, and 77.91 μg/L in November. Nutrient levels were lowest in both areas in February. The inner area consistently showed higher nutrient concentrations than the outer bay, particularly in August, more than three times higher.
3.2. Marine Algal Species and Biomass in Yeongil Bay
A total of 189 species (28 green algae, 31 brown algae, and 130 red algae) were identified in Yeongil Bay, out of which a total of 16 species (5 green algae, 1 brown alga, and 10 red algae, including Cladophora albida, U. australis, U. compressa, U. intestinalis, U. linza, Sargassum muticum, Stylonema alsidii, Erythrocladia irregularis, Erythrotrichia biseriata, E. carnea, E. reflexa, Sahlingia subintegra, Gelidium elegans, Chondracanthus tenellus, Ahnfeltiopsis flabelliformis, and crustose coralline algae) appeared in all sites. In total, 166 species (25 green, 27 brown, and 114 red algae) were identified in the outer area, whereas 160 species (24 green, 29 brown, and 107 red algae) were identified in the inner area (Figure 3).
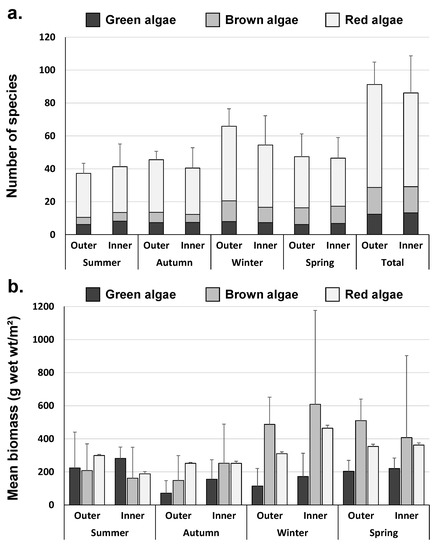
Figure 3.
Seasonal number of species and mean biomass in the outer and inner area of Yeongil Bay. (a) number of species and (b) mean biomass (g wet wt/m2). Error bars show S.D.
The average biomass ratio by taxon in total marine algae biomass was 13.2–36.6% for green algae, 27.2–51.0% for brown algae, and 34.7–45.1% for red algae, showing high biomass ratios of green and brown algae in Yeongil Bay (Figure 3). High biomass ratios of U. australis, S. thunbergii, and S. muticum were observed throughout Yeongil Bay, as well as in both the inner and outer areas. The average biomass ratios by taxon in the Yeongil Bay area were 13.2–36.6% for green algae, 27.2–51.0% for brown algae, and 34.7–45.1% for red algae, high rates of green algae (U. australis) and brown algae (S. muticum and S. thunbergii).
The outer area showed high biomass ratios of brown and red algae. The ratios of brown algae (S. muticum and S. thunbergii) and red algae (Corallina pilulifera) were high in the outer area, with 12.6–30.6% of green algae, 28.5–53.4% of brown algae, and 33.2–53.4% of red algae. The inner area showed high biomass ratios of green (U. australis) and brown (S. muticum, S. thunbergii, and S. yezoense), with 13.8–44.6% of green algae, 25.6–48.9% of brown algae, and 29.8–38.1% of red algae (Figure 3).
3.3. Ecological Index
When compared by season, most of the outer areas exhibited a higher abundance and dominance of marine algae than the inner areas, whereas the inner areas exhibited higher evenness than the outer areas (Figure 4). Species richness was highest in winter in the two sea areas due to an increase in the number of species, for example, Petalonia binghamiae, Scytosiphon lomentaria, S. fulvellum, Pyropia yezoensis, Gloiopeltis furcata, Pachymeniopsis lanceolate, and other brown and red algae. The Shannon’s index was lower in the outer area than in the inner area due to more filamentous forms of red algae, such as Aglaothamnion callophyllidicola, Antithamnionella breviramosa, Ceramium nakamurae, Gayliella fimbriata, Dasya collabens, Herposiphonia caespitosa, H. nuda, H. parca, and Leveillea jungermannioides. According to the calculated Simpson’s indices, the dominant species were perennial, mainly S. thunbergii, S. muticum, and C. filulifera in the outer area, whereas the inner area was dominated by annual algae such as U. compressa, U. australis, and Hypnea flexicaulis.
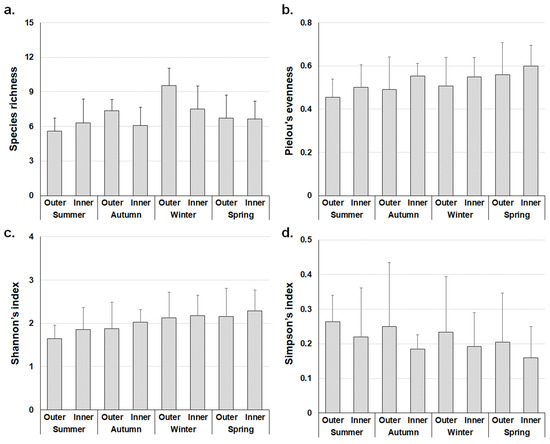
Figure 4.
Ecological indices of marine algae flora on the outer and inner areas according to the mean value of study sites (±SD). (a) Species richness; (b) Pielou’s evenness; (c) Shannon’s index; (d) Simpson’s index.
3.4. Comparison of Marine Algal Community in Outer and Inner Areas
3.4.1. Marine Algal Biomass
The two-way ANOSIM showed no differences in biomass between the two sea areas (global R = 0.056, p > 0.05). Furthermore, the results of SIMPER analyses indicated that the marine algal communities by sea area formed similar communities with the same nine species, including U. australis, S. muticum, and U. compressa, among others (Table 2).
Table 2.
Contributing to 50% similarity in the outer and inner areas according to biomass.
3.4.2. Importance Value
The two-way ANOSIM results showed the difference in the importance value of species in each sea area was significant (global-R = 0.296, p < 0.01). The study areas exhibited a 31.9% similarity in the outer area and 31.0% in the inner area, and the species with the highest contributions in all sea areas were U0. australis and U. compressa, with S. muticum, H. asiatica, and C. pilulifera being the most important contributors in the outer area, and Grateloupia asiatica being the most important contributor in the inner area by sea area. The dissimilarity between the outer and inner areas was high (69.1%), and the species with the highest contribution to the dissimilarity mostly belonged to the Ulva genus, including U. australis, U. compressa, and U. intestinalis. A total of 12 species accounted for 60% of the cumulative contribution, including U. australis, S. thunbergii, U. compressa, C. pilulifera, and S. muticum (Table 3).
Table 3.
Species contributing to dissimilarity in outer and inner areas, respectively, according to important value (IV).
Among the genera contributing to the dissimilarity of the two sea areas, the genera corresponding to 60% of the cumulative contribution represent the marine flora characteristics of the sea area. In the outer area, Ulva spp. (U. australis, U. compressa, U. intestinalis, and U. linza) at 39.7% and Sargassum spp. at 13.4%. In the inner area, Ulva spp. (U. australis, U. compressa, and U. linza) was 50.2% and Sargassum spp. was 13.4%. Thus, Ulva spp. had the greatest influence on the marine algal community structure in the inner area (Table 4).
Table 4.
Species contributing within 60% of the cumulative contribution in the outer and inner areas.
3.5. Seasonal Marine Algal Community Structures in the Outer and Inner Areas
The results of the SIMPER analysis of seaweed communities in sea areas by season based on importance demonstrated that the similarity by sea area was 31.8–46.6% in the outer area and 31.5–39.2% in the inner area. The species that accounted for 50% of the cumulative contribution were U. australis in all seasons at the study sites, with a total of 18 species (five green algae, five brown algae, and eight red algae) in the outer area and 16 species (three green algae, four brown algae, and nine red algae) in the inner area. The species with seasonal contributions included five summer species, seven autumn species, twelve winter species, and eight spring species in the outer area, and three summer species, five autumn species, nine winter species, and eight spring species in the inner area. In both cases, the highest algal abundance was observed in the winter. As for the species with the highest seasonal contribution, H. flexicaulis was the highest at 17.0% in summer, and U. australis was the highest at 18.8%, 14.1%, and 13.4% from fall to spring, whereas U. compressa was the highest at 32.3% in summer, and U. australis was the highest at 29.7%, 15.2%, and 23.7% from fall to spring. The contribution of the taxon was high, with 24.6% of red algae in summer and 23.9–33.9% of green algae from autumn to spring in the outer area, and 28.6–50.7% of green algae from summer to spring and 27.5% of red algae in winter (Figure 5).
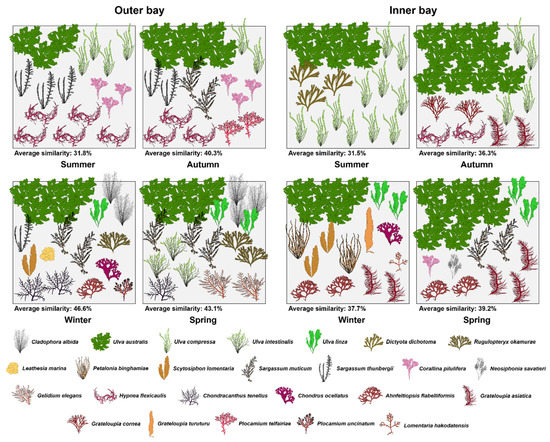
Figure 5.
Seasonal changes in marine algal community structure in the outer and inner areas of Yeongil Bay. Average similarity refers to the seasonal similarity value of the sea area calculated by the importance value of species. The algal species that contribute within 60% of the cumulative contribution in the community similarity are shown, and one algal form means 4% of important value at quadrat.
4. Discussion
The structure of the marine algal community in the outer and inner areas of Yeongil Bay was characterized by the growth of Ulva spp., the dominant algae in the inner area. The environmental factors in the outer and inner areas were similar except for salinity, and there were some clear differences in nutrient concentrations. The concentration of dissolved inorganic nitrogen was 59.83 μg/L in the outer area and 109.35 μg/L in the inner area (i.e., 1.8 times higher in the inner area). Ammonia nitrogen increases when the influx of domestic sewage or livestock wastewater is high, and nitrate nitrogen increases when the amount of chemical fertilizer and industrial wastewater increases [31]. This seems to be the result of the inflow of domestic sewage, coastal industrial complexes, and agricultural and livestock wastewater from the Hyeongsan River [32]. The weak currents in Yeongil Bay increase the residence time of nutrients flowing from the Hyeongsan River. Therefore, nutrient and pollution levels are higher in the southern part of the bay [24]. In the inner bay, the average DIN was the highest in August, and it increased as the KHOA survey site got close to the Hyeongsan River, but no clear seasonal pattern of nutrients could be confirmed in the two areas. The reason for the high average DIN in August in the inner area is the influx and pollution of nutrients from non-point sources such as fields, forests, and land around the estuary of the Hyeongsan River [32,33]. There is also a significant nutrient influx consistent with heavy rainfall in July and August [33]. Therefore, local governments are aware of the need for management measures to reduce the production of nutrients from non-point sources.
In turn, Ulva spp. can proliferate while responding quickly to environmental changes [6,34,35], thus enabling short algal blooms in inner areas with high levels of nutrients and pollution. Therefore, nutrient inflow appears to strongly determine the structure of the algal community and shape the growth space of other marine algae [35]. Additionally, Ulva spp. can adapt to a wide range of salinity conditions, thereby quickly adapting to the salinity stress caused by the Hyeongsan River in Yeongil Bay. In turn, the dominance of U. compressa in the sand deposition areas of the estuary appears to have influenced the overall prosperity of Ulva spp. [36].
The water quality of the environment should be monitored as Ulva spp. in Yeongil Bay is likely to proliferate in large quantities owing to eutrophication [37]. The indiscriminate reproduction of Ulva spp. due to the eutrophication of coastal waters is attracting attention as an environmental problem that can harm the surrounding intertidal marine algal community. Rapid growth reduces the amount of light available to nearby algae [38,39] and Ulva spp. accumulate on the shore [37]. Moreover, healthy Ulva spp. absorb and accumulate heavy metals and various pollutants in the intertidal zone. Therefore, pollution monitoring and ecosystem stability evaluations are conducted by examining the changes in biomass and pollutant concentrations accumulated in fronds [40,41,42,43]. Ulva spp. could be used as a target species for monitoring the marine environment in Yeongil Bay. It is the health of the marine ecosystem that can be derived by analyzing the monitoring results.
In Yeongil Bay, freshwater from the Hyeongsan River flows into the inner area, and salinity increases from the inner area to the outer area, with the lower layer having higher salinity than the surface layer [24]. During the study period, salinity was 35.3 psu in the outer area and 33.4 psu in the inner area. Considering that the average surface salinity in the East Sea is 34.1–34.5 psu [44], the salinity concentration in the inner area was lower than the average concentration in Korea. Salinity is a factor that determines the species composition of marine algae because it affects the osmotic pressure of marine algae [45,46]. Changes in salinity owing to freshwater flowing from the Hyeongsan River can induce stress in marine algae [17], thus providing an unfavorable environment for their growth. Therefore, fewer species were present in the inner area than in the outer area. Upon comparing the species that appeared in previous studies by dividing them into outer and inner areas [17,19], we confirmed that our results are consistent with those of epiphytic red algae. Of the 166 species that appeared in the outer area, 29 appeared only in the outer area, and 23 of 160 species appeared in the inner area. As a result of comparing the occurrence of species that appeared by season, more red algae grew in the outer area, and more species were present. The high occurrence of filamentous forms of red algae in most of the outer area was likely due to the dominance of Sargassum spp., such as S. muticum and S. thunbergii, which act as attachment substrates for epiphytic red algae [47,48].
The high winter species richness of both areas is due to the abundance of epiphytic red algae. In particular, Sargassum spp., a substrate of epiphytic red algae, occurs most frequently in winter [47,48] and grows rapidly from autumn [49,50], and red algae also occur frequently in winter [36,51]. Simpson’s index was higher in the outer area than in the inner area, which may be because the outer bedrock is exposed to waves [10,52,53]. For example, wave exposure in the intertidal communities off the California coast has higher species diversity compared to other shores of the inner bay [53] and played an important role in the rejoining of rocks by Postelsia palmaeformis [54]. In other words, it was confirmed that the wave exposure in the outer area causes marine algae disturbance, enabling the habitat of various marine algae such as epiphytic red algae and having high diversity. In addition, because the dominance rate of opportunistic species such as Ulva spp. in the outer area is lower than in the inner area, competition for space may increase the colonization and growth potential of new species.
Most outer and inner sites sampled are bedrock habitats. However, Guman 2 in the outer area is an ordinary sandy bottom site with a relatively stable substrate, and Songdo in the inner area is also a sandy bottom site. Upon comparing the dominant species in these sites, Guman 2 and Songdo were dominated by S. thunbergii and U. compressa, respectively, despite the occurrence of similar soft substrates [55]. Sand deposition at the estuary of the Hyeongsan River favored the dominance of opportunistic U. compressa in Songdo, resulting in differences in the dominant species between these two sites [55].
The intertidal zone of Yeongil Bay has been developed because it is possible to secure a wide site via coastal reclamation and to build a deep-water port where large ships can easily berth. However, the decrease in the area of the intertidal zone due to development may cause damage to the land due to the decrease in species diversity in the intertidal zone and the influence of typhoons and strong winds [9]. The importance of the intertidal zone should, therefore, be taken into consideration in development projects. With the growing recognition of the importance and economic value of intertidal zones in marine ecosystems, the need for ecological restoration of damaged intertidal zone has garnered increasing attention. Given the impacts of human activities on the intertidal zone of Yeongil Bay, there is a growing need for ecological restoration efforts based on sustainable ecological engineering to safeguard the environment and human health [56]. Ecological restoration of intertidal ecosystems requires characterization [57]. Therefore, the results of this study provide a theoretical basis for restoring the ecology of marine algae in the intertidal zone of Yeongil Bay.
5. Conclusions
In the inner area of Yeongil Bay, the opportunistic species of Ulva spp. Grows faster than other marine algae due to nutrients from the Hyeongsan River, an industrial complex. Comparing the two bay areas, the contribution of Ulva spp. In the inner area was high at 50.2%. Ulva spp. dominated and influenced the algal flora and structure in the intertidal zone of the inner area. It presents the possibility of using Ulva spp. for monitoring of nutrients and pollutants flowing into Yeongil Bay, in order to achieve stable marine ecosystem management. Various other factors, such as ocean currents, waves, seawater ion concentration, and nutrient salts, affect the structure of intertidal algae. Thus, additional research is needed to identify the clear cause of algae structure in the two sea areas.
Recently, the significance of marine ecosystems, such as primary productivity, habitat, and nutrient circulation in the intertidal zone, and the value of ecosystem services have been recognized. So, ecological restoration is required in the developed intertidal zone. Therefore, ecological restoration is required in the developed intertidal zone. In particular, the intertidal ecosystem of Yeongil Bay, which constantly develops along the coast and is constantly changing due to disturbance. This study can be used as important data for the restoration of marine algae in the intertidal zone of Yeongil Bay.
Author Contributions
S.J.P. and C.G.C. conceived, designed, and performed the experiments; S.W.J. and S.Y.H. analyzed the data; C.G.C. wrote and edited the manuscript. We confirm that this manuscript and its data are original and have not been previously published or considered elsewhere. All authors have read and agreed to the published version of the manuscript.
Funding
This research was supported by grants from the National Marine Biodiversity Institute of Korea (2023M00300), the Korea Institute of Marine Science & Technology Promotion (KIMST) funded by the Ministry of Oceans and Fisheries (20220254, 20220537), and the Korea Institute of Ocean Science and Technology project (PEA0016, PEA0111).
Institutional Review Board Statement
Not applicable.
Informed Consent Statement
Not applicable.
Data Availability Statement
Not applicable.
Conflicts of Interest
The authors declare no conflict of interest.
References
- Whitaker, S.G.; Smith, J.R.; Murray, S.N. Reestablishment of the southern California rocky intertidal brown alga, Silvetia compressa: An experimental investigation of techniques and abiotic and biotic factors that affect restoration success. Restor. Ecol. 2010, 18, 18–26. [Google Scholar] [CrossRef]
- Perkol-Finkel, S.; Ferrario, F.; Nicotera, V.; Airoldi, L. Conservation challenges in urban seascapes: Promoting the growth of threatened species on coastal infrastructures. J. Appl. Ecol. 2012, 49, 1457–1466. [Google Scholar] [CrossRef]
- Satheesh, S.; Wesley, S.G. Diversity and distribution of seaweeds in the Kudankulam coastal waters, south-eastern coast of India. Biodivers. J. 2012, 3, 79–84. [Google Scholar]
- Kim, Y.D.; Ahn, J.K.; Nam, M.M.; Lee, C.; Yoo, H.I.; Yeon, S.Y.; Kim, Y.H.; Kim, J.K.; Choi, J.S. Characteristics of algal succession following rock scraping at Imwon area in the east coast of Korea. J. Ocean Univ. China 2016, 15, 1087–1093. [Google Scholar] [CrossRef]
- Orfanidis, S.; Panayotidis, P.; Stamatis, N. An insight to the ecological evaluation index (EEI). Ecol. Indic. 2003, 3, 27–33. [Google Scholar] [CrossRef]
- Wells, E.; Wilkinson, M.; Wood, P.; Scanlan, C. The use of macroalgal species richness and composition on intertidal rocky seashores in the assessment of ecological quality under the european water framework directive. Mar. Pollut. Bull. 2007, 55, 151–161. [Google Scholar] [CrossRef]
- Scherner, F.; Horta, P.A.; Oliveira, E.C.; Simonassi, J.C.; Hall-Spencer, J.M.; Chow, F.; Nunes, J.M.C.; Pereira, S.M.B. Coastal urbanization leads to remarkable seaweed species loss and community shifts along the SW Atlantic. Mar. Pollut. Bull. 2013, 76, 106–115. [Google Scholar] [CrossRef] [PubMed]
- Ministry of Ocean and Fisheries. A Glossary of Marine and Fisheries; Ministry of Ocean and Fisheries: Sejong, Republic of Korea, 2020. [Google Scholar]
- Raffaelli, D.; Hawkins, S.J. Intertidal Ecology; Son, M.H., Yun, S.G., Eds.; Academy Publishing Company: Seoul, Republic of Korea, 2004. [Google Scholar]
- Dawes, C.J. Marine Botany; Oh, Y.S., Ed.; World Science: Seoul, Republic of Korea, 1998. [Google Scholar]
- Yu, O.H.; Lee, H.G.; Lee, J.H. The intertidal macrobenthic community along an artificial structure. Korean J. Fish. Aquat. Sci. 2006, 39, 132–141. [Google Scholar]
- Mirta, T.; Sophia, E.F.; Ylva, S.O.; Ivan, V.; Paulina, M.; Elizabeti Yuriko, M.O.I.; Monica, A.V.P.; Thaïs, N.C.; Martín, S.J.; Federico, P.O.; et al. Eutrophication and macroalgal blooms in temperate and tropical coastal waters: Nutrient enrichment experiments with Ulva spp. Glob. Chang. Biol. 2010, 16, 2624–2637. [Google Scholar]
- Allen, L.G. Seasonal abundance, composition and productivity of the littoral fish assemblage in upper Newport Bay. United States Fish. Bull. 1982, 80, 769–790. [Google Scholar]
- Han, K.H.; Hong, J.S.; Kim, Y.S.; Jeon, K.A.; Kim, Y.S.; Hong, B.K.; Hwang, D.S. Species composition and seasonal variations of ichthyoplankton in coastal waters of Yeongil Bay, Korea. Korean J. Ichthyol. 2003, 15, 87–94. [Google Scholar]
- Kim, K.T. A Study on Basic Production and Port Pollution in Youngil Bay; Report Industry-University Cooperation Foundation Research: Seoul, Republic of Korea, 1983; p. 57. [Google Scholar]
- Lee, H.B.; Oh, Y.S. A summer algal vegetation in Youngil Bay, eastern coast of Korea. Algae 1986, 1, 225–240. [Google Scholar]
- Lee, J.W.; Lee, H.B. A floristic study on marine benthic algae of Yongil Bay and adjacent areas, eastern coast of Korea. Algae 1988, 3, 165–182. [Google Scholar]
- Nam, K.W.; Kim, Y.S.; Kim, Y.H.; Sohn, C.H. Benthic marine algae in the east coast of Korea: Flora, distribution and community structure. Korean J. Fish. Aquat. Sci. 1996, 29, 727–743. [Google Scholar]
- Lee, S.Y.; Lee, J.W.; Lee, H.B. Marine benthic algal flora of Yongil Bay and its adjacent areas, the eastern coast of Korea. Algae 1997, 12, 303–311. [Google Scholar]
- Lee, I.K.; Kim, Y.H. Biodiversity and distribution of marine benthic organisms and uses of algal resources in the coastal zone of Korea and Japan I. benthic marine algae in the east coast of Korea. Algae 1999, 14, 91–110. [Google Scholar]
- Park, G.J.; Choi, C.G. A study on the community structure of intertidal benthic marine algae in Youngil Bay, eastern coast of Korea. Korean J. Fish. Aquat. Sci. 2009, 42, 664–673. [Google Scholar]
- Kwak, H.S. General oceanographic factors in Yeongil Bay of Korea, late October 1973. Ocean Sci. J. 1976, 11, 89–95. [Google Scholar]
- Shim, J.M.; Kwon, K.Y.; Jeong, H.D.; Choi, Y.K.; Kim, S.W. Spatial and temporal variability of phytoplankton in relation to environmental factors in Youngil Bay. J. Environ. Sci. Int. 2013, 22, 1683–1690. [Google Scholar] [CrossRef][Green Version]
- Kim, H.D.; Kim, J.I.; Ryu, C.R. Study on current and water quality characteristics in Yongil Bay. J. Ocean Eng. Technol. 2001, 15, 28–37. [Google Scholar]
- Margalef, R. Information theory in ecology. Gen. Syst. 1958, 3, 36–71. [Google Scholar]
- Pielou, E.C. Mathematical Ecology; Wiley Company: New York, NY, USA, 1977; pp. 2055–2057. [Google Scholar]
- Shannon, C.E.; Weaver, W. The Mathematical Theory of Communication; Univ-Illinois Press: Urbana, IL, USA, 1963. [Google Scholar]
- Simpson, E.H. Measurement of diversity. Nature 1949, 163, 688–692. [Google Scholar] [CrossRef]
- Clarke, K.R. Non-parametric multivariate analyses of changes in community structure. Aust. J. Ecol. 1993, 18, 117–143. [Google Scholar] [CrossRef]
- Anderson, M.J.; Gorley, R.N.; Clarke, K.R. Permanova+ for Primer: Guide to Software and Statistical Methods; PRIMER-E: Plymouth, UK, 2008. [Google Scholar]
- Meybeck, M. Carbon, nitrogen, and phosphorus transport by world rivers. Am. J. Sci. 1982, 282, 401–450. [Google Scholar] [CrossRef]
- Pohang City. 2020 White Paper of Environment; Pohang City: Pohang, Republic of Korea, 2020. [Google Scholar]
- Ministry of Land, Transport and Maritime Affairs. Hyeongsan River Basic Plan (Supplementary) Report; Busan Regional Construction and Management Administration: Busan, Republic of Korea, 2011. [Google Scholar]
- Dayton, P.K. Experimental evaluation of ecological dominance in a rocky intertidal algal community. Ecol. Monogr. 1975, 45, 137–159. [Google Scholar] [CrossRef]
- Rivers, F.S.; Peckol, P. Summer decline of Ulva lactuca (chlorophyta) in a eutrophic bayment: Interactive effects of temperature and nitrogen availability? J. Phycol. 1995, 31, 223–228. [Google Scholar] [CrossRef]
- Kang, J.W. Marine Algae. In Illustrated Encyclopedia of Fauna & Flora of Korea; Ministry of Education: Seoul, Republic of Korea, 1968; Volume 8. [Google Scholar]
- Song, Y.C.; Kim, S.R.; Park, S.J.; Kang, G.M.; Oh, S.S. A Study on the causes of Ulva pertusa kjellman large breeding in Bangdu Bay of Jeju Island. Rep. JIHE 2016, 27, 59–69. [Google Scholar]
- Krause-Jensen, D.; Middelboe, A.; Christensen Eelgrass, P.B. Zostera marina, growth along depth gradients: Upper boundaries of the variation as a powerful predictive tool. Oikos 2000, 91, 233–244. [Google Scholar] [CrossRef]
- Human, L.R.D.; Adams, J.B.; Allanson, B.R. Insights into the cause of an Ulva lactuca Linnaeus bloom in the Knysna Estuary. S. Afr. J. Bot. 2016, 107, 55–62. [Google Scholar] [CrossRef]
- Villares, R.; Puente, X.; Carballeira, A. Ulva and Enteromorpha as indicators of heavy metal pollution. Hydrobiologia 2001, 462, 221–232. [Google Scholar] [CrossRef]
- Farias, D.R.; Hurd, C.L.; Eriksen, R.S.; Macleod, C.K. Ulva australis as a tool for monitoring zinc in the Derwent Estuary and implications for environmental assessment. In Proceedings of the 15th International Conference on Environmental Science and Technology, Rhodes, Greece, 31 August–2 September 2017. [Google Scholar]
- Bonanno, G.; Veneziano, V.; Piccione, V. The alga Ulva lactuca (ulvaceae, chlorophyta) as a bioindicator of trace element contamination along the coast of Sicily, Italy. Sci. Total Environ. 2019, 699, 134329. [Google Scholar] [CrossRef]
- Mourad, F.A.; El-Azim, H.A. Use of green alga Ulva lactuca (L.) as an indicator to heavy metal pollution at intertidal waters in Suez Gulf, Aqaba Gulf and Suez Canal, Egypt. Egypt J. Aquat. Biol. Fish. 2019, 23, 437–449. [Google Scholar] [CrossRef]
- National Institute of Fisheries Science. Information of Oceanographic Conditions in the East Sea; NIFS East Sea Fisheries Research Institute: Gangneung, Republic of Korea, 2017; Volume 219, pp. 1–10. [Google Scholar]
- Wilkinson, M. Survival strategies of attached algae in estuaries. In Feeding and Survival Strategies of Estuarine Organisms; Jones, N.V., Wolff, W.J., Eds.; Plenum Publishing Company: New York, NY, USA, 1981; pp. 29–38. [Google Scholar]
- Josselyn, M. Do nutrients or physical factors control macroalgal growth in temperate estuaries? Estuaries 1985, 8, 304. [Google Scholar]
- Carballo, J.L.; Olabarria, C.; Osuna, T.G. Analysis of four macroalgal assemblages along the Pacific Mexican coast during and after the 1997–98 El Niño. Ecosystems 2002, 5, 749–760. [Google Scholar] [CrossRef]
- Kim, Y.S.; Choi, H.G. Epiphytic algae growing on Sargassum thunbergii in southern and western coasts of Korea. J. Ecol. Environ. 2004, 27, 173–177. [Google Scholar]
- Yoshida, G.; Yoshikawa, K.; Terawaki, T. Growth and maturation of two populations of Sargassum horneri (fucales, phaeophyta) in Hiroshima Bay, the Seto Inland Sea. Fish. Sci. 2001, 67, 1023–1029. [Google Scholar] [CrossRef]
- McCourt, R.M. Seasonal patterns of abundance, distributions, and phenology in relation to growth strategies of three Sargassum species. J. Exp. Mar. Biol. Ecol. 1984, 74, 141–156. [Google Scholar] [CrossRef]
- Mathieson, A.C.; Burns, R.L. Ecological studies of economic red algae. V. growth and reproduction of natural and harvested populations of Chondrus crispus stackhouse in New Hampshire. J. Exp. Mar. Biol. Ecol. 1975, 17, 137–156. [Google Scholar] [CrossRef]
- Prathep, A.; Lewmanomont, K.; Buapet, P. Effects of wave exposure on population and reproductive phenology of an algal turf, Gelidium pusillum (Gelidales, Rhodophyta), Songkhla, Thailand. Aquat. Bot. 2009, 90, 179–183. [Google Scholar] [CrossRef]
- Seapy, R.R.; Littler, M.M. The distribution, abundance, community structure, and primary productivity of macroorganisms from two central California rocky intertidal habitats. Pac. Sci. 1978, 71, 87–96. [Google Scholar]
- Dayton, P.K. Experimental studies of algal canopy interactions in a sea otter-dominated kelp community at Amchitka Island, Alaska. Fish. Bull. 1975, 73, 230–237. [Google Scholar]
- Daly, M.A.; Mathieson, A.C. The effects of sand movement on intertidal seaweeds and selected invertebrates at Bound Rock, New Hampshire, USA. Mar. Biol. 1977, 43, 45–55. [Google Scholar] [CrossRef]
- Mitsch, W.J. Ecological engineering: The seven-year itch. Ecol. Eng. 1998, 10, 119–138. [Google Scholar] [CrossRef]
- William, J.M.; Jorgensen, S.E. Ecological Engineering and Ecosystem Restoration; Kang, D.S., Kim, D.M., Sung, K.J., Ahn, C.W., Lee, S.M., Eds.; Hanteemedia: Seoul, Republic of Korea, 2003. [Google Scholar]
Disclaimer/Publisher’s Note: The statements, opinions and data contained in all publications are solely those of the individual author(s) and contributor(s) and not of MDPI and/or the editor(s). MDPI and/or the editor(s) disclaim responsibility for any injury to people or property resulting from any ideas, methods, instructions or products referred to in the content. |
© 2023 by the authors. Licensee MDPI, Basel, Switzerland. This article is an open access article distributed under the terms and conditions of the Creative Commons Attribution (CC BY) license (https://creativecommons.org/licenses/by/4.0/).